cpsc 340: data mining machine learningschmidtm/courses/340-f19/l10.pdf · •biclustering:...
TRANSCRIPT

CPSC 340:Machine Learning and Data Mining
Outlier Detection
Fall 2019

Last Time: Hierarchical Clustering
• We discussed hierarchical clustering:– Performs clustering at multiple scales.
– Output is usually a tree diagram (“dendrogram”).
– Reveals much more structure in data.
– Usually non-parametric:• At finest scale, every point is its own clusters.
• We discussed some application areas:– Animals (phylogenetics).
– Languages.
– Stories.
– Fashion.http://www.nature.com/nature/journal/v438/n7069/fig_tab/nature04338_F10.html

Biclustering
• Biclustering:– Cluster the training examples and features.
– Also gives feature relationship information.
• Simplest and most popular method:– Run clustering method on ‘X’ (examples).
– Run clustering method on ‘XT’ (features).
• Often plotted with ‘X’ as a heatmap.– Where rows/columns arranged by clusters.
– Helps you ‘see’ why things are clustered.
http://openi.nlm.nih.gov/detailedresult.php?img=2731891_gkp491f3&req=4

Biclustering
• Visualization: hierarchical biclustering + heatmap + dendrograms.
– Popular in biology/medicine.
https://arxiv.org/pdf/1408.0856v1.pdf

Application: Medical data
• Hierarchical clustering is very common in medical data analysis.
– Biclustering different samples of breast cancer:
http://members.cbio.mines-paristech.fr/~jvert/svn/bibli/local/Finetti2008Sixteen-kinase.pdf

Other Clustering Methods
• Mixture models:
– Probabilistic clustering.
• Mean-shift clustering:
– Finds local “modes” in density of points.
– Alternative approach to vector quantization.
• Bayesian clustering:
– A variant on ensemble methods.
– Averages over models/clusterings,weighted by “prior” belief in the model/clustering.

Graph-Based Clustering
• Spectral clustering and graph-based clustering:
– Clustering of data described by graphs.
https://griffsgraphs.wordpress.com/tag/clustering/http://ascr-discovery.science.doe.gov/2013/09/sifting-genomes/https://www.hackdiary.com/2012/04/05/extracting-a-social-graph-from-wikipedia-people-pages/

(pause)

Motivating Example: Finding Holes in Ozone Layer
• The huge Antarctic ozone hole was “discovered” in 1985.
• It had been in satellite data since 1976:
– But it was flagged and filtered out by a quality-control algorithm.
https://en.wikipedia.org/wiki/Ozone_depletion

Outlier Detection
• Outlier detection:– Find observations that are “unusually different” from the others.– Also known as “anomaly detection”.– May want to remove outliers, or be interested in the outliers themselves (security).
• Some sources of outliers:– Measurement errors.– Data entry errors.– Contamination of data from different sources.– Rare events.
http://mathworld.wolfram.com/Outlier.html

Applications of Outlier Detection
• Data cleaning.
• Security and fault detection (network intrusion, DOS attacks).
• Fraud detection (credit cards, stocks, voting irregularities).
• Detecting natural disasters (underwater earthquakes).
• Astronomy (find new classes of stars/planets).
• Genetics (identifying individuals with new/ancient genes).

Classes of Methods for Outlier Detection
1. Model-based methods.
2. Graphical approaches.
3. Cluster-based methods.
4. Distance-based methods.
5. Supervised-learning methods.
• Warning: this is the topic with the most ambiguous “solutions”.
But first…
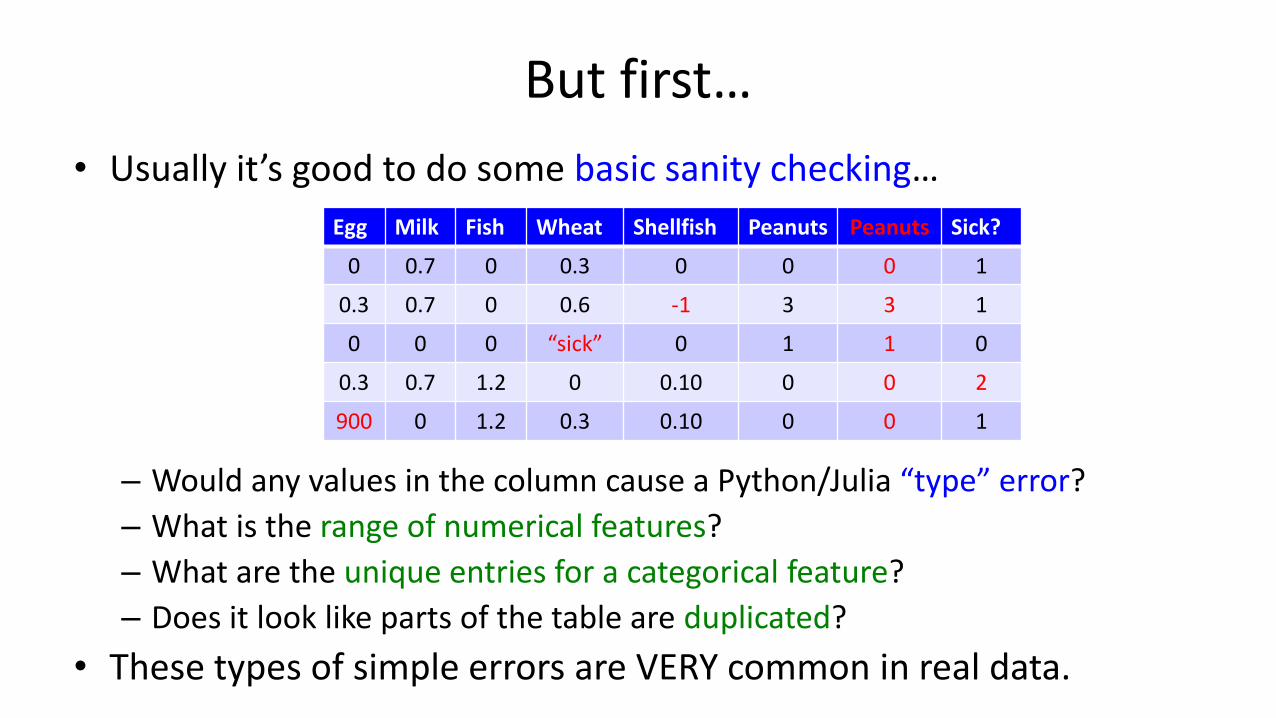
• Usually it’s good to do some basic sanity checking…
– Would any values in the column cause a Python/Julia “type” error?
– What is the range of numerical features?
– What are the unique entries for a categorical feature?
– Does it look like parts of the table are duplicated?
• These types of simple errors are VERY common in real data.
Egg Milk Fish Wheat Shellfish Peanuts Peanuts Sick?
0 0.7 0 0.3 0 0 0 1
0.3 0.7 0 0.6 -1 3 3 1
0 0 0 “sick” 0 1 1 0
0.3 0.7 1.2 0 0.10 0 0 2
900 0 1.2 0.3 0.10 0 0 1

Model-Based Outlier Detection
• Model-based outlier detection:1. Fit a probabilistic model.
2. Outliers are examples with low probability.
• Example:– Assume data follows normal distribution.
– The z-score for 1D data is given by:
– “Number of standard deviations away from the mean”.
– Say “outlier” if |z| > 4, or some other threshold.
http://mathworld.wolfram.com/Outlier.html
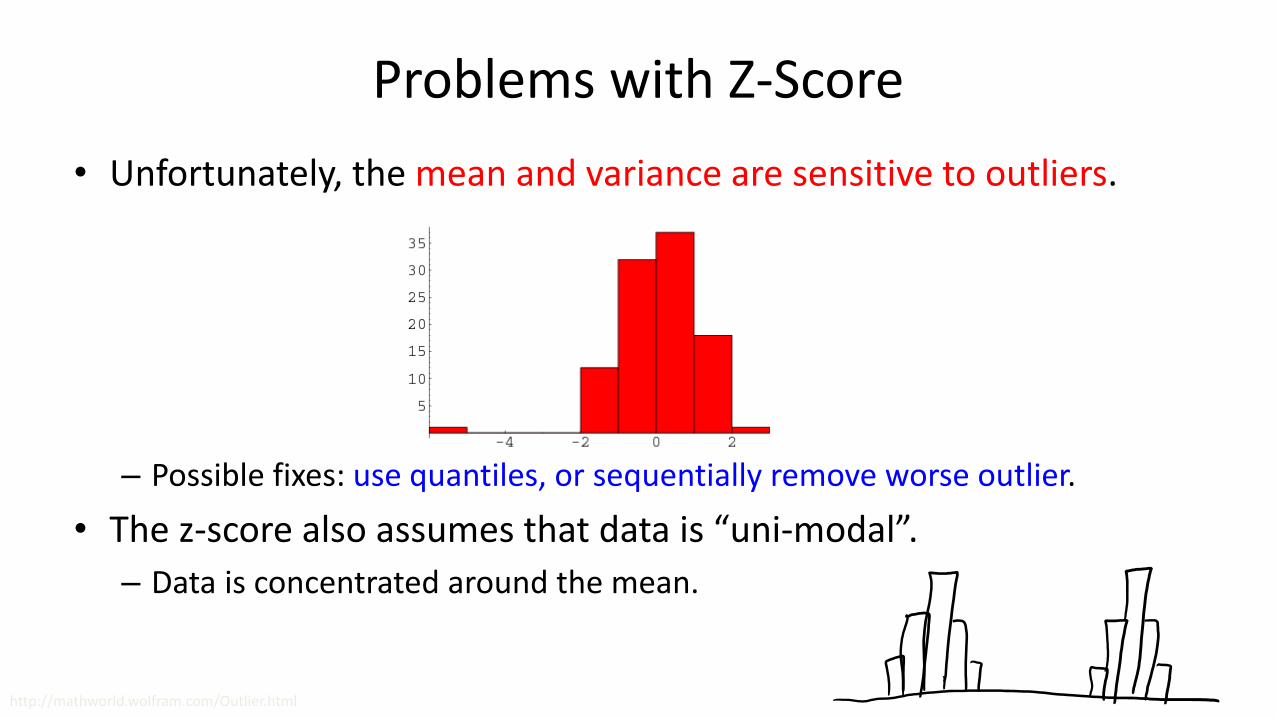
Problems with Z-Score
• Unfortunately, the mean and variance are sensitive to outliers.
– Possible fixes: use quantiles, or sequentially remove worse outlier.
• The z-score also assumes that data is “uni-modal”.
– Data is concentrated around the mean.
http://mathworld.wolfram.com/Outlier.html

Global vs. Local Outliers
• Is the red point an outlier?

Global vs. Local Outliers
• Is the red point an outlier? What if we add the blue points?

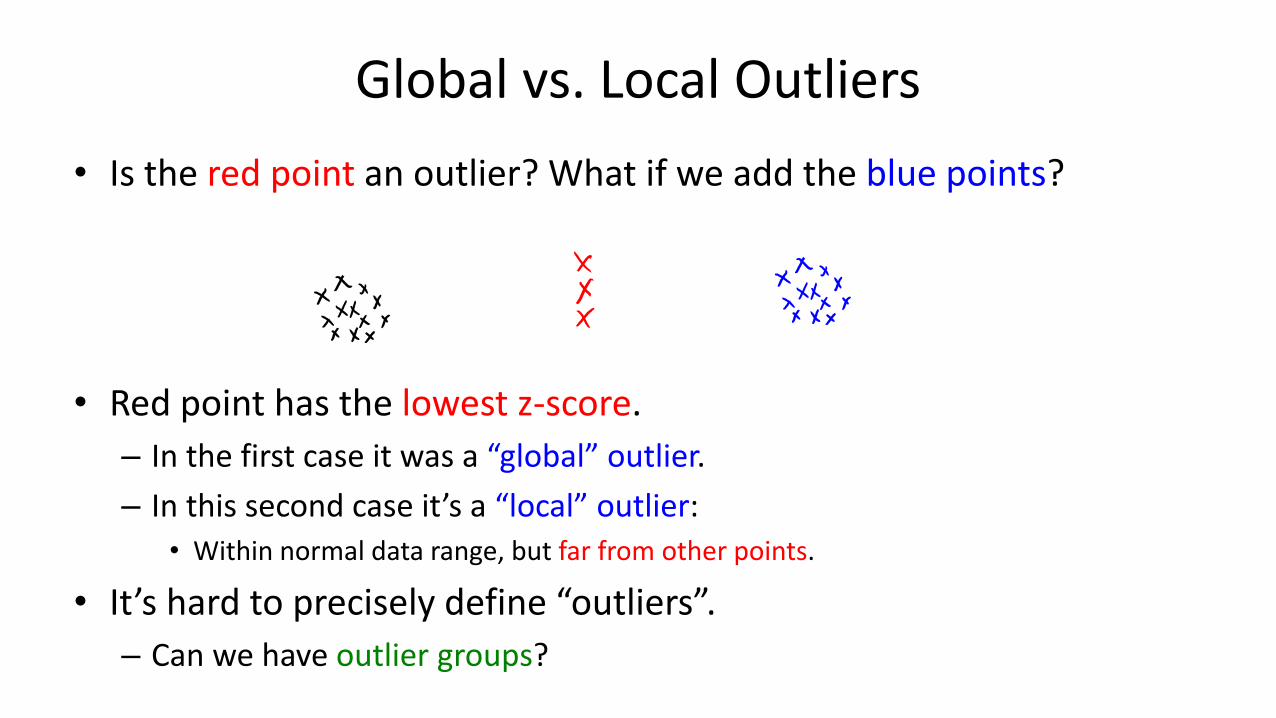
Global vs. Local Outliers
• Is the red point an outlier? What if we add the blue points?
• Red point has the lowest z-score.
– In the first case it was a “global” outlier.
– In this second case it’s a “local” outlier:
• Within normal data range, but far from other points.
• It’s hard to precisely define “outliers”.
– Can we have outlier groups?
Global vs. Local Outliers
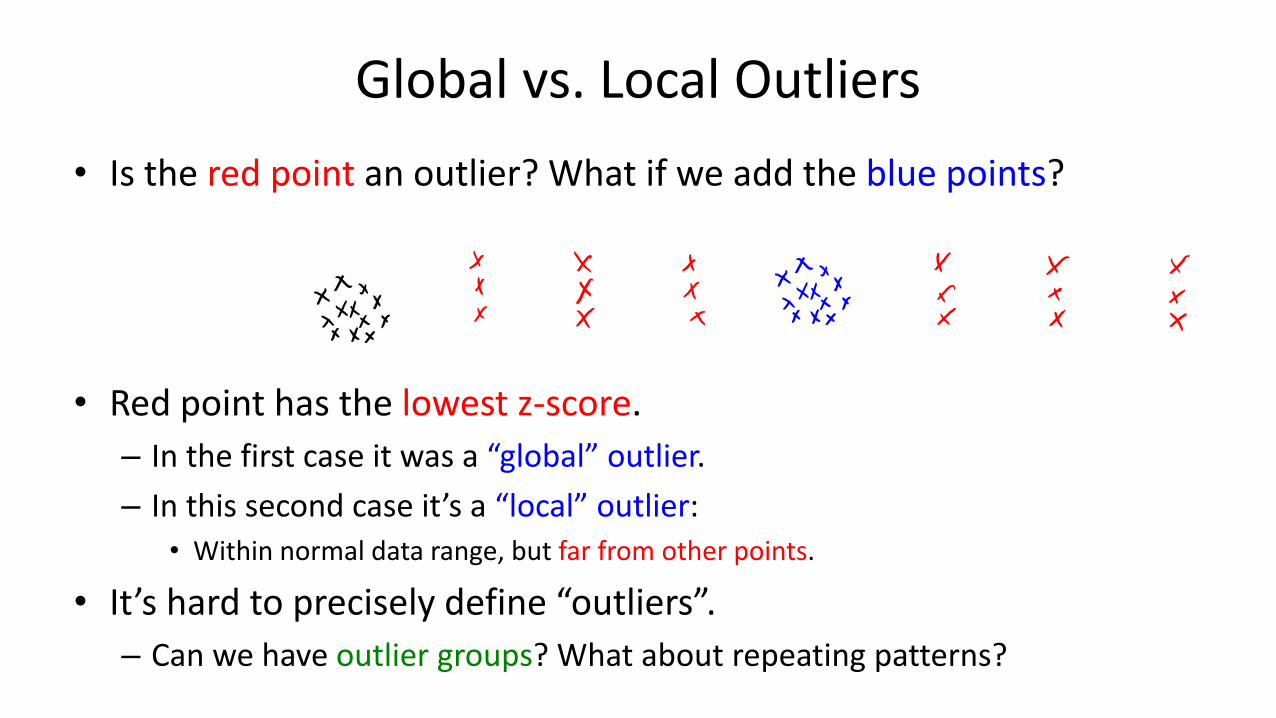
• Is the red point an outlier? What if we add the blue points?
• Red point has the lowest z-score.
– In the first case it was a “global” outlier.
– In this second case it’s a “local” outlier:
• Within normal data range, but far from other points.
• It’s hard to precisely define “outliers”.
– Can we have outlier groups? What about repeating patterns?

Graphical Outlier Detection
• Graphical approach to outlier detection:
1. Look at a plot of the data.
2. Human decides if data is an outlier.
• Examples:
1. Box plot:
• Visualization of quantiles/outliers.
• Only 1 variable at a time.
http://bolt.mph.ufl.edu/6050-6052/unit-1/one-quantitative-variable-introduction/boxplot/

Graphical Outlier Detection
• Graphical approach to outlier detection:
1. Look at a plot of the data.
2. Human decides if data is an outlier.
• Examples:
1. Box plot.
2. Scatterplot:
• Can detect complex patterns.
• Only 2 variables at a time.
http://mathworld.wolfram.com/Outlier.html

Graphical Outlier Detection
• Graphical approach to outlier detection:
1. Look at a plot of the data.
2. Human decides if data is an outlier.
• Examples:
1. Box plot.
2. Scatterplot.
3. Scatterplot array:
• Look at all combinations of variables.
• But laborious in high-dimensions.
• Still only 2 variables at a time.
https://randomcriticalanalysis.wordpress.com/2015/05/25/standardized-tests-correlations-within-and-between-california-public-schools/

Graphical Outlier Detection
• Graphical approach to outlier detection:
1. Look at a plot of the data.
2. Human decides if data is an outlier.
• Examples:
1. Box plot.
2. Scatterplot.
3. Scatterplot array.
4. Scatterplot of 2-dimensional PCA:
• ‘See’ high-dimensional structure.
• But loses information andsensitive to outliers.
http://scienceblogs.com/gnxp/2008/08/14/the-genetic-map-of-europe/

Cluster-Based Outlier Detection
• Detect outliers based on clustering:
1. Cluster the data.
2. Find points that don’t belong to clusters.
• Examples:
1. K-means:
• Find points that are far away from any mean.
• Find clusters with a small number of points.
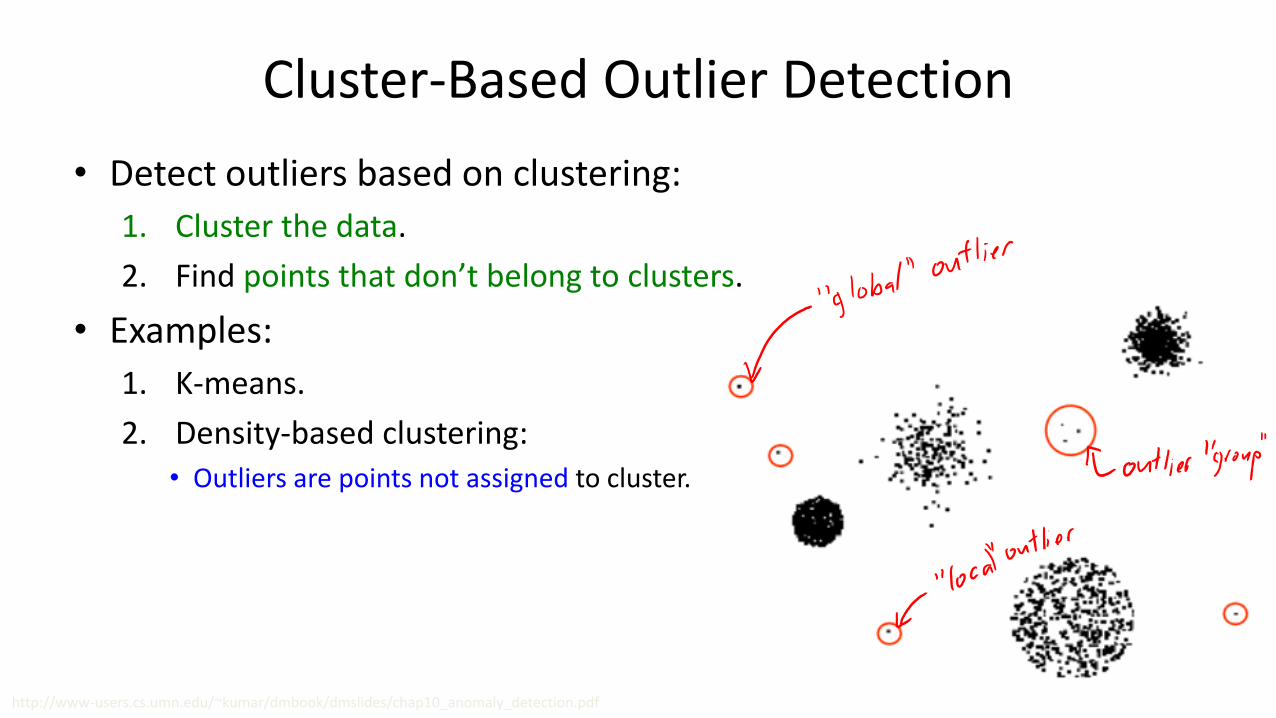
Cluster-Based Outlier Detection
• Detect outliers based on clustering:
1. Cluster the data.
2. Find points that don’t belong to clusters.
• Examples:
1. K-means.
2. Density-based clustering:
• Outliers are points not assigned to cluster.
http://www-users.cs.umn.edu/~kumar/dmbook/dmslides/chap10_anomaly_detection.pdf
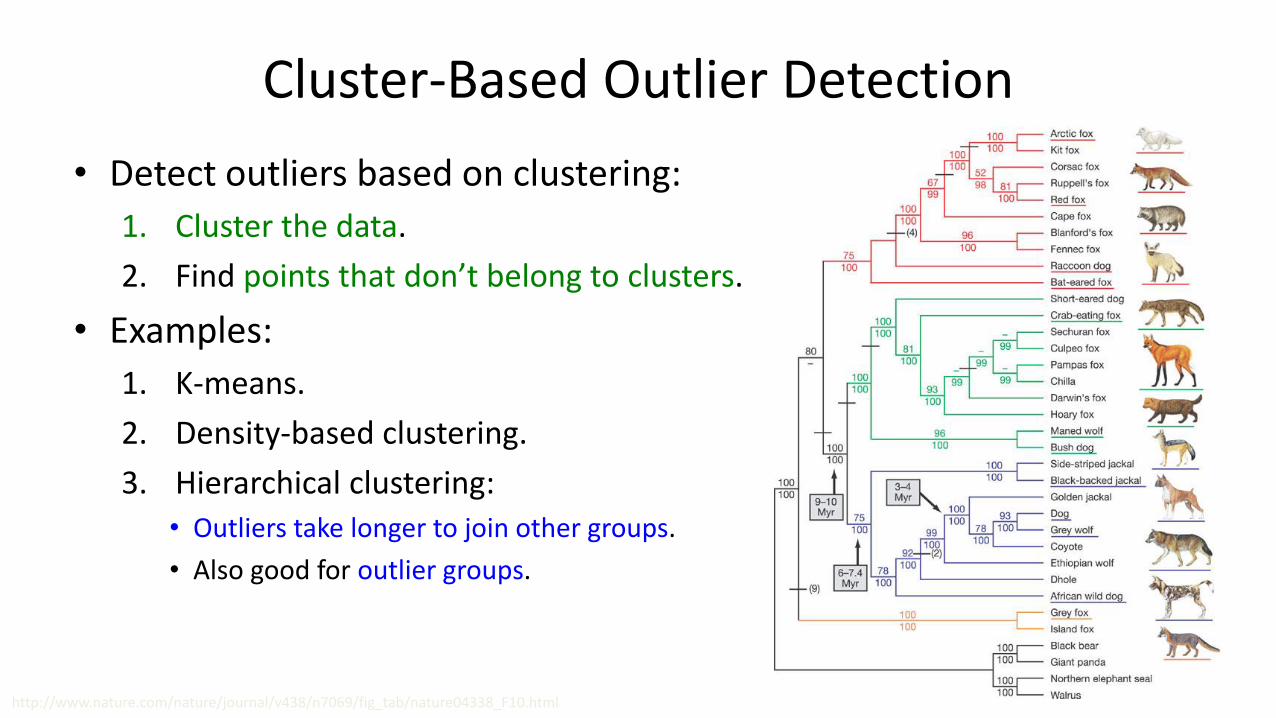
Cluster-Based Outlier Detection
• Detect outliers based on clustering:
1. Cluster the data.
2. Find points that don’t belong to clusters.
• Examples:
1. K-means.
2. Density-based clustering.
3. Hierarchical clustering:
• Outliers take longer to join other groups.
• Also good for outlier groups.
http://www.nature.com/nature/journal/v438/n7069/fig_tab/nature04338_F10.html

Distance-Based Outlier Detection
• Most outlier detection approaches are based on distances.
• Can we skip the model/plot/clustering and just measure distances?
– How many points lie in a radius ‘epsilon’?
– What is distance to kth nearest neighbour?
• UBC connection (first paper on this topic):

Global Distance-Based Outlier Detection: KNN
• KNN outlier detection:
– For each point, compute the average distance to its KNN.
– Choose points with biggest values (or values above a threshold) as outliers.
• “Outliers” are points that are far from their KNNs.
• Goldstein and Uchida [2016]:
– Compared 19 methods on 10 datasets.
– KNN best for finding “global” outliers.
– “Local” outliers best found with localdistance-based methods…
http://journals.plos.org/plosone/article?id=10.1371%2Fjournal.pone.0152173

Local Distance-Based Outlier Detection
• As with density-based clustering, problem with differing densities:
• Outlier o2 has similar density as elements of cluster C1.
• Basic idea behind local distance-based methods:
– Outlier o2 is “relatively” far compared to its neighbours.
http://www.dbs.ifi.lmu.de/Publikationen/Papers/LOF.pdf

Local Distance-Based Outlier Detection
• “Outlierness” ratio of example ‘i’:
• If outlierness > 1, xi is further away from neighbours than expected.
http://www.dbs.ifi.lmu.de/Publikationen/Papers/LOF.pdfhttps://en.wikipedia.org/wiki/Local_outlier_factor

Isolation Forests
• Recent method based on random trees is isolation forests.
– Grow a tree where each stump uses a random feature and random split.
– Stop when each example is “isolated” (each leaf has one example).
– The “isolation score” is the depth before example gets isolated.
• Outliers should be isolated quickly, inliers should need lots of rules to isolate.
– Repeat for different randomtrees, take average score.
https://cs.nju.edu.cn/zhouzh/zhouzh.files/publication/icdm08b.pdf
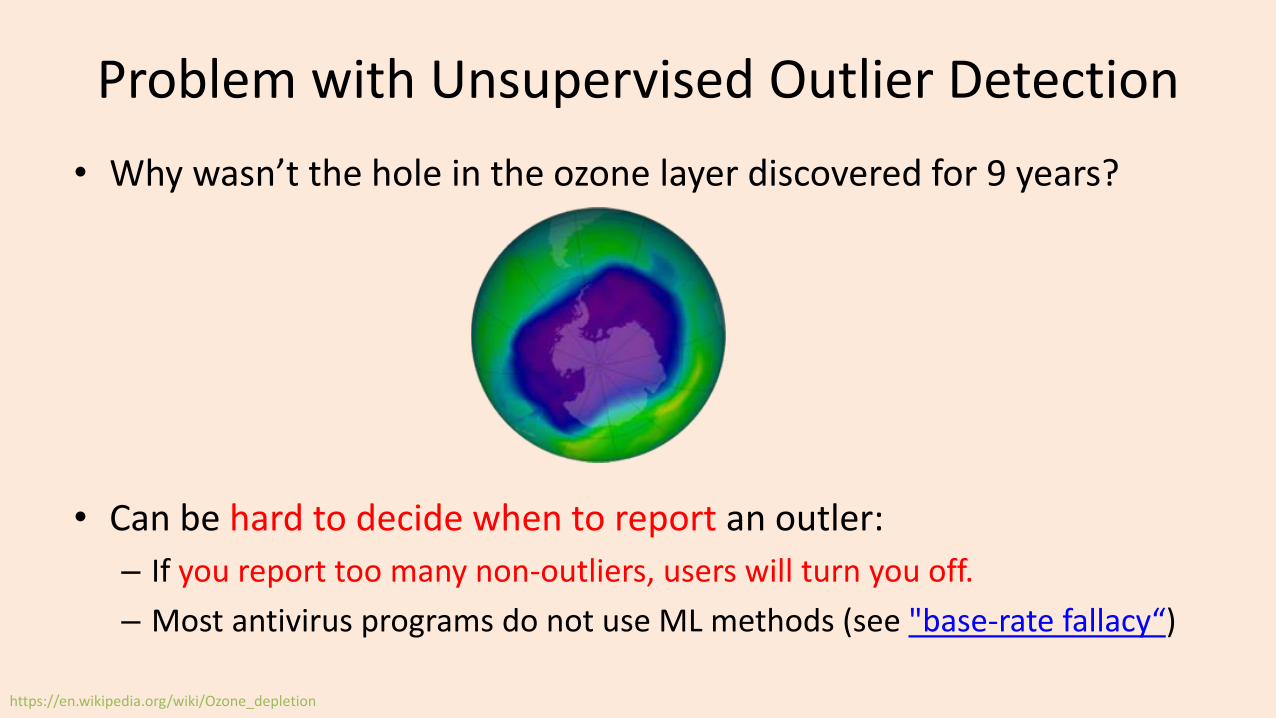
Problem with Unsupervised Outlier Detection
• Why wasn’t the hole in the ozone layer discovered for 9 years?
• Can be hard to decide when to report an outler:
– If you report too many non-outliers, users will turn you off.
– Most antivirus programs do not use ML methods (see "base-rate fallacy“)
https://en.wikipedia.org/wiki/Ozone_depletion
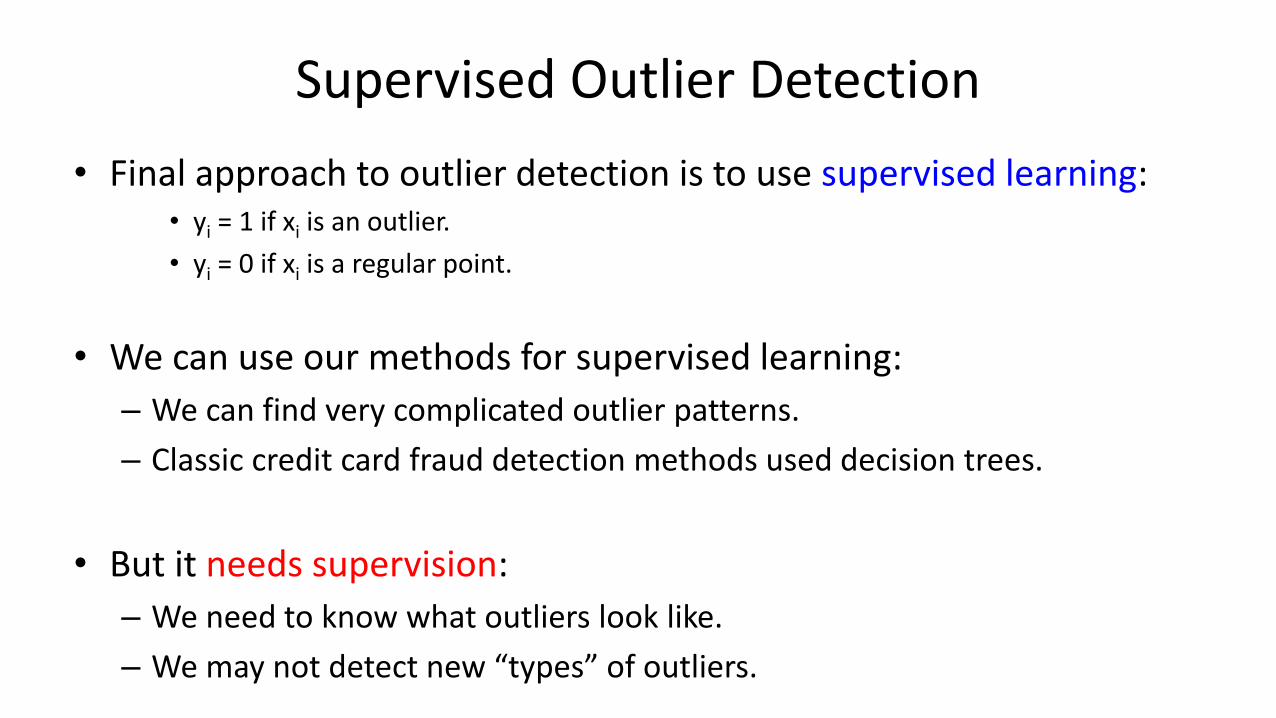
Supervised Outlier Detection
• Final approach to outlier detection is to use supervised learning:• yi = 1 if xi is an outlier.
• yi = 0 if xi is a regular point.
• We can use our methods for supervised learning:
– We can find very complicated outlier patterns.
– Classic credit card fraud detection methods used decision trees.
• But it needs supervision:
– We need to know what outliers look like.
– We may not detect new “types” of outliers.
(pause)

Motivation: Product Recommendation
• A customer comes to your website looking to buy at item:
• You want to find similar items that they might also buy:

User-Product Matrix

Amazon Product Recommendation
• Amazon product recommendation method:
• Return the KNNs across columns.– Find ‘j’ values minimizing ||xi – xj||.
– Products that were bought by similar sets of users.
• But first divide each column by its norm, xi/||xi||.– This is called normalization.
– Reflects whether product is bought by many people or few people.

Summary
• Biclustering: clustering of the examples and the features.
• Outlier detection is task of finding unusually different example.– A concept that is very difficult to define.
– Model-based find unlikely examples given a model of the data.
– Graphical methods plot data and use human to find outliers.
– Cluster-based methods check whether examples belong to clusters.
– Distance-based outlier detection: measure (relative) distance to neighbours.
– Supervised-learning for outlier detection: turns task into supervised learning.
• Amazon product recommendation: – Find similar items using (normalized) nearest neighbour search.
• Next time: detecting genes, viruses, plagiarism, and fingerprints.

Application: Medical data
• Hierarchical clustering is very common in medical data analysis.
– Clustering different samples of colorectoral cancer:
– This plot is different, it’s not a biclustering:
• The matrix is ‘n’ by ‘n’.
• Each matrix element gives correlation.
• Clusters should look like “blocks” on diagonal.
• Order of examples is reversed in columns.– This is why diagonal goes from bottom-to-top.
– Please don’t do this reversal, it’s confusing to me.
https://gut.bmj.com/content/gutjnl/66/4/633.full.pdf

“Quality Control”: Outlier Detection in Time-Series
• A field primarily focusing on outlier detection is quality control.
• One of the main tools is plotting z-score thresholds over time:
• Usually don’t do tests like “|zi| > 3”, since this happens normally.
• Instead, identify problems with tests like “|zi| > 2 twice in a row”.
https://en.wikipedia.org/wiki/Laboratory_quality_control
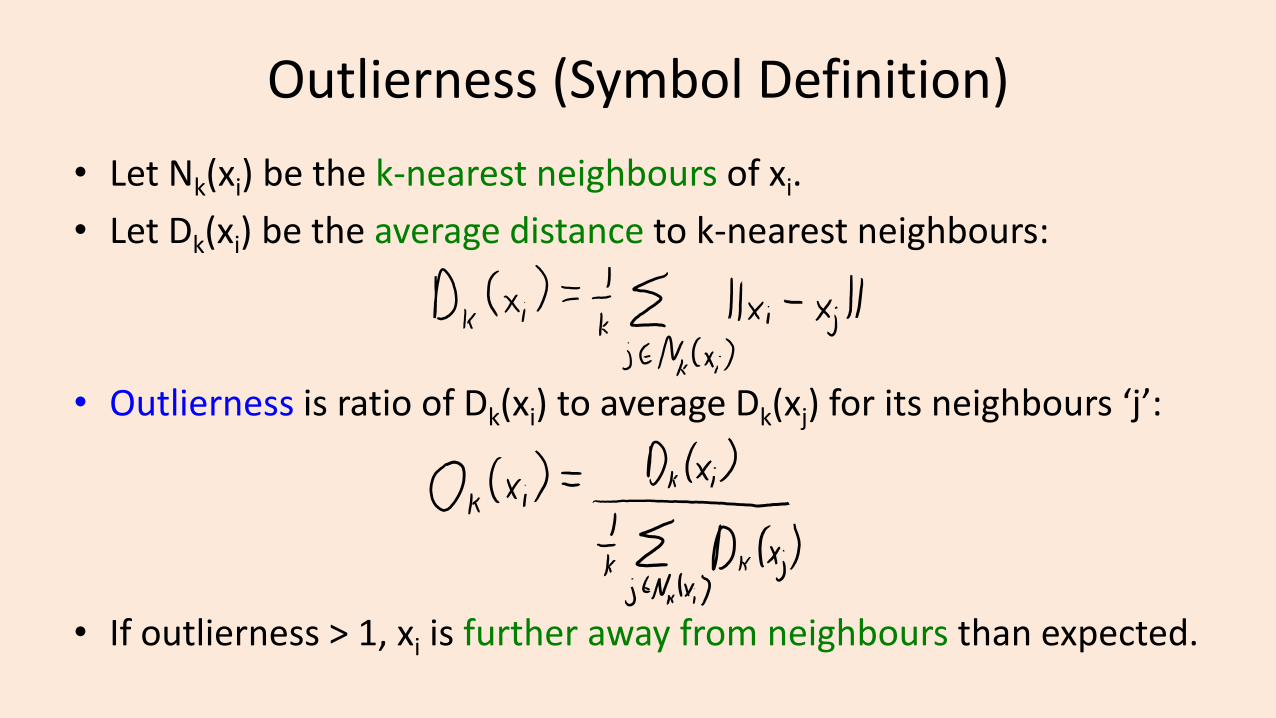
Outlierness (Symbol Definition)
• Let Nk(xi) be the k-nearest neighbours of xi.
• Let Dk(xi) be the average distance to k-nearest neighbours:
• Outlierness is ratio of Dk(xi) to average Dk(xj) for its neighbours ‘j’:
• If outlierness > 1, xi is further away from neighbours than expected.
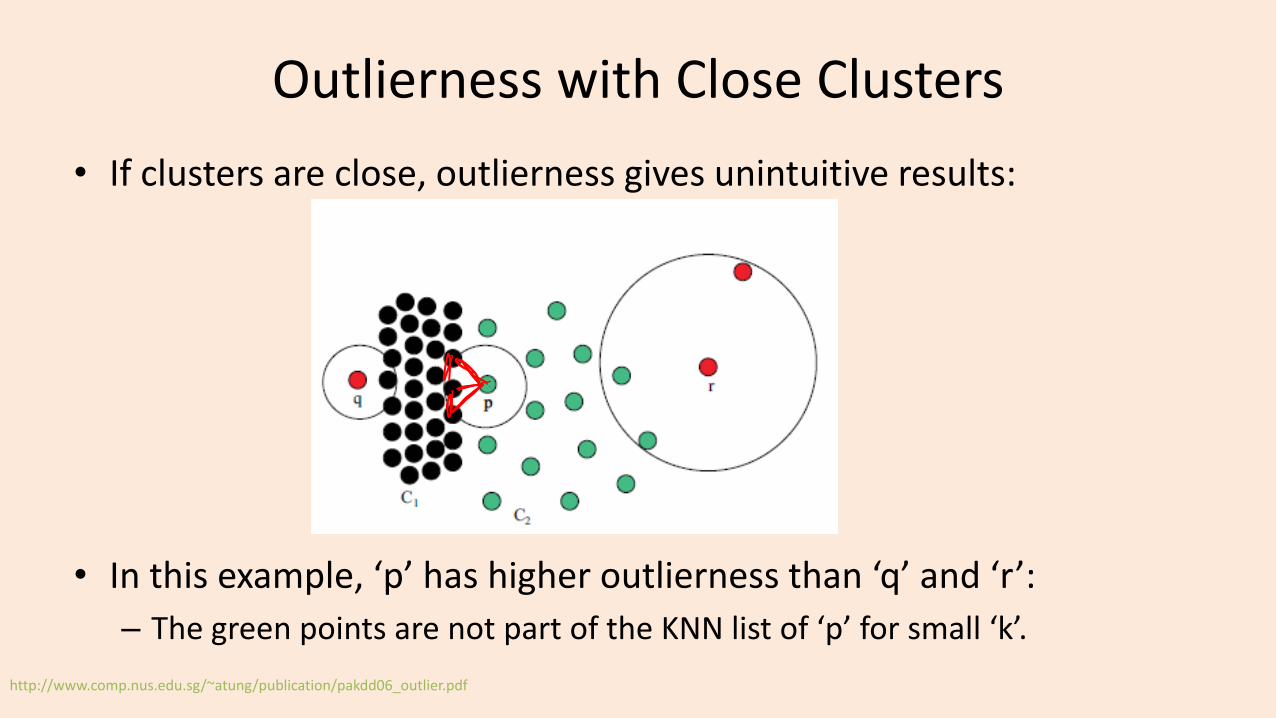
Outlierness with Close Clusters
• If clusters are close, outlierness gives unintuitive results:
• In this example, ‘p’ has higher outlierness than ‘q’ and ‘r’:
– The green points are not part of the KNN list of ‘p’ for small ‘k’.
http://www.comp.nus.edu.sg/~atung/publication/pakdd06_outlier.pdf

Outlierness with Close Clusters
• ‘Influenced outlierness’ (INFLO) ratio:– Include in denominator the ‘reverse’ k-nearest neighbours:
• Points that have ‘p’ in KNN list.
– Adds ‘s’ and ‘t’ from bigger cluster that includes ‘p’:
• But still has problems:– Dealing with hierarchical clusters.– Yields many false positives if you have “global” outliers.– Goldstein and Uchida [2016] recommend just using KNN.
http://www.comp.nus.edu.sg/~atung/publication/pakdd06_outlier.pdf

Training/Validation/Testing (Supervised)
• A typical supervised learning setup:
– Train parameters on dataset D1.
– Validate hyper-parameters on dataset D2.
– Test error evaluated on dataset D3.
• What should we choose for D1, D2, and D3?
• Usual answer: should all be IID samples from data distribution Ds.

Training/Validation/Testing (Outlier Detection)
• A typical outlier detection setup:– Train parameters on dataset D1 (there may be no “training” to do).
• For example, find z-scores.
– Validate hyper-parameters on dataset D2 (for outlier detection).• For example, see which z-score threshold separates D1 and D2.
– Test error evaluated on dataset D3 (for outlier detection).• For example, check whether z-score recognizes D3 as outliers.
• D1 will still be samples from Ds (data distribution).
• D2 could use IID samples from another distribution Dm.– Dm represents the “none” or “outlier” class.
– Tune parameters so that Dm samples are outliers and Ds samples aren’t.• Could just fit a binary classifier here.

Training/Validation/Testing (Outlier Detection)
• A typical outlier detection setup:– Train parameters on dataset D1 (there may be no “training” to do).
• For example, find z-scores.
– Validate hyper-parameters on dataset D2 (for outlier detection).• For example, see which z-score threshold separates D1 and D2.
– Test error evaluated on dataset D3 (for outlier detection).• For example, check whether z-score recognizes D3 as outliers.
• D1 will still be samples from Ds (data distribution).
• D2 could use IID samples from another distribution Dm.
• D3 could use IID samples from Dm.– How well do you do at recognizing “data” samples from “none” samples?

Training/Validation/Testing (Outlier Detection)
• Seems like a reasonable setup:– D1 will still be samples from Ds (data distribution).
– D2 could use IID samples from another distribution Dm.
– D3 could use IID samples from Dm.
• What can go wrong?
• You needed to pick a distribution Dm to represent “none”.– But in the wild, your outliers might follow another “none” distribution.
– This procedure can overfit to your Dm.• You can overestimate your ability to detect outliers.

OD-Test: a better way to evaluate outlier detections
• A reasonable setup:
– D1 will still be samples from Ds (data distribution).
– D2 could use IID samples from another distribution Dm.
– D3 could use IID samples from Dm.
– D3 could use IID samples from yet-another distribution Dt.
• “How do you perform at detecting different types of outliers?”
– Seems like a harder problem, but arguably closer to reality.

OD-Test: a better way to evaluate outlier detections
• “How do you perform at detecting different types of outliers?”
https://arxiv.org/pdf/1809.04729.pdf