=cr~~ vjrnm~;:;;;;;- ---.l~-----i~2~~ · system design and selection method which is applicable to...
TRANSCRIPT

Moe G283~
CR-1J3S'l3
FINAL REPORT
SPACE STATION VENTILATION STUDY
FEBRUARY 1972
15~69
UnclasGJ 3~
«MAS A=CR~ ~ 2.3 593» S VJrnm~;:;;;;;-_---.L~-----i~2~~STUDY Final RepOJrtPA~E STATION VENTILaTION(BcDonnell-Douglas A oVo Colombo o et al~972 1316 p' stronautllcs Coo) Febo
CSCL 22B
Prepared Under Contract No. NAS8-26267
By
Biotechnology and power DepartmentMcDonnell Douglas Astronautics Company
Huntington Beach, California
ForGeorge C. Marshall Space Flight Center
National Aeronautics and Space AdministrationMarshall Space Flight Center, Alabama 35812
https://ntrs.nasa.gov/search.jsp?R=19720014229 2018-07-06T08:52:32+00:00Z

MCDONNELL DOUGLAS ASTRONAUTICS COMPANY
5301 BoIsaAvenue, Huntington Beach, CA 92647 (714) 896-3311
MDC-G2835
Final Report
SPACE STATION VENTILATION STUDY
February 1972
Prepared by: G. V. Colombo and G. E. Allen
Approved by:
Prepared under Contract No. NAS8-26267
byBiotechnology and Power Department
McDonnell Douglas Astronautics Company - WestHuntington Beach, California
forGeorge C. Marshall Space Flight Center
National Aeronautics and Space AdministrationMarshall Space Flight Center, Alabama 35812
/MCDONNELLDOUGL~
CORPORAnON

ABSTRACT
This report presents the study results of Contract No. NAS8-26267
in two parts. Part I includes the development of a ventilation
system design and selection method which is applicable to any
manned vehicle. This method was used to generate design options
for the NASA 33 foot diameter space station, all of which meet
the ventilation system design requirements. System characteristics
such as weight, volume and power were normalized to dollar costs
for each option. Total system costs for the various options ranged
from a worst case $8 million to a group ot tour which which were all
approximately $2 million. A system design was then chosen from the
$2 million group and presented in detail in the report. In addition,
a ventilation system layout was designed for the MSFC space station
mockup which provided comfortable, efficient ventilation of the
mockup thus confirming the adequacy of the design.
Part II of the report presents a conditioned air distribution system
design for the 14 foot diameter modular space station. This system
was designed using the techniques developed in Part I. The tradeoff
study resulted in the selection of a system which costs $1.9 million,
as compared to the alternate configuration which would have cost
$2.6 million.

PART I, 33 FOOT DIAMETER SPACE STATION

PART I
CONTENTS
FIGURES
TABLES
NOMENCLATURE
SECTION 1 - INTRODUCTION AND SUMMARY
SECTION 2 - DESIGN REQUIREMENTS AND ANALYTICAL APPROACH
Design Conditions, Requirements, and Criteria
Analytical Approach
Sizing the Fan and DuctsAtmospheric Diffuser DesignHeat Exchanger PerformanceAcoustics
References
SECTION 3 - SYSTEM DESIGN AND TRADEOFFS
Trade Method and Philosophy
Tradeoff Results
Design Options
System Performance
References
SECTION 4 - FLIGHT DESIGN
System Layout
System Fan Performance
Diffuser Evaluation
Acoustical Analysis
System Control
Maintainability
Effects of Atmosphere Pressure Changes
Emergency and Out of Tolerance Operations
References
1-11
Page
I-iv
I-vii
I-viii
I-I
1-3
1-3
1-61-61-71-81-8
1-10
1-11
I-II
1-11
1-12
1-20
1-26
1-27
1-27
1-33
1-331-42
1-48
I-51
I-52I-54
I-57

PART I
CONTENTS (Continued)
SECTION 5 - TESTING
Recommended 33 Ft. Dia. Station Mockup Test
Generalized Design Parameter Verification Test
Correlation of Test and Design Data
Costs
Page
I-58
I-58I-58I-62I-63
APPENDIX
A
B
C
DESIGN OPTION LAYOUTS
TEMPORARY MOCKUP VENTILATION SYSTEM
PENALTY CALCULATION
I-iii
I-64I-8l
I-86

2-1
2-2
3-1
3-2
3-3
4-1
4-2
4-3
4-4
4-54-6
4-7
4-84-94-10
4-11
4-12
4-13
4-14
4-154-16
4-17
PART I
FIGURES
Steady State Atmosphere Temperature Vs. Deck Occupancy
Transient Effect of Increasing Deck Occupancy Fram 6 to12 Men with 500 CFM Ventilation Rate
Thermal Conditioning Unit
Typical Fan Performance Characteristics
Crew Compartment Temperature Attainable by Mixing 530FAtmosphere with Deck Atmosphere
Typical Atmosphere Supply System Configured for Deck 1or 3
Typical Atmosphere Supply System for Deck 1 or Deck 3Crew Compartments
Deck 2 Atmosphere Supply and Return System
Deck 4 Atmosphere Supply and Return System
Thermal Conditioning Unit Central Station Layout
System Fan Performance Curves
Bacterial Filter Pressure Drop as a Function of VolumeFlow
Modular and High Induction Diffuser Test Set Up
Modular Diffuser with Four-Way Blow
Modular Diffuser with Two-Way Blow
Modular Diffuser with Single Direction Blow
High Induction Circular Diffuser Test Arrangement andPerformance Data
Wall Mounted Slot Diffuser Test Arrangement andPerformance Data
Sound Level Versus Frequency
Typical Sound Trap Attenuation
Typical Control Schematic for Deck 1 or Deck 3 ExcludingCrew Compartment
Typical Control Schematic for Deck 2 or Deck 4
I-iv
1-5
1-6
1-18
1-19
1-24
1-28
1-29
1-30
1-31
1-32
1-34
1-35
1-37
1-38
1-391-40
1-41
1-43
1-44
1-47
1-491-49
4-18
4-19
5-1
PART I
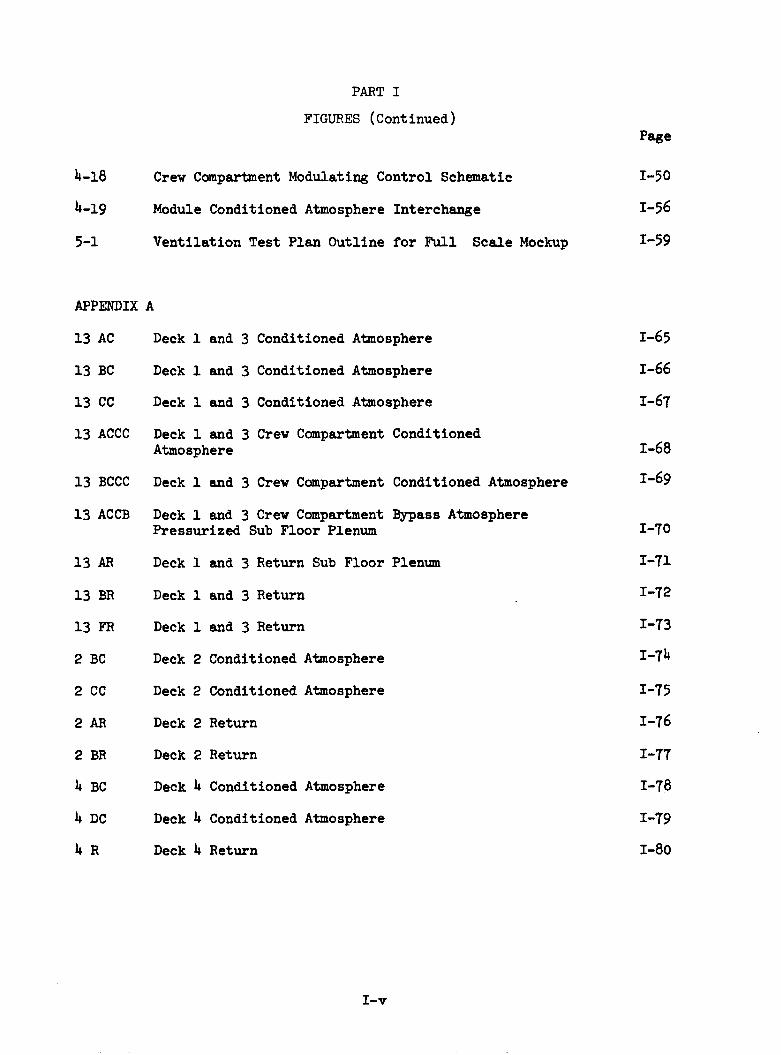
FIGURES (Continued)
Crew Compartment Modulating Control Schematic
Module Conditioned Atmosphere Interchange
Ventilation Test Plan Outline for Full Scale Mockup
Page
I-50
I-56
I-59
APPENDIX A
13 AC Deck 1 and 3 Conditioned Atmosphere
13 BC Deck 1 and 3 Conditioned Atmosphere
13 CC Deck 1 and 3 Conditioned Atmosphere
13 ACCC Deck 1 and 3 Crew Compartment ConditionedAtmosphere
13 BCCC Deck 1 and 3 Crew Compartment Conditioned Atmosphere
13 ACCB Deck 1 and 3 Crew Compartment Bypass AtmospherePressurized Sub Floor Plenum
13 AR Deck 1 and 3 Return Sub Floor Plenum
13 BR Deck 1 and 3 Return
13 FR Deck 1 and 3 Return
2 BC Deck 2 Conditioned Atmosphere
2 CC Deck 2 Conditioned Atmosphere
2 AR Deck 2 Return
2 BR Deck 2 Return
4 BC Deck 4 Conditioned Atmosphere
4 DC Deck 4 Conditioned Atmosphere
4 R Deck 4 Return
I-v
1-65
1-66
1-67
1-68
1-69
1-70
1-71
1-72
1-73
1-74
1-75
I-76
1-77
1-78
1-79
1-80

PART I
APPENDIX (Continued
APPENDIX B
Page
B-1
B-2
B-3
B-4
Exterior Duct and Equipment Layout for Space Station Mockup
Deck 2 Layout
Deck 4 Layout
Deck 1 and 3 Layout
1-82
1-83
1-84
1-85
APPENDIX C
C-l Duct Weight per Unit Length Versus Perimeter of Duct
I-vi
1-87

2-1
3-1
3-2
3-3
3-4
3-5
3-6
4-1
PART I
TABLES
Space Station Ventilation Study Design Requirements Phase B
Option Penaltys
Option Combinations
Module Options
Thermal Conditioning Unit Components Estimated Weightsand Volume
Selected Configuration Penaltys Based on Higher VelocityAir in Various Ducts
Module Penalty Based on Selected Configuration
Sound Energy Attenuation Within Distribution SystemSupplying Crew Compartment
Page
I-4
I-13
1-16
1-17
1-18
1-21
I-22
1-46
APPENDIX C
C-l Volume and Weight for Selected Duct Sizes
I-vii
1-88

SYMBOLS
C
Cp
Cpc
Cph
D
d
f
g
tlH
K
L
Mc
Mh
Pr
Q
Rq
Se
PART I
NOMENCLATURE
DEFINITION
SPEED OF SOUND
LOSS COEFFICIENT
SPECIFIC HEAT
SPECIFIC HEAT OF COLDER FLUID
SPECIFIC HEAT OF WARMER FLUID
EQUIVALENT DIAMETER
DISTANCE BETWEEN ENTRANCE AND EXIT
EFFECTIVE DIAMETER AT OUTLET
DARCY FRICTION FACTOR
ACCELERATION DUE TO GRAVITY
ENTHALPY CHANGE OF MOIST ATMOSPHERE
PROPORTIONALITY CONSTANT FOR ORIFICE OR NOZZLE
LENGTH
MASS FLOW RATE OF COLDER FLUID
MASS FLOW RATE OF WARMER FLUID
AVERAGE EFFECTIVE SOUND PRESSURE DUE TO REVERBRATED SOUND
DIRECTIVITY FACTOR
LATENT HEAT LOAD
SENSIBLE HEAT LOAD
ENTRAINMENT RATIO
PLENUM OR TRAP EXIT AREA
I-viii

SYMBOLS
Sw
Vo
a
e
r,;
PART I
DEFINITION
PLENUM OR TRAP WALL AREA
INLET TEMPERATURE OF COLDER FLUID
INLET TEMPERATURE OF WARMER FLUID
OUTLET TEMPERATURE OF WARMER FLUID
TEMPERATURE DIFFERENCE BETWEEN SUPPLY AND RETURN
AVERAGE VELOCITY
EFFECTIVE VELOCITY OF JET AT OUTLET
CENTERLINE RESIDUAL VELOCITY OF THE JET
SOUND POWER OF THE SOURCE
DISTANCE FROM SOUND SOURCE
THROW
MASS DENSITY
ABSORPTION COEFFICIENT OF THE LINING
ANGLE OF INDENCE AT EXIT
ACOUSTICAL CONSTANT
I-ix

SECTION 1.0
INTRODUCTION AND SUMMARY
This study has formulated a design for a ventilation system which will provide
selectable comfort conditions throughout key space station areas. The design
has been developed for the 33 foot space station as defined in the Phase B
Program Definition Study under NASA contract NAS8-25146. Prior to selecting
a design, trade-off studies were made on eight (8) configuration combinations
for Module 1 and four (4) configuration combinations for Module 2. These
trade-off studies provided a basis for comparing weight, volume and power
characteristics of the various feasible configurations. Additional comparative
studies were made on each configuration to determine if unique advantages
existed in the area of performance, reliability, and maintainability.
The design concept chosen is a workable ventilation system which provides
eight (8) zones of control for each module. Each crew compartment has indi
vidual temperature control. The configuration has low weight, low volume
and minimum power requirement. High reliability is achieved as a result of
system simplicity and state-of-the-art component usage. A key feature of
the system is that minimum auxiliary heat is required in any area to provide
the upper design range temperatures (i.e., 750 F to 850 F). This system
characteristic exists due to the ability of the controls to allow air to
bypass the main heat exchanger. Although the system was designed to operate
most efficiently at a space station pressure of 14.7 psia, satisfactory
operation can be achieved at a pressure of 10 psia with increased blower power.
Recommendations for future investigations as a result of this study include
the following:
o Develop an analytical model which can be used to make transient
and steady-state studies based on a changing heat and moisture
dissipation level in various areas of a space station.
o Perform detailed analytical studies on condensation possibilities
in highly stagnant areas.
I-l-
o Conduct tests which will verify key system design concepts and
provide data for upgrading analytical model.
1-2-

SECTION 2
DESIGN REQUIREMENTS AND ANALYTICAL APPROACH
The design requirements and analytical procedures that were used during the
study are reviewed in this section. This description includes a definition
of design conditions, criteria, and requirements in addition to a brief
discussion of the analytical tools utilized to accomplish the design.
Design Conditions, Requirements, and Criteria
The study was based on the 33 foot diameter Phase B Space Station configuration
which was designed to handle 12 men within the two modules. Table 2-1 (Ref
erence 2-1) presents the pertinent conditions and constraints which were
adhered to in formulationg the configuration and sizing the Thermal Conditioning
Unit. Criteria established during the study included formulation of an
acceptable noise level (based on Reference 2-2) which would not intefere with
normal speech levels of communication. This allowed an evaluation of the
amount of attenuation which could be utilized effectively to reduce the fan
and air noise to acceptable levels.
Prior to performing design studies a review of ventilation systems developed
for Skylab, Space Station Simulator, and MOL was made. Based on indicated
performance from these programs calculations were begun for the Phase B
Space Station Configuration. Results of these calculations, shown on Figure
2-1 and 2-2, are based on the following assumptions:
o Conditioned atmosphere delivery temperature is at constant
58°F for Figure 2-1. Initial atmosphere delivery temperature
is 58°F in Figure 2-2.
o Wall temperature is the same as the atmosphere temperature.
o Equipment heat dissipation equals 1500 watts per deck.
o Crew.man sensible metabolic rate equals 500 BTU/HR.
I-3-

DESIGNPARAlvlE'I'ER
TABLE 2-1 SPACE STATION VEN'l'ILATION STUDY
DESIGN REQUIREt·lENTS - PHASE B
DESIGNRANGE COMMEN'l'S
ATMOSPHERE
'I'EI'~PERATUHE
DE\oJ POINT
VELOCITY
PREf,SURE
MEAN KADIANT WALL
TEl~PERATURE
METABOLIC LEVEL
HEA'I' DISSIPA'I'ION
SENSIBLE
LATEN'l'
HEAT EXCHANGER
COOLANT FLOW
COOLANT TEI1P.
65 - 85°F
45 - 85°F
20 - 50 F'l'/llIN
10 - 14.7 PSIA
BTUHormal - 465 HR"/j.Mi~
BTUPeak - 1200 HR/t~J
Crew metabolic + 20% ofnet electrical poweroutput
o - 1650 Ib/hr
44°F
1-4-
Selectable
Transients to 40°F Allowed
Occupied Region Only
Selectable
Range - 300 - 600 B'I'U/HR/MAN
Consider wall adiabatic
Average Dissipation11 490 BTU
, HR
The 78 BTU/liB representsshower and laundry
825 Ib/hr nominal
Minimum

Note: Based onTables I & II
80
350 CFM 500 CFM75
650 CFMAirTemp.
20 - 50 FPMof 70Comfort Zone
65
o 2 4 6 8 10 12
Men Per Deck
FIGURE 2-1 STEADY STATE ATMOSPHERE TEMPERATURE VS. DECK OCCUPANCY
AirTempof
80
75
70o 2
I4
Minutes
I
6 8 10
FIGURE 2-2 TRANSIENT EFFECT OF INCREASING DECK OCCUPANCY FROM 6 TO 12MEN WITH 500 CFM VENTILATION RATE
I -5-

o Initial conditions for Figure 2-2 are based on six crewmen occupying
one deck with an atmospheric flow rate of 500 CFM. Heat transfer
to equipment and deck walls is negligible.
Conclusions reached as a result of these initial calculations are listed
below.
o Figure 2-1 indicates that if 500 CFM of 580 F air is supplied to
a deck the temperature can be maintained within a comfort zone
of 67°F - 730 F with a man loading of zero to seven.
o Figure 2-2 indicates that the deck temperature will rise from an
initial temperature of 730 F to 78°F if deck occupancy is increased
from six men to twelve men. Steady state conditions would be
achieved within ten minutes after increasing the man loading.
Analytical Approach
Conventional analytical methods were used to configure and size the various
components within the system. These methods are discussed briefly in the
following text.
Sizing the Fan and Ducts
Atmospheric flow rate for sizing the fan and transport ducts is based on the
crew metabolic load, equipment heat dissipation and requirements for a minimum
atmosphere movement rate to prevent contaminant buildup and provide comfort.
The flow rate required for sensible heat removal is calculated from equation (1).
(Flow Rate) =s p • C bT
P(1)
and compared against the flow rate required for latent heat removal expressed
in equation (2) [Reference 2-3].
1-6_

(Flow Rate)L = ~t.H
The higher of the two values represent the minimum atmosphere flow rate
required for sensible and latent heat removal. This minimum value known as
primary atmosphere is then divided among the compartments of each deck based
on the expected total heat load for that area.
Transport ducts were used to carry the conditioned atmosphere to its point
of discharge. They were sized based primarily on the pressure drop deemed
allowable from a fan power basis. Pressure drop calculations for flow thru
straight ducts were based on equation (3) [Reference 2-4].
V 2
(Heat Loss)ST = f LID ~g P (3)
(4)(Head Loss)ElbOW =
Losses for flow thru elbows and turns were calculated from equation (4)with the loss coefficient (Cl ) taken from Reference 2-4.
2C !......£.1 2g
Atmospheric Diffuser Design
Atmospheric diffusion utilizes the kinetic energy contained in a jet of the
primary supply to provide movements ranging from 20 - 50 ft/min. throughout
the occupied areas. The motion created by the jet promotes mixing of the
supply (primary) atmosphere with compartment (secondary) atmosphere. Velocity
profiles of isothermal jets issuing from diffusers can be calculated as a
function of the distance from the opening by equation (5) [Reference 2-5].
V =R
V Do eX K
The velocity profile is used to determine the entrainment ratio (i.e.,
ratio of total moving atmosphere to primary atmosphere supplied) a~ various
locations within the compartments. The entrainment ratio is calculated from
equation (6).
I-7-

v VR = 0.314 R/Vo (1.12 + 0.395 K o/V)2_l
q R (6)
Diffuser selection is based on a design which provides the necessary entrain
ment ratio in occupied areas.
Heat Exchanger Performance
Heat rejected from each module of the space station will be removed by a
condensing heat exchanger. The heat exchanger efficiency must be sufficiently
high to allow a close approach between the cooled atmosphere and the leaving
fluid. This efficiency is expressed in terms of effectiveness (Equation 7)
for a cross-flow heat exchanger with the fluid unmixed (Reference 2-6).
t hi - t£ (EFFECTIVENESS) ho= t hi - t ci
where M C >~ Cc Pc Ph
(7)
Actual heat exchanger design was not a part of this study, however, a relizable
effectiveness was assumed to determine a minimum supply atmosphere temperature.
Acoustics
Noise at any point in the space station is a combination of direct and rever
berated sound. The average effective sound pressure due to reverberated
sound is a function the sound power level (SPL) of the source, the character
istic impedance of the medium, and the acoustic properties of the room. Sound
pressure is defined by equation (7) where sound is radiated uniformly in all
directions~
P- 2 W 4/= p c ~r
1-8-
(7)

and by equation (8) where more sound is radiated in one direction than
another.
P 2r (dir)
w= II [ 1pc QI 2 + 4/ ]
41TX r;
(8)
The expression of sound pressure in the more familiar form of sound pressure
level (8PL) is accomplished by equation (9).
Attenuation of excessive noise is achieved primarily by altering the
characteristics of the acoustical path. In the atmospheric distribution
system this is accomplished by use of sound traps or lined plenums (Ref
erence 2-7). Calculation of attenuation resulting from use of acoustical
material within ducts can be made by use of equation (10).
ATTENUATION (db) = 10 LOGIO {Se (10)
I-9-

REFERENCES
2-1 Space Station Preliminary Design, Volume 1, Book 3, McDonnell Douglas
Astronautics Company - West, Report WD MDAC-G0634, July 1910.
2-2 Memorandum Between J. B. Sterett and Mr. Brooksbank at George C. Marshall
Space Flight Center, Huntsville, Alabama, dated June 20, 1969.
I.D. No. S&E-ASTN-ADV-69-14.
2-3 Strock, Clifford; Handbook of Air Conditioning Heating and Ventilating.
1st Edition, The Industrial Press, New York, New York, 1959.
2-4 Vennard, John K.; Elementary Fluid Mechanics, 3rd Edition, John Wiley
and Sons, Inc., New York, New York, 1956.
2-5 ASHRAE Guide and Data Book, Fundamentals and Equipment for 1965 and 1966.
American Society of Heating, Refrigerating and Air-Conditioning
Engineers, Inc., New York, New York.
2-6 Kreith, F., Principles of Heat Transfer, 2nd Edition, International
Textbook Co., Scranton, Pa., 1965.
2-1 Beranek, Leo Leroy, Acoustics, McGraw-Hill, 1954.
Section 3.0
SYSTEM DESIGN AND TRADEOFFS
This section deals with the various configurations investigated in formulating
a specific ventilation system design for each module. A method of investigation
in the form of a trade off analysis was utilized which evaluated the effects
of weight, volume and power required on each system design. Results of the
tradeoff study and optional considerations are tabulated.
Trade Method and Philoso~
The tradeoff procedure considers all feasible combinations of configuration
options listed in Table 3-1. (See Appendix A for deck layouts.) By calculating
option penalties (See Appendix C for sample calculation) for configurations on
each floor on an individual basis and summing, all attractive combinations
were investigated without the tedious computation of all possible permutations
and combinations. Weight and volume penalties and contribution to fan pressure
drop were calculated for each deck by completing Table 3-2. Following this,
module configurations were compared on Table 3-3.
Various methods of sizing ducts were investigated prior to starting the tradoff
analysis. Common sizing methods used in designing duct systems are: constant
pressure drop, velocity reduction, and static regain. Each method has advantages
and disadvantages when used to optimize a duct design from a power, weight and
volume standpoint. Based on the planned tradeoff studies, the velocity reduction
method yields sufficient accuracy, while minimizing duct volume and weight.
The static regain method was used on any constant volume portions of the duct
system when a detailed configuration was established, to validate the sizes
selected by the velocity reduction method.
Trade Off Results
Trade-off studies of various ventilation configurations were completed according
to the method outlined above. Penalty data for the 28 candidate configurations
I-ll-

are presented in Table 3-1 thru 3-3. The most promising combinations of these
options are then presented as Deck options in Table 3-2. Schematics of the
configurations which appear to be attractive based on the results of the
trade off analyses are included in Appendix A. Table 3-3 shows the most
attractive combinations for Module 1 and Module 2, not including maintenance
and spares penalties. The primary difference between the penalties of Module 1
and 2, is the requirement for bacteria filters and maintaining the Biomedical
laboratory, Dispensary and Isolation room at a slightly negative pressure
on Deck 2. The crew compartments have individual temperature control capa
bilities by means of thermostatically controlled mixing of up to 75 c~ of
530 F air with 55 cfm of bypass or unconditioned air. No auxiliary fans are
used in any of the options.
A single design for the thermal conditioning unit was assumed in all con
figurations. Figure 3-1 shows the general component arrangement expected.
Table 3-4 indicates estimated weight and volume for components or component
groups which were derived from data obtained from other aerospace programs.
Duct sizes for the various configurations were established to stay within the
fau power guidelines established in Reference 3-1. Performance characteristics
of a typical fan (Reference 3-2) were investigated over a range of differential
pressures as a basis for determining the noise and power penalties involved
with higher pressures and smaller ducts. Figure 3-2 indicates these perfor
mance characteristics.
Design Options
As an optional design approach higher duct velocities were considered in the
trade off studies. Overall penalties were recalculated on the selected con
figuration using higher velocities and smaller areas on transport ducts where
minimal acoustical treatment would suffice in attenuating the resulting
increase in noise level. Duct velocities were increased from approximately
1000 FPM to 3000 FPM in the main duct transporting atmosphere between decks
1-12-


TABL
E3
-1O
PTIO
NPE
NA
LTY
S
00 0000 40 40 40 60 60 60 00
To
tal
Vol
ume
(2)
Lau
nch
Wei
ght
$l,
04
0/1
b
Duc
tD
uct
Dif
fuse
rra
nd
Op
tio
nV
olum
eP
enal
ty(1
)H
eig
ht t
Pen
alty
(2)
Wei
ght
Pen
alty
(2)
Des
ign
6p
tjW
eigh
t':1
1blb
.in
H 2O!P
enal
tyft
....
p'ec
ks1
snd
3
Ret
urn
Con
t.
13CR
71
.294
0,00
06
0.2
62,6
001
1,0
40
0.2
1,0
02
,613
DR2
8.6
378,
000
36
.037
,400
11
,04
00
.241
6,4
13ER
62
.182
0,00
0-5
8.8
62,2
001
1,0
40
0.2
88
3,2
13FR
9.4
124,
000
1010
,400
11
,04
00
.15
13
5,4
Dec
k2
Co
nd
itio
ned
Air
2AC
--S
ELET
ED--
--2
BC42
.-155
5,00
07
9·2
82,4
009
9,3
60
0.3
56
46
,72
B'C
69
.691
8,00
091
i'194
,700
99
,36
00
.45
1,0
22
,02
B"C
69
.691
8,00
09
1.1
94,7
009
9,3
60
0.4
51
,02
2,0
2cc
33
.844
6,00
059
.561
,800
7.4
7,7
00
0.3
551
5,5
Ret
urn
Air
2AR
30
.039
6,00
04
6.8
48,7
00-
20*
20,8
000
.846
5,5
2BR
21
.228
0,00
03
0.7
31,9
0020
*20
,800
0.7
533
2,7
**In
clu
ded
Bac
teri
aF
ilte
rsI j ! I I I I
-(
-S
pace
Sta
tio
nN
orm
aliz
atio
nF
acto
rs:
(1)
Lau
nch
Vol
ume
$1
3,2
00
/ft3
-t , ...

TABL
E3-
1O
PTIO
NPE
NA
LTY
S
fT
ot.a
lD
uct
Duc
tD
iffu
ser
iVol
ume
Vol
ume
Pen
alty
(1)
Hei
gh
t,P
enal
ty(2
)W
eigh
tP
enal
ty{2
}D
esig
n6
pt
ia
nd
Op
tio
nI
..,1b
lb.
inH 2O
lW
eigh
tft
JIPe
nal
ty
Dec
k4
IC
ondi
tion
edA
ir
4AC
63.3
836,
000
111.
911
6,00
04.
14,
270
0.45
956
t27
04
AIC
51.6
672,
000
95.1
98,9
004.
14,
270
0.42
775,
170
4BC
49.5
653,
000"
92.7
96,4
009
9,36
00.
3575
8,76
04
cc59
.578
5,00
089
.693
,200
99,
360
0.38
887,
560
4D
28.6
378,
000
53.7
56,7
004.
74,
890
0·33
439,
590
HR
etur
nA
ir~ VI I
4R
3.6
49,"0
003
.63,
-740
0.3
'310
0·05
53,0
50
I
I ! I I -ISp
Rce
S~at1on
Nor
r.la
liza
tion
Fn
cto
ra:
.I(1
)L
aunc
hV
olum
eI
*13,
;;D
O/f
t3I
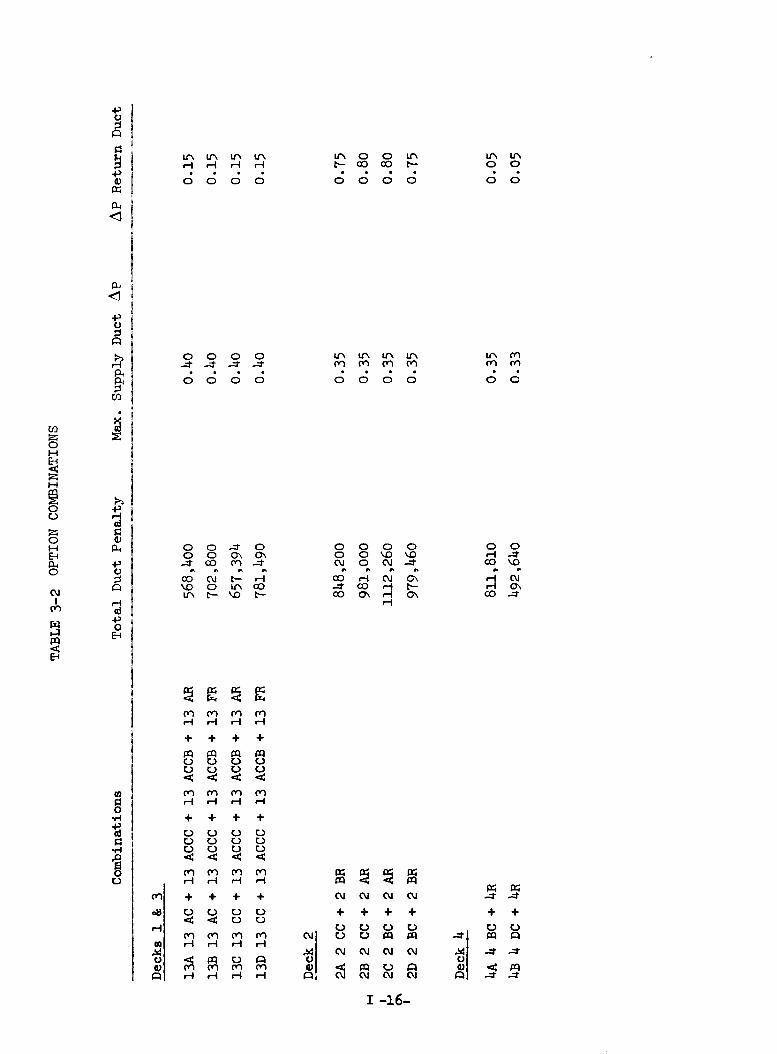
TABL
E3
-2O
PTIO
NCO
MBI
NA
TIO
NS
Com
bina
tion
s
Dec
ks1
&3
13A
13AC
+13
ACCC
+13
ACCB
+13
AR
13B
13AC
+13
ACCC
+13
ACCB
+13
FR
13C
13CC
+13
ACCC
+13
ACCB
+13
AR
13D
13CC
+13
ACCC
+13
ACCB
+13
FR
Dec
k2
2A2
CC+
2BR
H2B
2CC
+2
AR
t.2C
2BC
+2
AR0
\ ,2D
2BC
+2
BR
Dec
k4
4A4
BC+
4R
4B4
DC+
4R
To
tal
Duc
tP
enal
ty
568,
400
702,
800
657,
394
781,
490
848,
200
981,
000
1112
,260
979,
460
811,
810
492,
640
Max
.S
uppl
yD
uct
L\p
0.4
0
0.4
0
0.4
0
0.4
0
0.3
5
0.3
5
0.3
5
0.3
5
0.3
5
0.3
3
L\p
Ret
urn
Duc
t
0.1
5
0.1
5
0.1
5
0.1
5
0.7
5
0.8
0
0.8
0
0.7
5
0.0
5
0.0
5

Mod
ule
1
1-1
13A
+2
B
1-2
13A
+2
C
1-3
13C
+2
B
1-4
13C
+2
C
1-5
13B
+2
A
1-6
13B
+2
D
1-7
13D
+2
A
H1
-813
D+
2D
t .... ~ I
Mod
ule
2
2-1
13A
+4
A
2-2
13A
+4
B
2-3
13C
+4
A
2-4
13C
+4
B
TABL
E3
-3
MOD
ULE
OPT
ION
S
?1
Pow
er,
34
To
tal
Duc
tP
enal
tyf)
.PIn
.W
g.W
atts
Pen
alty
$T
ota
lP
enal
ty$
----
-_.__
.._._
---_
.._._,_
..
1,5
49
,40
01
.80
555
672,
000
2,6
10
,40
0
1,6
80
,70
01
.80
555
672,
000
2,7
41
,70
0
1,6
38
,40
01
.80
555
672,
000
2,6
99
,40
0
1,7
69
,70
01
.80
555
672,
000
2,8
30
,70
0
1,5
51
,00
01
.75
546
663,
000
2,6
03
,00
0
1,6
82
,30
01
.75
540
663,
000
2,7
34
,30
0
1,6
29
,70
01
.75
540
663,
000
2,6
81
,70
0
1,7
61
,00
01
.75
540
663,
000
2,8
13
,00
0
1,3
80
,20
01
.15
355
437,
000
2,2
06
,20
0
1,0
61
,00
01
.15
355
437,
000
1,8
87
,00
0
1,4
69
,20
01
.15
355
437,
000
2,2
95
,20
0
1,1
50
,00
01
.15
355
437,
000
1,9
76
,00
0
1.
Incl
ud
es0
.6"
Wg.
The
rmal
Co
ntr
ol
Un
itP
enal
ty
2.
Ass
umin
g40
%F
anE
ffic
ien
cy
3.Po
wer
Pen
alty
at
$1,2
30P
erW
att
4.In
clu
des
$389
,000
Wei
ght
and
Vol
ume
Pen
alty
from
TCU
nit
5.
Aw
ors
tca
sesy
stem
com
pros
edo
f2
each
of
13B
CC
,13
BC
CC
,13
BCCB
,13
CR
,an
don
eea
cho
f2B
6,2A
R,
4AC
,an
d4R
have
ato
tal
pen
alty
of
$8
,05
2,7
00
.

SupplyAcousticTre.p Baffle
Plate
FIGURE 3-1 THER~~ CONDITIONING UNIT
Filter Section[Removes 5-10,l.l
articles]
Component Weight Volume
Fan 12 lbs .8 Ft 3
Heat Exchanger1. 7 Ft3W/Face Damper 140 lbs (Dry)
Return Acoustic3 Ft3Trap 3 lbs
Supply Acoustic Trap.Bypass SectionBypass Damper,Transition Section,
10 Ft3and Baffle Plate 8 lbs
Filter SectionW/Filters andBlower Filter
1 Ft3Transition 1 lb
TABLE 3-4 THERMAL CONDITIONING UNITCOMPONENTS ESTIMATED ~~IGHT
AND VOLUMEr-18-

.~
6
NOTE: Data based on AiResearchMfg. Model MDF 44 AxialFan
p = .075 Ib/ft3
Pinlet =29.92" Hg
Constant Volume1050 CFM
o 0 400 800 1200 1600 2000
Fan Power, Watts
8500
24 10-r-l 1041p-'l>
650041 •..:l~-~ ~41 0p::; 16 ~
.r-l.. P-.bO 10
J::ogS ~ld ~
~ 4500 ~::;JOOr-l
Cf.l ('t)
8 u r-l41 Il> . 0
oM r-l r-l
2500 fJ t tJr-l p::;41 .0
p::; ~
00 1 2 3 4 5
Static Pressure, in. Wg.
FIGURE 3-2 TYPICAL FAN PERFORMANCE CHARACTERISTICS
1-19-

while velocity in the branch duct around the periphery of the inner core
was increased to 1800 FPM from approximately 700 FPM. Velocity was not
changed in ducts with attached diffusers since an acoustical plenum would be
required for velocity reduction and noise control prior to each outlet. Added
acoustical treatment to ducts without attached diffusers consists of three feet
of lining material on both sides (i.e., before and after each turn) of each
elbow.
Table 3-5 shows the calibrated system duct volume and weights and design
pressure drop for the higher veloc~ty arrangement. Table 3-6 furnishes a
comparison of the penalties for both the high and low velocity arrangement.
It can be noted from Table 3-6 that overall penalties are less for the low
velocity arrangement if configuration B .for Module 2 is selected. Configuration
A, Module 2 overall penalty tabulation indicates the high velocity duct arrange
ment to be less than the low velocity arrangement. However, configuration A,
Module 2 has a higher penalty in both cases than its alternate configuration B.
System duct volume and weight is reduced by its alternate configuration B.
System duct volume and weight is reduced by 28% and 10% respectively when
increased velocity is utilized. Power consumption on the other hand increased
30% with the high velocity arrangement due to increased static pressure loss
within the ducts. Increased duct velocity with the corresponding decrease
in duct volume and weight could prove feasible if the power penalty was reduced
12% or the volume and weight penalty were to increase 6%.
System Performance
Selectable temperature between 650 F and 850 F can be provided within each zone
by the proposed system using minimum auxiliary heat. The system is designed
to allow a portion of the heat from a warm zone to be utilized in a cooler
zone which requires heat. This considerably reduces the need for auxiliary
heat in providing a higher zone temperature (i.e., 750 F - 850 F). Requirement
for auxiliary heat will most often occur in the crew compartment. The box
shown in Figure 3-3 includes the attainable temperatures in each crew compartment
assuming a heat load of 750 BTU/hr from metabolic and equipment. Based on the
1-20-

TABL
E3-
5
SELE
CTED
CONF
IGUR
ATIO
NPE
NALT
YSBA
SED
ON
HIGH
ERV
ELO
CITY
AIR
INVA
RIOU
SDU
CTS
Dec
kD
uct
Pen
alty
(1)
Duc
t*P
enal
ty(2
)D
iffu
ser
Pen
alty
(2)
Des
ign
l.\P
Vol
ume
Wei
ght
Wei
ght
Inch
esH 2O
Ft3
1b
s.1
bs.
Dec
k1
and
3(F
ig.
13AC
CC)
31.1
410,
000
52.2
54,2
003
.23,
320
0.45
"
(Fig
.13
AC)
6.4
84,5
009
.69,
980
2.0
2,08
00.
25"
(Fig
.13
AR)
00
00
LO
1,0
40
0.15
"
(Fig
.13
ACCB
)0
00
03
.23,
300
0.35
"H I I\
)I-
' ID
eck
2
(Fig
.2B
C)
28.6
377,
000
64.1
66,9
009
.09,
360
1.2
"
(Fig
.2
AR)
30.0
396,
000
46.8
48,7
0020
.020
,800
0.8
"
Dec
k4
(Fig
.4
BC)
28.4
374,
000
63.5
66,0
009
.09,
360
LO
(Fig
.4
R)
3.6
49,0
003
.63,
740
0.3
310
0.05
Fig
.4
DC23
.230
6,00
047
.749
,500
4.7
4,89
00.
51
*In
clu
des
inte
rnal
lin
ers
at
elbo
ws
of
hig
hv
elo
city
du
cts.

TABL
E3-
6
MOD
ULE
PENA
LTY
BASE
DON
SELE
CTED
CON
FIG
URA
TIO
N
Mod
ule
No.
Co
nfi
gu
rati
on
To
tal
Vol
ume
and
Max
.S
uppl
yPo
wer
To
tal
Mod
ule
Wei
ght
Duc
tan
dT
herm
alF
ant,
pP
enal
tyP
enal
tyC
on
dit
ion
ing
Pen
alty
Wat
ts$
LOV
ELO
CITY
1F
ig.
13
AC13
ACCC
2,0
69
,72
01
.855
567
2,00
02
,74
1,7
20
13AC
CB13
AR2
BC2A
R
2F
ig.
13AC
H1
3AC
CCI f\)
A13
ACCB
1,7
69
,27
01
.15
355
437,
000
2,2
06
,27
0f\
)
13AR
4BC
4R
2F
ig.
13AC
13
ACCC
B13
ACCB
1,4
50
,10
01
.15
355
437,
000
1,8
87
,10
013
AR4
DC4
R
HIG
HV
ELO
CITY
1F
ig.
13AC
13AC
CC13
ACCB
13AR
1,8
76
,18
02
.679
598
0,00
02
,85
6,1
80
2BC
2A
R

TABL
E3-
6(C
onti
nued
)
MOD
ULE
PEN
ALT
YBA
SED
ONSE
LECT
EDCO
NFI
GU
RATI
ON
Mod
ule
No.
Co
nfi
gu
rati
on
To
tal
Vol
ume
and
Max
.S
uppl
yPo
wer
To
tal
Mod
ule
Wei
ght
Duc
tan
dT
herm
alF
anAP
Pen
alty
Pen
alty
Co
nd
itio
nin
gP
enal
tyW
atts
$
2F
ig.
13AC
1,4
59
,83
01
.65
500
615,
000
2,0
74
,83
013
ACCC
A13
ACCB
13AR
4BC
4R
2F
ig.
13AC
H13
ACCC
IB
13AC
CB1
,37
0,9
60
1.4
545
055
5,00
01
,92
5,9
60
f\)
13AR
LA
)I
4BC
4R

90
80
70 --
60
I60
I70 80
°Crew Compartment Temp F
Empty = (zero output), 360 wattsreheat
1 Man + Equip = (400 Btu/hr),243 watts reheat
1 Man + Equip = (750 Btu/hr),145 watts reheat
I90
FIGURE 3-3 CREW COMPARTMENT TEMPERATURES ATTAINABLE
BY MIXING 53°F ATMOSPHERE WITH DECK ATMOSPHERE
1-24-
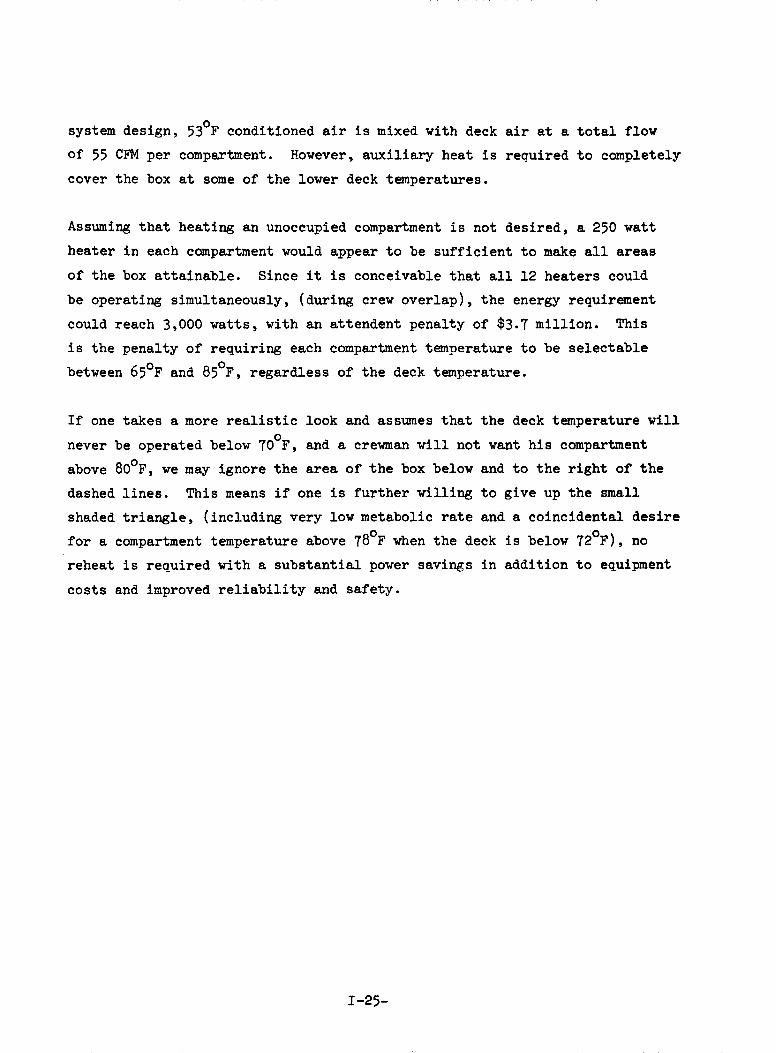
system design, 530 F conditioned air is mixed with deck air at a total flow
of 55 CFM per compartment. However, auxiliary heat is required to completely
cover the box at some of the lower deck temperatures.
Assuming that heating an unoccupied compartment is not desired, a 250 watt
heater in each compartment would appear to be sufficient to make all areas
of the box attainable. Since it is conceivable that all 12 heaters could
be operating simultaneously, (during crew overlap), the energy requirement
could reach 3,000 watts, with an attendent penalty of $3.7 million. This
is the penalty of requiring each compartment temperature to be selectable
between 650 F and 850 F, regardless of the deck temperature.
If one takes a more realistic look and assumes that the deck temperature willonever be operated below 70 F, and a crewman will not want his compartment
above 800 F, we may ignore the area of the box below and to the right of the
dashed lines. This means if one is further willing to give up the small
shaded triangle, (including very low metabolic rate and a coincidental desire00for a compartment temperature above 78 F when the deck is below 72 F), no
reheat is required with a substantial power savings in addition to equipment
costs and improved reliability and safety.
1-25-

REFERENCES
3-1 Space Station Preliminary Design, Volume 1, Book 3, McDonnell Douglas
Astronautics Company-West, Report No. MDC-G0639, July 1970.
3-2 Jorgensen, Robert; Fan Engineering, 6th Edition, Buffalo Forge Company,
BUffalo, New York, 1961.
1-26-

Section 4.0
FLIGH'l' DESIGN
A flight design was formulated based on the best configuration found during
the tradeoff study. 'I'his section includes a more detailed layout of the
flight design and reports on the controls, diffusers and acoustical treatment
required. In addition the system maintainability, pressure change effects
and emergency operation performance is analyzed .
.S"y..§~ em __L~'y-o_1f_t;_
The flight design selected from the trade off studies was configuration 1-2
('l'able 3-3) for Module 1 and 2-2 for Module 2. These two configurations
appear most feasible due to the calculated low penalty, good atmospheric
distribution characteristics and a degree of commonalty between modules. A
scaled layout of the assemblies and duct system for each deck is shown on
Figure 4-1, 4-2, 4-3, and 4-4. Each deck layouts indicate the location of
turning vanes and balancing dampers along with identification of diffusers
grills and filters. Details are given on diffusers and grills in order to
indicate the level of performance required and aid in developing working
drawings for mockup testing.
The central station thermal conditioning unit installed in the ECLS area is
shown on Figure 4-5. The ECLS compartment will function as a return plenum
for the two decks in each module. It will utilize access door seals and operate
at a slight negative pressure allowing only atmosphere from the return ducts
to enter the area. This method of atmosphere return appears to offer several
inherent advantages in addition to reducing required ducts. These advantages
include lower noise level in decks 1 and 3, containment and localized removal
of heat losses from life support systems, and centralized sensing of hazardous
contaminants. The arrangement provides easy access to equipment which may
require service and minimizes supply duct volume.
1-27-

DO
UG
LA
SA
IRC
RA
nC
OM
PA
NY
,IN
C.
MO
DII
L:
_
.."0
11
:_
__
__
__
__
__
__
__
DIV
ISIO
N
""II"
Allm
.v:
_C
HE
CK
II:)
.v:
_D
AT
C,
_
TIT
U:
RE
PO
RT
NO
:_
NO
TES:
Dif
fuse
rT
ype
-A
nem
ost
atE
-10
0-5
w/e
qu
ali
zin
gd
efl
ert
or
and
volu
me
co
ntr
ol
dam
per
Tu
nn
el
Tu
rnin
gV
anes
inst
all
ed
at
each
elbo
w
Wat
erlo
9-
Ro
taco
reG
rill
-8"
x4"
w/v
olum
eco
ntr
ol
dam
per
®D
iffu
ser
Typ
e-
An
emo
stat
Sla
d-F
(Sp
ec.)
2slo
t-
1"
w/o
ppos
edb
lad
eda
mpe
r
®&
®D
iffu
ser
Typ
e-
An
emo
stat
Sla
d-F
-2
slo
t-2
"w
jop
po
sed
bla
de
dam
per
FIG
UR
E4-
1
TYPI
CA
LA
TMO
SPH
ERE
SUPP
LYSY
STEM
CO
NFI
GU
RED
FOR
DEC
K1
OR
DEC
K3
(CR
EWC
OM
PAR
TMEN
TE
XC
EP
rED
)
Q)
~"
®~
u.I
of'\(
96"
3"x
4"
(See
Fig
ure
13A
C,
App
endi
xA
)
I-2
6-

DO
UG
LA
SA
IRC
RA
nC
OM
PA
NY
,IN
C.
MO
OIl
L,
__
;DIV
lSlO
N
~RI,.Attm
ev
:_
CH
IIC
KID
av:
_D
AT
I:_
TIT
U'
RE
PO
ItT
NO
'_
FIG
UR
E4
-2T
YP
ICA
LA
TMO
SP
HE
RE
SU
PP
LYSY
STl!2
oIFO
RD
EC
K1
OR
DEC
K3
(See
Fig
ure
13A
CC
Can
d13
AC
)F
or
deta
illa
yo
ut
on
ECLS
Un
it.
see
Fig
.4
-1&
4-5
.
NO
TES:
oo
r
-C
rew
cCll
lpar
tlll
ent
therm
ost
at
co
ntr
ols
by
pas
san
dp
rim
ary
atm
osp
her
ed
smp
ers
Opp
osed
bll
lde
blan
c1l1
gan
dsh
ut-
off
dsm
per
Dif
fuse
rT
ype
-A
nem
ost
atS
lad
-F2
Slo
t2
'v
/2se
tso
fm
oto
rize
do
pp
ose
db
lad
ed8
lllp
ers
(see
deta
ilA
-A)
®B
ypas
sat
mo
sph
ere
tran
spo
rted
ina
pre
ssu
rized
plen
umb
elo
wfl
oo
r
~Diffuser
.vit
hp
att
ern
co
ntr
ol
adju
stm
ent
@ ®
I
Pr1
mar
y-~
,..'..
II'
:I
Atm
osph
ere
I
Supp~
:.~,:
I:
I,
---.
......
:.........
..,.
.-+
-+-T
----
---'

DO
UG
LA
SA
IRC
RA
nC
OM
PA
NY
,IN
C.
PA
GE
:_
MO
DIt
L;
__
'DIV
ISIO
N
PR
EP
AR
ED
.V,
_C
HE
CK
IID
.V:
_
DA
T&
:_
TIT
U:
-'-
RE
PO
RT
NO
:_
FIG
UR
E4
-3D
ECK
2A
TMO
SPH
ERE
SUPP
LYAN
DRE
TURN
SYST
EM
(See
Fig
ure
2BC
and
2AR
,A
ppen
dix
A)
<!)
Dif
fuse
rT
ype
-A
nem
ost
atE
-10Q
-5w
/eq
uali
zin
gd
efl
ecto
ran
dvo
lum
eco
ntr
ol
dam
per
®D
iffu
ser
Typ
e-
An
emo
stat
Sla
d-F
2S
lot
2'
w/o
pp
ose
db
lad
eda
mpe
r
®B
acte
rial
Fil
ters
-S
ize
30
"x
30
"
®B
acte
rial
Fil
ters
-S
ize
40"
x40
"
(~
Opp
osed
bla
de
bala
ncin
gan
dsh
ut-
off
dam
per
qvR
etu
rnG
rill
Typ
e-
Wat
erlo
om
od
ellH
MV
siz
e1
4"
x1
0"
w/o
ne-h
alf
inch
thic
k5-l0~
part
icle
filt
er
att
ach
ed
<VT
urn
ing
van
esin
sta
lled
@ea
chel
bo
w
I-3
0-

DO
UG
LA
SA
IRC
RA
nC
OM
PA
NY
,IN
C.
P'A
GII
:_
MO
DE
L:
__
DIV
ISIO
N
PR
EP
AR
ED
BV
:_
CH
EC
KII
D.V
:_
DA
TK
'_
TIT
l..E
:R
EP
OR
TN
O;
_
FIG
UR
E4-
4DE
CK4
ATM
OSPH
ERE
SUPP
LYAN
DRE
TURN
SYST
EM
(See
Fig
ure
4DC
and
4RA
.A
ppen
dix
A)
, I i j I
/ / .I
/
/<D
Dif
fuse
rT
ype
-A
nem
osta
tS
lad
-F(S
pec
.)2
Slo
t-
l'
W/O
ppos
edB
lade
Dam
per
®D
iffu
ser
Typ
e-
Ane
mos
tat
Sla
d-F
2S
lot
-2
'v
/op
po
sed
bla
de
dam
per
CDD
iffu
ser
Typ
e-
Ane
mos
tat
E-1
00-5
v/e
qu
aliz
ing
defl
ecto
ran
dvo
lum
eco
ntr
ol
dam
per
<li)
Opp
osed
bla
de
bal
anci
ng
and
shu
t-o
ffda
mpe
r
~R
etur
nG
rill
Typ
e-
Wat
erlo
om
odel
RC
3HD
-81
sh
e20
"x
12"
v/o
ne-
hal
fin
chth
ick5-1~
part
icle
filt
er
atta
ched
I-3
1-

MO
DE
L:
_
"4
01
::.
__
__
__
__
__
__
__
_D
IVIS
ION
DO
UG
LA
SA
IRC
RA
nC
OM
PA
NY
,IN
C.
~R.~ARED
.v:
_C
HE
CK
ED
ev:
_
DA
U'-
-.,
.;;-
--C
=--:-
;;----
TITL
I:_~
6~~"~·~97!.Y.~2~::;_------------------------RI:PORT
NO
:_
Ii;1
or
3R
etu
rn
FIG
UR
E4
-5TH
ERM
AL
CO
ND
ITIO
NIN
GU
NIT
CEN
TRA
LST
ATI
ON
LAY
OU
T
NO
TE
S:
Can
par
tmen
tse
rves
asa
retu
rnat
mo
sph
ere
plen
um.
Acc
ess
seals
all
oy
the
com
part
men
tto
op
era
teat
asl
igh
tn
eg
ati
ve
pre
ssu
re
Fac
eD
uIp
er
mO
::::::
:::iI-
f'-lS
huto
ttD
Ulp
llrl
l
Scr
een
Inta
ke
Cov
er
Dia
clla
rge
Aco
ust
icT
rap
I-3
2-

System Fan Performance
System fan performance characteristics curves for Module 1 and Module 2 are
shown on Figure 4-6. Module 1 system curve reflects the added pressure drop,
resulting from dust laden (i.e., 0.45 1b/ft2 ) bacterial filters located on
deck 2. Initial system pressure for Module 1 (based on clean bacterial filters)
and Module 2 is 1.43 inches of water. Gradual filter loading occurs in Module 1
until the system pressure drop exceeds 1.8 inches of water where it is assumed
the filters would be changed. Figure 4-7 shows the relationship between
bacterial filter pressure drop and volume flow per unit area for both clean and
loaded conditions.
The desired commonality between Module 1 and Module 2 blowers can be achieved
using two approaches. One approach would be design and manufacture both blowers
to operate on several current frequencies with selection depending on the
impeller speed required to meet the system pressure characteristics. Filter
loading resulting in an increase in the pressure drop could be adjusted for
by changing the operating frequency. A second approach would be to utilize
the same blower housing and impeller for both modules but install different
motors. Outlet dampers would be used to provide an added pressure drop in
Module 1 while the bacterial filters were clean. This would provide commonalty
of blower assemblies for Module 1 and Module 2 in all components except motors.
Diffuser Evaluation
Diffuser designs were established for the flight configured ventilation system
based primarily on commercial test data (Reference 4-1). A preliminary test
was completed in an attempt to correlate commercial test data (developed using
a floor to diffuser height of 9') with expected performance in a space station
where the floor to diffuser height is only 6.5'. The three diffuser designs
tested were: 1) modular cored unit with preforated plates (8" x 8"), 2) high
induction circular unit (5" neck), and 3) wall mounted two-slot unit (3' long).
The test was designed to simulate mounting locations typical of those that will
exist for a space station.
I -33-

StaticPressure'in. H
20
Gage
2.0
1.0
o
Module 1*
200 400 600
Fan "Curve
800 1000
Based on a 11" axialblower operating at3800 RPM, staticefficiency 45%w/atmosphere flow thrubacterial filters of.07 CFM/in2 and a dust
loading of .45 lb/ft2 .
1200
3.0
Air Volume Rate, CFM
* Module 1 system and fan curve will be identical with Module 2when bacterial filters are clean.
Module 2
StaticPressurein. H
20
Gage
2.0
1.0
System Curve
Fan Curve
Based on a 11" axialblower operating at3050 RPM, staticefficiency 45%
o 200 400 600 800 1000 1200
Air Volume Rate, CFM
FIGURE 4-6 - SYSTEM FAN PERFORMANCE CURVES
1-34-

'Z.\-tlV
.8 ),."'Q":>
1 ~~------ ---~"".~~ I0.">-
\p.'lJl I.6 ').0-),. I
I
I ),.0-I lV0-),.
Pressure .4 ~~":>
Drop' 0-),.~lV~ IInches )..~
H2O IJ
.2 IIII
00 .1 .2 .3 .4 .5
Flow Per Unit Area, CFM/in2
1 Selection point represented in Module 1 pressuredrop of 1.8 inches water gage
2 Represents doubling of surface area over 1
3 Represents tripling of surface area over 1
FIGURE 4-7 BACTERIAL FILTER PRESSURE
AS A FUNCTION OF VOLUME FLOW
r-35-

Figure 4-8 shows the test arrangement for the two ceiling mounted
diffusers. The air velocity in the isothermal test set-up was measured by
uSing a portable hot wire anemometer which had an accuracy of approximately
~ 10%. Ratings for ceiling-mounted diffusers are in terms of minimum and
maximum radius of diffusion. Minimum radius of diffusion is defined as the
distance from the center line of the diffuser where the average air velocity
is between 25 and 50 FPM. Maximum radius of diffusion defines the distance
from the center line of the diffuser where the average air velocity is between
20 and 35 FPM. For the wall mounted diffusers these terms are called minimum
and maximum throw.
Modular Cored Unit with Perforated Plate
Figures 4-9, 4-10 and 4-11 present test results from this diffuser in three
different configurations. The three configurations tested consisted of four
way blow, two-way blow, and single-direction blow. The diffuser could be
adjusted to any of the three configurations by relocating the removable cores.
Figure 4-9, 4-10, and 4-11 show the air velocity at the ceiling and six inches
below. The measured air velocity at ceiling height showed a rapid decrease
to reasonable levels as the distance from the diffuser increased. An area
below the diffuser extending approximately two feet down and one foot in
diameter was found to have velocities at or below the 20 FPM level. Overall
velocities within the test area were found to be between 10-30 FPM except in
the area 6" below the ceiling.
Circular High Induction Unit
Figure 4-12 shows the performance of the high induction diffuser (i.e., equal
parts primary air and test area air) when operating at both 50 and 80 CFM.
Rapid reduction in ceiling level air velocity occurred as the distance from
the diffuser increased. A low velocity area also occurred below the high
induction unit as with the modular unit previously described. Air velocities
in the test areas ranged above 20 FPM as shown on Figure 4-12 with the exception
of the ceiling area and the 6" below ceiling area. Lower velocities occurred
in DIR. I than in DIR. II due to a sag in the temporary ceiling which created
some minor turbulences.
1-36-

FIGURE 4-8 - MODULAR AND HIGH INDUCTION DIFFUSER TEST SET UP
59" Blow Direction 2."
u 40"
I
I/#
f
//
,J'/
/
r, ...............
~low Directi<:>E_?( DBlow Direction 1,
'-........... .~
....-.1
37"
'II 61"Blow Direction 4
: l ' •.• .'1""
_,·t· •
Supply Air
Jl
78"
I-37-
r"II
/

160
~B
low
Dir
ecti
on
4&: ..
120
>. .... .... 0 080
r-l
OJ > J.4 ....40
«6"
Bel
owC
eili
ng
----0
01
23
Dis
tan
cefr
omD
iffu
ser,
Ft.
160
Blo
wD
irec
tio
n3
~ &: ..12
0>.
At
Cei
lin
g+
l.r
-! 0 0 r-l
80OJ :::- J.4 .r-! <I;
406"
Bel
owC
eili
ng
00
12
3D
ista
nce
from
Dif
fuse
r,F
t.
Blo
wD
irec
tio
n1
160
.
>.12
0+
l .... 0 080
r-l
G) > J.4 ....
40«
H6"
Bel
owC
eili
ng
I w ())
0I
01
23
Dis
tan
cefr
omD
iffu
ser,
Ft.
160
Blo
wD
irec
tio
n2
~ &: ..12
0>. +l .... 0 0 r-l
80G
) > J.4 ....40
«6"
Bel
owC
eili
ng
-----
00
12
3
Dis
tan
cefr
omD
iffu
ser,
Ft.
FIG
UR
E4
-9M
OD
ULA
RD
IFFU
SER
WIT
HFO
UR
WAY
BLO
W

320
NO
TE:
Vel
oci
tyat
ceil
ing
and
6"be
low
is20
-25
FPM
for
blow
dir
ecti
on
1an
d3
Blo
wD
irec
tio
n4
Blo
wD
irec
tio
n2
320
240
-?~
~
~;(-
1H
.r~ i1
"I W
..\0
>.16
0I
.., orl (} 0 r-i
Q) > J.4 o
rl -=:80
6"B
elow
Cei
lin
g
---
240
;:!:: &: .. >. ..,
160
-1~
orl (} 0
Cr-
i~.
f./
Q)
.fQ.
>~
J.4 orl
<I;
80
611B
elow
Cei
lin
g
oo
12
3o
12
3D
ista
nce
from
Dif
fuse
r,F
t.D
ista
nce
from
Dif
fuse
r,F
t.
FIG
UR
E4
-10
MOD
ULAR
DIF
FUSE
RW
ITH
~lO
WAY
BLOW

20
0
~H
..I
>.~
+'
16
0.-
0....
I0 0 r-l
4) > J.t .... «
80
611B
elow
Cei
lin
g
oo
12
3
Dis
tan
ce
fro
mD
iffu
ser,
Ft.
FIG
UR
E4
-11
MO
DU
LAR
DIF
FU
SE
RW
ITH
SIN
GL
ED
IRE
CT
ION
BLO
W

No Wall
59" )
jJ ~
I1 oADirII Wall 1
oE OB
@ 78"Dir.
~
I
3 oC1 oD
)40"
NOTE: Anemostat type CM-I-IOO A - Vel. 25 FPMSize 5" Diffuser B - Vel. 20 FPMAir Supplied C - Vel. 20 FPM At 50 CFM
D - Vel. 20 FPl-1E - Vel. 25 FPM
80 CFM
--- 50 CFM
6" Down---
"" ........
"-, At Ceiling
""""-'\
""--
250
o
300
50
~
i! 200-~.. 150»+'J'Mg 100...-l
~
o
300
250
~'M 200~-+'JIi.... 150>.+'J'M() 100 -0
...-lC1l
:>-50
012 3Distance from Diffuser, Ft.
Dir. I Data
012 3Distance from Diffuser, Ft.
Dir. II Data
FIGURE 4-12 HIGH INDUCTION CIRCULAR DIFFUSER
TEST ARRANGEMENT AND PERFORMANCE DATA
1-41-

Wall Mounted Slot Diffuser
Figure 4-13 shows the test arrangement and performance of the wall mounted
diffuser. High air velocity, as with the two previous diffuser types,
existed only at the ceiling. Excessive velocity even at the ceiling was
reduced to an acceptable level within 5 feet. Air velocity at other locations
within the test area were in the acceptable region.
Test Findings
The preliminary test showed that air velocities considerably higher and lower
than the 25 to 50 FPM average existed at specific location within the test
area. However, the high and low velocity region was at the ceiling and 6"below ceiling where deviations from the comfort range of 20 to 50 FPM are
not of great importance. Air velocities within the remaining area are in
general very acceptable for all three of the diffuser designs.
Acoustical Analysis
Accepted sound level criteria was not specified in the design constraints
for the space station except as suggested in Reference 4-2. Therefore,
detailed design on noise attenuation could not be formulated during the study.
In order to relate the sound generated due to fans and atmosphere movement
within the transport ducts some constraints were assumed for purpose of analysis.
The assumptions listed below were developed from estimated acoustical require
ments for good speech communication, experience during the 90-day test, and
basic equipment test data.
1) Sound pressure level (SPL) of a typical fan used in the space
station would not exceed that of the four (4) fan cluster used on
the Skylab program. (See Figure 4-14) (Note: Reliable SPL data
was not available from manufacturers.
2) Perfect isolation of machine vibration exists with no other source
of sound other than fan noise and atmosphere noise within ducts.
I-42-

r128'
1 ~3'-+l
r .,NOTE: Anemostat Type Slad
2-S1ot (36" Long)
Both upper and lowerslot open on 2' section
Flow 50 CFM/2 Ft. Section
* l' section closed
A B0 0
Wall 78"
C D0 0
E0
(A) Vel - 19 FPM(B) Vel - 25 FPM(C) Vel - 25 FPM(D) Vel - 28 FPM(E) Vel - 33 FPM
l' Below Ceiling
300
250::E~ 200~
t:-ori 150CJ0r-iV:> 100J.4
orI< 50
00 2 4 6 8 10
Distance from Diffuser, Feet
FIGURE 4-13 WALL MOUNTED SLOT DIFFUSER
TEST ARRANGEMENT AND PERFORMANCE DATA
1-43-

Des
ign
(Est
imat
ed)
Aco
ust
ical
Lev
elF
or
Cre
wC
omna
rtm
ent
.jL-
ITyP
iC~l
Fan
Aco
ust
ical
__
-........
JtL
evel
---J
90-D
ayS
pac
eS
tati
on
~------------~~~
1S
imu
lato
rC
rew
Com
part
men
t
Fan
Eff
.40
%----
----
5070 4080 60
Ul
E-t
E-< ~ ::;:
M rl I 0 rl
r:4 ~ P '0
HH
I::;
:s::
-p..
.s::
-I
Q ;:::;~ ~
I r:4 ~ 8 u 0
30
1;,
,
80
10
012
51
60
20
025
031
540
063
0lK
1.G
K50
080
01.
25K
GEO
MET
RIC
MEA
NFR
EQUE
NCY
(HZ
)
2.5K
2.0K
4.0K
6.3K
3.l
5K
5.0K
S.O
K
FIG
URE
4-14
SOUN
DLE
VEL
VER
SUS
FREQ
UEN
CY

3) Design sound level would not be below that identified on Figure 4-14.
(Note: Design level should be considered an estimate of acoustical
requirements for good speech communication.)
The analysis was based on a typical crew compartment since excessive noise
would probably be most objectional in that area.
Table 4-1 indicates the extent to which sound from a typical fan is attenuated
as it moves through the distribution system to a crew compartment. Some
portion of all the entering sound is lost in each segment of the distribution
system. However, primary losses occur at the elbows which act as sound traps.
The attenuation obtained from bare ducts is greater in the low frequency ranges
than in the higher ranges. Bare duct attenuation consists basically of the
transfer of sound energy to the duct walls, the reflection of sound energy
at the openings (ex., diffusers and branch take-off), and the sound reflection
due to turns or elbows. Air flow generated sound due to turbulences in elbows,
vanes and take-off has also been calculated and is shown on Table 4-1. Its
sound level over the frequency band is below that created by the fan and will
be attenuated in the untreated duct system. Air flow generated sound at the
low velocities, therefore, will not be a factor in the overall sound level of
the crew compartment.
The added attenuation needed to achieve the estimated level for good speech
communication can be had by installing duct lining before and after elbows
(1. e., 18" at entering and exit of elbow) and locating sound traps on the
return and supply side of the blower (Reference 4-3). Duct lining is most
effective in the middle frequency range which is also the speech frequency
range (600 - 4800 cps). Duct lining usually offers a maximum attenuation in
the middle frequency range with a minimum of weight and volume. Table 4-1
shows the reduction in db for duct lining over that for the duct system with
no lining. Sound traps can be designed to accomplish the remaining needed
attenuation. Figure 4-15 indicates the required attenuation which must be
obtained from sound traps along with the achievable attenuation from a 12-inch
long sound trap. The system trade-off studies included allowances for weight
and volume requirements of duct lining and sound traps.
I -45-

TABLE 4-1 SOUND ENERGY ATTENUATIONWITHIN DISTRIBUTION SYSTEMSUPPLYING CREW COMPARTMENT
lypical blower SPLdb (Re 10-13 watts)
Duct SystemAttenuation
BAND MID - FREQUENCY (CPS)
250 5°° 1.9°0 200C?.- ~0Q..0_. .53_0.00
Vaned elbowAir outletreflectionDuct walls
SPL @crew compartment outlet withoutacoustical attenuation
Estimated max. 8PLrequired for goodspeech communication
Requiredattenuation
Air flow generatedsound
Air outletVaned elbowsDuct turbulences
Required attenuationif duct lining aheadand after elbow isutilized.
22.4
52.6
44.0
8.6
17.4
5.0
42.0
12.6
5.9
55.9
38.0
17.9
10.6
11.9
1-46-
18.6
48.9
36.0
12.9
18.6
46.9
34.0 32.0

Go
50
40
5 30H[-lc~;:::.>~.~""
f,.5E-<[.,< 20
10
-
.......-/'
//
/',/
Attenuation of a typicalsound trap w/4 inch internalchannels - 1 foot lonp,
Requiredattenuation in "addition to ductining
oIGo
200250
315400
500G30 lK lo6K
800 1.25K
FREQUENCY, CPS
2.5K 4.0K 6.3K2.0K 3.15K S.OK S.OK
10K
FIGURE 4-15 TYPICAL SOUND TRAP ATTENUATION
I -47-

System Controls
A simplified automatic control technique resulted from the mUltiple zoning
arrangement utilized for each module of the space station. The elimination
of heat exchanger coolant fluid controls; made possible by use of modulating
controls for mixing of cooled and bypassed atmosphere for each zone, minimized
possible maintenance and improved system reliability.
Control Function
Each space station module is separated into eight (8) temperature conditioning
zones for purposes of control. These eight (8) zones are comprised of crew
compartments (six (6) zones), remaining area of deck 1 and 3 (one (1) zone),
and deck 2 or 4 (one (1) zone). The two large zones (i.e., remaining area
of deck 1 or 3 and deck 2 or 4) each have several heat detectors connected
in series which by balancing or unbalancing a bridge network create signals
causing accurate modulating of the face and bypass dampers located on the
central thermal conditioning unit.
Several detectors in series are utilized to provide improved zone temperature
control and enable more accurate sensing of the representative conditions.
Figure 4-16 indicates the control schematic for the remaining area of deck
1 or 3 where two electronic heat detectors are utilized, each with 50% authority.
The control schematic for deck 2 or 4 is shown on Figure 4-17. It utilizes
four (4) electronic heat detectors each with 25% authority. One electronic
heat detector is located in each of the three laboratories with the remaining
electronic heat detector located at the return atmosphere intake.
Each crew compartment is treated as a separate zone which allows individual
selection of temperature. Both conditioned and bypassed atmosphere is supplied
to the crew compartment diffuser plenum which has dampers under control of
the compartment heat detector. Figure 4-18 shows a typical crew compartment
control schematic.
1-48-

Area Heat Detectors
BalancingPotentiometer
';
Control Motor
TAmplifier
Relay 1--------''4-~-___.
V\/'-----I
\'Face and~Bypass Dampers
FIGURE 4-16 TYPICAL CONTROL SCHEMATIC FOR DECK 1OR DECK 3 EXCLUDING CREW COMPARTMENT
Four (4) Heat Detectors250 OHMS each
ControlMotor~
AmplifierRelay
\ Face and~Bypass Dampers
FIGURE 4-17 TYPICAL CONTROL SCHEMATIC FORDECK 2 OR DECK 4
1-49-

BalancingPotentiometer
~~N'v.
CompartmentHeat Detector
r - - - --,,..-.-NI/\N'Ml'.t-., I
.Amplifier"--------,~----i
Relay
ControlMotor~
1000
!\N"---l
Diffuser PlenumDa.m.pers
FIGURE 4-18 CREW COMPARTMENT MODULATINGCONTROL SCHEMATIC
I -50-

Types of Controls
Several types of controls exist which would provide proportional operation.
However, only two types will meet the constraints imposed by the space station
application. These constraints are: 1) Provide accurate measurement and
rapid response to small changes in the control variable, (2) provide a means
of adjustment in each zone to permit changes in the control variable, and 3)
provide high reliability over long periods of time. The two types which
meet the constraints are 1) modulating electric circuits and 2) modulating
electronic circuits. Both types appear to some degree to meet the guidelines
of adequate accuracy, rapid response, remote adjustability and good reliability.
However, modulating electric circuits have the disadvantage of moving parts
in the controller. Modulating electronic circuits do not have this dis
advantage and appear well suited for the space station application. In addition,
electronic controls operate on an error signal where the gain of the system
determines the amount of error required to provide full output of the controller.
High sensitivity is achieved by increasing the amplifier gain. The advantages
of the modulating electronic over the modulating electric are as follows:
o Heat detectors provide rapid response due to low mass in addition
to having no moving parts.
o Several heat detectors can be installed in series to provide
averaging for large zones.
o High reliability solid state components can be utilized in the
amplifier or relay part of the circuit.
Maintainability
System design has stressed high reliability and easy maintainability of all
components. Component differences between the two modules were kept at a
minimum to reduce the number of spares required and allow the greatest
familiarity with the equipment. The components which may require occasional
maintenance include the blowers and controls. On rare occasions the mixing
dampers may require attention and filters changed as ~P instrumentation
indicates. Their maintainability is discussed as follows:
I-5l-
Blowers
Since the system pressure drop for the two modules are different the blower
performance must vary. In order to achieve high reliability the blower would
be designed for direct drive by use of a brushless motor. Module 1 and 2
blower pressure characteristics differ due to the increased system pressure
drop resulting from bacteria filters. Between the two methods considered of
achieving commonality it is felt that a blower design which uses identical
housings and impellers but different motor sizes and speeds would provide
the best reliability. The spare parts required would consist of two motors
(one for each mo~ule) and a spare housing and impeller.
Controls
Each zone controller and its associated bridge network will be located in an
accessable area within the zone. Any failure will only effect that zone.
Controlled devices (i.e., motor operators) are located on the mixing dampers
at the front of the central station unit or in the case of the crew compartment
at the diffuser plenum dampers. Easy access 'to this area is provided. Commonality
of components will exist as follows:
o All eight (8) motor operators are identical
o All bridge and amplifier relays are identical
o Controller (heat detectors) types are limited to three (3)
The ECLS compartment design, Figure 4-5, enhances maintainability by placing
all items which will not require maintenance such as ducts and sound traps
at the rear of the compartment, while the blower, heat exchanger, damper
controls, etc., are placed at the front immediately facing the access doors.
System design calculations were made based on a pressure of 14.7 PSIA within
the Space Station and its inner tunnel. However, design allowances were
made throughout the study to enable system operation at 10 PSIA while pro
cessing the same mass flow. At reduced pressure a higher volume flow results
which affects the performance of the fans, diffusers and central station
1-52-

section of the thermal conditioning system. Performance of subcomponents
such as controls are not effected by a change in pressure.
The characteristic changes which will occur in atmosphere transport losses,
acoustic properties and diffuser performance are discussed below.
Atmospheric Flow Pressure Losses
In order for the mass flow to remain constant in a fixed system with a reduced
pressure the volume flow must increase. This increase for a 10 PSIA pressure
over that calculated for a 14.7 PSIA pressure is approximately 45% as shown in
equation (11).
(pqs
• llt]Vol. Flow • C @10 PSIA
P Vol. Flow (11 )@10 PSIA = qs @14.7 PSIA
[p . C llt] @14.7 PSIAp
Increased pressure drop occurs as the volume flow increases due to higher duct
velocities. This is calculated for 10 PSIA operation relative to 14.7 PSIA in
straight runs of ducts by equation (12). A similar calculation can be made for
elbows and branch takeoffs. All calculations show an increase in head loss
which approximates 44%.
V 2 • P
LIDa • Head Lossf 2g @10 PSIAHead Loss = @14.7 PSIA (12)
V 2 • p
f LIDa
2g @ 14.7 PSIA
Fan Characteristic Changes
Fan power and impeller speed must increase if the same fan is used for the
10 PSIA application as was used for 14.7 PSIA. Fan speed must increase by
a factor of 1.5 and power by a factor of 2.25 (Reference 4-4).
1-53-

Diffuser Performance
Pressure loss thru the diffuser though small is increased due to the higher
velocities at 10 PSIA pressure. The throw or radius of diffusion is .also
increased. These changes are approximated as follows:
Pressure drop - Increases 40-50%
Throw or Radius of Diffusion - Increases 20-50%
[Note: Based on diffuser manufacturer's data (Reference 4-1).]
Acoustic Characteristics of the Chamber
In general, sound pressure level decreases with a decrease in atmosphere
pressure for a fixed system (i.e., a system utilizing constant velocity
with no change in blower speed). The decrease would be directly proportional
to the change in mass density since the speed of sound remains essentially
constant. However, in a system where a constant mass flow is required for
heat removal, higher velocities in the ducts and higher fan speeds result
which creates increased noise. Sound pressure level for air flow generated
sound at the lower pressure will increase by approximately 10 db and blower
noise by approximately 8 db. Based on this the crew compartment will have
only a slight increase in sound pressure level at most.
Emergency and Out-of-Tolerance~er~tJ2E~
In the Baseline Space Station design, a small flow of conditioned atmosphere
is continually supplied to the tunnel to prevent contaminant buildup and to
remove the small amount of heat generated there. This conditioned atmosphere
enters the ventilation assembly and is mixed with ventilation atmosphere and
distributed in the tunnel. Normally, little equipment is operating in the
tunnel and crew activity is limited to inter compartment passage and minor
repair activities. Therefore only a limited amount of tunnel atmosphere
conditioning is necessary. For emergency cases, (one water loop inoperative
in one compartment or 12-men taking refuge in the tunnel), the following
procedure is required.
1-54-

A damper valve at the ventilation fan inlet is positioned to blow larger
amounts of conditioned atmosphere into the tunnel from the humidity and temp
erature control assembly. This damper valve was not identified as a separate
component in the Baseline design but requires a negligible amount of weight
and no electrical power.
Figure 4-19 shows the expected atmosphere conditions during the emergency
situations. Both ventilation assemblies operate during the inoperative water
loop emergency. Conditioned atmosphere is blown into the tunnel by the
ventilation assembly adjacent to the operating ECILS and the tunnel atmosphere
is interchanged with the disabled module atmosphere by the other ventilation
assembly. When operating in this mode, the normal CO2
level is exceeded by
a small amount, 0.26 mm Hg, and humidity is well within acceptable limits.
Adequate cooling will be available in the disabled module because of inoperative
water loop will require shutdown of cold plated electrical equipment. There
fore, a reasonable environment is provided for six men sleeping in the compartment
with an inoperative cooling loop. Additional cooling capacity is available in
the compartment with the operating water loop by increasing the flow rate.
During emergency tunnel occupancy by all 12 crewmen, the ventilation assembly
adjacent to the operating ECILS is operated. Figure 4-19 also shows that the
normal CO2 level is only slightly exceeded, humidity is within normal limits.
Available atmosphere cooling is 10,700 Btulhr at 750 F which should be more than
adequate.
I -55-

FIGURE 4-19 MODULE CONDITIONED AIR INTERCHANGE
Module 2 Module 1
6 Men 6 Men
PC02 - 3 mmHg
-1rCO2 - 3.26 IIlIllHg
~ ~
°50 F Dew Point 53°F Dew Point
500 CFM 500 CFM
1 t f {-
PC02 - 3.13 mm F~ 51. 5°F Dew PointTUNNEL
EMERGENCY CONDITIONS FOR INOPERATIVE WATER LOOP
Module 2 Module 1---
4 -+
12 Men
t t 500 CFM Available cooling isPC02 - 3 mmHg °l5d700 Btu/Hr at 75 F
53 F Dew PointTUNNEL
EMERGENCY CONDITIONS FOR 12 MAN LOADING IN TUNNEL
WITH 1 Ec/LS OPERATING
1-56-

REFERENCES
4-1 Anemostat Draftless Aspirating Air Diffusers, Selection Manual
No. 60-1957, Anemostat COrPOration of America, New York, New York.
1957.
4-2 Memorandum Between J. B. Sterett and Brooksbank at George C. Marshall
Space Flight Center, Huntsville, Alabama, Dated June 20, 1969,
I. D. No. S&E-ASTN-ADV-69-l4.
4-3 Harris, Cyril M., Handbook of Noise Control, McGraw-Hill Book Co.
Inc., New York, New York, 1957.
4-4 Jorgensen, Robert; Fan Engineering, 6th Edition, Buffalo Forge Company,
BUffalo, New York, 1961.
I -57-

SECTION 5.0
TESTING
TEST PLAN
This section discusses two test plans which have been outlined as a part of the
study. One test plan will provide for full-scale mockup testing of the ventila
tion system design. The other test plan outlines a scaled-down test program
utilizing only one deck of the mockup and substitutes analytical modeling of the
remaining deck using the G-189 computer program. Correlation of any testing done
would be made with pretest prediction developed from a math model.
Recommended 33-ft. Diameter Space Station Mockup Test
Table 5-1 outlines a test program utilizing the full-scale mockup as a test bed
to validate the system design concept. Commercial components of the same design
would be substituted for flight hardware in equipping the mockup. The test is
designed to map the atmospheric movement rate. measure temperature gradients at
various simulated loads. measure trace gas levels in dead volume area. eng
measure the sound pressure level in habitable areas.
Generalized Space Vehicle Ventilation Tests
Due to declining support for the 33-foot diameter space station concept. it is
recommended that the follow-on test program be modified to a design verification
test of several of the key concepts developed during the present study. The
following test program can take advantage of the existing space station mockup
as a test bed. The prOgram may be carried out using only the first deck with
only slight modifications and will not require unstacking the decks.
I -58-

Section 1
FIGURE 5-1 VENTILATION TEST PLAN OUTLINE FOR
FULL SCALE MOCKUP
INTRODUCTION
1.1 Program Objective1.2 Program Organization1.3 Program Schedule1.4 Thermal Conditioning System Design for Space Station Mockup1.5 Pre-Test Predictions
Section 2 TEST OPERATING PROTOCOL
2.1 Test Operating Staff2.1.1 Test Supervision2.1.2 Data Collection Engineer2.1.3 Technician
2.2 Test Supporting Staff2.3 Safety Rules
Section 3 TEST EQUIPMENT AND SUPPORT FACILITIES
3.1 Space Station Mockup Preparation3.1.1 Unstack Decks
3.2 Component Evaluation and Procurement3.2.1 Performance3.2.2 Acoustical
3.3 Flight Design Thermal Conditioning System Installation3.3.1 Deck 1
Subfloor Duct to simulate 13 ACCCSubfloor plenum and baffles to simulate 13 ACCB and 13 AR13 AC Ducting13 ACCC DuctingDiffusers, Dampers and Controls
3.3.2 Deck 2Ducts to simulate 2 BC and 2 CCDucts to simulate 2 AR including Bacteria FiltersDiffusers, Dampers, and Controls
3.3.3 Deck 33.3.4 Deck 4
Ducts to simulate 4 BC and 4 DCDucts to simulate 4 RDiffusers, Dampers, and Controls
3.3.5 Air supply unit installed in ECLS BoxHeat exchanger and damperBlowerSound mufflers
1-59-
Section 4
Support Facilities3.4.1 Electrical Power3.4.2 Refrigeration System
INSTRill4ENTATION AND DATA MANAGEMENT
4.1 Instrumentation Selection and Procurement4.1.1 Air velocity measurement devices4.1.2 Temperature gradient measurement device4.1.3 Duct mass flow measurement device4.1.4 Acoustical (Sound Pressure Level)4.1.5 Gas Analysis Equipment
4.2 Instrumentation Calibration4.3 Instrumentation Installation4.4 Instrumentation Signal Conditioning4.5 Data Collecting and Processing Equipment4.6 Test Data Logs
Section 5 PRE-TEST PROCEDURE
5.1 Operational Checkout5.2 NASA Readiness Inspection5.3 Pre-Test Procedure Report
Section 6 TEST
6.1 Velocity Profiles6.1.1 Isothermal velocity mapping to simulate zero gravity6.1.2 Controlled temperature velocity mapping with
simulated thermal loads6.2 Thermal gradients
6.2.1 Thermal mapping in conjunction with 6.1.26.3 Mixing
6.3.1 Investigation of simulated contaminant leak distribution6.3.2 Trace gas introduction and monitoring to investigate
dead volumes6.4 Noise
Sound power measurements during various modes of system operation6.5 SUbjective
Occupation and subjective comfort evaluation of system duringcontrolled temperature tests
Section 7 FINAL TEST REPORT
7.1 Summary7.2 Test Results and Processed Data7.3 Test Conclusions
1-60-

DESIGN CONCEPTS AND TEST APPROACHES
High Wall Slot Diffuser - The use of high wall slot diffusers with a long throw
shows promise of good circulation over a large area with minimum ductin~. This
may be confirmed in its design configuration recommended in options 13 AC and
13 \BC.
Floor Slot Diffuser - Floor diffusers may be advantageous where subfloor ducting
or plenums are attractive from weight and volume standpoints. By mocking up one
or two crew compartments such as proposed in options 13ACCC and 13ACCB, both
plenum and duct fed diffusers, as well as mixing and distribution characteristics,
may be determined.
Bacteria Filters on Return Grilles and Negative Pressure Room - Design criteria
call for biochemical laboratories and medical facilities being isolated to pre
vent the possible spread of bacteria. The design concept to be verified involves
maintaining a room at a slightly negative pressure and passing the return air
through a bacteria filter. This may be accomplished in the waste management area
of the mockup.
Distribution in Room with Only Return Air - The primary air required for
ventilation may be reduced by utilizing the movement of return air in areas with
small thermal loads, or those where a temperature somewhat higher than the rest
of the deck may be desirable. The distribution provided by this approach may be
evaluated by testing option 13 FR in the mockup.
1-61-

Negative Pressure ECLS Box and Return System - Mockup and test system as described
in Section 4.0.
General Tests for Above Concepts - Velocity distributions with isothermal
simulation of zero gravity. Temperature distribution with simulated thermal
loads. Trace gas introduction and monitoring to investigate dead zones.
SUbjective comfort evaluations.
Data obtained from testing the first deck would be correlated ,1ith pretest
analytical predictions in order to develop an accurate math model. Utilizing
the model both transient and steady-state studies would be made for the complete
space station.
Correlations of Test and Design Data
Correlation of design data with test data will be made at the completion of
the test program on atmosphere velocity. temperature level versus heat dissipated.
temperature gradient. humidity level. trace ~as level. and noise level. Each
area of the space station listed will be correlated with predictions made for
that area. The correlated data can then be used to develop an accurate math
model which will serve to evaluate changes in design or determine off design
operating conditions.
The method of correlation would consist of comparing the reduced test data with
the calculated data. Indicated differences would serve as a flag causing exami
nation of the test condition and the assumptions used in the analytical model.
If the analytical assumptions used in the analysis were not supported by the
test data. they would be modified to agree with the test. By comparing each data
point. the test data will serve to update the analJ~ical model.

COSTS
Preliminary costin~ was made for both the full-scale mockup test and the scaled-
down test program. 'rhe breakdown of time and materials furnished below should
be used for rough estimating only prior to development of a detailed test plan
and procedure document.
FULL-SCALE MOCKUP TEST [FOUR (4) DECKS]
Cost Manhours-Design (La~rout &Specification) 900
Fabrication 1300
*Materials 40,000
**Instrumentation & Data Processing 18,000
Testing 300
TOTAL - $58,000 25'5'0
GENERALIZED TEST [SCALED. DOWN - ONE (1) DECK]
Cost Manhours-Design (Layout &Specification) 500
Fabrication 900
*Materials 18,000
**Instrumentation & Data Processing 8,000
Testing 200-TOTAL - $26,000 1600
* Includes Blowers, Diffusers, Ducts, Filters, etc.** Includes Hot Wire Anemometers, Thermocouples, Recorders, etc.
I -63-

APPENDIX A
The configurations analyzed in making the trade-off
studies are shown on the following figures. The
trade-off studies are described in Section 3.0.
I-64-

Console GLS
A-A
• Ceiling Diffuser
t;: Slot Diffuser
(CFM)
T -65-
•
B-B
Figure 13 ACDecks 1 & 3Condition.~d..Atmosphere

Console
A-A
G Ceiling Dif.fusel·
~ Slot DiUuser
(CFM)
T-66-B-B
Figure 13 BC.Decks 1 & 3
\:.\.
\"\.
\\1.\~
\a-__.1

Q) Ceiling Diffuser
(CFM)
.T -67-A-A

A-A
IIt,
i1~
I
I-68-
Figure 13 ACCCDecks 1 and 3
-"",'-. Crew Compartment,.," Condit10ned
~tmo8pher•
.\
a...--,.~{!,:i

A-AI -69-
Figure 13 ECCCDecks 1 & 3
""'~.'"'<, Crew Cornpnrtment~'t CODdl tioned
"'~<,. Atmosphere.,.~"
'\.
"-'r,
1:..~
:-
\
"\~--1
i•~;.
~~/,;
1"""'--"......j~_1.1/
l'J
;'

A-AI -70-
j1/
·f
/.;

a Floor ReturnGrilles
I -71-
EeLS
A-A
Figure 13 ARDecks 1 & 3 ReturnSub Floor Plenum
",l
;'l

Ell Return Grille
1-72- A-A
--~,.

ECL.-S I· ..
~.~,~
...
I -73-
u
'\\
A '.uJ,
r--------l
A-A

r-74-
~ Ceiling DiffuserV 55 CFM each
ECLS
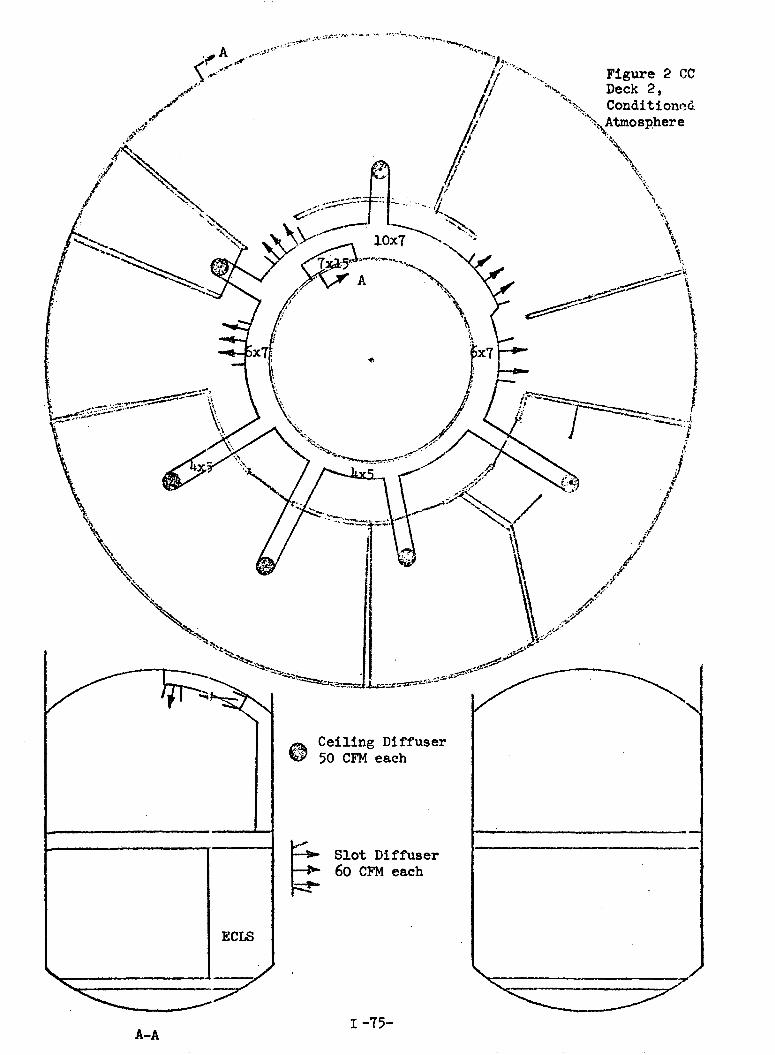
~ Ceiling Diffuser~ 50 CFM each
A-A
ECLS
Slot Diffuser60 CFM each
1-75-

m Return andl:t.t±±J Bacteria Filte:~
A-A
Return Grille
I -76-
EeLS
BB

~ Return and8fEB Bacteria Filter
~ Return Grille
Figure 2 LRDeck 2 Return
1--------,----"-
r-77-

~ Ceiling Diffuser
ECLS
A-A r-78-

~ Ceiling Diffuser
A-A
ECLS
~ Slot Diffuser
1-79-

\\
EeLS
r-80-

APPENDIX B
TEMPORARY MOCKUP VENTILATION SYSTEM
As part of the program to complete the construction of the MSFC Space Station
Mockup by mid-December 1970, MDAC was requested to divert emphasis to assist
ing in the design of the mockup air conditioning system. MDAC was provided
with mockup drawings which showed structural details including equipment and
lighting locations. A design approach was agreed upon utilizing an existing
heat pump, and making use of the volume between the mockup floors and ceilings
as conditioned air plenums. The recommended air supply and return configuration
is shown in Figure B-1. A diffuser was located by MDAC which has the capability
of being adjusted to provide varying flows in any of four directions. The
Anemostat model RMD-PT-4S diffuser (6" x 6") was recommended for use, and
layouts showing recommended locations were prepared as shown in Figures B-2,
B-3, and B-4. The use of 10 to 11 diffusers at 500 CFM per deck, provides
substantially derated operation of the diffusers thus reducing draft problems
in the low ceiling rooms, and eliminating diffuser noise. Some fan noise is
anticipated, and inlet and outlet sound suppressors are recommended as shown
in Figure B-1.
1-81-
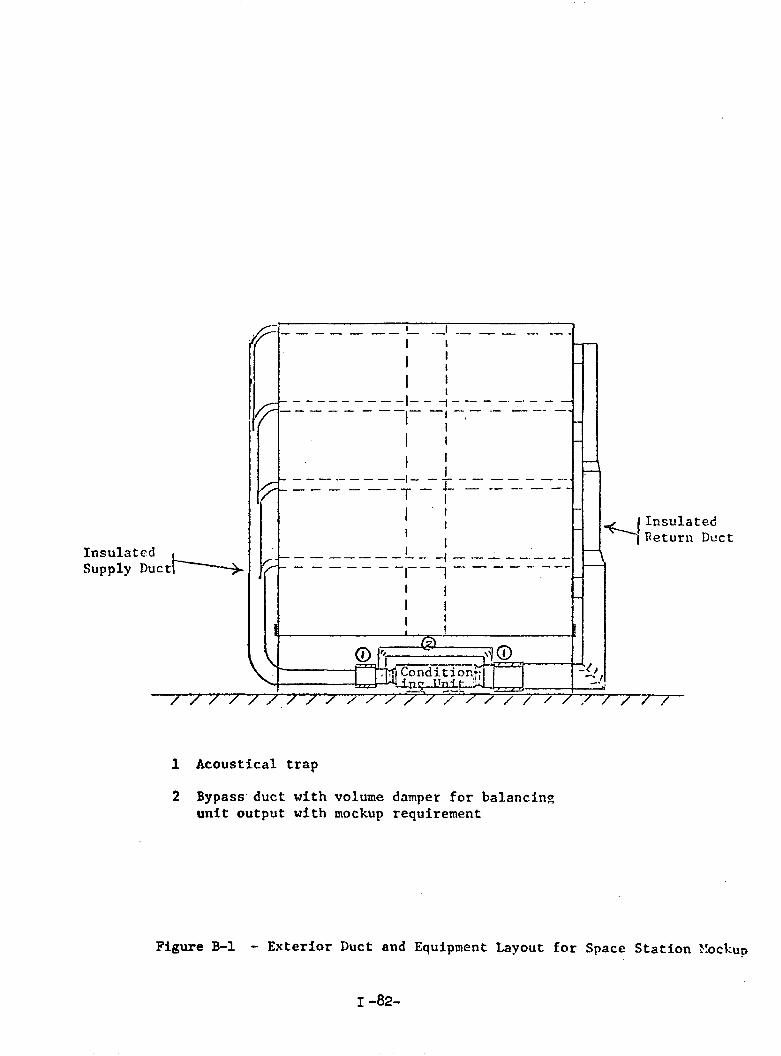
/ / / /
-
\ <D {, "CDi----4cii:c~~1 ~;;;rrri'-
I ·"Ml9ond?:t;ontil .\UI ;',..,~ ,I"''lt- !li.1 I=
I ._1 .__ _
III
I II
I.r-:r- - - - - - - - - -1- - "1 - - - _. -:- - - 1'/-- - - - - --1- -I -,- -- - --- -
II I
I I ~I to-
r- - - - -- - - - -1- - - - - - - - - --~.- - - - - - - T - ~ - - _.. - --
I II I
I Ir I-- - - - - - - - - _.. --1 - - - - _. - - /" r- - - - - - - -,- - l _. - - - _. ---
I II II I
llt- J.-"""..Lf -1G'I
.'v-------
////////////7/////////
Insu13tedSupply Duct~
1 Acoustical trap
2 Bypass duct with volume damper for balancin~
unit output with mockup requirement
Figure B-1 - Exterior Duct and Equipment Layout for Space Station }~ockup
1-82-

Flush Mounted Ceiling Lights
Anemostnt RMD-PT-4S 6" x 6" Di.ffuser (10 required)
(Shaded areas ceiling high)
Figure B-2 - Deck 2 Layout
r-83-

~ Flush Mounted Ceiling Lights~
19 Anemostat R...'1D-PT-4S 6" x 6" Diffuser (10 required)
(Shaded areas ceiling high)
Figure B-3- Deck 4 Layout I -84.;.

Flush Mounted Ceiling Lights
Anemostat RMD-PT-4S .f' x 6" Diffuser (11 required)
(Shaded areas ceiling high)
Figure B-4 -Decks 1 and· 3 Layout
r-85-

APPENDIX C
Penaltys were calculated on each configuration shown in Appendix A and
tabulated in Table 3-1, 3-2 and 3-3 (see Section 3). In order to simplify
penalty _calculations aids were prepared such as Figure C-l and Table C-l.
Figure C-l gives duct weight per unit length for various perimeters of
insulated and uninsulated duct. Table C-l tabulates the volume and weight
per unit length for various sizes of insulated and uninsulated duct. The
method of making a penalty calculation will be illustrated below based on
configuration 1-1 for module 1 (see Table 3-3).
Configuration 1-1 incorporates Deck 1 design l3A (see Table 3-2)
and Deck 2 design 2A (see Table 3-2).
Deck 1 design 13A is made up as follows:
See
Appendix A
For Layouts
Supply layouts 13 AC, 13 ACCC, and 13 ACCB
Return layout 13 AR
Deck 2 design 2A is made up as follows:
Supply layouts 2CC
Return layout 2 BR
Penalty calculations shown in Table 3-1 were made as follows for each layout.
[Duct Length x Vol./Foot x Launch Vol. Penalty] = Penalty(1 )
Wei~ht ][Duct Length x Foot x Launch Weight Penalty = Penalty(2)
Duct
[Diffuser Wt. x Launch Weight Pehalty] = Penalty(2)
(Diffuser)
1-86-

..c ~ ~ CIl
...:I
~
H0 0
I~
CD~
J.<I
CIl P- m ~ - ~ bO ""CIl ~ ~ () tS
2.4
2.0
1.6
1.2 .8 .4
FIG
URE
C-1
DUCT
WEI
GHT
PER
UN
ITLE
NGTH
VERS
ESPE
RIM
ETER
OFDU
CT
-+i
H-i:
:-~:
r\::
'--:::!_~-+~:~:
!_L~
--J-
;-t-
-'--
':4~
-::~
:g3:
:~L=
_'_"~_'
~_,:t
--~p::_,
,-i-
l-LI
--'-
'=r--:
-l---
--:'-
.-'--h
--'-
':T:
:,iT
t-~-:
;-:_;
-';
-',
-,-
;-,
.-
•i:::
--:~
,-i
-':-X
-c_
.,_
_1
,
ii~~-~
S~;'~f
I~J'-~
I;c~:t
~~J??1
~r··.~~I·C\::~
{~~I
~!=L
C~·,Ti~
I~C=~
T,J--4~.+L-±"
~-Ih
ij*'
:~W-
;t~
,'4
.1
~~j~~~
8;~J·.
'.l~i~.T~
14--
--f~
1~~4--Y~I'
+--~
~7~~
t{~
t---
l--
_'._
e.
j..
.,m
;._
L,
__j.
I~&j
-1
'I
_I
.YL:
r::J-
--'r-I
,-.:::
J
,-i--tT
,---;
-:",
-,--
-I-i--
---l
::!::.::
-J/'
1_1.+
.v....-
:-'H
'-,
I!-
:-:I
l--
:-L
-i--
C-L
-,_
_j-
I_...l_
.--'
-+-j
--;-
"-H
--j-
-H-;
--j-
l-'-
j-'H
-l
.'
;,
'I
1-++
--i-+
H-+
-+'-i
l--i+
-+-+
+/.-7
'/'+-+
-1--
0 -;--+
:"1"
'1+-,
--'---
--I--;
-----,
--+,~'+
I,'+
'++
-+-'-
+-+
-:-I
++
I'+-'+
-+-;
+f-
++-i
+_ll_-
-ij..-L'-
--__-,'--+--
,--,-+
--+t
i--.--
-
o8
1624
3240
,---
4856
6412
;,
j
80
Per
imet
ero
fD
uct
,In
ches

TABLE C-1 VOLUME AND WEIGHT FOR SELECTED DUCT SIZES
Size Vo1/Ft Wt/Ft
Ins. Ins.
7 x 15 1.06 0.73 1.53 0.105
7 x 10 0.667 0.486 1.25 0.86
7 x 7 0.562 0.313 0.97 0.66
6 x 7 0.500 0.291 0.91 0.61
5 x 4 0.291 0.139 0.63 0.43
6 x 4 0.333 0.167 0.70 0.47
9 x 7 0.688 0.437 loll 0.76
5 x 7 0.437 0.243 0.84 0.57
5 x 6 0.389 0.208 0.77 0.52
12 x 6 0.5 0.85
22 x 8 1.22 1.43
10 x 17 1.18 1.28
16 x 17 1.89 1.57
20 x 17 2.36 .1.76
I -88-

Total Vol.and Weight = IPenalty
Penalty;(1)
Penalty,(2)
Duct
Penalty(2)
Diffuser
In computing the total volume and weight penalty for configuration 1-1 the above
procedure would be followed for layout 13AC, 13ACCC, 13ACCB, 13AR, 2CC and 2BR.
The combination total volume and weight penalty would be shown on Table 3-2
where the maximum supply duct pressure is evaluated. Table 3-3 shows the
total volume and weight penalty in addition to the fan power required based
on Figure 3-2. The final calculation of total penalty is shown as follows:
Total Volumeand WeightPenalty
+Fan PowerRequired
(Power Penalty)Watt
-89-
Total Penalty for a= specific module
configurat ion


PAR T I I
CONTEBTS
FIGURES
TABLES
Section 1 - IBTRODUCTION AND SUMMARY
Section 2 - DESIGB REQUIREMENTS
Section 3 - SYSTEM DESIGN, ANALYSIS ANDTRADEOFF
SYSTn-i DESIGB
Atmosphere ReconditioningAssembly
Air Temperature ControlAssemblies
SYSTEM ANALYSIS
TRADEOFF RESULTS
Section 4 - FLIGHT DESIGN
System Layout
Contingency Operation
II-ii
Page
II-iii
II-iv
II-1
II-3
II-6
II-6
II-6
II-8
II-10
II-21
II-24
II-24
II-24

3.1
3.2
3.3
3.4
3.5
3.6
3.73.8
3.93.10
4.1
4.2
4.3
PART II
FIGURES '
SERIES FLOW DESIGN CONDITIONS
SERIES FLOW CASE 1 CONDITIONS
SERIES FLOW CASE 2 CONDITIONS
SERIES FLOW CASE 3 CONDITIONS
SERIES FLOW CASE 4 AVERAGE CONDITIONS
PARALLEL FLOW DESIGN CONDITIONS
PARALLEL FLOW CASE 1 CONDITIONS
PARALLEL FLOW CASE 2 CONDITIONS
PARALLEL FLOW CASE 3 CONDITIONS
PARALLEL FLOW CASE 4 CONDITIONS
CREW MODULE PRIMARY AIR DUCT LAYOUT
POWER MODULE PRIMARY AIR DUCT LAYOUT
TYPICAL EXPERIMENT MODULE DUCT LAYOUT
II-iii
PAGE NO.
11-11
II-12
II-13
11-14
11-15
11-16
11-17
11-18
II-19
11-20
11-25
II-26
11-27

2.1
2.2
PART II
TABLES
MODULAR SPACE STATION DESIGN REQUIREMENTS
IDCATION AND LEVEL OF MAN LOADING UTILIZED
IN STUDY DESIGN CONDITIONS
PRIMARY AIR FLOW REQUIRED FOR MAINTAINING
P <: 0.4 kB/m2 and Tnp <: 14.5°CcO2
OPTION PENALTIES FOR SERIES AND PARALLEL
ARRANGEMENT
II-iv
PAGE NO.
II-4
II-5
II-22
II-23

Section 1.0
INTRODUCTION AND SUMMARY
This part is an extension of Contract NAS8-26267 and is designed to
investigate a ventilation system for the 14-foot diameter modular space
station. The level of effort provided by the available funds did not
allow the indepth study and analysis spent on the 33-foot diameter ver
sion covered in Part!. However, the scope of the study starts with
the ventilation system design developed during Contract NAS8-25140 and
expands the design variations in addition to determining trade-off
penalties. The design and trade-off studies consider only the mass flow
of primary air necessary to accomplish humidity control, CO2 removal and
trace contaminants control. Individual sensible heat removal units which
will exist in each module to maintain the correct dry bulb temperature
are not evaluated in this study.
The primary air ventilation system configured for the modular space station
provides the greatest flexibility with the lowest weight, volume and power
penalties. Each module has its own thermal conditioning unit to provide
selectable sensible cooling for crew members in the area. The coolant
loop and heat rejecting capability of' each thermal conditioning unit is
contained in the module it serves. This reduces transport ducting between
modules and its associated penalties.
The design chosen is one where a constant volume of reconditioned primary
air is available for CO2
' humidity and trace contaminant control. This
minimizes the atmosphere reconditioning assembly (ARA) size and enables
one efficient unit to serve the entire modular space station, including
emergency control of the General Purpose Laboratory (GPL). The GPL
has its own ARA for normal conditions, which is also sized and configured
to serve the entire modular space station in a backup mode.
II-l
Transport ducting has been arranged in a series configuration rather
than in a parallel configuration since the increased series ducting
causes less penalty than the increased ARA size and air flow required
for the parallel arrangement.
Recommendations for future investigations resulting from this study would
encompass a more indepth analysis and evaluation of possible ventilation
systems and their impact on the overall space station design. Specific
recommendations include the following:
o
o
Investigate possible ventilation distributions within each
module by analytical and test techniques.
Develop an analytical model to perform detailed trade-off
studies at off-design conditions which include the indivi
dual thermal conditioning units.
11-2

Section 2.0
DESIGN REQUIREMENTS
The study was made on a l4-foot diameter modular space station con
figuration. Atmosphere conditioning for control of CO2 , humidity, and
trace contaminants is accomplished using the central Atmosphere
Reconditioning Assembly (ARA) located in a crew module. As a backup,
the ARA located in the General Purpose Laboratory (OPL) can serve as
the central reconditioner of the atmosphere in event of failure of
the primary unit. All sensible cooling is accomplished in a separate
unit within each module.
Table 2.1 shows the design requirements which were the basis of the
performance and trade-off studies. Table 2.2 indicates additional off
design conditions which have been utilized in calCUlating performance
and trade-off results.
11-3

TABLE 2.1 MODULAR SPACE STATION DESIGN REQUIREMENTS
Oxygen partial pressure
Total pressure
CO2 partial pressure
CO2
generation rate, peak/average
02 use rate, average
Trace contaminants
Free moisture in atmosphere
Particulate filtration level
Atmosphere heat load
Metabolic levels
Atmosphere temperature
Dewpoint temperature
Mean radiant wall temperature
Velocity in occupied regions
Design latent load
Crew
Crew equipment
Experiments
11-4
21.4 kN/m2 (3.1 psia)
101 kN/m2 (14.7 psia)
Normal - 0.4kN /m2 (3 JlDJ1 Hg) or less
Emergency - 1.0 kN/m2 (7.6 mm Hg)
maximum for 7 days
0.354/0.260 kg/hr (0.78/0.575 lb/hr)
(6 men)
0.218 kg/hr (0.48 Ib/hr) (6 men)
Same as Phase B SS Study
None allowed
Class 100,000 clean room
Crew metabolic +20% of net electrical
power output
Normal - 136 watts (465 Btu/hr) for
24 hr.
Design - 2 men at 235 watts (800 Btu/hr)
4 men at 161 watts (550 Btu/hr)
18.4 to 23.9°C (65 to 85°F) selectable
7.2 to 15.6°c (45 to .600 F) with
transients to 4.5°C (40°F) allowable
18.4 to 23.9°C (65 to 85°F)
0.1 to 0.25 m/sec (20 to 50 ft/min)
640 watts (2180 Btu/hr)
385 watts (1313 Btu/hr)
306 watts (1042 Btu/hr)
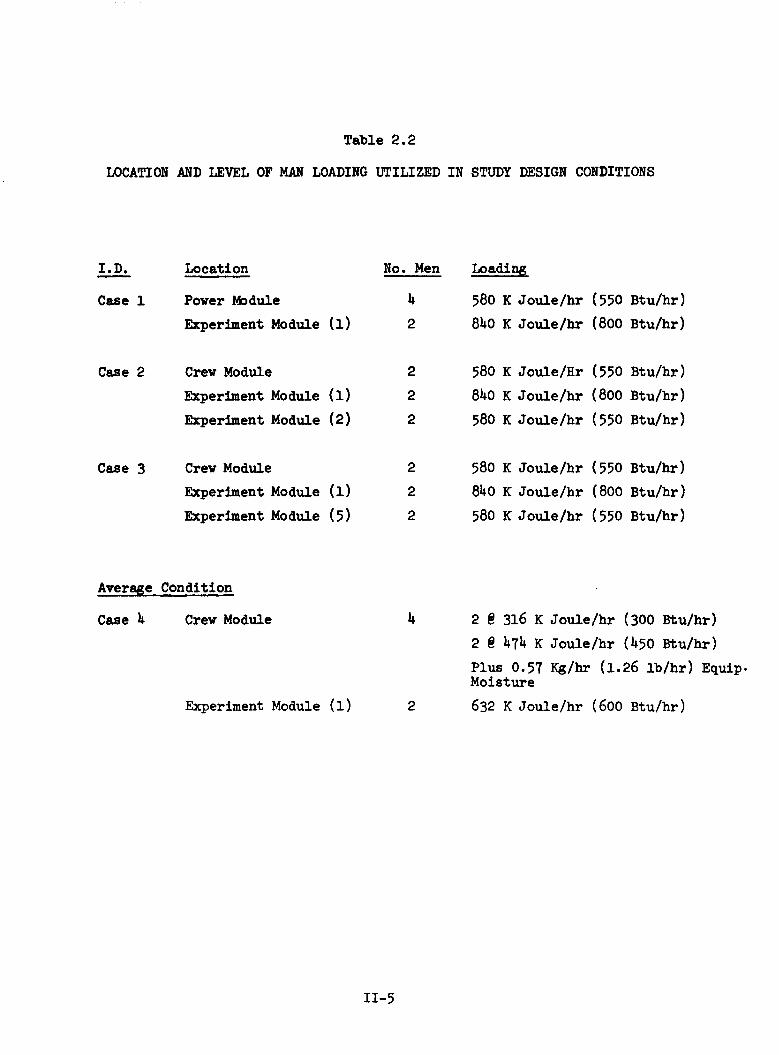
Table 2.2
LOCATION AND LEVEL OF MAN LOADING UTILIZED IN STUDY DESIGN CONDITIONS
I.D. Location No. Men Loading
Case 1 Power M::>dule 4 580 K Joule/hr (550 Btu/hr)
Experiment Module (1) 2 840 K Joule/hr (800 Btu/hr)
Case 2 Crew Module 2 580 K Joule/Hr (550 Btu/hr)
Experiment Module (1) 2 840 K Joule/hr (800 Btu/hr)
Experiment Module (2) 2 580 K Joule/hr (550 Btu/hr)
Case 3 Crew Module 2 580 K Joule/hr (550 Btu/hr)
Experiment Module (1) 2 840 K Joule/hr (800 Btu/hr)
Experiment Module (5) 2 580 K Joule/hr (550 Btu/hr)
Average Condition
Case 4 Crew Module
Experiment Module (1)
II-5
4
2
2 @316 K Joule/hr (300 Btu/hr)
2 @474 K Jou1e/hr (450 Btu/hr)
Plus 0.57 Kg/hr (1.26 1b/hr) EquipMoisture
632 K Jou1e/hr (600 Btu/hr)

SECTION 3.0
SYSTEM DESIGN, ANALYSIS AND TRADEOFF
This section deals with the ventilation system component design and fUnction.
In addition, module CO2 levels, dew point levels and transport duct trade-off
results are given.
§Zstem Design
Primary components of the ventilation system are the Atmosphere Reconditioning
Assembly, air temperature control assemblies, associated ducts and module
diverter valves.
Atmosphere Reconditioning Assembly (ARA)
The atmosphere reconditioning assembly (ARA) basically performs three fUnctions.
These functions are: 1) humidity control, 2) CO2 removal and 3) trace con
taminant control.
Atmosphere humidity is controlled by two assemblies located in the Crew/Module
and the GPL Module. The unit located in the Crew/Operations Module dehumidifies
air in the Crew/Operations Module, Power/Subsystems Module and any attached
modules. Under normal operation the GPL unit dehumidifies air only in the GPL
Module.
Process gas for humidity control is drawn into the condenser and cooled to 10°C
(50°F) by the cold circulating water on the liquid side of the condenser.
This temperature is below the cabin dew point. Excess moisture is condensed
from the process air, separated from the air stream by a face type wick separator
and pumped to the water management assembly group for processing.
11-6

The humidity control assembly is designed to remove 1,330 watts (4,535 Btu/hr)
of primarily latent load. This is comparable to the design point for the
Space Station Prototype Program. Allowances are included for the crew at high
metabolic loads in a warm 24°c (75°F) cabin, crew equipment such as showers
and washers at 386 watts (1,313 Btu/hr) and 306 watts (1,042 Btu/hr) from
experiments •
CO2 removal is accomplished in the ARA by a molecular sieve. One ARA with a
molecular sieve is located in the Crew/Operations Module and one is located
in the GPL Module. Each is capable of removing 0.354 kg/hr (0.78 lb/hr) of
CO2 which corresponds to 2 men at 235 watts (800 Btu/hr) and 4 men at 160 watts
(550 Btu/hr). The units are completely independent from one another; each
unit is serviced by different process heat and coolant water loops. This
arrangement reduces the possiblity of losing both CO2 removal assemblies at one
time.
Atmosphere laden with CO2 is drawn from downstream of the humidity control
assembly by the process flow fan and passed through a liquid-cooled, adsorbing
desiccant bed where the stream is dried to a dewpoint of approximately -65°C
(-85°F). The air continues through a liquid-cooled, adsorbing molecular sieve
canister, where CO2 is removed by adsorption on zeolite. Effluent air returns
to the cabin through the desorbing desiccant canister where desorption of
the contained water rehumidifies the air and regenerates the desiccant bed.
Control of the CO2 removal unit is under direction of a demand control. It
senses the partial pressure of CO2 in each module through sensors located in
the ARA. After the molecular sieve timed cycle is completed, the process is
repeated. An overboard dum}? line is provided to desorb the molecular sieve
canister to space if desired. Electrical heaters are provided in both the
silica gel and molecular sieve beds because periodic bakeout may be required.
1I-7

A dew point sensor provides infonnation as to the smount of water vapor
in the gas stream during startup of the CO2 concentrator atter long-tenn
shutdown. When the gas stream is adequately dry, the bypass valve is
closed and the flow is directed through a molecular sieve bed for CO2removal.
Trace contaminants are controlled by the trace contsminants and odor
control portion of each ARA. Process gas from the condenser outlet is
passed through the nonregenerable charcoal cannister where heavy molecular
weight contaminants, such as hy'drocarbons, are removed. The fan provides
the high flow [(2.54 m3/min (90 cfm)] for the charcoal canister and a lower
flow [0.156 m3/min (5.5 cfm)] for the catalytic oxidizer. Carbon dioxide,
hy'drogen, and methane are oxidized in the catalytic oxidizer to produce
water and other products which can be removed by other EC/Ifj equipllent.
The trace contaminant canister contains copper sulfate beads to remove
ammonia and lithium carbonate sorbent to remove acid gasses in addition
to nonregenerable charcoal. Removal of these products prevents poisoning
of the catalyst bed. An on-off heater control maintains catalytic bed
temperature at the design temperature of 371°C (700°F).
Air Temperature Control Assemblies (ATCA)
A separate ATCA is provided in each module which removes the sensible
heat load and maintains the selectable temperature at 18.4 to 29.4°c
(65 to 85°F). Cabin air is passed through a liquid-to-air heat exchanger
where the air is cooled by the circulating cooling water. The cabin tem
perature is controlled by the temperature control valve which bypasses
cooling water based on a signal fran the electronic temperature selector
and control. Input to the controller originates from the temperature
sensors located in the process gas duct.
A minimum circulating water temperature of 14.50 C (58°F) is provided at
the cabin heat exchanger inlet to avoid inadvertent moisture condensation
II-8

in the process gas. The temperature control valve bypasses sufficient
warm circulating water through the regenerative heat exchanger to
maintain the condenser surface temperature above l5.5°C (60°F).
The air temperature control assemblies have sufficient cooling capacity
to remove crew thermal loads, EC /If3 calculated sensible loads, and
equipment sensible loads.
Electrical loads are liquid cooled in all possible locations since liquid
cooling represents a smaller penalty than air cooling. It is estimated
that 80% of all electrical heat loads other than EC/IJ3 loads can be
removed by liquid cooling.
Special ventilation is required in the crew quarters because no atmosphere
mixing can occur with the doors closed. The crew quarters located in the
crew module will require high ventilation flow but low conditioning flow
since the heat load is small. The crew quarters temperature will be no
higher then the average deck temperature since the crew will be at a low
metabolic rate in that area. Crew quarters temperature mq approach the
minimum supply air temperature of l5.5°C (60°F) due to long periods at low
heat loads. Supply air therefore cannot be directly added to the crew
quarters. To maintain the proper crew quarters temperature, air is drawn from
the main deck area with a fen and distributed to the crew quarters by ducting
end diffusers. Each unit supplies 14.1 m3/min (500 cfm) to three crew
quarters, which is sufficient flow to provide normal crew cooling with a
108°c (2°F) temperature rise in the gas stream. This now rate is also
sufficient to prevent appreciable buildup of crew metabolic products in the
crew quarters. The reconditioned atmosphere tran the ARA is expelled into
the main distribution system which distributes the air throughout the Space
Station. The air returns are located in the hygiene and galley areas so that
the air movement towards those areas will prevent odors from escaping to
the remainder of the station.
1I-9

System Analysis
Calculations were made to determine CO2 level and dew point in each module
at various manned loading levels. A series flow arrangement shown in
Figure 3.1 for purified air :frail the Crew/Operations Module AHA is ot par
ticular significance. Values shown tor dew point temperature and CO2partial pressure represent design point conditions for humidity control
and CO2 removal. The design point condition taken from Table 1.1 for
atmosphere distribution is based on 2 crewmen located in an attached
module working at 234 watts (800 Btu/hr). Equipnent humidity loads assumed
in the attached module are 360 watts (1,042 Btu/hr) and in the Crew Opera
tions Module are 386 watts (1,3l3 Btu/hr). Purified air is delivered to
the modules in a series arrangement. This approach, as will be shown
later, was tound to minimize the total air which must be processed and
delivered. It also minimizes the required capacity of atmosphere purifi
cation equipnent because the series arrangement results in a higher con
centration of H20 vapor and CO2 entering the atmosphere purification
equipnent.
The design point for atmosphere distribution assumes two men at high metabolic
load in an attached module, however, a greater number of crewmen can be
accanmodated in one attached module if they are working at lower levels.
Sufficient tlow to the Power/Subsystems Module and the attached modules
exists so that the entire crew can be in those areas working at their average
metabolic rates without exceeding design atmosphere conditions. The values
given assume steady-state conditions. However, it would take time for CO2and water vapor to build up to the maximum allowable level under higher
crew and equipment loads.
Additional cases have been calculated using off-design conditions shown in
Table 2-1. Figures3.l thru 3.5 show results of these calculations when a
series flow arrangement is utilized. Figures 3.6 thru 3.10 show the same
conditions when a parallel flow arrangement is utilized. It can be noted
11-10

1LB
/HR
H 202
MEN
AT80
0BT
U/H
R
4M
EN8
550
BTU
/HR
1.16
1LB
/HR
H 20
T=
60°F
DP PCO
=2
2.68
MMHG
"I
T=
50°F
DP PC0 2
=2.
68MM
HG
T DP=
60°F
PC0 2
=2.
96MM
HG
~-..I
ATM
OSPH
ERE
~RE
CON
DIT
ION
ING
284
CFM
GPL
CREW
ATM
OSPH
ERE
RECO
ND
ITIO
NIN
G
CON
DIT
ION
S
MAX
HUM
IDIT
Y-
60°F
T DP
MAX
PC0 2
-3
MMHG
75°F
CABI
N
t
.---
/Pco
•2.
49t.
.~_
_·.
..L
--l-
--{V
i
2I
POW
ERI
H H I .... ....
FIG
URE
3.1
SER
IES
FLOW
DES
IGN
CON
DIT
ION
S

1LB
/HR
H 202
MEN
@80
0BT
U/H
R
°T
DP=
50F
P CO=
2.68
MMHG
2
T=
60°F
DPAT
MOS
PHER
E~
of--~
P CO=
2.96
MMHG
RECO
ND
ITIO
NIN
G2
284
CFM
CREW
ATM
OSPH
ERE
RECO
ND
ITIO
NIN
G
136
CFM
TYP
4M
EN@
550
BTU/
HR1.
161
LB/H
RH 20
POW
ER20
4CF
M
P CO=
2.91
MMHG
2T
DP=
54.5
°F
T DP=
63.1
o F
P CO=
3.16
MMHG
2
H H I ..... I\)
FIG
URE
3.2
SER
IES
FLOW
CASE
1CO
ND
ITIO
NS

ATM
OSPH
ERE
RECO
ND
ITIO
NIN
G28
4CF
M
oT DP
=50
F
P=
2.68
MMHG
CO2
2M
EN@
550
BTU
/HR
1.1
61
LB/H
RH 20
-..
t
CREW
ATM
OSPH
ERE
RECO
ND
ITIO
NIN
G
POW
ER
+t
1LB
/HR
H20
2M
EN@
80
0B
TU/H
R
13
6CF
MTY
P
P CO=
2.49
MMHG
2o
T DP=
50F
L..-q
t-_
-,--_
-,-
H H I .... W
FIG
URE
3.3
SER
IES
FLOW
CASE
2CO
ND
ITIO
NS

1LB
/HR
H20
2M
EN@
80
0B
TU
/HR
2M
EN@
550
BT
U/H
R
H H I .... ~
-6
°T DP
-0
F
P CO=
2.68
MMHG
2
2M
EN@
550
BT
U/H
R1
.16
1LB
/HR
H20
CREW
ATM
OSPH
ERE
RECO
ND
ITIO
NIN
G
13
6CF
MTY
P
FIG
URE
3.4
SER
IES
FLOW
CASE
3CO
ND
ITIO
NS
°T DP
=59
F
P CO=
2.78
2M
MHG
+-~
A~OSPHERE
~RE
CON
DIT
ION
ING
284
CFM
T DP=
60°F
P CO=
2.96
MMHG
2
T=
50°F
DPP CO
=2
.68
MMHG
2

1LB
/HR
H 202
MEN
@60
0BT
U/H
R
°T DP
=50
F
P CO=
2.68
MMHG
2
T DP=
60°F
P CO=
2.68
MMHG
2
+--
t:.o
IAT
MOS
PHER
E~
RECO
ND
ITIO
NIN
G28
4CF
M
2M
EN@
300
BTU/
HR2
MEN
@45
0BT
U/HR
POW
ER
T DP=
58°F
P CO=
2.69
MMHG
2
H H I ~ \J1
FIG
URE
3.5
SER
IES
FLOW
CASE
4AV
ERAG
ECO
ND
ITIO
NS

-6
0T
DP-
0F
P CO=
2.96
MMHG
2
_0
TDP
-50
F
P CO=
2.68
MMHG
2
+--
a-I
ATM
OSPH
ERE
RECO
ND
ITIO
NIN
G
284
CFM
CREW
4M
EN@
550
BTU
/HR
1.16
1LB
/HR
H 20
ATM
OSPH
ERE
RECO
NDIT
IONI
NG
1LB
/HR
H 2O2
MEN
@80
0BT
U/HR
0
~
"+,
+T DP
=68
F
P CO=
3.16
2MM
HG
POW
ER
----
P CO=
2.85
MMHG
2
T DP
=57
°FH H I ..... 0\
FIG
URE
3.6
PARA
LLEL
FLOW
DES
IGN
CON
DIT
ION
S

1LB
/HR
H2
02
MEN
@80
0BT
U/H
R
I , oT DP
=50
F
P CO=
2.68
MMHG
2
-i-~
ATM
OSPH
ERE
RECO
ND
ITIO
NIN
G
t,
ATM
OSPH
ERE
RECO
ND
ITIO
NIN
G
80C
FM
204
CFM
4M
EN@
550
BTU
/HR
1.1
61
LB/H
RH
20
-6
0T DP
-7
F
P CO=
3.3
MMHG
2
H H I ......
o-:j
FIG
URE
3.7
PARA
LLEL
FLOW
CASE
1CO
ND
ITIO
NS

°T
DP=
50F
P CO=
2.68
MMHG
2
284
cm
-I!-
-ta
-IAT
MOS
PHER
E2
MEN
@55
0BT
U/H
R--
..RE
CON
DIT
ION
ING
1.1
61
LB/H
RH 20
T DP=
60°F
P CO=
2.96
MMHG
2CR
EW
GPL
ATM
OSPH
ERE
RECO
ND
ITIO
NIN
G
t
2ME
N@
550
BTU
/HR
---,
.---
..°
T DP=
60.8
FP CO
=3.
152
MM
HG
POW
ER
1LB
/HR
H 202
MEN
@80
0BT
U/H
R
T DP=
66°F
PCO
=3.
22MM
HG2
H H I ..... ():)
FIG
URE
3.8
PARA
LLEL
FLOW
CASE
2CO
ND
ITIO
NS

1LB
/HR
H 202
MEN
@80
0BT
U/H
R2
MEN
@55
0BT
U/H
R T DP=
61.6
°F
P CO=
3.14
2M
MHG
++
_°
TDP
-50
F
P CO=
2.68
MMHG
2
-6
°T DP
-0
F
PCO
=2.
96M
MHG
2
284
CFM
-..4!-~
ATM
OSPH
ERE
RECO
ND
ITIO
NIN
G2
MEN
@55
0BT
U/H
R1.
161
LB/H
RH
20
t
CREW
ATM
OSPH
ERE
RECO
ND
ITIO
NIN
G
80CF
MPO
WER
P CO=
2.85
MMKG
2
°T DP
=57
F
TDP
=65
°F
P CO=
2.96
MMHG
2
H H I I-'
\0
FIG
URE
3.9
PARA
LLEL
FLOW
CASE
3CO
ND
ITIO
NS

1LB
/HR
H20
2M
EN@
600
BTU
/HR
++ °
TDP
=50
F
P CO=
2.68
MMHG
2
T DP=
60°F
P CO=
2.9
6MM
HG2
284
CFM
Q/
ATM
OSPH
ERE
2M
EN~
300
BTU
HR~~~
RECO
ND
ITIO
NIN
G2
MEN
@45
0BT
U/H
R
t
CREW
ATM
OSPH
ERE
RECO
ND
ITIO
NIN
G
POW
ER
T DP=
64°F
P CO=
2.92
MMHG
2
H H I I\) o
FIG
URE
3.1
0PA
RALL
ELFL
OWCA
SE4
CON
DIT
ION
S

that in several cases the CO2 level climbs above the design level of
0.4 kB/m2 (3.0 mm Hg). In order to maintain the design level, an
increased atmospheric flow rate is required. Table 3.1 indicates the
flow rate required for each module in order to maintain a CO2 partial
pressure of 0.4 'kN/m2 (3.0 mm Hg) or below.
As stated previously no increase in mass flow fran the ARA will be required
if a series arrangement is utilized. The higher than design flow required2in some modules to maintain a 0.4 ltN/m (3.0 mm Hg) CO2 level and l4.5°C
(58°F) dew point can be met by drawing a larger quantity of air from the
series duct serving the experiment modules. Table 3-1 for example shows
that 8.46 x 10⁻² m3/sec (180 e~) would be required in experiment module 1
if the conditions in case 1 were to occur. This increase from the 6.4 x
10-2 m3/sec (136 cf'm) design could easily be met from the available 9.6 x
10-2 m3/sec (204 c~) being handled in the series duct. The parallel
arrangement, however, will require an increase in primary air from the AHA
if the off-design conditions are to be satisfied and not exceed 0.4 KN/m2
(3.0 mm Hg) and l4.5°C (58°F) dew point. Table 3-1 indicates that 18.6 m3/sec
(396 cf'm) of primary air would be required to satisty case 2. To supply this
larger flow would create additional weight, volume, and power penalties for
the ARA.
Trade-off Results
A trade-off analysis was made between the series and parallel arrangement
to determine overall penalties for each. Calculations for the parallel
arrangements show that an increased mass flow is required from the ARA.
Transport duct requirements, however, are reduced from. that needed with
the series arrangement. Results of the analysis for both arrangements are
shown in Table 3.2. Initial ARA weight, volume end power requirements have
been taken from Reference 1 for the series arrangement. Transport duct weight
and volume have been calculated. All values given for both the series and
parallel arrangement were calculated based on meeting the off-design condi
tions listed in Table 2.1. Penalties were assigned and the results indicate
that the series arrangement has approximately a 26% lower dollar valuation
than the parallel arrangements.
1I-2l

H H I l\)
l\)
Ta
ble
3.1
PR
IMA
RY
AIR
FLO
WR
EQ
UIR
ED
FOR
MA
INT
AIN
ING
P<:
0.4
kN/m
2(3
.0m
mH
g)&
TD~
<:1
5.6
°c(6
00
F)
co2
r
CAS
EI.
D.
SE
RIE
SAR
RAN
GEM
ENT
PA
RA
LLE
LAR
RAN
GEM
ENT
POW
ERE
XP
.M
OD
.E
XP
.MO
D.
CREW
POW
ERE
XP
.M
OD
.E
XP
.MO
D.
CREW
MO
DU
LE1
(OTH
ER
)M
OD
ULE
MO
DU
LE1
(OTH
ER
)M
OD
ULE
DE
SIG
N6
-26
.4x1
0-2
-26
-26
.4xlO
-2-2
9.
x10
13
.35x
109
.x1
01
3.3
5x1
0
m3 /s
ec
m3/s
ec
m3/s
ec
m3 /s
ec
m3 /s
ec
m3/s
ec
204
cfm
13
6cf
m2
84
cfm
204
cfm
18
0cf
m2
84
cfm
6-2
4-2
6-2
-24
-21
3.3
5xlO
-2C
ASE
9.
x10
6.
x10
13
.35
x1
13
.35
x10
12
.2x1
0
1m
3 /se
cm
3/s
ec
m3
/se
cm
3/s
ec
m3/s
ec
m3/s
ec
204
cfm
18
0cf
m28
4c:
tm28
4e:
tm2
60
c:tm
284
efD
l
6-2
4-2
6.4
x1
0-2
-26
-26
.4x1
0-2
7.7
6x1
0-2
18
.6x1
0-2
CAS
E9
.x1
06
.x1
01
3.3
5x10
18
.iX
10
2m
3/s
ee
m3
/se
em
3/s
ee
m3 /s
ec
Jfl3
/ se
cm
3/s
ee
m3 /s
ee
m3/s
ec
204
efm
13
6ef
m1
36
cfm
284
e:tm
396
e:tm
18
0e:
tm1
65
efm
396
efln
CAS
E6
-26
.4x1
0-2
6.4
x1
0-2
-26
-28
-26
-2-2
9.
x10
13
.35x
109
.x1
01
0.
5x1
07
.7x1
01
3.3
5x1
0
3m
3/s
ee
m3/s
ee
m3/s
ee
m3 /s
ee
m3/s
ee
m3 /s
ee
m3/s
ee
m3/s
ee
204
efm
13
6ef
m1
36
cfm
284
efln
204
efm
13
6e
fm1
65
efm
284
efm
(AV
ER
AG
E)
CAS
E6
-26
.4x1
0-2
-26
-26
.4x1
0-2
13
.35
xlO
-29
.x1
01
3.3
5x10
9.
x10
4m
3/s
ee
m3/s
ee
m3
/se
cm
3/s
ec
m3 /s
ee
m3/s
ee
204
efm
13
6cf
m28
4c:
tm20
4e
fm1
36
efm
28
4e
fm
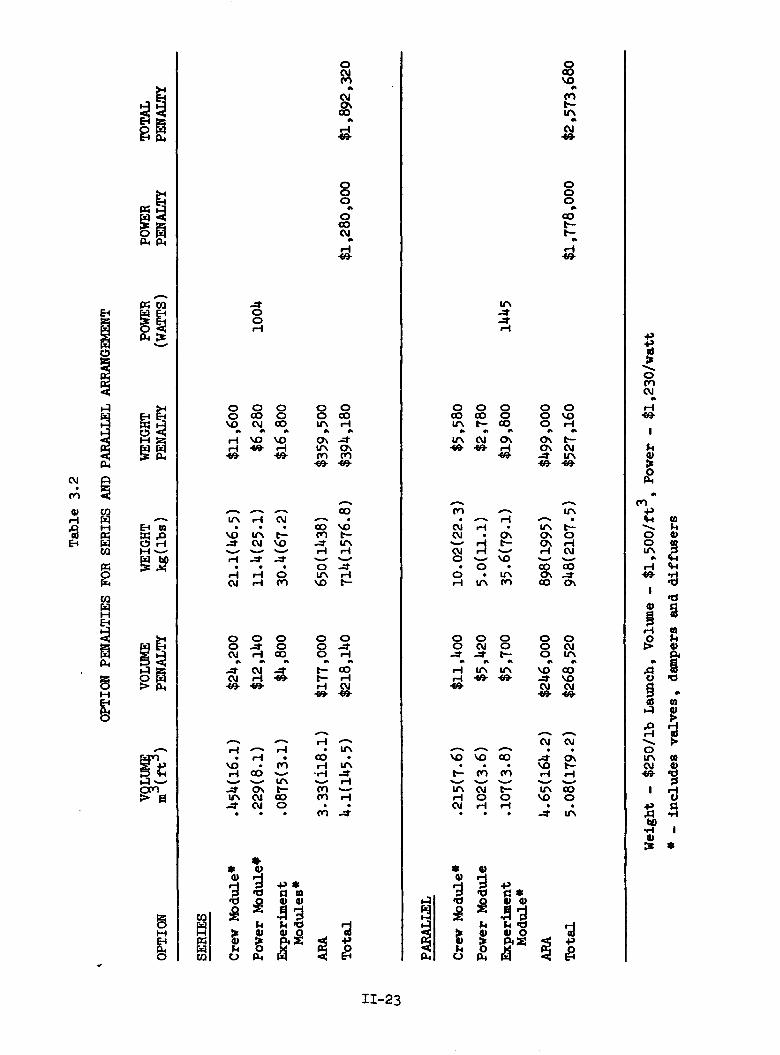
Tab
le3
.2
OPTI
ONPE
NA
LTIE
SFO
RSE
RIE
SAN
DPA
RALL
ELAR
RANG
EMEN
T
~~(~)
VOLU
ME
WEI
GHT
WEI
GHT
POW
ERPO
WER
TOTA
LOP
TION
PENA
LTY
kg
(lb
s)PE
NALT
Y(W
ATTS
)PE
NALT
YPE
NALT
Y
SER
IES
Cre
wlO
Odu
le-
.454
(16.
1)$2
4,20
021
.1(4
6.5)
$11,
600
Pow
erM
odul
e".2
29(8
.1)
$12,
140
11.4
(25.
1)$6
,280
1004
Exp
erim
ent
.087
5(3.
1)$4
,800
30.4
(67.
2)$1
6,80
0M
odul
es-
ARA
3.3
3(i
18
.1)
$177
,000
650(
1438
)$3
59,5
00
Tot
al4.
1(14
5.5)
$218
,140
714(
1576
.8)
$394
,180
$1,2
80,0
00$1
,892
,320
H H I I\)
w
PARA
LLEL
Cre
wM
odul
e-.2
15(7
.6)
$11,
400
10.0
2(22
.3)
$5,5
80
Pow
erM
odul
e.1
02(3
.6)
$5,4
205.
0(11
.1)
$2,7
80
Exp
erim
ent
.107
(3.8
)$5
,700
35.6
(79.
1)$1
9,80
014
45M
odul
e-
AM
4.65
(164
.2)
$246
,000
898(
1995
)$4
99,0
00
Tot
al5.
08(1
79.2
)$2
68,5
2094
8(21
07.5
)$5
27,1
60$1
,778
,000
$2,5
73,6
80
Wei
ght
-$2
50/1
bL
aunc
h,V
olum
e-
$1
,50
0/t
t3,
Pow
er-
$1,2
30/w
att
--
incl
ud
esv
alv
es,
dam
pers
and
dit
f'u
sers

Section 4.0
FLIGHT DESIGN
A tlight design tor the ventUat ion system has been contigured around the
series arrangement with ducting arranged to allow tor contingency operation
in event one ARA becomes inoperative.
System Layout
Figures 4.1 thru 4.3 show the transport duct l~out tor the series
configuration in the major modules. Duct sizes are shown in addition to
damper/valves.
Contingency Operation
Contingency operation occurs when a reconditioning unit becomes inoperative
in one of the core modules. It the Crew/Operations Module unit is inopera-
tive the atmosphere distribution duet valves are opened between compartments
and the shut-ott valve is closed in the GPL distribution duct which is
nonnally used. Backtlow ot air through the Crew/Operations Module recon
ditioning unit is prevented by a check valve. The atmosphere leaving the
Power/Subsystems Module passes through the Crew/Operations Module and then to the
GPL carrying the generated water vapor and CO2 back to the GPL reconditioning
unit.
It the GPL reconditioning unit tails, the atmosphere ducting valves are
opened between the GPL and Crew/Operations Modules and a portion ot the
reconditioned air trom the Crew/Operations Module is directed to the GPL.
Backtlow is prevented through the GPL reconditioning unit by a check valve.
The flow split between the GPL and Crew/Operations Modules is adjusted with
the shut-ott valves located in the distribution ducts to correspond to the
water vapor and CO2 loads in the modules.
11-24

H H I I\)
V1
:::I
CD
AM
PER
/VA
LVE
6"S
ER
IES
RE'l'U
RND
UCT
FIG
UR
E4
.1CR
EWM
OD
ULE
PRIM
AR
YA
IRD
UCT
LAY
OU
T

H H , f\) ""
::x
=D
AM
PER
/VA
LVE
6"PR
IMA
RY
SUPP
LYD
UCT
204
CFM
FIG
UR
E4.
2PO
WER
MOD
ULE
PRIM
AR
YA
IRD
UCT
LAY
OU
T.

I. DAMPER/VALVE
5" MODULE SUPPLY DUCT
FAN/HEAT EXCHANGER
5" MODULE RETURN DUCT
FIGURE 4.3 TYPICAL EXPERIMENT MODULE DUCT LAYOUT
11-27

A diverter valve is located in the Crew/Operations Module which allows the
Power/Subsystems Module to be isolated it' unoccupied. Distribution duct
shut-off valves are closed between the Crew/Operations Module and Power/
Subsystems Module and the diverter valve is positioned so that the entire
flow fran the reconditioning unit is distributed within the Crew/Operations
Module.
II-28

References:
1. Modular Space Station Detailed Preliminary Design - Vol. II,
MDe G2582, Nov. 1971.
II-29