craigieburn restricted retail / showroom precinct demand ... · craigieburn restricted retail /...
TRANSCRIPT
Craigieburn Restricted Retail / Showroom Precinct Demand
Analysis Draft Report – 1 December 2010
Growth Areas Authority
This report has been prepared for:
This report has been prepared by:
SGS Economics and Planning Pty Ltd
ACN 007 437 729
Level 5 171 Latrobe Street
MELBOURNE VIC 3000
P: + 61 3 8616 0331
F: + 61 3 8616 0332
W: www.sgsep.com.au
Offices in Brisbane, Canberra, Hobart, Melbourne, Perth, Sydney
Table of Contents
20100536-Draft Report 1 December 2010.docx
1 Introduction......................................................................... 1
1.1 Purpose ................................................................................................................. 1
1.2 Definitions .............................................................................................................. 1
1.3 Study Area ............................................................................................................. 2
1.4 Report Structure ..................................................................................................... 3
2 Activity Centre Context ......................................................... 4
2.1 Retail Systems ........................................................................................................ 4
2.2 Activity Centre Structure........................................................................................... 5
2.3 Summary ............................................................................................................... 7
3 Demand Estimate .................................................................. 8
3.1 Catchment ............................................................................................................. 8
3.2 Population ............................................................................................................ 10
3.3 Retail Spending Per Capita ...................................................................................... 12
3.4 Total Household Goods Expenditure and Floorspace ..................................................... 12
3.5 Expenditure Capture .............................................................................................. 13
3.6 Household Goods Floorspace Estimates for Study Area ................................................. 14
3.7 Motor Vehicle Related Sales..................................................................................... 15
3.8 Summary ............................................................................................................. 17
4 Site Analysis ...................................................................... 18
4.1 Optimal Characteristics ........................................................................................... 18
4.2 Study Area Analysis ............................................................................................... 19
4.3 Summary ............................................................................................................. 22
5 Summary of Findings .......................................................... 23
Figures
Figure 1 – Study Area ....................................................................................................... 2
Figure 2 – Regional Activity Centre Structure ........................................................................ 6
Figure 3 – Catchment Area ................................................................................................ 9
Figure 4 – Population and Dwelling Estimates ..................................................................... 10
Figure 5 – Assumed Growth Pattern to 2046 ....................................................................... 11
Figure 6 - Victoria State Retail Expenditure Per Capita (2010$) .............................................. 12
Figure 7 – Household Goods Expenditure and Floorspace (2010$) .......................................... 13
Figure 8 – Study Area Expenditure Capture Scenarios .......................................................... 14
Figure 9 – Household Goods Floorspace Estimates for Study Area........................................... 15
Figure 10 – Motor Vehicle Related Sales Floorspace Estimate for Study Area ............................ 16
Figure 11 – Site Analysis Zones ........................................................................................ 19
Craigieburn Restricted Retail / Showroom Precinct Demand Analysis
20100536-Draft Report 1 December 2010.docx P. 1
1 Introduction
1.1 Purpose
The Growth Areas Authority (GAA) is in the early stages of scoping the preparation of Precinct
Structure Plans (PSPs) in Craigieburn and surrounds. As part of this process, the GAA seeks to
understand the potential for establishing a restricted retail / showroom precinct along the Hume
Highway corridor in Craigieburn to ‘kick start’ investment and development in the area. This will
require an understanding of supply and demand for the subject use in a regional context.
The purpose of the project (as noted in the project brief) is to provide advice on:
The demand for restricted retail/showroom uses within the locality, noting that there is
some bulky goods proposed within the Craigieburn Town Centre.
The suitability of the site for restricted retail in terms of access to population, frontage etc.
The extent of restricted retail/showroom uses which could be supported within this PSP.
1.2 Definitions
The focus of this study is on restricted retail and showroom uses. For the purpose of this project,
these are defined as follows.
‘Restricted Retail Premises’ in Victorian Planning Provisions (VPPs) is defined as “Land used to sell
or hire: a) automotive parts and accessories; b) camping equipment; c) electric light fittings; d)
equestrian supplies; e) floor and window coverings; f) furniture, bedding, furnishings, fabric and
manchester; g) household appliances, household electrical goods and home entertainment goods;
h) party supplies; i) swimming pools; or j) office equipment and supplies.” These uses are more
generally referred to as bulky goods retail.
A further description of the uses is provided by the Bulky Goods Retailers Association, which
defines bulky goods as “large items in terms of size, shape and weight”. The retailers generally
sell “homemaker products including furniture, electrical, furnishings, bedding, building materials,
household fixtures, and fittings ... Examples of bulky goods store brands include Freedom
Furniture, Beacon Lighting, Spotlight, Supercheap Auto, The Good Guys, Fantastic Furniture,
Barbeques Galore, Harvey Norman, Forty Winks, OZ Design Furniture and Bunnings”.
A showroom is a type of building that accommodates a number of the above-mentioned land uses.
Showrooms typically have glazed frontages to enable customers to view products on display, such
as furniture, motor vehicles and related products. Showrooms can provide a high amenity frontage
to streets if designed well.
Craigieburn Restricted Retail / Showroom Precinct Demand Analysis
20100536-Draft Report 1 December 2010.docx P. 2
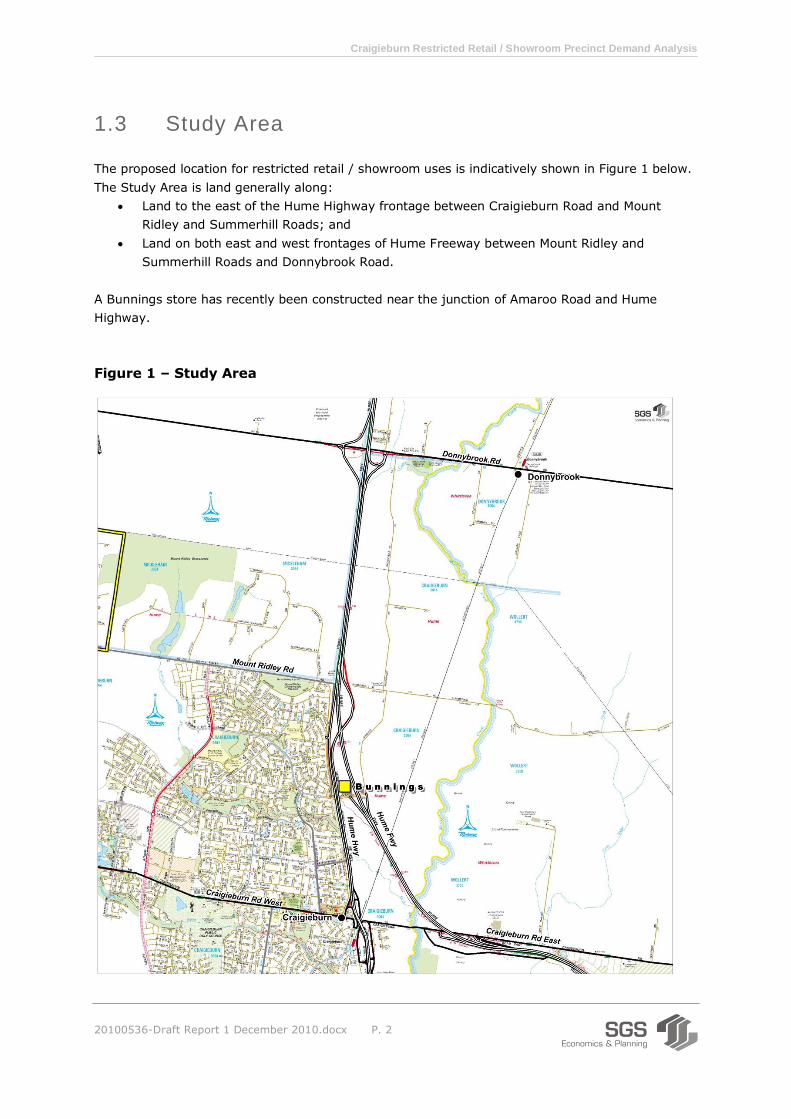
1.3 Study Area
The proposed location for restricted retail / showroom uses is indicatively shown in Figure 1 below.
The Study Area is land generally along:
Land to the east of the Hume Highway frontage between Craigieburn Road and Mount
Ridley and Summerhill Roads; and
Land on both east and west frontages of Hume Freeway between Mount Ridley and
Summerhill Roads and Donnybrook Road.
A Bunnings store has recently been constructed near the junction of Amaroo Road and Hume
Highway.
Figure 1 – Study Area
Craigieburn Restricted Retail / Showroom Precinct Demand Analysis
20100536-Draft Report 1 December 2010.docx P. 3
1.4 Report Structure
This report is structured as follows.
Section 2 provides an overview of the activity centre context within which restricted retail and
showroom planning can take place. This explores the distribution of centres and the theory behind
activity centre planning.
Section 3 provides an overall demand estimate for restricted retail and showroom uses. An
indicative catchment area is identified for the Study Area and spending and supportable floorspace
estimates are provided. A number of share or apportionment scenarios are provided for the Study
Area.
Section 4 provides a broad site analysis and provides guidance on possible land use and design
solutions for the area. The focus of the analysis is on access and exposure characteristics of the
study area.
Section 5 presents a summary of the findings of the report.

Craigieburn Restricted Retail / Showroom Precinct Demand Analysis
20100536-Draft Report 1 December 2010.docx P. 4
2 Activity Centre Context
2.1 Retail Systems
Retail Hierarchies
Retail activities are generally arranged in a hierarchy of centres. The hierarchy describes levels in
the retail network whereby there are a small number of ‘large’ centres and a larger number of
‘smaller’ centres.
Retail and other land uses agglomerate in centres within the hierarchy depending on their
catchment characteristics and their capacity to pay rent. A catchment is an area from which a
shop or centre draws its regular customers.
Centres in the retail hierarchy are generally ‘anchored’ by a major retail business or group of major
businesses. A retail anchor has significant customer drawing power (or retail gravity) upon which
regular trips are generated. Specialty stores and other businesses and services are able to locate
near retail anchors to attract customers. On that basis, the typical retail hierarchy is defined by
the retail anchor businesses, upon which other smaller businesses agglomerate.
The lowest level of the hierarchy is a cluster of local shops that offer convenience retail and related
services. The next level up is a supermarket based neighbourhood centre, which would generally
offer daily and weekly convenience shopping services. From that level, sub-regional and regional
centres define the network.
Bulky Goods
Bulky goods stores consume large floorplates and sites and generally achieve a lower turnover per
unit area of floorspace compared with core retail services. The trend has been for modern bulky
goods retailers to develop cost-effective buildings at highly visible road locations on sites with
ample car parking.
Hume City Council’s Retail Strategy1 explored options for the management of bulky goods
recognising the land extensive nature of the activity and the trend to provide the use both within
designated activity centres in some situations and outside designated activity centres in other
situations (usually along main roads).
That strategy recommended that a hierarchy for bulky goods retailing be developed that addresses
different typologies in different ways, as follows:
1. Large-scale and low density bulky goods - A number of regional-scale specialised bulky
goods centres are established to service regional catchments, similar to the function of the
Nunawading homemaker cluster in eastern Melbourne;
1 SGS Economics and Planning for Hume City Council, Hume City Retail Strategy, Final Report - 18 September 2009 (Version 2).
Craigieburn Restricted Retail / Showroom Precinct Demand Analysis
20100536-Draft Report 1 December 2010.docx P. 5
2. Lower-scale and / or high density bulky goods - This form of bulky goods can be
accommodated in designated activity centres in addition to the above, but only where the
activity is integrated in higher density formats; and
3. The general dispersal of bulky goods in other locations is prohibited unless it can be proven
that there is insufficient capacity in the bulky goods hierarchy.
This approach was recommended to respond to the characteristics of this business type as follows:
Bulky goods shopping is an infrequent and generally high cost shopping activity, and as
such consumers are generally prepared to travel longer distances for such items;
A significant concentration of bulky goods retailers in the one specialised centre can provide
consumers from a wider regional catchment the opportunity to visit one location for
comparison shopping;
Clustering bulky goods in a specialised centre provides the opportunity to provide
integrated road and public transport services and shared car parking solutions; and
Land in core activity centres is released for higher density and higher value land uses if
large scale and low density bulky goods is located in specialised centres. The land take of
bulky goods can be extensive and job density low, and as such the activity is often not
perfectly suited for a mixed use centre that focuses on high density urban forms including
food and convenience retailing, personal and business services, high density housing and
public transport activation.
Planning Directions
The State Government’s Retail Policy Review Discussion Paper proposes to exclude Restricted Retail
(or bulky goods) from industrial zones, meaning that land specifically zoned for the purpose would
need to be provided. The Bulky Goods Retailers Association has expressed concern at that
proposal because it has the view that insufficient land has been provided for the sector in the past,
and that implementation of such a proposal must be accompanied with a clear and appropriate land
release strategy.
2.2 Activity Centre Structure
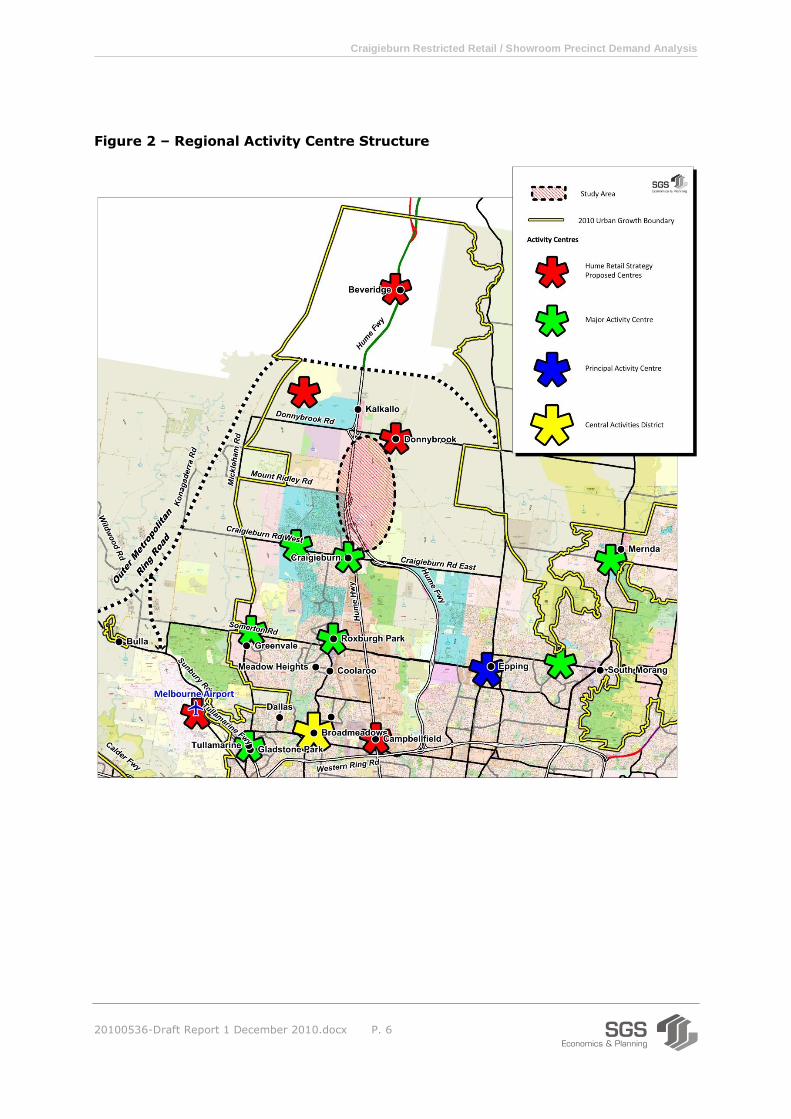
The activity centre system in the vicinity of the Study Area is summarised in Figure 2 below. This
focuses on Major Activity Centres and above.
Figure 2 shows the Study Area in context of existing activity centres and proposed activity centres
as noted in the Hume’s Retail Strategy.
Three regional-scale specialised bulky goods centres were proposed by the Hume Retail Strategy
for the Hume growth corridor, these being:
Generally near Campbellfield, along Hume Highway and Mahoneys Road (shown as a red
asterisk);
At Melbourne Airport (shown as a red asterisk); and
At a centre in the Craigieburn region at a location to be identified.
Craigieburn Restricted Retail / Showroom Precinct Demand Analysis
20100536-Draft Report 1 December 2010.docx P. 6
Figure 2 – Regional Activity Centre Structure
Craigieburn Restricted Retail / Showroom Precinct Demand Analysis
20100536-Draft Report 1 December 2010.docx P. 7
2.3 Summary
Bulky goods stores consume large floorplates and sites and as such the trend has been for modern
bulky goods retailers to develop cost-effective buildings at highly visible road locations on sites
with ample car parking.
Hume’s Retail Strategy proposes that a hierarchy for bulky goods retailing be developed as follows:
1. Large-scale and low density bulky goods - A number of regional-scale specialised bulky
goods centres are established to service regional catchments, similar to the function of the
Nunawading homemaker cluster in eastern Melbourne;
2. Lower-scale and / or high density bulky goods - This form of bulky goods can be
accommodated in designated activity centres in addition to the above, but only where the
activity is integrated in higher density formats; and
3. The general dispersal of bulky goods in other locations is prohibited unless it can be proven
that there is insufficient capacity in the bulky goods hierarchy.
The Study Area is well positioned to perform the role of a Craigieburn region specialised bulky
goods centre.
An appropriate zoning (e.g. Business 4) will need to be provided to facilitate this outcome
consistent with the State’s Retail Policy Review.

Craigieburn Restricted Retail / Showroom Precinct Demand Analysis
20100536-Draft Report 1 December 2010.docx P. 8
3 Demand Estimate
3.1 Catchment
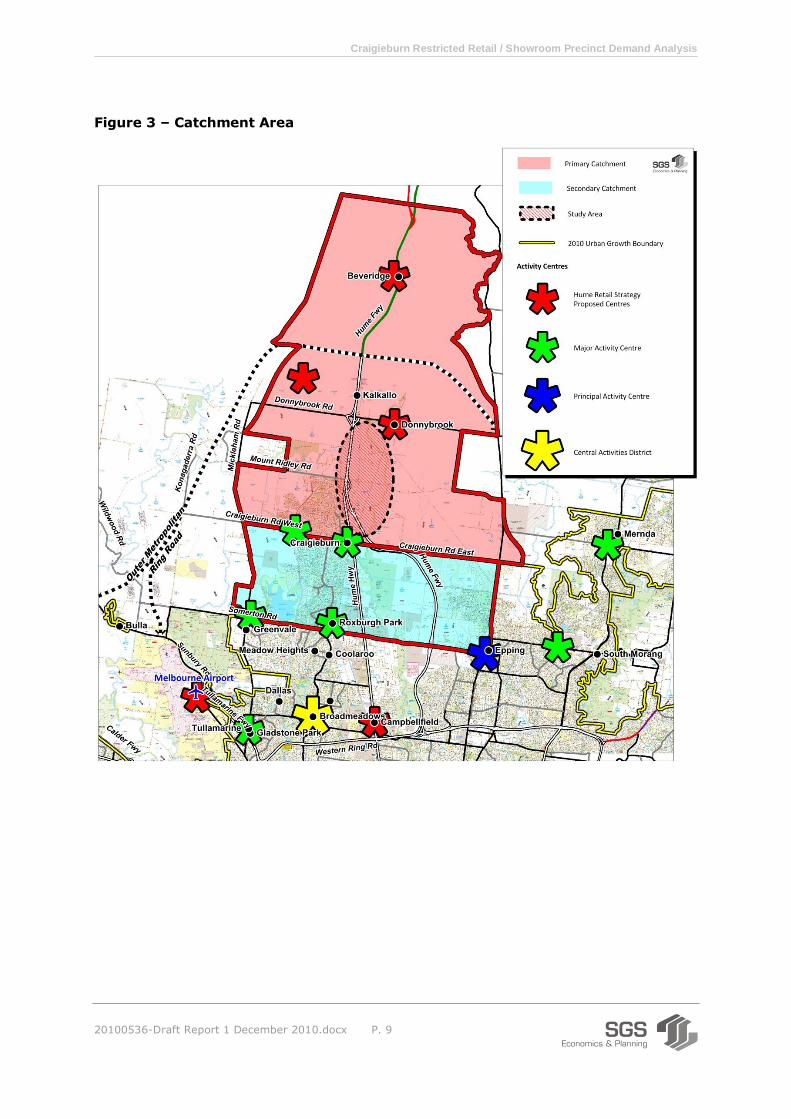
The catchment for the Study Area as a specialised and regional-scale bulky goods centre is shown
in Figure 3 below. This is assessed as a reasonable future catchment based on:
The position of the Urban Growth Boundary;
The existing and potential future network of activity centres in the region;
The existing and potential future road network in the region; and
The propensity for households that live on the urban fringe to shop in large centres that are
located towards the city centre (i.e. inbound shopping movements).
It is assessed that the Primary Trade Area of such a centre is the area generally north of
Craigieburn Road (within the Urban Growth Boundary). A Secondary Trade Area is the area
generally between Craigieburn Road and Somerton Road. In the southern part of the region, an
existing network of bulky goods activities is reasonably well established, and this network is
expected to grow in the future.
Craigieburn Restricted Retail / Showroom Precinct Demand Analysis
20100536-Draft Report 1 December 2010.docx P. 9
Figure 3 – Catchment Area
Craigieburn Restricted Retail / Showroom Precinct Demand Analysis
20100536-Draft Report 1 December 2010.docx P. 10
3.2 Population
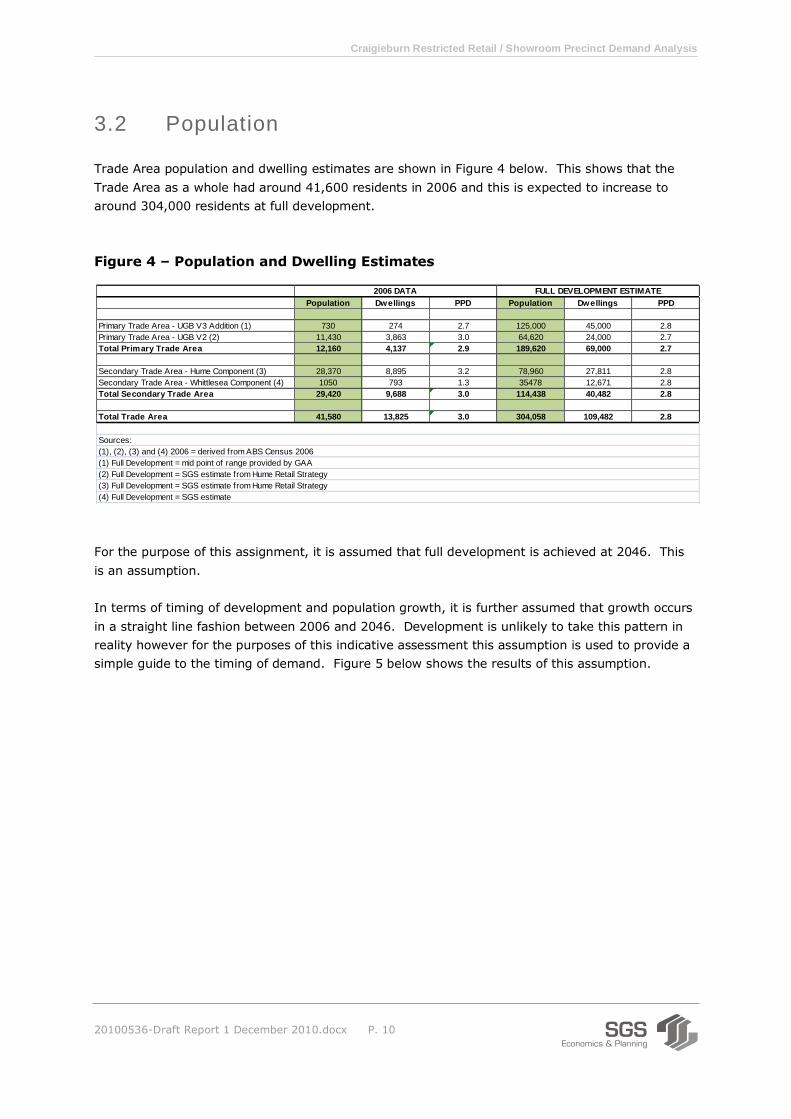
Trade Area population and dwelling estimates are shown in Figure 4 below. This shows that the
Trade Area as a whole had around 41,600 residents in 2006 and this is expected to increase to
around 304,000 residents at full development.
Figure 4 – Population and Dwelling Estimates
For the purpose of this assignment, it is assumed that full development is achieved at 2046. This
is an assumption.
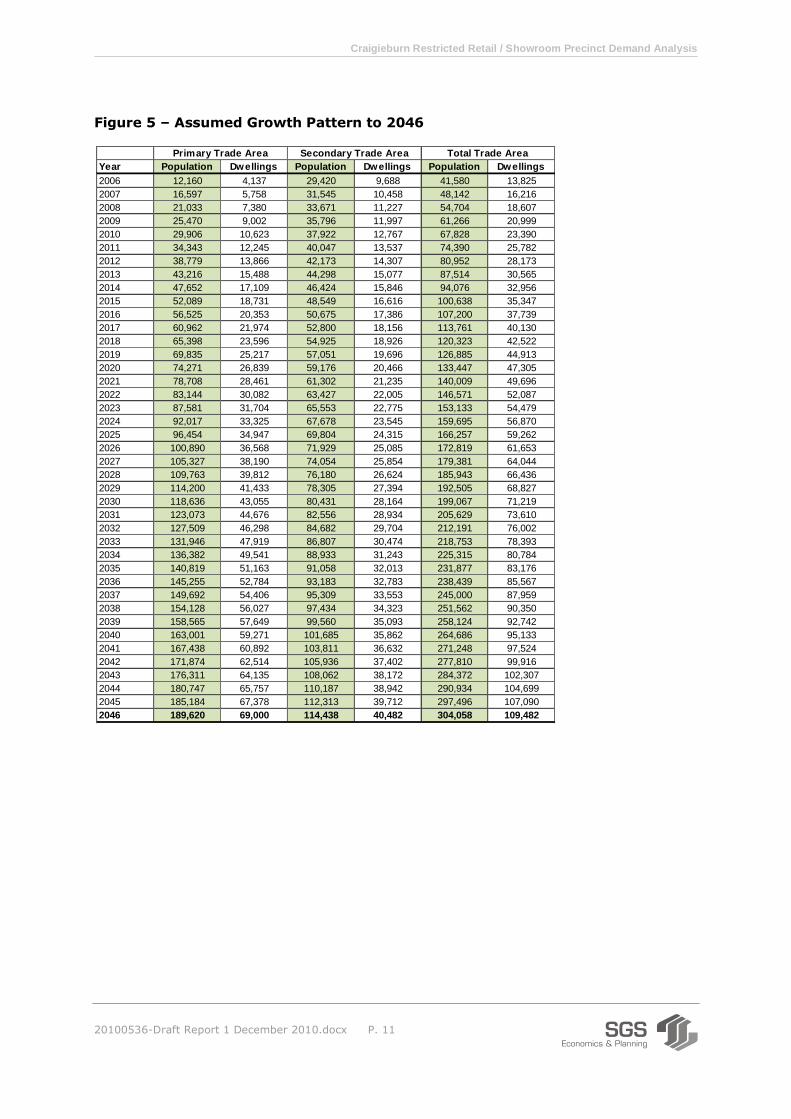
In terms of timing of development and population growth, it is further assumed that growth occurs
in a straight line fashion between 2006 and 2046. Development is unlikely to take this pattern in
reality however for the purposes of this indicative assessment this assumption is used to provide a
simple guide to the timing of demand. Figure 5 below shows the results of this assumption.
Population Dwellings PPD Population Dwellings PPD
Primary Trade Area - UGB V3 Addition (1) 730 274 2.7 125,000 45,000 2.8
Primary Trade Area - UGB V2 (2) 11,430 3,863 3.0 64,620 24,000 2.7
Total Primary Trade Area 12,160 4,137 2.9 189,620 69,000 2.7
Secondary Trade Area - Hume Component (3) 28,370 8,895 3.2 78,960 27,811 2.8
Secondary Trade Area - Whittlesea Component (4) 1050 793 1.3 35478 12,671 2.8
Total Secondary Trade Area 29,420 9,688 3.0 114,438 40,482 2.8
Total Trade Area 41,580 13,825 3.0 304,058 109,482 2.8
(1), (2), (3) and (4) 2006 = derived from ABS Census 2006
(1) Full Development = mid point of range provided by GAA
(2) Full Development = SGS estimate from Hume Retail Strategy
(3) Full Development = SGS estimate from Hume Retail Strategy
(4) Full Development = SGS estimate
FULL DEVELOPMENT ESTIMATE2006 DATA
Sources:
Craigieburn Restricted Retail / Showroom Precinct Demand Analysis
20100536-Draft Report 1 December 2010.docx P. 11
Figure 5 – Assumed Growth Pattern to 2046
Year Population Dwellings Population Dwellings Population Dwellings
2006 12,160 4,137 29,420 9,688 41,580 13,825
2007 16,597 5,758 31,545 10,458 48,142 16,216
2008 21,033 7,380 33,671 11,227 54,704 18,607
2009 25,470 9,002 35,796 11,997 61,266 20,999
2010 29,906 10,623 37,922 12,767 67,828 23,390
2011 34,343 12,245 40,047 13,537 74,390 25,782
2012 38,779 13,866 42,173 14,307 80,952 28,173
2013 43,216 15,488 44,298 15,077 87,514 30,565
2014 47,652 17,109 46,424 15,846 94,076 32,956
2015 52,089 18,731 48,549 16,616 100,638 35,347
2016 56,525 20,353 50,675 17,386 107,200 37,739
2017 60,962 21,974 52,800 18,156 113,761 40,130
2018 65,398 23,596 54,925 18,926 120,323 42,522
2019 69,835 25,217 57,051 19,696 126,885 44,913
2020 74,271 26,839 59,176 20,466 133,447 47,305
2021 78,708 28,461 61,302 21,235 140,009 49,696
2022 83,144 30,082 63,427 22,005 146,571 52,087
2023 87,581 31,704 65,553 22,775 153,133 54,479
2024 92,017 33,325 67,678 23,545 159,695 56,870
2025 96,454 34,947 69,804 24,315 166,257 59,262
2026 100,890 36,568 71,929 25,085 172,819 61,653
2027 105,327 38,190 74,054 25,854 179,381 64,044
2028 109,763 39,812 76,180 26,624 185,943 66,436
2029 114,200 41,433 78,305 27,394 192,505 68,827
2030 118,636 43,055 80,431 28,164 199,067 71,219
2031 123,073 44,676 82,556 28,934 205,629 73,610
2032 127,509 46,298 84,682 29,704 212,191 76,002
2033 131,946 47,919 86,807 30,474 218,753 78,393
2034 136,382 49,541 88,933 31,243 225,315 80,784
2035 140,819 51,163 91,058 32,013 231,877 83,176
2036 145,255 52,784 93,183 32,783 238,439 85,567
2037 149,692 54,406 95,309 33,553 245,000 87,959
2038 154,128 56,027 97,434 34,323 251,562 90,350
2039 158,565 57,649 99,560 35,093 258,124 92,742
2040 163,001 59,271 101,685 35,862 264,686 95,133
2041 167,438 60,892 103,811 36,632 271,248 97,524
2042 171,874 62,514 105,936 37,402 277,810 99,916
2043 176,311 64,135 108,062 38,172 284,372 102,307
2044 180,747 65,757 110,187 38,942 290,934 104,699
2045 185,184 67,378 112,313 39,712 297,496 107,090
2046 189,620 69,000 114,438 40,482 304,058 109,482
Primary Trade Area Secondary Trade Area Total Trade Area

Craigieburn Restricted Retail / Showroom Precinct Demand Analysis
20100536-Draft Report 1 December 2010.docx P. 12
3.3 Retail Spending Per Capita
To estimate the changing patterns of retail spending, regression analysis was performed on retail
turnover data from 1983 as published in the ABS Retail Trade publication (8501.0). This enabled
an estimate of how real growth in state expenditure per capita has changed over time and is likely
to change in the future. An overview of the projected retail expenditure per capita results is shown
in Figure 6 below.
Figure 6 - Victoria State Retail Expenditure Per Capita (2010$)
From the above list of commodity groups, ‘household goods’ approximates to restricted retailing or
bulky goods. This commodity group includes Furniture Retailing, Floor Coverings Retailing,
Electrical, Electronic and Gas Appliances, Hardware and Building Supplies Retailing, Garden
Supplies Retailing, Sport and Camping Equipment Retailing and Marine Equipment Retailing.
3.4 Total Household Goods Expenditure and Floorspace
The household goods expenditure figures shown above from 2010 to 2031 are applied to the
population estimates shown in Figure 5 to estimate total expenditure generation from the Trade
Area. It should be noted that the spending data is assumed to remain constant in real terms from
2031 due to no alternative data being available from that point. The results are shown in Figure 7
below.
This shows that Total Trade Area spending on household goods is expected to increase from around
$215.8m in 2010 to around $1,237.8m in 2046. This represents expenditure from the Trade Area
residents and not necessarily capture by Trade Area businesses.
Figure 7 also shows the level of household goods floorspace this level of expenditure will support
over time, based on a 2010 retail turnover density (RTD) of $3,404 / sqm (and inflated in line with
real expenditure inflation). This RTD is an estimate prepared by SGS for Victoria.
2010 2011 2016 2021 2026 2031+
Food $4,114 $4,251 $4,563 $4,899 $5,128 $5,367
Clothing $2,005 $2,087 $2,185 $2,287 $2,373 $2,464
Household goods $3,182 $3,246 $3,439 $3,643 $3,851 $4,071
Other retail $2,295 $2,254 $2,627 $3,061 $3,297 $3,552
Hospitality and services $1,383 $1,283 $1,304 $1,325 $1,395 $1,469
Total $12,979 $13,121 $14,118 $15,215 $16,044 $16,923
Source: SGS estimate derived from ABS Retail Trade Publication (8501.0)

Craigieburn Restricted Retail / Showroom Precinct Demand Analysis
20100536-Draft Report 1 December 2010.docx P. 13
This shows that, in 2010, the population in the Trade Area supports about 63,400 sqm of
household goods space across the retail economy. Based on the estimates shown in this report,
this figure is expected to increase to about 284,300 sqm in 2046.
Figure 7 – Household Goods Expenditure and Floorspace (2010$)
3.5 Expenditure Capture
The next question is what level of this expenditure and space can reasonable be captured in the
Study Area based on the competitive context.
For the purpose of this assignment, it is assumed that the long term capture of household goods
expenditure in region will grow to 90% (in net terms). This makes a 10% escape expenditure
allowance at full development in order to recognise the outer urban position of the area and role of
central metropolitan centres.
Year
HHG RTD
($/sqm)
HHG
Expenditure Floorspace
HHG
Expenditure Floorspace
HHG
Expenditure Floorspace
2010 $3,403 $95,160,892 27,964 $120,667,168 35,459 $215,828,060 63,423
2011 $3,471 $111,475,755 32,112 $129,993,374 37,446 $241,469,129 69,559
2012 $3,513 $127,373,503 36,261 $138,520,450 39,434 $265,893,954 75,694
2013 $3,554 $143,613,750 40,409 $147,211,612 41,421 $290,825,362 81,830
2014 $3,595 $160,196,494 44,557 $156,066,858 43,409 $316,263,352 87,966
2015 $3,637 $177,121,735 48,706 $165,086,190 45,396 $342,207,925 94,102
2016 $3,678 $194,389,475 52,854 $174,269,606 47,384 $368,659,081 100,238
2017 $3,721 $212,133,828 57,002 $183,733,266 49,371 $395,867,094 106,373
2018 $3,765 $230,240,199 61,151 $193,370,363 51,358 $423,610,562 112,509
2019 $3,809 $248,708,588 65,299 $203,180,897 53,346 $451,889,485 118,645
2020 $3,852 $267,538,996 69,448 $213,164,868 55,333 $480,703,864 124,781
2021 $3,896 $286,731,423 73,596 $223,322,275 57,321 $510,053,698 130,917
2022 $3,941 $306,352,382 77,744 $233,703,861 59,308 $540,056,244 137,052
2023 $3,985 $326,342,459 81,893 $244,262,284 61,295 $570,604,744 143,188
2024 $4,029 $346,701,653 86,041 $254,997,545 63,283 $601,699,198 149,324
2025 $4,074 $367,429,963 90,190 $265,909,643 65,270 $633,339,606 155,460
2026 $4,118 $388,527,390 94,338 $276,998,579 67,258 $665,525,969 161,596
2027 $4,166 $410,246,718 98,486 $288,442,083 69,245 $698,688,800 167,731
2028 $4,213 $432,356,457 102,635 $300,072,626 71,233 $732,429,083 173,867
2029 $4,260 $454,856,609 106,783 $311,890,209 73,220 $766,746,818 180,003
2030 $4,307 $477,747,172 110,931 $323,894,832 75,207 $801,642,004 186,139
2031 $4,354 $501,028,148 115,080 $336,086,494 77,195 $837,114,641 192,275
2032 $4,354 $519,089,139 119,228 $344,739,201 79,182 $863,828,340 198,410
2033 $4,354 $537,150,131 123,377 $353,391,908 81,170 $890,542,038 204,546
2034 $4,354 $555,211,122 127,525 $362,044,615 83,157 $917,255,737 210,682
2035 $4,354 $573,272,114 131,673 $370,697,322 85,144 $943,969,435 216,818
2036 $4,354 $591,333,105 135,822 $379,350,029 87,132 $970,683,134 222,954
2037 $4,354 $609,394,097 139,970 $388,002,735 89,119 $997,396,832 229,089
2038 $4,354 $627,455,088 144,119 $396,655,442 91,107 $1,024,110,530 235,225
2039 $4,354 $645,516,080 148,267 $405,308,149 93,094 $1,050,824,229 241,361
2040 $4,354 $663,577,071 152,415 $413,960,856 95,082 $1,077,537,927 247,497
2041 $4,354 $681,638,063 156,564 $422,613,563 97,069 $1,104,251,626 253,633
2042 $4,354 $699,699,054 160,712 $431,266,270 99,056 $1,130,965,324 259,768
2043 $4,354 $717,760,046 164,860 $439,918,977 101,044 $1,157,679,023 265,904
2044 $4,354 $735,821,037 169,009 $448,571,684 103,031 $1,184,392,721 272,040
2045 $4,354 $753,882,029 173,157 $457,224,391 105,019 $1,211,106,420 278,176
2046 $4,354 $771,943,020 177,306 $465,877,098 107,006 $1,237,820,118 284,312
Primary Trade Area Secondary Trade Area Total Trade Area
Craigieburn Restricted Retail / Showroom Precinct Demand Analysis
20100536-Draft Report 1 December 2010.docx P. 14
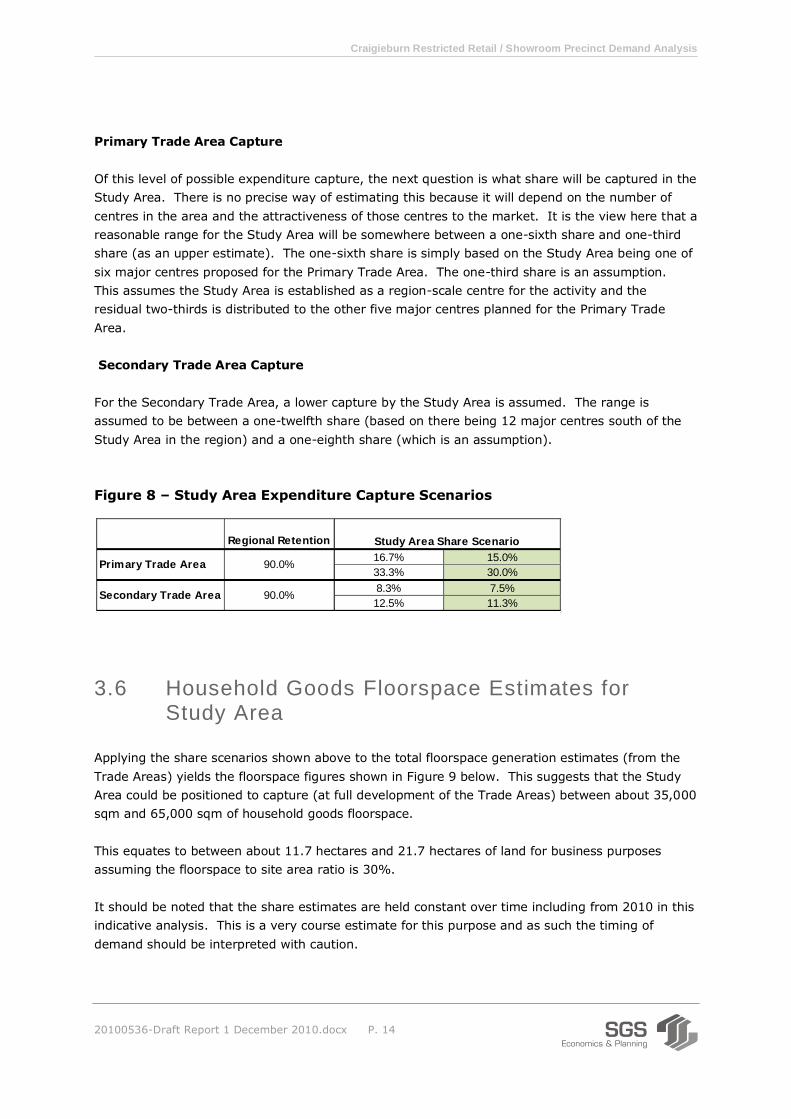
Primary Trade Area Capture
Of this level of possible expenditure capture, the next question is what share will be captured in the
Study Area. There is no precise way of estimating this because it will depend on the number of
centres in the area and the attractiveness of those centres to the market. It is the view here that a
reasonable range for the Study Area will be somewhere between a one-sixth share and one-third
share (as an upper estimate). The one-sixth share is simply based on the Study Area being one of
six major centres proposed for the Primary Trade Area. The one-third share is an assumption.
This assumes the Study Area is established as a region-scale centre for the activity and the
residual two-thirds is distributed to the other five major centres planned for the Primary Trade
Area.
Secondary Trade Area Capture
For the Secondary Trade Area, a lower capture by the Study Area is assumed. The range is
assumed to be between a one-twelfth share (based on there being 12 major centres south of the
Study Area in the region) and a one-eighth share (which is an assumption).
Figure 8 – Study Area Expenditure Capture Scenarios
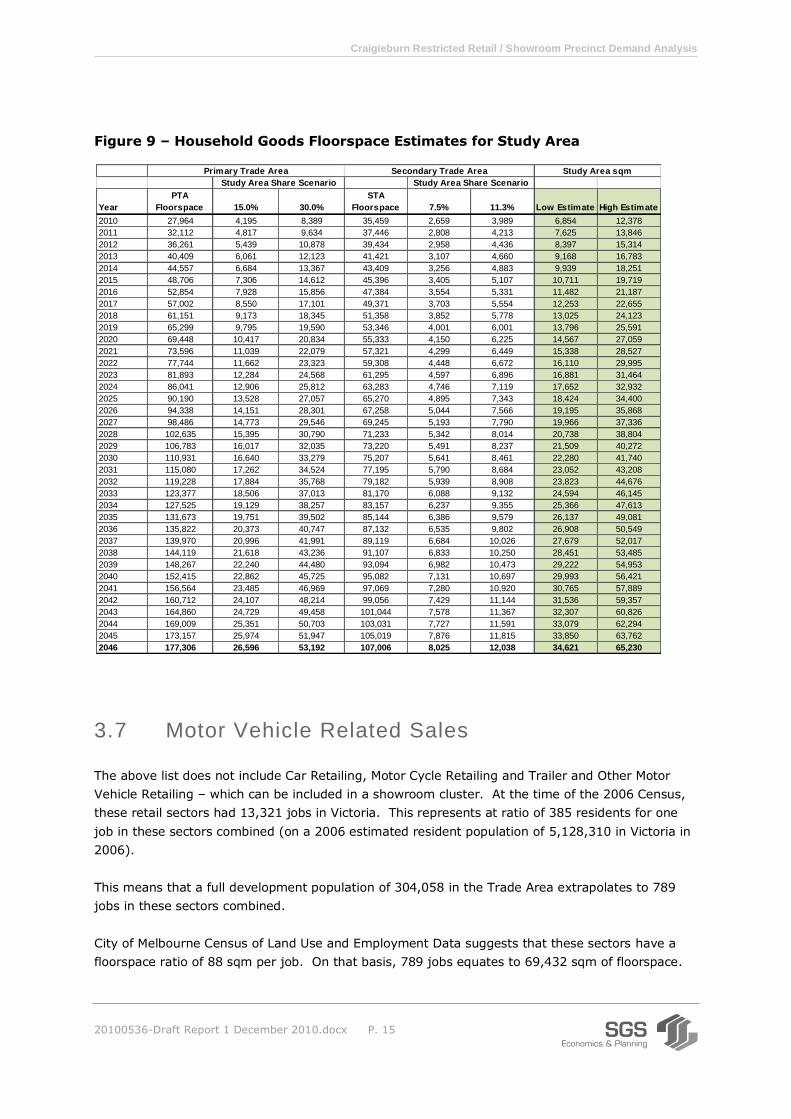
3.6 Household Goods Floorspace Estimates for Study Area
Applying the share scenarios shown above to the total floorspace generation estimates (from the
Trade Areas) yields the floorspace figures shown in Figure 9 below. This suggests that the Study
Area could be positioned to capture (at full development of the Trade Areas) between about 35,000
sqm and 65,000 sqm of household goods floorspace.
This equates to between about 11.7 hectares and 21.7 hectares of land for business purposes
assuming the floorspace to site area ratio is 30%.
It should be noted that the share estimates are held constant over time including from 2010 in this
indicative analysis. This is a very course estimate for this purpose and as such the timing of
demand should be interpreted with caution.
Regional Retention
16.7% 15.0%
33.3% 30.0%
8.3% 7.5%
12.5% 11.3%
90.0%Primary Trade Area
Secondary Trade Area 90.0%
Study Area Share Scenario
Craigieburn Restricted Retail / Showroom Precinct Demand Analysis
20100536-Draft Report 1 December 2010.docx P. 15
Figure 9 – Household Goods Floorspace Estimates for Study Area
3.7 Motor Vehicle Related Sales
The above list does not include Car Retailing, Motor Cycle Retailing and Trailer and Other Motor
Vehicle Retailing – which can be included in a showroom cluster. At the time of the 2006 Census,
these retail sectors had 13,321 jobs in Victoria. This represents at ratio of 385 residents for one
job in these sectors combined (on a 2006 estimated resident population of 5,128,310 in Victoria in
2006).
This means that a full development population of 304,058 in the Trade Area extrapolates to 789
jobs in these sectors combined.
City of Melbourne Census of Land Use and Employment Data suggests that these sectors have a
floorspace ratio of 88 sqm per job. On that basis, 789 jobs equates to 69,432 sqm of floorspace.
Year
PTA
Floorspace 15.0% 30.0%
STA
Floorspace 7.5% 11.3% Low Estimate High Estimate
2010 27,964 4,195 8,389 35,459 2,659 3,989 6,854 12,378
2011 32,112 4,817 9,634 37,446 2,808 4,213 7,625 13,846
2012 36,261 5,439 10,878 39,434 2,958 4,436 8,397 15,314
2013 40,409 6,061 12,123 41,421 3,107 4,660 9,168 16,783
2014 44,557 6,684 13,367 43,409 3,256 4,883 9,939 18,251
2015 48,706 7,306 14,612 45,396 3,405 5,107 10,711 19,719
2016 52,854 7,928 15,856 47,384 3,554 5,331 11,482 21,187
2017 57,002 8,550 17,101 49,371 3,703 5,554 12,253 22,655
2018 61,151 9,173 18,345 51,358 3,852 5,778 13,025 24,123
2019 65,299 9,795 19,590 53,346 4,001 6,001 13,796 25,591
2020 69,448 10,417 20,834 55,333 4,150 6,225 14,567 27,059
2021 73,596 11,039 22,079 57,321 4,299 6,449 15,338 28,527
2022 77,744 11,662 23,323 59,308 4,448 6,672 16,110 29,995
2023 81,893 12,284 24,568 61,295 4,597 6,896 16,881 31,464
2024 86,041 12,906 25,812 63,283 4,746 7,119 17,652 32,932
2025 90,190 13,528 27,057 65,270 4,895 7,343 18,424 34,400
2026 94,338 14,151 28,301 67,258 5,044 7,566 19,195 35,868
2027 98,486 14,773 29,546 69,245 5,193 7,790 19,966 37,336
2028 102,635 15,395 30,790 71,233 5,342 8,014 20,738 38,804
2029 106,783 16,017 32,035 73,220 5,491 8,237 21,509 40,272
2030 110,931 16,640 33,279 75,207 5,641 8,461 22,280 41,740
2031 115,080 17,262 34,524 77,195 5,790 8,684 23,052 43,208
2032 119,228 17,884 35,768 79,182 5,939 8,908 23,823 44,676
2033 123,377 18,506 37,013 81,170 6,088 9,132 24,594 46,145
2034 127,525 19,129 38,257 83,157 6,237 9,355 25,366 47,613
2035 131,673 19,751 39,502 85,144 6,386 9,579 26,137 49,081
2036 135,822 20,373 40,747 87,132 6,535 9,802 26,908 50,549
2037 139,970 20,996 41,991 89,119 6,684 10,026 27,679 52,017
2038 144,119 21,618 43,236 91,107 6,833 10,250 28,451 53,485
2039 148,267 22,240 44,480 93,094 6,982 10,473 29,222 54,953
2040 152,415 22,862 45,725 95,082 7,131 10,697 29,993 56,421
2041 156,564 23,485 46,969 97,069 7,280 10,920 30,765 57,889
2042 160,712 24,107 48,214 99,056 7,429 11,144 31,536 59,357
2043 164,860 24,729 49,458 101,044 7,578 11,367 32,307 60,826
2044 169,009 25,351 50,703 103,031 7,727 11,591 33,079 62,294
2045 173,157 25,974 51,947 105,019 7,876 11,815 33,850 63,762
2046 177,306 26,596 53,192 107,006 8,025 12,038 34,621 65,230
Secondary Trade Area Study Area sqm
Study Area Share Scenario Study Area Share Scenario
Primary Trade Area
Craigieburn Restricted Retail / Showroom Precinct Demand Analysis
20100536-Draft Report 1 December 2010.docx P. 16
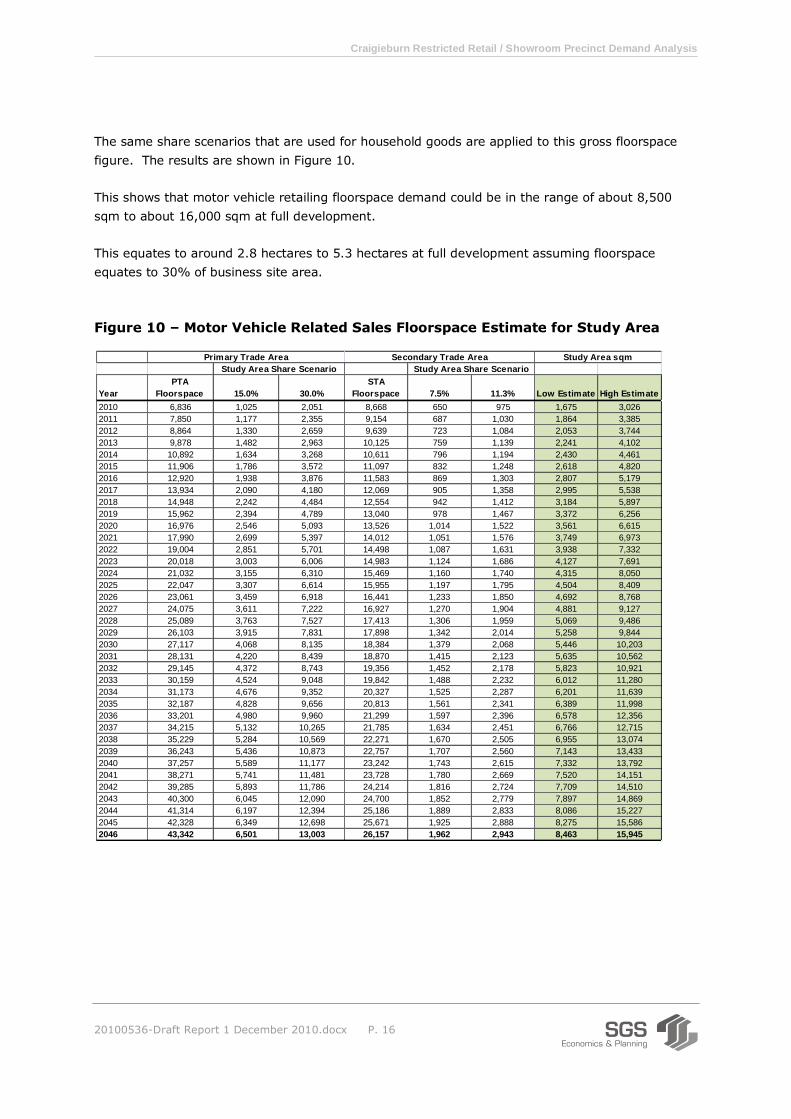
The same share scenarios that are used for household goods are applied to this gross floorspace
figure. The results are shown in Figure 10.
This shows that motor vehicle retailing floorspace demand could be in the range of about 8,500
sqm to about 16,000 sqm at full development.
This equates to around 2.8 hectares to 5.3 hectares at full development assuming floorspace
equates to 30% of business site area.
Figure 10 – Motor Vehicle Related Sales Floorspace Estimate for Study Area
Year
PTA
Floorspace 15.0% 30.0%
STA
Floorspace 7.5% 11.3% Low Estimate High Estimate
2010 6,836 1,025 2,051 8,668 650 975 1,675 3,026
2011 7,850 1,177 2,355 9,154 687 1,030 1,864 3,385
2012 8,864 1,330 2,659 9,639 723 1,084 2,053 3,744
2013 9,878 1,482 2,963 10,125 759 1,139 2,241 4,102
2014 10,892 1,634 3,268 10,611 796 1,194 2,430 4,461
2015 11,906 1,786 3,572 11,097 832 1,248 2,618 4,820
2016 12,920 1,938 3,876 11,583 869 1,303 2,807 5,179
2017 13,934 2,090 4,180 12,069 905 1,358 2,995 5,538
2018 14,948 2,242 4,484 12,554 942 1,412 3,184 5,897
2019 15,962 2,394 4,789 13,040 978 1,467 3,372 6,256
2020 16,976 2,546 5,093 13,526 1,014 1,522 3,561 6,615
2021 17,990 2,699 5,397 14,012 1,051 1,576 3,749 6,973
2022 19,004 2,851 5,701 14,498 1,087 1,631 3,938 7,332
2023 20,018 3,003 6,006 14,983 1,124 1,686 4,127 7,691
2024 21,032 3,155 6,310 15,469 1,160 1,740 4,315 8,050
2025 22,047 3,307 6,614 15,955 1,197 1,795 4,504 8,409
2026 23,061 3,459 6,918 16,441 1,233 1,850 4,692 8,768
2027 24,075 3,611 7,222 16,927 1,270 1,904 4,881 9,127
2028 25,089 3,763 7,527 17,413 1,306 1,959 5,069 9,486
2029 26,103 3,915 7,831 17,898 1,342 2,014 5,258 9,844
2030 27,117 4,068 8,135 18,384 1,379 2,068 5,446 10,203
2031 28,131 4,220 8,439 18,870 1,415 2,123 5,635 10,562
2032 29,145 4,372 8,743 19,356 1,452 2,178 5,823 10,921
2033 30,159 4,524 9,048 19,842 1,488 2,232 6,012 11,280
2034 31,173 4,676 9,352 20,327 1,525 2,287 6,201 11,639
2035 32,187 4,828 9,656 20,813 1,561 2,341 6,389 11,998
2036 33,201 4,980 9,960 21,299 1,597 2,396 6,578 12,356
2037 34,215 5,132 10,265 21,785 1,634 2,451 6,766 12,715
2038 35,229 5,284 10,569 22,271 1,670 2,505 6,955 13,074
2039 36,243 5,436 10,873 22,757 1,707 2,560 7,143 13,433
2040 37,257 5,589 11,177 23,242 1,743 2,615 7,332 13,792
2041 38,271 5,741 11,481 23,728 1,780 2,669 7,520 14,151
2042 39,285 5,893 11,786 24,214 1,816 2,724 7,709 14,510
2043 40,300 6,045 12,090 24,700 1,852 2,779 7,897 14,869
2044 41,314 6,197 12,394 25,186 1,889 2,833 8,086 15,227
2045 42,328 6,349 12,698 25,671 1,925 2,888 8,275 15,586
2046 43,342 6,501 13,003 26,157 1,962 2,943 8,463 15,945
Primary Trade Area Secondary Trade Area Study Area sqm
Study Area Share Scenario Study Area Share Scenario
Craigieburn Restricted Retail / Showroom Precinct Demand Analysis
20100536-Draft Report 1 December 2010.docx P. 17
3.8 Summary
The Trade Area for the Study Area is assessed to be the urban areas (existing and future) generally
north of Somerton Road, with the Primary Trade Area being north of Craigieburn Road. The Trade
Area as a whole had around 41,600 residents in 2006 and this is expected to increase to around
304,000 at full development
The Study Area is one of 15 major centres in the region, which includes existing and proposed
centres in and around the Trade Area. The extent to which the Study Area can capture floorspace
will depend on its offer and positioning in relation to this competitive context.
It is estimated that the Study Area could be positioned to capture (at full development):
Between about 35,000 sqm and 65,000 sqm of household goods (restricted retail)
floorspace. This equates to between about 11.7 hectares and 21.7 hectares of land for
business purposes; and
Between about 8,500 sqm and 16,000 sqm of motor vehicle retailing floorspace. This
equates to around 2.8 hectares to 5.3 hectares of land at full development.
The total land allowance is therefore between 14.5 hectares and 27.0 hectares for business
purposes, not including an allowance for estate roads, open space and other shared assets.
Craigieburn Restricted Retail / Showroom Precinct Demand Analysis
20100536-Draft Report 1 December 2010.docx P. 18
4 Site Analysis
4.1 Optimal Characteristics
The success of a restricted retail / showroom precinct relates to its access, exposure,
agglomeration and integration attributes (assuming a sufficient catchment is in place to support the
centre). These attributes are explained as follows.
Accessibility - The accessibility of a precinct to its regional catchment is a critical success
factor. A highly accessible precinct is usually located on a major road or highway and near
the junction of other major roads. The optimal access system for a restricted retail /
showroom precinct is a radial road network that connects the precinct with its catchment in
multiple directions.
Exposure – Related to the above point, businesses that establish in restricted retail /
showroom precincts benefit from being located on the main road frontage due to the
exposure it provides to its regional catchment base. Businesses are able to be better
recognised and patronised by being in a visible location.
Agglomeration – A critical mass of restricted retail / showroom businesses adds to the
gravity of the precinct by expanding its catchment and catchment penetration. Customers
are drawn to precincts with a large number of similar businesses due to the comparison
shopping benefits a large and consolidated precinct can offer.
Integration – Agglomeration benefits can be enhanced or diminished by the level of linkage
and integration between businesses in the precinct. Ideally, precincts should offer the
capacity for customers to park in zones and walk to numerous businesses without having to
drive to each business.
In short, successful restricted retail / showroom precincts are attractive to their large catchments
because of their comparison offer and ease of access to and within precincts.

Craigieburn Restricted Retail / Showroom Precinct Demand Analysis
20100536-Draft Report 1 December 2010.docx P. 19
4.2 Study Area Analysis
The Study Area is assessed to have four broad zones with variable characteristics from the
perspective of restricted retail / showroom uses. The four zones are shown in Figure 11 below.
Figure 11 – Site Analysis Zones

Craigieburn Restricted Retail / Showroom Precinct Demand Analysis
20100536-Draft Report 1 December 2010.docx P. 20
Zone 1 – Hume Highway and Craigieburn Road Junction
This is potentially a prime business node in the study area
region. The success of this zone as a business junction may
be contingent on the Hume Highway and Craigieburn Road
junction being redeveloped to form a proper cross street
format with rail underpass or similar. The current junction
configuration presents poor integration and legibility.
Assuming the above engineering solution was delivered, this junction could be established as a
focal point for restricted retail / showroom uses due to its position on Hume Highway (north-south
accessibility and exposure), Craigieburn Road (east-west accessibility and exposure) and Hume
Freeway (north-south east accessibility and exposure). The Craigieburn Road link has the potential
to provide a high level or penetration into the vast residential catchment to the west and tap the
Whittlesea growth area to the more distant east. In addition to these advantages, Craigieburn
Station provides access via train services.
It is also important that Hume Highway has lower traffic speeds and greater capacity for traffic
management compared to Hume Freeway (which connects with the Highway north of Summerhill
and Mount Ridley Roads).
Advantages:
North-south access and exposure;
East-west access and exposure (which can be improved subject to road works);
Highway section of road (which provides capacity for traffic management);
Land availability on east side of Hume Highway; and
Access to Craigieburn Station.
Disadvantages:
Land not availability on west side of Hume Highway.
Zone 2 – Hume Highway Between Craigieburn Road and
Summerhill Road
The strip along the east side of Hume Highway could be
established as a successful restricted retail / showroom strip.
Bunnings has established a store here which can perform the
role of anchor tenant for the area.
The benefits of this zone are similar to Zone 1. Additional
linkages could be provided with extensions to Amaroo Road to the east and Summerhill Road
(east) and Mount Ridley Road (west).
Hume Highway has lower traffic speeds than the Freeway and greater capacity for traffic
management. This means the capacity to build a high amenity and integrated environment may be
easier in this zone compared to Zone 3.
Craigieburn Restricted Retail / Showroom Precinct Demand Analysis
20100536-Draft Report 1 December 2010.docx P. 21
Advantages:
North-south access and exposure;
East-west access and exposure (which can be improved subject to road works);
Highway section of road (which provides capacity for traffic management);
Land availability on east side of Hume Highway; and
Existing Bunnings store will act as anchor for other businesses.
Disadvantages:
Land not availability on west side of Hume Highway.
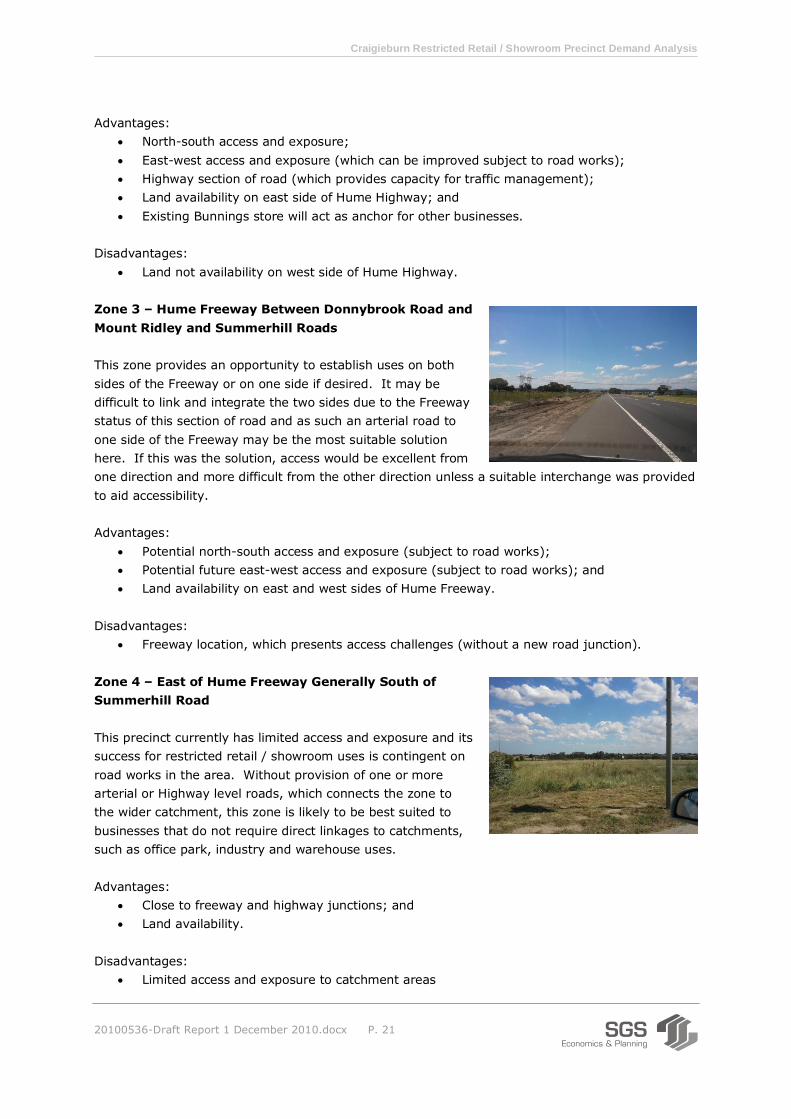
Zone 3 – Hume Freeway Between Donnybrook Road and
Mount Ridley and Summerhill Roads
This zone provides an opportunity to establish uses on both
sides of the Freeway or on one side if desired. It may be
difficult to link and integrate the two sides due to the Freeway
status of this section of road and as such an arterial road to
one side of the Freeway may be the most suitable solution
here. If this was the solution, access would be excellent from
one direction and more difficult from the other direction unless a suitable interchange was provided
to aid accessibility.
Advantages:
Potential north-south access and exposure (subject to road works);
Potential future east-west access and exposure (subject to road works); and
Land availability on east and west sides of Hume Freeway.
Disadvantages:
Freeway location, which presents access challenges (without a new road junction).
Zone 4 – East of Hume Freeway Generally South of
Summerhill Road
This precinct currently has limited access and exposure and its
success for restricted retail / showroom uses is contingent on
road works in the area. Without provision of one or more
arterial or Highway level roads, which connects the zone to
the wider catchment, this zone is likely to be best suited to
businesses that do not require direct linkages to catchments,
such as office park, industry and warehouse uses.
Advantages:
Close to freeway and highway junctions; and
Land availability.
Disadvantages:
Limited access and exposure to catchment areas
Craigieburn Restricted Retail / Showroom Precinct Demand Analysis
20100536-Draft Report 1 December 2010.docx P. 22
4.3 Summary
Successful restricted retail / showroom precincts are attractive to their large catchments because
of their comparison offer and ease of access to and within precincts.
Based on existing conditions, it is recommended that the best solution for restricted retail /
showroom activities is to focus activity generally in zones 2 and 1 as defined in this report. These
zones provide an existing highway road system with reasonable catchment linkages and capacity to
leverage off the Bunnings store in the north and Craigieburn Station in the south.
It will be important to ensure development is agglomerated to the extent possible, by developing
areas in stages. It will also be important to ensure that road works, parking, footpath and design
treatments are used to integrate businesses in both functional and amenity terms.
Zone 4 can be used for a range of businesses and provide capacity for additional restricted retail /
showroom activities in the more distant future, if the demand arises.
The above approach is linked to existing road network characteristics, and the recommendations
could change if the road network was modified. Under current conditions, it is felt that the
Freeway status of zone 3 and limited existing interchanges presents difficulties in establishing a
restricted retail / showroom precinct there in the short term.
Craigieburn Restricted Retail / Showroom Precinct Demand Analysis
20100536-Draft Report 1 December 2010.docx P. 23
5 Summary of Findings
The Study Area is well positioned to perform the role of a Craigieburn region specialised bulky
goods centre.
An appropriate zoning (e.g. Business 4) will need to be provided to facilitate this outcome
consistent with the State’s Retail Policy Review.
The Study Area is one of 15 major centres in the region, which includes existing and proposed
centres in and around the Trade Area. The extent to which the Study Area can capture floorspace
will depend on its offer and positioning in relation to this competitive context.
It is estimated that the Study Area could be positioned to capture (at full development):
Between about 35,000 sqm and 65,000 sqm of household goods (restricted retail)
floorspace. This equates to between about 11.7 hectares and 21.7 hectares of land for
business purposes; and
Between about 8,500 sqm and 16,000 sqm of motor vehicle retailing floorspace. This
equates to around 2.8 hectares to 5.3 hectares of land at full development.
The total land allowance is therefore between 14.5 hectares and 27.0 hectares for business
purposes, not including an allowance for estate roads, open space and other shared assets.
Successful restricted retail / showroom precincts are attractive to their large catchments because
of their comparison offer and ease of access to and within precincts.
Based on existing conditions, it is recommended that the best solution for restricted retail /
showroom activities is to focus activity generally in zones 2 and 1 as defined in this report. These
zones provide an existing highway road system with reasonable catchment linkages and capacity to
leverage off the Bunnings store in the north and Craigieburn Station in the south.
It will be important to ensure development is agglomerated to the extent possible, by developing
areas in stages. It will also be important to ensure that road works, parking, footpath and design
treatments are used to integrate businesses in both functional and amenity terms.
The above approach is linked to existing road network characteristics, and the recommendations
could change if the road network was modified.