crash performance of strong-post w-beam guardrail with ... · crash performance of strong-post...
TRANSCRIPT
Crash Performance of Strong-Post W-Beam Guardrail
with Missing Blockouts Carolyn E. Hampton and Hampton C. Gabler
Virginia Tech – Center for Injury Biomechanics, Blacksburg VA 24061
Abstract
Missing blockouts in a strong-post w-beam guardrail, a condition most commonly associated with environmental decay or crash damage, has never been thoroughly investigated. To determine the risks posed by the removal of a blockout, a combination of component-level pendulum testing and full-scale finite element models of crash tests was used to assess whether a missing blockout renders the guardrail performance unacceptable. Finite element models were developed for three pendulum tests. (1) A 30.1 kph impact into test installation with proper blockout installation resulting in containment, (2) a 30.5 kph impact into a test installation with one missing blockout resulting in splice rupture, and (3) a 26.7 kph impact into a test installation with one missing blockout resulting in containment. The finite element model was able to reproduce the splice failure in Test 2 when the appropriate mesh quality and failure criteria were used. Full scale crash test models of a 2000 kg pickup truck striking a 29 post
guardrail at 25 degrees were developed. The simulation results indicated that wheel snagging was not a major problem. Although a missing blockout increases the maximum rail tension and deflection by as much as 13%, such guardrails are still capable of safely redirecting vehicles.
INTRODUCTION
Strong-post w-beam guardrail is the most common type of longitudinal barrier in use along highways,
representing more than 50% of total barrier length in use [1]. Full scale crash tests such as those specified in NCHRP Report 350 (National Cooperative Highway Program Report 350 – Recommended Procedures
for the Safety Evaluation of Highway Features) are used to evaluate guardrail performance before
installation along roadways [2]. After installation, the functionality of these guardrails suffers from crash damage and environmental decay. The costs incurred by repairing such damage are considerable and
damage that is considered ‘minor’ may be postponed by transportation agencies. Unfortunately, there is
little information available on the performance of damaged guardrail.
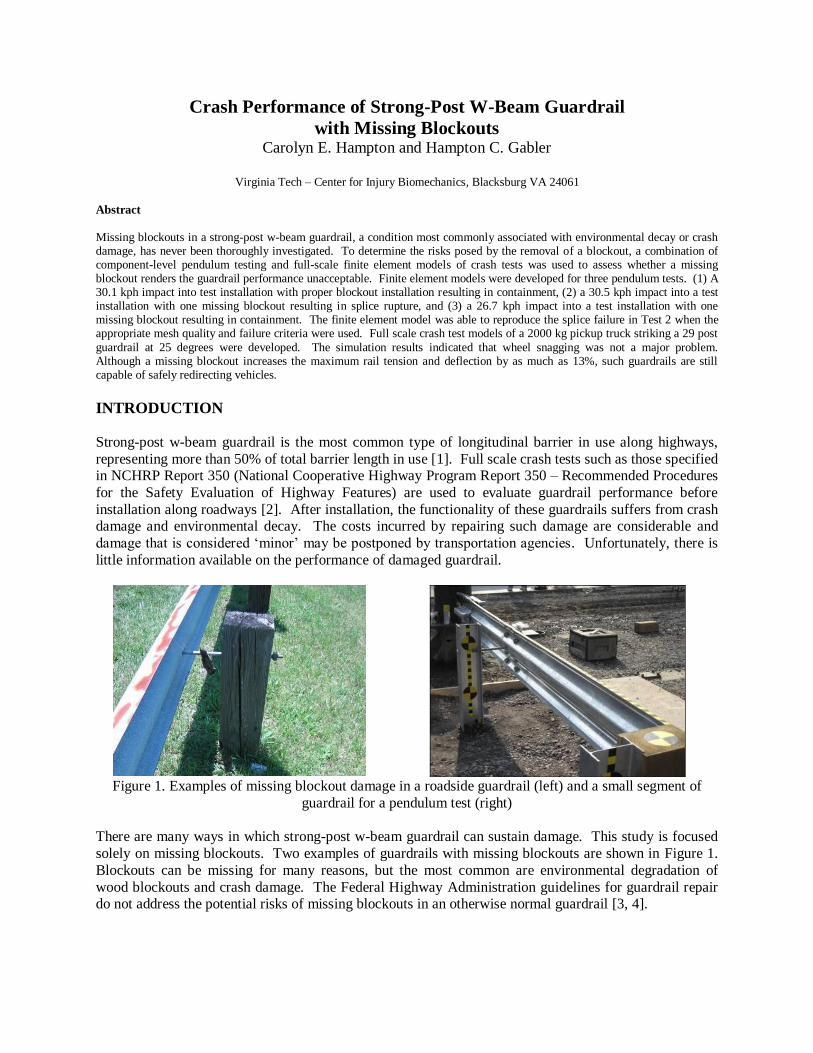
Figure 1. Examples of missing blockout damage in a roadside guardrail (left) and a small segment of
guardrail for a pendulum test (right)
There are many ways in which strong-post w-beam guardrail can sustain damage. This study is focused
solely on missing blockouts. Two examples of guardrails with missing blockouts are shown in Figure 1.
Blockouts can be missing for many reasons, but the most common are environmental degradation of
wood blockouts and crash damage. The Federal Highway Administration guidelines for guardrail repair do not address the potential risks of missing blockouts in an otherwise normal guardrail [3, 4].
A survey of 39 U.S. states and Canadian provinces revealed that many repairing agencies consider
missing blockouts to be a threat. If a blockout were missing, 89% would schedule a repair and 19% of agencies considered the damage to be dangerous enough to warrant a repair as soon as practical [5].
Clearly this type of guardrail damage is of concern to transportation agencies and the associated risks
need to be better understood.
The goal of this study is to provide an objective assessment of the risks posed by guardrail with a missing
blockout. Since there are no full scale crash tests of such guardrail, the guardrail performance will be
assessed using a combination of pendulum testing of small guardrail sections and finite element modeling of both pendulum and full scale crash tests [1]. The results of this study will provide guidance for
assessing the need for repair when missing blockouts are observed.
METHODS
The safety of guardrails with missing blockouts was assessed using a three part approach. First, a series of pendulum tests of small guardrail sections with a missing blockout were performed. Second, a finite
element model was developed using the pendulum models as validation data. Finally, the finite element
models were extended to represent full-scale crash tests so that the performance of a guardrail with missing blockouts could be determined.
Pendulum testing
Three pendulum tests were conducted at the Federal Outdoor Impact Laboratory (FOIL) using a 2000 kg
(4500 lb) as part of a larger test series to assess the performance of damaged guardrail [1]. These tests were intended to assess the capability of the guardrail to contain a striking mass without rail rupture or
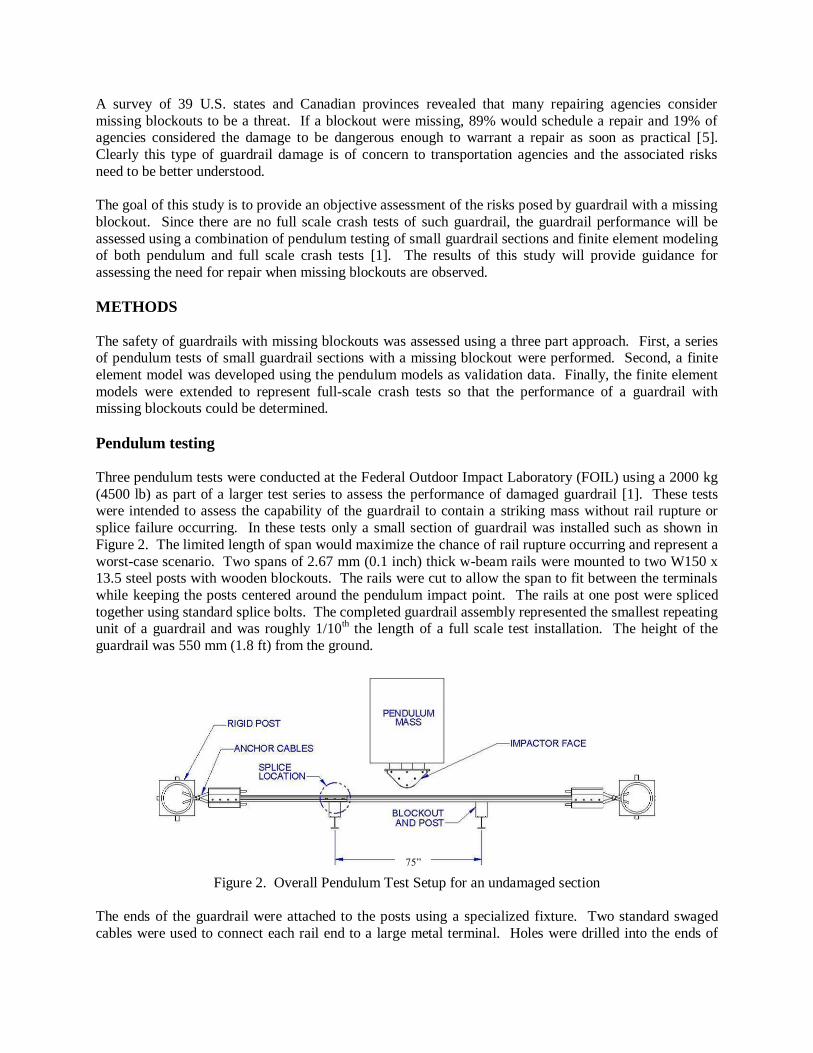
splice failure occurring. In these tests only a small section of guardrail was installed such as shown in
Figure 2. The limited length of span would maximize the chance of rail rupture occurring and represent a
worst-case scenario. Two spans of 2.67 mm (0.1 inch) thick w-beam rails were mounted to two W150 x 13.5 steel posts with wooden blockouts. The rails were cut to allow the span to fit between the terminals
while keeping the posts centered around the pendulum impact point. The rails at one post were spliced
together using standard splice bolts. The completed guardrail assembly represented the smallest repeating unit of a guardrail and was roughly 1/10
th the length of a full scale test installation. The height of the
guardrail was 550 mm (1.8 ft) from the ground.
Figure 2. Overall Pendulum Test Setup for an undamaged section
The ends of the guardrail were attached to the posts using a specialized fixture. Two standard swaged
cables were used to connect each rail end to a large metal terminal. Holes were drilled into the ends of
75”
each rail so that metal brackets could be attached, providing a location to anchor the swaged cables. The
positions of these holes were similar to those at a splice joint. The ends of the cables were threaded through a large metal plate in the terminal and washers and nuts were tightened to create tension in the
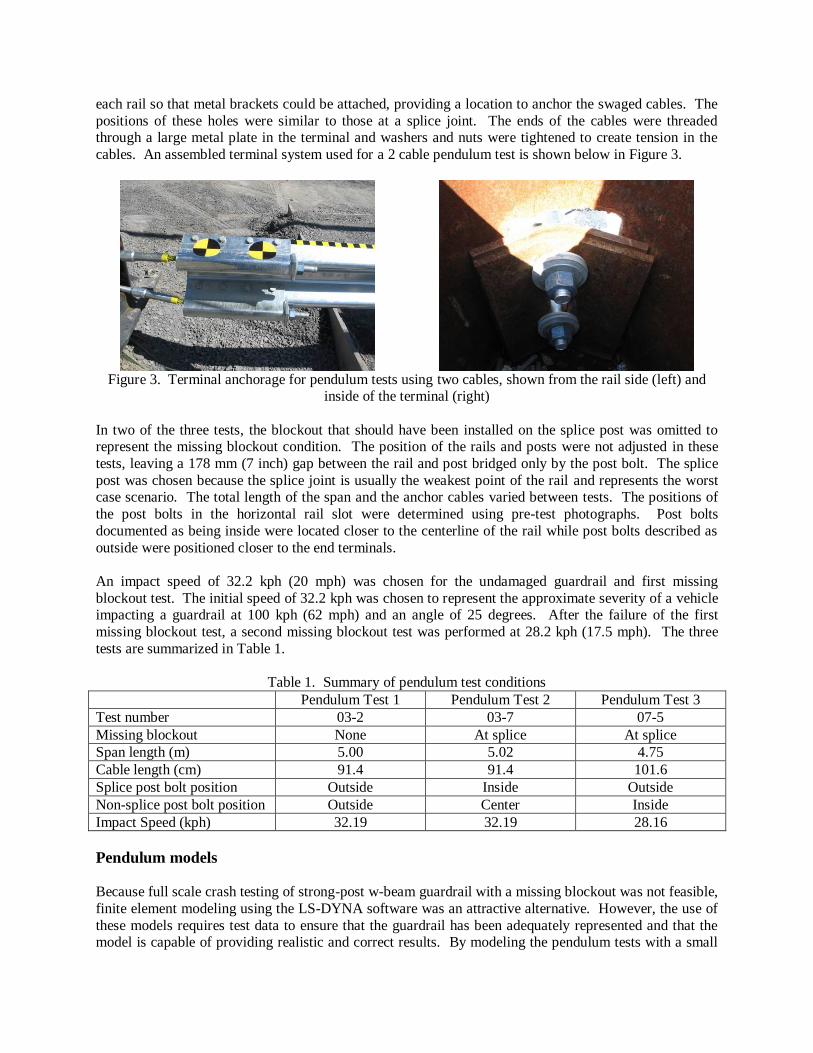
cables. An assembled terminal system used for a 2 cable pendulum test is shown below in Figure 3.
Figure 3. Terminal anchorage for pendulum tests using two cables, shown from the rail side (left) and
inside of the terminal (right)
In two of the three tests, the blockout that should have been installed on the splice post was omitted to represent the missing blockout condition. The position of the rails and posts were not adjusted in these
tests, leaving a 178 mm (7 inch) gap between the rail and post bridged only by the post bolt. The splice
post was chosen because the splice joint is usually the weakest point of the rail and represents the worst case scenario. The total length of the span and the anchor cables varied between tests. The positions of
the post bolts in the horizontal rail slot were determined using pre-test photographs. Post bolts
documented as being inside were located closer to the centerline of the rail while post bolts described as
outside were positioned closer to the end terminals.
An impact speed of 32.2 kph (20 mph) was chosen for the undamaged guardrail and first missing
blockout test. The initial speed of 32.2 kph was chosen to represent the approximate severity of a vehicle impacting a guardrail at 100 kph (62 mph) and an angle of 25 degrees. After the failure of the first
missing blockout test, a second missing blockout test was performed at 28.2 kph (17.5 mph). The three
tests are summarized in Table 1.
Table 1. Summary of pendulum test conditions
Pendulum Test 1 Pendulum Test 2 Pendulum Test 3
Test number 03-2 03-7 07-5
Missing blockout None At splice At splice
Span length (m) 5.00 5.02 4.75
Cable length (cm) 91.4 91.4 101.6
Splice post bolt position Outside Inside Outside
Non-splice post bolt position Outside Center Inside
Impact Speed (kph) 32.19 32.19 28.16
Pendulum models Because full scale crash testing of strong-post w-beam guardrail with a missing blockout was not feasible,
finite element modeling using the LS-DYNA software was an attractive alternative. However, the use of
these models requires test data to ensure that the guardrail has been adequately represented and that the model is capable of providing realistic and correct results. By modeling the pendulum tests with a small
section of the full scale guardrail model, a greater degree of confidence in the simulation results can be
achieved.
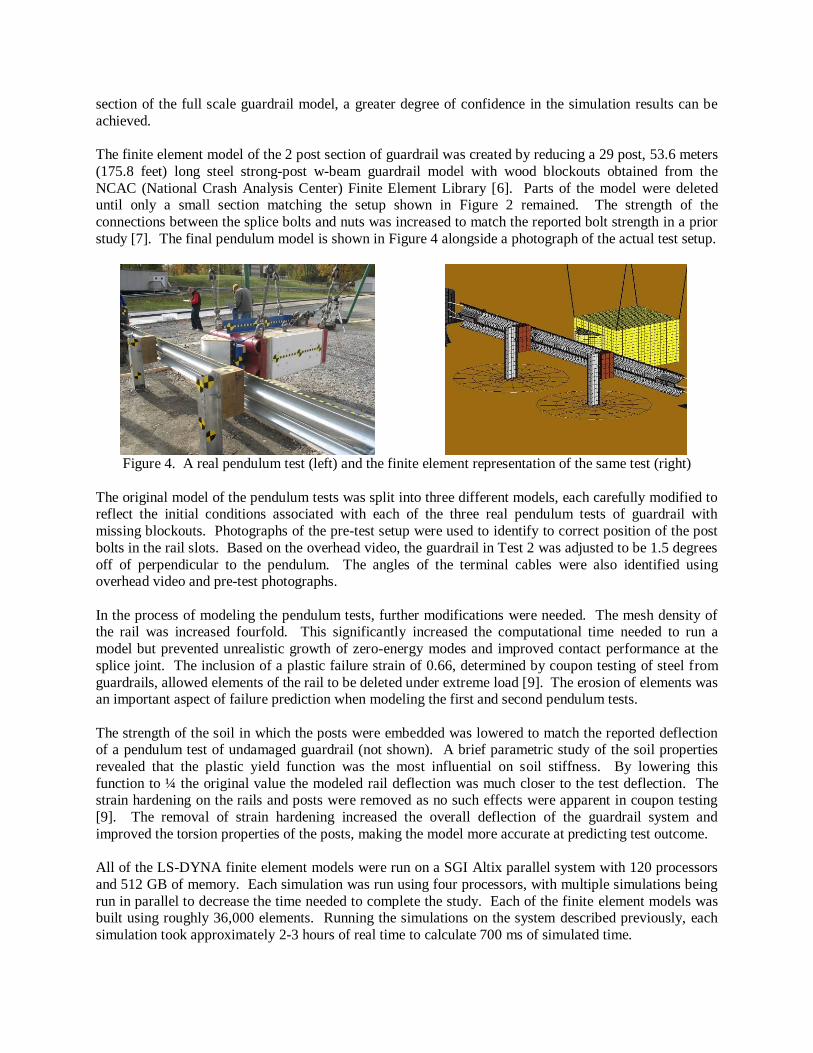
The finite element model of the 2 post section of guardrail was created by reducing a 29 post, 53.6 meters
(175.8 feet) long steel strong-post w-beam guardrail model with wood blockouts obtained from the
NCAC (National Crash Analysis Center) Finite Element Library [6]. Parts of the model were deleted until only a small section matching the setup shown in Figure 2 remained. The strength of the
connections between the splice bolts and nuts was increased to match the reported bolt strength in a prior
study [7]. The final pendulum model is shown in Figure 4 alongside a photograph of the actual test setup.
Figure 4. A real pendulum test (left) and the finite element representation of the same test (right)
The original model of the pendulum tests was split into three different models, each carefully modified to reflect the initial conditions associated with each of the three real pendulum tests of guardrail with
missing blockouts. Photographs of the pre-test setup were used to identify to correct position of the post
bolts in the rail slots. Based on the overhead video, the guardrail in Test 2 was adjusted to be 1.5 degrees
off of perpendicular to the pendulum. The angles of the terminal cables were also identified using overhead video and pre-test photographs.
In the process of modeling the pendulum tests, further modifications were needed. The mesh density of the rail was increased fourfold. This significantly increased the computational time needed to run a
model but prevented unrealistic growth of zero-energy modes and improved contact performance at the
splice joint. The inclusion of a plastic failure strain of 0.66, determined by coupon testing of steel from
guardrails, allowed elements of the rail to be deleted under extreme load [9]. The erosion of elements was an important aspect of failure prediction when modeling the first and second pendulum tests.
The strength of the soil in which the posts were embedded was lowered to match the reported deflection of a pendulum test of undamaged guardrail (not shown). A brief parametric study of the soil properties
revealed that the plastic yield function was the most influential on soil stiffness. By lowering this
function to ¼ the original value the modeled rail deflection was much closer to the test deflection. The strain hardening on the rails and posts were removed as no such effects were apparent in coupon testing
[9]. The removal of strain hardening increased the overall deflection of the guardrail system and
improved the torsion properties of the posts, making the model more accurate at predicting test outcome.
All of the LS-DYNA finite element models were run on a SGI Altix parallel system with 120 processors
and 512 GB of memory. Each simulation was run using four processors, with multiple simulations being
run in parallel to decrease the time needed to complete the study. Each of the finite element models was built using roughly 36,000 elements. Running the simulations on the system described previously, each
simulation took approximately 2-3 hours of real time to calculate 700 ms of simulated time.
Full scale crash test models
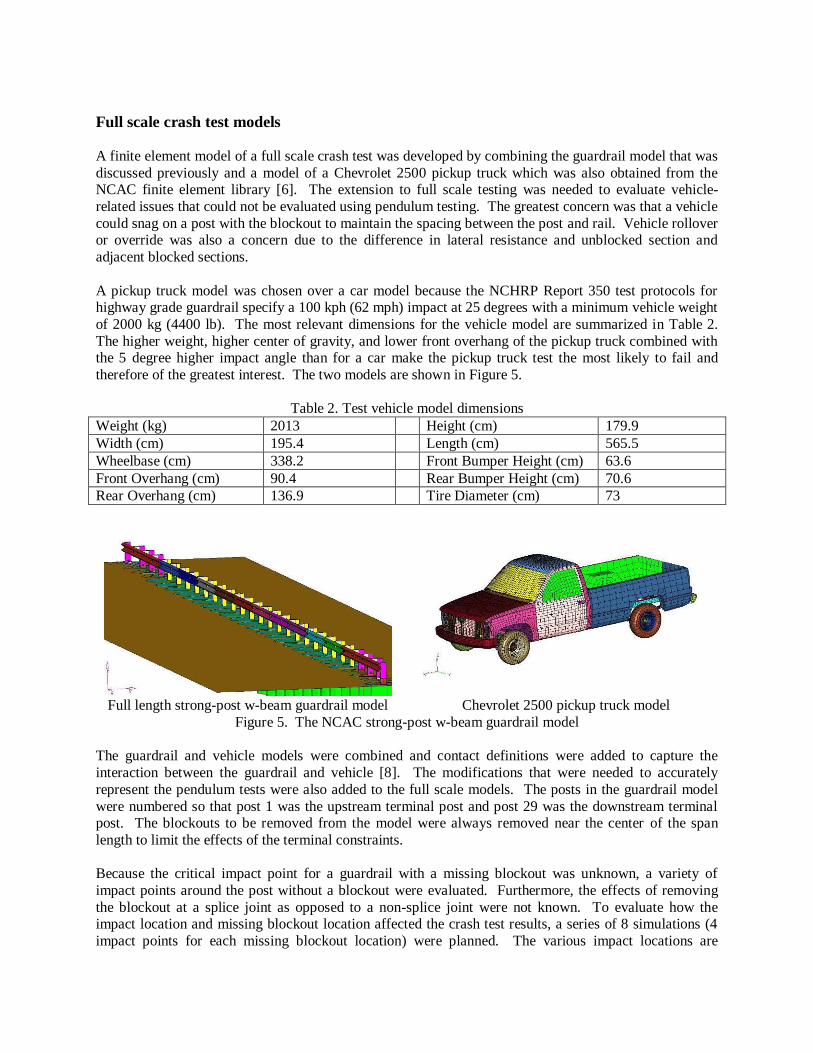
A finite element model of a full scale crash test was developed by combining the guardrail model that was
discussed previously and a model of a Chevrolet 2500 pickup truck which was also obtained from the NCAC finite element library [6]. The extension to full scale testing was needed to evaluate vehicle-
related issues that could not be evaluated using pendulum testing. The greatest concern was that a vehicle
could snag on a post with the blockout to maintain the spacing between the post and rail. Vehicle rollover or override was also a concern due to the difference in lateral resistance and unblocked section and
adjacent blocked sections.
A pickup truck model was chosen over a car model because the NCHRP Report 350 test protocols for highway grade guardrail specify a 100 kph (62 mph) impact at 25 degrees with a minimum vehicle weight
of 2000 kg (4400 lb). The most relevant dimensions for the vehicle model are summarized in Table 2.
The higher weight, higher center of gravity, and lower front overhang of the pickup truck combined with the 5 degree higher impact angle than for a car make the pickup truck test the most likely to fail and
therefore of the greatest interest. The two models are shown in Figure 5.
Table 2. Test vehicle model dimensions
Weight (kg) 2013 Height (cm) 179.9
Width (cm) 195.4 Length (cm) 565.5
Wheelbase (cm) 338.2 Front Bumper Height (cm) 63.6
Front Overhang (cm) 90.4 Rear Bumper Height (cm) 70.6
Rear Overhang (cm) 136.9 Tire Diameter (cm) 73
Full length strong-post w-beam guardrail model Chevrolet 2500 pickup truck model
Figure 5. The NCAC strong-post w-beam guardrail model
The guardrail and vehicle models were combined and contact definitions were added to capture the
interaction between the guardrail and vehicle [8]. The modifications that were needed to accurately
represent the pendulum tests were also added to the full scale models. The posts in the guardrail model
were numbered so that post 1 was the upstream terminal post and post 29 was the downstream terminal post. The blockouts to be removed from the model were always removed near the center of the span
length to limit the effects of the terminal constraints.
Because the critical impact point for a guardrail with a missing blockout was unknown, a variety of
impact points around the post without a blockout were evaluated. Furthermore, the effects of removing
the blockout at a splice joint as opposed to a non-splice joint were not known. To evaluate how the impact location and missing blockout location affected the crash test results, a series of 8 simulations (4
impact points for each missing blockout location) were planned. The various impact locations are
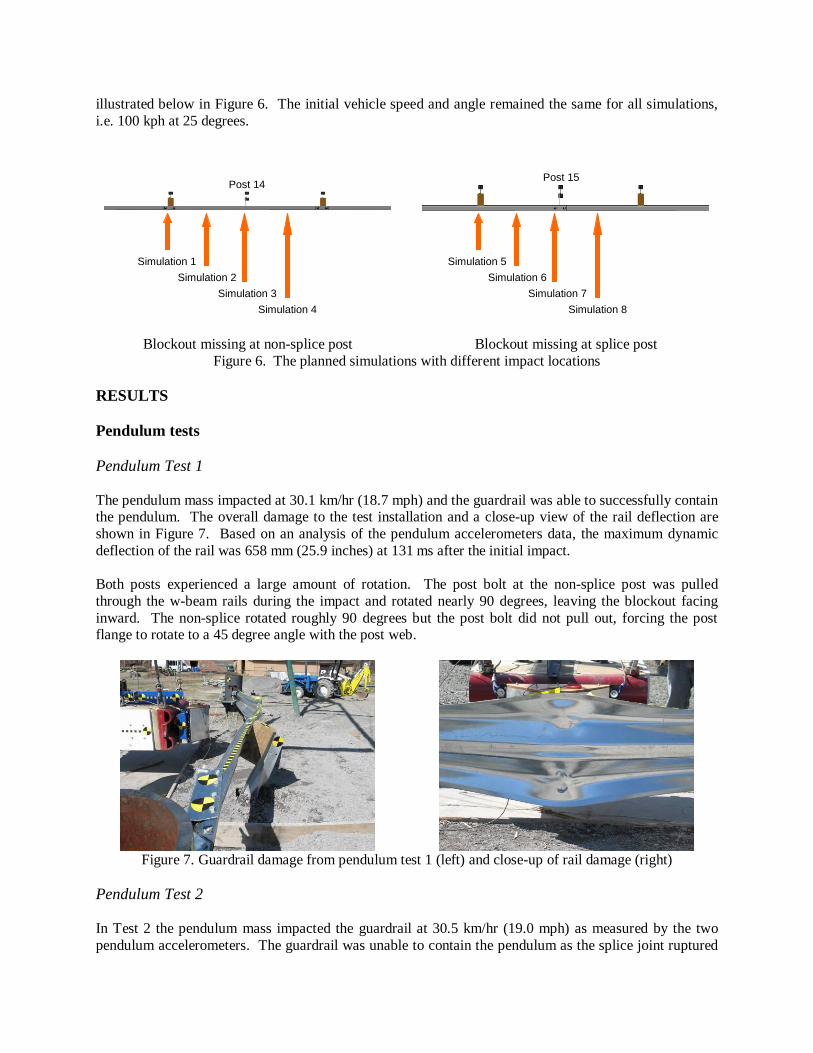
illustrated below in Figure 6. The initial vehicle speed and angle remained the same for all simulations,
i.e. 100 kph at 25 degrees.
Simulation 1
Simulation 2
Simulation 3
Simulation 4
Post 14
Simulation 1
Simulation 2
Simulation 3
Simulation 4
Post 14
Blockout missing at non-splice post
Simulation 5
Simulation 6
Simulation 7
Simulation 8
Post 15
Simulation 5
Simulation 6
Simulation 7
Simulation 8
Post 15
Blockout missing at splice post
Figure 6. The planned simulations with different impact locations
RESULTS
Pendulum tests
Pendulum Test 1
The pendulum mass impacted at 30.1 km/hr (18.7 mph) and the guardrail was able to successfully contain the pendulum. The overall damage to the test installation and a close-up view of the rail deflection are
shown in Figure 7. Based on an analysis of the pendulum accelerometers data, the maximum dynamic
deflection of the rail was 658 mm (25.9 inches) at 131 ms after the initial impact.
Both posts experienced a large amount of rotation. The post bolt at the non-splice post was pulled
through the w-beam rails during the impact and rotated nearly 90 degrees, leaving the blockout facing
inward. The non-splice rotated roughly 90 degrees but the post bolt did not pull out, forcing the post flange to rotate to a 45 degree angle with the post web.
Figure 7. Guardrail damage from pendulum test 1 (left) and close-up of rail damage (right)
Pendulum Test 2 In Test 2 the pendulum mass impacted the guardrail at 30.5 km/hr (19.0 mph) as measured by the two
pendulum accelerometers. The guardrail was unable to contain the pendulum as the splice joint ruptured
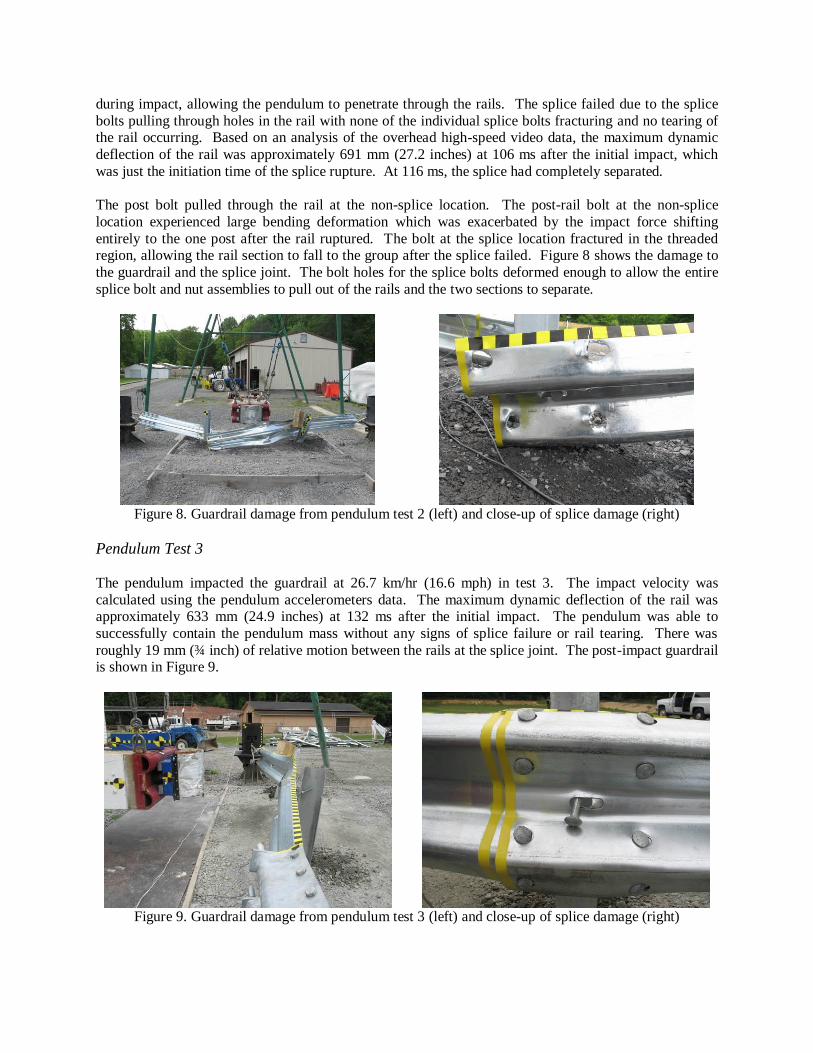
during impact, allowing the pendulum to penetrate through the rails. The splice failed due to the splice
bolts pulling through holes in the rail with none of the individual splice bolts fracturing and no tearing of the rail occurring. Based on an analysis of the overhead high-speed video data, the maximum dynamic
deflection of the rail was approximately 691 mm (27.2 inches) at 106 ms after the initial impact, which
was just the initiation time of the splice rupture. At 116 ms, the splice had completely separated.
The post bolt pulled through the rail at the non-splice location. The post-rail bolt at the non-splice
location experienced large bending deformation which was exacerbated by the impact force shifting
entirely to the one post after the rail ruptured. The bolt at the splice location fractured in the threaded region, allowing the rail section to fall to the group after the splice failed. Figure 8 shows the damage to
the guardrail and the splice joint. The bolt holes for the splice bolts deformed enough to allow the entire
splice bolt and nut assemblies to pull out of the rails and the two sections to separate.
Figure 8. Guardrail damage from pendulum test 2 (left) and close-up of splice damage (right)
Pendulum Test 3
The pendulum impacted the guardrail at 26.7 km/hr (16.6 mph) in test 3. The impact velocity was
calculated using the pendulum accelerometers data. The maximum dynamic deflection of the rail was approximately 633 mm (24.9 inches) at 132 ms after the initial impact. The pendulum was able to
successfully contain the pendulum mass without any signs of splice failure or rail tearing. There was
roughly 19 mm (¾ inch) of relative motion between the rails at the splice joint. The post-impact guardrail is shown in Figure 9.
Figure 9. Guardrail damage from pendulum test 3 (left) and close-up of splice damage (right)
The posts were not damaged during the impact. The non-splice post bolt pulled out of the rails during the
impact. At the splice post, the bolt remained inside the rail but allowed the rail to slip lower due to the slack caused by the rail deformation. There was a small amount of deformation around the splice bolt
holes due to the load transfer through the splice during impact.
Pendulum models
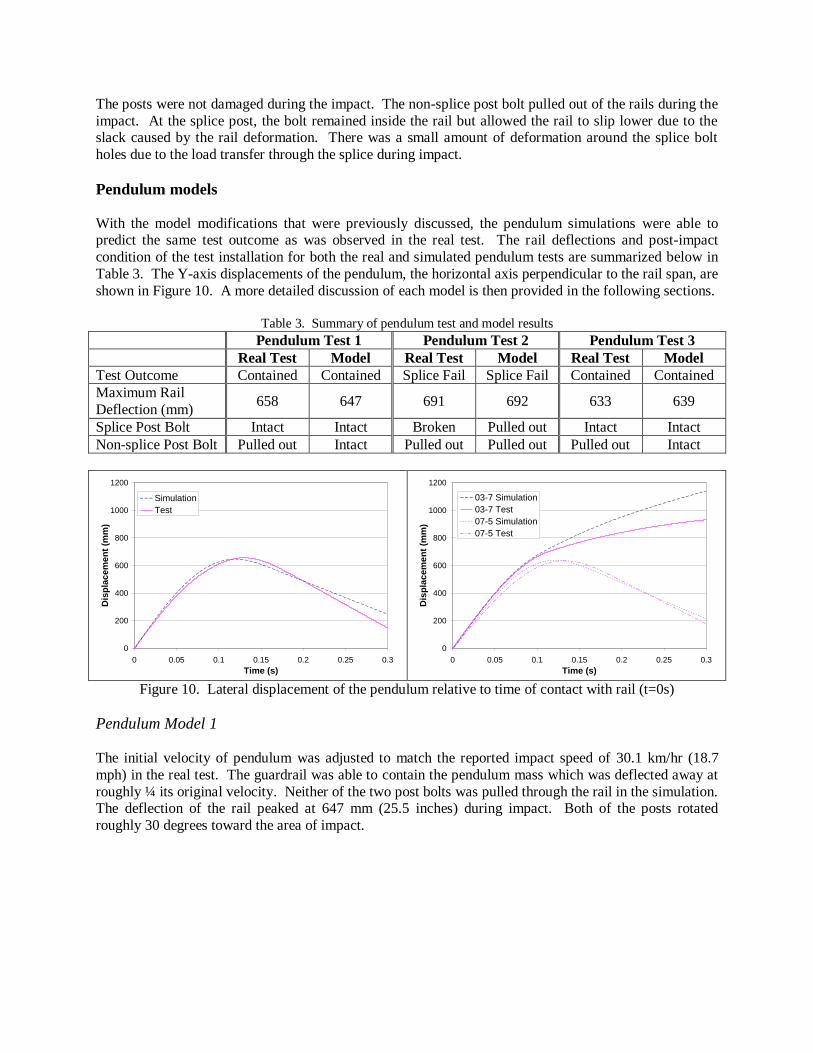
With the model modifications that were previously discussed, the pendulum simulations were able to predict the same test outcome as was observed in the real test. The rail deflections and post-impact
condition of the test installation for both the real and simulated pendulum tests are summarized below in
Table 3. The Y-axis displacements of the pendulum, the horizontal axis perpendicular to the rail span, are
shown in Figure 10. A more detailed discussion of each model is then provided in the following sections.
Table 3. Summary of pendulum test and model results
Pendulum Test 1 Pendulum Test 2 Pendulum Test 3
Real Test Model Real Test Model Real Test Model
Test Outcome Contained Contained Splice Fail Splice Fail Contained Contained
Maximum Rail
Deflection (mm) 658 647 691 692 633 639
Splice Post Bolt Intact Intact Broken Pulled out Intact Intact
Non-splice Post Bolt Pulled out Intact Pulled out Pulled out Pulled out Intact
0
200
400
600
800
1000
1200
0 0.05 0.1 0.15 0.2 0.25 0.3
Time (s)
Dis
pla
ce
me
nt
(mm
)
Simulation
Test
0
200
400
600
800
1000
1200
0 0.05 0.1 0.15 0.2 0.25 0.3
Time (s)
Dis
pla
ce
me
nt
(mm
)
03-7 Simulation
03-7 Test
07-5 Simulation
07-5 Test
Figure 10. Lateral displacement of the pendulum relative to time of contact with rail (t=0s)
Pendulum Model 1 The initial velocity of pendulum was adjusted to match the reported impact speed of 30.1 km/hr (18.7
mph) in the real test. The guardrail was able to contain the pendulum mass which was deflected away at
roughly ¼ its original velocity. Neither of the two post bolts was pulled through the rail in the simulation. The deflection of the rail peaked at 647 mm (25.5 inches) during impact. Both of the posts rotated
roughly 30 degrees toward the area of impact.
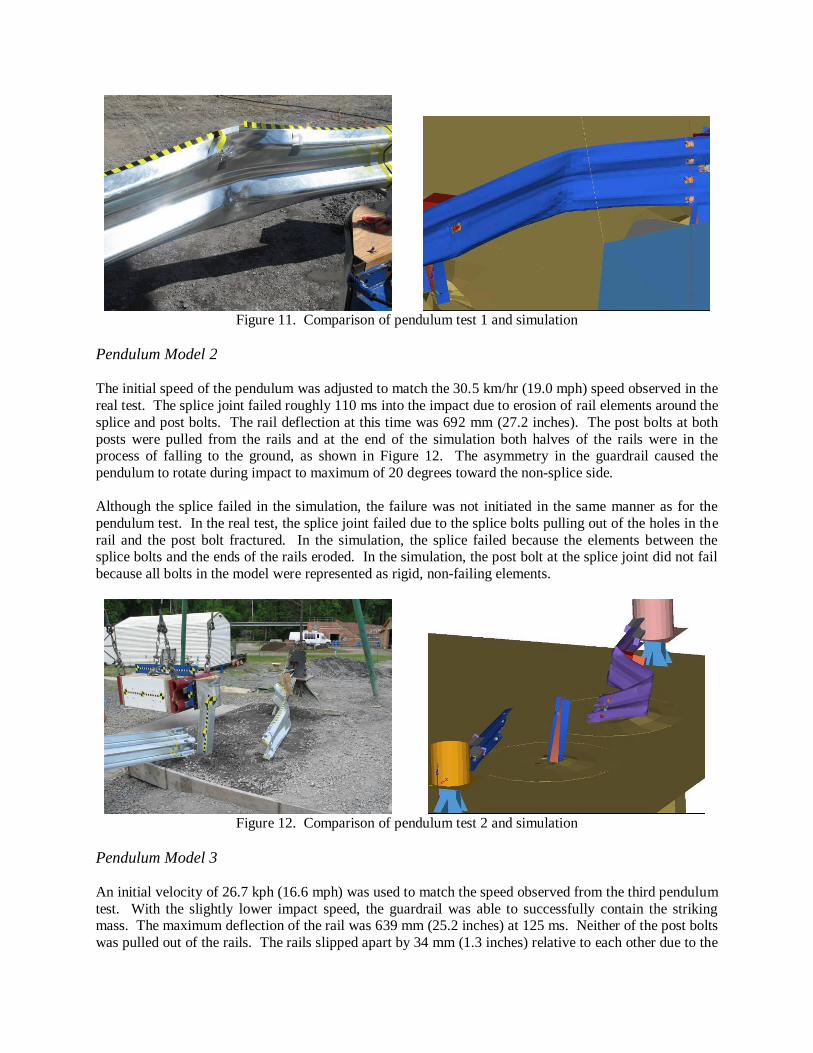
Figure 11. Comparison of pendulum test 1 and simulation
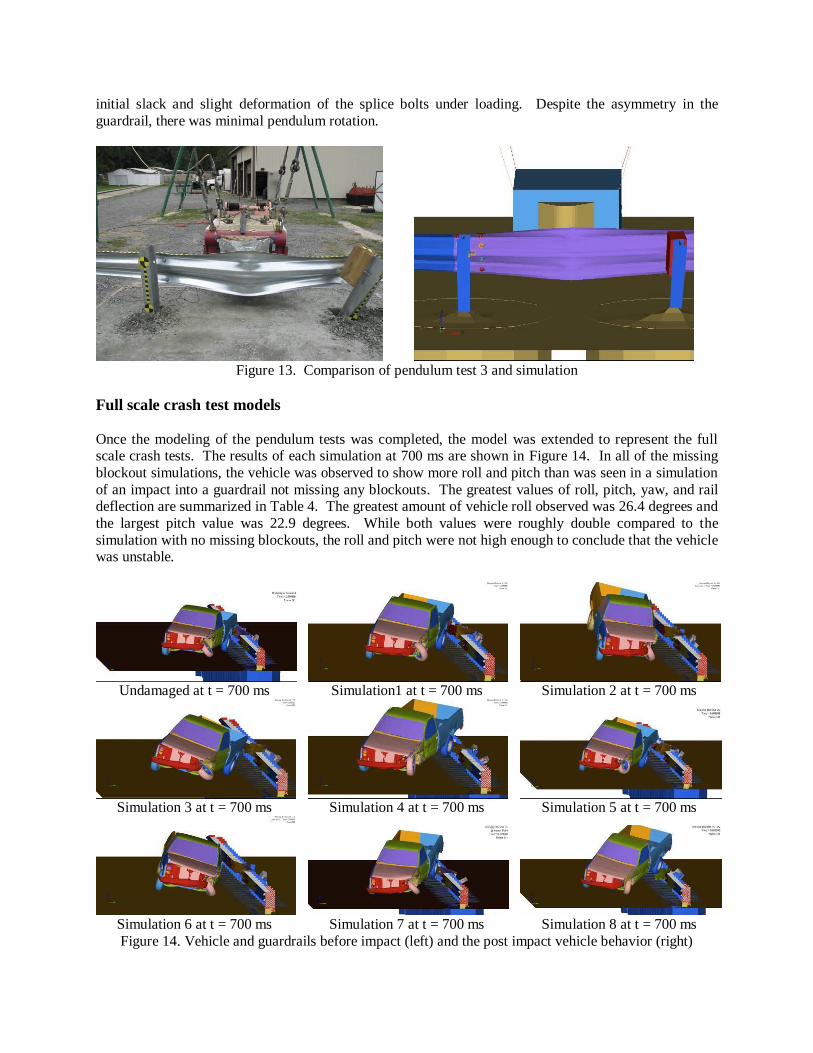
Pendulum Model 2 The initial speed of the pendulum was adjusted to match the 30.5 km/hr (19.0 mph) speed observed in the
real test. The splice joint failed roughly 110 ms into the impact due to erosion of rail elements around the
splice and post bolts. The rail deflection at this time was 692 mm (27.2 inches). The post bolts at both
posts were pulled from the rails and at the end of the simulation both halves of the rails were in the process of falling to the ground, as shown in Figure 12. The asymmetry in the guardrail caused the
pendulum to rotate during impact to maximum of 20 degrees toward the non-splice side.
Although the splice failed in the simulation, the failure was not initiated in the same manner as for the
pendulum test. In the real test, the splice joint failed due to the splice bolts pulling out of the holes in the
rail and the post bolt fractured. In the simulation, the splice failed because the elements between the splice bolts and the ends of the rails eroded. In the simulation, the post bolt at the splice joint did not fail
because all bolts in the model were represented as rigid, non-failing elements.
Figure 12. Comparison of pendulum test 2 and simulation
Pendulum Model 3
An initial velocity of 26.7 kph (16.6 mph) was used to match the speed observed from the third pendulum
test. With the slightly lower impact speed, the guardrail was able to successfully contain the striking mass. The maximum deflection of the rail was 639 mm (25.2 inches) at 125 ms. Neither of the post bolts
was pulled out of the rails. The rails slipped apart by 34 mm (1.3 inches) relative to each other due to the
initial slack and slight deformation of the splice bolts under loading. Despite the asymmetry in the
guardrail, there was minimal pendulum rotation.
Figure 13. Comparison of pendulum test 3 and simulation
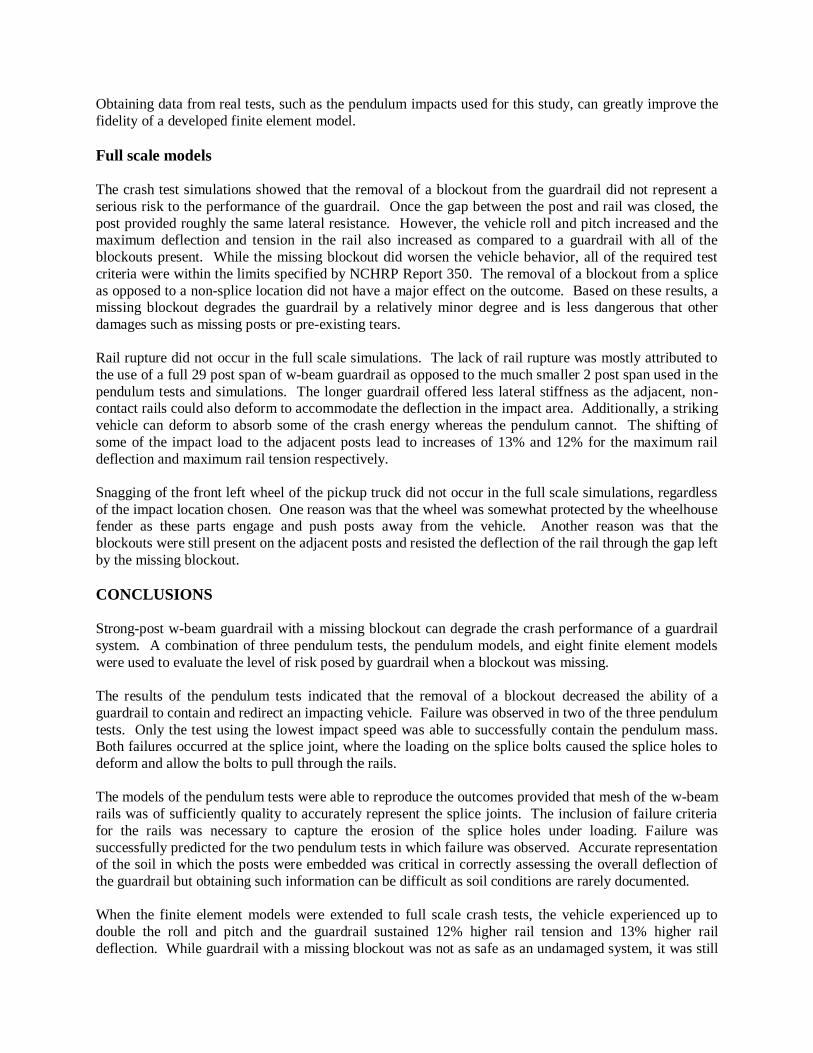
Full scale crash test models
Once the modeling of the pendulum tests was completed, the model was extended to represent the full scale crash tests. The results of each simulation at 700 ms are shown in Figure 14. In all of the missing
blockout simulations, the vehicle was observed to show more roll and pitch than was seen in a simulation
of an impact into a guardrail not missing any blockouts. The greatest values of roll, pitch, yaw, and rail deflection are summarized in Table 4. The greatest amount of vehicle roll observed was 26.4 degrees and
the largest pitch value was 22.9 degrees. While both values were roughly double compared to the
simulation with no missing blockouts, the roll and pitch were not high enough to conclude that the vehicle was unstable.
Undamaged at t = 700 ms
Simulation1 at t = 700 ms
Simulation 2 at t = 700 ms
Simulation 3 at t = 700 ms
Simulation 4 at t = 700 ms
Simulation 5 at t = 700 ms
Simulation 6 at t = 700 ms
Simulation 7 at t = 700 ms
Simulation 8 at t = 700 ms
Figure 14. Vehicle and guardrails before impact (left) and the post impact vehicle behavior (right)
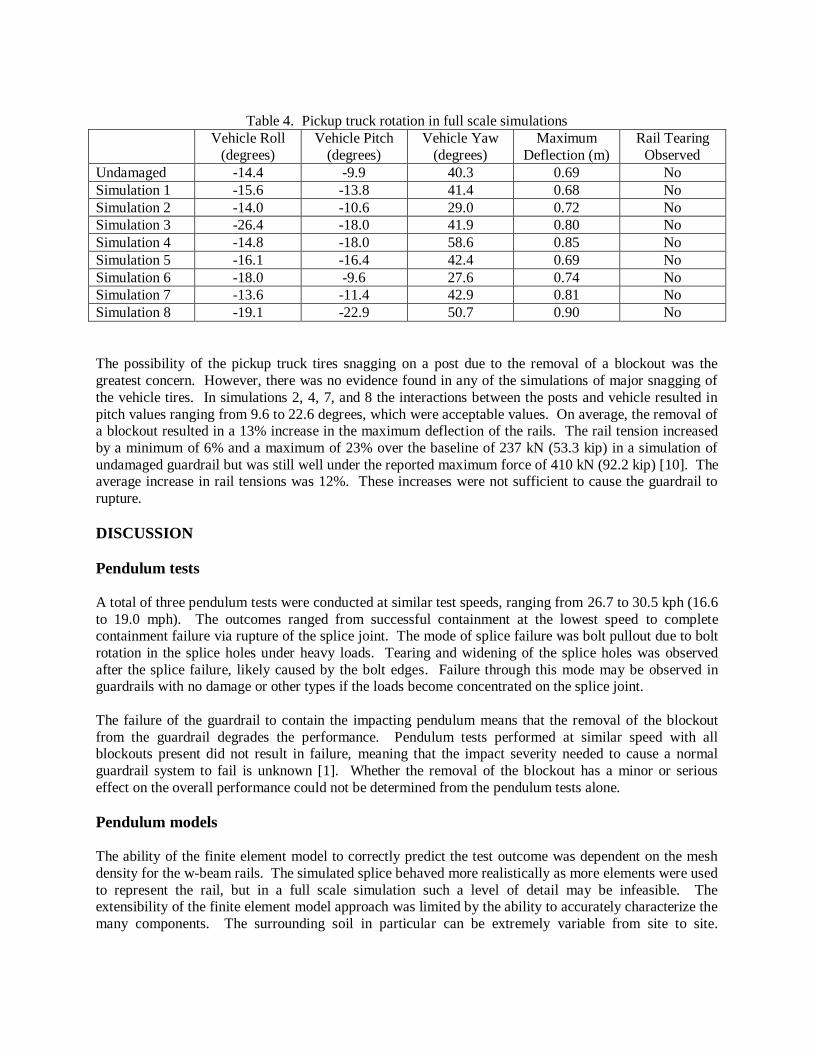
Table 4. Pickup truck rotation in full scale simulations
Vehicle Roll
(degrees)
Vehicle Pitch
(degrees)
Vehicle Yaw
(degrees)
Maximum
Deflection (m)
Rail Tearing
Observed
Undamaged -14.4 -9.9 40.3 0.69 No
Simulation 1 -15.6 -13.8 41.4 0.68 No Simulation 2 -14.0 -10.6 29.0 0.72 No Simulation 3 -26.4 -18.0 41.9 0.80 No Simulation 4 -14.8 -18.0 58.6 0.85 No Simulation 5 -16.1 -16.4 42.4 0.69 No Simulation 6 -18.0 -9.6 27.6 0.74 No Simulation 7 -13.6 -11.4 42.9 0.81 No Simulation 8 -19.1 -22.9 50.7 0.90 No
The possibility of the pickup truck tires snagging on a post due to the removal of a blockout was the
greatest concern. However, there was no evidence found in any of the simulations of major snagging of
the vehicle tires. In simulations 2, 4, 7, and 8 the interactions between the posts and vehicle resulted in
pitch values ranging from 9.6 to 22.6 degrees, which were acceptable values. On average, the removal of a blockout resulted in a 13% increase in the maximum deflection of the rails. The rail tension increased
by a minimum of 6% and a maximum of 23% over the baseline of 237 kN (53.3 kip) in a simulation of
undamaged guardrail but was still well under the reported maximum force of 410 kN (92.2 kip) [10]. The average increase in rail tensions was 12%. These increases were not sufficient to cause the guardrail to
rupture.
DISCUSSION
Pendulum tests
A total of three pendulum tests were conducted at similar test speeds, ranging from 26.7 to 30.5 kph (16.6
to 19.0 mph). The outcomes ranged from successful containment at the lowest speed to complete containment failure via rupture of the splice joint. The mode of splice failure was bolt pullout due to bolt
rotation in the splice holes under heavy loads. Tearing and widening of the splice holes was observed
after the splice failure, likely caused by the bolt edges. Failure through this mode may be observed in guardrails with no damage or other types if the loads become concentrated on the splice joint.
The failure of the guardrail to contain the impacting pendulum means that the removal of the blockout
from the guardrail degrades the performance. Pendulum tests performed at similar speed with all blockouts present did not result in failure, meaning that the impact severity needed to cause a normal
guardrail system to fail is unknown [1]. Whether the removal of the blockout has a minor or serious
effect on the overall performance could not be determined from the pendulum tests alone.
Pendulum models The ability of the finite element model to correctly predict the test outcome was dependent on the mesh
density for the w-beam rails. The simulated splice behaved more realistically as more elements were used
to represent the rail, but in a full scale simulation such a level of detail may be infeasible. The extensibility of the finite element model approach was limited by the ability to accurately characterize the
many components. The surrounding soil in particular can be extremely variable from site to site.
Obtaining data from real tests, such as the pendulum impacts used for this study, can greatly improve the
fidelity of a developed finite element model.
Full scale models The crash test simulations showed that the removal of a blockout from the guardrail did not represent a
serious risk to the performance of the guardrail. Once the gap between the post and rail was closed, the
post provided roughly the same lateral resistance. However, the vehicle roll and pitch increased and the maximum deflection and tension in the rail also increased as compared to a guardrail with all of the
blockouts present. While the missing blockout did worsen the vehicle behavior, all of the required test
criteria were within the limits specified by NCHRP Report 350. The removal of a blockout from a splice
as opposed to a non-splice location did not have a major effect on the outcome. Based on these results, a missing blockout degrades the guardrail by a relatively minor degree and is less dangerous that other
damages such as missing posts or pre-existing tears.
Rail rupture did not occur in the full scale simulations. The lack of rail rupture was mostly attributed to
the use of a full 29 post span of w-beam guardrail as opposed to the much smaller 2 post span used in the
pendulum tests and simulations. The longer guardrail offered less lateral stiffness as the adjacent, non-contact rails could also deform to accommodate the deflection in the impact area. Additionally, a striking
vehicle can deform to absorb some of the crash energy whereas the pendulum cannot. The shifting of
some of the impact load to the adjacent posts lead to increases of 13% and 12% for the maximum rail
deflection and maximum rail tension respectively.
Snagging of the front left wheel of the pickup truck did not occur in the full scale simulations, regardless
of the impact location chosen. One reason was that the wheel was somewhat protected by the wheelhouse fender as these parts engage and push posts away from the vehicle. Another reason was that the
blockouts were still present on the adjacent posts and resisted the deflection of the rail through the gap left
by the missing blockout.
CONCLUSIONS Strong-post w-beam guardrail with a missing blockout can degrade the crash performance of a guardrail
system. A combination of three pendulum tests, the pendulum models, and eight finite element models
were used to evaluate the level of risk posed by guardrail when a blockout was missing.
The results of the pendulum tests indicated that the removal of a blockout decreased the ability of a
guardrail to contain and redirect an impacting vehicle. Failure was observed in two of the three pendulum
tests. Only the test using the lowest impact speed was able to successfully contain the pendulum mass. Both failures occurred at the splice joint, where the loading on the splice bolts caused the splice holes to
deform and allow the bolts to pull through the rails.
The models of the pendulum tests were able to reproduce the outcomes provided that mesh of the w-beam
rails was of sufficiently quality to accurately represent the splice joints. The inclusion of failure criteria
for the rails was necessary to capture the erosion of the splice holes under loading. Failure was
successfully predicted for the two pendulum tests in which failure was observed. Accurate representation of the soil in which the posts were embedded was critical in correctly assessing the overall deflection of
the guardrail but obtaining such information can be difficult as soil conditions are rarely documented.
When the finite element models were extended to full scale crash tests, the vehicle experienced up to
double the roll and pitch and the guardrail sustained 12% higher rail tension and 13% higher rail
deflection. While guardrail with a missing blockout was not as safe as an undamaged system, it was still
capable of successfully redirecting a striking pickup truck in NCHRP Report 350 test level 3 impacts.
Wheel snagging, a potential problem that could not be evaluated through pendulum testing, did not occur in the finite element models.
The absence of a blockout from a strong-post w-beam guardrail did not sufficiently compromise barrier
performance that an immediate repair was warranted. However, the performance of the guardrail was lessened. Therefore, a repair may still be warranted, but the priority does not need to be as high as for
types of damage such as ruptures and tears.
ACKNOWLEDGEMENTS
The authors would like to acknowledge the contributions of many individuals and groups who contributed to this research: Chuck Niessner and the Transportation Research Board panel for funding the NCHRP
22-23 study, the FHWA for providing the services of the FOIL laboratory for the pendulum tests, Trinity
and Gregory Industries for providing test materials, LSTC for providing the LS-DYNA finite element solver software, and Altair Engineering for providing the HyperWorks pre- and post-processing software.
REFERENCES 1 HC Gabler, DJ Gabauer, and CE Hampton, National Cooperative Highway Research Program Report 656 Criteria for
Restoration of Longitudinal Barriers, Transportation Research Board, Washington DC 2010. 2 HE Ross, DL Sicking, RA Zimmer, National Cooperative Highway Research Program Report 350 Recommended
Procedures for the Safety Evaluation of Highway Features, Transportation Research Board, Washington DC 1993. 3 Federal Highway Administration, W-Beam Guardrail Repair and Maintenance A Guide for Street and Highway
Maintenance Personnel, FHWA-RT-90-001, US Department of Transportation, Washington DC 1990.
4 WJ Fitzgerald, W-Beam Guardrail Repair: A Guide for Highway and Street Maintenance, FHWA-SA-09-002, 2008. 5 DJ Gabauer and HC Gabler, ‘Evaluation of Current Repair Criteria for Longitudinal Barrier with Crash Damage’, Journal of
Transportation Engineering, 2009 135 (4) 225-234. 6 NCAC, NCAC Finite Element Archive, http://www.ncac.gwu.edu/vml/models.html, Accessed 2/21/2009.
7 RP Bligh, NR Seckinger, AY Abu-Odeh, PN Roschke, WL Menges, and RR Haug, Dynamic Response of Guardrail
Systems Encased in Pavement Mow Strips, FHWA/TX-04/0-4162-2, Texas Transportation Institute 2004. 8 LSTC, LS-DYNA Keyword User’s Manual Version 970, Livermore Software Technology Corporation, 2003.
9 AE Wright and M Ray, Characterizing Roadside Hardware Materials for LS-DYNA3D Simulations, FHWA-RD-96-108,
Federal Highways Administration, 1996. 10 MH Ray, CA Plaxico, and K Engstrand, ‘Performance of W-Beam Splices’, Transportation Research Record 1743, 2001
120-125.