cre lab manuals
DESCRIPTION
creTRANSCRIPT

NATIONAL INSTITUTE OF TECHNOLOGY, TIRUCHIRAPPALLI – 15
DEPARTMENT OF CHEMICAL ENGINEERING
CHEMICAL REACTION ENGINEERING LABORATORY MANUAL

Department of Chemical Engineering 1
Experiments Order
1) Adiabatic Reactor
2) Batch Reactor –I
3) Batch Reactor –II
4) Mixed Flow Reactor
5) Mixed Flow Reactor in Series
6) Plug Flow Reactor
7) Mixed Flow Reactor followed by Plug Flow Reactor
8) RTD Studies in a Plug Flow Reactor
9) RTD studies in a Mixed Flow Reactor

Department of Chemical Engineering 2
ADIABATIC REACTOR
Aim:
To study the effect of temperature on the rate of reaction between hydrogen peroxide
and sodium thiosulphate under adiabatic reaction conditions and to determine the activation
energy of the reaction.
Theory:
The effect of temperature on the reaction mixture consisting of hydrogen peroxide and
sodium thiosulphate when the reaction is carried out under adiabatic conditions, it can be
observed and correlation with the reaction rate is given. As the exothermic reaction proceeds,
the temperature increases and becomes constant. The rate of the reaction and temperature are
correlated to various temperatures.
Where
TF – Final Temperature (°C)
T0 – Initial Temperature (°C)
K – Rate constant
CA0 – Initial concentration (moles/ litre)
A graph is drawn between lnA Vs.1/T and the slope is equated to -E/R.
Procedure:
Take 30 ml of hydrogen peroxide in a beaker and dilute it into 300 ml by using distilled
water and pour it into the reactor, 300 ml of sodium thiosulphate solution will also be added
in the reactor. Due to exothermic reaction, the temperature of reaction mixture starts
increasing, the rise in temperature is noted at different time intervals as the reaction proceeds.
Tabulation:
Time (sec) Temperature
(°C)
dT/dt (Ts – T)2 1/(T+273)
(k-1)
A ln A
0F
RTEA0
2f TT
KC
dt
dT
TT
1 e

Department of Chemical Engineering 3
Model Graph:
Model Calculation:
1) t =
2) T =
3) dt
dT
4) (Tf – T)2=
5) 2
f
3
T)(T
10
dt
dTA
=
6) lnA =
7) 273)(T
1
=
8) E= -slope x R=
Result and Inferences:
--------------
Slope = -E/R
1/T (k-1) x 0 ln
A
T°C
Time (s)

Department of Chemical Engineering 4
BATCH REACTOR -1
Aim:
To verify the order and to determine the rate constants for the reaction between
equimolar quantity of NaOH and ethyl acetate in a batch reactor.
Reaction:
NaOH + CH3COOC2H5 CH3COONa + C2H5OH
Theory:
For a second order reaction, the rate of reaction is as follows
2A
AKC
dt
dC
Integrating,
A
A
A
C
CA
C
CAA
A
x1
x
KC
1t
C1
K
1
KC
dCt
0
A
A0
A
0
2
Procedure:
500 ml of NaOH and 500 ml of ethyl acetate are taken in the batch reactor with the
starting and stop water. Then each 10 ml of the reaction mixture is taken every 5 minutes the
reaction is arrested by adding acetic acid to the sample. The reaction mixture is titrated
against sodium hydroxide of known normality and its concentration found. Samples are taken
up to 50 minutes and the concentration of the reactor is found.
Standard Data:
Normality of NaOH=
Normality of CH3COOC2H5=
Normality of CH3COOH=
Tabulation:
S.No. Reaction
Time (min)
Volume of
NaOH (ml)
Naormality
of NaOH (N)
CA
(mol/lit)×10 -3
1/CA
(lit/mol)
XA
A
A
X1
X
1 5
2 10
3 15
4 20
5 25
6 30
7 35
8 40
9 45
10 50

Department of Chemical Engineering 5
Model Graph:
Model Calculation:
1) 2
NC
NaOHA0 =
2) VolumeSample
addedNaOHofmolesaddedCOOHCHofmolesC
3A
=
3) AC
1=
4) 0
0
A
AAA
C
CCX
=
5) A
A
X1
X
Result:
Thus the experiment on batch reactor was performed. The value of K found from
graph.
1/CA vs t =
XA /(1-XA) vs t =
----------
t
k AC1
0AC1
0 x
t x
0
kCA0
y y
A
A
X-1
X

Department of Chemical Engineering 6
BATCH REACTOR – II
Aim:
To verify the order and to determine the rate constants for the reaction between non-
equimolar quantity of NaOH and ethyl acetate in a batch reactor.
Reaction:
NaOH + CH3COOC2H5 CH3COONa + C2H5OH
Theory:
In a batch reactor, the composition of the components is uniform throughout at any
instant of time
A
A
AB
BA A
0A
AA
X1m
Xmln
)C-K(C
1
CKCr-
ProductsB)(Afor
)(-r
kXCt
00
XA
0
Procedure:
400 ml of NaOH and 800 ml of ethyl acetate of known concentration are taken in the
reactor. Samples (10ml) are drawn for every 5 minutes from the reactor up to 50 minutes. The
concentration of reactants in the sample is found out by adding 10 ml of acetic acid and
titrating against sodium hydroxide.
Standard Data:
Normality of NaOH=
Normality of CH3COOC2H5=
Normality of CH3COOH=
Tabulation:
S.No. Reaction
Time (min)
Volume of
NaOH (ml)
Naormality
of NaOH (N)
CA
(mol/lit)×10 -3
CBo
(mol/lit)
XA
)Xm(1
Xmln
A
A
1 5
2 10
3 15
4 20
5 25
6 30
7 35
8 40
9 45
10 50
Model Graph:

Department of Chemical Engineering 7
Model Calculation:
1) total
NaOHNaOHA
V
NVC 0
=
2)
VolumeTotal
VNVNC
NaOHA.AA
=
3) total
EAEAB
V
NVC 0
=
4) 0
0
A
B
C
CM =
5) 0
0
A
AAA
C
CCX
=
6) 00 AB CC
SlopeK
=
Result:
Thus the experiment on batch reactor – II was performed. The value of k found the
graph is
------------
Time (min) x
0
Slope = K (CB0 – CA0)
y
A
A
X1m
Xmln
Department of Chemical Engineering 8
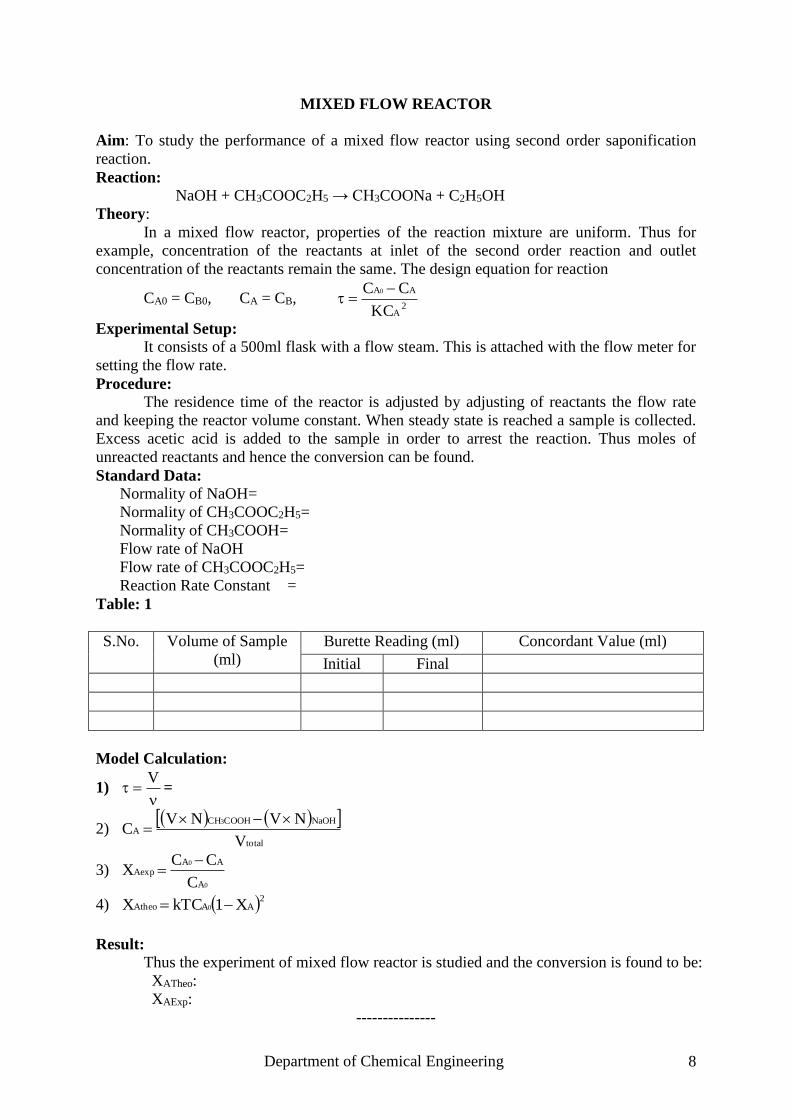
MIXED FLOW REACTOR
Aim: To study the performance of a mixed flow reactor using second order saponification
reaction.
Reaction:
NaOH + CH3COOC2H5 → CH3COONa + C2H5OH
Theory:
In a mixed flow reactor, properties of the reaction mixture are uniform. Thus for
example, concentration of the reactants at inlet of the second order reaction and outlet
concentration of the reactants remain the same. The design equation for reaction
CA0 = CB0, CA = CB, 2
A
AA
KC
CC 0
Experimental Setup:
It consists of a 500ml flask with a flow steam. This is attached with the flow meter for
setting the flow rate.
Procedure: The residence time of the reactor is adjusted by adjusting of reactants the flow rate
and keeping the reactor volume constant. When steady state is reached a sample is collected.
Excess acetic acid is added to the sample in order to arrest the reaction. Thus moles of
unreacted reactants and hence the conversion can be found.
Standard Data:
Normality of NaOH=
Normality of CH3COOC2H5=
Normality of CH3COOH=
Flow rate of NaOH
Flow rate of CH3COOC2H5=
Reaction Rate Constant =
Table: 1
S.No. Volume of Sample
(ml)
Burette Reading (ml) Concordant Value (ml)
Initial Final
Model Calculation:
1)
V
=
2)
total
NaOHCOOHCHA
V
NVNVC
3
3) 0
0
A
AAAexp
C
CCX
4) 2AAAtheo X1kTCX 0
Result: Thus the experiment of mixed flow reactor is studied and the conversion is found to be:
XATheo:
XAExp:
---------------
Department of Chemical Engineering 9
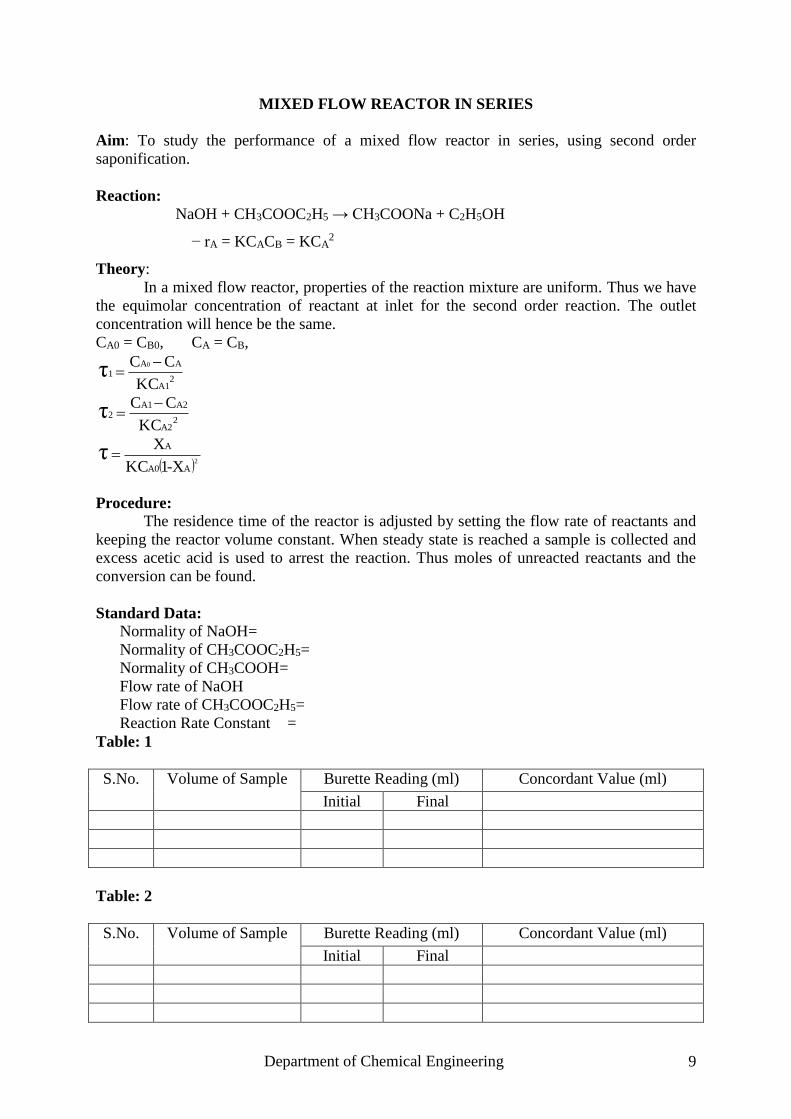
MIXED FLOW REACTOR IN SERIES
Aim: To study the performance of a mixed flow reactor in series, using second order
saponification.
Reaction:
NaOH + CH3COOC2H5 → CH3COONa + C2H5OH
− rA = KCACB = KCA2
Theory:
In a mixed flow reactor, properties of the reaction mixture are uniform. Thus we have
the equimolar concentration of reactant at inlet for the second order reaction. The outlet
concentration will hence be the same.
CA0 = CB0, CA = CB,
2A1
AA1
KC
CC 0τ
2A2
A2A12
KC
CCτ
2AA0
A
X-1KC
Xτ
Procedure: The residence time of the reactor is adjusted by setting the flow rate of reactants and
keeping the reactor volume constant. When steady state is reached a sample is collected and
excess acetic acid is used to arrest the reaction. Thus moles of unreacted reactants and the
conversion can be found.
Standard Data:
Normality of NaOH=
Normality of CH3COOC2H5=
Normality of CH3COOH=
Flow rate of NaOH
Flow rate of CH3COOC2H5=
Reaction Rate Constant =
Table: 1
S.No. Volume of Sample Burette Reading (ml) Concordant Value (ml)
Initial Final
Table: 2
S.No. Volume of Sample Burette Reading (ml) Concordant Value (ml)
Initial Final

Department of Chemical Engineering 10
Model Calculation:
NaOH
COOHCHCOOHCHNaOH
V
NVN
33
At steady state in Reactor I
Volume
NVNVC
NaOHCOOHCHA
3
1
0
10
1
A
AAA
C
CCX
At steady state in Reactor II
Volume
NVNVC
NaOHCOOHCHA
3
2
0
20
2
A
AAA
C
CCX
Theoretical conversion:
Reactor I:
11
Vτ
21
AA0
A1
X-1KC
Xτ
Reactor II:
22
Vτ
212
AA0
AA2
X-1KC
X-Xτ
Result: Thus the experiment of mixed flow reactor in series is studied and the conversion is
found to be:
Reactor 1
XA,Theo :
XA,Exp :
Reactor 2
XA,Theo :
XA,Exp :
---------

Department of Chemical Engineering 11
PLUG FLOW REACTOR
Aim:
To study the performance of the plug flow reactor for the second order reaction of
saponification of ethyl acetate.
Reaction:
NaOH + CH3COOC2H5 → CH3COONa + C2H5OH
0A
0A
A
A
A
A
C
CA
C
CAA
A
CK1
CKX
x1
x
KC
1t
C1
K
1
KC
dCt
0
A
A0
A
0
2
Experimental setup:
It consists of a transparent tube provided with glass beads ( = 0.04) sampling can be
done at different points all along the length of the tube.
Procedure:
NaOH and CH3COOC2H5 solution of equal flow rate is allowed to enter at a constant
flow rate until steady state is reached. When the inlet flow rate equals the outlet flow rate, the
steady state is said to be attained. Samples are collected at different position, acetic acid is
added to arrest the reaction. The concentration of unreacted NaOH and conversion in the
mixture is noted.
Standard Data:
Normality of NaOH=
Normality of CH3COOC2H5=
Normality of CH3COOH=
Flow rate of NaOH
Flow rate of CH3COOC2H5=
Reaction Rate Constant =
Tabulation:
S.No Reactor volume
(ml)
Space time
(min)
Titrant
volume (ml)
CA (N)
×10 – 3
XA (%)
(expt.)
XA (%)
(theo)
Model Graph:

Department of Chemical Engineering 12
Model Calculation:
1) Initial Concentration= NNaOH/2
2) 0V
Vτ
3)
Volume
NVNVC
NaOHCOOHCHA
3
4) 0A
AAexp
C
C1X
5) 0
0
A
AAtheo
KC1
KCX
ττ
Result: Thus the performance of plug flow reactor under constant flow rate is studied and
necessary graphs are drawn.
-----------
Theoretical
Experimental
XA
x 0
y
Time
Department of Chemical Engineering 13
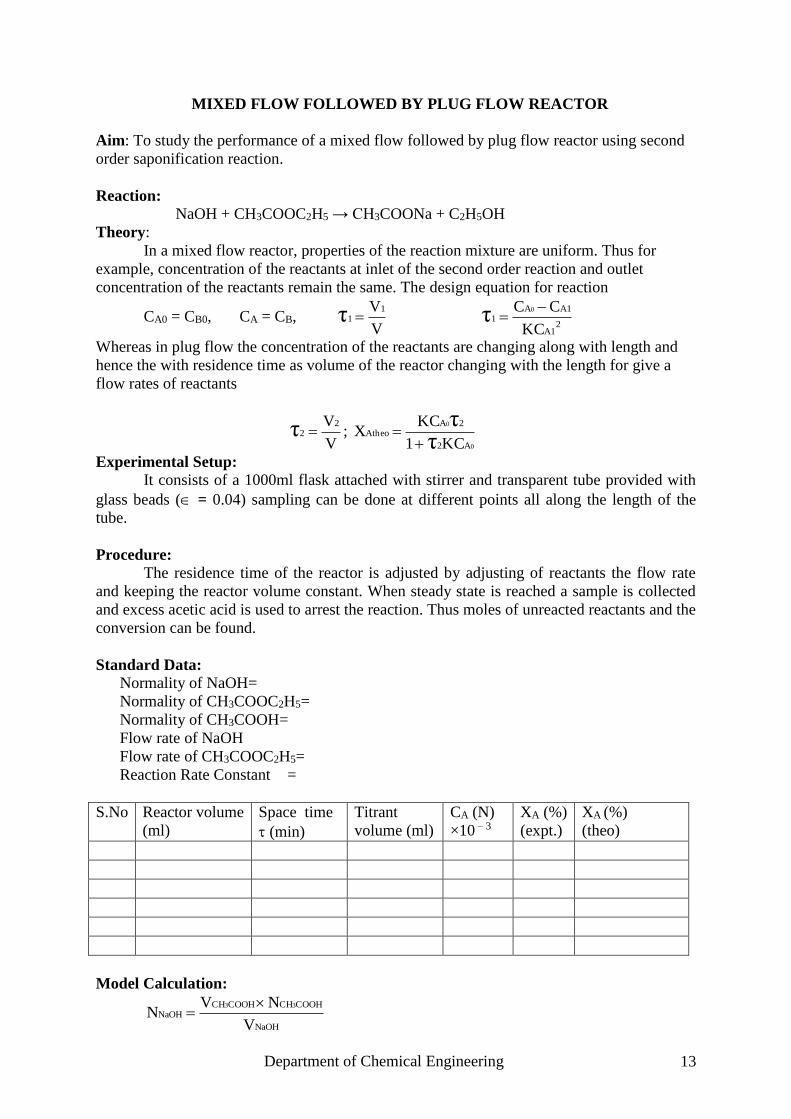
MIXED FLOW FOLLOWED BY PLUG FLOW REACTOR
Aim: To study the performance of a mixed flow followed by plug flow reactor using second
order saponification reaction.
Reaction:
NaOH + CH3COOC2H5 → CH3COONa + C2H5OH
Theory:
In a mixed flow reactor, properties of the reaction mixture are uniform. Thus for
example, concentration of the reactants at inlet of the second order reaction and outlet
concentration of the reactants remain the same. The design equation for reaction
CA0 = CB0, CA = CB, V
V11τ
2A1
A1A1
KC
CC 0τ
Whereas in plug flow the concentration of the reactants are changing along with length and
hence the with residence time as volume of the reactor changing with the length for give a
flow rates of reactants
V
V22τ ;
0
0
A2
2AAtheo
KC1
KCX
ττ
Experimental Setup:
It consists of a 1000ml flask attached with stirrer and transparent tube provided with
glass beads ( = 0.04) sampling can be done at different points all along the length of the
tube.
Procedure: The residence time of the reactor is adjusted by adjusting of reactants the flow rate
and keeping the reactor volume constant. When steady state is reached a sample is collected
and excess acetic acid is used to arrest the reaction. Thus moles of unreacted reactants and the
conversion can be found.
Standard Data:
Normality of NaOH=
Normality of CH3COOC2H5=
Normality of CH3COOH=
Flow rate of NaOH
Flow rate of CH3COOC2H5=
Reaction Rate Constant =
S.No Reactor volume
(ml)
Space time
(min)
Titrant
volume (ml)
CA (N)
×10 – 3
XA (%)
(expt.)
XA (%)
(theo)
Model Calculation:
NaOH
COOHCHCOOHCHNaOH
V
NVN
33

Department of Chemical Engineering 14
At steady state in Reactor I
Volume
NVNVC
NaOHCOOHCHA
3
1
0
10
1
A
AAA
C
CCX
At steady state in Reactor II
Volume
NVNVC
NaOHCOOHCHA
3
2
0
20
2
A
AAA
C
CCX
Theoretical conversion:
Reactor I:
V
V11τ
21
AA0
A1
X-1KC
Xτ
Reactor II:
V
V22τ
4) 0
0
A2
2AAtheo
KC1
KCX
ττ
Result: Thus the performance of mixed flow followed by plug flow reactor under constant flow
rate is studied and necessary graphs are drawn.
----------
Theoretical
Experimental
XA
x 0
y
Time

Department of Chemical Engineering 15
RTD STUDIES IN A PLUG FLOW REACTOR
Aim:
To study the behavior of a plug flow reactor by RTD studies.
Theory:
Elements of fluid taking different routes through the reactor may take different lengths
of time to pass through the vessel. The distribution of these times for the stream of fluid
leaving the vessel is called the exit age distribution E, or the residence time distribution
(RTD) of the fluid. From E mean residence time, flow pattern, model parameters can be
evaluated.
Procedure:
In a plug flow reactor, a tube packed with particles is used. To start with reactor is
filled with 0.05N of NaOH Water flow is allowed from a water tank above the reactor. The
variation of concentration of sodium hydroxide in the each taping point is noted. The
dispersion number is obtained from the graph.
Standard Data:
Normality of CH3COOH =
Flow rate of Water =
Normality of NaOH (Nmax) =
Formulae:
1) ΔtiEtt ii
2) 2
ii2
i2 tΔtEtσ
3) 2
2
0
t
σσ 2
4) 2
σ
UL
D 20
5) N
1σ 2
0
where,
timeresidencemeant
varianceσ2
∆ti = time interval
numberDispersionUL
D
Tabulation:
Time
(min)
VCH3COOH
(ml)
NNaOH
max
NaOH
N
NF
dt
dFEi
Eiti Eiti2

Department of Chemical Engineering 16
Model Graph:
Model Calculation:
1) 1 NNaOH =
2) maxN
NF
3) F = y (t)
4) dt
dFE
5) ΔtiEtt ii
6) 2
ii2
i2 tΔtEtσ
7) 2
2
0
t
σσ 2
8) 2
σ
UL
D 20
9) N
1σ 2
0
Result:
Thus, the experiment of plug flow RTD was conducted and the dispersion number and
N were calculated.
F E
y y
x x t t
Department of Chemical Engineering 17
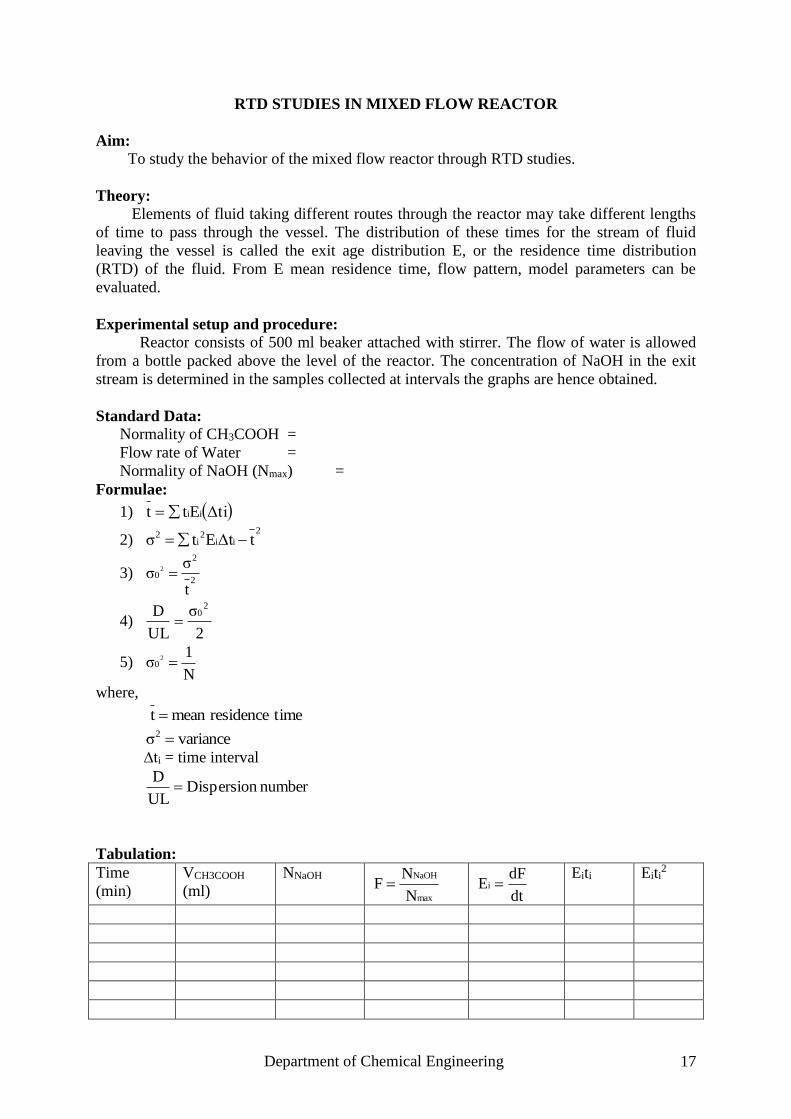
RTD STUDIES IN MIXED FLOW REACTOR
Aim: To study the behavior of the mixed flow reactor through RTD studies.
Theory:
Elements of fluid taking different routes through the reactor may take different lengths
of time to pass through the vessel. The distribution of these times for the stream of fluid
leaving the vessel is called the exit age distribution E, or the residence time distribution
(RTD) of the fluid. From E mean residence time, flow pattern, model parameters can be
evaluated.
Experimental setup and procedure: Reactor consists of 500 ml beaker attached with stirrer. The flow of water is allowed
from a bottle packed above the level of the reactor. The concentration of NaOH in the exit
stream is determined in the samples collected at intervals the graphs are hence obtained.
Standard Data:
Normality of CH3COOH =
Flow rate of Water =
Normality of NaOH (Nmax) =
Formulae:
1) ΔtiEtt ii
2) 2
ii2
i2 tΔtEtσ
3) 2
2
0
t
σσ 2
4) 2
σ
UL
D 20
5) N
1σ 2
0
where,
timeresidencemeant
varianceσ2
∆ti = time interval
numberDispersionUL
D
Tabulation:
Time
(min)
VCH3COOH
(ml)
NNaOH
max
NaOH
N
NF
dt
dFEi
Eiti Eiti2

Department of Chemical Engineering 18
Model Graph:
Model Calculation:
1) maxN
NF
2) F = y (t)
3) dt
dFE
4) ΔtiEtt ii
5) 2
ii2
i2 tΔtEtσ
6) 2
2
0
t
σσ 2
7) 2
σ
UL
D 20
8) N
1σ 2
0
Result:
Thus, the experiment of mixed flow RTD was conducted and the dispersion number
and N were calculated.
--------------
F C
y y
x x t t
x’ x’
y’ y’