creating a private market for ecosystem services: results ... · ecosystem services: results from...
TRANSCRIPT

11
Creating a Private Market for Creating a Private Market for Ecosystem Services: Results from Ecosystem Services: Results from
Selling Hayfield Services for Selling Hayfield Services for Grassland Nesting BirdsGrassland Nesting Birds
Stephen K. SwallowStephen K. SwallowEmi UchidaEmi Uchida
Christopher M. AndersonChristopher M. AndersonUniversity of Rhode IslandUniversity of Rhode Island
Environmental and Natural Resource Environmental and Natural Resource EconomicsEconomics
Conservation Innovation Grant

22
The Public Good ChallengeThe Public Good Challenge
• Ecosystem Services often Public Goods• Strategic advantage of “free riding”
– “Free ride” or “cheap ride”= under-donate or under-pay
relative to personal benefit• But people do donate, despite theory

33
Market Goods Market Goods –– Private, ExclusionPrivate, Exclusion
$ per unit
Quantity (e.g., kg shellfish to eat)
Consumers value first few units (to eat) highly, but value next units less highly.
Excludability in consumption: Only one consumer can use each unit. – Aggregate Demand
Supply – starts with some cost of production, rising as more is produced.
Market Price
With excludability, providers get incentive to provide.
Law of one Price – all pay same
44
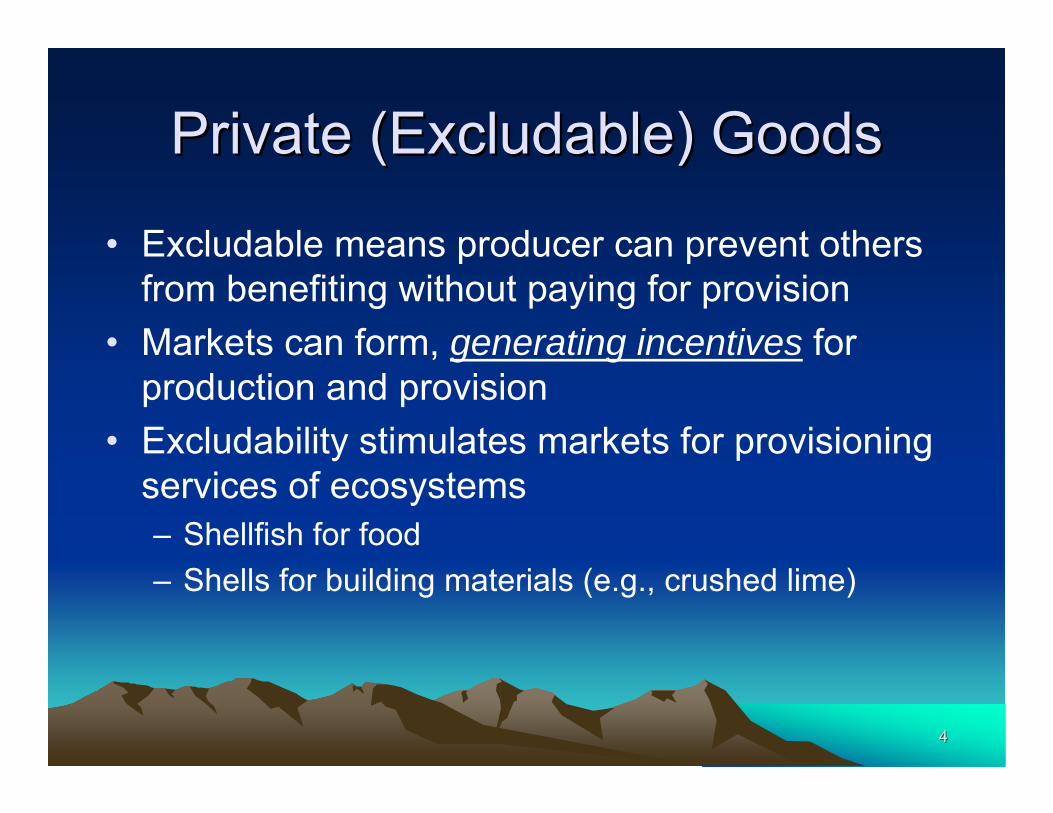
Private (Excludable) GoodsPrivate (Excludable) Goods
• Excludable means producer can prevent others from benefiting without paying for provision
• Markets can form, generating incentives for production and provision
• Excludability stimulates markets for provisioning services of ecosystems– Shellfish for food– Shells for building materials (e.g., crushed lime)

55
Public Goods Public Goods –– nonnon--excludable, excludable, benefit many people simultaneouslybenefit many people simultaneously
Quantity (e.g., environmental restoration)
$ per unit
Individualized Prices, Value(example shows prices for two people)
Single person values water quality initially high, with declining value.
Additional person gains value from same units.
Society’s value of each increment in service reflects the sum across individuals.
If one person pays for a unit, others still benefit. People can “ride free” on providers.
Generally, market cannot form: providers cannot collect payment.

66
ResultResult
• Too few ecosystem services• Society values ecosystem services more
than the resources needed to increase provision
• Too little (1) production or (2) protection

77
Government and Philanthropic Government and Philanthropic approachesapproaches
• Leaves consumer values administratively attenuated
• Government Costs of administration– Bureaucratic flexibility– Spatial, temporal
• Philanthropic free riding– Broad or open-ended projects diffuse
consumer/beneficiary value, with less focus on specific public goods

88
Market Approach: Private ProvisionMarket Approach: Private Provision
• Public good = Impossible?• Integrate consumer/beneficiary values• Nimble entrepreneurship
– Direct link between Ecosystem Service desired and payments from households
• Start with 2nd Best Approaches: More efficient? (Improvement?)

99
Solving the ChallengeSolving the Challenge
• Design rules of trade and pricing that:– Reduce incentives to free ride– Enable providers to benefit more fully from other
people’s values
• Economics Experiments have shown– Incentives can increase contributions– Dirty details: simplicity, trust and cooperation– Provision first: Second Best before First Best

1010
Selling Farm Ecosystem ServicesSelling Farm Ecosystem Services
• USDA/Conservation Innovation Grant
• For-profit farm product– Grassland bird habitat– Bobolinks on hayfields– Farm contract– Sell share to residents

1111
Experimental MarketExperimental Market
• A deliverable public good– Late May to early July:
• Hay at peak nutritional value• Bobolinks / grassland birds nesting
• Identifiable group of potential beneficiaries– Ex-urban residents value landscape and
wildlife or ecosystem health

1212
Why residents buy bobolinks?
1. Generally value wildlife and ecosystem health in rural town
2. Product encourages farm hayfields = pastoral views
3. Sustain active farm heritage
Potential Umbrella Bundle:
4. Restoration from idle fields = remove invasive species, adds views (butterfly connection)
5. Potential water quality/quantity links relative to alternative crops
Visible bird
Species in decline
Acrobatic call display
R-2-D-2

1313
Features of Revenue MechanismsFeatures of Revenue Mechanisms
• Group of potential beneficiaries
• Money back guarantee (MBG)– One increment
• Establish “Provision Point”= the cost of farm contract for wildlife-friendly hayfield= minimum target for funds
• Provision Point, MBG = threat of non-provision

1414
Mechanism 1: Proportional Rebate Mechanism 1: Proportional Rebate (PR)(PR)
• Individual: pledge to maximum payment– Pay only proportion needed for provision point
• Example: Person pledges $50 and all pledges total $5000 but contract cost is $2500 --- then person only pays $25– Incentives reduce cost of pledging beyond
marginal need

1515
Mechanism 2: Uniform Price Auction Mechanism 2: Uniform Price Auction (UPA)(UPA)
• Pledge to maximum payment– Broker calculates a uniform-price $P to meet
the Provision Point (contract cost)– Pledged >$P? Pay uniform price $P– Pledged <=$P? Pay nothing
• Incentives create more separation between pledge and final payment– Fair? All payers pay the same “uniform price”

1616
Mechanism 3: Uniform Price Cap Mechanism 3: Uniform Price Cap (UPC)(UPC)
• Modification of UPA• Broker still calculates $P—a Price-Cap—
to meet the Provision Point– Pledged >$P? Pay $P Price-cap– Pledged <=$P? Pay amount pledged/offered
• Address part of reaction to rebates/refunds• UPC meets ProvPoint met by PropRebate

1717
Pledge ($)
Pledge ($)
Number of individuals Number of individuals
Reb
ate
Pay
men
t
Pay
men
t ($P
)Revenue
UPA Revenue
Proportional Rebate (PR) Mechanism
Uniform Price Auction/Cap (UPA/UPC) Mechanisms
UPC Revenue
Revenue-generating mechanisms set revenue = Provision Point
or implement money-back-guarantee

1818
Mechanism 4: Pivotal MechanismMechanism 4: Pivotal Mechanism(PM)(PM)
• Incentive compatible• Designed to measure value (check efficiency)
• Each person makes offer $xi
• Pay if “pivotal” – if your $Xi just makes total reach provision point:– Pay $Xi if Σ X≠i<P <Σ X≠i + Xi
Pay $0 otherwise

1919
Newspaper Advertisement

2020
Trademark
Web Site

2121
Brochure for Direct Mail Marketing

2222

2323
Offer to recipient:
Field description
Mechanism described(UPC version)
Discrete Choice (yes-no)
(Open-ended modified “payment card”)
Credit Card authorization or personal check

2424
Direct Mail Marketing Direct Mail Marketing –– ResponseResponse
• March-April (07-08)- 2 mailings + reminder• Jamestown Press advertising from Feb.• Inform farmers by May 7• Hayfields (if provided) protected 6 weeks
(late May to Early July) – no mowing• About 2750 deliverable homes
– 2007: 371 respond, 189 offers = $9700– 2008: 212 respond, 143 offers = $6800

2525
Participation Decision by ProbitParticipation Decision by Probit(sent a reply, with or without money)(sent a reply, with or without money)
Variable Coefficient Std. Err. P<Year 2008 -0.5761 0.0709 0.001ln (Minimum Amount Presented) -0.1031 0.04634 0.026Made an offer in 2007 0.6520 0.1717 0.001ln (purchase power) 0.1095 0.06559 0.095Age 0.01514 0.003553 0.001Donate to any cause 0.2460 0.09150 0.007Donate to environmental cause 0.2219 0.1258 0.078Mail order for kids -0.1887 0.09619 0.050Income missing 2.698 0.7523 0.001Missing info on environ., health 0.5506 0.3364 0.102Missing info on mail order kids -1.916 0.6972 0.006Constant -2.644 0.4300 0.001

2626
Participation InsightsParticipation Insights
• More likely to respond if:– Previous donor to various charity– Higher income (or didn’t tell income)
• 2007 Participation more likely than 2008• Made no difference:
– Attributes of bobolink parcels– Rules-of-trade except:
• Higher participation with lower minimum $ amount requested

2727
Estimated Willingness to Pay by IntervalEstimated Willingness to Pay by Interval--Regression: Parcel and Individual CharacteristicsRegression: Parcel and Individual Characteristics
Variable Coefficient Std. Err. P<Acres 0.2761 1.082 0.80View 8.701 7.043 0.22N bobolink territories -3.017 2.916 0.31N fledglings 2.170 1.001 0.03ln (purchase power) 8.358 5.493 0.13Participated in 2007 -26.10 10.56 0.015Age -0.6262 0.3439 0.07Donated to charity before -8.556 7.668 0.27Mail-order for kids before -17.52 8.334 0.04Income missing 12.88 38.07 0.74Self-selection bias (imr) -27.04 16.56 0.11
2828
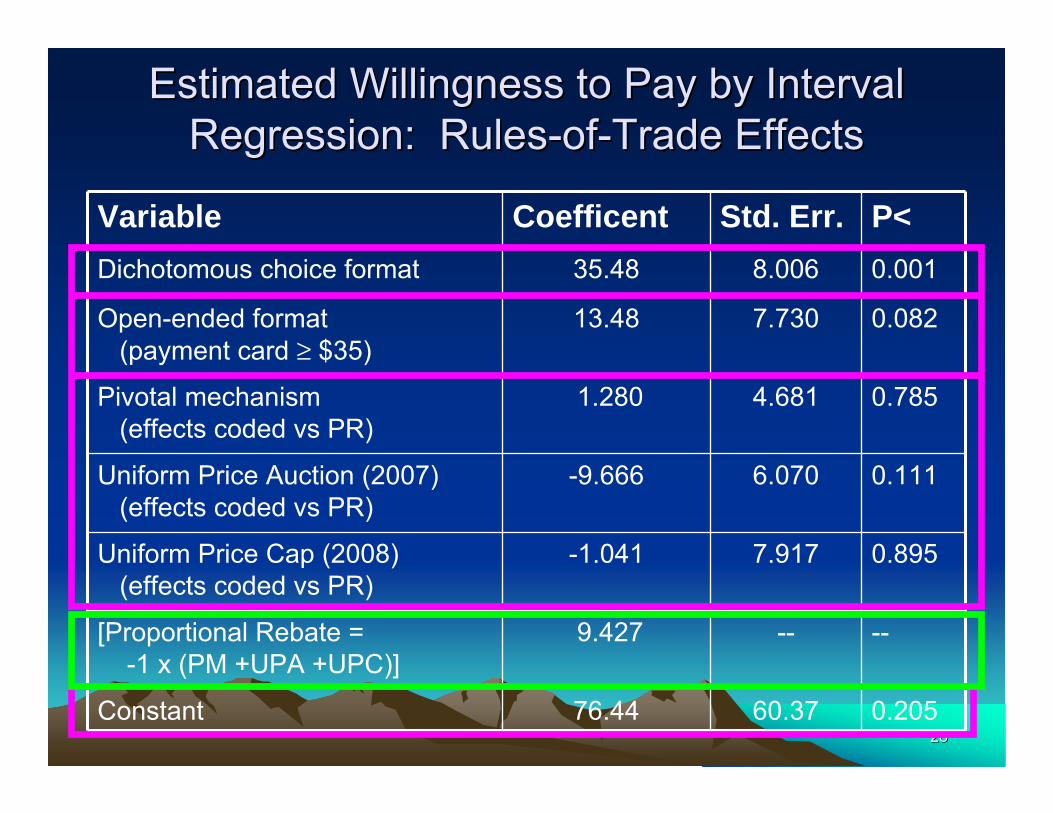
Estimated Willingness to Pay by Interval Estimated Willingness to Pay by Interval Regression: RulesRegression: Rules--ofof--Trade EffectsTrade Effects
Variable Coefficent Std. Err. P<Dichotomous choice format 35.48 8.006 0.001
Open-ended format (payment card ≥ $35)
13.48 7.730 0.082
Pivotal mechanism (effects coded vs PR)
1.280 4.681 0.785
Uniform Price Auction (2007)(effects coded vs PR)
-9.666 6.070 0.111
Uniform Price Cap (2008) (effects coded vs PR)
-1.041 7.917 0.895
[Proportional Rebate = -1 x (PM +UPA +UPC)]
9.427 -- --
Constant 76.44 60.37 0.205

2929
Percent of 2007 Participants with WTP > Amount, in Discrete Choice
0
10
20
30
40
50
60
70
80
90
100
0 10 20 30 40 50 60 70 80 90 100Amount ($)
% o
f Par
ticip
ants
ProportionalRebatePivotalMechanismUniform PriceAuctionUniform PriceCap
70%$60
$52
$41

3030
Percent of 2007 Participants with WTP > Amount, in Open-Ended High (In data, request >$35 or fill-in-the-blank)
0
10
20
30
40
50
60
70
80
90
100
0 10 20 30 40 50 60 70 80
Amount ($)
Perc
ent o
f Par
ticip
ants
ProportionalRebatePivotalMechanismUniform PriceAuctionUniform PriceCap
70%
$38
$29
$27

3131
Projected 2007 Revenue per 100 Participant, in Discrete Choice
0
500
1000
1500
2000
2500
3000
3500
4000
4500
5000
0 10 20 30 40 50 60 70 80 90 100Amount ($)
Rev
enue
($)
ProportionalRebatePivotalMechanismUniform PriceAuctionUniform PriceCap

3232
Projected 2007 Revenue per 100 Participants, in Open-Ended High (In data, requested $35 or more or fill-in-the-blank)
0
500
1000
1500
2000
2500
3000
0 10 20 30 40 50 60 70 80Amount ($)
Rev
enue
($)
Proportional RebatePivotal MechanismUniform Price AuctionUniform Price Cap

3333
Percentage of 2008 Participants WTP > Amount, in Discrete Choice
0
10
20
30
40
50
60
70
80
90
100
0 10 20 30 40 50 60 70 80 90 100Amount ($)
Perc
enta
ge o
f Par
ticic
pant
s
ProportionalRebatePivotalMechanismUniform PriceAuctionUniform PriceCap
70%
$62
$56
$52

3434
Percent of 2008 Participants with WTP > Amount, in Open-Ended High (In data, minimum $35 or fill-in-the-blank)
0
10
20
30
40
50
60
70
80
90
100
0 10 20 30 40 50 60 70 80Amount ($)
Perc
ent o
f Par
ticip
ants
ProportionalRebatePivotalMechanismUniform PriceAuctionUniform PriceCap

3535
Projected 2008 Revenue per 100 Participants in 2008, with Discrete Choice
0
500
1000
1500
2000
2500
3000
3500
4000
4500
5000
0 10 20 30 40 50 60 70 80 90 100Amount ($)
Rev
enue
($)
ProportionalRebatePivotalMechanismUniform PriceAuctionUniform PriceCap

3636
Projected 2008 Revenues per 100 Participants, in Open-Ended High (In data, minimum >$35 or fill-in-the-blank)
0
500
1000
1500
2000
2500
3000
0 10 20 30 40 50 60 70 80
Amount ($)
Rev
enue
($)
ProportionalRebate
PivotalMechanism
Uniform PriceAuction
Uniform PriceCap

3737
Preliminary SummaryPreliminary Summary
• Field differs from Lab for PR vs. PM– Change in marketing:
clarity, trust (gimmick)– Negative reaction to
rebates/refunds in 2007• Proportional Rebate
most promising initially

3838
Discussion: PreliminaryDiscussion: Preliminary
• Long-run performance may be different– Will PR degrade toward free-riding outcome (and failure) over
time?– Will UPA remain more stable over time?– Does UPC encourage participation that nets higher offers?
• Public frame of reference– Use of excess funds: Extra field, second field– Community connection– Cross-group benefits
• Long-term Challenges: Fluid, arms-length market

3939
Ecosystem Service MarketsEcosystem Service Markets• Bundling multiple goods: birds & water &
views & . . . .• Tradeoffs between generic markets versus
local markets– Carbon on Chicago Climate Exchange versus
carbon in local ecosystem restoration which spins off additional benefits
• Blending consumer values into incentive payment programs (CRP matching funds)

4040
Value and Production EcologyValue and Production Ecology
• How to bundle services in contracts;• Water quality, birds, landscape/scenic
• Production of ecosystem services• Attract/guide bobolinks via audio calls• Rotations for birds and hayfield quality (farmer concerns)• Restoration of idle fields
– Black swallow wort and butterflies– Pastoral views
• How will market affect ecosystem services in long term, with what side effects?

4141
Other applicationsOther applications• Sea grass restoration
– Lagoon sedimentation control (water quality)– Fish, waterfowl habitat and recreation– Links to carbon sequestration
• Oyster restoration (nutrients; water quality)• Carbon sequestration through market credits• Virginia Coastal Reserve (NSF LTER)