creating and measuring a compelling path to purchase
TRANSCRIPT

CREATING AND MEASURING A COMPELLING PATH TO PURCHASE

ABOUT ME
Marketing, Analysis, & Product Management for…
• SourceKnowledge
• Keeward Ventures
• Frank & Oak
JUSTIN ADLER @thejustinadler
My projects have been featured by…
• VentureBeat • Tech Crunch • Fast Company • SXSW Interactive

THIS IS NOT HOW ECOMMERCE WORKS

WHERE NEW PURCHASERS COME FROM
9%
45%
27%
18%
DirectOrganicPaidOther
OBSERVATIONS
• Websites aren’t physical spaces, so you can’t depend on foot traffic.
• Organic traffic is free (yay!) but is hard to scale and measure. You could spend a lot of time on a campaign and get anemic results.
• Paid traffic is scalable but can be extremely expensive (not yay!). You could spend a lot of money and get bad traffic.
WHY YOU NEED TO INVEST IN ACQUISITION
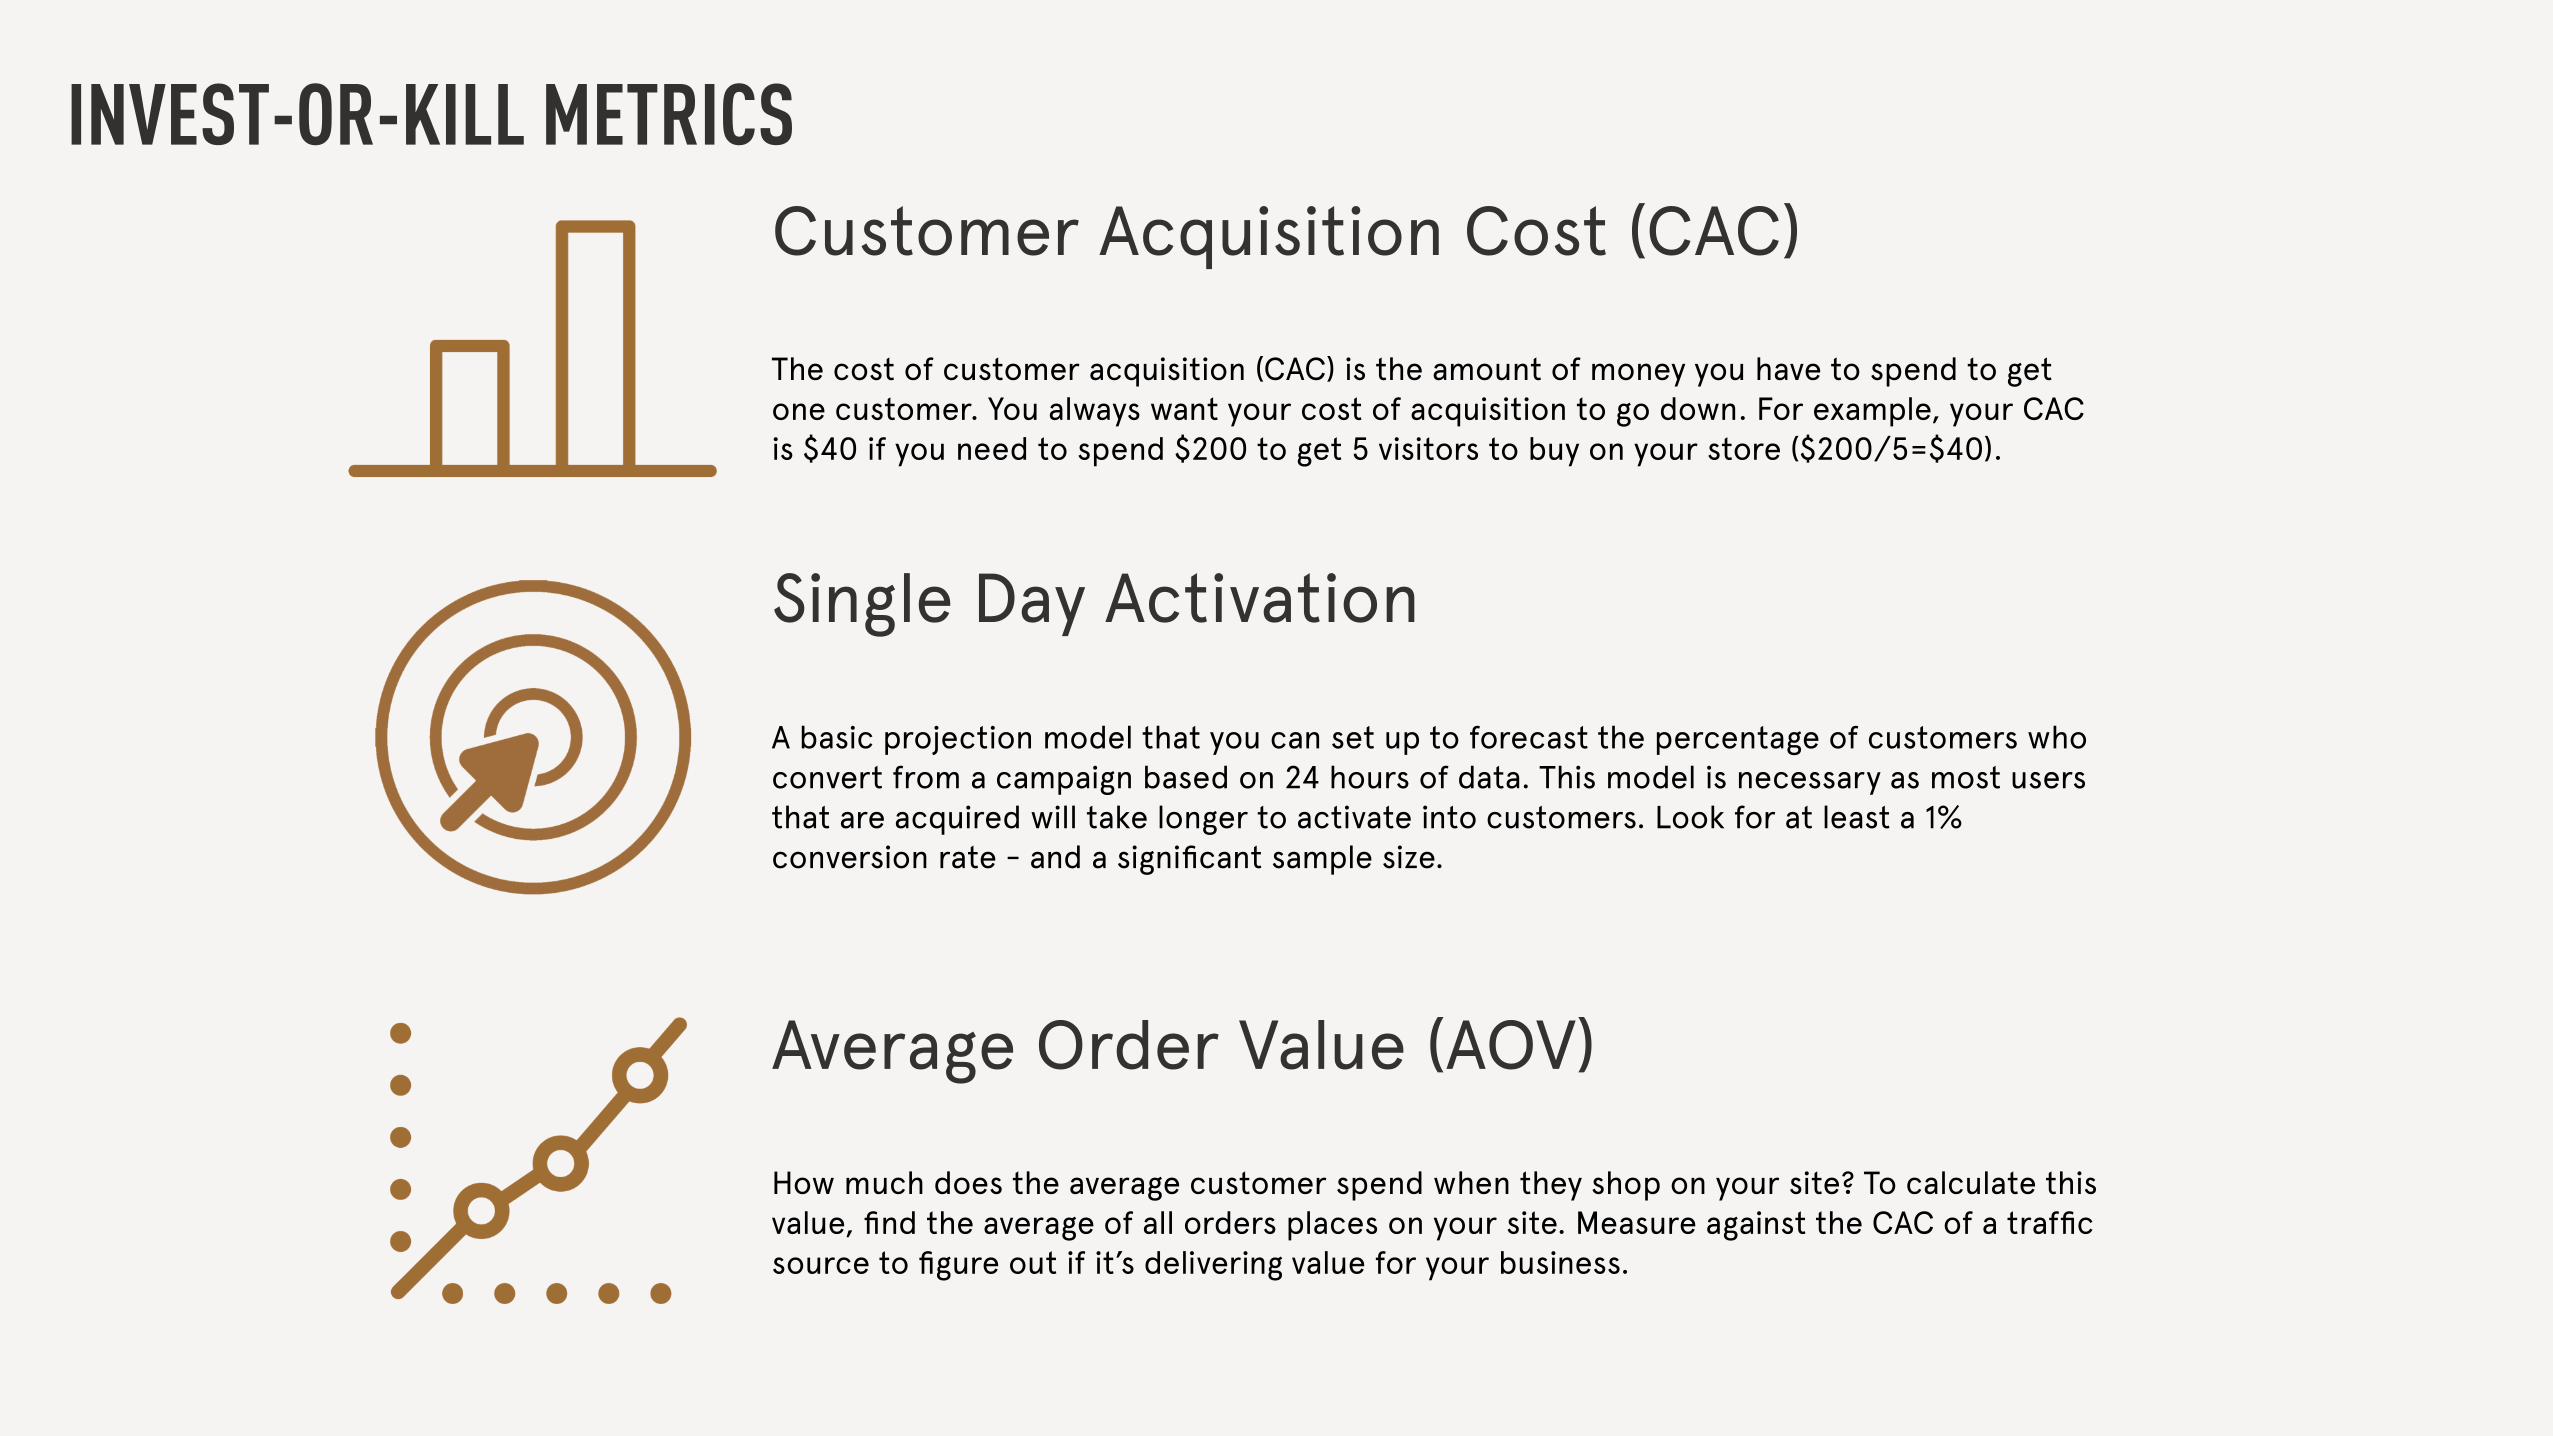
INVEST-OR-KILL METRICSCustomer Acquisition Cost (CAC)
The cost of customer acquisition (CAC) is the amount of money you have to spend to get one customer. You always want your cost of acquisition to go down. For example, your CAC is $40 if you need to spend $200 to get 5 visitors to buy on your store ($200/5=$40).
Single Day Activation
A basic projection model that you can set up to forecast the percentage of customers who convert from a campaign based on 24 hours of data. This model is necessary as most users that are acquired will take longer to activate into customers. Look for at least a 1% conversion rate - and a significant sample size.
Average Order Value (AOV)
How much does the average customer spend when they shop on your site? To calculate this value, find the average of all orders places on your site. Measure against the CAC of a traffic source to figure out if it’s delivering value for your business.

THE PROBLEM WITH PAID ACQUISITION
FIRST PURCHASE AOV SEGMENTED BY ACQUISITION SOURCE
AOV
60
120
180
Acquisition Source
Paid Organic
OBSERVATIONS
• Typically the AOV from paid acquisitions is significantly lower than organic.
• This correlation can also generally be observed through other metrics such as: Lifetime Value (LTV), Conversion Rate (CVR), Order Frequency, and Churn.
• We can conclude that users who are acquired through Paid channels do not perform as well - but why?

WHY PAID DOES NOT PREFORM
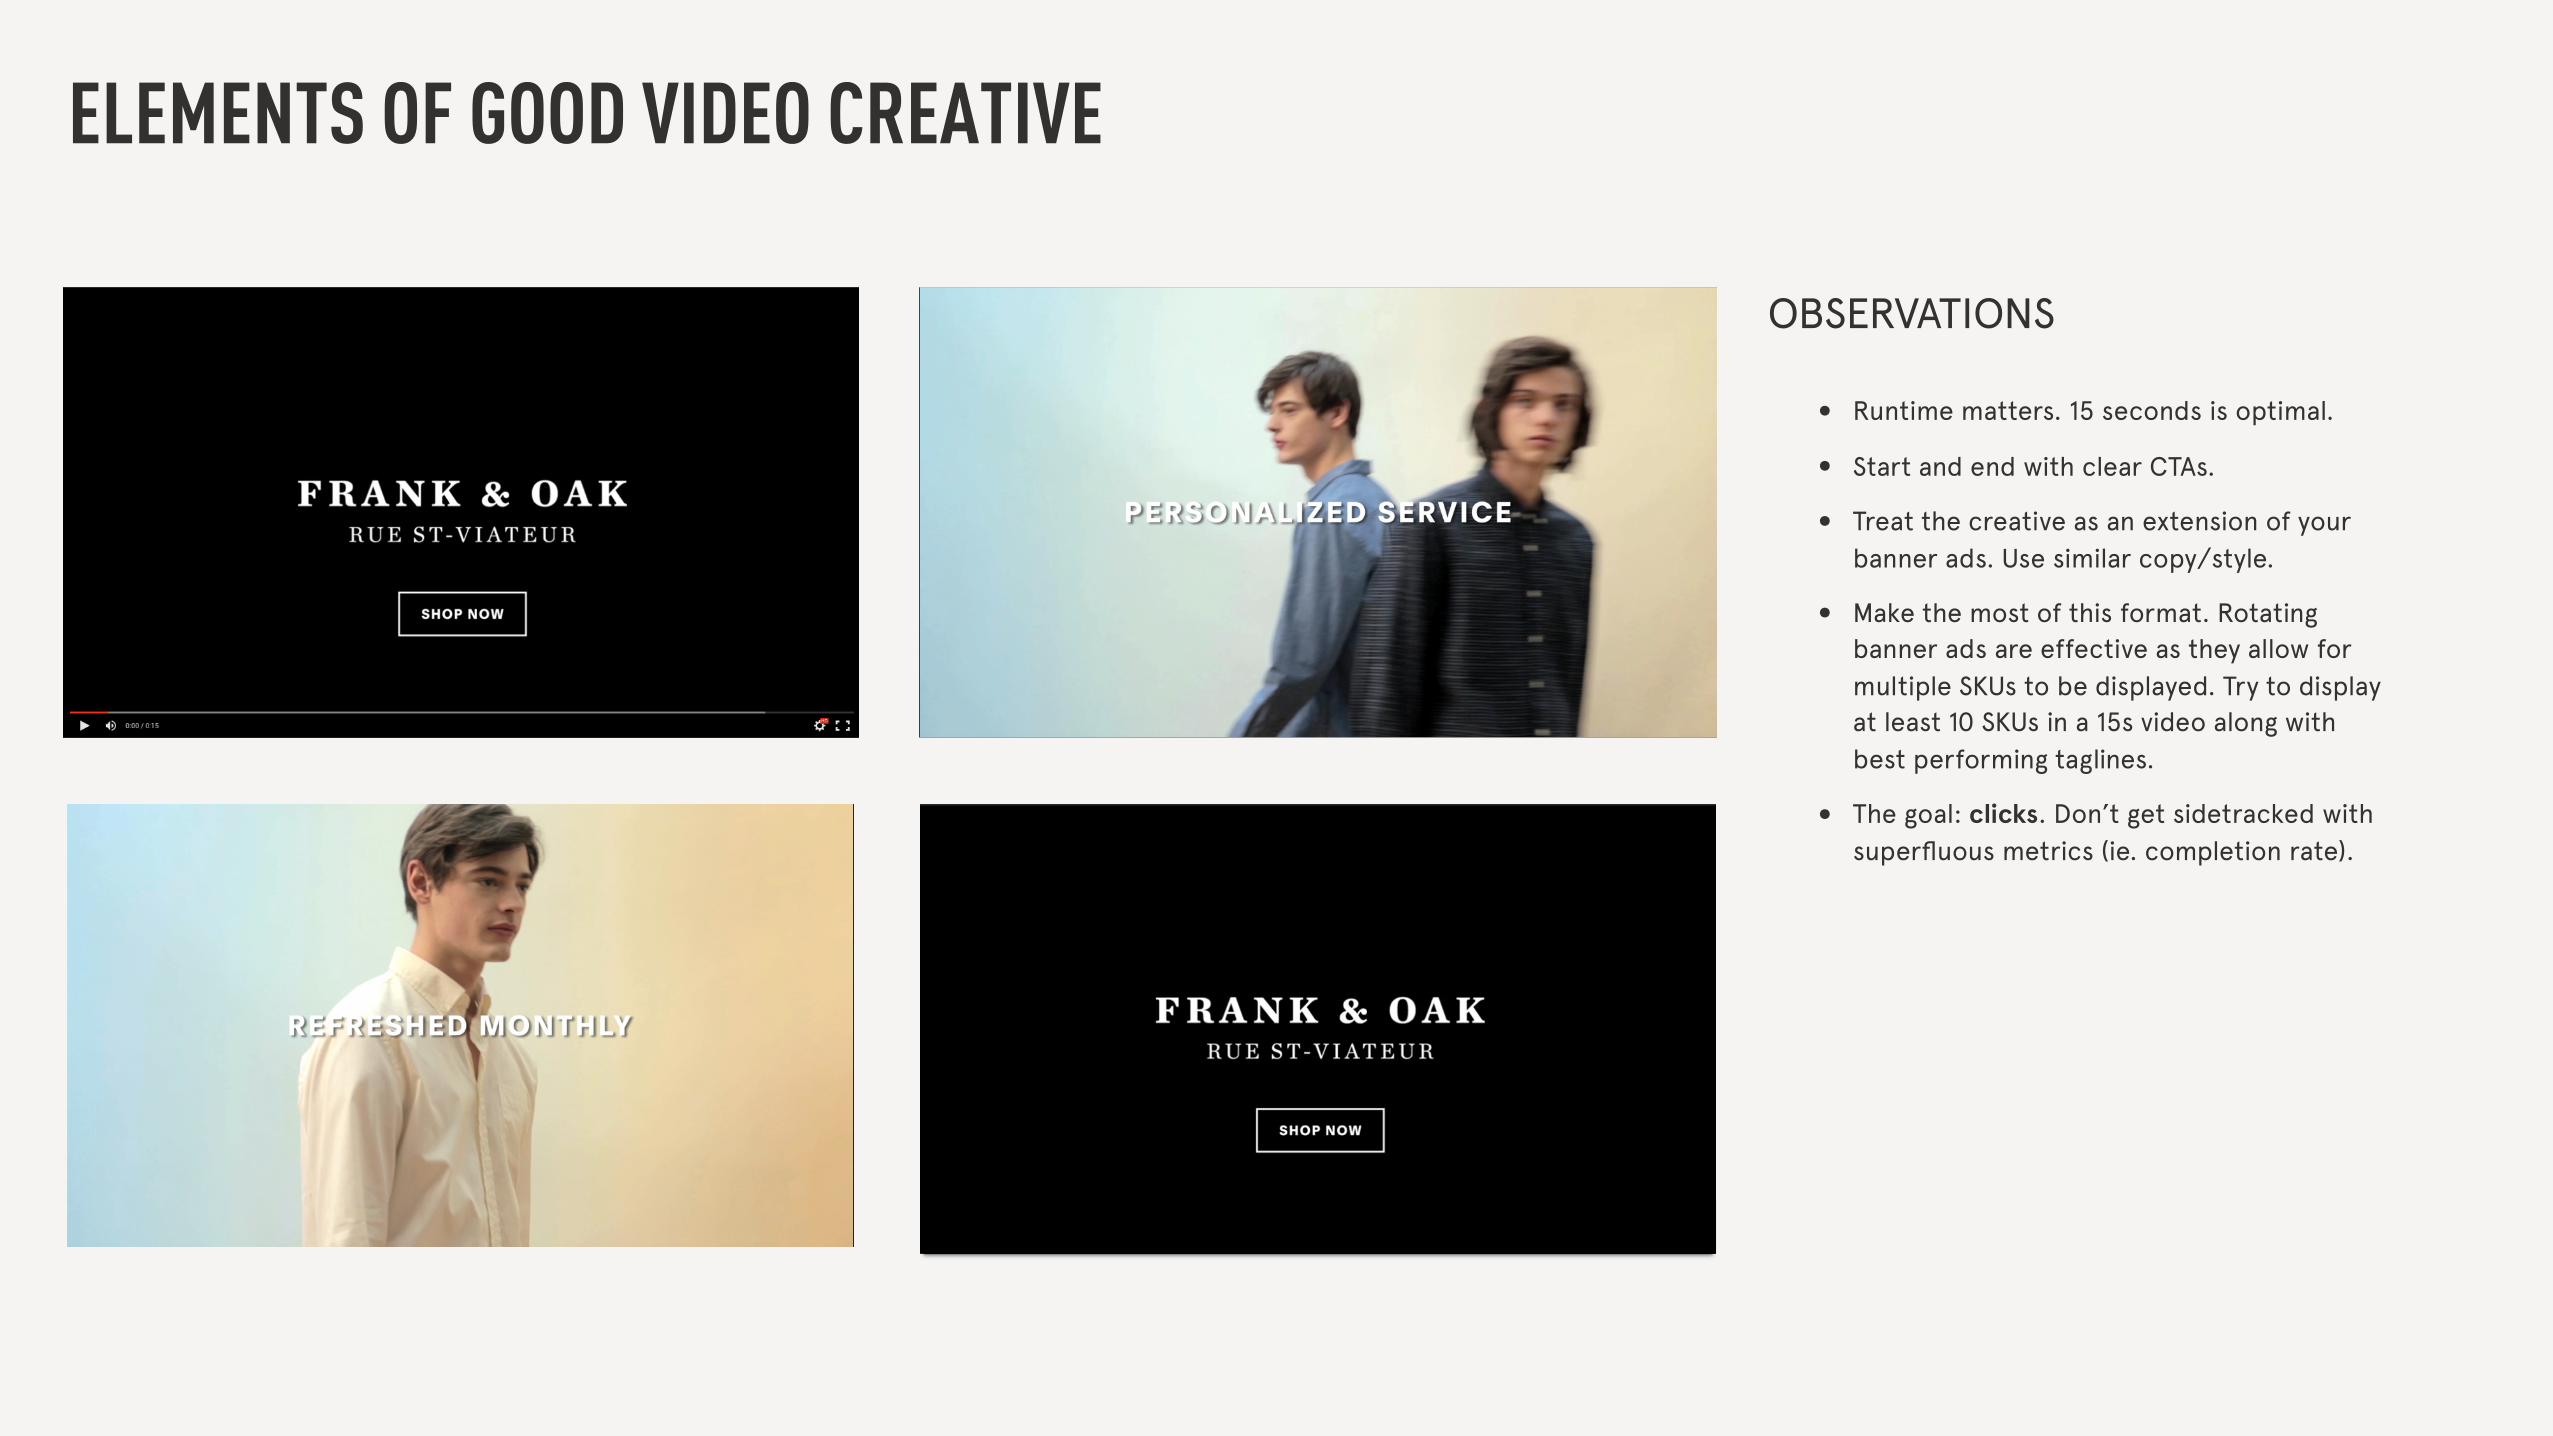
ELEMENTS OF GOOD VIDEO CREATIVE
OBSERVATIONS
• Runtime matters. 15 seconds is optimal.
• Start and end with clear CTAs.
• Treat the creative as an extension of your banner ads. Use similar copy/style.
• Make the most of this format. Rotating banner ads are effective as they allow for multiple SKUs to be displayed. Try to display at least 10 SKUs in a 15s video along with best performing taglines.
• The goal: clicks. Don’t get sidetracked with superfluous metrics (ie. completion rate).

HOW COMFORTABLE WOULD YOU BE MAKING A LARGE FIRST PURCHASE ON THIS SITE?
POSSIBLE PAIN POINTS
• Will the quality be acceptable?
• Will the fit be acceptable?
• Will the order arrive in a timely fashion?
• Is the brand/company trustworthy?
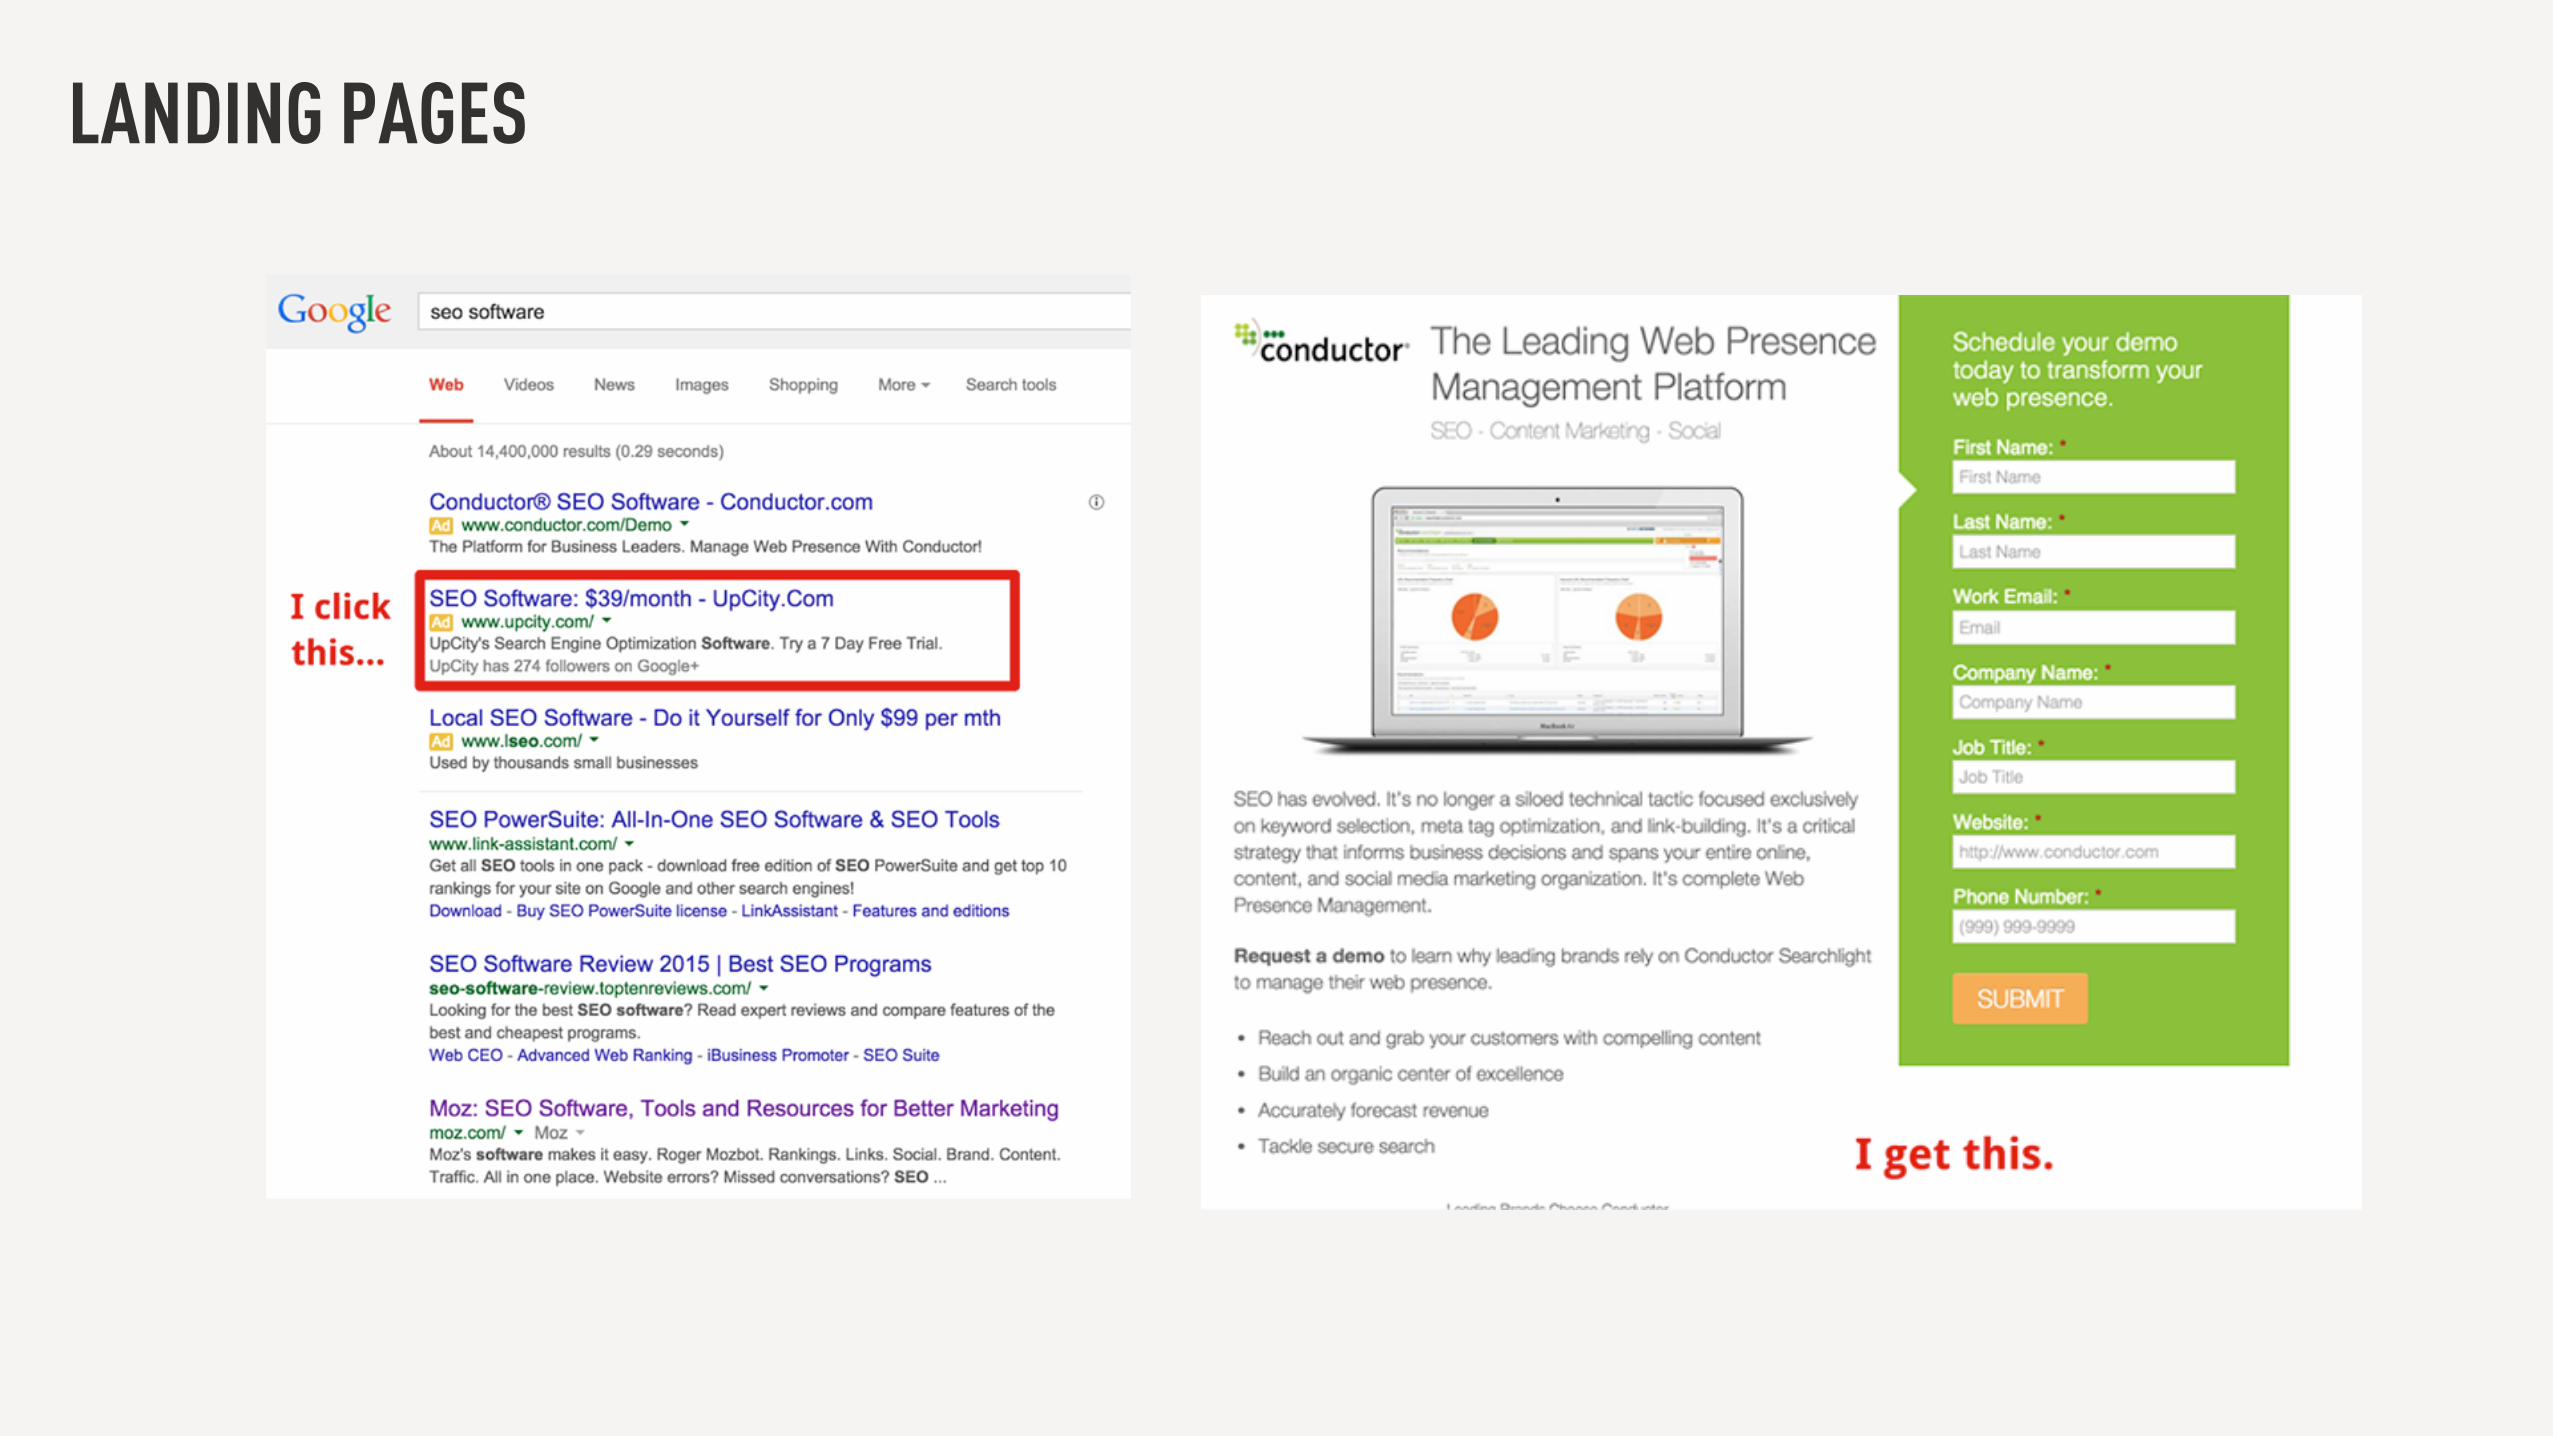
LANDING PAGES
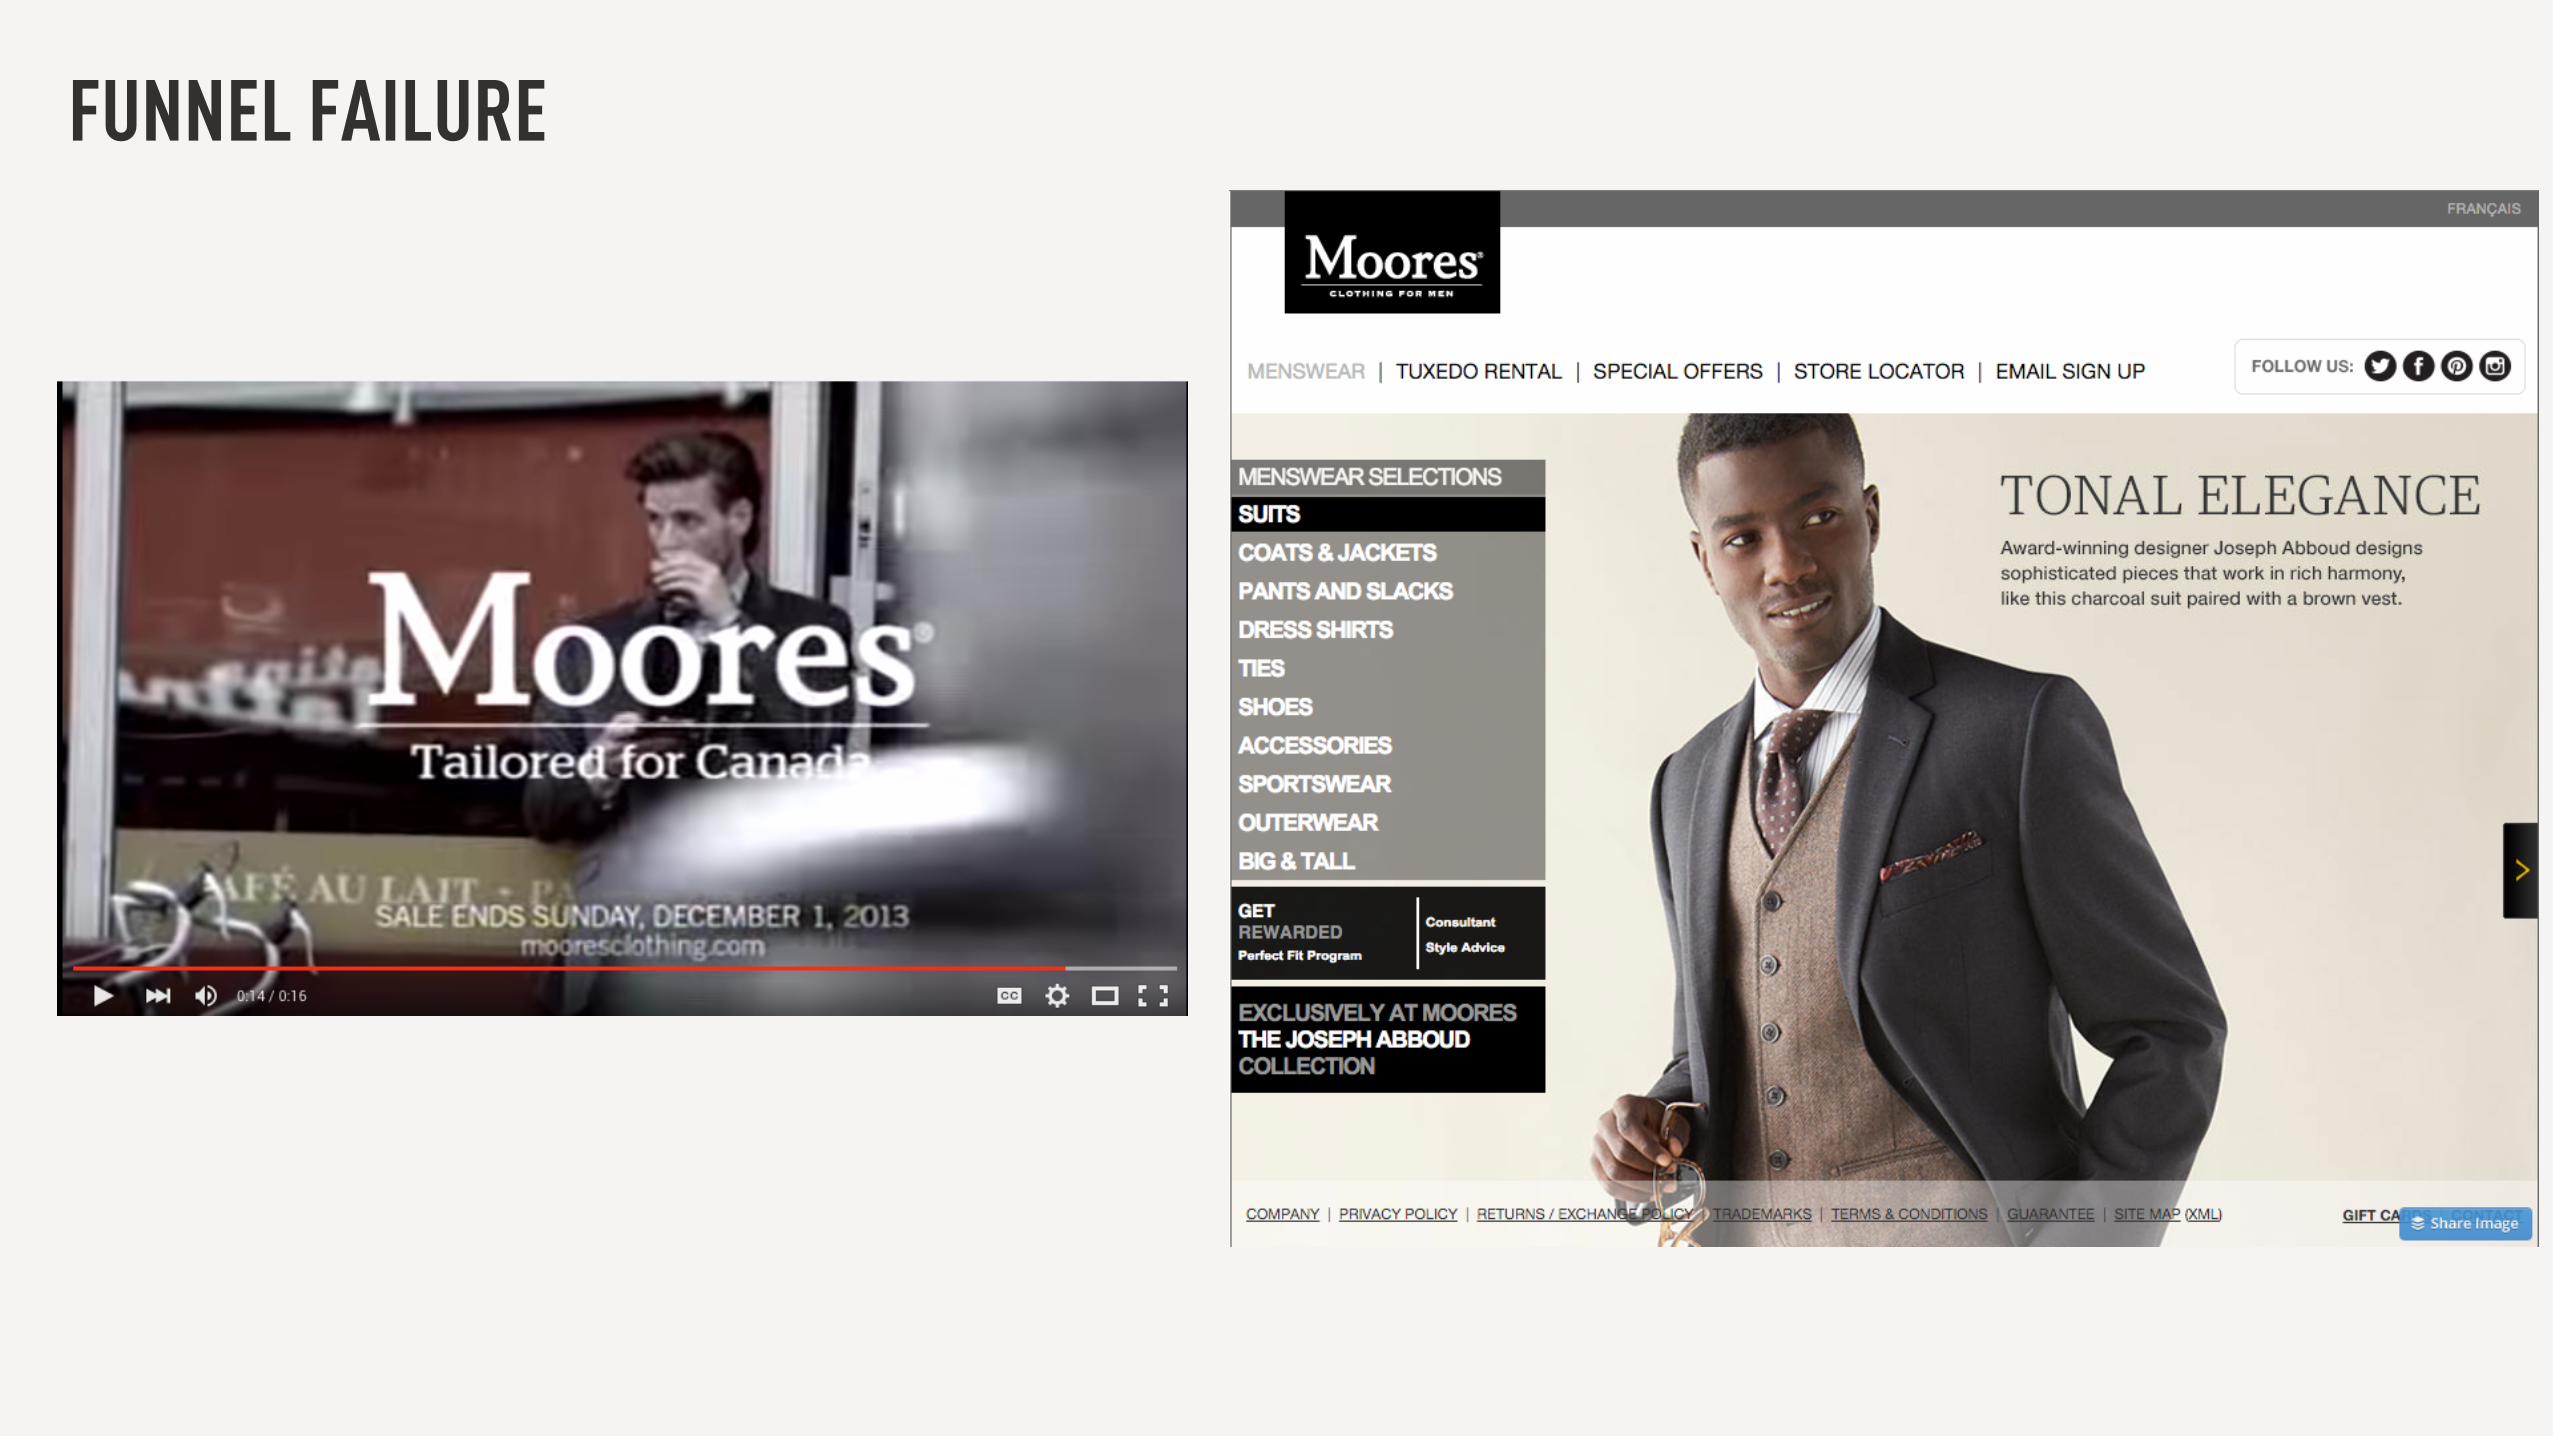
FUNNEL FAILURE

BRAND STORYTELLING IMPROVES PERCEPTION, VALUE, AND TRUST.

MEASURING VALUE: UNDERSTANDING ATTRIBUTION
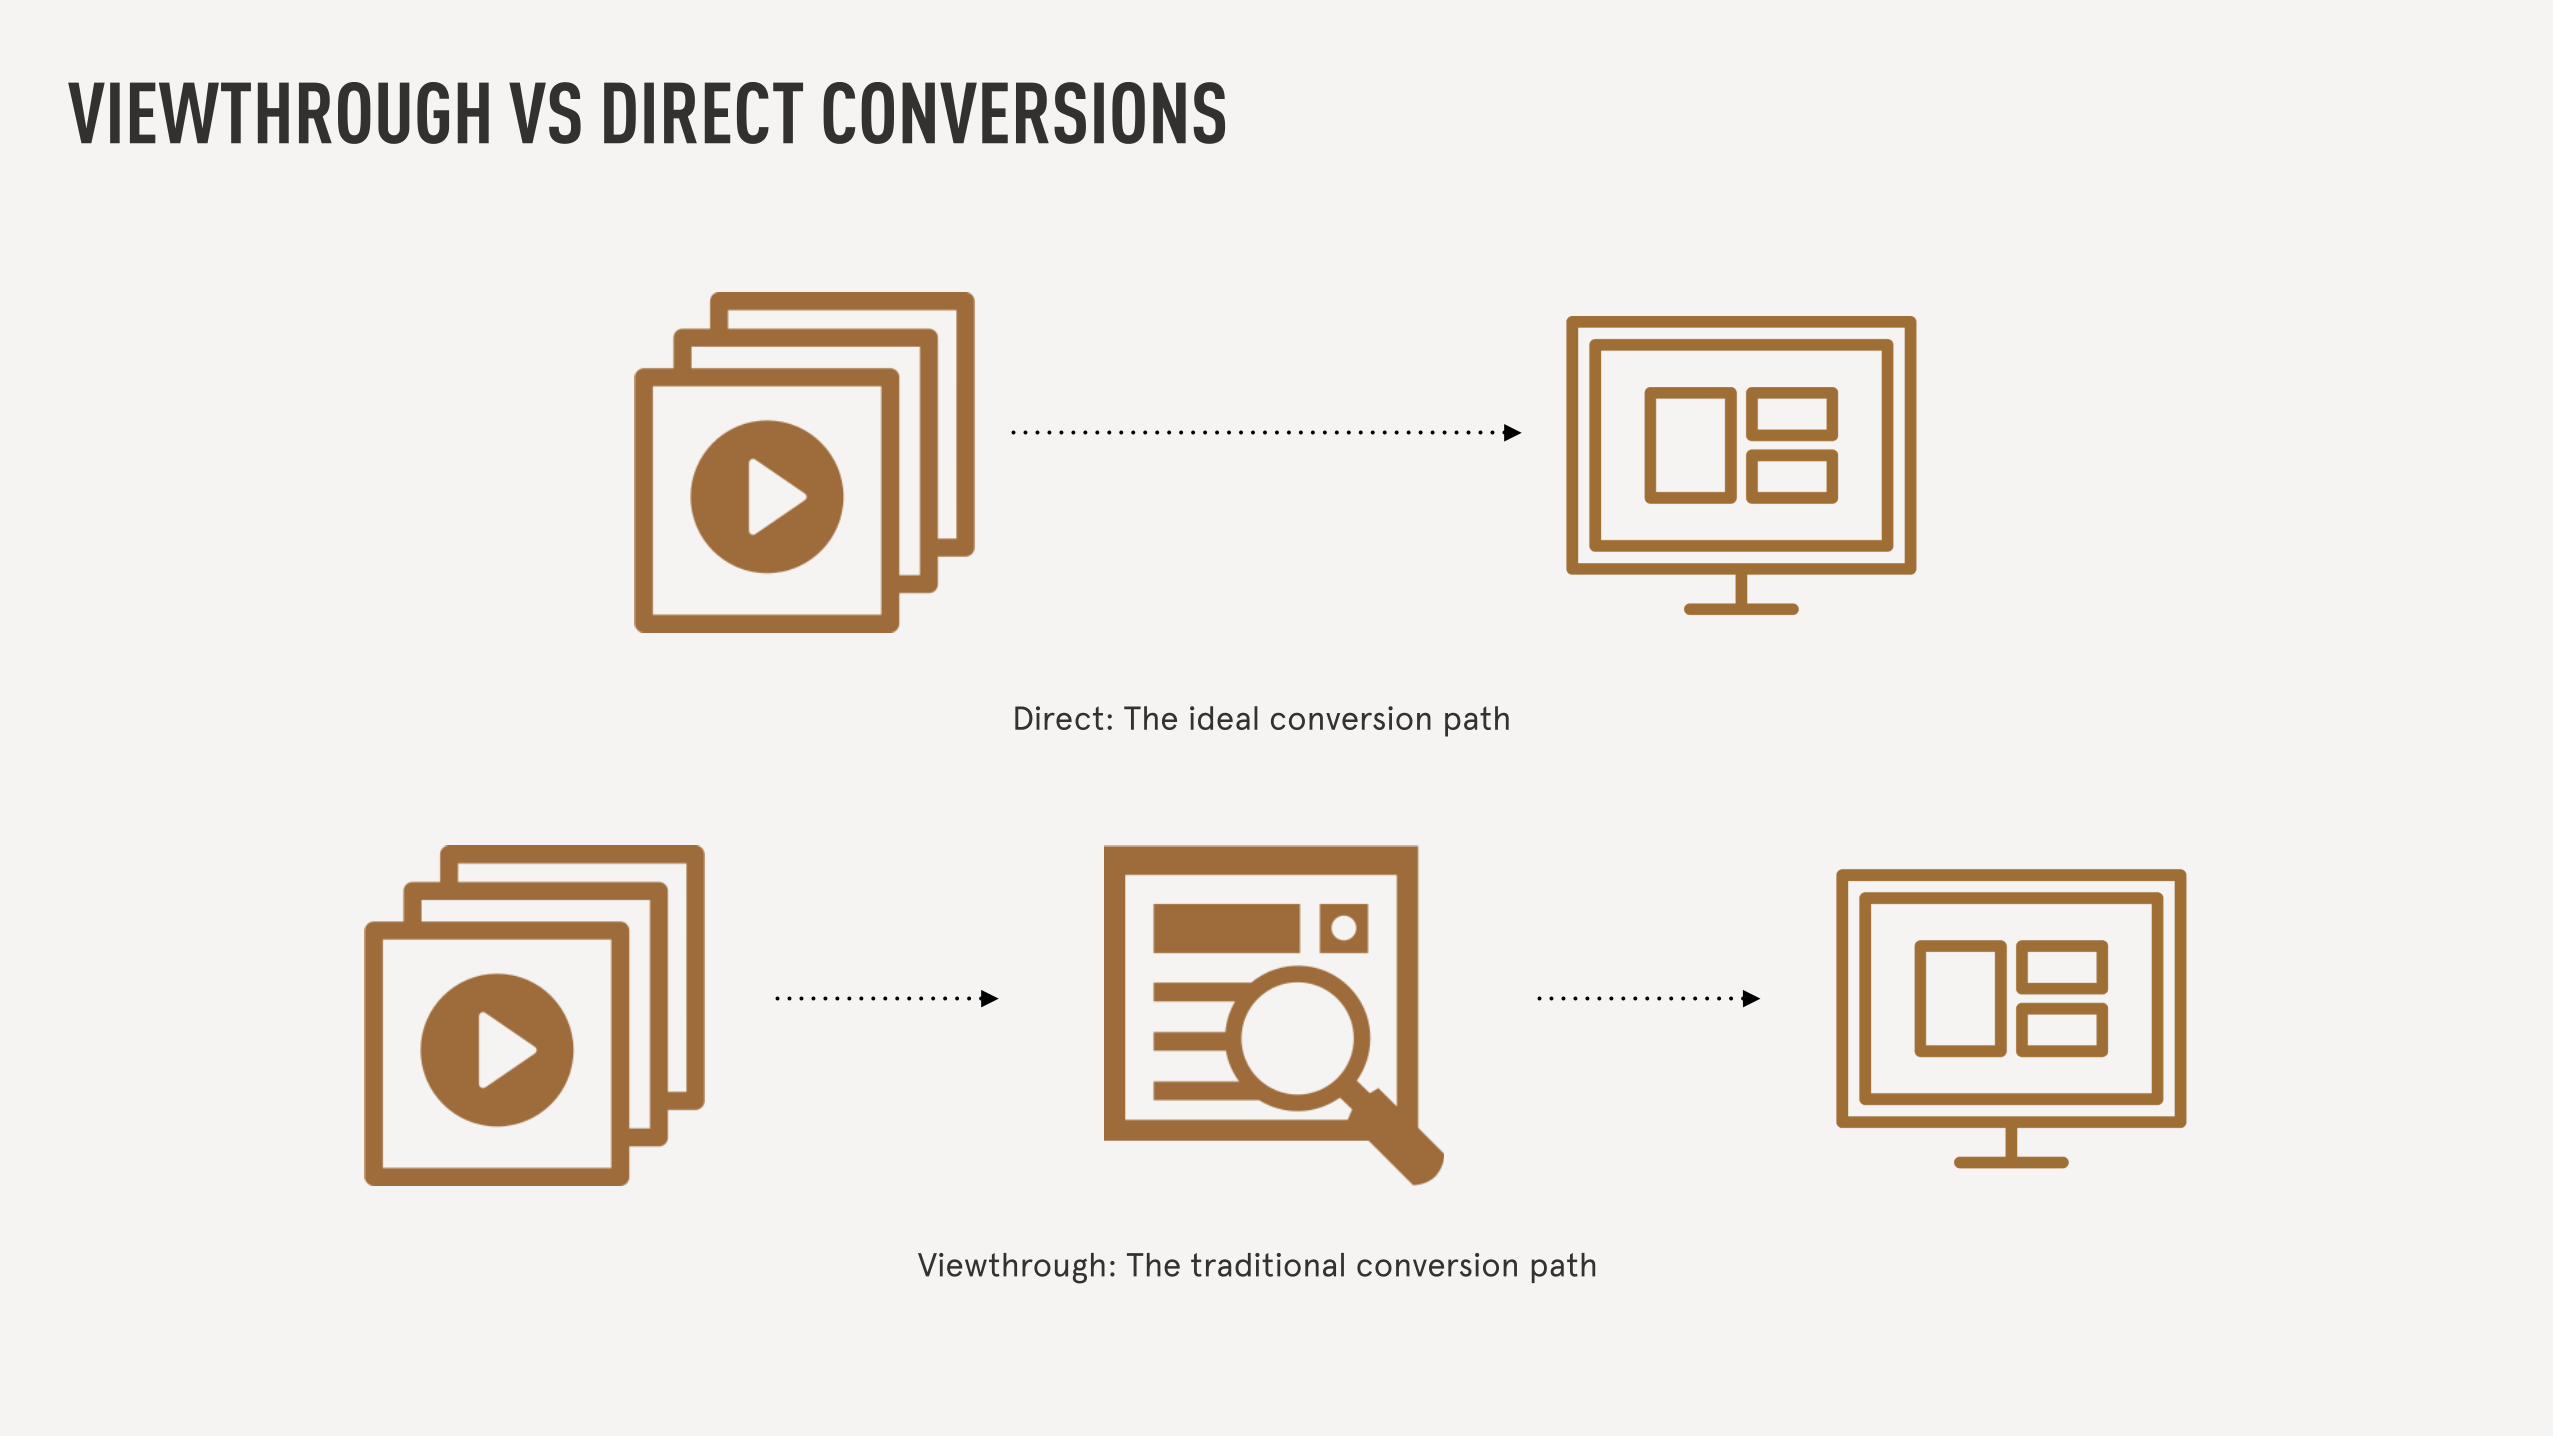
VIEWTHROUGH VS DIRECT CONVERSIONS
Direct: The ideal conversion path
Viewthrough: The traditional conversion path

UNDERSTANDING MULTI-TOUCHPOINT PATHS
“Digital advertising is not about click-through, but rather: seeding the
intent to search” - Ben Jones, Creative Director (Google)

TYPES OF ATTRIBUTION MODELSFirst-click - Credit is given to the first click in the path to
conversion.
Last-click - Credit is given to the last click in the path to
conversion.
Linear - Credit is spread equally across all clicks in the path to
conversion.
Time decay - More credit is given to clicks that occur closest to
the time of conversion.
Position-based - Credit is given based on the position of the
click in the path to conversion, with the first and last click
receiving more value.
Regression or algorithmic - Credit is given based on regression
analysis of historical performance.

AD SATURATION AND EFFIENCY
OBSERVATIONS
• On average, there were approximately 5.34 ad events per conversion path (31,406 impressions vs 5,506 conversions).
• 15% of the total conversions only had 1 event in their path. Within that path 87% of those conversions were viewthrough.
• Only 1 single conversion had 20 ad events. 50% split between direct and viewthrough.
• 22% of the total conversions had 10 events. Nearly 100% of these were viewthrough conversions.
Ad Events Conversions % of Total Conversions
% Viewthrough % Clickthrough1 839 15% 87% 13%2 759 14% 85% 15%3 558 10% 88% 12%
4 436 8% 91% 9%
5 342 6% 90% 10%6 309 6% 94% 6%
7 247 4% 94% 6%
8 193 4% 96% 4%
9 140 3% 95% 5%
10 1,189 22% 100% 0%
11 374 7% 91% 9%
12 75 1% 82% 18%
13 28 1% 75% 25%
14 6 0% 70% 30%
15 5 0% 67% 33%
16 2 0% 50% 50%
18 2 0% 56% 44%
19 1 0% 53% 47%
20 1 0% 50% 50%
Total 5506 100% 94% 6%
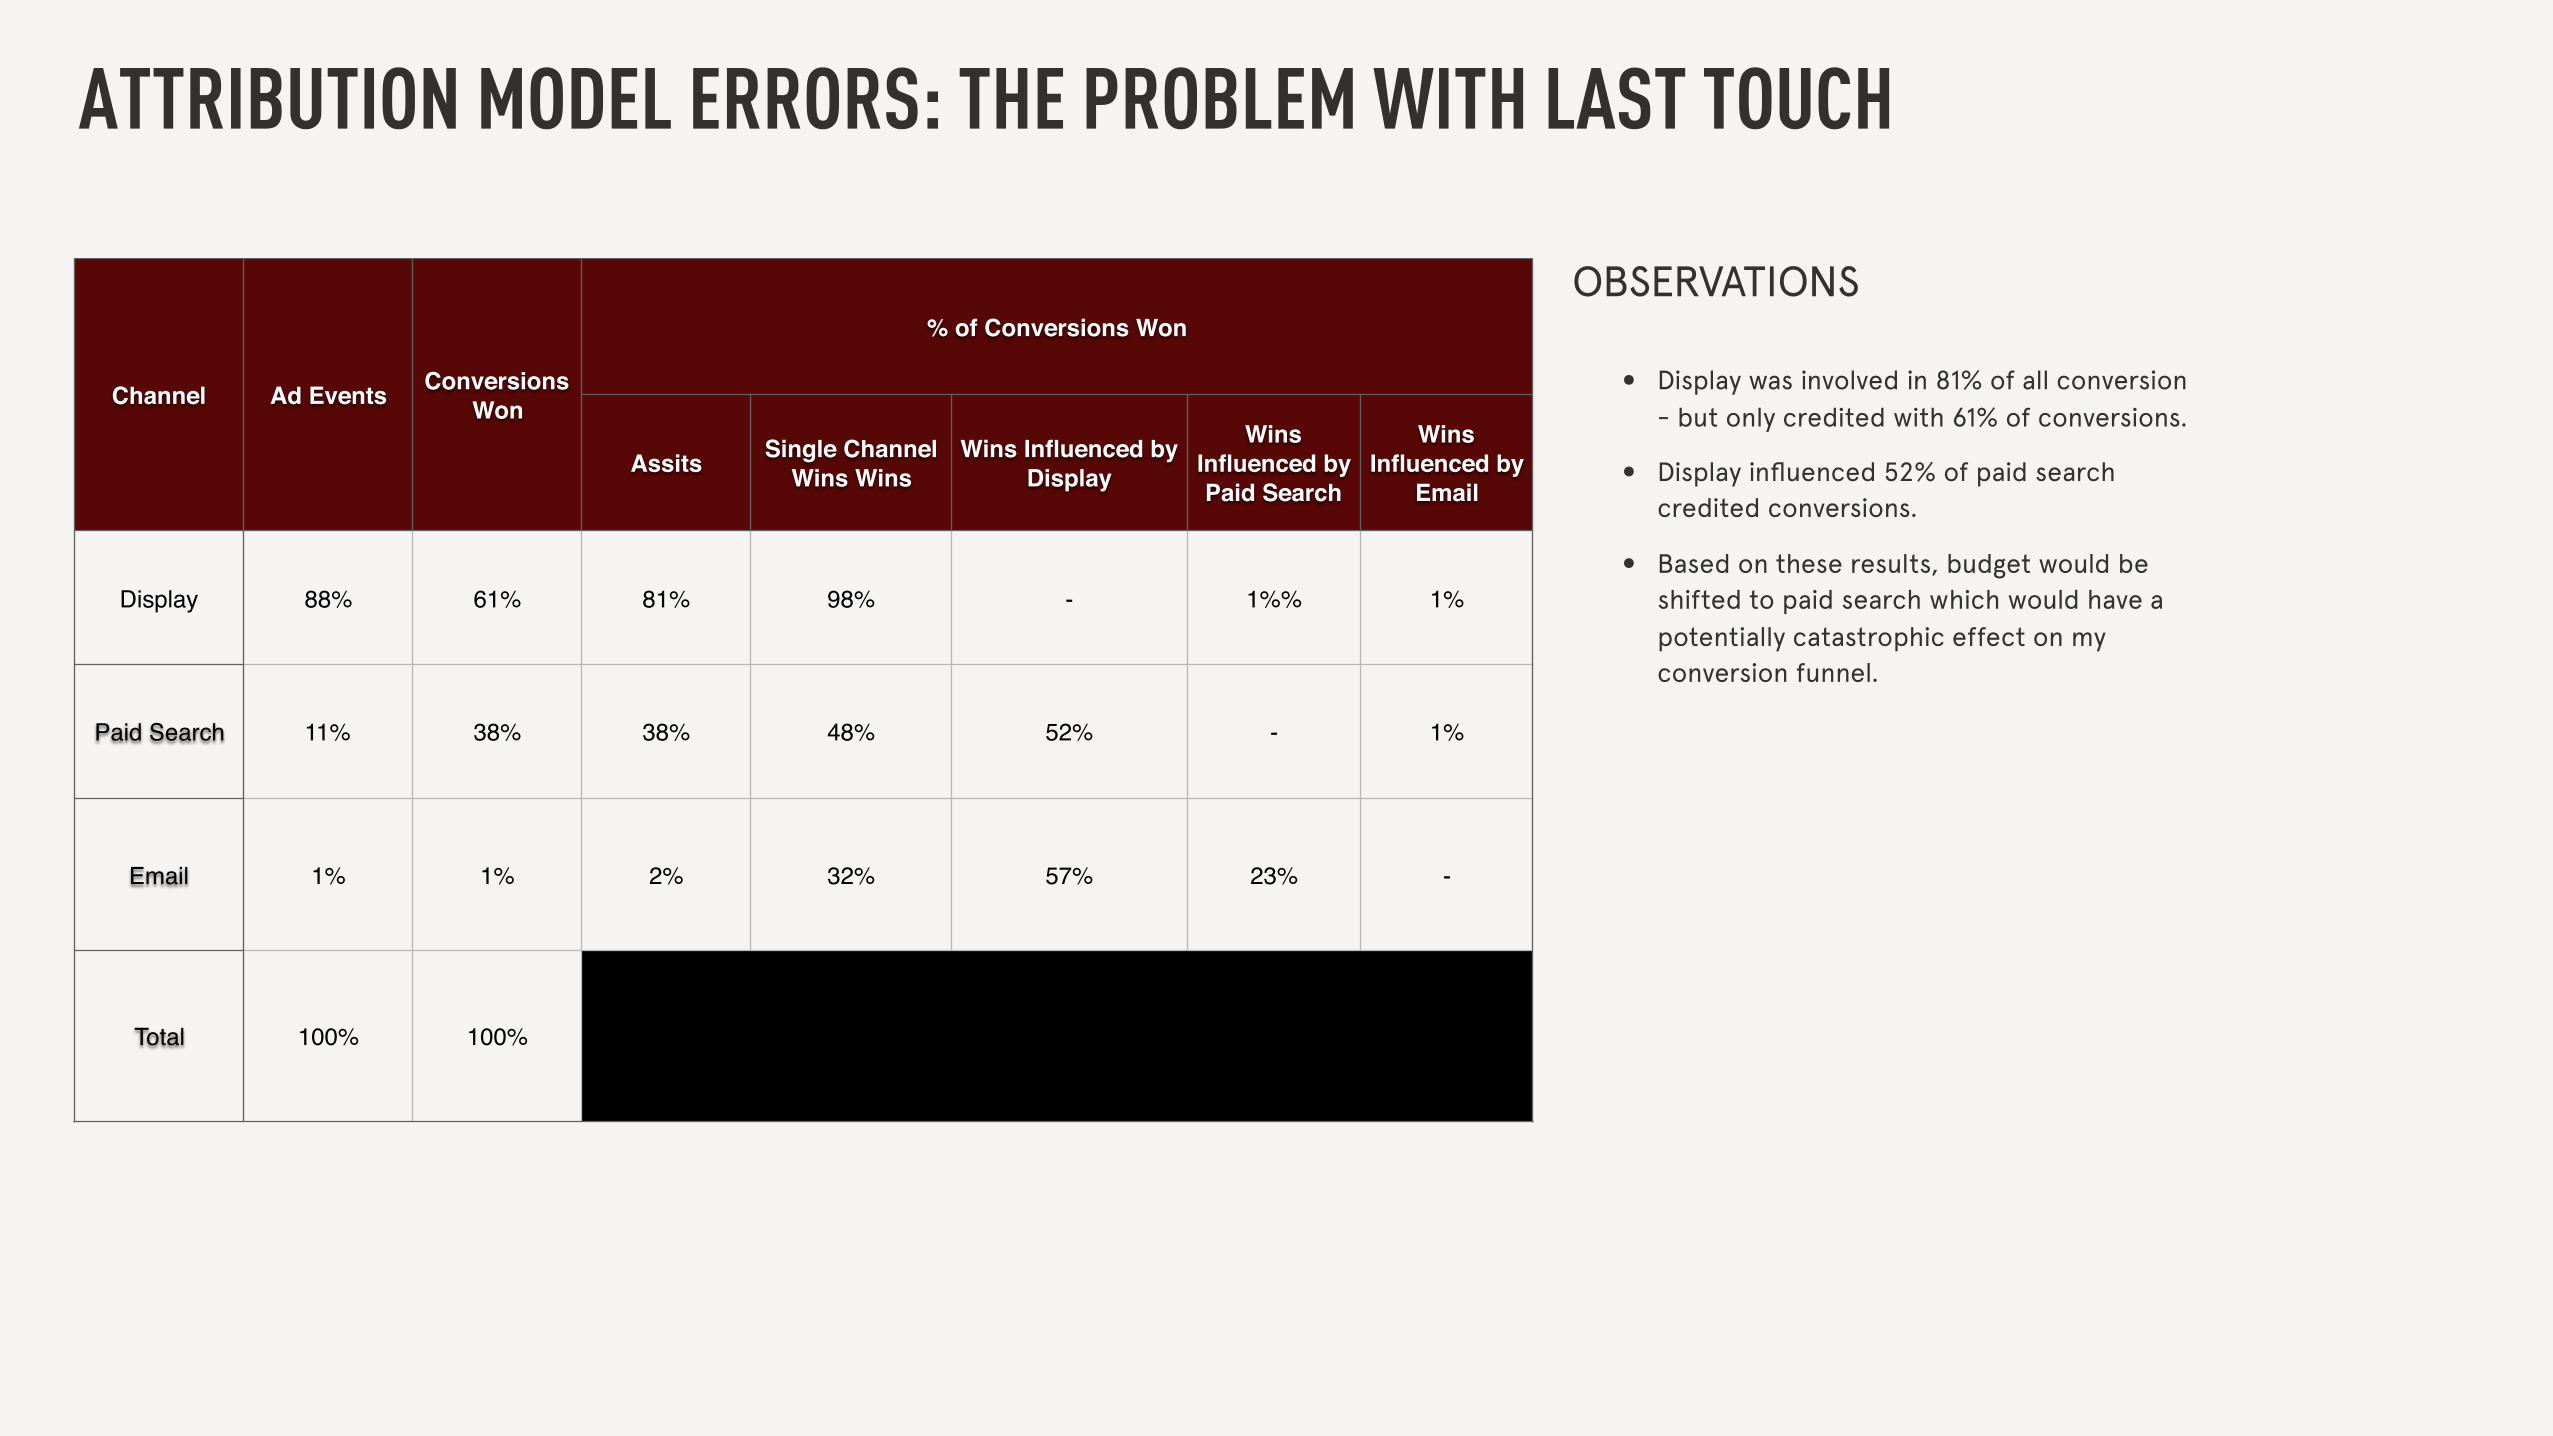
ATTRIBUTION MODEL ERRORS: THE PROBLEM WITH LAST TOUCH
OBSERVATIONS
• Display was involved in 81% of all conversion - but only credited with 61% of conversions.
• Display influenced 52% of paid search credited conversions.
• Based on these results, budget would be shifted to paid search which would have a potentially catastrophic effect on my conversion funnel.
Channel Ad Events Conversions Won
% of Conversions Won
Assits Single Channel Wins Wins
Wins Influenced by Display
Wins Influenced by Paid Search
Wins Influenced by
Display 88% 61% 81% 98% - 1%% 1%
Paid Search 11% 38% 38% 48% 52% - 1%
Email 1% 1% 2% 32% 57% 23% -
Total 100% 100%
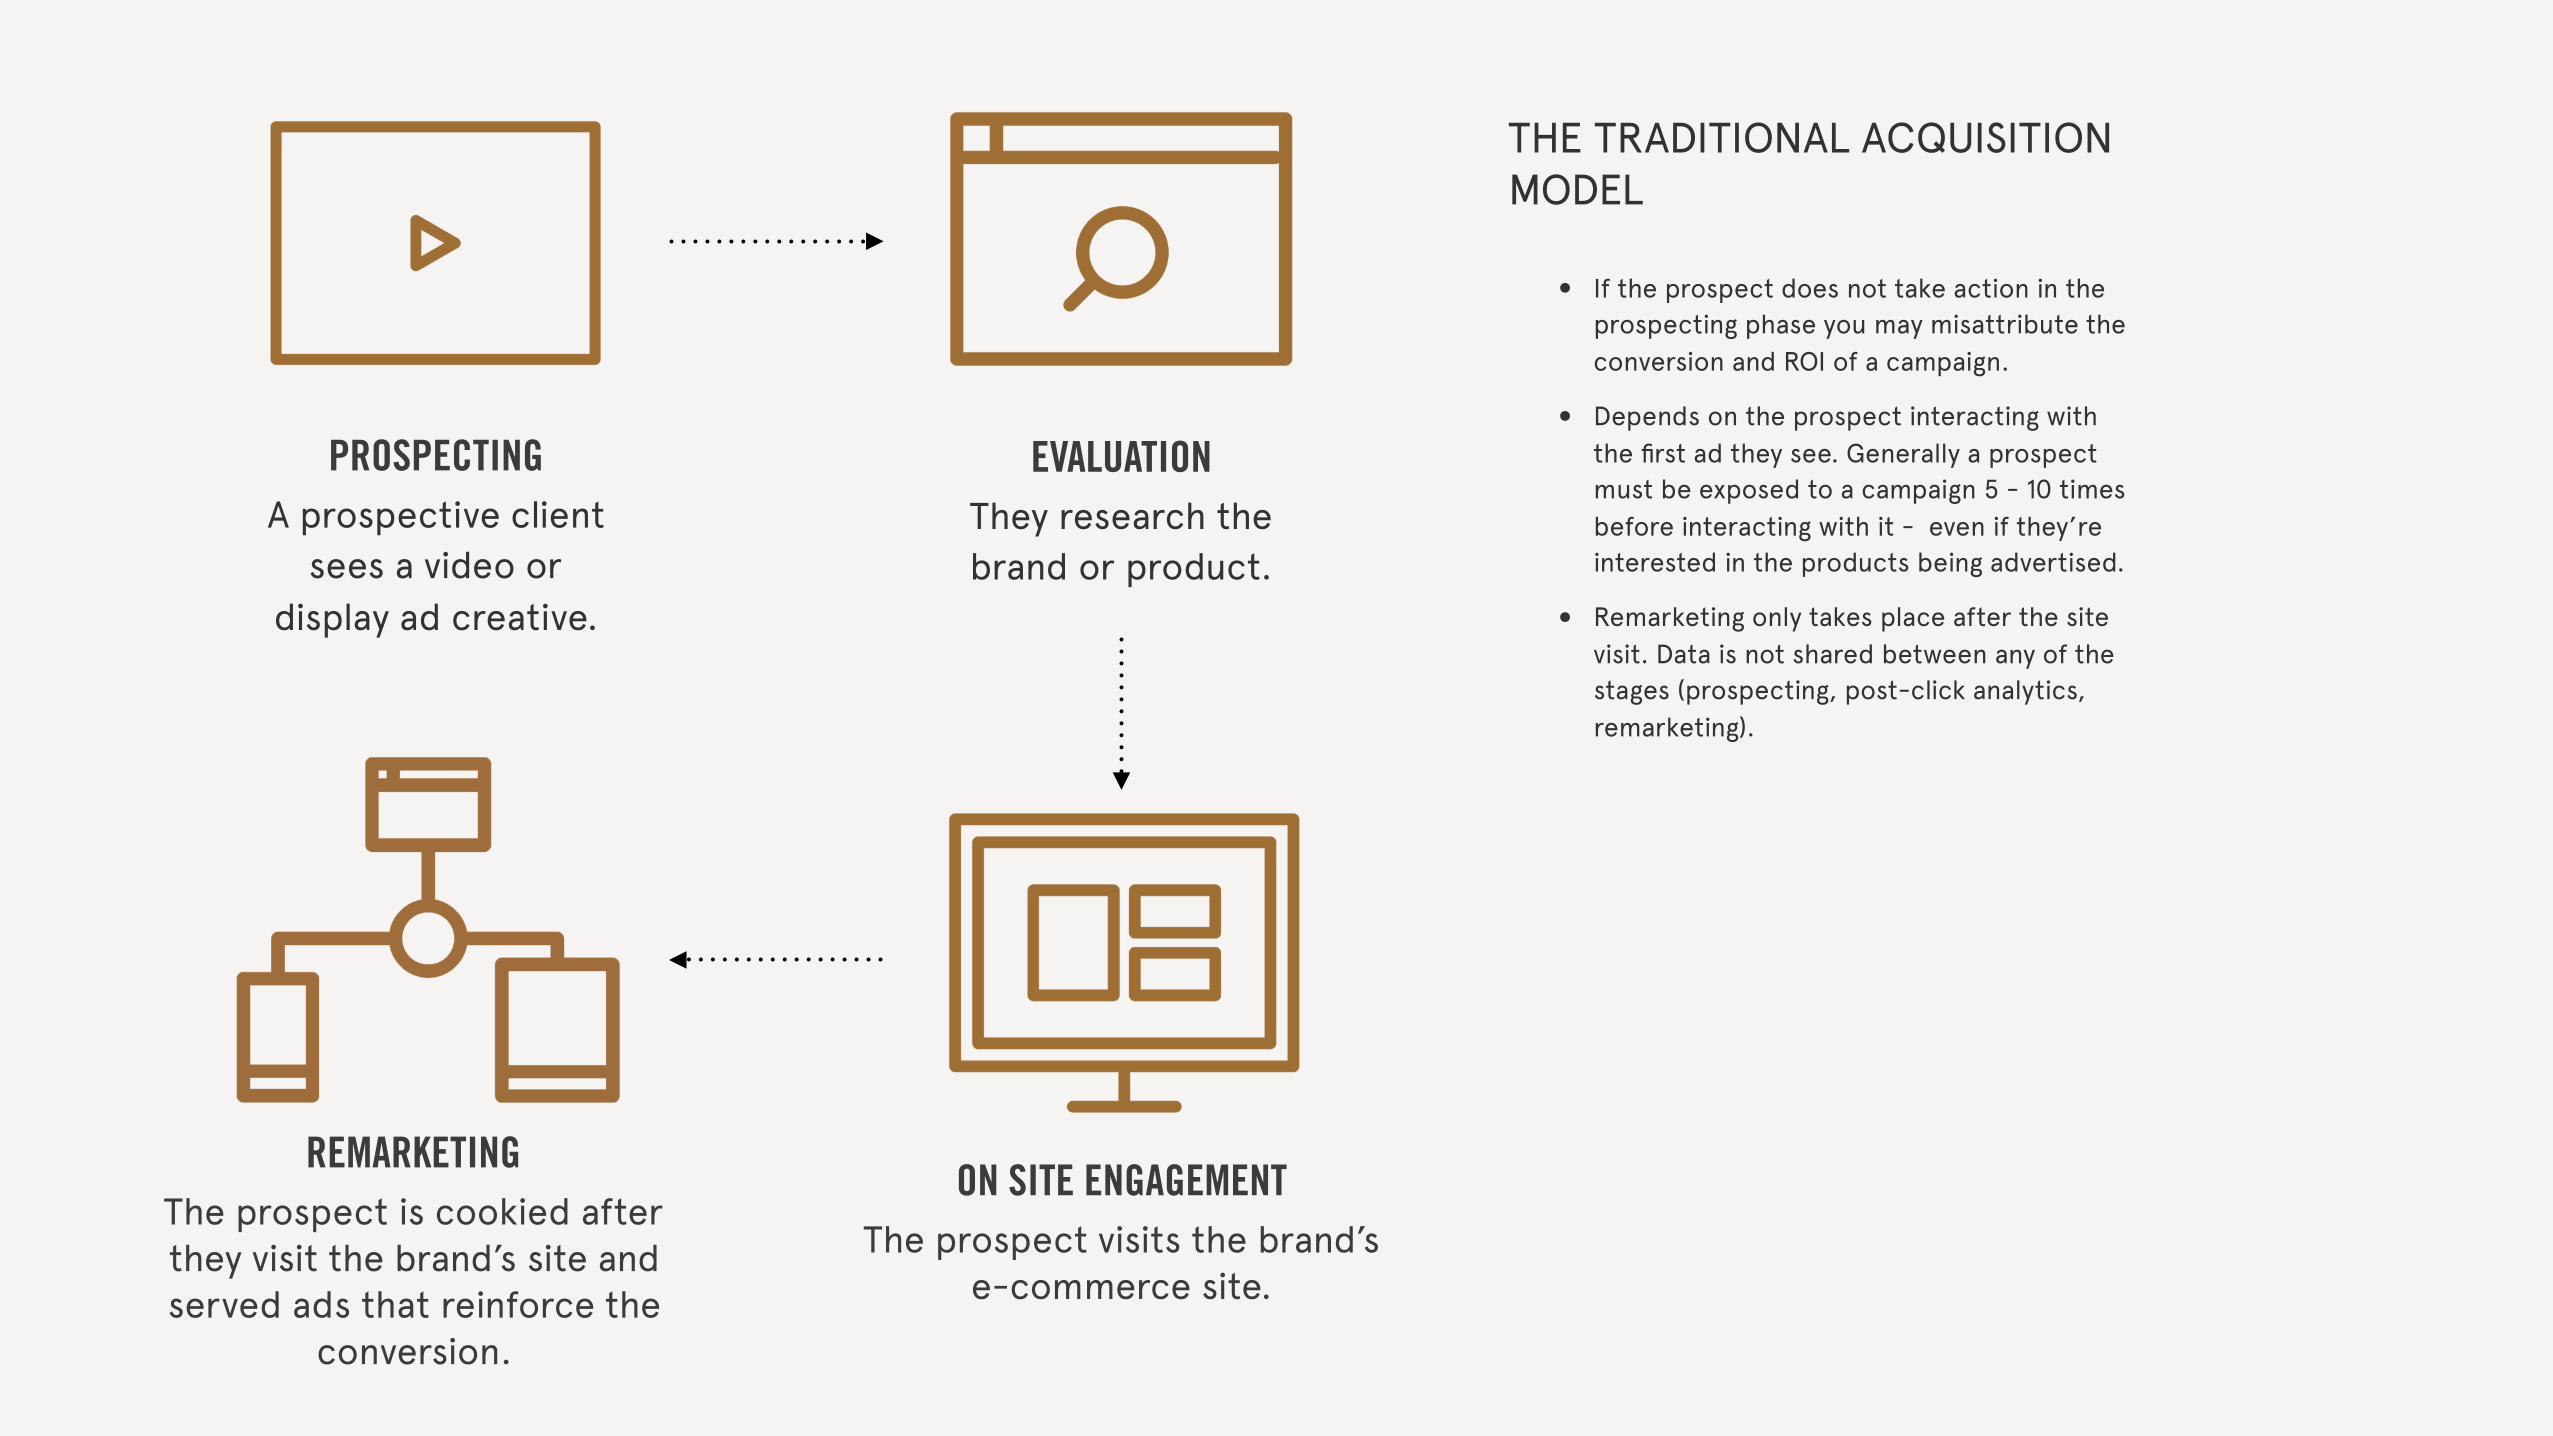
PROSPECTING
A prospective client sees a video or
display ad creative.
ON SITE ENGAGEMENT
The prospect visits the brand’s e-commerce site.
EVALUATION
They research the brand or product.
REMARKETING
The prospect is cookied after they visit the brand’s site and served ads that reinforce the
conversion.
THE TRADITIONAL ACQUISITION MODEL
• If the prospect does not take action in the prospecting phase you may misattribute the conversion and ROI of a campaign.
• Depends on the prospect interacting with the first ad they see. Generally a prospect must be exposed to a campaign 5 - 10 times before interacting with it - even if they’re interested in the products being advertised.
• Remarketing only takes place after the site visit. Data is not shared between any of the stages (prospecting, post-click analytics, remarketing).
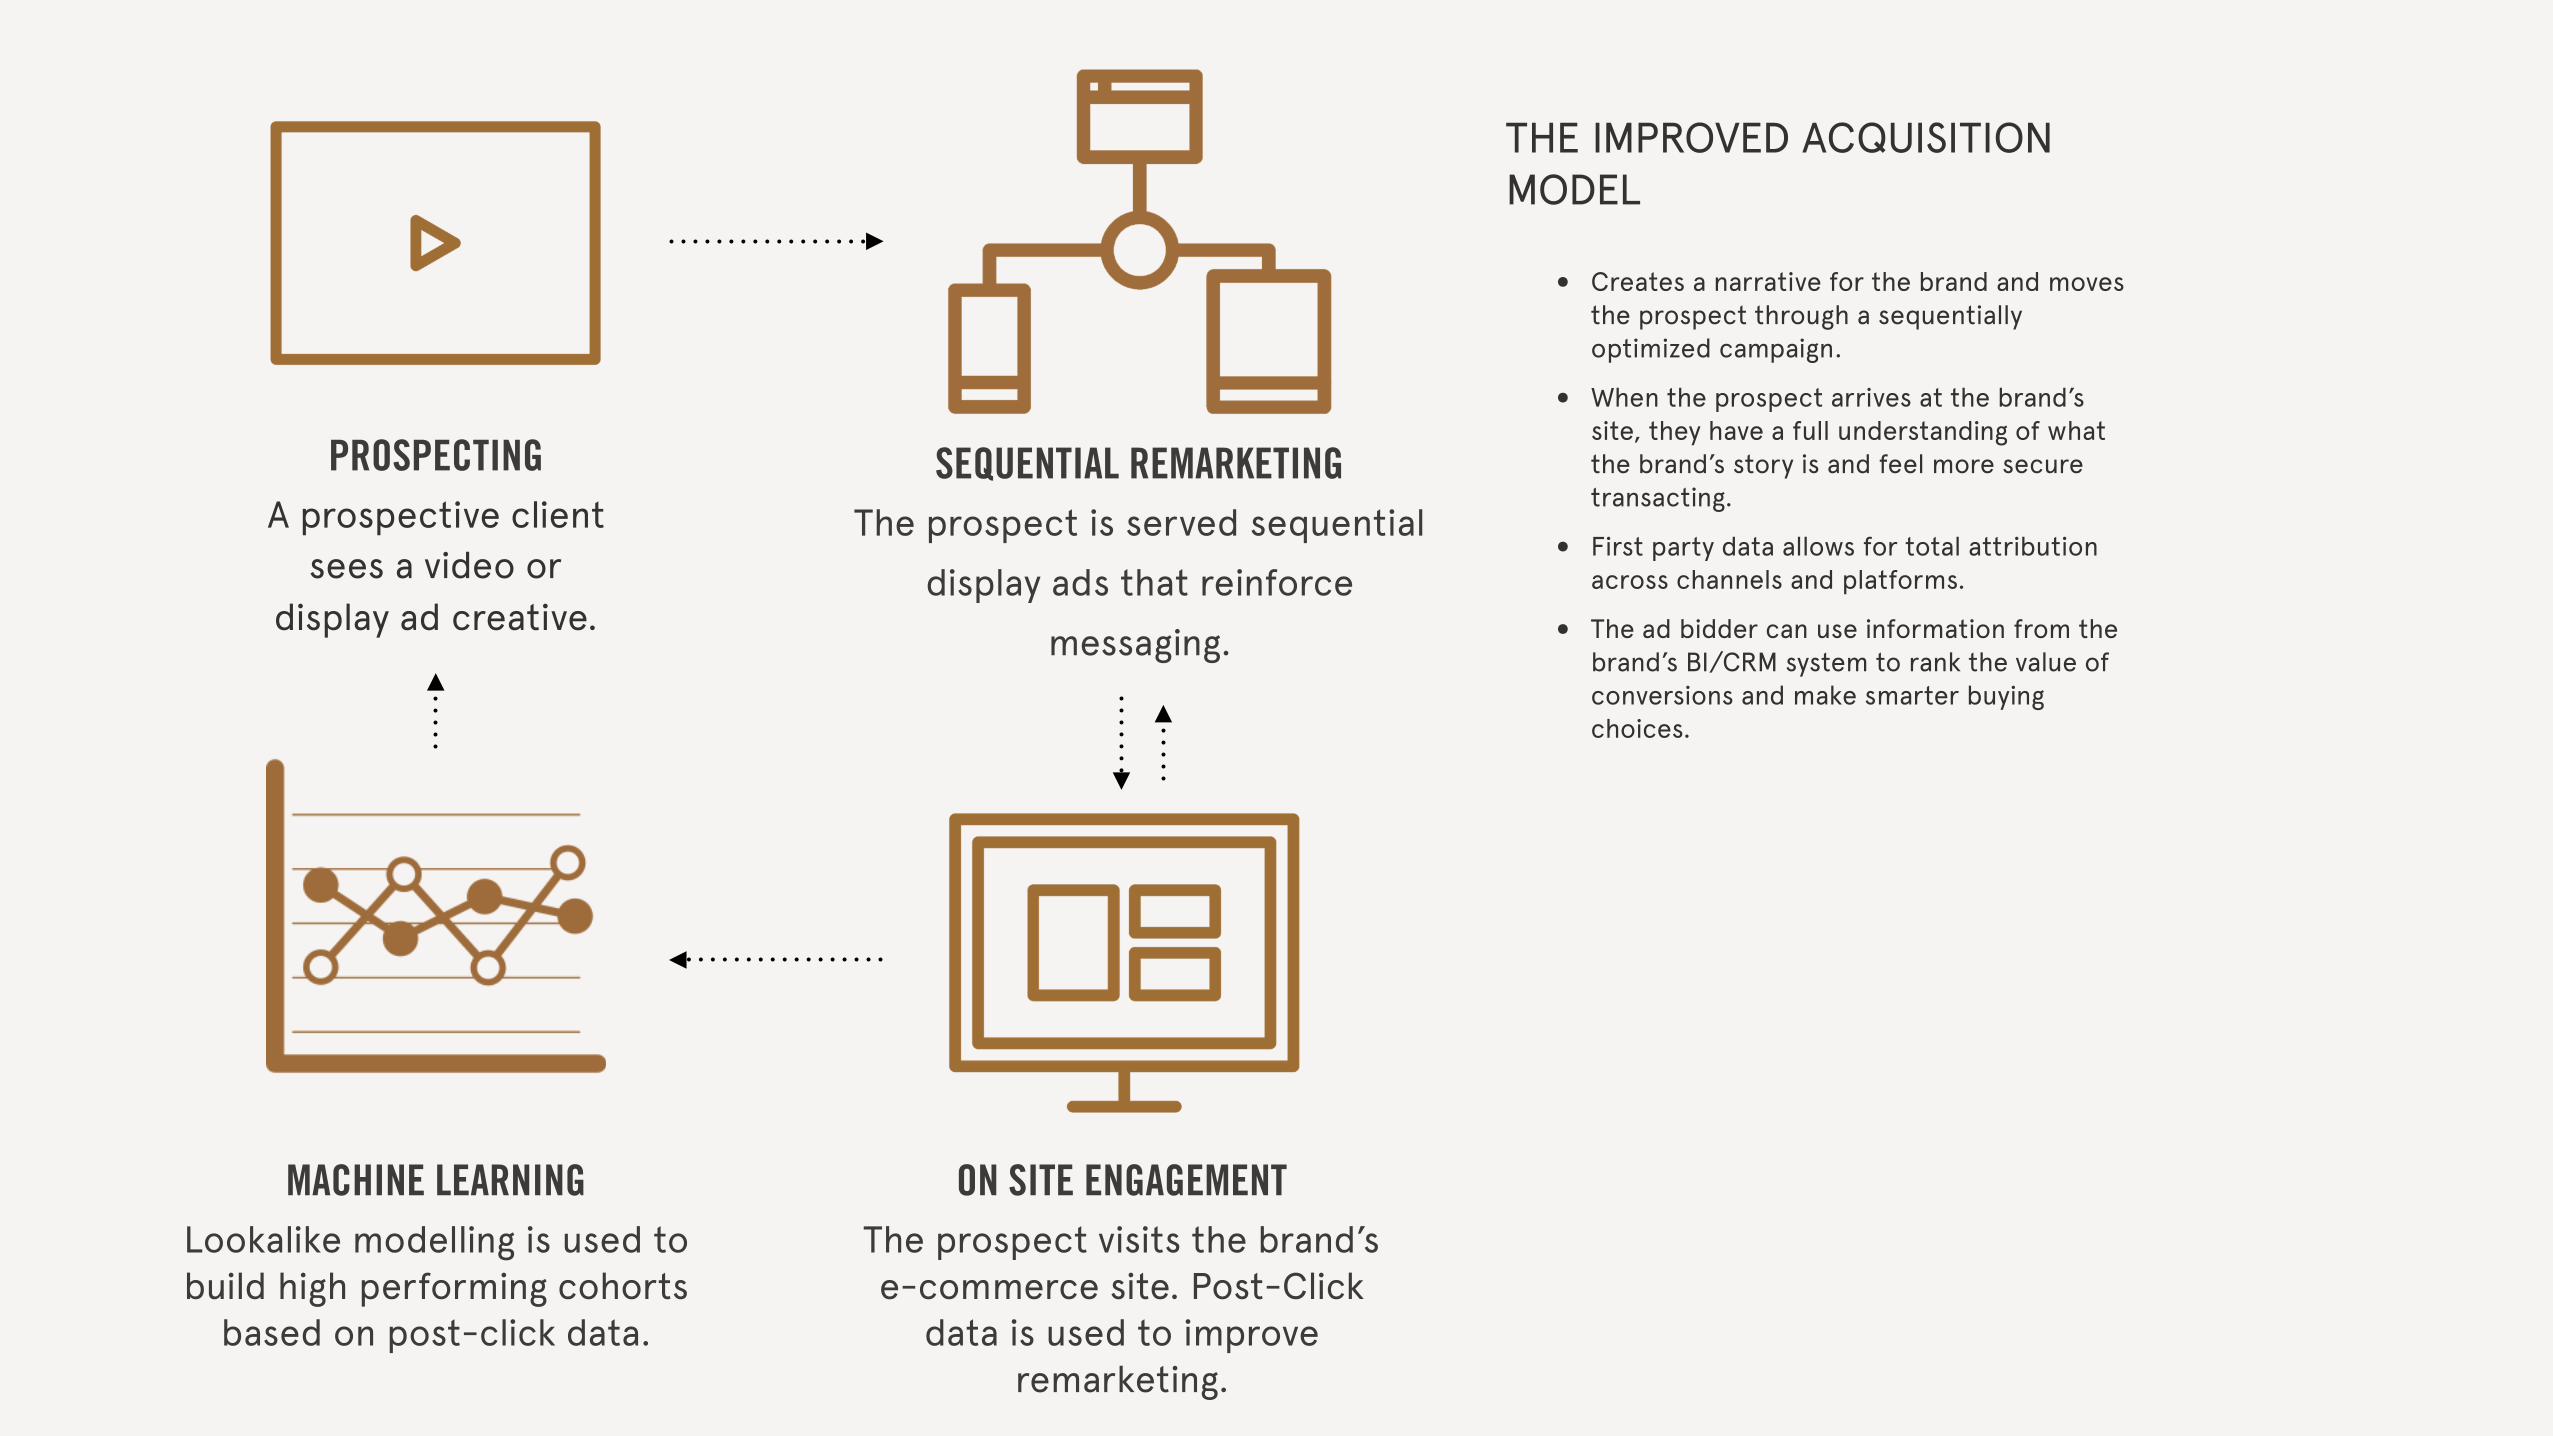
PROSPECTING
A prospective client sees a video or
display ad creative.
ON SITE ENGAGEMENT
The prospect visits the brand’s e-commerce site. Post-Click
data is used to improve remarketing.
SEQUENTIAL REMARKETING
The prospect is served sequential
display ads that reinforce
messaging.
MACHINE LEARNING
Lookalike modelling is used to build high performing cohorts
based on post-click data.
THE IMPROVED ACQUISITION MODEL
• Creates a narrative for the brand and moves the prospect through a sequentially optimized campaign.
• When the prospect arrives at the brand’s site, they have a full understanding of what the brand’s story is and feel more secure transacting.
• First party data allows for total attribution across channels and platforms.
• The ad bidder can use information from the brand’s BI/CRM system to rank the value of conversions and make smarter buying choices.

CASE STUDY: FRANK & OAK
PROBLEM
Users acquired through paid media have a lower conversion rate, lower AOV, and lower LTV compared to users who join through earned media. Why? Because banner ads are not an effective means of conveying the brand’s story or value.
EXECUTION
Use video to create a brand forward first touch targeted to the brand’s core demographic. Key audience members were re-engaged with sequential cross-media messaging.

CASE STUDY: FRANK & OAK
RESULTS
• Individuals who had been exposed to the video creative first, were 84% more likely to engage with a display unit than the control group.
• Conversion were 10% more likely in users acquired by this campaign.
• First time purchasers who discovered the brand through this campaign bought for 20% more than site-wide AOV (average order value).
• Delivered 3.5M impressions that were targeted to M18:40.

THANKS! QUESTIONS? AMAWANT TO LEARN MORE? @THEJUSTINADLER