creating barriers to accessing higher education: national educational policy and ethnicity
TRANSCRIPT

CREATING BARRIERS TO ACCESSING HIGHER EDUCATION: NATIONAL EDUCATIONAL POLICY AND ETHNICITYKamden K. StrunkOklahoma State University

BACKGROUND The current educational policy climate,
particularly those policies associated with ‘No Child Left Behind’ have been subject to much criticism (Hursh, 2007).
Others have specifically pointed to the effects that NCLB may have on the grounds of ethnic boundaries (Alsthuler & Schmautz, 2006).

RESEARCH QUESTIONS But – what is the extent of such inequalities,
and what effect might they have on access to higher education?
If NCLB is creating inequalities in education, what effect might these have on students of color in accessing higher education?
Specifically, how can we understand these policies as either removing or creating barriers in accessing higher education?

NATIONAL DATA To answer these questions, national data
collected by the Department of Education were analyzed.
Specifically of interest were the way that gaps in reading and math (both of which have long-term data) have changed since the passage of NCLB.
Of further interest were specific markers of college admission on HS transcripts, such as ACT and SAT scores, GPA, and other such markers.

FURTHER QUESTIONS State data are also used, collected from state
Departments of Education, in supplemental analyses.
These data are used in follow-up analyses to answer critical questions about the intersection between space and identity.
THEORETICAL FRAMEWORK In the present study, I mobilize large-scale data,
quantitative analyses, and the general linear model, all of which are typically associated with Positivism.
However, in the present study, the theoretical framework is critical.
U.S. D.O.E. data is used to critique U.S. D.O.E. practices.
The quantitative practices that are being called into question as means of educating students are, in fact, turned to critique that system itself.
Further, the nature of the research question calls for understanding the phenomenon on the national level, for which quantitative analyses of large-scale data are ideally suited.

METHOD Two government databases are analyzed in
the present study. In all cases, the data include seniors in high school from cases randomly selected by the Department of Education to create a representative sample.
The databases used are: The Long Term Trend database with reading and
math scores from 1970 to 2008 (n = 108,900). The High School Transcript database with data
from 1987 to 2009 (n = 181,200).
RESULTS There have been no statistically significant
improvements in the gap between white students and students of color over the past 40 years in reading or math.
However, it is worth noting that in the past ten years under NCLB, ‘white’ students have made statistically significant gains in achievement scores, widening the achievement gap.
The differences can be examined in markers of achievement, as well as in markers of access to higher education.

READING GAP
1975
1984
1990
1994
1999
2008
20
25
30
35
40
Gap White vs. Black
1975
1984
1990
1994
1999
2008
20
25
30
35
40
Gap White vs. Hispanic
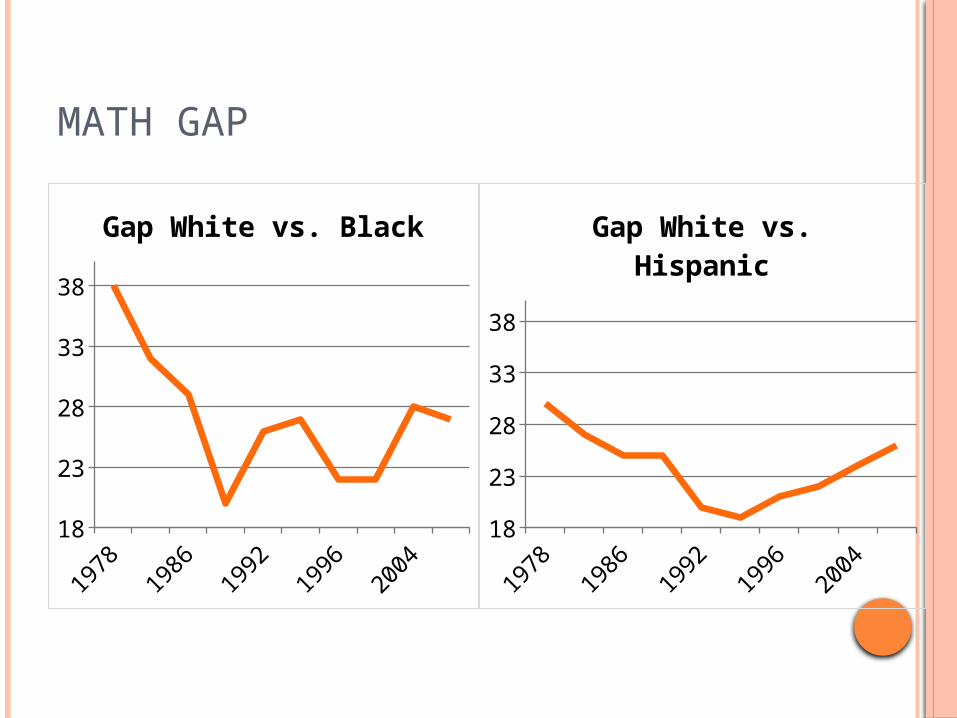
MATH GAP
1978
1986
1992
1996
2004
18
23
28
33
38
Gap White vs. Black
1978
1986
1992
1996
2004
18
23
28
33
38
Gap White vs. Hispanic

MARKERS OF ACCESS There are several key markers of access to
higher education that were also analyzed: Graduating GPA ACT and SAT scores AP and Pre-AP credits (these do not provide
access to higher education, but say something about the future read onto students, and may tell us something about tracking)
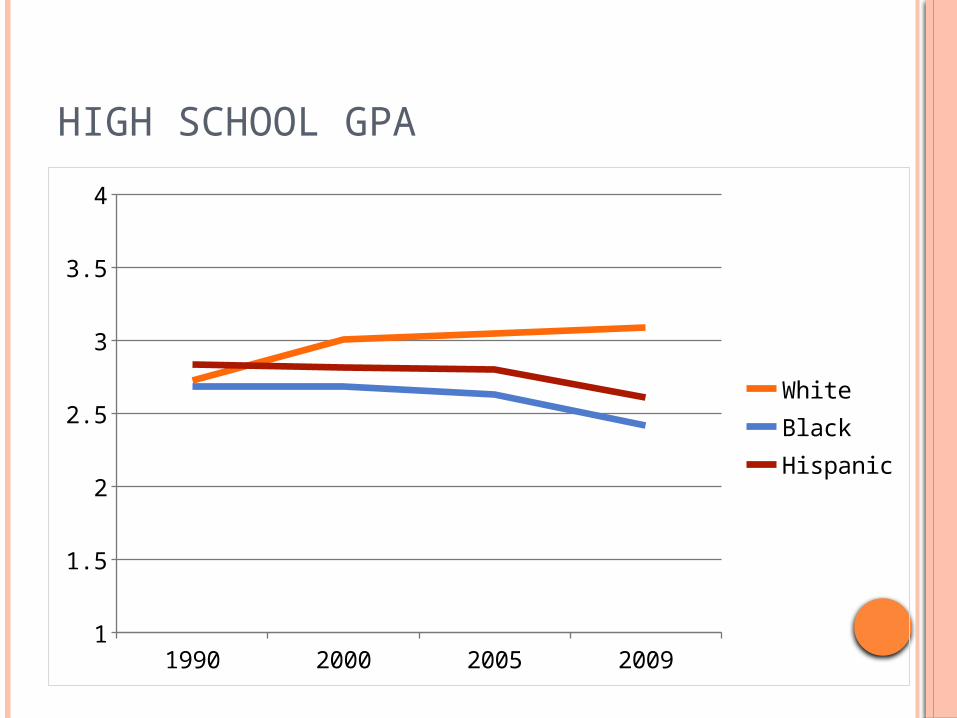
HIGH SCHOOL GPA
1990 2000 2005 20091
1.5
2
2.5
3
3.5
4
WhiteBlackHispanic

PRE-AP AND AP COURSES
1990 2000 2005 20090
1
2
3
4
5
6
WhiteBlackHispanic

COLLEGE ENTRANCE EXAMS: ACT
1990 2000 2005 200917
18
19
20
21
22
23
WhiteBlackHispanic

COLLEGE EXAMS: PSAT
1990 2000 2005 20093234363840424446485052
1990 2000 2005 20093234363840424446485052
WhiteBlackHispanic
Math Verbal

RACIALIZED SPACES The preceding data are the result of
nationalized averages from representative samples.
However, researchers have argued that the effects of NCLB are differentiated by the status of a school.
That is, the distribution of resources may be different for schools with a high representation of students of color, an effect exacerbated by the way that standardized tests function.

RACIALIZED SPACES To test this hypothesis, data were gathered
from state departments of education that included aggregated yearly test scores for seniors in high school by individual school.
Many states have provided this data, others have it publically available, and other (such as Oklahoma) require legal process to release their data (the release of these data is required by law).
INEQUALITY BY SCHOOL So what is the difference between schools
that are a majority of students of color, those that are a mixture of students, and those that are a majority of white students?
From these data clearly emerges a picture of how the racialized landscape of secondary education under current national education policy has served to create barriers to accessing higher education.

STATE-LEVEL NCLB TEST SCORES BY SCHOOL BY ETHNIC DIVERSITY
20002001200220032004200520062007200920106668707274767880828486
LowModerateHigh
CREATING BARRIERS TO ACCESSING HIGHER EDUCATION Who is being ‘left behind’ by current
educational policy discourses? How are school spaces involved in creating
these gaps in achievement? Further – how are these gaps, then, related to
differences in markers of access to college access?
Finally, what might the actual barriers created to accessing higher education be?