creating cartograms: making geographic areas speak volumes
TRANSCRIPT
Northeast Arc Users Group Spring Conference 2009 May 12
Creating Cartograms: Making Geographic Areas Speak VolumesAndy Anderson
Academic Technology ServicesAmherst CollegeAmherst, Massachusetts
Tuesday, May 12, 2009
Creating Cartograms: Making Geographic Areas Speak Volumes
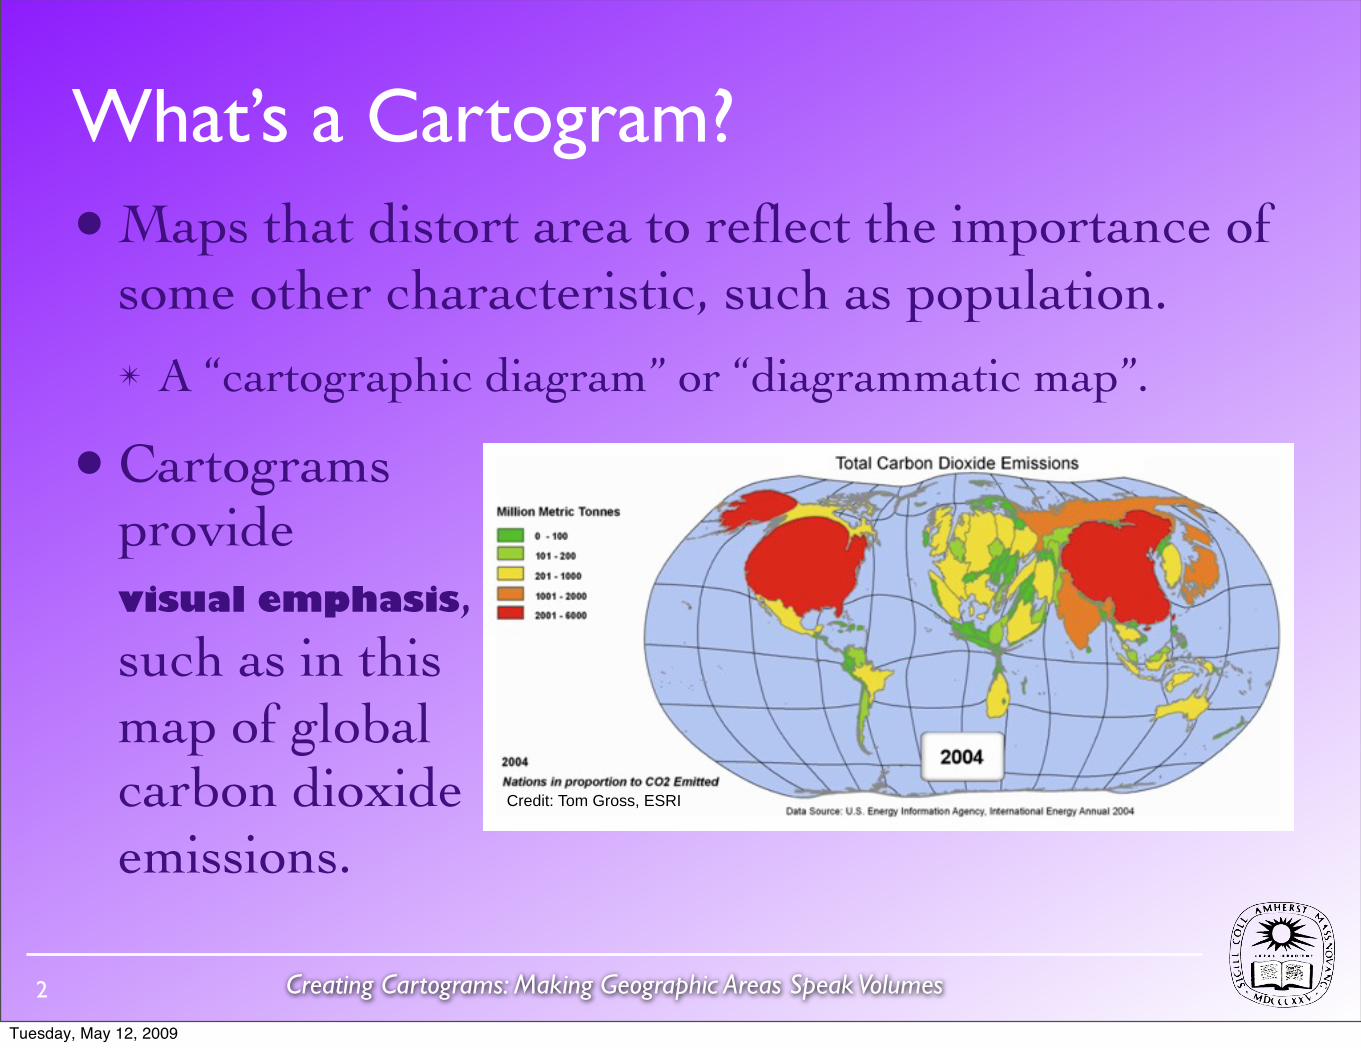
What’s a Cartogram?• Maps that distort area to reflect the importance of
some other characteristic, such as population.✴ A “cartographic diagram” or “diagrammatic map”.
• Cartograms provide visual emphasis, such as in this map of global carbon dioxide emissions.
Credit: Tom Gross, ESRI
2
Tuesday, May 12, 2009
Creating Cartograms: Making Geographic Areas Speak Volumes3
Tuesday, May 12, 2009
Creating Cartograms: Making Geographic Areas Speak Volumes
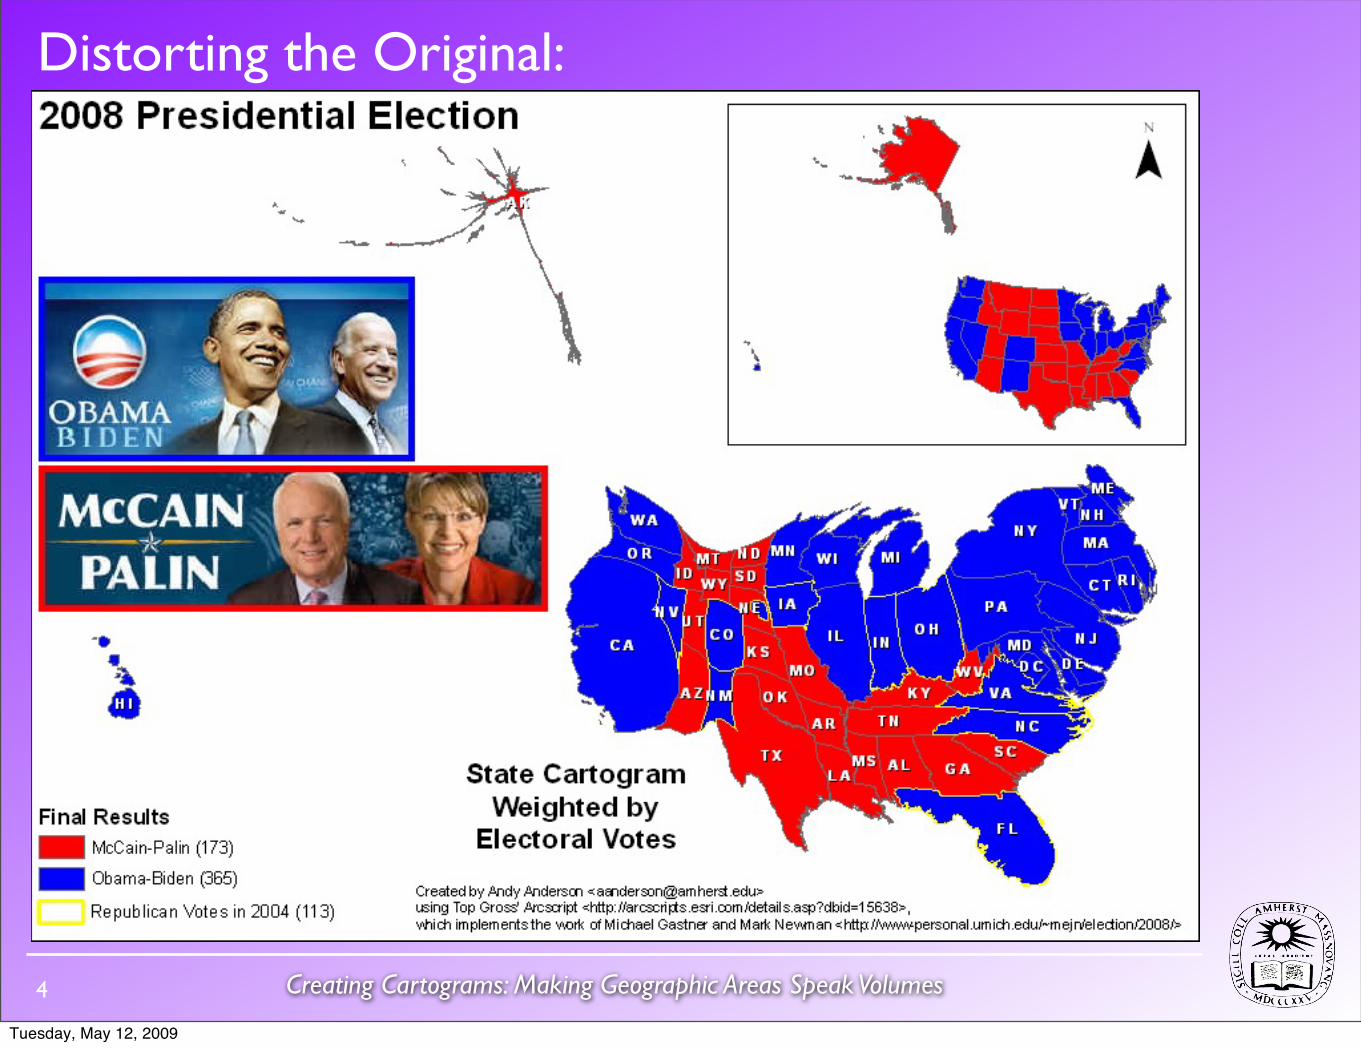
Distorting the Original:
4
Tuesday, May 12, 2009
Creating Cartograms: Making Geographic Areas Speak Volumes
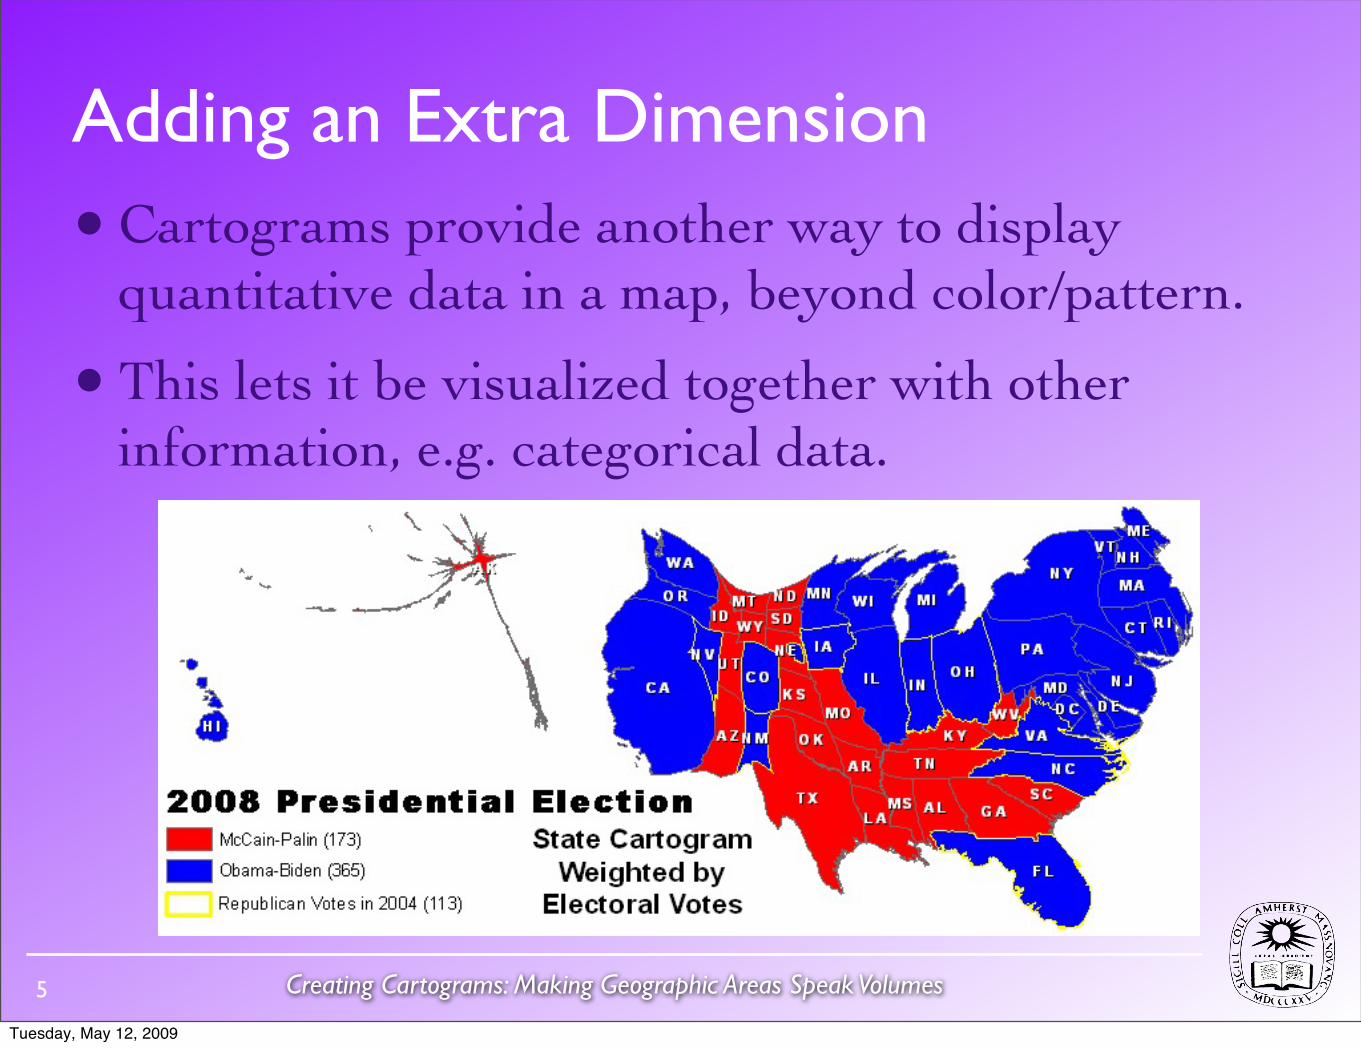
Adding an Extra Dimension• Cartograms provide another way to display
quantitative data in a map, beyond color/pattern.
• This lets it be visualized together with other information, e.g. categorical data.
5
Tuesday, May 12, 2009
Creating Cartograms: Making Geographic Areas Speak Volumes
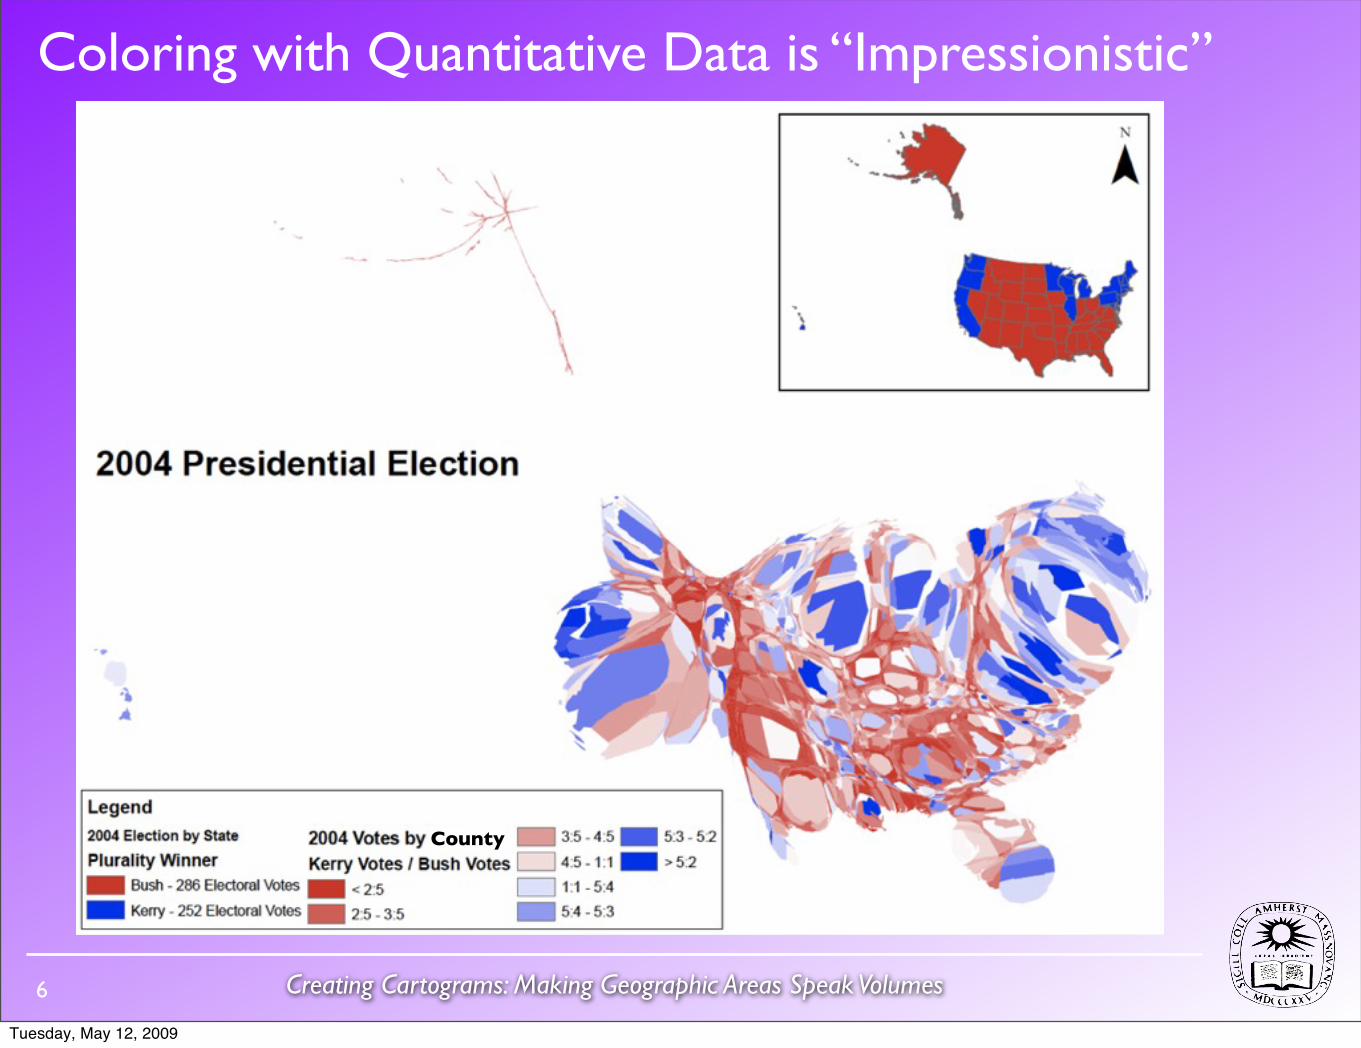
Coloring with Quantitative Data is “Impressionistic”
6
County
Tuesday, May 12, 2009
Creating Cartograms: Making Geographic Areas Speak Volumes
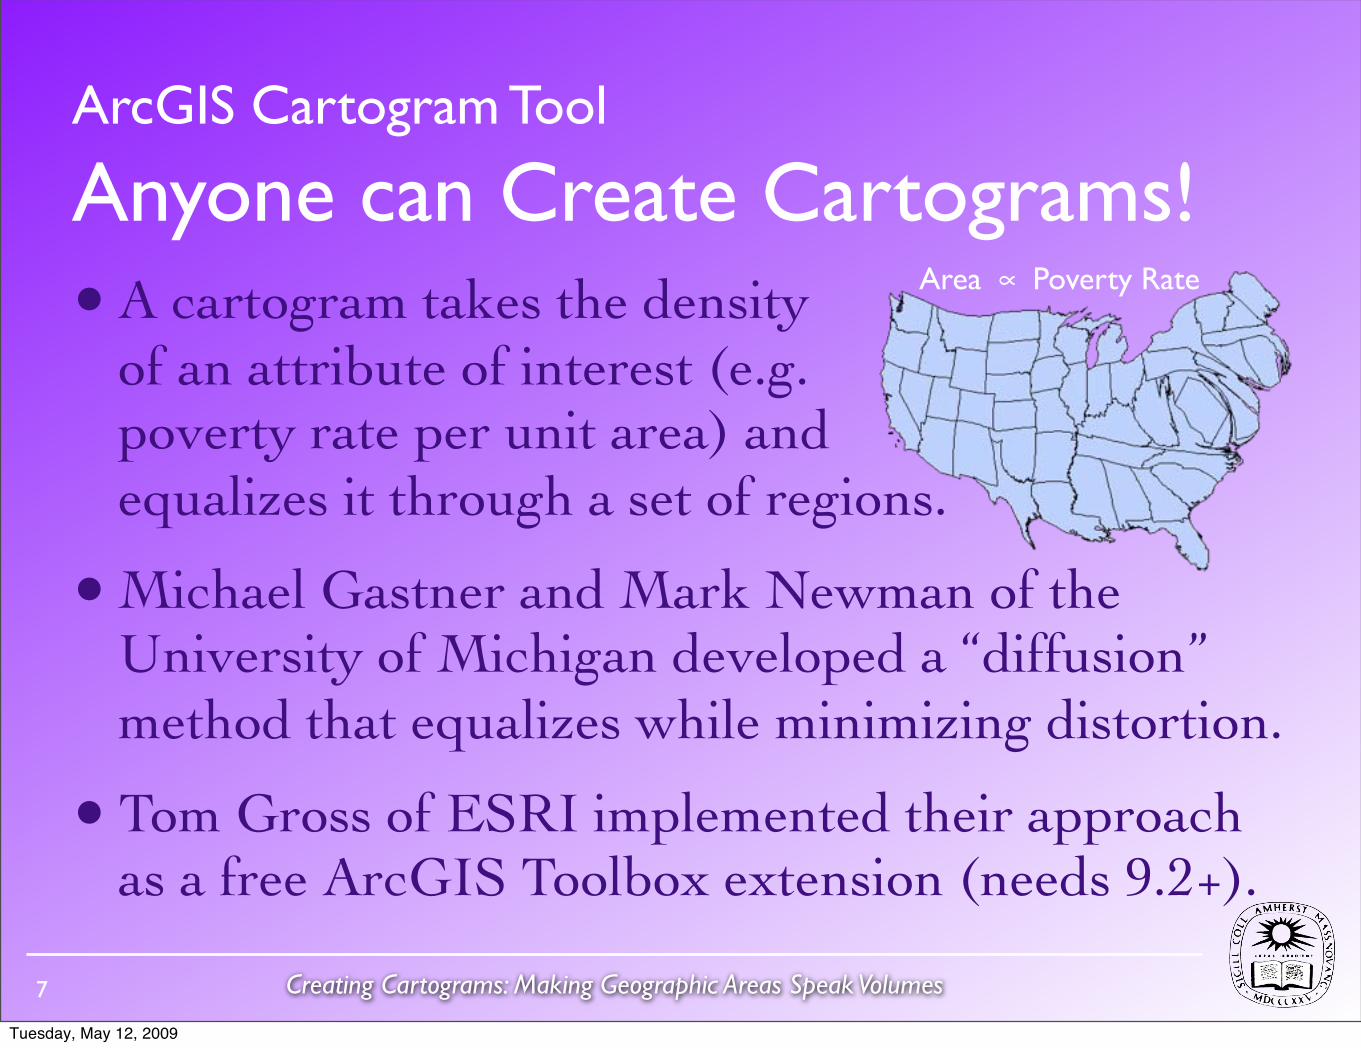
Anyone can Create Cartograms!• A cartogram takes the density
of an attribute of interest (e.g. poverty rate per unit area) and equalizes it through a set of regions.
• Michael Gastner and Mark Newman of the University of Michigan developed a “diffusion” method that equalizes while minimizing distortion.
• Tom Gross of ESRI implemented their approach as a free ArcGIS Toolbox extension (needs 9.2+).
Area ∝ Poverty Rate
ArcGIS Cartogram Tool
7
Tuesday, May 12, 2009
Creating Cartograms: Making Geographic Areas Speak Volumes
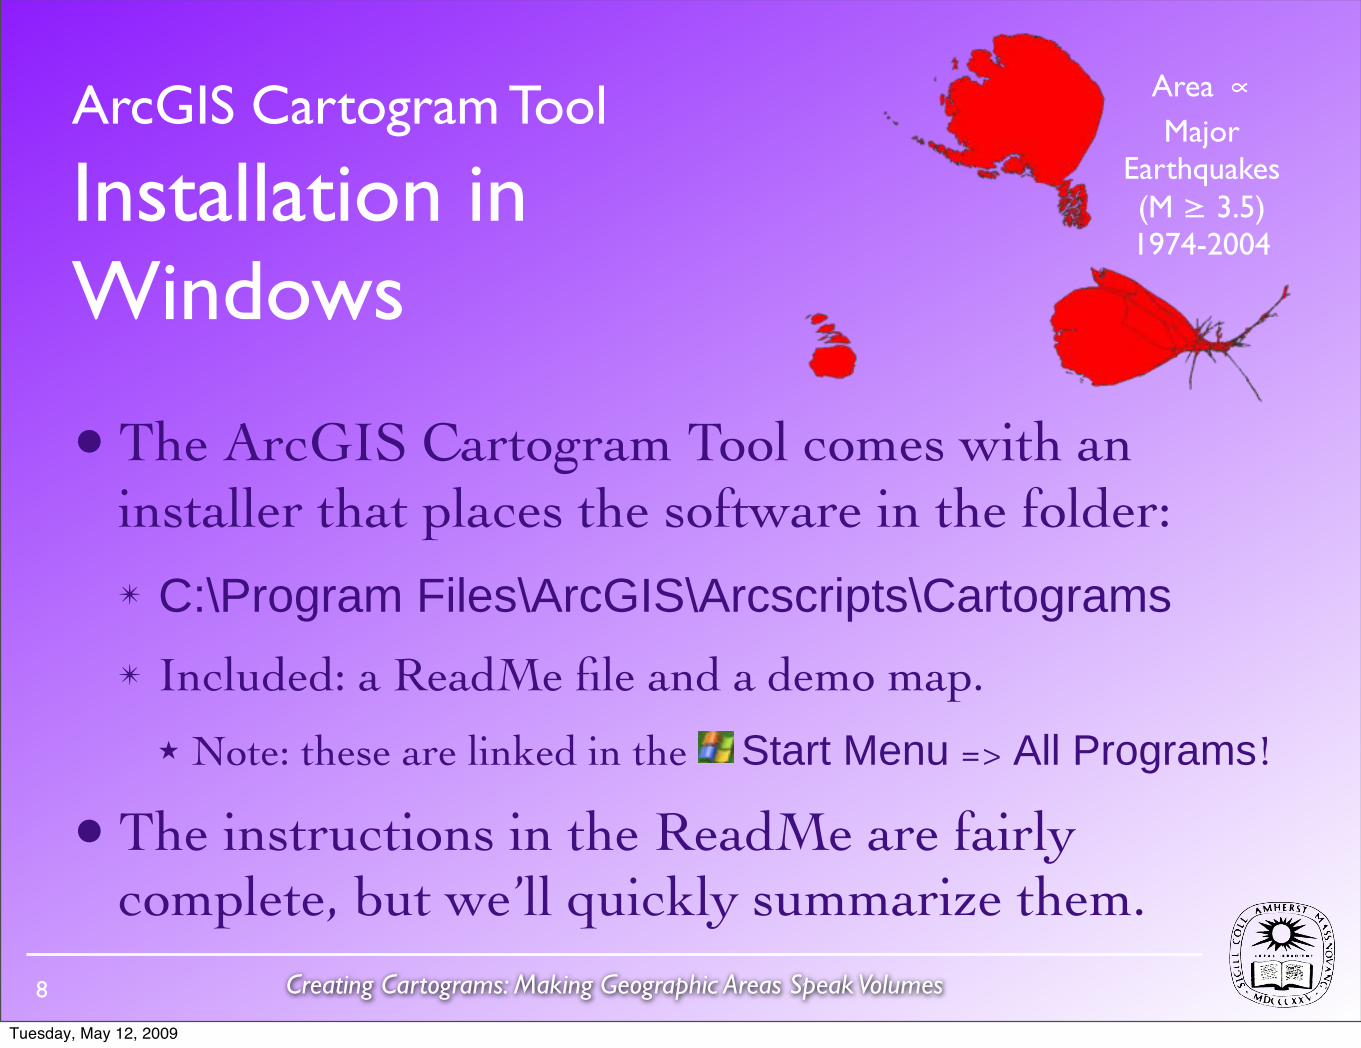
• The ArcGIS Cartogram Tool comes with an installer that places the software in the folder: ✴ C:\Program Files\ArcGIS\Arcscripts\Cartograms✴ Included: a ReadMe file and a demo map.
★ Note: these are linked in the Start Menu => All Programs!
• The instructions in the ReadMe are fairly complete, but we’ll quickly summarize them.
ArcGIS Cartogram Tool
Installation in Windows
Area ∝ Major
Earthquakes(M ≥ 3.5) 1974-2004
8
Tuesday, May 12, 2009
Creating Cartograms: Making Geographic Areas Speak Volumes
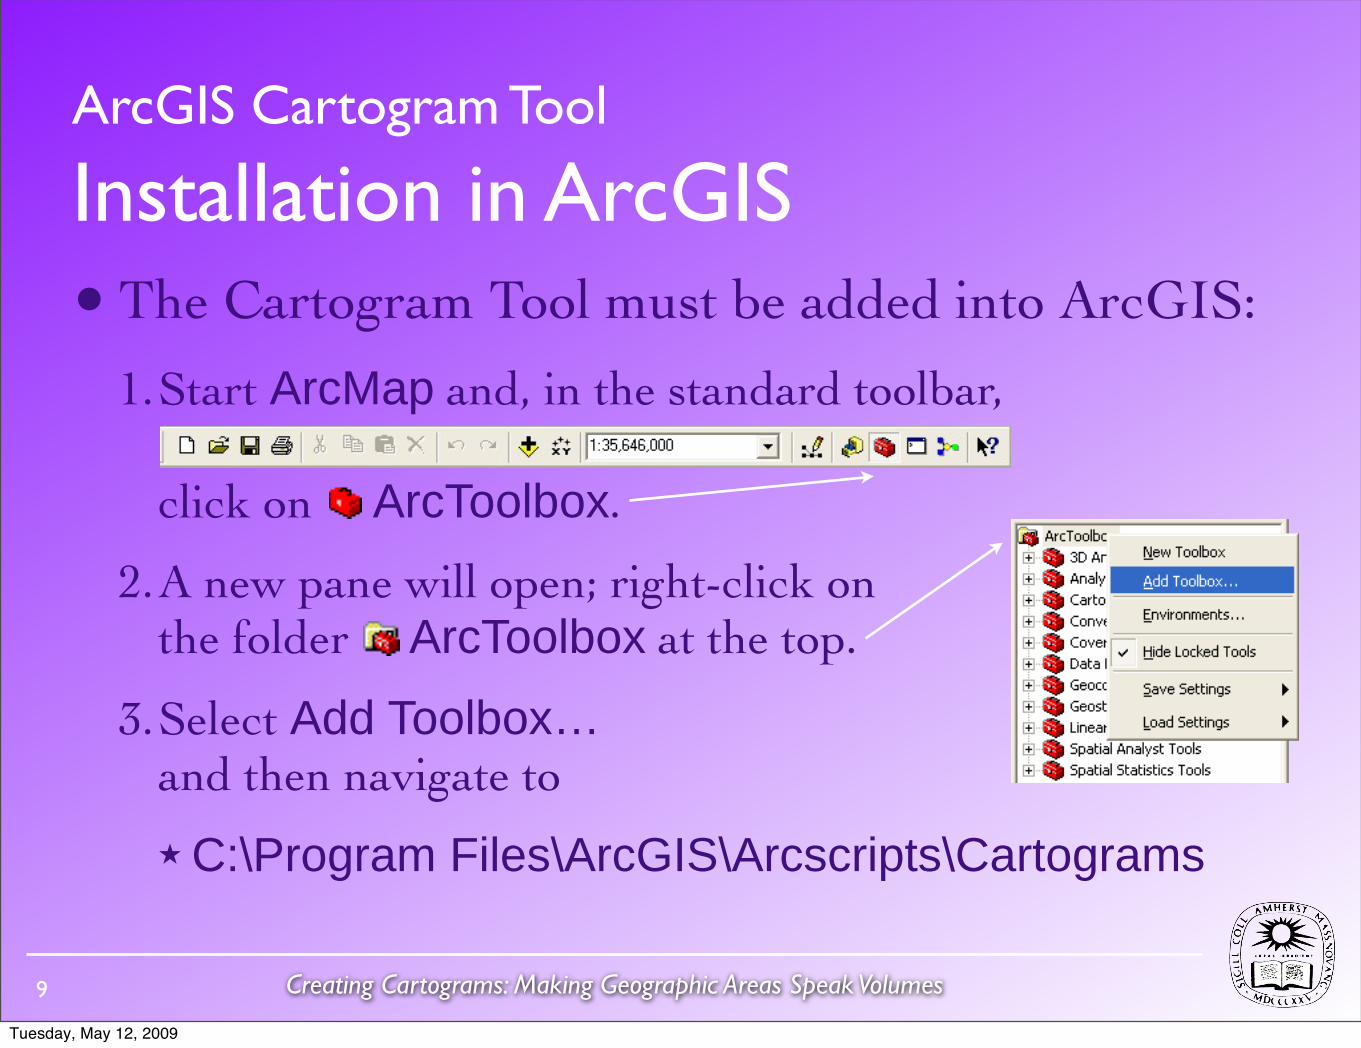
• The Cartogram Tool must be added into ArcGIS:
1.Start ArcMap and, in the standard toolbar, click on ArcToolbox.
2.A new pane will open; right-click on the folder ArcToolbox at the top.
3.Select Add Toolbox… and then navigate to
★ C:\Program Files\ArcGIS\Arcscripts\Cartograms
ArcGIS Cartogram Tool
Installation in ArcGIS
9
Tuesday, May 12, 2009
Creating Cartograms: Making Geographic Areas Speak Volumes
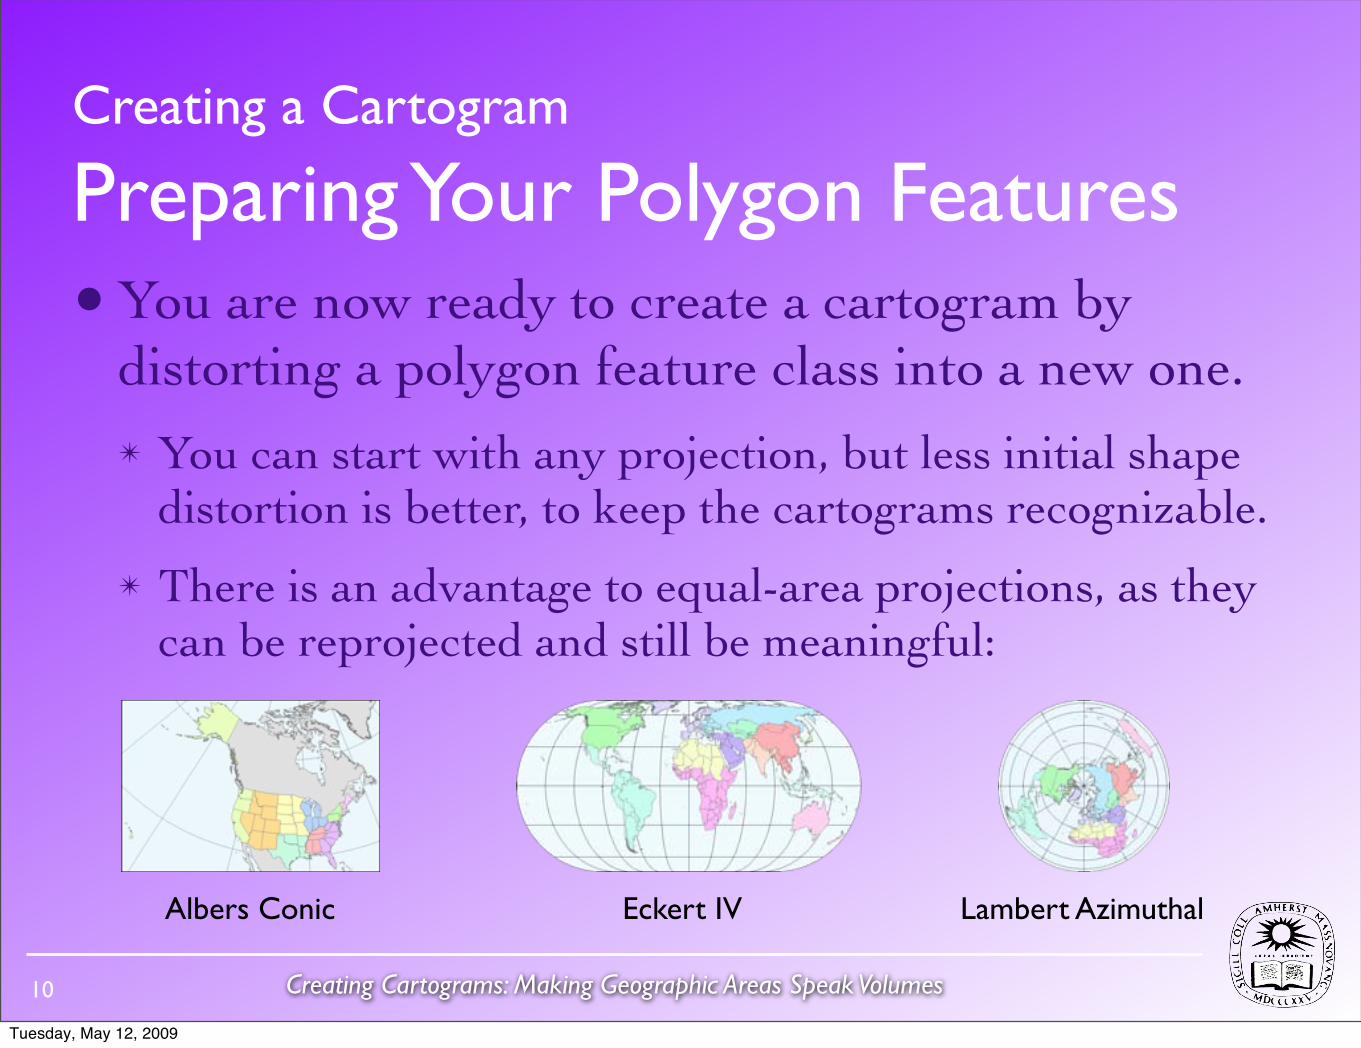
• You are now ready to create a cartogram by distorting a polygon feature class into a new one.✴ You can start with any projection, but less initial shape
distortion is better, to keep the cartograms recognizable.
✴ There is an advantage to equal-area projections, as they can be reprojected and still be meaningful:
Creating a Cartogram
Preparing Your Polygon Features
Eckert IV
10
Lambert AzimuthalAlbers Conic
Tuesday, May 12, 2009
Creating Cartograms: Making Geographic Areas Speak Volumes
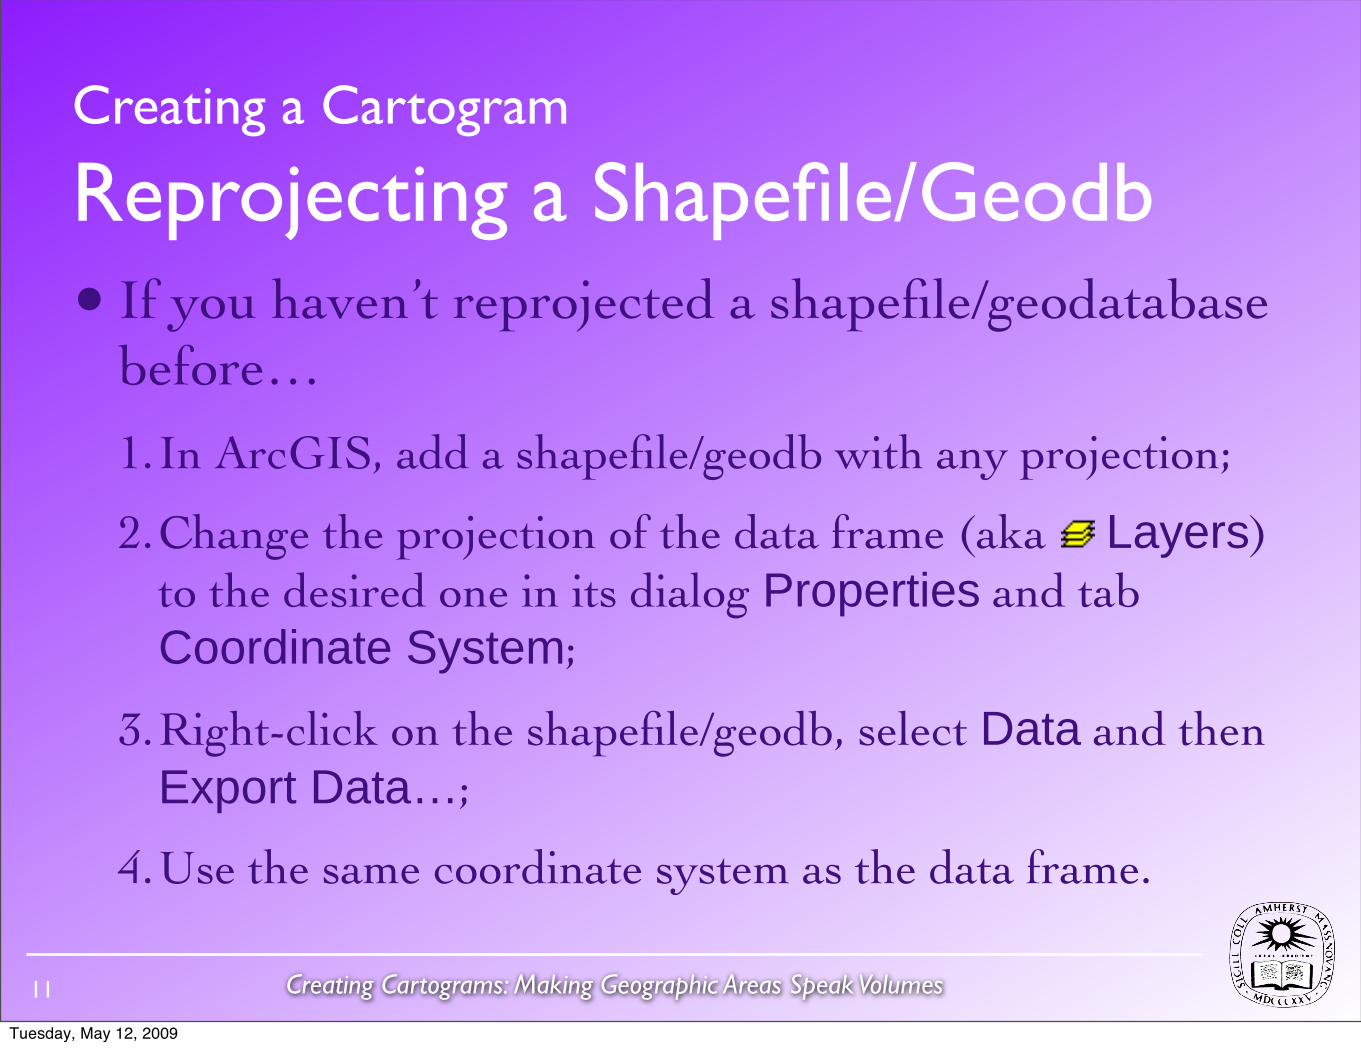
• If you haven’t reprojected a shapefile/geodatabase before…
1.In ArcGIS, add a shapefile/geodb with any projection;
2.Change the projection of the data frame (aka Layers) to the desired one in its dialog Properties and tab Coordinate System;
3.Right-click on the shapefile/geodb, select Data and then Export Data…;
4.Use the same coordinate system as the data frame.
Creating a Cartogram
Reprojecting a Shapefile/Geodb
11
Tuesday, May 12, 2009
Creating Cartograms: Making Geographic Areas Speak Volumes
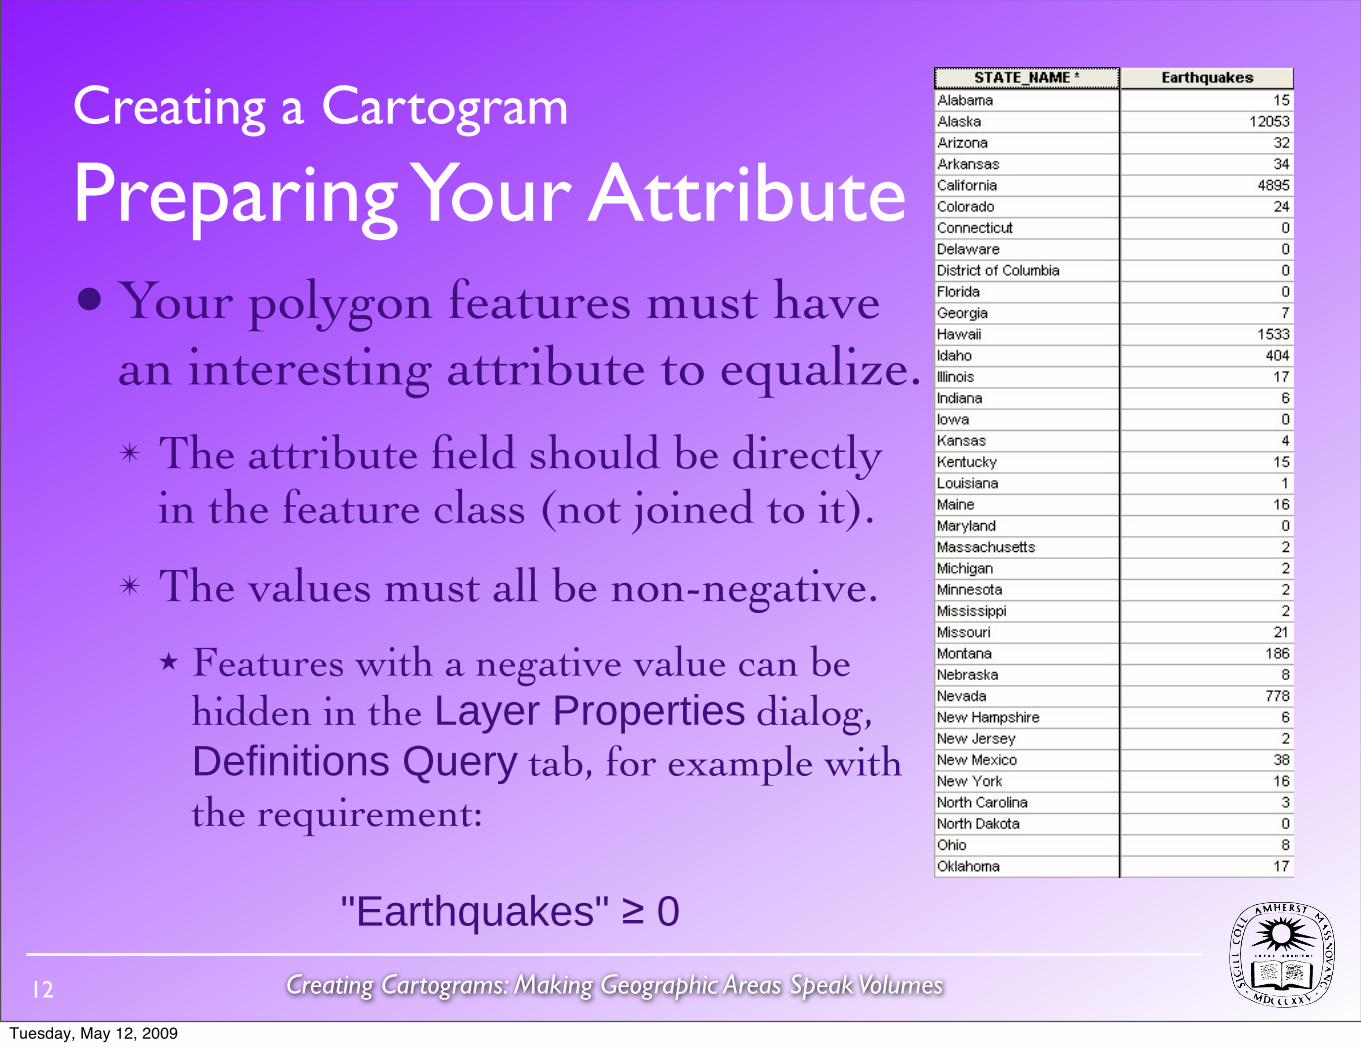
• Your polygon features must have an interesting attribute to equalize.✴ The attribute field should be directly
in the feature class (not joined to it).
✴ The values must all be non-negative.★ Features with a negative value can be
hidden in the Layer Properties dialog, Definitions Query tab, for example with the requirement:
"Earthquakes" ≥ 0
Creating a Cartogram
Preparing Your Attribute
12
Tuesday, May 12, 2009
Creating Cartograms: Making Geographic Areas Speak Volumes
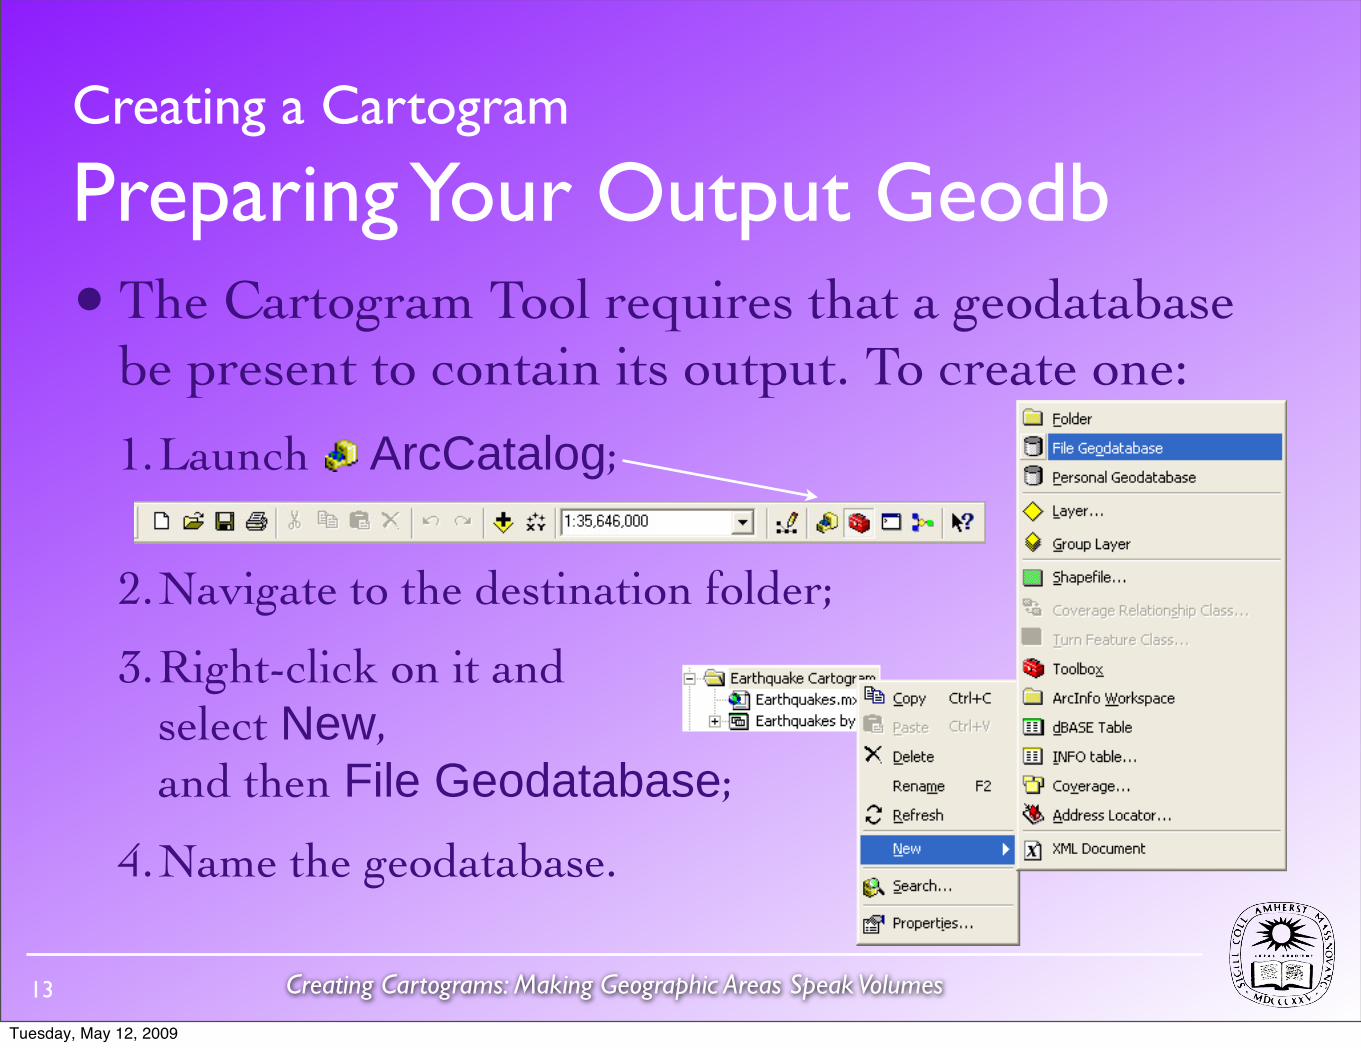
• The Cartogram Tool requires that a geodatabase be present to contain its output. To create one:
1.Launch ArcCatalog;
2.Navigate to the destination folder;
3.Right-click on it and select New, and then File Geodatabase;
4.Name the geodatabase.
Creating a Cartogram
Preparing Your Output Geodb
13
Tuesday, May 12, 2009
Creating Cartograms: Making Geographic Areas Speak Volumes
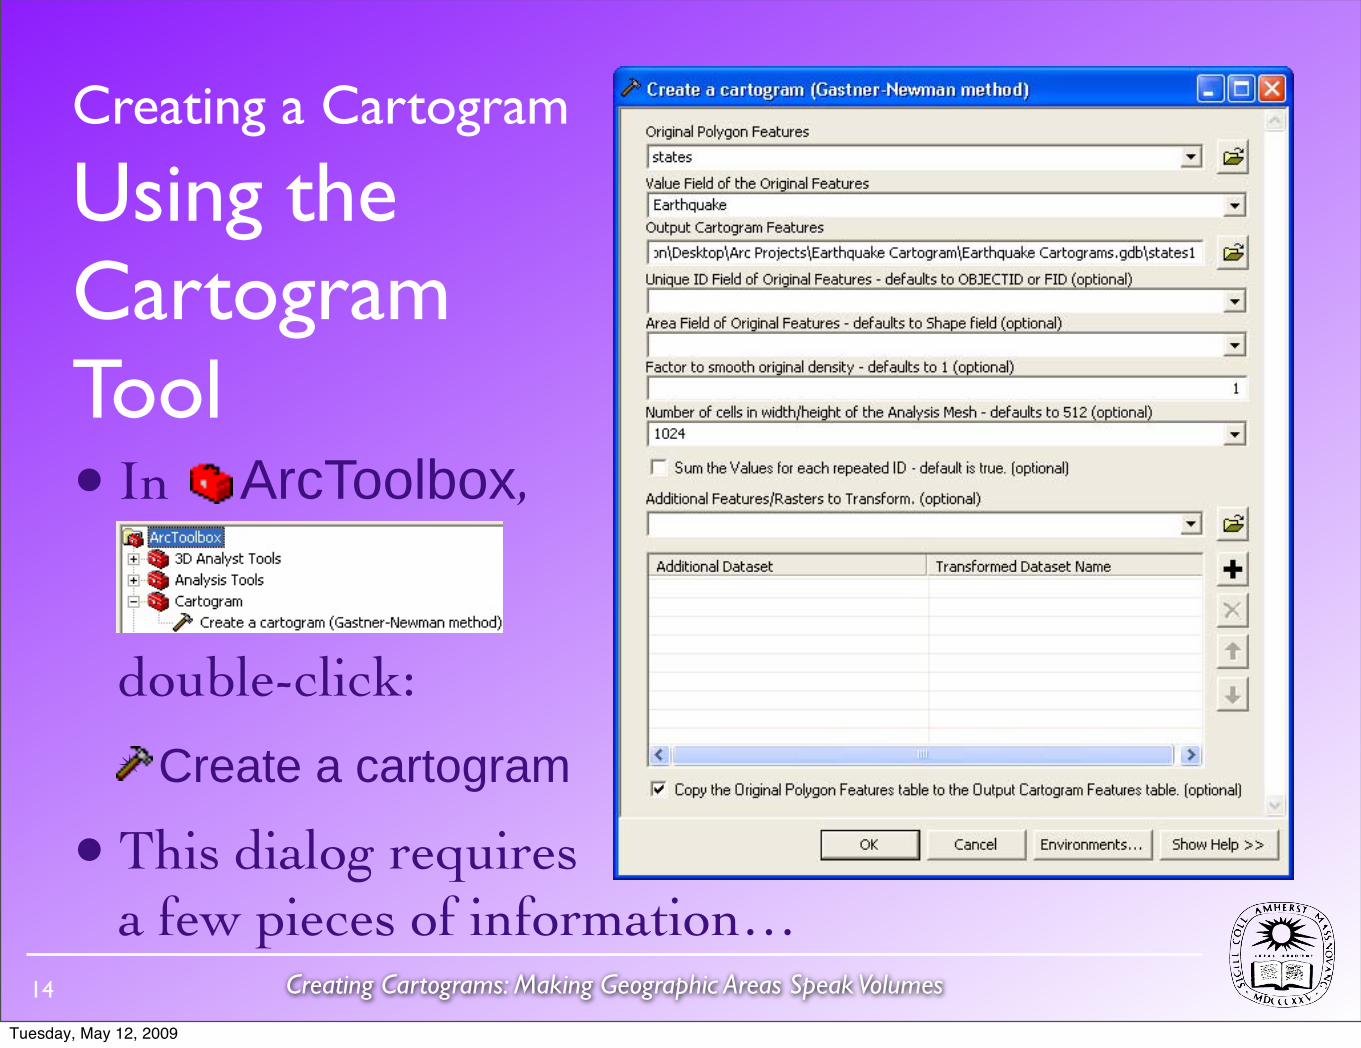
• In ArcToolbox,
double-click:✴ Create a cartogram
• This dialog requires a few pieces of information…
Creating a Cartogram
Using the Cartogram Tool
14
Tuesday, May 12, 2009
Creating Cartograms: Making Geographic Areas Speak Volumes
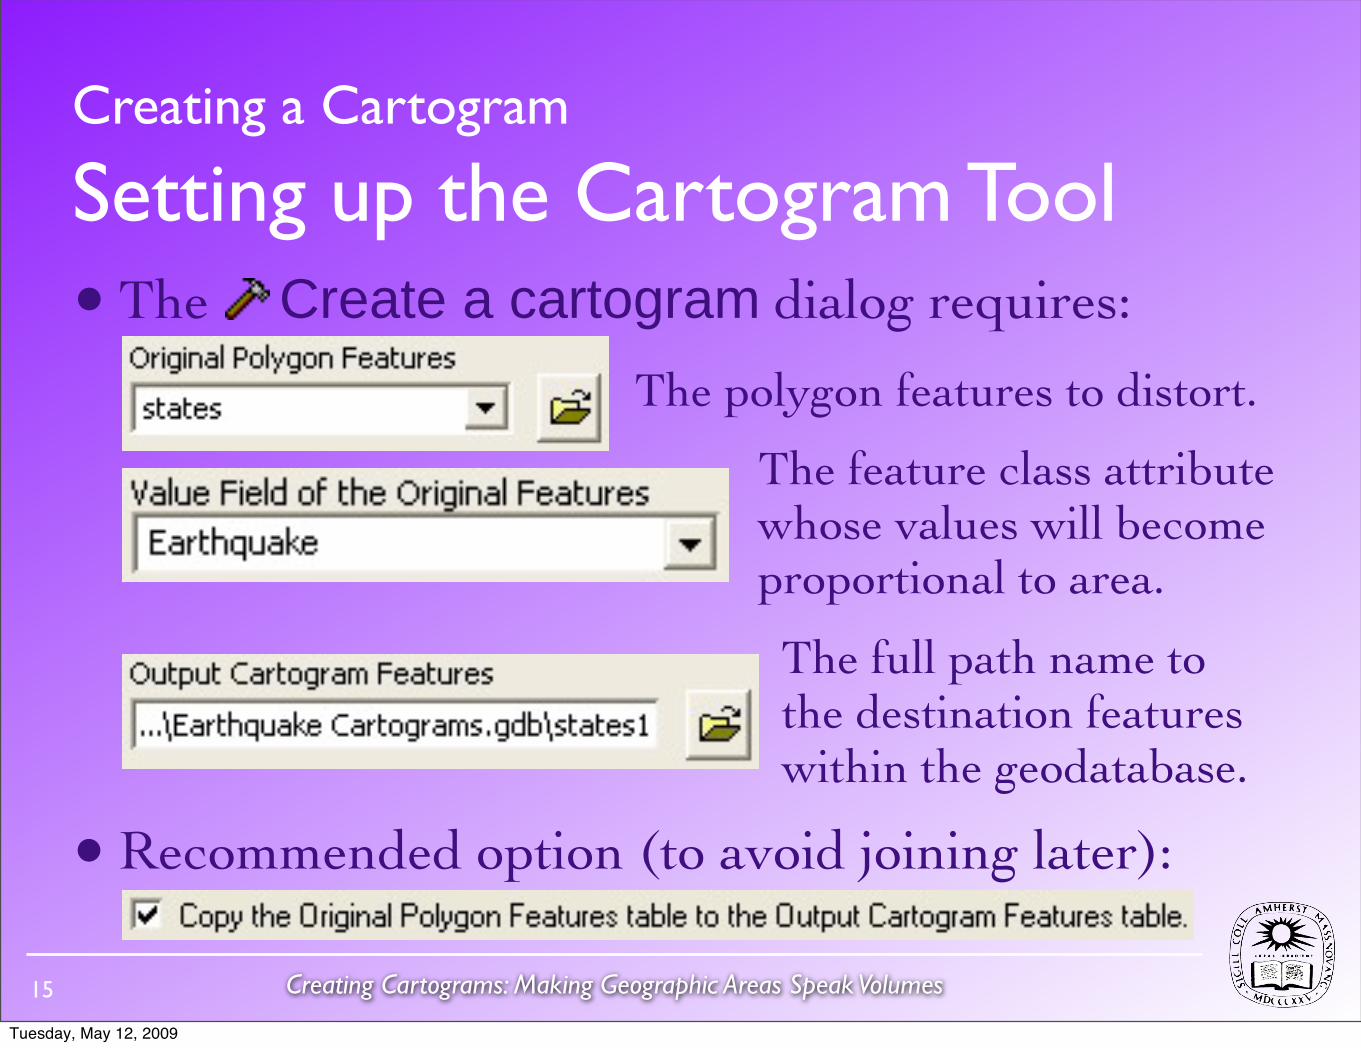
• The Create a cartogram dialog requires:
The polygon features to distort.
The feature class attribute whose values will become proportional to area.
The full path name to the destination features within the geodatabase.
• Recommended option (to avoid joining later):
Creating a Cartogram
Setting up the Cartogram Tool
15
Tuesday, May 12, 2009
Creating Cartograms: Making Geographic Areas Speak Volumes
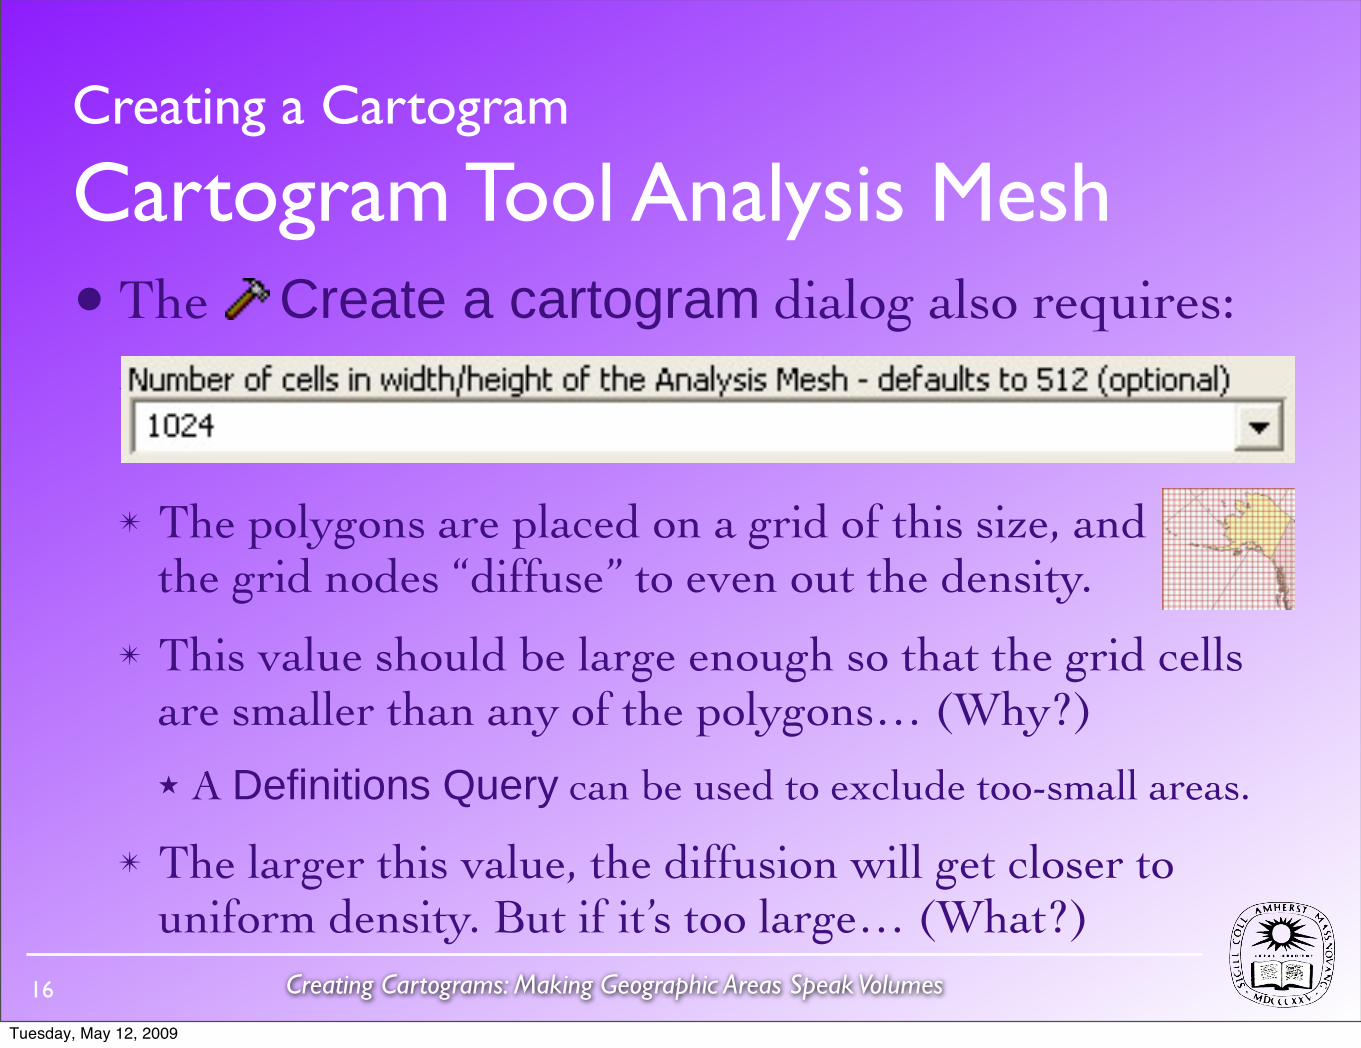
• The Create a cartogram dialog also requires:
✴
✴ The polygons are placed on a grid of this size, and the grid nodes “diffuse” to even out the density.
✴ This value should be large enough so that the grid cells are smaller than any of the polygons… (Why?)★ A Definitions Query can be used to exclude too-small areas.
✴ The larger this value, the diffusion will get closer to uniform density. But if it’s too large… (What?)
Creating a Cartogram
Cartogram Tool Analysis Mesh
16
Tuesday, May 12, 2009
Creating Cartograms: Making Geographic Areas Speak Volumes
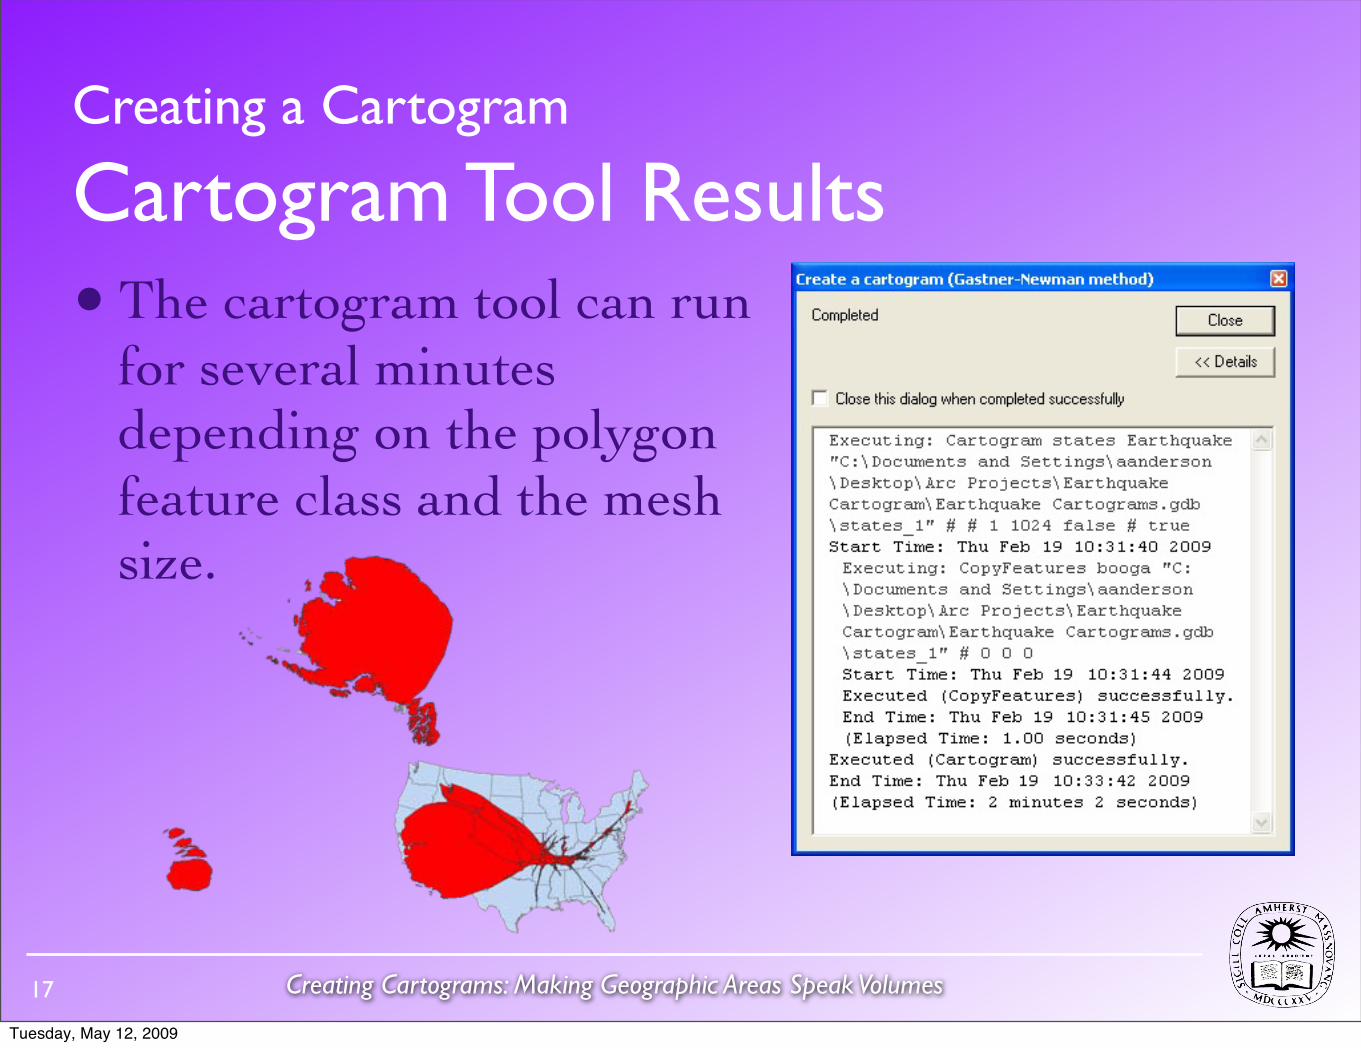
• The cartogram tool can run for several minutes depending on the polygon feature class and the mesh size.
Creating a Cartogram
Cartogram Tool Results
17
Tuesday, May 12, 2009
Creating Cartograms: Making Geographic Areas Speak Volumes
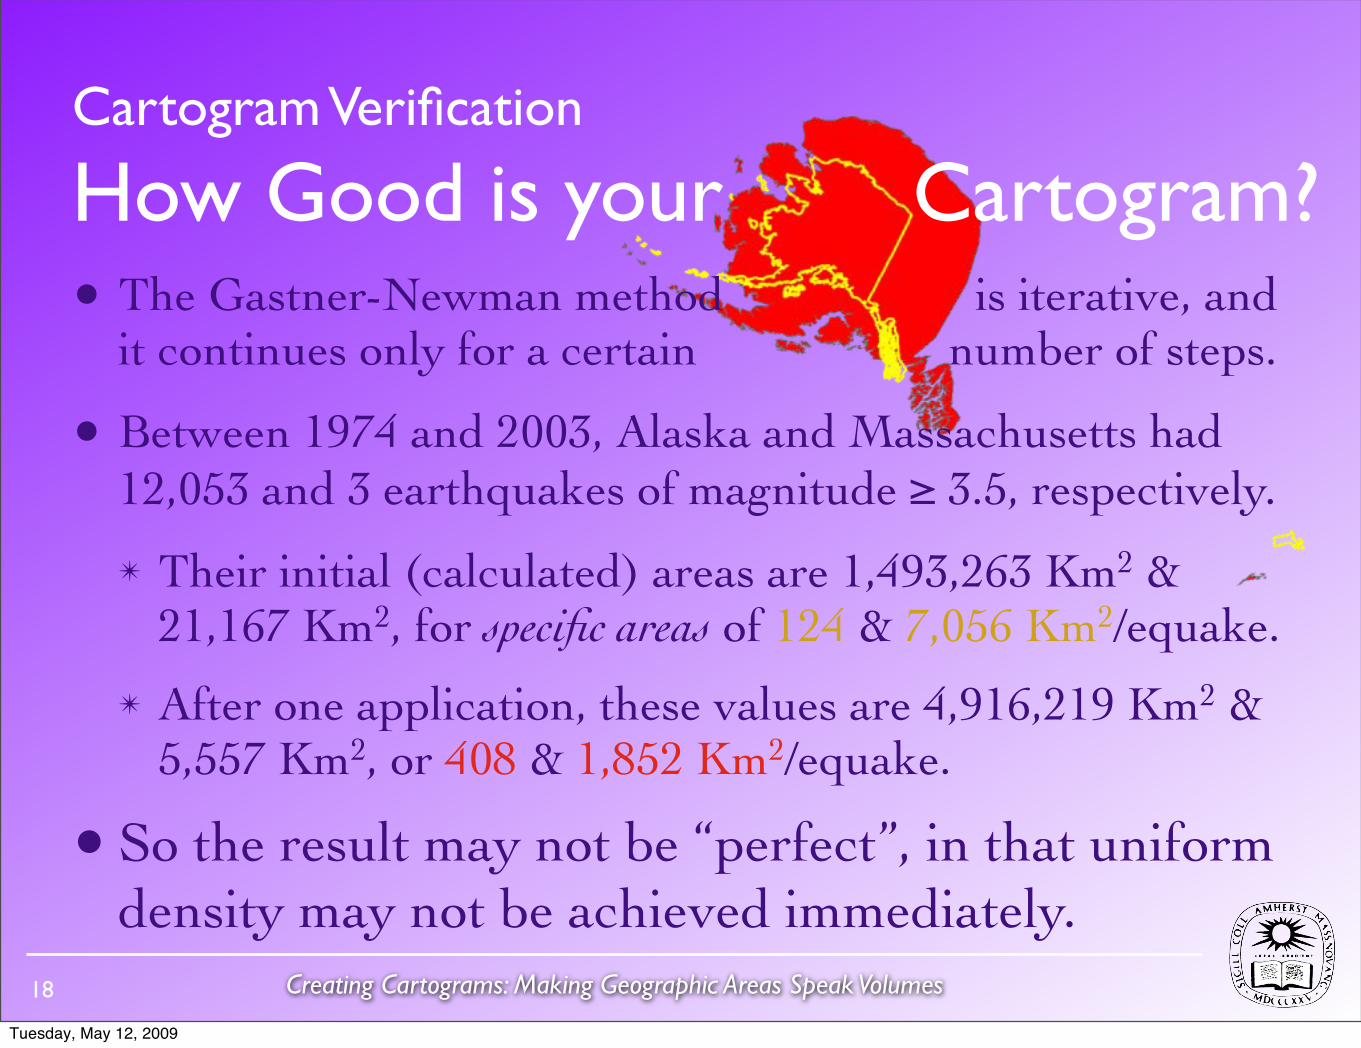
• The Gastner-Newman method is iterative, and it continues only for a certain number of steps.
• Between 1974 and 2003, Alaska and Massachusetts had 12,053 and 3 earthquakes of magnitude ≥ 3.5, respectively.
✴ Their initial (calculated) areas are 1,493,263 Km2 & 21,167 Km2, for specific areas of 124 & 7,056 Km2/equake.
✴ After one application, these values are 4,916,219 Km2 & 5,557 Km2, or 408 & 1,852 Km2/equake.
• So the result may not be “perfect”, in that uniform density may not be achieved immediately.
Cartogram Verification
How Good is your Cartogram?
18
Tuesday, May 12, 2009
Creating Cartograms: Making Geographic Areas Speak Volumes
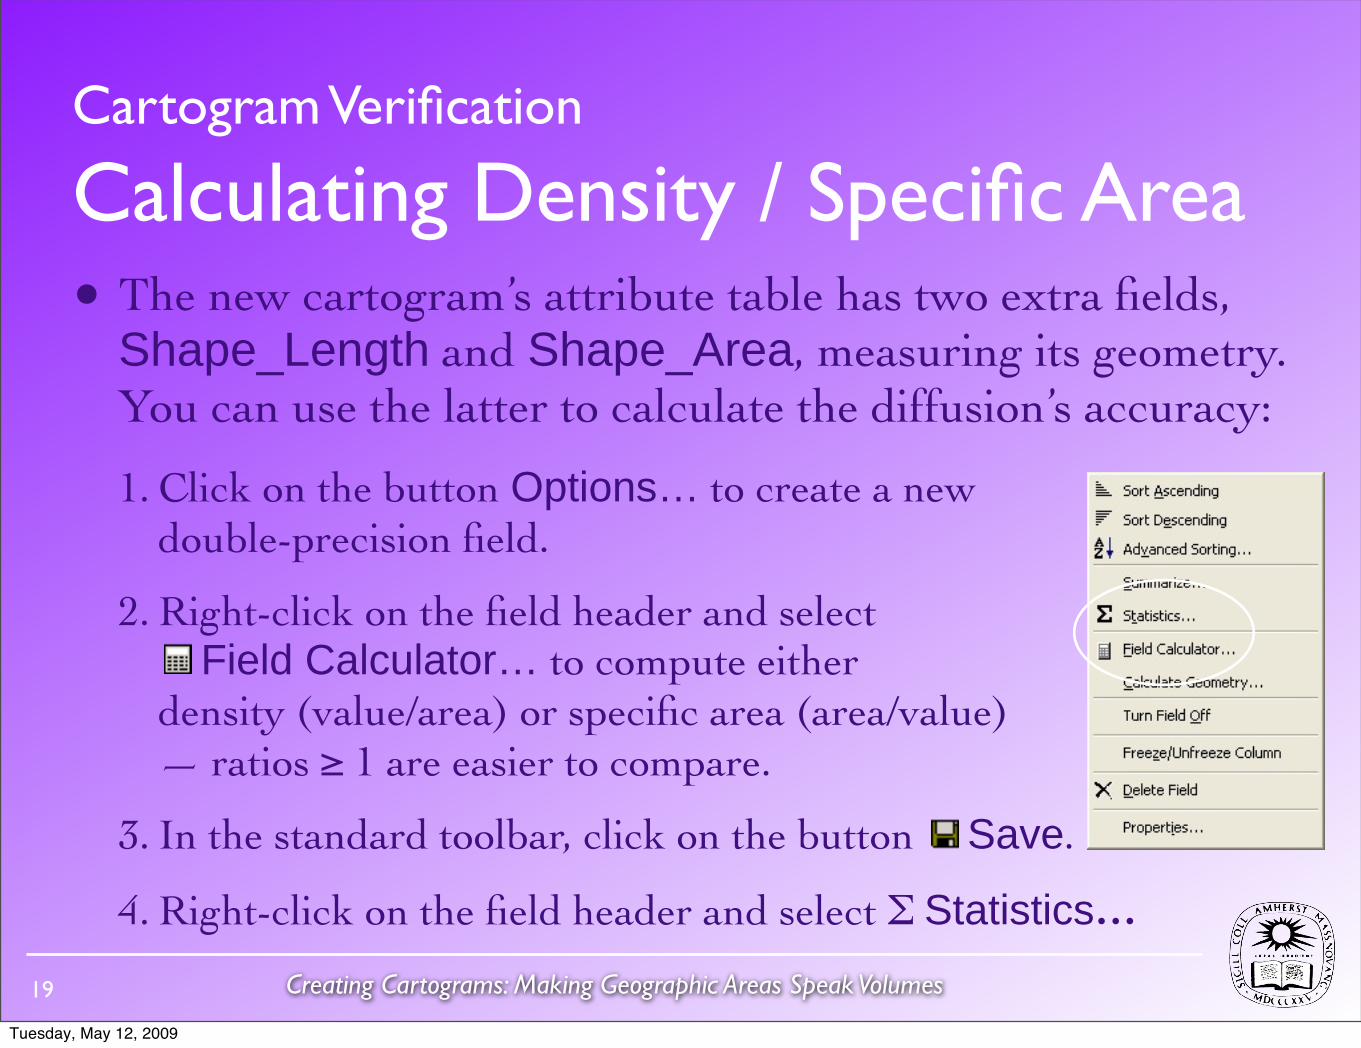
• The new cartogram’s attribute table has two extra fields, Shape_Length and Shape_Area, measuring its geometry. You can use the latter to calculate the diffusion’s accuracy:
1. Click on the button Options… to create a new double-precision field.
2. Right-click on the field header and select Field Calculator… to compute eitherdensity (value/area) or specific area (area/value) — ratios ≥ 1 are easier to compare.
3. In the standard toolbar, click on the button Save.
4. Right-click on the field header and select Σ Statistics…
Cartogram Verification
Calculating Density / Specific Area
19
Tuesday, May 12, 2009
Creating Cartograms: Making Geographic Areas Speak Volumes
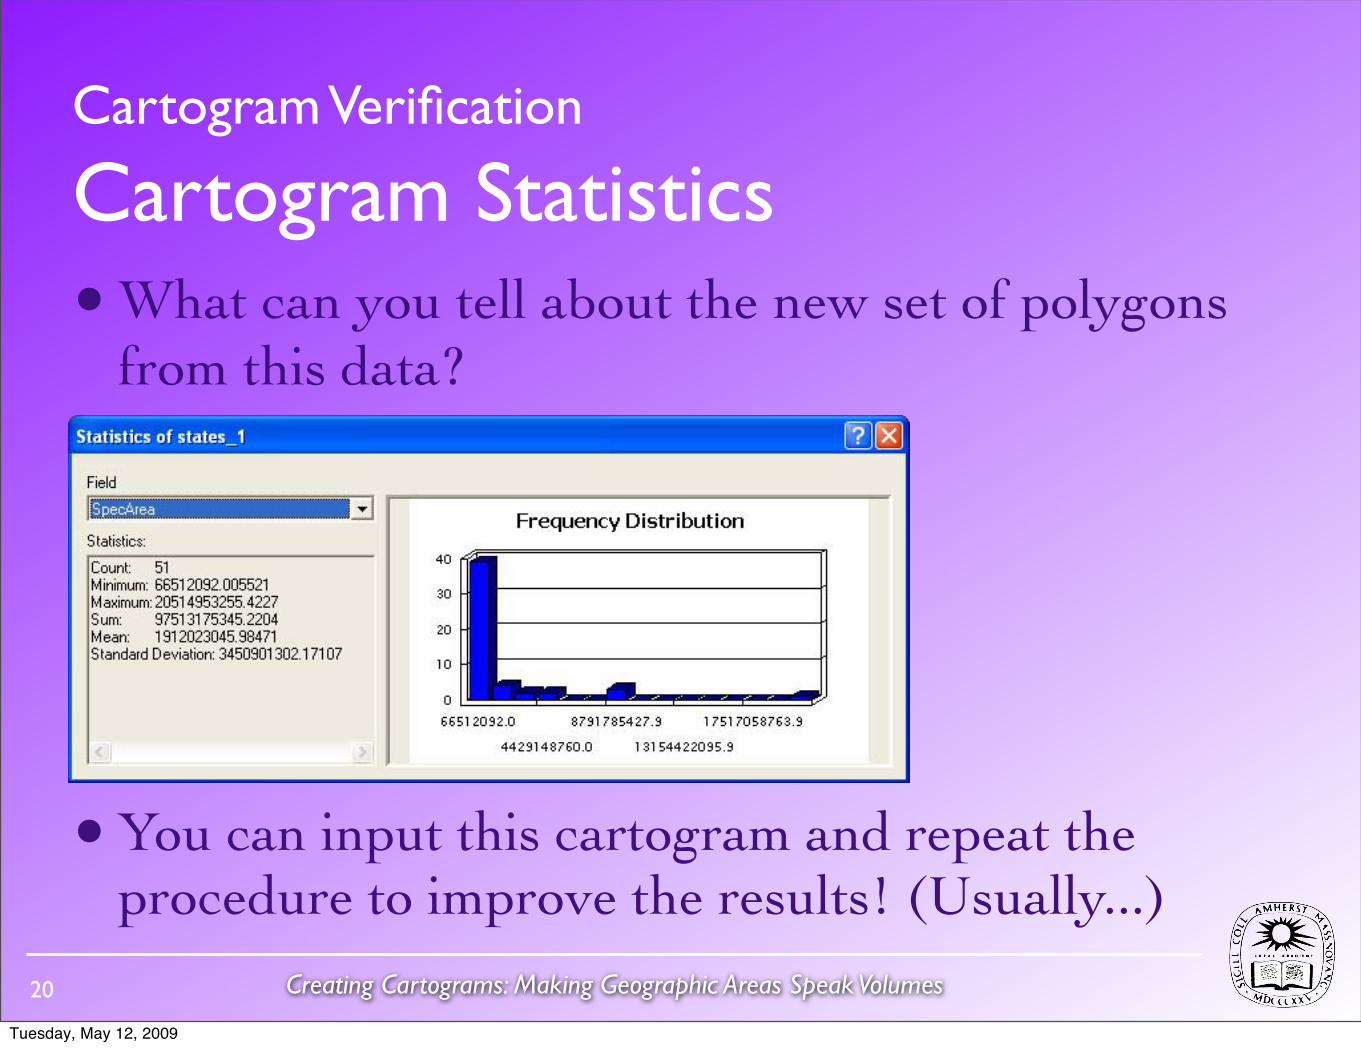
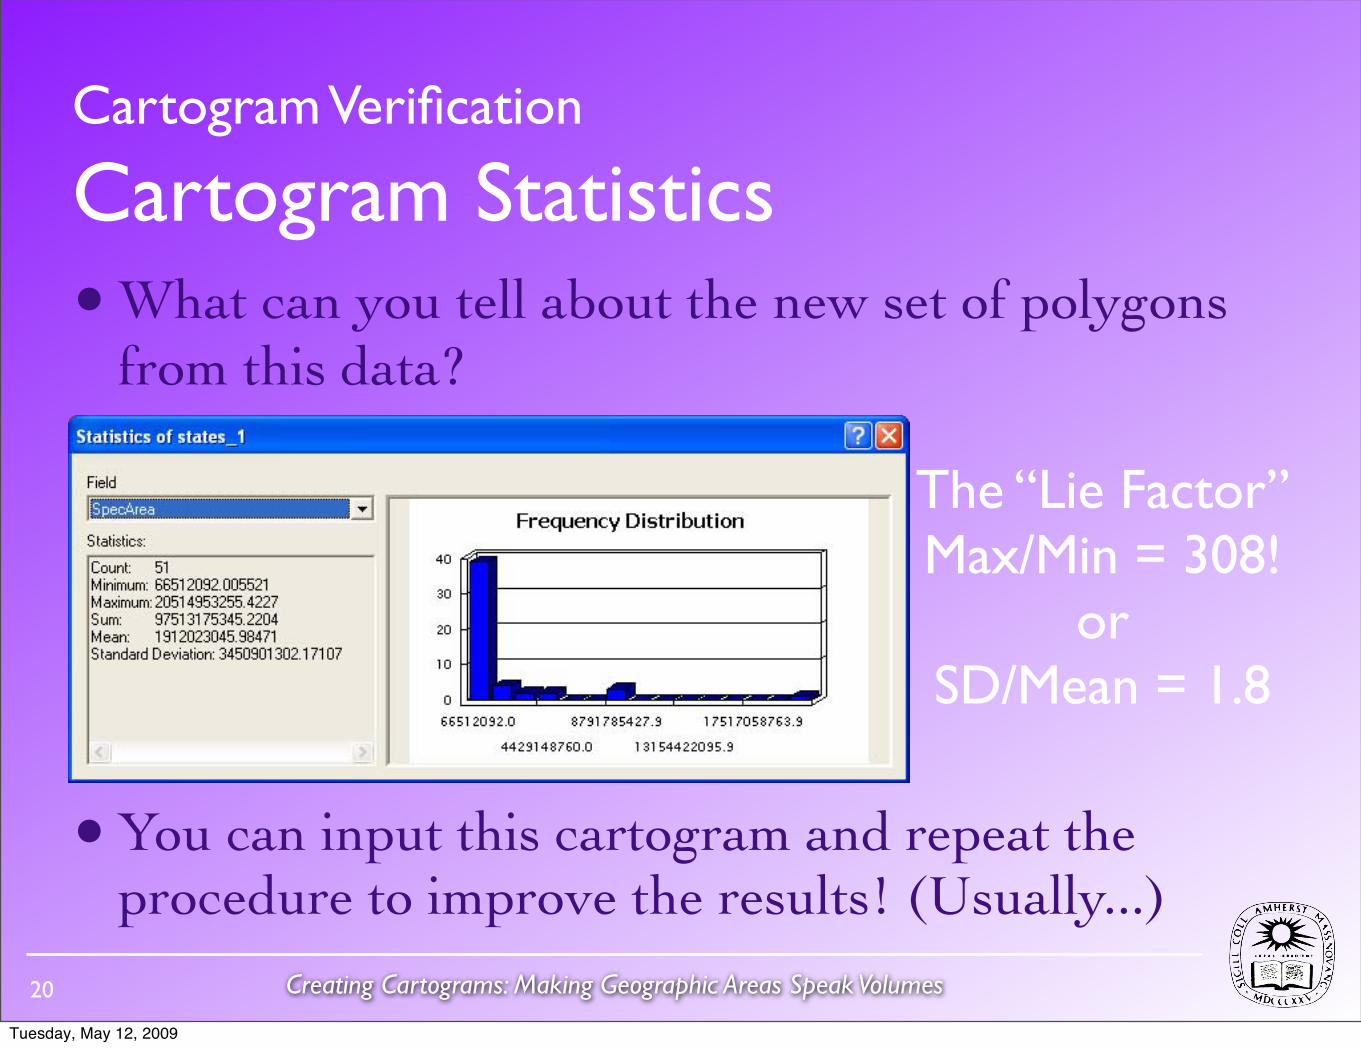
• What can you tell about the new set of polygons from this data?
• You can input this cartogram and repeat the procedure to improve the results! (Usually...)
Cartogram Verification
Cartogram Statistics
20
Tuesday, May 12, 2009
Creating Cartograms: Making Geographic Areas Speak Volumes
• What can you tell about the new set of polygons from this data?
• You can input this cartogram and repeat the procedure to improve the results! (Usually...)
Cartogram Verification
Cartogram Statistics
20
The “Lie Factor” Max/Min = 308!
orSD/Mean = 1.8
Tuesday, May 12, 2009
Creating Cartograms: Making Geographic Areas Speak Volumes
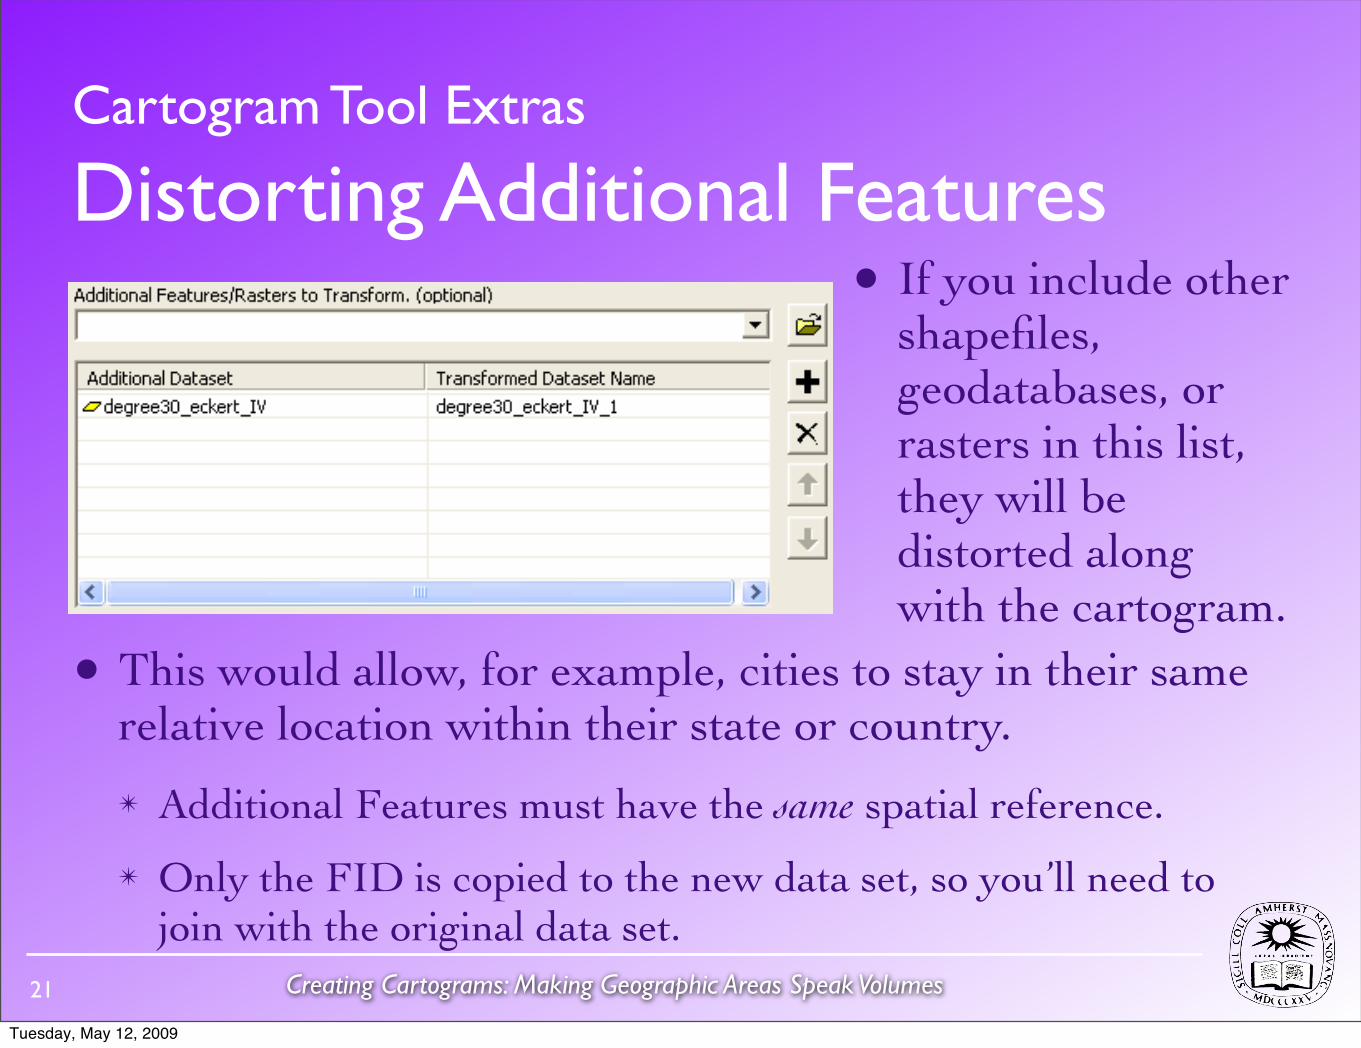
• This would allow, for example, cities to stay in their same relative location within their state or country.
✴ Additional Features must have the same spatial reference.
✴ Only the FID is copied to the new data set, so you’ll need to join with the original data set.
Cartogram Tool Extras
Distorting Additional Features
21
• If you include other shapefiles, geodatabases, or rasters in this list, they will be distorted along with the cartogram.
Tuesday, May 12, 2009
Creating Cartograms: Making Geographic Areas Speak Volumes
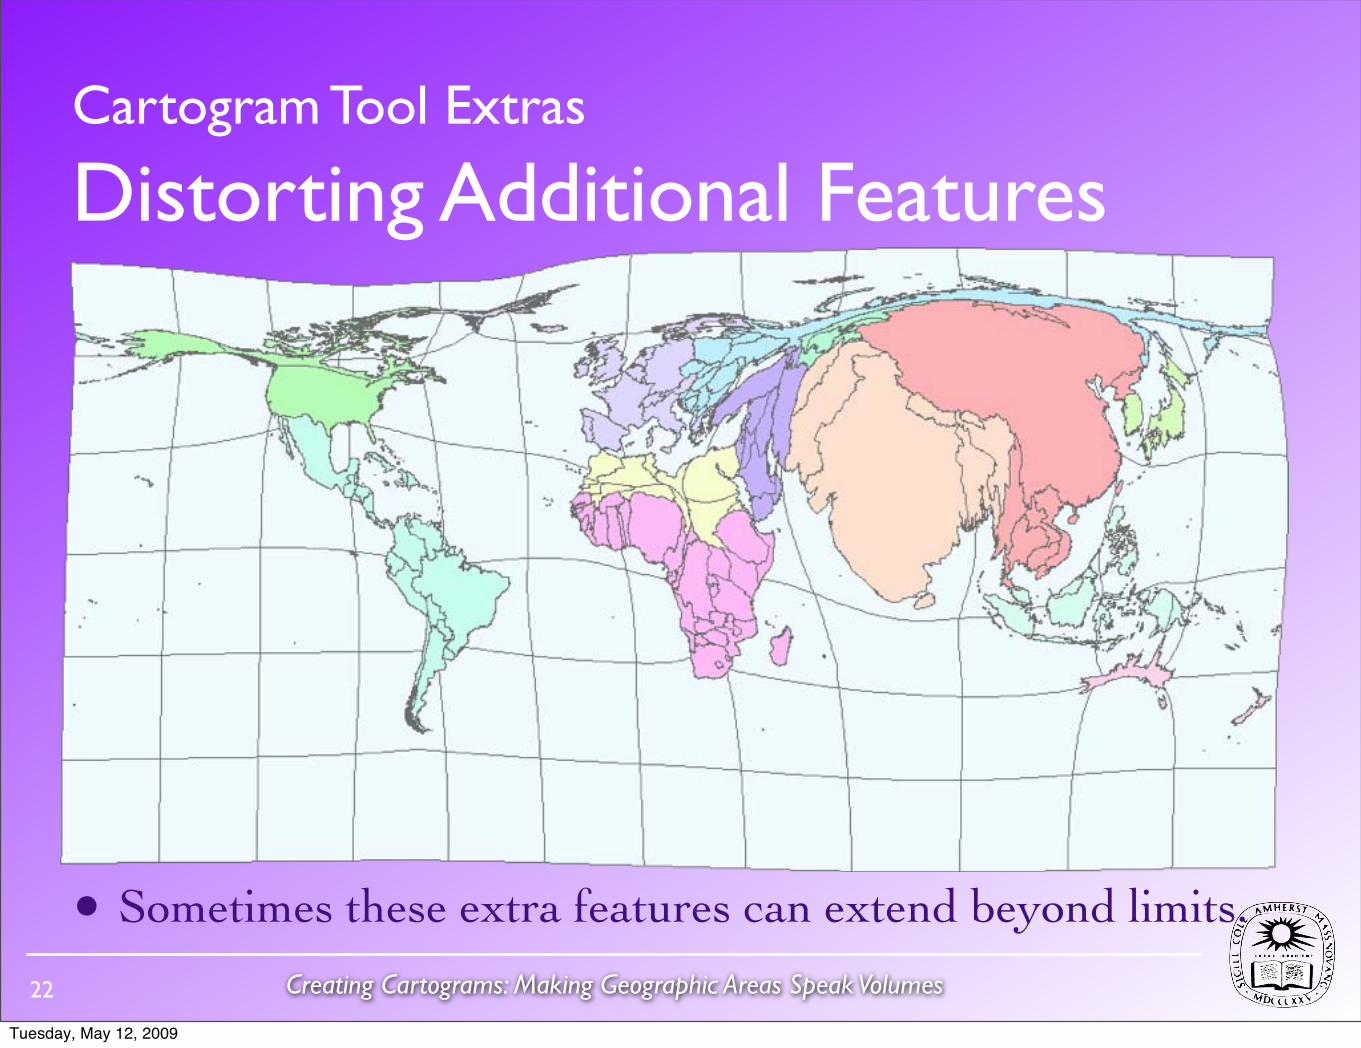
• Sometimes these extra features can extend beyond limits.
Cartogram Tool Extras
Distorting Additional Features
22
Tuesday, May 12, 2009
Creating Cartograms: Making Geographic Areas Speak Volumes
• Unique Field of Original Features: Some polygon feature classes use distinct polygons to represent parts of a whole (think Hawaii). This is the field linking them so they distort together. (Usually data is identical.)
• Sum the Value for each repeated ID: Some polygons stand on their own but also collectively form a larger region (e.g. counties within states). If this box is checked and you set the Unique Field that links them, the larger unit is distorted.
Cartogram Tool Extras
Working with Related Features
23
Tuesday, May 12, 2009
Creating Cartograms: Making Geographic Areas Speak Volumes
Resources• Presidential Elections:
✴ 2008: http://www.amherst.edu/~aanderson/presidential_elections/2008-results.png
✴ 2004: http://www.amherst.edu/~aanderson/presidential_elections/2004-analysis.pdf
• ArcGIS Cartogram Plug-In:✴ http://arcscripts.esri.com/details.asp?dbid=15638
• Mark Newman @ the University of Michigan:✴ http://www-personal.umich.edu/~mejn/election/2008/
24
Tuesday, May 12, 2009