creating cleantech clusters: 2006 update - … national cleantech... · 2015-01-29 · weather...
TRANSCRIPT

CREATING CLEANTECH CLUSTERS: 2006 UPDATE
How Innovation and Investment Can Promote Job Growth and a Healthy Environment
May 2006 Principal Author Patrick R. Burtis Contributing Authors Bob Epstein, E2 Nicholas Parker, Cleantech Capital Group, LLC


Creating Cleantech Clusters: 2006 Update
3
ABOUT E2 Environmental Entrepreneurs (E2) is a national community of professionals and business people who believe in protecting the environment while building economic prosperity. Working with its environmental partner, the Natural Resources Defense Council (NRDC), E2 works through bipartisan efforts to shape state and national policy. E2 serves as a champion on the economic side of good environmental policy by taking a reasoned, economically sound approach to environmental issues. ABOUT NRDC NRDC (Natural Resources Defense Council) is one of the nation’s most effective environmental organizations. Founded in 1970, NRDC uses law, science and the support of 1.2 million members and online activists to protect the planet's wildlife and wild places and to ensure a safe and healthy environment for all living things. Today, with over 300 employees nationwide, NRDC has built upon its continued legal successes to bring its core programmatic and scientific expertise to bear on issues spanning global warming, clean air, clean water and oceans, public lands, endangered species, and energy. ABOUT CLEANTECH VENTURE NETWORK LLC Part of the Cleantech Capital Group LLC, the Cleantech Venture NetworkTM LLC is a for-profit membership group that connects venture, corporate and institutional investors, entrepreneurs and service providers interested in clean technology through related information products, advisory and online services, and the Cleantech Venture Forum series of events. The organization’s mission is to accelerate the next and necessary wave of venture innovation and investment. Cleantech Venture Network serves more than 900 affiliate investor member firms worldwide. The organization has tracked more than $8.2 billion invested in cleantech ventures since 1999, of which over $400 million has been raised by Cleantech Venture Forum presenting companies. Cleantech Venture Network has offices in Canada, Europe and the US. ABOUT THE AUTHORS Patrick R. Burtis is an independent consultant in the cleantech and environmental fields.
Bob Epstein is co-founder of Environmental Entrepreneurs, Sybase, and GetActive Software
Nicholas Parker is Chairman and co-founder of Cleantech Venture Network LLC and the Cleantech Capital Group LLC.
ENVIRONMENTAL ENTREPRENEURS AND CLEANTECH VENTURE NETWORK LLC
4
ACKNOWLEDGMENTS The authors would like to acknowledge the following people for the information, assistance, and guidance they provided in the development of this report: Elias Arzak (Cleantech Indices LLC) Diane Bailey (NRDC) Dale Bryk (NRDC) Marian Chertow (Yale School of Forestry and Environmental Studies) Teryn Hanggi (E2) Anastasia O’Rourke (Cleantech Venture Network; Yale School of Forestry and
Environmental Studies) Victoria Rome (NRDC) Edan Rotenberg (Yale Law School and Yale School of Forestry and Environmental
Studies) Theo Spencer (NRDC) Devra Wang, (NRDC) SPONSORS NRDC E2 President Co-Founders Frances Beinecke Bob Epstein and Nicole Lederer
Director of Communications Director Phil Gutis Teryn Hanggi Reports Manager Alexandra Kennaugh Cleantech Venture Network Chairman and co-founder CEO and co-founder Nicholas Parker Keith Raab
Project Director Anastasia O’Rourke Copyright 2006 by the Natural Resources Defense Council and Cleantech Venture Network LLC You may download this report directly from www.nrdc.org, www.e2.org, or www.cleantech.com.

Creating Cleantech Clusters: 2006 Update
5
TABLE OF CONTENTS
EXECUTIVE SUMMARY I. CLEANTECH: AN INDUSTRY ON THE RISE
I.1 The Cleantech Industry Comes Into Its Own I.2 Cleantech Investment Takes Off
i. Renewable energy investment ii. Venture Capital Investment
II. POLICY + CLEANTECH + FINANCE = JOB CREATION II.1 Sowing the Seeds for Job Creation II.2 Venture Capital: A Catalyst for Economic Growth II.3 Substituting Jobs for Fuel II.4 A California Case Study: Creating Jobs Through
Venture Capital Investment II.5 Putting the Job Creation Scenarios in Context
III. CURRENT U.S. CLEANTECH CLUSTERS III.1 The Benefits of Clusters III.2 U.S. Cleantech Clusters Today III.3 Growth and Share Change in Cleantech Clusters III.4 Cleantech Cluster Profiles
i. California ii. Northeast
iii. Midwest
IV. USING PUBLIC POLICY TO CREATE CLEANTECH CLUSTERS IV.1 Necessary Conditions for Clusters IV.2 The Importance of Public Policy in Private Equity
Investment Decisions IV.3 A Case Study: Key California Regulations and
Initiatives IV.4 A Coordinated Effort: Public Policy and Private
Investment
V. PUBLIC POLICY OPTIONS FROM OTHER STATES AND REGIONS V.1 Building Demand for Cleantech Products and Services V.2 Financial Assistance to Cleantech Startups

ENVIRONMENTAL ENTREPRENEURS AND CLEANTECH VENTURE NETWORK LLC
6
V.3 Cleantech Economic Development and Indirect Assistance
VI. CONCLUSION
VII. APPENDICES VIII. 2005 Cleantech VC Investment and Companies by State IX. Job Creation Scenario Methodology

Creating Cleantech Clusters: 2006 Update
7
WHAT IS “CLEANTECH”? The cleantech industry encompasses a broad range of products and services, from alternative energy generation to wastewater treatment to more resource-efficient industrial processes. Although some of these industries are very different, all share a common thread: they use new, innovative technology to create products and services that compete favorably on price and performance while reducing humankind’s impact on the environment. To be considered “cleantech,” products and services must:
• Optimize use of natural resources, offering a cleaner or less wasteful alternative to traditional products and services;
• Have their genesis in an innovative or novel technology or application;
• Add economic value compared to traditional alternatives.
The ten cleantech categories, as defined by the Cleantech Venture Network, are:
• Agriculture and Nutrition
• Air Quality
• Enabling Technologies (such as manufacturing process technologies)
• Energy-Tech (clean energy Generation, Storage, Efficiency and Infrastructure)
• Environmental Information Technology (IT)
• Materials and Nanotechnology
• Materials Recovery & Recycling
• Manufacturing/Industrial
• Transportation & Logistics
• Water Purification & Management
Firms in these categories may not always market themselves specifically as “cleantech,” and investors who place capital into these firms likewise may not necessarily consider themselves to be “cleantech” investors. The Cleantech Venture Network (www.cleantech.com) tracks the activity of investors and entrepreneurs throughout the cleantech space and aggregates that information to create a holistic picture of the industry.

ENVIRONMENTAL ENTREPRENEURS AND CLEANTECH VENTURE NETWORK LLC
8
Cleantech Segment
Example Technologies
Agriculture & Nutrition
Bio-based materials; farm efficiency technologies; micro-irrigation systems; bio-remediation; non-toxic cleaners and natural pesticides. Does not include organic, health food or natural health products.
Air Quality Air purification products and air filtration systems, energy efficient HVAC; universal gas detectors; multi-pollutant controls; fuel additives to increase efficiency and reduce toxic emissions.
Enabling Technologies
Optical components, reactor technologies, catalysts and membranes with multiple applications; technology enabling the manufacture of nano-scale compositions; distributed sensor network technologies.
Environmental IT
Online exchanges for buying and selling resources; web-based software for Environment Health & Safety management; online environmental record-keeping; operations management software for utility companies; software-enabled control systems for light emitting devices; wind source analysis and weather forecasting services
Materials and Nano-technology
Biodegradable materials derived from seed proteins; micro-fluidics technology for conducting biochemical reactions; nano- materials; composite materials; thermal regulating fibers and fabrics; environmentally-friendly solvents; nano-technology components for electronics, sensor applications, and energy storage; electro-chromic glass; thermoelectric materials
Energy Generation Distributed and renewable energy generation and conversion (including fuel cells, geothermal, wind and solar/photovoltaics); gasification technologies for biomass; flywheel power systems
Energy Infrastructure Wireless networks to utilities for advanced metering, power quality monitoring and outage management; integrated electronic systems for the management of distributed power; demand response and energy management software.
Energy Storage Batteries e.g. thin film, rechargeable; power quality regulation; flywheels; electro-textiles
Energy
Energy Efficiency Energy management systems; systems that improve output of power generating plants; intelligent metering; solid state micro-refrigeration; control technology for HVAC systems; automated energy conservation networks.
Materials Recovery & Recycling
Recycling technologies; waste treatment; internet marketplace for materials; hazardous waste remediation; bio-mimetic technology for advance metals separation and extraction
Manufacturing/ Industrial
Advanced packaging; natural chemistry; sensors; smart construction materials; business process and data flow mapping tools; precision manufacturing instruments & fault detectors; chemical management services.
Transportation & Logistics
Hybrid vehicle technology; lighter materials for cars; smart logistics software; car-sharing; temperature pressure sensors to improve transportation fuel efficiency; telecommuting
Water Purification & Management
Water recycling and ultra-filtration systems (e.g. UV membrane & ion exchange systems); sensors and automation systems; water utility sub-metering technology desalination equipment

Creating Cleantech Clusters: 2006 Update
9
EXECUTIVE SUMMARY
This report finds that the cleantech industry can be a major driver for new investment and job growth throughout the country. Finding 1: Cleantech is a rapidly growing industry, with strong fundamental drivers. As measured by investment, the cleantech industry is large and growing: venture capital investment in U.S. cleantech startups totaled $1.4 billion in 2005, tying it as the sixth largest investment sector for venture capitalists. (Cleantech was fifth in Q4 2005.) An additional $233 million of venture capital was invested in Canadian cleantech companies over the same period. Across North America, cleantech venture capital funding increased 43% in 2005 over 2004. Total investment (government and private, including venture capital) in renewable energy (the largest subset of cleantech) totaled $7 billion in 2004, the most recent year for which figures are available. Six long-term trends are driving this growth, suggesting that we are witnessing only the beginning of a decades-long expansion of the cleantech industry. Finding 2: Cleantech is fast becoming a mainstream investment category. In recent years, some of the largest companies in the world have made significant investments in cleantech, including General Electric, Goldman Sachs, J.P Morgan Chase, BP, and Shell. GE expects to reap $2 billion in wind energy revenues this year, and expects renewables to account for 25% of its energy infrastructure sales in five years. Mainstream (traditionally non-cleantech) venture capital investors such as Kleiner Perkins Caufield & Byers are also now committing significant capital to cleantech. Large public pension funds such as CalPERS and CalSTRS have invested nearly $450 million over the last two years in cleantech private equity. And new project finance entities such as Riverstone-Carlyle have created cleantech project finance companies with resources of $500 million. Finding 3: Two primary U.S. cleantech regions have formed in California and the Northeast. A third cleantech region appears to be emerging in the Midwest. California continues to lead the nation in venture-backed cleantech startups and cleantech venture capital received. But the Northeast, led by Massachusetts, is not far behind, and a third major region appears to be developing in the Midwest, which more than doubled its cleantech venture

ENVIRONMENTAL ENTREPRENEURS AND CLEANTECH VENTURE NETWORK LLC
10
capital received in 2005. Increasingly, we see a diversification of entrepreneurial and financing activity into new regions of the country, with cleantech often accounting for over ten percent of venture capital investment. Finding 4: Cleantech investment can create thousands of new jobs, improve energy security and human health, and promote a cleaner environment. Modeling by the authors (based on thirty years of data from the National Venture Capital Association) suggests a simple rule of thumb: every $100 million of VC money invested could help spur the creation of 2,700 direct jobs at venture-backed companies, many more indirect jobs, and $500 million in incremental annual revenue over the subsequent two decades, while also benefiting the environment.a Additionally, investments in renewable energy generation create more jobs per unit of capacity than investments in traditional (non-renewable) energy projects. Investments in renewables also reduce the nation’s reliance on expensive and often imported fossil fuels, presenting an opportunity to substitute costly fuel with high quality jobs, and redirect more of our energy spending towards local economies. Finding 5: Public policies are a critical driver of cleantech growth. Cleantech investors overwhelmingly agree that public policy can be an important driver for new job and investment growth: • 91% of cleantech venture capitalists surveyed say that pro-environmental
public policy can be a driver in bringing new business and investment to a state
• 79% of cleantech venture capitalists surveyed say that current public policies (regulations, programs and incentives) are a prominent factor in their investment decisions
Finding 6: State and local leaders have a host of policy options to choose from as they encourage growth of cleantech clusters. These include policies that make states or regions better direct customers for cleantech products, those that drive indirect demand for cleantech products and services, and economic development and education initiatives that indirectly assist cleantech startups. The policies most successful in building cleantech clusters are likely to be those that also address pressing local problems such as air pollution, transportation, water shortages, water pollution, toxics, and solid waste problems. a Please see Appendix 2 for an explanation of the methodology used in this calculation.

Creating Cleantech Clusters: 2006 Update
11
CHAPTER 1
CLEANTECH: AN INDUSTRY ON THE RISE
1.1 THE CLEANTECH INDUSTRY COMES INTO ITS OWN Five years ago, “cleantech” could hardly be called an industry. At the first Cleantech Venture Network Forum in 2002, 80 curious investors and entrepreneurs convened in Toronto to seek a common platform from which to discuss what they saw as the dawn of a potential revolution. Few people outside of that group had ever heard the term “cleantech.” Today, after a remarkable period of growth, the cleantech industry is firmly planted on the country’s economic map. The North American cleantech industry received $1.6 billion in venture capital in 2005, tying it as the sixth largest recipient of venture capital investment.1 The 68 public companies in the Cleantech Capital Indices LLC Cleantech Index (CTIUS) have an aggregate market capitalization of $115 billion.2 In renewable energy (the largest subset of cleantech), an estimated $30 billion of private and government capital was invested globally in projects, installations, and companies in 2004, the latest year for which figures are available.3 An estimated $7 billion of that went into the U.S.4 Private investors in cleantech in the last year included some of the largest corporations in the world: General Electric, Goldman Sachs, BP, Shell, and Citigroup, to name a few. In addition to the thousands of direct jobs created by this infusion of capital, the cleantech industry has spawned its own corps of specialist investors, bankers, hedge fund managers, analysts, lawyers, PR firms, consultants, journalists, bloggers, and, of course, gadflies. The industry has several prominent investor conferences, including the Cleantech Venture Forum, the last of which drew over 500 attendees, the NREL Industry Growth Forum and the Energy Venture Fair. And legislators from

ENVIRONMENTAL ENTREPRENEURS AND CLEANTECH VENTURE NETWORK LLC
12
both sides of the aisle have begun to recognize the important economic, environmental, social, and security benefits of a growing cleantech industry. In short, cleantech is emerging as the enabling technology of modern industrial society - the next and necessary wave of innovation in a natural resource constrained world. We firmly believe that the industry is still in its infancy, and that we have only begun to tap cleantech’s potential to create quality jobs, generate new wealth, improve our environment, and protect our citizens from a variety of harms. A perfect storm of sorts is brewing for the cleantech industry; six fundamental drivers have combined in the last three years to spur the rapid growth of the industry. All six are long-term drivers, suggesting that cleantech could enjoy sustained growth for decades to come. Those drivers are:
1. Technological Advances. Materials and biological science innovations, improvements in research and manufacturing processes, and the rapidly falling cost, increasing power, and near ubiquity of information technology (IT) are leading to breakthroughs in clean products and services. The resulting reductions in cost and advances in functionality have spurred business and consumer demand for many of these green products. Indeed, many purchasers choose cleantech products purely on their economic merits.
2. High Energy Prices. Sustained high energy prices have catalyzed
interest in energy efficiency and alternative technologies, and improved the relative economics of some cleantech offerings.
3. Global urbanization and corresponding environmental pressures.
Sometime this decade, for the first time in history, more people in the world will live in cities than in rural areas. Between 2000 and 2030, the world’s urban population is expected to expand by more than 2 billion people5, aggravating air pollution and public health problems, and creating huge demands on municipalities to provide clean air, clean water, energy, and other basic services. These challenges create enormous potential markets for companies with products that are cleaner, less resource intensive, or more energy efficient.
4. U.S. National Policy Evolution. Increasingly, policy-makers at the
national and state level are recognizing that cleantech can be a valuable asset in creating jobs, improving environmental performance, and promoting national security and resource

Creating Cleantech Clusters: 2006 Update
13
independence. For example, in his 2006 State of the Union address, President Bush highlighted the U.S.’s addiction to foreign oil, and called for major increases in spending for research and development of alternative sources of energy. Local governments are also supporting cleantech initiatives through public policy and their own purchasing initiatives.
5. Global Policy Action. With the entry into force of the Kyoto
Protocol and European Trading Scheme (ETS) in February 2005, the global cleantech industry received a powerful shot in the arm. Mandatory caps on European greenhouse gas (GHG) emissions, coupled with voluntary programs the world over, have spurred significant R&D and project finance investments in low-carbon technologies and related products, services, and markets.
6. Capital Markets Acceptance. In past years, cleantech and
environmental technologies were sometimes viewed as “alternative” investments, suitable primarily for socially responsible investors (SRIs). No longer. In the past two years, some of the biggest and most respected names in the banking, private equity, institutional, and corporate arenas have made significant investments or commitments to cleantech businesses or markets. All of these players forecast cleantech in some shape or form to be one of the most important industries of the 21st century.
It is important to note that “cleantech” as it is defined here differs from traditional environmental technologies such as air pollution control, remediation, and hazardous waste management. These conventional environmental technologies tend to be “end-of-pipe” add-ons to existing businesses or systems – they are adopted primarily to clean up existing problems and to comply with state or federal regulations. Cleantech products and services, by contrast, are designed to prevent these problems from occurring in the first place. Cleantech products are developed and adopted primarily to meet an economic need; their environmental benefits are a significant but secondary consequence. As such, while policy is an important driver of cleantech growth, it is by no means the only driver. On a similar note, at various times renewable energy technologies have experienced periods of heightened interest, notably during and just after the 1970s oil crisis, when a nascent solar industry was born. However, the renewable energy technologies of that era never approached cost competitiveness with conventional technologies, and once oil prices fell, both policy support and interest in the sector waned. By contrast, many cleantech products and services today do compete – and win – on cost

ENVIRONMENTAL ENTREPRENEURS AND CLEANTECH VENTURE NETWORK LLC
14
versus conventional alternatives. Furthermore, the broad range and sustained nature of the forces driving cleantech today suggest that the industry’s growth will be far less susceptible to the attenuation of any individual driver, such as energy prices or varying political winds.
1.2 CLEANTECH INVESTMENT TAKES OFF Although it is difficult to assemble a comprehensive picture of the nation’s total cleantech investment, by examining some specific sectors and asset classes, we begin to get a sense of the rapid expansion of cleantech-related investments and capital markets. RENEWABLE ENERGY INVESTMENT Renewable energy is just one piece of cleantech, but the investment numbers for renewables alone are staggering. In 2004, roughly $30 billion of private and government money was invested in renewable energy worldwide, up from $7 billion in 1995.6 This includes wind power, solar photovoltaic (PV), small hydroelectric, solar water heating, and biofuels such as ethanol and biodiesel. By comparison, $110-$150 billion was invested in traditional (non-renewable) energy projects in 2004, meaning that renewables now receive 20-25% of global energy investment. That number is expected to rise rapidly in coming decades.7 Of the $30 billion invested in renewable energy projects, companies, and technologies, about $7 billion was invested in the U.S., according to the American Council on Renewable Energy.8 U.S. federal and state governments contributed an estimated $3 billion of that9, suggesting that private capital accounted for the other $4 billion. Of that private capital, a small but important piece - less than $400 million – was venture capital money, a crucial seed for future industry growth.10 Analysis also suggests that renewables are turning into big business for some U.S. corporations. General Electric (GE), which in 2002 bought Enron’s wind business, now earns $2 billion per year from wind energy.11 GE forecasts that in five years, alternative energy projects will account for a quarter of its energy equipment sales. GE’s Energy Financial Services (EFS) group has around $1 billion in renewable energy projects in its portfolio; renewables are reportedly now EFS’ fastest growing niche.12 Other companies, including major banks, are also joining in. Goldman Sachs acquired Zilkha Renewable Energy in 2005, and in November pledged to invest $1 billion in renewable energy.13 Wells Fargo has committed to provide $1 billion in lending, investments, and other financial commitments to environmentally beneficial business, including

Creating Cleantech Clusters: 2006 Update
15
renewable energy.14 J.P. Morgan Chase says it will invest $250 million in wind energy projects.15 And a host of other U.S. and foreign firms are beginning to pour money into the space. Cleantech Venture Capital Investment Venture capital is a high-risk, high-return asset class, in which venture capitalists (VCs) provide crucial funding to entrepreneurs in return for a stake in their companies. Many of these “startup” companies are so young they have no revenue or even products. For these startups, venture capital serves as a fuel for economic growth. But for our purposes, venture financing can also serve as a proxy for the promise of young industries. Follow the venture money, and you are likely to find the industries poised for exceptional growth. (Except where noted, all the following figures on cleantech venture capital are provided by Cleantech Venture Network.) North American and U.S. Cleantech Venture Investment In 2005, venture capitalists invested $1.6 billion in North American cleantech companies (including clean energy-tech companies), an increase of 43% from 2004. Of the $1.6 billion, $1.4 billion was invested in the U.S., with the remaining $.2 billion going to Canadian companies. Figure 1.1 Number of U.S. and Canadian Cleantech Venture Deals, and Amounts Invested, by Year (2001 – 2005)
$1,598$1,107$1,021$1,267$780
108
222
191205
246
$-
$200
$400
$600
$800
$1,000
$1,200
$1,400
$1,600
$1,800
2001 2002 2003 2004 2005
$US
Mill
ion
0
50
100
150
200
250
300
Num
ber o
f dea
ls
Source: Cleantech Venture Network

ENVIRONMENTAL ENTREPRENEURS AND CLEANTECH VENTURE NETWORK LLC
16
The $1.4 billion invested in U.S. companies amounted to 6.8% of total U.S. venture capital investments in 2005, tying cleantech as the sixth largest recipient of venture capital money in the United States, behind Software, Biotech, Telecommunications, Medical Devices, and Semiconductors, and ahead of IT Services, Media & Entertainment, and Industrial & Energy. (Cleantech tied with Networking & Equipment.)16 In the fourth quarter of 2005, cleantech pulled ahead of Semiconductors and Networking & Equipment, and was virtually tied with Telecommunications, accounting for just under 10% of overall U.S. venture dollars.17 Figure 1.2 Top 10 US Venture Capital Investment Industries, 2005 (Billions of dollars of 2005 VC Investment)
$0.0
$1.0
$2.0
$3.0
$4.0
$5.0
Source: Cleantech Venture Network; PriceWaterhouseCoopers National Venture Capital Association Moneytree
Software
Biotech
Telecom
MedicalDevices
Semi-conductors
Cleantech
Networking& Equipment
IT Services
Media &Ent.
Industrial& Energy
$4.7B
$3.9B
$2.1B $2.1B$1.8B
$1.4B $1.4B$1.0B $1.0B
$.8B
U.S. Cleantech Investment by Sector Within the U.S. cleantech industry, Energy-tech (Clean energy-related Generation, Storage, and Efficiency technologies, and Infrastructure) remained the largest recipient of venture money in 2005, receiving $590MM, or 44% of U.S. cleantech venture capital invested. Materials & Nanotechnology was second, receiving $264 million, or 20% of the industry’s total. Manufacturing/Industrial, Enabling Technologies, and

Creating Cleantech Clusters: 2006 Update
17
Water Technologies followed, receiving $108 million, $80 million, and $71 million respectively. Figure 1.3 U.S. Cleantech Venture Capital Investment by Segment, 2005 (Millions of dollars of 2005 VC Investment)
$0
$100
$200
$300
$400
$500
$600
$700
Source: Cleantech Venture Network
Energy-tech
Materials& Nanotech
Manfacturing/Industrial
EnablingTechs.
Water
Air Quality
MaterialsRecovery
& Recycling
Agriculture& Nutrition
Transpor-tation
EnvironmentalIT
$590
$264
$108$80 $71 $61 $59 $50 $41 $25
U.S. Cleantech Investment by Region
The West Coast (California and Hawaii) once again led the nation in cleantech VC money received in 2005, at $487 million (37% of the $1.4B U.S. total). California received $484 million and Hawaii received $3.5 million The Northeast region was second, receiving $410 million (30% of the U.S. total).
The Midwest was third, with $190 million, followed by the Southeast ($121 million).
Two primary U.S. cleantech regions have formed, in California and the Northeast. A third cleantech region appears to be emerging in the Midwest.

ENVIRONMENTAL ENTREPRENEURS AND CLEANTECH VENTURE NETWORK LLC
18
(Appendix 1 lists, by state, 2005 cleantech VC investment and deals, and the number of unique cleantech companies in each state receiving venture capital funding between 2001 and 2005.) Figure 1.4 U.S. Cleantech VC Investment by Region 2005 (Millions of dollars of 2005 cleantech VC investment)
$0
$100
$200
$300
$400
$500
$600
WestCoast
North-east
Mid-west
South-East
South-West
Rockies/Plains
North-West
$487MM
$410MM
$190MM
$121MM $112MM
$17MM $11MM
Source: Cleantech Venture Network Leading Cleantech VC Firms Between 2002 and 2005, the top 10 most active VC investors in North American cleantech companies (measured by number of deals) were, in alphabetical order:18 Investor Location Investor
type Focus
Altira Group LLC CO VC Part cleantech Draper Fisher Jurvetson CA VC Not cleantech EnerTech Capital PA VC Cleantech specialist Harris & Harris Group NY VC Part cleantech Hydro-Québec CapiTech Quebec Corporate Part cleantech NGEN Partners LLC CA VC Cleantech specialist Nth Power CA VC Cleantech specialist OPG Ventures Ontario Corporate Cleantech specialist

Creating Cleantech Clusters: 2006 Update
19
Perseus LLC NY, DC VC Part cleantech Rockport Capital Partners MA VC Cleantech specialist Source: Cleantech Venture Network
As is evident, a number of these established venture capitalists specialize in cleantech. A number of new firms have also recently raised cleantech-specialized funds. Just as importantly, though, in the last year many of the largest and most established Silicon Valley VC firms, such as Draper Fisher Jurvetson, Kleiner Perkins Caufield & Byers, U.S. Venture Partners, and Vantage Point Venture Partners have pledged significant investments for the cleantech industry. In many cases these are the same firms that funded the biotech, software, and Internet revolutions. At this point it appears that investors are beginning to embrace cleantech the way they did the software industry in the 1980s. It is a sign of the strong economic promise of cleantech that leading venture capitalists from other sectors are starting to place bets on the industry. The Cleantech Venture Capital Outlook A recent study by Cleantech Venture Network19 forecasts that between 2006 and 2009, $6.2B to $8.8B of VC money is likely to be invested in North American cleantech startups. From a state’s perspective, this capital – and the economic benefits that go with it – is up for grabs. No state or region has a dominant position in any cleantech segment yet. And the global pool of cleantech venture capital is not a zero-sum game – promising companies will always attract new capital. But the seeds are being laid now to determine which state’s companies will get the lion’s share of investment, and which states will call the future leaders of the cleantech industry their own. The states that can best woo entrepreneurs and investors now will have a chance to create self-perpetuating cleantech clusters that drive dynamic economic growth while also improving the environment.
ENVIRONMENTAL ENTREPRENEURS AND CLEANTECH VENTURE NETWORK LLC
20
CHAPTER 2
POLICY + CLEANTECH + FINANCE = JOB CREATION
2.1 SOWING THE SEEDS FOR JOB CREATION Direct corporate investment, public equity, and project finance dwarf the venture capital sums invested in cleantech. Compare, for instance, the $590 million of venture capital invested in U.S. energy-tech companies in 2005, versus more than $6 billion in project finance, government money, and other non-VC capital spent just on renewable energy.20 But when it comes to creating growth industries, all dollars are not created equal. Project finance, corporate capital, and capital from the public markets tend to follow early venture capital flows, often with a five to ten year lag time. Put another way, venture capital “greases the skids” for the eventual large investments that expand industries and create thousands of new jobs. Furthermore, a higher proportion of venture capital money is spent on payrolls – jobs – than, for instance, project finance, which is often used to finance large capital infrastructure projects. Therefore, step one for policy-makers, legislators, and economic development executives who want to create jobs and economic growth through cleantech clusters is to create a business environment that is attractive to entrepreneurs and investors. Only by creating conditions in which small companies and investors can thrive can states hope to enjoy the fruits of high-tech industry expansion: high quality jobs, vibrant communities, and a robust tax base.

Creating Cleantech Clusters: 2006 Update
21
2.2 VENTURE CAPITAL: A CATALYST FOR ECONOMIC GROWTH In the last thirty years, venture capital has been a catalytic force for some of the biggest growth industries in the U.S. The personal computer, biotechnology, software, Internet, and big box retail industries are just some of those which trace their meteoric growth back to venture capital funding. Notable companies that were backed by venture capital investors include Microsoft, Intel, Federal Express, Apple, Palm Computer, Amazon.com, Yahoo, Google, eBay, Sun Microsystems, Jet Blue, Amgen, Genentech, The Home Depot, and Starbucks.21 The overall impact of venture capital on the American economy has been huge: according to a 2004 study by Global Insight and the National Venture Capital Association (NVCA)22, in 2003 companies backed by venture capital directly accounted for 10.1 million jobs and contributed $1.8 trillion annually to the U.S. GDP. The study also found that venture-backed companies grew sales at almost twice the rate of non-venture-backed companies, and invested twice as much proportionately in R&D. An earlier Global Insight/NVCA report23 found that venture-backed companies generate almost twice the exports and pay almost three times as many taxes as non-venture-backed companies per every $1,000 in assets. And European studies have shown that venture-backed companies have higher rates of innovation and generate more productivity from their R&D expenditures.24 Perhaps most importantly, venture-backed companies create jobs at a faster rate than non-venture-backed companies.25,26 Venture capital is more than just a fuel for growth, however. It is also a leading indicator of economic and technological innovation. For VCs to make their investment model work, they must keep their proverbial ears to the ground for cutting edge technology that can reshape an industry. As a result, when the venture capital community gets excited about an industry, there’s a good chance it’s about to take off. An encouraging sign for policy-makers, entrepreneurs, and environmentalists is that in the last several years, many VCs have identified cleantech as one of the most promising new investment categories.
2.3 SUBSTITUTING JOBS FOR FUEL A recent study by Daniel Kammen, Kamal Kapadia, and Matthias Fripp of the University of California at Berkeley found that “the renewable energy sector generates more jobs per megawatt of power installed, per unit of energy produced, and per dollar of investment, than the fossil-fuel-based energy sector.”27 Kammen et. al. found that a wind power installation

ENVIRONMENTAL ENTREPRENEURS AND CLEANTECH VENTURE NETWORK LLC
22
employs up to 2.8 times as many people over its lifespan as a coal or gas-fired power plant for the same energy output, when counting all phases of the supply and production process. A solar photovoltaic installation employs seven to eleven times the people for the same energy output. The net result: transitioning 20% of the U.S.’s electricity generation to renewable sources by 2020 would result in 101,000-157,000 more American jobs than relying solely on coal and natural gas-fired electricity. While the labor costs may consequently be higher for every megawatt of renewable power than in traditional fossil-based power plants, because there are no fuel costs for most renewables, they often compete on cost with traditional power sources while providing many more jobs. In short, clean energy allows us to substitute fuel with jobs, a vision that every American can rally behind. In another encouraging finding, the Renewable Energy Policy Project (REPP) concluded that the U.S. states that have lost the most traditional manufacturing jobs in recent years are those best positioned to capture the new manufacturing jobs that will be needed as the wind energy industry expands. In other words, the cleantech industry could help offset the deterioration of the traditional U.S. manufacturing base, precisely where those jobs are most needed.28 Jobs in cleantech startups also tend to be high-quality, high-paying jobs. Just like in the biotech, PC, and software booms, the first hundred employees in most cleantech startups are likely to be primarily engineers, physicists, chemists, biologists, programmers, and designers. Just as in earlier booms, we are already seeing well-educated, high-earning-potential workers moving to areas with burgeoning cleantech industries.

Creating Cleantech Clusters: 2006 Update
23
2.4 A CALIFORNIA CASE STUDY: CREATING JOBS THROUGH VENTURE CAPITAL INVESTMENT Because venture capital is such a powerful catalyst for growth, a relatively small amount of it can eventually translate into big economic growth. California, one of the leaders in the cleantech revolution, provides a useful case study. In an earlier E2 report29, using more than thirty years of data from the National Venture Capital Association30, we constructed several scenarios of what a California cleantech cluster could mean for the state’s economy. These scenarios estimated the jobs and revenues that could eventually be created by venture-backed cleantech startups, based on the amount of venture capital flowing into the state.b (See Appendix 2 for a description of the methodology used in the job creation scenarios.) b These calculations are demonstrative and wholly unscientific, and should not be viewed as forecasts of the jobs and revenue likely to be created as a result of cleantech venture capital investment. They are presented only to offer an “order of magnitude” assessment of the economic activity that might be spurred by current and future venture capital
HOW VENTURE CAPITAL WORKS Venture capital is both a fuel for entrepreneurial activity and a measure of it. Venture capitalists, or VCs, make money by investing very early in the development of promising companies, often before those companies have revenues. VCs try to pick startups that have the potential to be “game-changing” – in other words, those that can revolutionize an industry or create an entirely new one. As a result, VCs are like an early warning system for new industries – other investors and corporate decision-makers often watch venture capitalists to identify hot new technologies and companies. By investing at an early stage, VCs buy into their “portfolio companies” at low valuations. They then work with them to help them grow and prosper. Most VCs aim to “exit” (sell their stake) in three to eight years, hopefully at a much higher valuation when the company goes public or is acquired. VCs typically invest a few million dollars in a company and hope to earn returns that are five, ten, or twenty times higher than what they invested. Of course, not every startup succeeds; the majority of venture-backed companies go out of business or only break even. But when a company does hit it big, investors stand to make returns far above those available in other asset classes. By investing in companies that are too risky for most banks to lend to, and too small to attract other institutional investors, VCs help foster the growth of new industries and companies that might not otherwise receive funding. And by bringing industry-specific expertise and management to their portfolio companies, VCs can help guide startups to enormous growth.

ENVIRONMENTAL ENTREPRENEURS AND CLEANTECH VENTURE NETWORK LLC
24
Using updated numbers, we offer two new scenarios for the sake of demonstration. On the conservative side, if California receives $3.1 billion in cleantech venture capital investments between 2006 and 2010 (reflecting modest funding growth for the industry and no gain in share for California of the nation’s cleantech funding) the state could realize 48,000 new direct jobs from venture-backed companies over the next two decades, and additional annual revenues of $10.8 billion. A more aggressive scenario assumes that U.S. venture capital funding of cleantech grows at 20% per year starting in 2006, and that California increases its share of U.S. cleantech funding from 36% to 40%. Under this scenario, California would receive $4.8 billion in cleantech funding between 2005 and 2010, potentially spurring 75,000 direct jobs in venture-backed companies over the next two decades, and $17.2 billion in incremental annual revenue. In addition to the economic impact, California would reap significant environmental benefits from a healthy cleantech industry. Increasing use of renewable energy sources avoids emissions of local and global pollutants such as mercury, nitrogen oxides (NOx) and greenhouse gases like carbon dioxide, and reduces the environmental impact of resource extraction. In non-energy sectors, cleantech products and services can directly reduce energy demands, lessen pollution, and encourage local businesses and consumers to purchase more environmentally sensitive technologies. Deployment of cleantech can also boost the productivity of a range of agricultural, manufacturing, and transport related industries by reducing the use of scarce resources such as water or energy. California is presented here as just one example of what venture capital could mean for a state’s cleantech cluster. For policy-makers, the important message is this: attracting venture capital now is one of the best ways to create high-quality jobs over the long term. A quick rule of thumb is that every $100 million in venture capital funding invested in startups
investments. Furthermore, these calculations rely on a host of assumptions (stated in Appendix 2), which readers should carefully consider as they view the scenarios.
A quick rule of thumb: every $100 million in venture capital funding could help spur creation of 2,700 direct jobs in venture-backed companies, $500 million in annual revenues over the next two decades, and many more indirect jobs.

Creating Cleantech Clusters: 2006 Update
25
could help spur the creation of 2,700 direct jobs at venture-backed companies, and $500 million in annual revenues from those firms over the next two decades.31 Clearly, venture capital is not the only factor at work here. Many other types of financing – including, often, government support – are required to help startup companies grow into major corporations that employ thousands of people. And many venture-backed companies simply go out of business before they can become large employers. But when venture-backed companies do succeed, they can become powerful economic engines for their host states, creating thousands of jobs and billions of dollars in revenue in a short period.
2.5 PUTTING THE JOB CREATION SCENARIOS IN CONTEXT In considering the job creation scenarios described above, four points bear highlighting: First, these numbers are only a partial accounting of the economic impact of cleantech. Successful cleantech clusters benefit many companies, not just those that are venture-backed. Additionally, technology clusters support a broad range of support services, such as legal, marketing, real-estate, and accounting, which tend to develop in close proximity to the cluster, and which are not considered here. Second, the range of results produced in the scenarios above – anywhere from 48,000 to 75,000 jobs and from $11 billion to $17 billion in revenue – underscores the leverage that decision-makers have in shaping how the cleantech industry develops. It is not accurate to say that public-policy-makers can directly make these scenarios a reality. However, there are things governments can do to better attract cleantech startups, help them prosper, and encourage private equity investment. Third, it’s useful to view these investment scenarios in the context of historical venture capital activity. Although $4.8 billion invested in California cleantech companies through 2010 may sound large, it is not big relative to past venture capital spending. At the market peak in 2000, venture capitalists invested more than $100 billion in the U.S. in a single year, most of it in Information Technology companies.32 California received $41 billion of that investment.33 Finally, venture capital is perhaps the most mercurial of all capital. When venture capitalists decide a sector is hot, investments can skyrocket in just a few years. (Indeed, North American cleantech VC investment grew 43%

ENVIRONMENTAL ENTREPRENEURS AND CLEANTECH VENTURE NETWORK LLC
26
from 2005 to 2004.34) As a result, any state or municipality that succeeds in spawning a cleantech cluster could see a rapid surge in cleantech venture investing, driving significant job growth and economic activity in a short period. The mercurial nature of venture capital also has a downside, of course – market cyclicality, economic conditions, and a host of other factors can cause venture capital flows to contract quickly. For this reason, policy makers must not depend entirely on venture capital to foster their cleantech clusters. For burgeoning clusters, it is important that states and regions implement thoughtful and consistent policies – backed by funding – that can both allow startups to take advantage of investor interest in their sector, but also provide support when fluctuations in private financing occur. The rest of this report is intended to identify current and emerging cleantech clusters in the U.S., and provide concrete ideas for policy-makers interested in helping their states develop cleantech clusters. In approaching these issues, we have addressed three key questions:
1. How can states grow market demand for cleantech products and services?
2. How can states attract and nurture cleantech startups within their borders?
3. How can states better encourage cleantech private equity investors to invest in those companies?

Creating Cleantech Clusters: 2006 Update
27
CHAPTER 3
LEADING U.S. CLEANTECH REGIONS AND CLUSTERS
3.1 THE BENEFITS OF CLUSTERS For public policy-makers trying to create new economic growth, a common strategy is to create conditions for the development of an industry cluster. Harvard Business School professor Michael Porter defines a cluster as “a concentration of companies and industries in a geographic region that are inter-connected by the markets they serve and the products they produce.”35, c Well-known clusters include Silicon Valley, the mutual fund industry in Boston, the textile cluster in the Carolinas, and the fashion shoe cluster in Northern Italy. As Porter points out, new clusters often grow out of established ones. For instance, the same resources that enabled Silicon Valley’s high-tech cluster to develop – a great higher educational system, entrepreneurial talent, expertise in advanced technologies, and access to capital – have proven to be critical building blocks for creating a cleantech cluster. Existing companies play a crucial role: technology and management spin-outs from established high-tech companies frequently spawn new cleantech businesses.
c In this report we distinguish between “clusters” and “regions” that receive cleantech financing. Defining a cluster is more art than science, but at a minimum a cluster implies a narrower – and geographically smaller - definition than a region. One useful (though not absolute) criterion for defining a cluster is whether an employee can change jobs in the same industry without selling their home. By that definition it appears that two cleantech clusters are emerging in the U.S., one in California’s Bay Area, and one around Boston (see below). However, although regions are not clusters, examining capital flows into a region can suggest the emergence of potential clusters within that region.

ENVIRONMENTAL ENTREPRENEURS AND CLEANTECH VENTURE NETWORK LLC
28
THE BENEFITS OF CLUSTERS Companies in a cluster compete against one another, but they also share key resources. By gathering together in one region, companies foster communication and trust, leading to eventual advantages in efficiency, effectiveness, flexibility, and the rate of innovation. They share access to employees and suppliers, they leverage the same specialized business services (lawyers, accountants, banks, marketing, and so on), and they trade information and technologies. This shared access, and the fierce competition it engenders, provide cluster companies a leg up on companies not in the cluster. Clusters spur new successful companies, which perpetuate and upgrade the cluster, and so on. High-tech clusters tend to form around academic institutions that produce much of their technological raw material. For instance, information technology (IT) startups Sybase, Ingres, Illustra, and Inktomi were all founded on technology developed at the University of California at Berkeley. Google’s founders are Stanford graduates. Sun Microsystems was formed using technology developed at both Berkeley and Stanford. All these companies were founded in California and remain there today, employing thousands of people as part of the state’s huge IT cluster. Clusters create another important benefit for their companies – a cluster puts a face on an industry, unifying often disparate corporations into a coherent entity to which industry outsiders can relate. Rattle off a list of high-tech companies, and many people won’t know half of them. Say “Silicon Valley,” and people know immediately what you’re talking about. This “face” is important – it helps brand an industry, raises its profile, and helps investors, entrepreneurs and consumers better understand the industry’s significance. The presence of a cluster may also reassure investors. As a cluster of successful businesses in one industry emerges, investors tend to gain confidence in placing money with new startups in that sector. Where others have succeeded, and with available talent and resources in close proximity, there is more reason to believe that the risk inherent in any one company is manageable.
3.2 U.S. CLEANTECH REGIONS TODAY In the U.S., two regions – California and the Northeast – currently attract the majority of cleantech venture funding. A third region, the Midwest, appears to be gaining ground. It seems likely that clusters will develop within each of these regions. Indeed, two clusters already seem to be forming – one in Northern California, and the other around Boston. Figure 3.1 shows the amount of cleantech venture capital invested by region in 2005.

Creating Cleantech Clusters: 2006 Update
29
Figure 3.1 U.S. Cleantech Regions 2005 (Millions of dollars of 2005 cleantech VC Investment)
$0
$100
$200
$300
$400
$500
$600
WestCoast
North-east
Mid-west
South-East
South-West
Rockies/Plains
North-West
$487MM
$410MM
$190MM
$121MM $112MM
$17MM $11MM
Source: Cleantech Venture Network Because venture capital flows vary from year to year, perhaps a better measure of a region’s cleantech activity is the number of cleantech startups based there. While not every good startup seeks venture money, many of the most promising companies do. Figure 3.2 shows the total number of unique cleantech companies receiving venture funding in each region between 2001 and 2005. We cannot be sure that all of these companies are still in business, nor that others haven’t chosen to keep their financings undisclosed (in which case they would not be captured here). Furthermore, some types of businesses are not suited for venture investing. Nonetheless, this measure is a useful proxy for the high-quality, grass-roots entrepreneurial activity of a region.

ENVIRONMENTAL ENTREPRENEURS AND CLEANTECH VENTURE NETWORK LLC
30
Figure 3.2 Unique U.S. Cleantech Companies Receiving Venture Capital Funding, by Region, 2001-2005 (Number of Companies)
0
50
100
150
WestCoast
North-east
Mid-west
South-East
South-West
Rockies/Plains
North-West
126119
75
40 4029
18
Source: Cleantech Venture Network
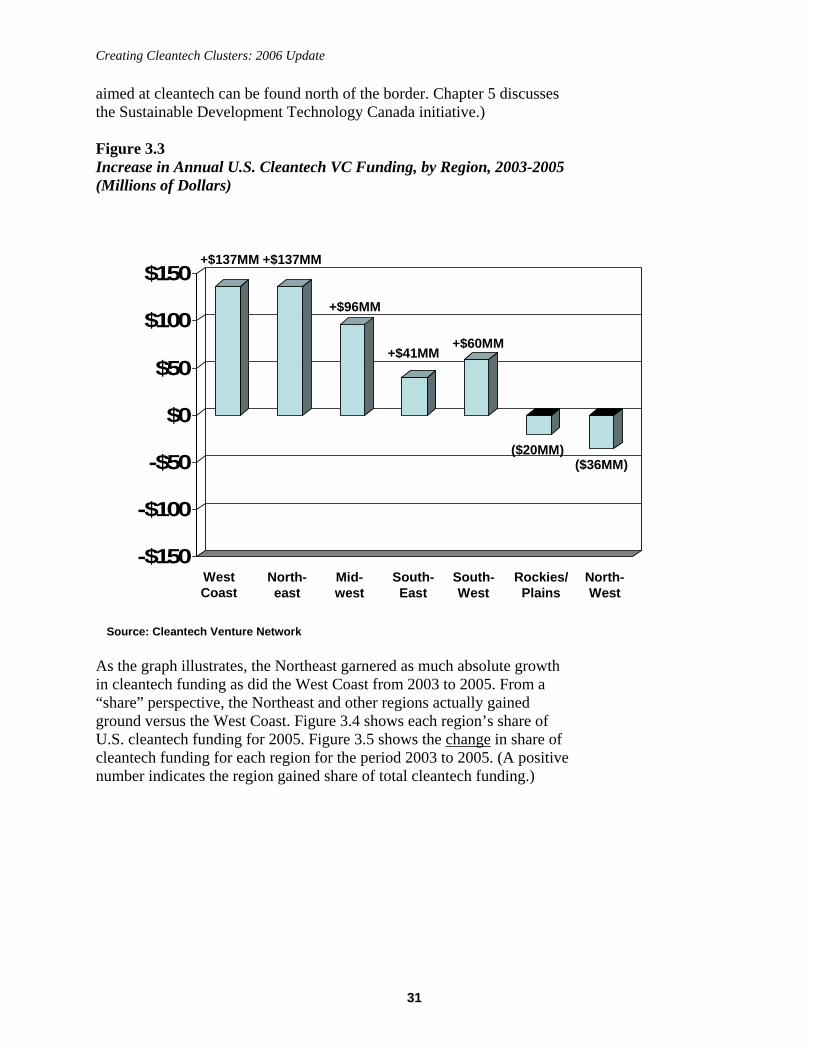
3.3 GROWTH AND SHARE CHANGE IN U.S. CLEANTECH REGIONS The West Coast (California and Hawaii) has long been the leading US region for cleantech financing. Cleantech VC funding continues to grow rapidly there – 2005 VC funding to California increased 36% over 2004. However, other regions, in particular the Northeast, Midwest, and Southwest, have also seen rapid growth in cleantech funding in recent years. Across the United States, annual cleantech funding grew approximately $400 million between 2003 and 2005, from just under one billion in 2003 to $1.4 billion in 2005. Figure 3.3 shows which regions captured that $400 million annual increase in funding. (It is worth noting that Canada has also seen a rapid rise in cleantech venture funding received, from $87 million in 2003, to $158 million in 2004, to $233 million in 2005. Given the fluid economic border between the U.S. and Canada, policy-makers may want to consider Canadian entrepreneurialism and venture capital flows as they form new policy. Additionally, good examples of public policy programs
Creating Cleantech Clusters: 2006 Update
31
aimed at cleantech can be found north of the border. Chapter 5 discusses the Sustainable Development Technology Canada initiative.) Figure 3.3 Increase in Annual U.S. Cleantech VC Funding, by Region, 2003-2005 (Millions of Dollars)
-$150
-$100
-$50
$0
$50
$100
$150
WestCoast
North-east
Mid-west
South-East
South-West
Rockies/Plains
North-West
+$137MM
+$96MM
+$41MM
Source: Cleantech Venture Network
+$137MM
+$60MM
($20MM)($36MM)
As the graph illustrates, the Northeast garnered as much absolute growth in cleantech funding as did the West Coast from 2003 to 2005. From a “share” perspective, the Northeast and other regions actually gained ground versus the West Coast. Figure 3.4 shows each region’s share of U.S. cleantech funding for 2005. Figure 3.5 shows the change in share of cleantech funding for each region for the period 2003 to 2005. (A positive number indicates the region gained share of total cleantech funding.)

ENVIRONMENTAL ENTREPRENEURS AND CLEANTECH VENTURE NETWORK LLC
32
Figure 3.4 Share of 2005 U.S. Cleantech Funding, by Region (% of U.S. Cleantech Funding)
Source: Cleantech Venture Network
West Coast36%
Northeast30%
Midwest14%
Southeast9%
Southwest9%
Rockies/Plains 1%Northwest 1%

Creating Cleantech Clusters: 2006 Update
33
Figure 3.5 Change in Share of Cleantech Venture Capital Funding, by Region, from 2003-2005 (% of total US Cleantech VC funding)
-5%-4%-3%-2%-1%0%1%2%3%4%5%
WestCoast
North-east
Mid-west
South-East
South-West
Rockies/Plains
North-West
(1%)
+1%
+4%
No change
+3%
-3%
-4%
Source: Cleantech Venture Network
3.3 CLEANTECH REGION PROFILES Two regions capture the bulk of U.S. cleantech venture funding: the West Coast (primarily California) and the Northeast. A third region – the Midwest – has seen rapid growth in cleantech funding of late, and we hypothesize that a cleantech cluster may be emerging there. CALIFORNIA California receives the most cleantech funding of any state or region in the country, having attracted nearly $2 billion of cleantech venture capital over the last five years.36 California also hosts the most venture-backed cleantech startups of any state or region. The state is a natural host for a cleantech cluster, possessing many of the necessary ingredients: a thriving technology base, abundant entrepreneurial and management talent, access to capital, and a proactive environmental public policy. As one venture capitalist put it, California is the “primordial soup” for cleantech entrepreneurialism. In a 2004 E2/NRDC survey37, venture capitalists were asked to name the one place worldwide that is “the most attractive for cleantech/clean energy investment.” California received nearly twice as many mentions as any other state, region, or country.

ENVIRONMENTAL ENTREPRENEURS AND CLEANTECH VENTURE NETWORK LLC
34
As table 3.1 shows, California’s cleantech activity is focused around four sectors: clean Energy-tech; Materials & Nanotechnology; Enabling Technologies, and Manufacturing/Industrial. Table 3.1 California Cleantech Cluster Composition
Unique
VC-funded 2005 VC Companies $ Raised 2005 VC 2001-2005 ($MM) FinancingsEnergy-tech 45 $181 21 Materials & Nanotechnology 22 $100 9 Manufacturing/ Industrial 14 $29 3 Enabling Technologies 12 $52 4 Materials Recovery and Recycling 7 $18 2 Water Purification & Management 7 $31 5 Agriculture & Nutrition 5 $16 3 Air Quality 4 $37 6 Environmental IT 4 $18 3 Transportation & Logistics 4 $2 1 124 $484 MM 57
Some of the cleantech companies in California include: SEGMENT COMPANY & DESCRIPTION Energy-tech eLite Optoelectronics (Sunnyvale)
Energy Efficiency Developer of high power indium gallium nitride light emitting diodes used in various solid state lighting applications.
Nanosolar, Inc. (Palo Alto) Energy Generation Developer of cost-efficient solar panels with novel high-volume production technology.
PowerGenix Systems (San Diego) Energy Storage Developer of high discharge rate rechargeable nickel-zinc (NiZn) batteries.
Materials & Nanotechnology
Sub-One Technology (Livermore) Developer of high performance carbon film coatings for interior surfaces, improving existing in-service life expectancy of high-wear critical components.

Creating Cleantech Clusters: 2006 Update
35
Yulex Corporation (Carlsbad) Manufacturer and marketer of a safe, natural rubber latex for medical products.
Enabling Technologies Crossbow Technology Inc. (San Jose) Provider of wireless sensor networks for applications such as environmental monitoring.
NeoPhotonics Corporation (San Jose) Developer & manufacturer of optical components for industries including electronic and photonic materials, energy storage and the manufacture of catalysts, ceramics and semiconductors.
Manufacturing/ Industrial
SpectraSensors, Inc. (San Dimas) Manufacturer of laser and LED-based gas sensors for industrial, energy, and environmental applications.
NORTHEAST The Northeast region, comprising eleven states and Washington, DC, is the second major cleantech fundraiser in the U.S. In reality, the Northeast contains two primary regions: one around Boston (arguably a cluster), and the region comprising New York, Connecticut, New Jersey, and Pennsylvania. Of the 119 Northeastern cleantech startups that received venture funding from 2001 to 2005, 43 are in Massachusetts, and 52 are in New York, Connecticut, New Jersey, and Pennsylvania combined. Interestingly, in the period 2001-2005, a higher percentage of investors putting money into cleantech startups had their headquarters in the Northeast than in California (29% versus 21%).38 The Northeast received $410 million in cleantech VC funds in 2005. Massachusetts received $247 million in 28 financings, and the combined 4-state region around New York received $64 million in 21 financings. The smaller average deal size for the New York-area cluster reflects a higher prevalence of early-stage startups, especially in New York State. In other words, the Northeast is growing and can be expected to receive much larger capital flows as its cleantech companies mature. As in California, the Northeast’s cleantech cluster is centered around energy; Energy-tech companies received 41% of cleantech VC funding in 2005. Materials & Nanotechnology were second at 24%, with Manufacturing/Industrial receiving 10%.

ENVIRONMENTAL ENTREPRENEURS AND CLEANTECH VENTURE NETWORK LLC
36
Table 3.2 Northeast Cluster Composition VC-funded 2005 VC Companies $ Raised 2005 VC 2001-2005 ($MM) FinancingsEnergy-tech 41 $168 27 Materials & Nanotechnology 19 $99 11 Manufacturing/ Industrial 14 $43 4 Agriculture & Nutrition 10 $23 4 Water Purification & Management 8 $4 3 Materials Recovery and Recycling 7 $25 2 Air Quality 6 $13 4 Enabling Technologies 6 $0 0 Transportation & Logistics 5 $36 3 Environmental IT 3 $0 0 119 $410 MM 58

Creating Cleantech Clusters: 2006 Update
37
CLEANTECH IN MASSACHUSETTS From a small start, Massachusetts has grown to be the number two state in venture-backed cleantech activity. The state received $247 million in 2005 cleantech VC funding. Between 2001 and 2005, cleantech venture capital flowing into the state quintupled, and the number of venture-backed cleantech startups nearly tripled, to 43. How did Massachusetts do it? Long before cleantech existed as a distinct industry, Massachusetts had many of the attributes needed for successful cluster development. Massachusetts is home to world-class universities, including Harvard, MIT, Boston University, Northeastern, and the University of Massachusetts. Many of these schools maintain leading programs in cleantech-relevant fields, such as engineering, energy, biology, and computer science. Due to Boston’s extensive financial services industry, local capital is abundant. And the state already has many high-tech companies, notably in its vaunted biotechnology cluster. Recently, though, Massachusetts has added one crucial element to the pot that we believe is catalyzing its rapid growth in cleantech: a pro-active environmental public policy. In 2002, the state promulgated a Renewable Portfolio Standard (RPS) which mandates that 4% of electricity must be derived from renewable sources by 2009, with the percentage increasing 1 point each year thereafter. The state has also introduced several innovative financing mechanisms to foster cleantech startups. These include: • The Massachusetts Renewable Energy Trust (RET). The RET was established in 1998 and is funded through a small surcharge on ratepayers’ utility bills. Organizations receiving RET funding to date include Evergreen Solar and Konarka Technologies (leading solar PV manufacturers), Nuvera Fuel Cells and Accumentrics (fuel cells), and New Energy Finance. • The Massachusetts Green Energy Fund (MGEF), a privately managed venture capital fund chartered to invest public and private money in Massachusetts-based renewable energy companies. • The Sustainable Energy Economic Development Initiative (SEED), which provides $50,000 to $500,000 convertible loans for companies undertaking new product development at the critical stage between R&D and commercialization. Massachusetts has long been a leader in promoting responsible environmental regulations, which help spur cleantech business. However, Massachusetts recently withdrew from the Regional Greenhouse Gas Initiative (RGGI), a pact that will certainly drive cleantech innovation throughout the Northeast. How this will impact Massachusetts’ cleantech cluster remains to be seen.

ENVIRONMENTAL ENTREPRENEURS AND CLEANTECH VENTURE NETWORK LLC
38
Some of the cleantech companies in the Northeast include: SEGMENT COMPANY & DESCRIPTION Energy-tech Evergreen Solar (Marlboro, MA)
Energy Generation Developer of thin-film technology for solar photovoltaic cells. Evergreen Solar went public in 2000 and now has a market capitalization of nearly $1 billion (as of April 23, 2006).
Franklin Fuel Cells, Inc. (Malvern, PA) Energy Generation Developer of solid oxide fuel cell (SOFC) technology.
GridPoint, Inc (Washington, DC) Energy Efficiency Provider of intelligent energy management appliances.
Lilliputian Systems, Inc (Woburn, MA) Energy Generation Developer of a micro-fuel-cell based power supply for handheld electronics.
Comverge, Inc. (East Hanover, NJ) Energy Infrastructure Provider of energy monitoring and communications software to utilities and energy service companies.
Materials & Nanotechnology
Aerogel Composite, LLC (Storrs, CT) Developer of proprietary technologies involving meso-porous carbon aerogel composites.
ApNano Materials, Inc. (New York, NY) Provider of nanotechnology-based products including the first commercial solid lubricant based on spherical inorganic nanoparticles.
Manufacturing/ Industrial
Sensors for Medicine and Science, Inc. (Germantown, MD) Developer of sensing technology for detection and measurement of molecules.
Tiger Optics, LLC. (Warrington, PA) Developer of laser-based spectroscopy instruments for detection of trace contaminants in gases.

Creating Cleantech Clusters: 2006 Update
39
MIDWEST The Midwest region features 75 venture-backed companies in 11 states. In 2005, the region received $190 million in 30 cleantech VC financings, up 129% from reported 2004 activity of $83 million in 11 financings. Of the Midwestern states, Illinois led the pack with $50 million received, followed by Indiana ($41 million) and Michigan ($28 million). Illinois hosts the most venture-backed cleantech startups, at 22. Like the other regions, the Midwest’s largest sector is Energy-tech. Manufacturing/Industrial and Materials & Nanotechnology round out the top three. Table 3.3 Midwest Cluster Composition VC-funded 2005 VC 2005 VC Companies $ Raised Financings 2001-2005 ($MM) Energy-tech 26 $93 15 Manufacturing/ Industrial 13 $10 2 Materials & Nanotechnology 12 $54 4 Materials Recovery and Recycling 7 $11 3 Agriculture & Nutrition 5 $6 1 Transportation & Logistics 5 $0 1 Water Purification & Management 3 $16 2 Environmental IT 2 $1 1 Enabling Technologies 1 $1 1 Air Quality 1 $- 0 75 $190 30
Some of the cleantech companies in the Midwest include: SEGMENT COMPANY & DESCRIPTION Energy-tech Hydrogen, LLC (Cleveland, OH)
Energy Generation Manufacturer of multi-megawatt fuel cell systems utilizing proprietary, air-cooled phosphoric acid fuel cell technology.
Iroquois Bio-Energy Company LLC (Rensselaer, IN) Energy Generation Producer of ethanol from corn.

ENVIRONMENTAL ENTREPRENEURS AND CLEANTECH VENTURE NETWORK LLC
40
Tekion, Inc. (Champaign, IL) Energy Storage Developer of an advanced battery technology with a unique micro fuel cell technology.
Akermin, Inc (St Louis, MO) Energy Generation Developer of portable fuel cells.
Manufacturing/ Industrial
Informance International (Northbrook, IL) Developer of equipment efficiency and utilization analysis software for the manufacturing industry.
Cool Clean Technologies (Eagan, MN) Provider of carbon dioxide cleaning technology.
Materials & Nanotechnology
Northwest Coatings LLC (Oak Creek, WI) Developer and manufacturer of customized specialty energy-curable and water-based coatings and adhesives that are environmentally friendly and solvent free.
Nanosphere (Northbrook, IL) Developer of a system for detecting bio-molecules such as nucleic acids and proteins.

Creating Cleantech Clusters: 2006 Update
41
CHAPTER 4
USING PUBLIC POLICY TO CREATE CLEANTECH CLUSTERS
4.1 NECESSARY CONDITIONS FOR CLUSTERS Creating a cluster is no simple task, and public policy is but one ingredient in a complex recipe. We identify seven key factors for the development of cleantech clusters:
• Technology innovation and expertise (from public and private research)
• Entrepreneurial culture • Management talent • Access to capital and other financing • Large local markets for products and services • Proactive public policy • Consumer/customer acceptance
In 2004 we surveyed 25 cleantech investors (most of them venture capitalists) in an effort to understand the attributes they believe help spawn environmentally-oriented industries.39 At the time, we were asking specifically about the attractiveness of California as a place to invest, but the themes these investors highlighted are universal. Repeatedly, they mentioned the same qualities as being important: a vibrant and experienced entrepreneurial community; pro-active environmental public policy; high quality university systems; the presence of other successful high-tech companies (with subsequent spin-outs and management talent); availability of capital; and large local markets for cleantech products. Figure 4.1 shows the main attributes venture capitalists look for when choosing where to focus their cleantech investments. The responses are

ENVIRONMENTAL ENTREPRENEURS AND CLEANTECH VENTURE NETWORK LLC
42
ranked by the number of mentions in the survey. (Each respondent could name up to three reasons.) Figure 4.1 Attributes for Cleantech Cluster Development (Number of Mentions)
0
5
10
15
EntrepreneurialCulture/Talent
PublicPolicy
Technology/Education
Base
AvailableCapital
LargeLocal
Market
CleantechDealFlow
ConsumerAwareness
Source: NRDC N = 25 respondents
A region need not have all of these attributes to create a successful cluster. However, a key set of attributes is necessary to begin building a cleantech cluster. At a minimum, a corps of entrepreneurial and management talent, and a base of technology expertise (whether from public or private research) are critical ingredients. Additionally, most states will have specific areas of strength, rather than expertise in all or most of the technologies contained in cleantech. For instance, a region may have a strong agricultural base which suits it for a biofuels industry. Others may have specific advantages due to their existing industrial bases – for instance, petrochemicals in the Northeast corridor, biotechnology around Boston, information technology in California, and forestry and paper in the Southeast. Others may have natural advantages in certain industries due to topographical, climatic, and resource attributes: the prevalence of wind in the northern Midwest, solar energy in the Southwest, and coal in

Creating Cleantech Clusters: 2006 Update
43
the northwestern plains and parts of the Southeast suggest natural starting points for cleantech industries. States and municipalities are encouraged to identify their relative strengths (and weaknesses) and explore in which areas of cleantech they may best be able to compete. It is important to note that of the seven ingredients listed above, most take decades to develop. A world-class university system cannot be built in a few years. World-class companies and management talent can be recruited over time, but they do not spring up overnight. And states can’t do much in the short term to increase the size of their local economies. However, states and regions can do things in the short term to catalyze markets for cleantech products, create a business-friendly environment for entrepreneurs, and attract capital. The key to all of these steps is progressive public policy.
4.2 THE IMPORTANCE OF PUBLIC POLICY IN PRIVATE EQUITY INVESTMENT DECISIONS In our 2004 survey of cleantech investors, we asked them how important public policy is to them as they decide where to invest. At the time, this sample of investors controlled more than $7 billion in committed capital, and planned to invest more than $4 billion of it over the following three years. $1.2 billion of that was explicitly slated for cleantech investment. Again, the specific context of the survey was California, but the findings apply broadly. (Fewer than half of the VCs surveyed were based in California.) Our survey shows clearly that public policy does influence where VCs invest. The link is an indirect one – VCs invest in companies, not in states. But the vast majority of investors we surveyed think policy can significantly impact the growth of cleantech clusters: • 79% of venture capitalists surveyed said that public policies (regulations,
programs, and incentives) are a factor in their cleantech investment decisions
• 91% of venture capitalists surveyed say that a pro-environmental public
policy stance can be a driver in bringing new business and investment to a state
• Regulatory Climate/Public Policy ranked second in the list of reasons for
why venture capitalists like investing in California cleantech companies

ENVIRONMENTAL ENTREPRENEURS AND CLEANTECH VENTURE NETWORK LLC
44
4.3 CASE STUDY: KEY CALIFORNIA REGULATIONS AND INITIATIVES The venture capitalists we surveyed highlighted several California initiatives that they feel encourage both cleantech startups and private equity investment in the state. The list presented below is not comprehensive, nor intended to suggest that these are the best instruments available to policy-makers. Rather, it reflects the programs that were repeatedly mentioned by venture capitalists in a survey specifically about California. We present these as examples of programs other states might consider. (Indeed, many states have already adopted similar programs.) A more comprehensive list from a variety of states is presented in Chapter 5.
The Green Wave Initiative With the Green Wave Initiative, the two major California pension funds (CalPERS and CalSTERS) allocated in 2004 $450 million dollars to private equity firms for investment in cleantech companies. Both funds are expected to have fully invested that capital by the end of 2006. Green Wave is an important initiative for several reasons. First, the sheer magnitude of capital should provide a significant boost to the cleantech sector. Second, the hope is that Green Wave will cause a ripple effect and encourage other states to follow suit, particularly as the structure of the Green Wave initiative proves viable and initial investments begin to bear fruit. The net effect of Green Wave on cleantech VC investment is difficult to quantify. But there was a consensus among the VCs surveyed that Green Wave would encourage additional cleantech investors, particularly in California. As one venture capitalist put it, Green Wave could be “a key lubricant” for the California cleantech industry.
Public Interest Energy Research (PIER) Program The California Public Interest Energy Research (PIER) Program supports research and development (R&D) in energy technologies through direct research grants totaling up to $62 million annually. Companies receiving PIER awards must address a California energy problem and provide a potential benefit to California electric ratepayers or natural gas customers. PIER is cited by many investors and entrepreneurs as a critical link in the development process of energy-tech companies, since many have technology gestation periods that make them initially unsuitable for venture capital investment. PIER funding, by filling a critical gap in the

Creating Cleantech Clusters: 2006 Update
45
financing infrastructure, helps these companies get to a point where they might attract venture capital. A good example of a PIER success is PowerLight Corporation, a privately held designer, manufacturer, and installer of solar photovoltaic systems based in Berkeley, Calif. With 2003 revenues (the latest available) exceeding $55 million, and more than 100 employees, PowerLight initially used PIER funding to develop its flagship product, Powerguard®, a patented polystyrene solar roof tile.
California’s Renewable Portfolio Standard (RPS) Passed into law in 2002 and recently updated, California’s RPS requires the state's investor-owned utilities to buy or produce 20 percent of their power from renewable sources by 2010. The law requires utilities to increase the renewable portion of their portfolios by 1% annually until each utility meets the 20% standard. According to State documents, “the Governor expanded the goal to achieving 33 percent renewables by 2020 for both investor-owned utilities and municipal utilities.”40 As of 2002, 12% of the electricity consumed in California came from renewable sources.
Renewable Energy Incentive Programs California offers several incentive programs for generators of renewable power:
Renewable Resource Trust Fund41: The Renewable Resource Trust Fund is funded with $135 million annually from the three California investor-owned utilities via a public goods surcharge on electricity use. This money is distributed through a cents-per-kilowatt-hour incentive to a variety of Existing, New, and Emerging renewable generation technologies including: biomass; waste tire; wind; geothermal; small hydro; digester gas; landfill gas; municipal solid waste; PV and thermal solar; fuel cells; inverters; and other qualifying technologies. The Fund also supports a consumer education campaign to inform the public about the benefits and available choices of renewable energy technologies.
As of December 31, 2005, the Fund had disbursed $592 million since its inception. $223 million has gone to support 378 Existing Renewables projects, covering 1,110 GigaWatt hours (GWh) of production. Fifty-eight million dollars has helped fund 45 New Renewables projects, supporting 5,964 GWh of production. And the Emerging Renewables program has

ENVIRONMENTAL ENTREPRENEURS AND CLEANTECH VENTURE NETWORK LLC
46
provided $234 million to over 15,000 systems, supporting 64 MW of new capacity.
Solar PV Initiatives: Both the California Energy Commission (CEC) and California Public Utilities Commission (PUC) have offered “buy-down” programs that reimburse purchasers of solar systems for up to 50% of their project cost. California also offers a phased Solar Income Tax Credit (15% of the capital investment for the first two years, 7.5% for the remaining two years) for residential and commercial customers purchasing onsite PV systems up to 200 KW in size. Finally, net-metering credits reimburse solar system owners for energy they produce but do not use. Individual municipalities and utilities also offer substantial rebates to customers installing PV equipment.
California Solar Initiative (CSI): In January 2006 the California Public Utilities Commission approved the California Solar Initiative (CSI), committing $2.9 billion over the next ten years to help homeowners, businesses, farmers, and government install 3000 MW of new solar capacity on 1 million rooftops in California.42 It is estimated that the initiative will help dramatically lower the cost of solar cells and create 15,000 jobs over the coming decade.43 (Note: The CSI program has replaced both the Emerging Renewables Program and the CPUC’s Self Generation Incentive Program.)
By offsetting the capital, installation, and production costs of PV, wind, and other power systems, California has helped nurture one of the largest state-based renewable energy industries in the country, with hundreds of renewable equipment manufacturers, installers, and servicers now employing thousands of Californians. Energy Efficiency Rebates California’s Public Utilities Commission (CPUC) recently approved $2 billion in funding for energy efficiency programs for the period 2006-2008. The money will provide rebates for installation of qualifying energy-efficient products in multifamily buildings. This significant initiative, the largest in the nation, should help spur adoption of new and existing technologies for energy efficiency.
Diesel Emissions Reduction Plan As of 2000, diesel engines released more than 25,000 tons of particulate matter into California’s air each year, of which roughly two-thirds came from off-road equipment. In September 2000, the California Air Resources Board (ARB) adopted a plan to achieve 75% reductions by

Creating Cleantech Clusters: 2006 Update
47
2010 in particulate matter and NOx emissions from on and off-road diesel engines, and 85% reductions by 2020. The Diesel Risk Reduction Plan and its subsequent regulations seek to lower emissions through a combination of stricter regulations, incentive programs, and compliance assurance activities. Two of the Diesel Risk Reduction Plan’s more prominent programs provide incentives for owners of diesel engines to replace their existing equipment with cleaner options. The Carl Moyer Program, established in 1999, pays vehicle owners to offset the extra cost of reducing nitrogen oxides (NOx) emissions. To date the program has provided $174 million to subsidize replacement of more than 7,000 conventional diesel engines with alternative-fuel engines and other upgrades, reducing 18 tons per day of NOx emissions and one ton per day of diesel particulate matter. The Carl Moyer Program is an important part of California’s progress towards meeting its State Implementation Plan (SIP) for air quality.44 Since its inception, the Lower-Emission School Bus Program has allocated more than $70 million to replace 500 pre-1987 school buses. Additional plans call for the installation of filters on more than 3,000 buses. In 2006, $25 million has been approved for the program; half will be used for new school bus purchases, and half for retro-fits to existing buses. Of highest target are the 743 pre-1977 buses in the state, which had no federal safety standards.45 By creating a mandated market and providing incentives for customers, California’s diesel emission programs have opened numerous entrepreneurial opportunities for California-based companies.
4.3 A COORDINATED EFFORT: PUBLIC POLICY AND PRIVATE INVESTMENT The evidence is mounting that public policy can be a key factor in driving both cleantech demand and entrepreneurialism, and in attracting capital to states. At the same time, nearly every VC we interviewed said they won’t invest in a company that is dependent on one regulation for its success. Instead, a holistic approach to environmental regulation and public policy is more important to the investing community than any individual regulation.
In addition, many investors emphasize the need for consistency in the way public policy is implemented. A case in point (although at a national level) is the on-again, off-again implementation of the renewable energy

ENVIRONMENTAL ENTREPRENEURS AND CLEANTECH VENTURE NETWORK LLC
48
Production Tax Credit, or PTC. Periodically renewing and lapsing, this federal tax credit has led to a boom-bust cycle in the wind turbine industry (Figure 4.2), making it very difficult for entrepreneurs, project developers, financiers, utilities, and infrastructure manufacturers like GE Energy to plan and operate their businesses. As one venture capitalist remarked, “How they (policy-makers) do this is as important as what they do.” Figure 4.2 U.S. Windpower Capacity Additions (MWs per year)
0
500
1000
1500
2000
2500
1999 2000 2001 2002 2003 2004 2005
575
43
1696
410
1687
389
2431
Source: Union of Concerned Scientists; American Wind Energy Association
6/99 PTC Expires –Extended
12/99
12/01 PTC Expires –Extended
2/02
12/03 PTC Expires –Extended
10/04
8/05 PTC Extended
To 12/07
The radical swings in production caused by the intermittent PTC have caused enormous problems for people up and down the wind energy supply chain, from manufacturers to financiers to customers, and have limited the growth of the U.S. wind industry. Now with the predictability afforded by a two year extension of the PTC (in August 2005, the first time the PTC was extended before it expired), many in the wind industry are planning for a period of sustained growth. The PTC should serve as a cautionary tale for policy-makers as they consider how to foster growth in the cleantech industry and achieve their environmental and energy goals. Ultimately, investors, entrepreneurs, and consumers look to policy-makers to reduce risk, not increase it. Consistency in regulation will be a key element of building successful public-private partnerships with the cleantech industry.

Creating Cleantech Clusters: 2006 Update
49
CHAPTER 5
PUBLIC POLICY OPTIONS FROM OTHER STATES AND REGIONS
A number of states, municipalities, and regions have adopted progressive policies which are spurring cleantech entrepreneurialism and investment. In addition to meeting any environmental objectives, these policies are generally intended to achieve one of three goals in fostering cleantech clusters:
1. Build demand (directly or indirectly) for cleantech products and services
2. Provide additional financial backing (direct or indirect) to cleantech startups
3. Provide economic development services and other indirect assistance to the cleantech industry
Based on our observations, an important factor in getting cleantech-relevant policies enacted and making them successful is to build them around existing societal problems for which clean technologies may provide a solution. For instance, California’s highly publicized energy crises and air pollution problems laid the groundwork for the passage of its innovative clean energy programs (including the RPS), the PIER program, and the Diesel Emission Reduction Plan. These programs were not necessarily implemented to spawn a cleantech industry – instead, they were adopted to solve thorny, long-term problems that directly impacted the health and well-being of California citizens. That they have catalyzed the growth of a new economic sector for the state is a happy byproduct of good public policy. As policy-makers in other states consider how to build cleantech clusters, they would do well to consider what existing problems they might solve

ENVIRONMENTAL ENTREPRENEURS AND CLEANTECH VENTURE NETWORK LLC
50
by doing so. In the Southwest, water is a persistent and complex problem which will require real innovation – public and private - to solve. The Northeast, which is downwind from the Midwest’s many coal-fired power plants and has long suffered from a serious acid rain problem, has decades of experience working with the EPA, the DOE, and the power industry to find equitable solutions. That region’s attempts at implementing the nation’s first cap-and-trade system for greenhouse gases (the Regional Greenhouse Gas Initiative, described below) was a natural extension of this experience. Other states, cities, and regions will have their own specific needs. As policy-makers consider in which areas to focus their cleantech efforts, they will likely find that matching those efforts to outstanding policy problems will help ease passage and implementation of new policies.
5.1 BUILDING DEMAND FOR CLEANTECH PRODUCTS AND SERVICES States, regions, cities, and the infrastructure that support them often serve as critical early customers for cleantech ventures. In some cases, the demand is direct – for instance, a city may change its purchasing patterns to favor cleantech products such as low emission vehicles or equipment, clean energy, new water purification technology, or non-toxic supplies. Usually, in addition to providing economic benefit to cleantech companies, these measures aim to satisfy other important objectives, such as meeting Clean Air Act requirements, reducing pollution and resource use, or minimizing strain on municipal waste operations.
A state or region may also spur indirect demand for cleantech products by introducing policies that incentivize or require existing consumers and producers (public or private) to purchase or promote cleantech products. These include renewable portfolio standards (RPS), a tax on certain types of waste, a fuel credit for ethanol, biodiesel, or other clean fuels, or financial incentives for solar homes or green buildings, among many others. Finally, policy-makers may launch and catalyze entirely new cleantech markets through mandated regulation. The Regional Greenhouse Gas Initiative (RGGI) is one such initiative.
Some examples of demand-driving policies are described below. This is not intended as a comprehensive list, but merely an informal survey to suggest the range of possibilities available to policy-makers.
A. Direct Demand: Making the State/City/Region a Bigger, Better Cleantech Customer

Creating Cleantech Clusters: 2006 Update
51
State and local governments purchase billions of dollars of products and services each year. Steering more of this funding towards cleantech products helps create crucial demand for struggling startups, improves the environment, and “mainstreams” many cleantech products in the public eye. These programs also increase production volumes of these products, improving their cost positions and making them more competitive in national and global markets. Alternative Fuel Vehicles New York City Local Law 6 mandates that 80 percent of new light-duty vehicles and 20 percent of new bus purchases must be powered by alternative fuels. Natural gas has been the fuel of choice so far. It has been estimated that more than 60 companies in New York stand to gain business in providing alternative fuel vehicles, refueling stations, or fuel as a result of the program. 46 Several other city agencies have also implemented alternative fuel programs. The New York City Department of Transportation, which owns 1,100 buses operating mostly in the city's outer boroughs, is currently converting its fleet to natural gas, with 348 buses on order for delivery starting this year. Meanwhile, the Metropolitan Transportation Authority (MTA) is in the process of purchasing 500 alternative fuel buses powered by natural gas, or possibly, by a hybrid-electric engine.47 New Mexico New Mexico’s Alternative Fuel Acquisition Act of 1992 requires that 75% of state government and educational institution fleet vehicles acquired in fiscal year 2003 and thereafter (except authorized exemptions) be bi-fuel or dedicated alternative fuel vehicles (AFVs), or gas-electric hybrid vehicles. The act authorized a $5 million revolving loan fund for AFV acquisitions by state agencies, political subdivisions, and educational institutions. Additionally, by 2010, all cabinet-level state agencies, K-12 public schools, and higher education institutions are required to take action toward obtaining 15% of their total transportation fuel requirements from renewable fuels.48 Minnesota – Environmentally Preferable Purchasing Initiative49 To reduce the quantity and toxicity of waste in Minnesota, the state has adopted legislation requiring state agencies and other public entities to purchase recycled, repairable, and durable goods. Two of the initiatives implemented by the state are: • Recycled or Re-blended latex paint. Minnesota now recommends that
local and state governments purchase reprocessed or reblended latex

ENVIRONMENTAL ENTREPRENEURS AND CLEANTECH VENTURE NETWORK LLC
52
paint, with a recycled content of at least 20%. Recycled paints perform as well as non-recycled products, and offer cost savings up to 50% over virgin paint. The state awarded its contract for both recycled and reblended paints to Minnesota companies.
• Non-toxic cleaners. 33 categories of cleaning products were evaluated for inclusion on state purchasing lists, and a number were excluded based on their toxic contents. In one example, the state’s Central Stores now carry Spray & Clean, a pH-neutral, plant-derived, and water-based cleaner that is far less toxic than traditional alternatives. In addition to improving safety for Minnesota employees and citizens, this initiative has boosted the prospects for Brown & Company, the St. Paul-based company that makes Spray & Clean.
Other governments adopting Environmentally Preferable Purchasing programs include Massachusetts; Vermont; Ohio; King County, Wash.; Austin, Tex.; and many others.
B. Indirect Demand A host of measures are being implemented across the country to indirectly drive consumer and commercial demand for cleantech products. These may take the form of financial incentives to consumers and businesses, legal mandates, or education campaigns. Renewable Portfolio Standards (RPS) At least 28 states now have a renewable portfolio standard, which requires that some percentage of electricity consumed in the state be produced from renewable sources. The mechanisms for achieving this vary widely, but RPS’ are often powerful catalysts driving the growth of cleantech businesses. Examples of RPS’ include: • Texas. Passed in 1999, Texas’ RPS required 2.15% of the state’s energy
to be derived from renewables in 2005, rising to 3%, or 2,880 MW of renewable energy, by 2009. The legislation succeeded in setting off the “Texas Wind Rush,” spurring ten new wind projects totaling 930MW of power in 2001 alone. Twelve new landfill gas projects with 44MW of capacity and 50MW of hydropower renovations were also announced or came on line in 2001.50 Texas is now considered by many to be a national leader in the wind power industry, and innovative energy companies are springing up at a rapid pace. Much of the activity centers around the technological and entrepreneurial hub of Austin.

Creating Cleantech Clusters: 2006 Update
53
Other examples of RPS’ include:51 • California: 20% renewable power by 2010 • Illinois: 5% by 2010, with a goal of 15% by 2020 • Nevada: 20% by 2015 • New Jersey: 20% by 2020 • New Mexico: 10% by 2011 • New York: 25% by 2013 • Pennsylvania: 18% by 2020 • Rhode Island: 16% by 2019 Green Building Initiatives Green building initiatives include “green mortgages” and green building codes or educational programs. Energy Efficiency Mortgages (EEM), for instance, allow borrowers to qualify for a larger mortgage as a result of energy efficiency improvements. Green building codes can also spur cleantech investment. To cite one example, Seattle became in 2000 the first U.S. city to adopt a green building initiative. 52 The program aims to educate building industry professionals about the sustainability options available in the trade, and to encourage incorporation of sustainability principles and design into technical codes and land use policies. Prior to Seattle’s Green Building Program, only a handful of homes in Seattle were built to sustainability standards; by 2003, 15% of new homes built in King and Snohomish Counties complied with Seattle’s Built GreenTM certification standard.53 Programs like these help build demand for cleantech products such as solar power systems, energy efficiency technologies, and non-toxic or sustainable building materials. Renewable Energy Incentives Forty-six states now offer at least one financial incentive for consumers or commercial interests to build, install, or produce energy from renewable technologies. These range from the modest to the comprehensive. Some examples include:d • Iowa: 1.5 cent production tax credit (PTC) per kWh for residential and
commercial renewable energy projects; sales and property tax exemptions on wind and solar energy equipment and materials; interest free loans for analysis and installation of renewable projects
d A useful summary of various state renewable energy programs is provided by DSIRE (Database of State Incentives for Renewable Energy), at http://www.dsireusa.org/index.cfm?&CurrentPageID=7&EE=1&RE=1

ENVIRONMENTAL ENTREPRENEURS AND CLEANTECH VENTURE NETWORK LLC
54
• Louisiana: Property tax exemption for the value of installed renewable energy equipment, including passive solar and solar PV
• South Carolina: $1,000 rebate on installation of solar water heaters
• Idaho: low-interest loans for energy efficiency projects, and for active solar, wind, geothermal, hydropower and biomass energy projects
A number of states have also taken steps in conjunction with their electricity deregulation programs to make it easier to implement energy efficiency measures. Decoupling, for instance, which separates utilities’ profits from the volume of electricity they sell, removes the financial penalty utilities sometimes incur by promoting energy efficiency measures (which lower the volume of power consumed). C. Responsible Environmental Regulation Environmental regulation is perhaps the most powerful lever states have to spur the cleantech industry. In addition to protecting the environment and improving citizens’ health and quality of life, regulation can drive the adoption of cleantech products and services, helping to create thousands of new jobs. For instance, in California, state environmental regulation has been the primary force behind the creation of the 32,000 California jobs now supported by the Air Pollution Control (APC) industry. 54 Another intriguing example is that of RGGI, or the Regional Greenhouse Gas Initiative. RGGI is a cooperative effort by eight Northeastern and Mid-Atlantic states (Connecticut, Delaware, Maine, Maryland, New Hampshire, New Jersey, New York, and Vermont) to implement a cap-and-trade system regulating carbon dioxide emissions from power plants in the region. In March 2006, a Draft Model Rule was released for public comment. In brief, the Draft Model Rule proposes to cap regional carbon dioxide emissions at current levels (approximately 121 million tons per year) from 2009 to 2015, followed by incremental reductions to achieve 10% lower emissions by 2019. Trading of emission allowances will be allowed, and emitters can meet up to 3.3% of their commitments through natural gas energy efficiency “offsets” (projects that reduce greenhouse gas emissions from sources other than power plants, such as landfill methane, energy efficiency measures, or other greenhouse gas releases).55,56 RGGI is expected to catalyze investment in a variety of cleantech-related products and services in the Northeast, including renewable or low-carbon energy generation technology and energy efficiency projects. RGGI is expected to spawn a regional carbon market in which power companies can trade their carbon allowances and offsets. Additionally, a minimum of

Creating Cleantech Clusters: 2006 Update
55
25% of each state’s emission allowances will be allocated to support consumer benefit purposes. These allowances will be sold in the market, with the proceeds being used to fund energy efficiency measures and other consumer benefit projects. This plan is projected to produce regional revenues of $50-$185 million for these programs.57 Although it is too early to say for certain, analysis by the Federal Reserve Bank of Boston concludes that as currently outlined, RGGI is likely to have a “modest positive impact on gross regional product, personal income, and employment.” For companies in the cleantech industry, RGGI could be much more beneficial – indeed, the Federal Reserve Bank study attributes a recent $25 million venture capital raise by a cleantech company in Cambridge, Mass. (which is using algae to scrub carbon dioxide from power plant stacks), at least in part to the expected demand for new emissions reduction technologies due to RGGI.58
5.2 FINANCIAL ASSISTANCE TO CLEANTECH STARTUPS A. Solving the “Early Stage Funding Gap” Many startups encounter a paucity of early-stage funding (commonly known as “seed investment”) at the point when their technology leaves the lab, but is still years from being commercialized. This period, known colloquially in the venture capital industry as the “Valley of Death,” is the graveyard of many startups. This problem is not unique to cleantech – many startups falter for lack of funding in the period between the discovery of new technology and its commercial debut. The reason for this is fundamental to the venture capital industry – most VC funds are designed to return investors’ money in 10 years. Thus they need to liquidate their investment in a company (either through a public offering or sale of the company) in three to eight years. Yet many technologies take far longer to develop and commercialize. The early-stage funding gap is exacerbated in the cleantech industry for several reasons, including long technology gestation periods, unproven markets, high capital requirements, and long purchasing cycles (particularly in energy and water projects).59 Historically, investors’ lack of familiarity with the cleantech sector has also made it harder for cleantech startups to find this early-stage funding. As the cleantech industry matures, we see lack of familiarity becoming less of a barrier. But the “Valley” still remains a long and desolate trek for most cleantech startups.

ENVIRONMENTAL ENTREPRENEURS AND CLEANTECH VENTURE NETWORK LLC
56
A number of state and regional initiatives (including California’s PIER program, profiled above) have attempted to address this by providing additional early-stage R&D funding for startups. However, many VCs feel that neither PIER nor similar programs are sufficiently funded to support the increasing number of startups that will need assistance as the cleantech industry grows. Furthermore, VCs point out that in most states, there is little R&D funding available for non-energy cleantech companies. For instance, in California, there is no significant counterpart to PIER in the materials research, water treatment, clean consumer products, or other clean industries. As a result, there is a need for an increase – both at the state and federal level – in public funding of early-stage cleantech startups.60 Secondly, there is a clear need for the creation of programs comparable to PIER that are targeted at non-energy cleantech sectors. Several VCs in our 2004 survey expressed their desire for a state version of the federal Small Business Innovation Research (SBIR) program. State policy-makers are best equipped to understand the specific needs of their states – that is, which financing mechanisms make the most sense, for which technologies and sectors, and to solve which problems. Two innovative approaches to solving the early stage funding gap – one from Connecticut and one from Canada – are highlighted below. The Connecticut Clean Energy Fund (CCEF) Connecticut’s Clean Energy Fund, operational since 2000, makes equity investments in commercial enterprises whose products and services will accelerate the development of clean energy technologies, including fuel cells, solar, wind, biomass, wave/ocean technologies, and green buildings. The CCEF also supports research, education, and outreach initiatives designed to stimulate ratepayers' desire for clean energy. The CCEF’s funds come from a surcharge on Connecticut ratepayers' utility bills and are expected to total more than $100 million over 5 years. One of the CCEF’s stated goals is to make Connecticut “the fuel cell capital of the world.” Since its inception, the CCEF has allocated more than $75 million towards a variety of clean energy projects, including fuel cells. In 2005 the CCEF committed $2.3 million towards fuel cell initiatives within the state.61 The CCEF recently made a significant investment to establish the Connecticut Global Fuel Cell Center for fuel cell technology research at the University of Connecticut. The Fund also aims, more broadly, to encourage the expansion of the state’s renewable energy industry, which it considers to be “a major driver of the state’s economy” in the future.62

Creating Cleantech Clusters: 2006 Update
57
Sustainable Development Technology Canada (SDTC) SDTC is a Canadian non-profit foundation that funds the development and demonstration of clean technologies. SDTC’s focal areas include technologies which provide solutions to issues of climate change, clean air, water quality and soil, and which deliver economic, environmental and health benefits to Canadians. The Foundation draws from an investment fund of $550 million. Established in 2001, to date SDTC has allocated $169 million to 75 projects. Other project partners, including venture capitalists and industry, have leveraged these investments with an additional $449 million, bringing total SDTC funding to over $600 million.63 SDTC specifically aims to “bridge the gap” between the lab and commercialization by targeting cleantech startups whose technologies are entering the development and demonstration phase, a period at which private investment is often hard to come by. By assembling consortia of investors, relevant industry players, and academic experts for each of its projects, SDTC spreads investment risk, facilitates go-to-market strategies for startups, and generally accelerates the commercialization of technologies that can both succeed economically and benefit Canadian consumers and the environment. B. Loan and Lease Guarantees, and Project Finance Because many cleantech projects such as wastewater treatment and renewable energy installations are capital intensive, and because many banks are hesitant to lend to companies in these still unfamiliar industries, states and municipalities can assist their homegrown startups by facilitating financial transactions that are common in other industries. By guaranteeing loans and leases to cleantech startups, and providing project finance support, governments can ensure that cleantech startups and their customers obtain financing with the same ease and at the same cost as in other industries. C. Tax Breaks for Cleantech Companies For most early-stage startups, tax breaks would not be a critical aid, since most startups lose money for the first several years. Yet for companies that are further along, targeted tax breaks can make a crucial difference. In Canada, for instance, early-stage companies may write off 30-40% of the salaries of R&D employees. D. Business Plan competitions Business plan competitions, whether privately or government sponsored, provide another innovative way to provide seed funding (and marquee

ENVIRONMENTAL ENTREPRENEURS AND CLEANTECH VENTURE NETWORK LLC
58
value) to promising early-stage companies. In Massachusetts, the MIT Energy Forum of Cambridge administers the Ignite Clean Energy Business Presentation Competition, which awards $125,000 of funding annually to the most promising clean energy business plans. The California Cleantech Open will award $500,000 to promising cleantech startups in 2006. Although the prizes are small in the grand scheme of cleantech’s funding needs, the awards can help these fledgling companies get off the ground, provide important validation as they seek venture money, encourage entrepreneurs to bring their ideas to market, and help publicize a state or region’s cleantech entrepreneurial efforts.
5.3 CLEANTECH ECONOMIC DEVELOPMENT AND INDIRECT ASSISTANCE
A. Public Education Investment Technology research and development is at the heart of any state’s efforts to establish a cleantech cluster. Many cleantech startups are founded based on technology developed in public universities. Often, university researchers “spin out” to launch these new companies, and end up bringing the public dollar full circle as they create new jobs for the state, broaden the tax base, and commercialize technologies that eventually pay royalties back into the university’s coffers. States can help bring more clean technologies and products to market by explicitly allocating spending for cleantech research and development activities, and creating mechanisms that facilitate the commercialization of technologies from university labs.
More broadly, as the cleantech industry expands, there is likely to be more demand for engineers, chemists, biologists, physicists, environmental engineers and scientists, and other skilled professionals. Investing in programs for the hard sciences would benefit not only the cleantech industry, but would help reverse the declining prominence of the U.S. in the global race for scientific leadership.
B. Public Sector Outreach and Leadership In our 2004 survey, several respondents noted the important role that state leaders can play in promoting their cleantech clusters. By sponsoring public/private seminars, conventions, workshops, and organizations, and promoting local businesses in export development efforts, states can grow markets and foster business collaboration and innovation at minimal cost. Local leaders can also leverage their influence and visibility to promote their state or region as a breeding ground for the cleantech industry.

Creating Cleantech Clusters: 2006 Update
59
These efforts are particularly important now that the market for cleantech talent and technologies has gone global. To cite one example, a 2004 email circulating in the cleantech community outlined a proposal by the United Kingdom to attract American cleantech business to Europe. Similarly, Germany and Japan have fostered leading wind and solar industries through initiatives that make long-term renewable energy projects more economically viable. In the process they have supplanted the U.S as the leaders in these industries. To stay competitive, American states and cities need to very publicly present a compelling vision of their plans to be global cleantech centers.
C. Cleantech Incubators and Expanded Resources Incubators are centers of shared resources and facilities for startups. In incubators, companies work side by side in office space or labs, lowering costs and fostering collaboration. Incubator companies receive assistance with basic business tasks, such as writing business plans and filing taxes and patents. Cleantech incubators can assist startups in their development and slow the rate at which they burn precious capital.
D. Planning for Cleantech Clusters States can demonstrate their commitment to building a cleantech cluster by improving coordination within the cleantech industry, helping focus the state’s development efforts, and identifying (and where appropriate, emulating) successful cleantech regulations and programs from other states, cities, and countries. While economic cluster growth is in large part an “organic” phenomenon, state and local policy-makers and executives can help lay the groundwork for cluster development through thoughtful, non-financial intervention. Some ideas include: • Cataloguing the cleantech companies and existing public, private, and
quasi-public agencies, initiatives, and programs in a state, city, or region that impact or support the cleantech sector.
• Improving coordination across these organizations and creating
linkages to help organize them around common objectives. • Defining and promoting a state’s cleantech “core
competencies,” and allowing investors to focus on a handful of key industries for targeted cluster development. Given the disparate nature of the ten cleantech industries, no state can be a leader in all of them. But

ENVIRONMENTAL ENTREPRENEURS AND CLEANTECH VENTURE NETWORK LLC
60
by focusing on those areas where a state has a head start, policy makers and executives can accelerate cluster growth.
• Connecting cleantech entrepreneurs, investors, and interested policy-
makers within and across states and municipalities to share ideas and best practices, open new markets for cleantech products, and increase the flow of capital and business interests.
• Identifying links to pressing public policy problems for which clean
technologies are well suited.

Creating Cleantech Clusters: 2006 Update
61
CONCLUSION
Cleantech is an exciting new industry which offers the promise of economic expansion, a healthier environment, and a less resource-intensive future. From humble beginnings, and based on a superior economic premise, the cleantech industry has quickly grown into one of the most dynamic and fast-growing industries in the country. The spectrum of interests investing in cleantech includes some of the nation’s major manufacturers, banks, and private equity investors. Policy-makers too have realized the promise of cleantech – increasingly, we see progressive policy being adopted at the state, municipal, and federal level that can protect the environment, help spur job growth, save society money, and improve the quality of life of the nation’s citizens. For states wishing to foster cleantech clusters, a key challenge is to attract high-quality entrepreneurs and venture capital. Policy can be a key instrument in achieving these goals. By building home-grown demand for cleantech products, helping cleantech companies obtain critical growth funding, and facilitating partnerships between investors, entrepreneurs, and customers, smart public policy can attract private capital, and help plant the seeds that allow cleantech clusters to grow. Based on the broad forces driving the adoption of cleantech products and services, we anticipate a rapid and sustained expansion for this important industry. The nation, its people, and our environment all stand to benefit.

ENVIRONMENTAL ENTREPRENEURS AND CLEANTECH VENTURE NETWORK LLC
62
APPENDICES

Creating Cleantech Clusters: 2006 Update
63
APPENDIX 1: 2005 NORTH AMERICAN CLEANTECH VC INVESTMENT AND COMPANIES BY STATE (States listed had at least one company that reported receiving a VC investment between 2001 and 2005.)
Source: Cleantech Venture Network
State
Unique Cleantech
Companies in State
Millions of VC Dollars
(2005) Deals (2005)
AL 1 $ - 0 AZ 6 $ 18.9 4 CA 124 $ 483.5 57 CO 17 $ 15.4 3 CT 9 $ 25.6 4 DC 3 $ 9.0 1 DE 1 $ 5.5 1 FL 9 $ 43.9 3 GA 9 $ 18.2 6 HI 2 $ 3.5 1 ID 1 $ - 0 IL 22 $ 49.6 9 IN 5 $ 41.1 2 KS 2 $ - 0 KY 1 $ - 0 MA 43 $ 246.8 28 MD 8 $ 56.7 4 ME 3 $ 3.0 1 MI 9 $ 28.1 5 MN 10 $ 18.8 4 MO 6 $ 8.7 2 MS 1 $ 12.0 1 NC 8 $ 16.0 4 NE 3 $ - 0 NH 6 $ 25.1 1 NJ 9 $ 16.5 3 NM 7 $ 48.8 4 NY 20 $ 13.7 9 OH 13 $ 17.3 5 OK 2 $ - 0 OR 3 $ 1.2 2 PA 14 $ 7.9 5 RI 2 $ 0.2 1 SC 1 $ - 0 SD 1 $ - 0 TN 2 $ 7.0 2 TX 27 $ 44.4 8 UT 5 $ - 0 VA 8 $ 24.4 3 VT 1 $ - 0 WA 14 $ 9.6 4 WI 6 $ 25.6 2 WV 2 $ - 0 WY 1 $ 3.1 3 CANADA 116 $ 233.2 53 NORTH AMERICAN TOTAL 563 $ 1,582.1 246

ENVIRONMENTAL ENTREPRENEURS AND CLEANTECH VENTURE NETWORK LLC
64
APPENDIX 2: JOB CREATION SCNENARIO METHODOLOGY In an effort to understand the potential jobs and revenue impact of the cleantech sector on state economies, we used historical data on the venture capital industry to extrapolate future job and revenue creation scenarios. In doing this, we examined: historical venture capital investment flows; the number of jobs now hosted by the venture-backed companies that received that capital; and the recent revenues of those companies. The consequent calculations are demonstrative and wholly unscientific, and should not be viewed as forecasts of the jobs and revenue likely to be created as a result of cleantech venture capital investment. These calculations are presented purely to offer an “order of magnitude” assessment of what economic activity might be spurred by current and future venture capital investments. Furthermore, these calculations rely on a host of assumptions (stated below), which readers should carefully consider as they view the figures presented in this document. For inputs to the analysis, we relied on current industry data and previously published reports related to venture capital investing. The primary report used to calculate the job and revenue creation numbers was the 2004 study “Venture Impact 2004: Venture Capital Benefits to the U.S. Economy” by Global Insight and the National Venture Capital Association (NVCA).64 It found that $338.5 billion of venture capital invested in U.S. companies in the period 1970-2003 led to the creation of 10.1 million jobs by 2003. The report also listed the 2003 jobs and revenues of venture-backed companies in 15 states, including California. A separate NVCA document65 provided the total venture capital invested in California for the period 1970-2003 ($140.1 billion). Using this data, we calculated a rough hypothetical measure of the job and revenue-creating potential of venture capital over the 33-year period covered by the data, subject to the assumptions listed below. For the U.S. as a whole, every $33,500 of venture capital invested in U.S. companies between 1970 and 2003 correlated to one job in service in 2003 at venture backed companies. Every dollar of venture capital invested between 1970 and 2003 correlated to $5.30 of annual revenue in 2003 for venture-backed companies. For California, every $56,700 of VC money invested in U.S. companies between 1970 and 2003 correlated to one job in service in 2003 at venture backed companies. Every dollar of venture capital invested in California between 1970 and 2003 correlated to $3.12 of annual revenue in 2003 for venture-backed companies. By using these numbers, adjusting for inflation where possible, and making assumptions about the amount of venture capital that could be invested in California companies between now and 2010, we modeled two job and revenue creation scenarios for the California cleantech industry,

Creating Cleantech Clusters: 2006 Update
65
which are outlined in Chapter 2. A more detailed explanation of the methodology used here is provided in the 2004 E2 report.66 Though the scenarios in the 2004 report differ from those presented in this report, the methodology is the same. For the abstract figures presented in this report (that every $100 million of venture capital invested could eventually spur 2,700 jobs in venture-backed companies and $500 million of annual revenue), simple division and rounding was used (a highly imperfect measure, for reasons outlined below). Key Assumptions Following are the key assumptions used in making these calculations. Neither the authors, NRDC, E2, nor Cleantech Venture Network guarantee the accuracy of these assumptions, and readers should make their own assessment about their validity as they consider the scenarios. We assume: • Causation: The venture capital invested historically was at least in part
responsible for the jobs and revenue created by the companies that received that capital.
• Temporal extrapolation: Past job and revenue creation can reasonably be extrapolated to model future job and revenue creation scenarios.
• Extrapolation across segments: Future cleantech job and revenue creation is likely to reflect, on average, the job and revenue creation of all venture capital invested across multiple industries between 1970 and 2003.
Considerations A number of factors should be considered in assessing these calculations: • It was almost certainly not the intention of Global Insight or the National
Venture Capital Association that their data be used in this fashion. They had no part in these calculations, and in no way endorse them.
• Because we lacked data on the exact amount of venture capital invested in each year between 1970 and 2003, we were unable to correct for past inflation in comparing historical venture capital investment with current and future job and revenue creation. This is a key weakness in this analysis. The effect of inflation was considered in modeling future investment, job creation, and revenue creation.
• The bulk (at least 90%) of the $338 billion in venture capital invested between 1970 and 2003 was invested between 1996 and 2003. This

ENVIRONMENTAL ENTREPRENEURS AND CLEANTECH VENTURE NETWORK LLC
66
should logically mitigate somewhat the effects of past inflation. (More than $210 billion was invested just in the period 1999-2001.)
• Because so much of the venture capital between 1970-2003 was invested in the final eight years covered, we made a broad assumption that the bulk of jobs and revenue currently in evidence at venture-backed companies were spurred by venture capital investments made in the last twenty years. Therefore, in looking forward, we assumed that the effect on jobs and revenue of any venture capital invested now would be realized over the next twenty years, rather than the 33 years covered by the historical data.
• Jobs and revenue in evidence in venture-backed companies in 2003 may have disappeared in the years between 2003 and this writing. New jobs and revenue at venture-backed companies have also been created in that time.

Creating Cleantech Clusters: 2006 Update
67
ENDNOTES
1 Cleantech Venture Network; PriceWaterhouseCoopers National Venture Capital Association Moneytree Report (CVN; Moneytree) 2 As of April 24, 2006. American Stock Exchange (www.amex.com) Cleantech Index ticker = CTIUS 3 Martinot, E. “Renewables 2005: Global Status Report.” Renewable Energy Policy Network for the 21st Century (REN21). (2005) 4 Eckhart, M. “State of Renewable Energy 2006.” (Presentation) American Council on Renewable Energy. (January 17, 2006) 5 United Nations Department of Economic and Social Affairs, Population Division, “World Urbanization Prospects, The 2003 Revision”. http://www.un.org/esa/population. (2004). 6 Ibid Martinot 7 Ibid Martinot 8 Ibid Eckhart 9 Ibid Martinot 10 Cleantech Venture Network 11 Carey, J., Aston, A., et al. “ Alternate Power: A Change Is In The Wind.” Business Week. (July 4, 2005) 12 Deutsch, C. “GE Renewables Unit Gets a Favorable Wind.” New York Times. (February 15, 2006)
13 Ibid Deutsch 14 “Wells Fargo Invests $5 Million in Renewable Energy Fund.” Renewable Energy Access. (April 7, 2006) http://www.renewableenergyaccess.com/rea/news/story?id=44563 15 Ibid Deutsch 16 Ibid CVN; Moneytree 17 Ibid CVN; Moneytree 18 Parker, N. and O’Rourke, A. “The Cleantech Venture Capital Report – 2006.” Cleantech Venture Network LLC. (2006)

ENVIRONMENTAL ENTREPRENEURS AND CLEANTECH VENTURE NETWORK LLC
68
19 Ibid Parker and O’Rourke 20 Ibid Eckhart 21 “Venture-backed Companies Outperformed Peers in 10 Industries During U.S. Economic Downturn, New Study Shows.” (Press Release). National Venture Capital Association. (July 20, 2004.)
22 “Venture Impact 2004: Venture Capital Benefits to the U.S. Economy,” Global Insight, National Venture Capital Association (Global Insight) (2004)
23 "The Economic Impact of the Venture Capital Industry on the U.S. Economy."
National Venture Capital Association NVCA, DRI-WEFA, A Global Insight Company. (2002)
24 Roman, A., and van Pottlesberghe de la Potterie, B. “The Economic Impact of
Venture Capital.” (September 2003) 25 “The Economic Impact of Private Equity in the UK 2003” - British Venture Capital
Association (2003) 26 ibid Global Insight 27 Kammen, D., Kapadia, K., & Fripp, M. “Putting Renewables to Work: How Many
Jobs Can the Clean Energy Industry Generate?” Energy and Resources Group/Goldman School of Public Policy at University of California, Berkeley. (2004)
28 Sterzinger, G., and Svrcek, M. “Wind Turbine Development: Location of Manufacturing Activity.” Renewable Energy Policy Project (REPP). (September 2004) 29 Burtis, P., Epstein, R., Hwang, R. “Creating the California Cleantech Cluster.” Natural Resources Defense Council/E2. (2004) 30 Ibid Global Insight 31 Ibid Global Insight; Authors’ analysis
32 PriceWaterhouseCoopers National Venture Capital Association MoneyTree 33 DRI-WEFA and Venture Economics 34 Cleantech Venture Network 35 Porter, M. “Clusters and the New Economics of Competition.” Harvard Business
Review. (November-December 1998) 36 Cleantech Venture Network

Creating Cleantech Clusters: 2006 Update
69
37 Ibid Burtis et al 38 Ibid Parker and O’Rourke 39 Ibid Burtis et al 40 “Energy Commission Renewable Energy Program Summary of Activities October 1, 2005 – December 31, 2005.” California Energy Commission. (CEC) http://www.energy.ca.gov/renewables/quarterly_updates/index.html 41 Ibid CEC 42 “PUC Creates Groundbreaking Solar Energy Program.” (Press Release) California Public Utilities Commission. Docket #: R.04-03-017. 43 “The California Solar Initiative: A monumental step to a million solar roofs.” (Press Release) (March 7, 2006) www.EnvironmentCalifornia.org 44 “The Carl Moyer Program Guidelines: Approved Revision 2005.” California Environmental Protection Agency Air Resources Board. (ARB) (2006) http://www.arb.ca.gov/msprog/moyer/moyer.htm 45 “Public Meeting Regarding Funding for Cleaner, Safer School Buses.” (Presentation) California Environmental Protection Agency Air Resources Board. (2005) http://www.arb.ca.gov/msprog/schoolbus/2005/oct14pres.pdf 46 “New York’s Alternative Fuels. State Emerging as Leader in Drive for Clean Air.” Inform: Strategies for a Better Environment. (Inform) (2006) http://www.informinc.org/news_altfuels.php 47 Ibid Inform 48 US Department of Energy: Energy Efficiency and Renewable Energy (New Mexico). http://www.eere.energy.gov/afdc/progs/search_state.cgi?afdc/NM 49 “Environmentally Preferable Purchasing (EPP).” Minnesota Office of Environmental Assistance. (2006) http://www.moea.state.mn.us/lc/purchasing/index.cfm
50 Wiser, R. “The Renewables Portfolio Standard in Texas: An Early Assessment.”
Lawrence Berkeley National Laboratory (Nov. 2001)
51 American Council for an Energy-Efficient Economy. http://www.aceee.org/briefs/mktabl.htm 52 “Green Building Program.” Seattle Department of Planning and Development. (Seattle DPD) http://www.seattle.gov/dpd/Sustainable_Building/index.asp 53 Ibid Seattle DPD 54 “The Impacts of the Air Pollution Control Industry on the California Economy.” Environmental Business International, Inc. (December 2003)

ENVIRONMENTAL ENTREPRENEURS AND CLEANTECH VENTURE NETWORK LLC
70
55 “Public Review Model Rule Draft 3/23/06.” Regional Greenhouse Gas Initiative. www.rggi.org (2006) 56 “RGGI States Announce Release of Draft Model Rule for Regional Carbon Cap.” New York State Department of Environmental Conservation. (2006) http://www.dec.state.ny.us/website/environmentdec/2006a/rggi032306.html 57 “Regional Greenhouse Gas Initiative – Overview.” http://www.rggi.org/docs/mou_rggi_overview_12_20_05.pdf 58 Brome, H. “Economic Impact of RGGI.” (Memorandum) Federal Reserve Bank of Boston. (March 3, 2006) 59 Chertow, M. Bridging the Gap: Commercializing Environmental Technology in the United States. MIT Press. (2003) 60 Ibid Chertow 61 “Annual Report 2005.” Connecticut Clean Energy Fund. (2005)
62 “Connecticut Clean Energy Fund Strategic Framework and 2003 Annual Report.” (2003) http://www.ctcleanenergy.com/
63 Sustainable Development Technology Canada. (2006) http://www.sdtc.ca/en/about/index.htm 64 Ibid Global Insight 65 “Venture-Backed Companies Outperformed Peers in 10 Industries During U.S. Economic Downturn, New Study Shows.” (Press Release) National Venture Capital Association. (July 20, 2004) 66 Ibid Burtis et al