creating dashboards for microsoft project server 2010 · pdf file2. creating reports 3....
TRANSCRIPT

Creating Dashboards
for Microsoft Project
Server 2010
Authors: Blaise Novakovic, Jean-Francois LeSaux, Steven Haden, Microsoft Consulting Services
2
Information in the document, including URL and other Internet Web site references is subject to change
without notice. Except as expressly provided in any written license agreement from Microsoft, the
furnishing of this document does not give you a license to any patent, trademarks, copyrights, or other
intellectual property that are the subject matter of this document.
© 2011 Microsoft Corporation.
Creating Dashboards for Microsoft Project Server 2010 | 3
Table of Contents
1. Introduction .......................................................................................................................................... 5
Installation Prerequisites .......................................................................................................................... 5
Document Structure ................................................................................................................................. 6
2. Understanding Report Types ................................................................................................................ 6
Excel Services Reports ............................................................................................................................... 6
PerformancePoint Analytic Charts and Grids ........................................................................................... 8
SQL Server Reporting Services Reports ..................................................................................................... 9
3. Creating Reports ................................................................................................................................. 10
Excel Services Reports ............................................................................................................................. 10
KPI Department per % ......................................................................................................................... 11
Project Cost per Department .............................................................................................................. 22
Resource Availability by Role .............................................................................................................. 24
Timesheet Reconciliation List ............................................................................................................. 28
PerformancePoint Reports ..................................................................................................................... 33
Data Connections ................................................................................................................................ 33
Analytical Charts ................................................................................................................................. 37
SQL Server Reporting Services Reports ................................................................................................... 52
Document Library ............................................................................................................................... 52
SQL Server Reporting Services Reports ............................................................................................... 54
4. Creating Dashboards by using PerformancePoint Services ................................................................ 60
PerformancePoint Reports ..................................................................................................................... 62
Filters ................................................................................................................................................... 62
Excel Services Reports ......................................................................................................................... 66
4
SQL Server Reporting Services Reports ............................................................................................... 69
Creating Dashboards with PerformancePoint Services .......................................................................... 73
Page 1 - KPIs ........................................................................................................................................ 78
Page 2 – Summary Dashboard ............................................................................................................ 82
Page 3 – Project Status ....................................................................................................................... 84
Page 4 – Timesheet Dashboard .......................................................................................................... 87
5. Creating a Dashboard by using a Web Parts Page .............................................................................. 91
Creating a Dashboard by using a Web Parts Page .................................................................................. 92
Creating an Excel Services Web Part within a Web Parts page .............................................................. 93
Creating a SQL Server Reporting Services Web Part within a Web Parts Page ...................................... 99
6. Conclusion ......................................................................................................................................... 102
7. Appendix A – Enterprise Custom Fields ............................................................................................ 104
Project ................................................................................................................................................... 104
Resource ............................................................................................................................................... 104
8. Appendix B – IPMO Stored Procedures ............................................................................................ 106
IPMO_DepartmentalKPIvalues Stored Procedure ................................................................................ 106
IPMO_OrganisationalKPIvalues Stored Procedure ............................................................................... 110
9. References ........................................................................................................................................ 112
10. List of Figures ................................................................................................................................ 115
11. List of Tables ................................................................................................................................. 115
Creating Dashboards for Microsoft Project Server 2010 | 5
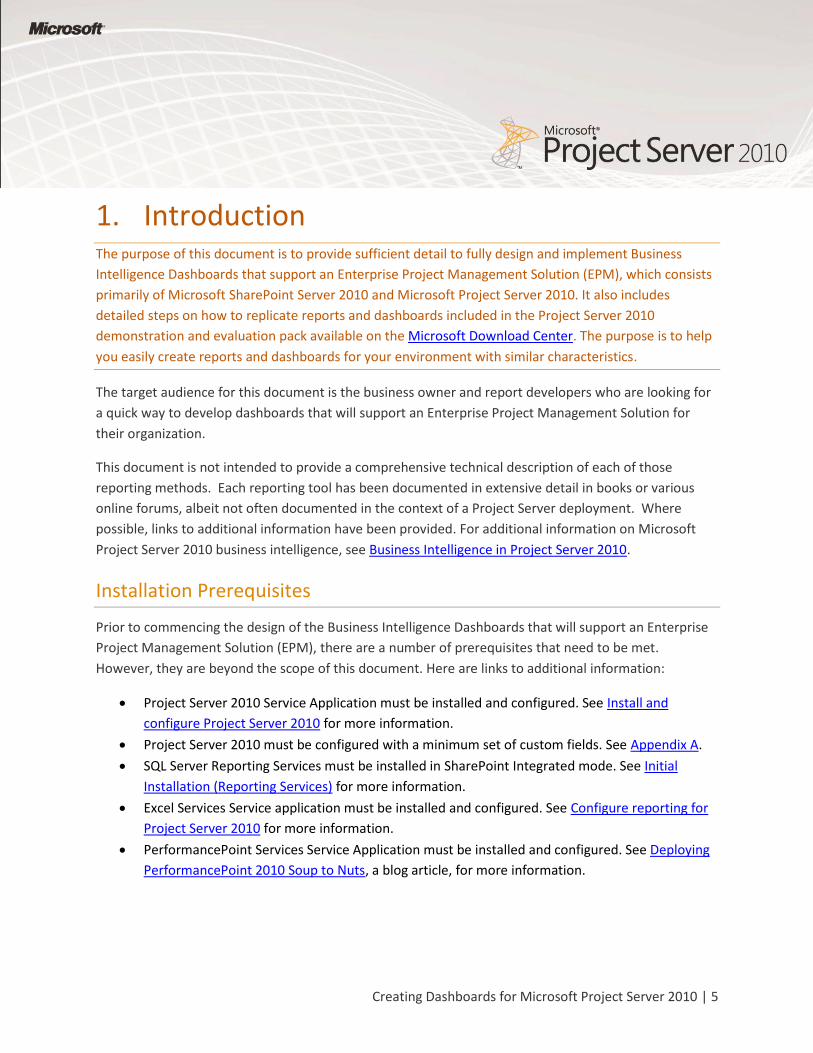
1. Introduction The purpose of this document is to provide sufficient detail to fully design and implement Business
Intelligence Dashboards that support an Enterprise Project Management Solution (EPM), which consists
primarily of Microsoft SharePoint Server 2010 and Microsoft Project Server 2010. It also includes
detailed steps on how to replicate reports and dashboards included in the Project Server 2010
demonstration and evaluation pack available on the Microsoft Download Center. The purpose is to help
you easily create reports and dashboards for your environment with similar characteristics.
The target audience for this document is the business owner and report developers who are looking for
a quick way to develop dashboards that will support an Enterprise Project Management Solution for
their organization.
This document is not intended to provide a comprehensive technical description of each of those
reporting methods. Each reporting tool has been documented in extensive detail in books or various
online forums, albeit not often documented in the context of a Project Server deployment. Where
possible, links to additional information have been provided. For additional information on Microsoft
Project Server 2010 business intelligence, see Business Intelligence in Project Server 2010.
Installation Prerequisites
Prior to commencing the design of the Business Intelligence Dashboards that will support an Enterprise
Project Management Solution (EPM), there are a number of prerequisites that need to be met.
However, they are beyond the scope of this document. Here are links to additional information:
Project Server 2010 Service Application must be installed and configured. See Install and
configure Project Server 2010 for more information.
Project Server 2010 must be configured with a minimum set of custom fields. See Appendix A.
SQL Server Reporting Services must be installed in SharePoint Integrated mode. See Initial
Installation (Reporting Services) for more information.
Excel Services Service application must be installed and configured. See Configure reporting for
Project Server 2010 for more information.
PerformancePoint Services Service Application must be installed and configured. See Deploying
PerformancePoint 2010 Soup to Nuts, a blog article, for more information.
6 | Understanding Report Types
Document Structure
This document is structured with the following major sections:
1. Understanding Report Types
2. Creating Reports
3. Creating Dashboards by using PerformancePoint Services
4. Creating a Dashboard by using Web Parts page
2. Understanding Report Types SharePoint Server 2010 and Project Server 2010 enables dashboard authors and users to easily view and
use a variety of report types, including analytic charts and grids, Excel Services reports, SQL Server
Reporting Services reports, and many others.
This section provides an overview of the different kinds of reports that you might use in your EPM
dashboard:
Excel Services reports
PerformancePoint analytic charts and grids
SQL Server Reporting Services reports
The following report types can also be implemented part of an overall Business Intelligence strategy.
However, they are beyond the scope of this document:
Visio Services
PowerPivot
PerformancePoint Scorecard
PerformancePoint Strategy Map
PerformancePoint KPI Details Reports
Excel Services Reports
Excel Services reports are used to display Microsoft Excel spreadsheets or items that are in an Excel
workbook, such as PivotTable reports, PivotChart reports, or a section in a worksheet. An Excel Services
report might resemble the following image:

Creating Dashboards for Microsoft Project Server 2010 | 7
Figure 1: Excel Services Report Example
Excel Services reports can use data that is stored in Analysis Services, a SharePoint list, a table in SQL
Server, an Excel workbook, or in Excel Services in Microsoft SharePoint Server 2010. Project Server 2010
includes ten default Excel Services reports for enterprise project management (EPM) reports:
Simple Project List
Milestones Due This Month
Resource Capacity
Issues and Risks
Deliverables
Timesheet Actuals
Rejected Projects
Top Projects
Workflow Chart
Workflow Drilldown
In addition, Project Server 2010 includes fourteen default Excel Services templates for enterprise project
management (EPM) reports generated out of Analysis Services.
Assignment Non Timephased
Assignment Timephased
Deliverables
EPM Timesheet
Issues
MSP_Portfolio_Analyzer
8 | Understanding Report Types
MSP_Project_SharePoint
MSP_Project_Timesheet
Project Non Timephased
Resource Non Timephased
Resource Timephased
Risks
Task Non Timephased
Timesheet
Similar to analytic charts and grids, Excel Services reports are typically highly interactive. Users can click
to see lower levels of detail. Users can export these reports to Microsoft PowerPoint or Excel and apply
filters to them.
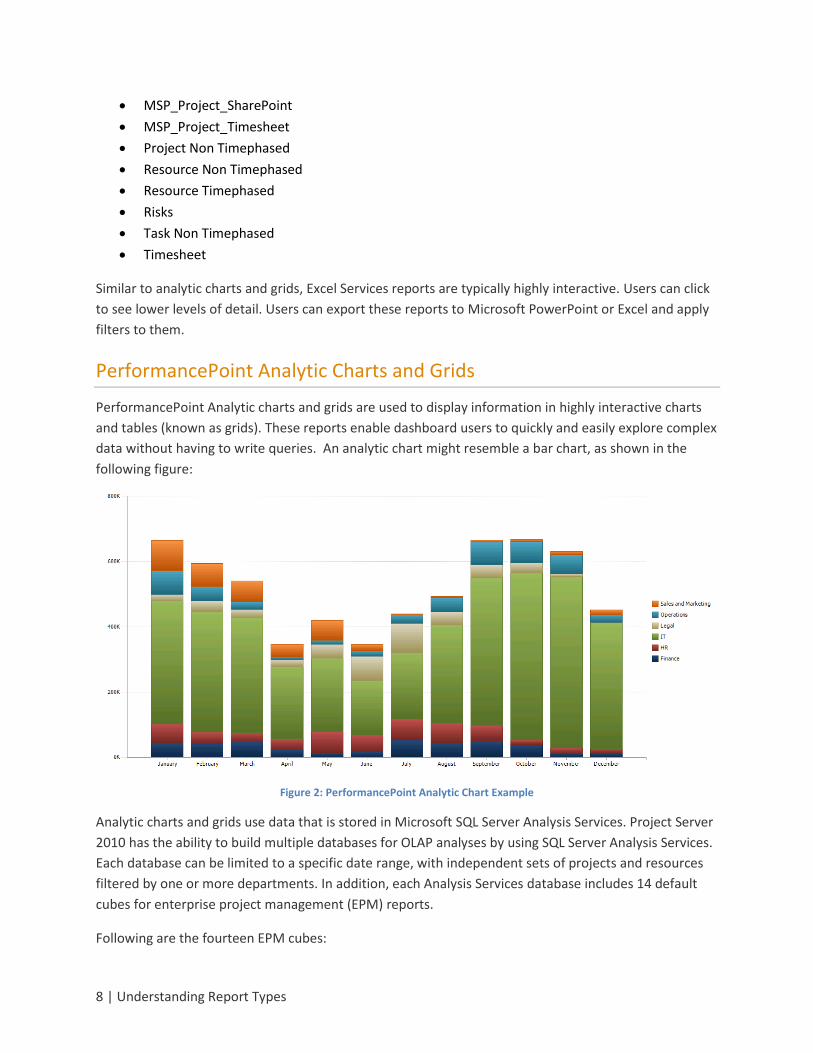
PerformancePoint Analytic Charts and Grids
PerformancePoint Analytic charts and grids are used to display information in highly interactive charts
and tables (known as grids). These reports enable dashboard users to quickly and easily explore complex
data without having to write queries. An analytic chart might resemble a bar chart, as shown in the
following figure:
Figure 2: PerformancePoint Analytic Chart Example
Analytic charts and grids use data that is stored in Microsoft SQL Server Analysis Services. Project Server
2010 has the ability to build multiple databases for OLAP analyses by using SQL Server Analysis Services.
Each database can be limited to a specific date range, with independent sets of projects and resources
filtered by one or more departments. In addition, each Analysis Services database includes 14 default
cubes for enterprise project management (EPM) reports.
Following are the fourteen EPM cubes:
Creating Dashboards for Microsoft Project Server 2010 | 9
Assignment Non Timephased
Assignment Timephased
Deliverables
EPM Timesheet
Issues
MSP_Portfolio_Analyzer
MSP_Project_SharePoint
MSP_Project_Timesheet
Project Non Timephased
Resource Non Timephased
Resource Timephased
Risks
Task Non Timephased
Timesheet
Users can add calculated measures to any of the cubes by using an MDX expression. For example, users
can add a resource availability calculated measure to the Virtual Portfolio Analyzer cube.
These reports are highly interactive. Using a mouse, EPM Business Users can typically do all of the
following in analytic charts and grids:
Drill down or up to see lower or higher levels of detail.
Sort items in ascending or descending order.
Filter out empty rows or columns, isolate an item, or remove an item from the report view.
Apply top or bottom members in a group.
Apply value filters, such as items greater than or less than an amount that you specify.
Pivot a grid, or change a grid to an analytic chart.
Use Additional Actions, which are defined in the Analysis Services cube.
Show or hide information that is included in the chart or grid.
Work with pages of grid data (useful when a query returns a large set of results).
Launch a Decomposition Tree to view more information about a particular report value.
SQL Server Reporting Services Reports
SQL Server Reporting Services reports are reports that have been published to Reporting Services.
Reporting Services reports can resemble tables or charts, and they can include their own filters, which
are sometimes called parameters.
10 | Creating Reports
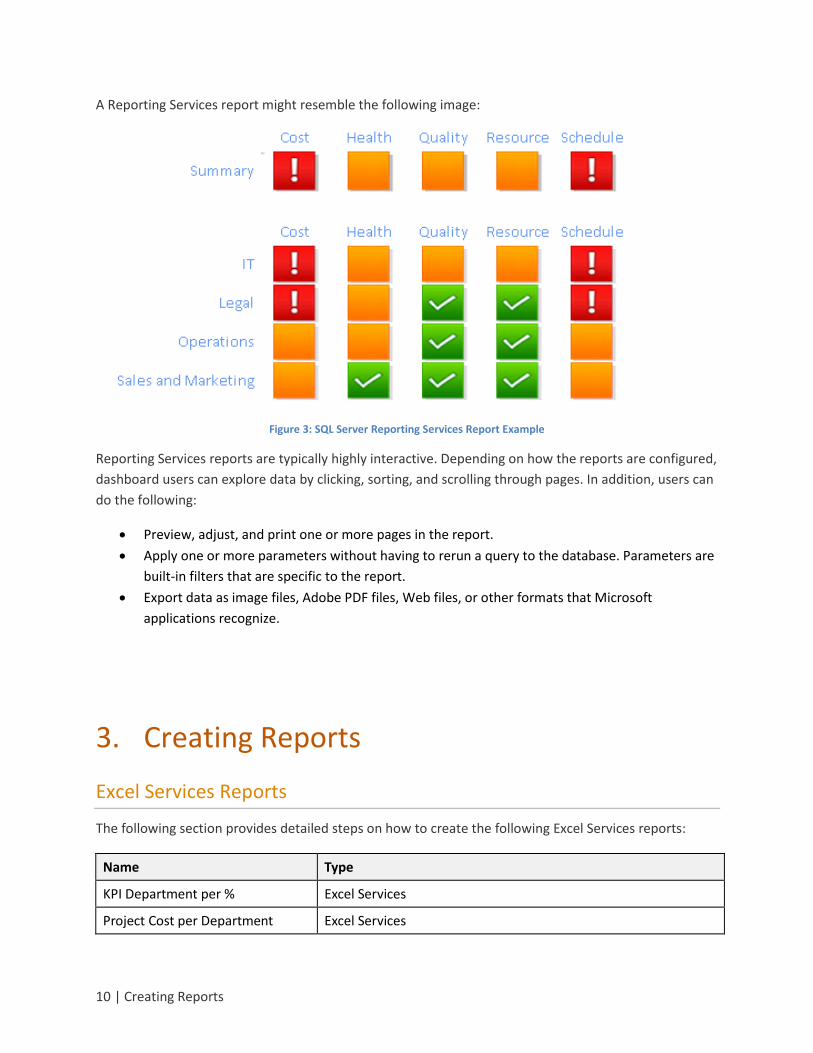
A Reporting Services report might resemble the following image:
Figure 3: SQL Server Reporting Services Report Example
Reporting Services reports are typically highly interactive. Depending on how the reports are configured,
dashboard users can explore data by clicking, sorting, and scrolling through pages. In addition, users can
do the following:
Preview, adjust, and print one or more pages in the report.
Apply one or more parameters without having to rerun a query to the database. Parameters are
built-in filters that are specific to the report.
Export data as image files, Adobe PDF files, Web files, or other formats that Microsoft
applications recognize.
3. Creating Reports
Excel Services Reports
The following section provides detailed steps on how to create the following Excel Services reports:
Name Type
KPI Department per % Excel Services
Project Cost per Department Excel Services
Creating Dashboards for Microsoft Project Server 2010 | 11
Resource Availability by Role Excel Services
Timesheet Reconciliation List Excel Services
Table 1: List of Excel Services Reports
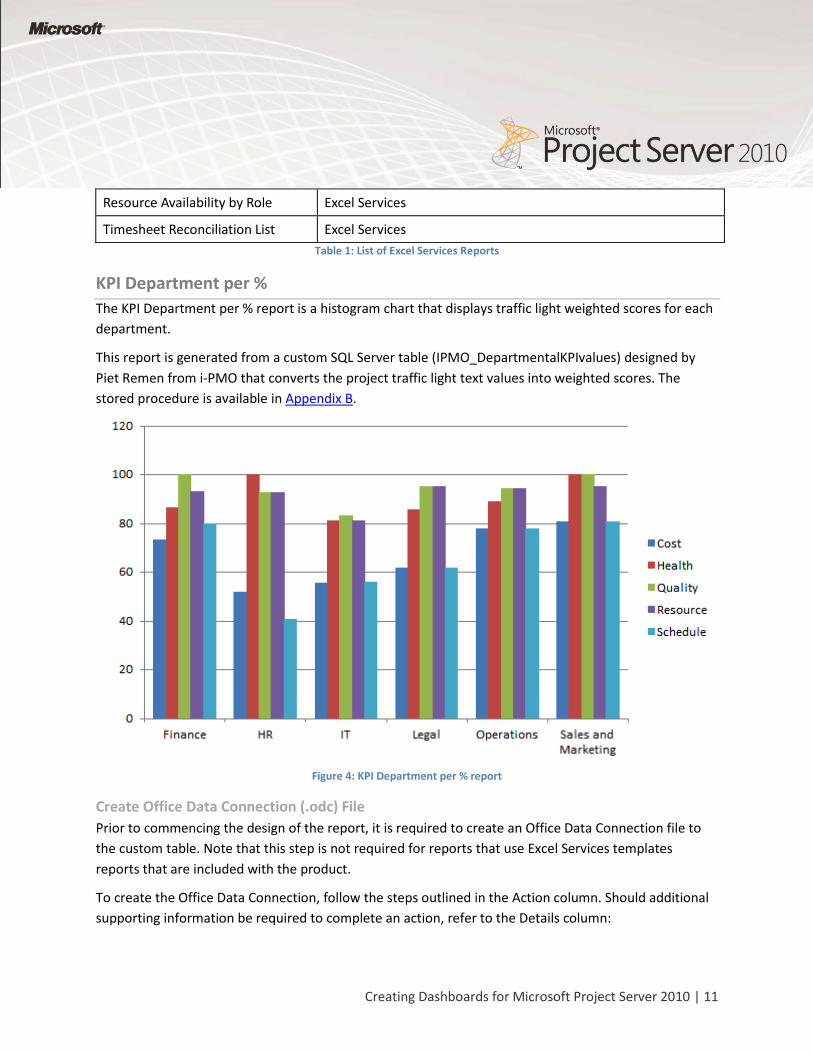
KPI Department per %
The KPI Department per % report is a histogram chart that displays traffic light weighted scores for each
department.
This report is generated from a custom SQL Server table (IPMO_DepartmentalKPIvalues) designed by
Piet Remen from i-PMO that converts the project traffic light text values into weighted scores. The
stored procedure is available in Appendix B.
Figure 4: KPI Department per % report
Create Office Data Connection (.odc) File
Prior to commencing the design of the report, it is required to create an Office Data Connection file to
the custom table. Note that this step is not required for reports that use Excel Services templates
reports that are included with the product.
To create the Office Data Connection, follow the steps outlined in the Action column. Should additional
supporting information be required to complete an action, refer to the Details column:
12 | Creating Reports
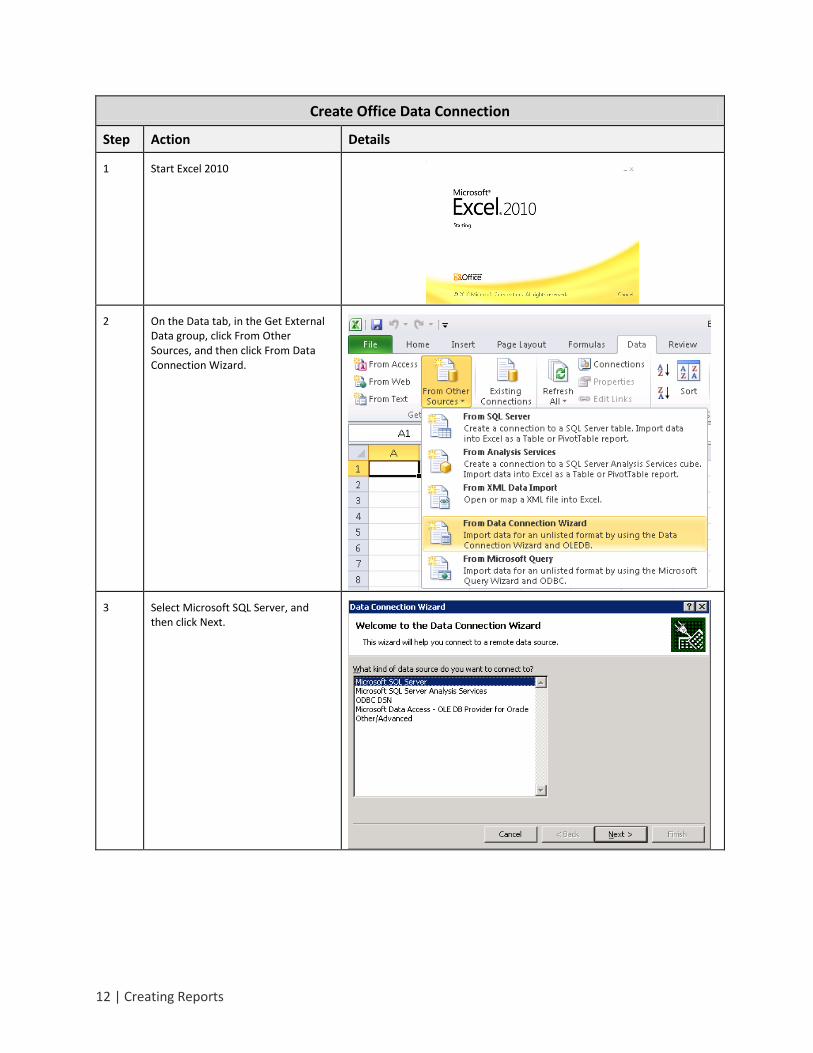
Create Office Data Connection
Step Action Details
1 Start Excel 2010
2 On the Data tab, in the Get External Data group, click From Other Sources, and then click From Data Connection Wizard.
3 Select Microsoft SQL Server, and then click Next.
Creating Dashboards for Microsoft Project Server 2010 | 13
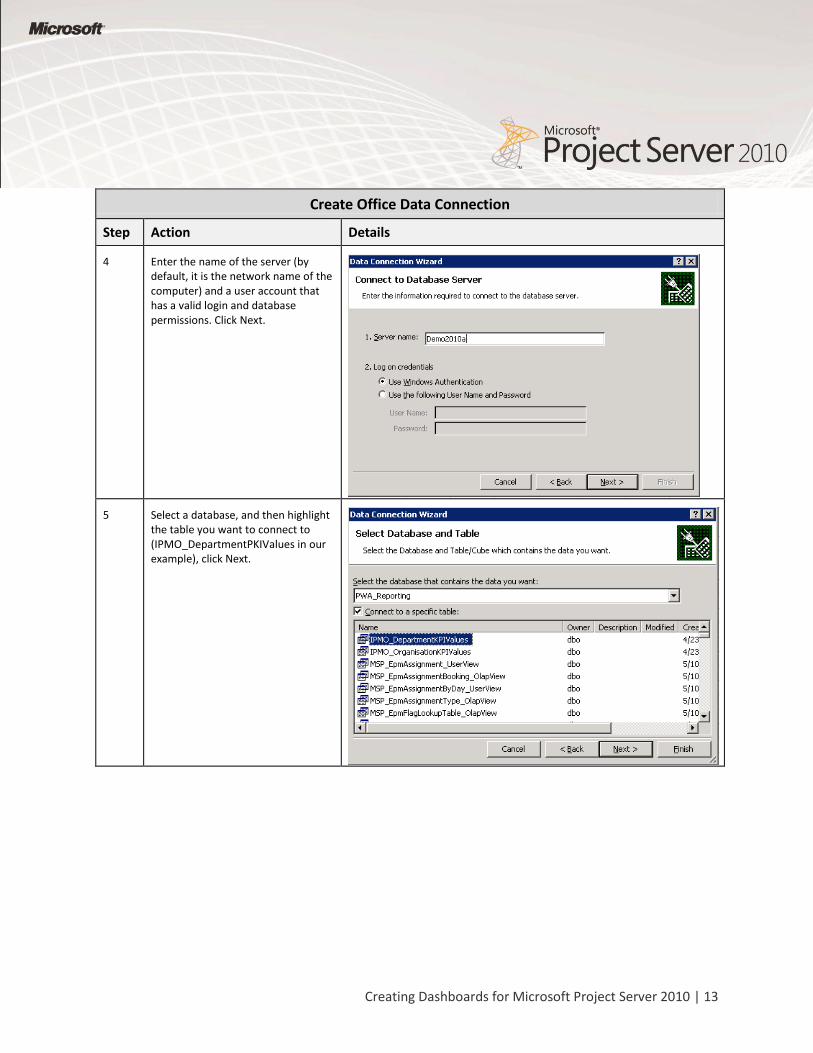
Create Office Data Connection
Step Action Details
4 Enter the name of the server (by default, it is the network name of the computer) and a user account that has a valid login and database permissions. Click Next.
5 Select a database, and then highlight the table you want to connect to (IPMO_DepartmentPKIValues in our example), click Next.
14 | Creating Reports
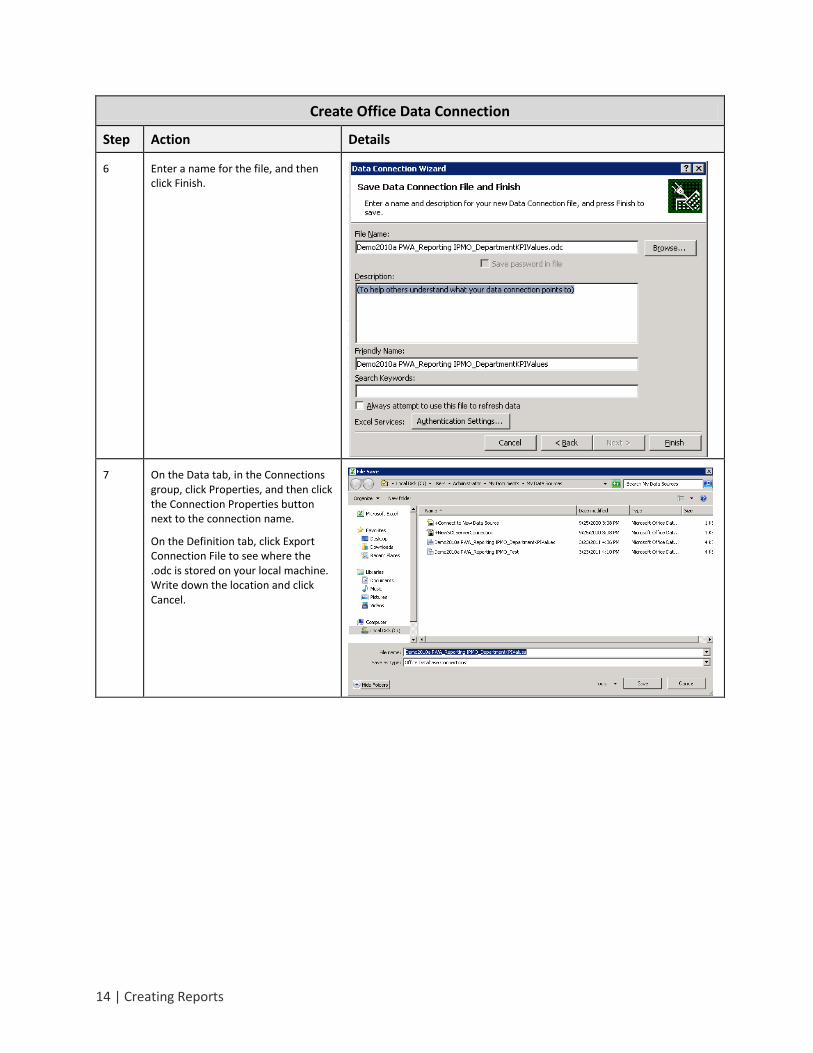
Create Office Data Connection
Step Action Details
6 Enter a name for the file, and then click Finish.
7 On the Data tab, in the Connections group, click Properties, and then click the Connection Properties button next to the connection name.
On the Definition tab, click Export Connection File to see where the .odc is stored on your local machine. Write down the location and click Cancel.
Creating Dashboards for Microsoft Project Server 2010 | 15
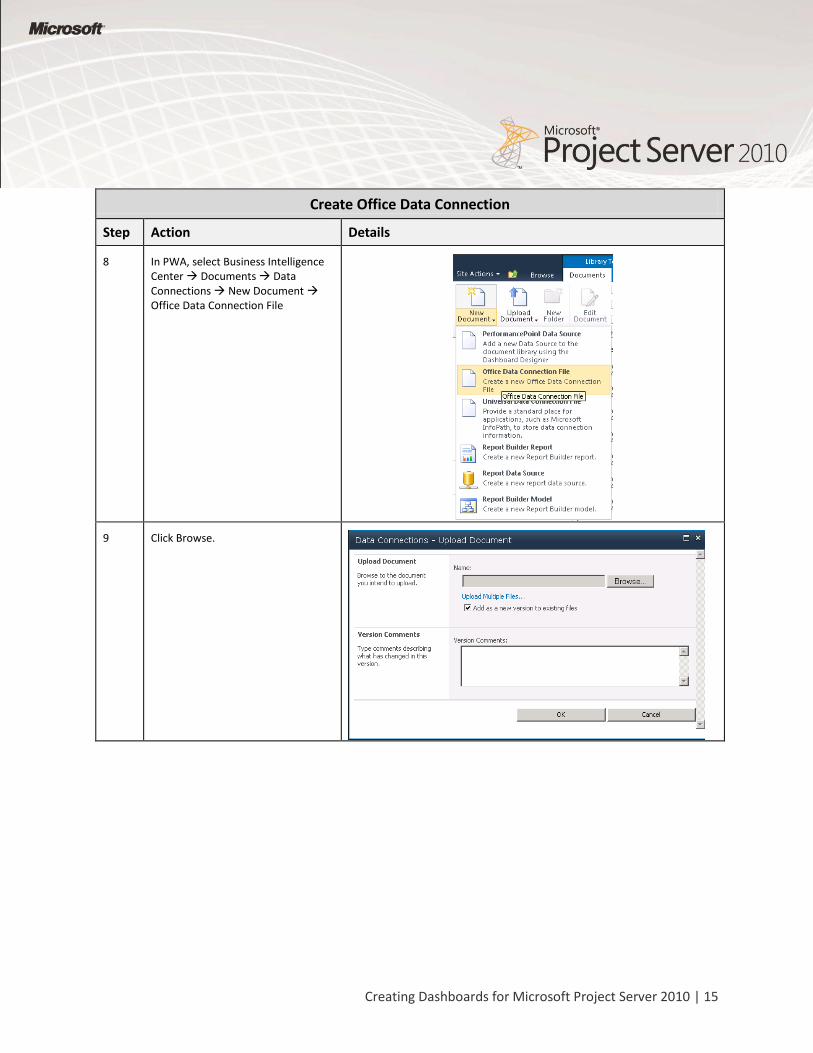
Create Office Data Connection
Step Action Details
8 In PWA, select Business Intelligence Center Documents Data Connections New Document Office Data Connection File
9 Click Browse.
16 | Creating Reports
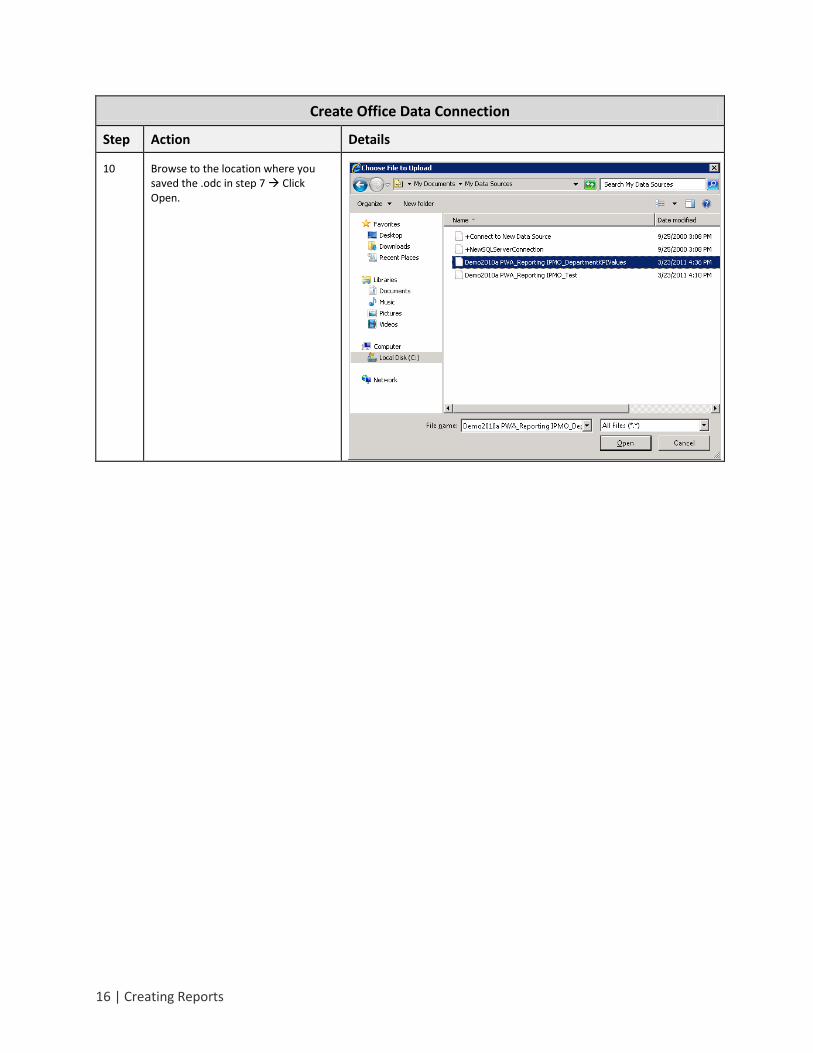
Create Office Data Connection
Step Action Details
10 Browse to the location where you saved the .odc in step 7 Click Open.
Creating Dashboards for Microsoft Project Server 2010 | 17
Create Excel Services Report
To create the report, follow the steps outlined in the Action column. Should additional supporting
information be required to complete an action, refer to the Details column:
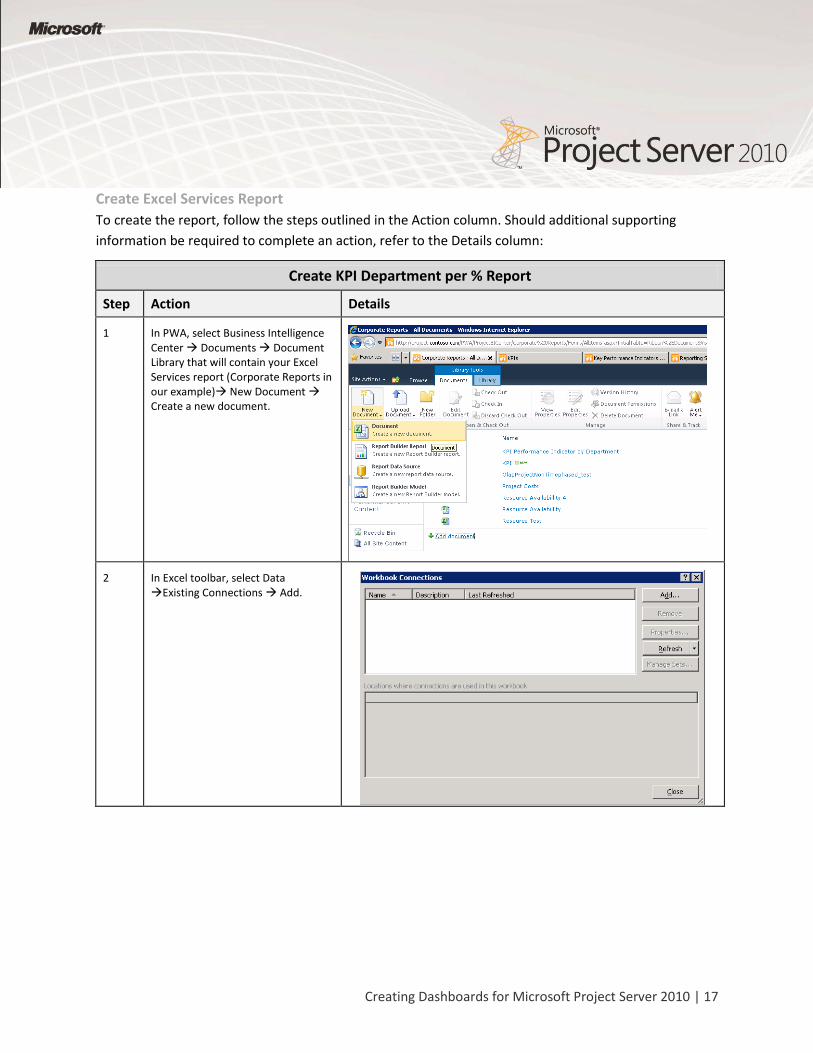
Create KPI Department per % Report
Step Action Details
1 In PWA, select Business Intelligence Center Documents Document Library that will contain your Excel Services report (Corporate Reports in our example) New Document Create a new document.
2 In Excel toolbar, select Data Existing Connections Add.
18 | Creating Reports
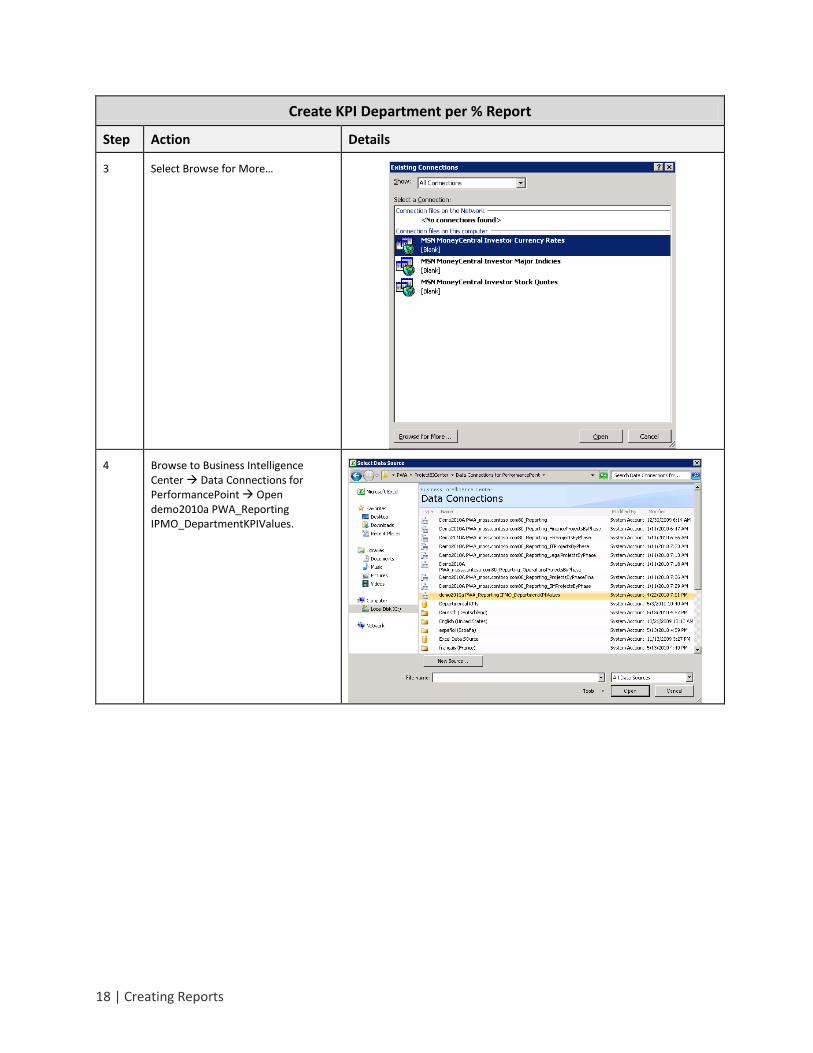
Create KPI Department per % Report
Step Action Details
3 Select Browse for More…
4 Browse to Business Intelligence Center Data Connections for PerformancePoint Open demo2010a PWA_Reporting IPMO_DepartmentKPIValues.
Creating Dashboards for Microsoft Project Server 2010 | 19
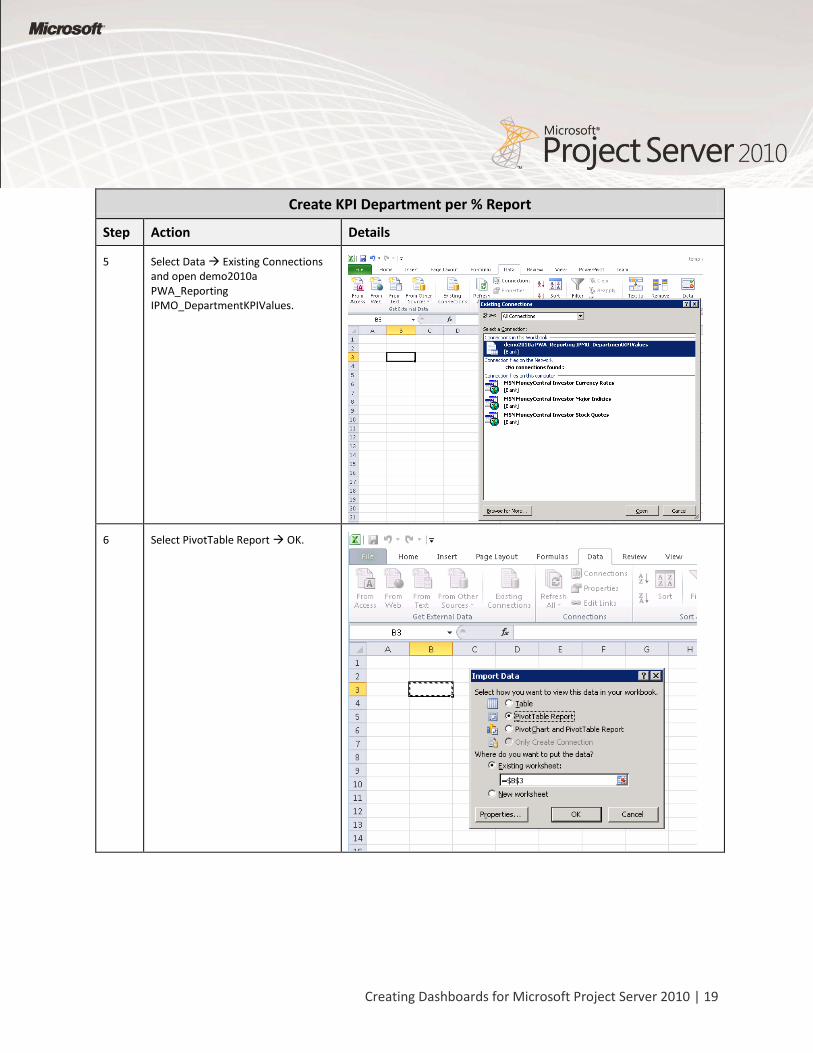
Create KPI Department per % Report
Step Action Details
5 Select Data Existing Connections and open demo2010a PWA_Reporting IPMO_DepartmentKPIValues.
6 Select PivotTable Report OK.
20 | Creating Reports
Create KPI Department per % Report
Step Action Details
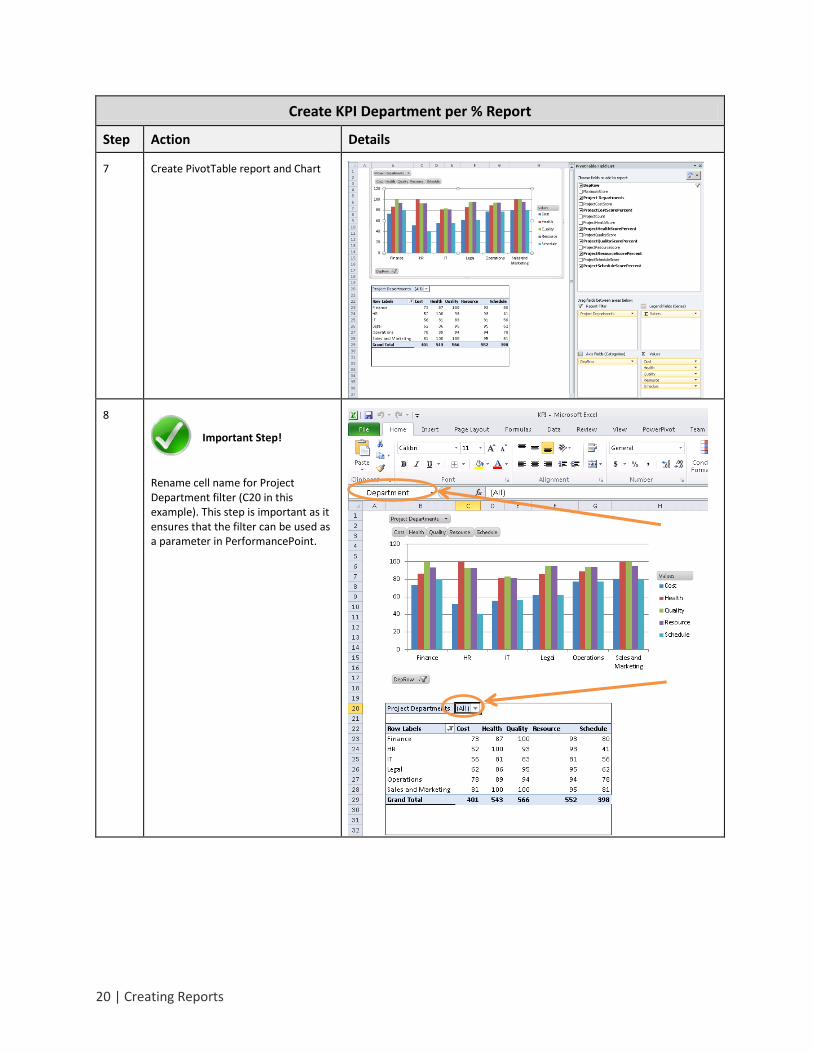
7 Create PivotTable report and Chart
8
Important Step!
Rename cell name for Project Department filter (C20 in this example). This step is important as it ensures that the filter can be used as a parameter in PerformancePoint.
Creating Dashboards for Microsoft Project Server 2010 | 21
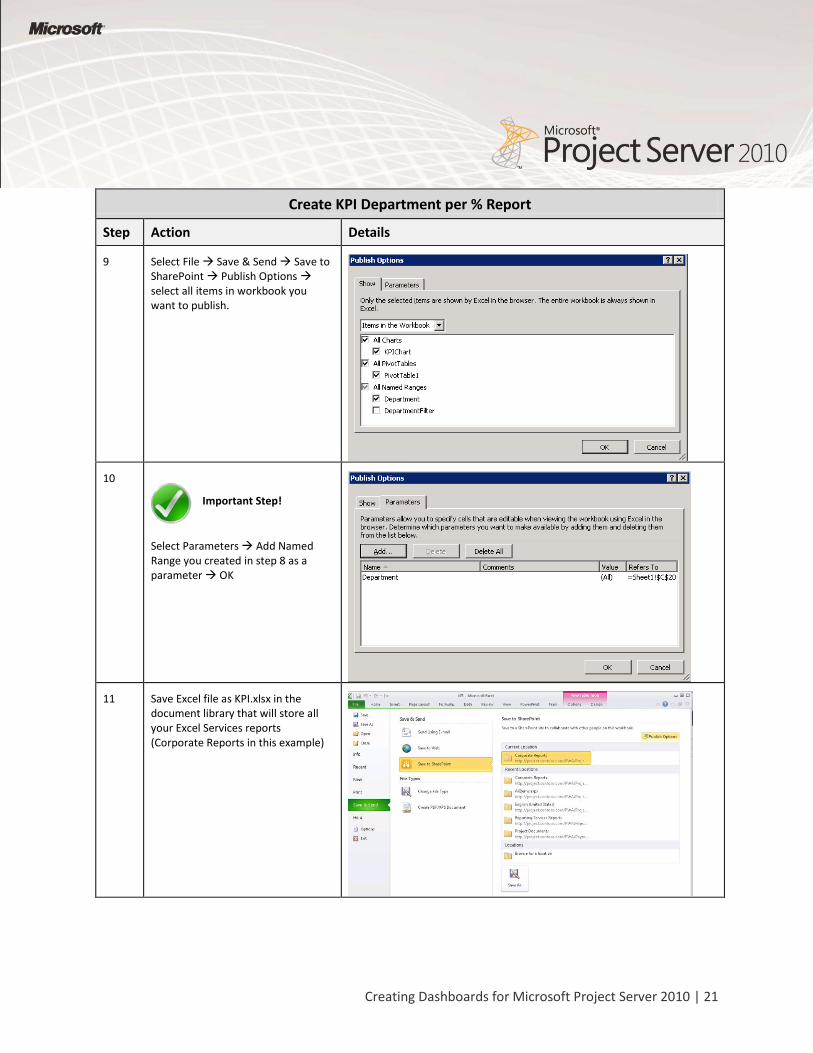
Create KPI Department per % Report
Step Action Details
9 Select File Save & Send Save to SharePoint Publish Options select all items in workbook you want to publish.
10
Important Step!
Select Parameters Add Named Range you created in step 8 as a parameter OK
11 Save Excel file as KPI.xlsx in the document library that will store all your Excel Services reports (Corporate Reports in this example)
22 | Creating Reports
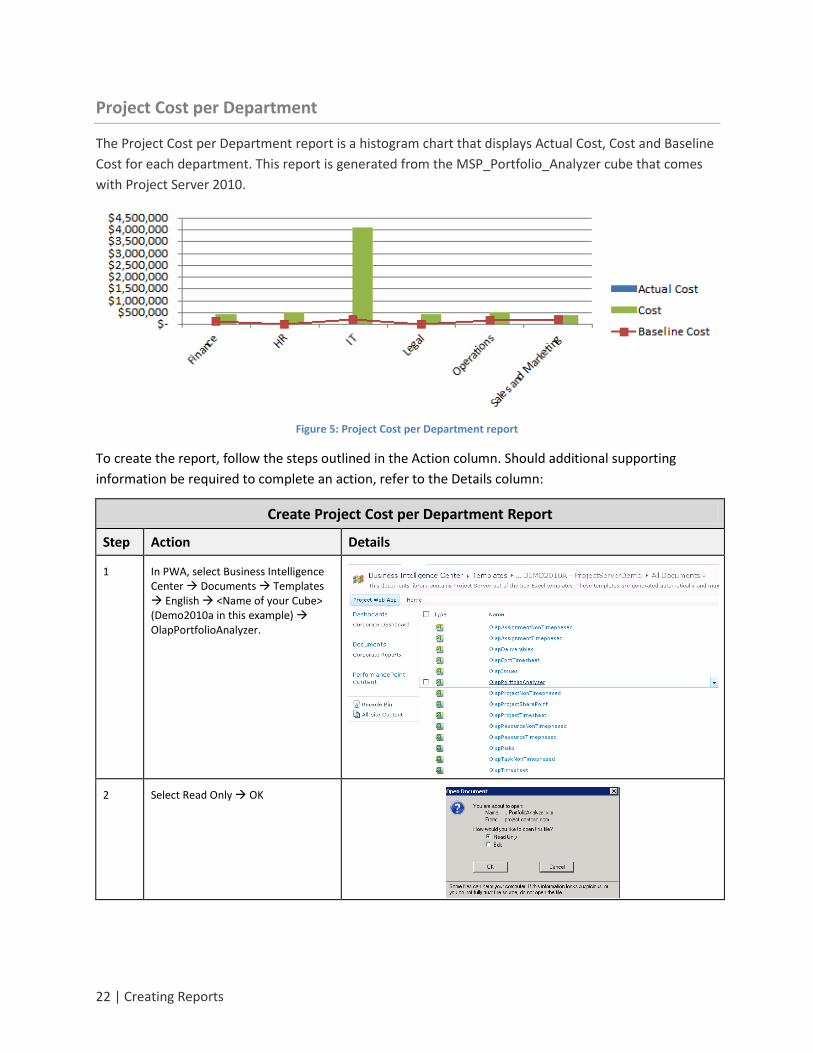
Project Cost per Department
The Project Cost per Department report is a histogram chart that displays Actual Cost, Cost and Baseline
Cost for each department. This report is generated from the MSP_Portfolio_Analyzer cube that comes
with Project Server 2010.
Figure 5: Project Cost per Department report
To create the report, follow the steps outlined in the Action column. Should additional supporting
information be required to complete an action, refer to the Details column:
Create Project Cost per Department Report
Step Action Details
1 In PWA, select Business Intelligence Center Documents Templates English <Name of your Cube> (Demo2010a in this example) OlapPortfolioAnalyzer.
2 Select Read Only OK
Creating Dashboards for Microsoft Project Server 2010 | 23
Create Project Cost per Department Report
Step Action Details
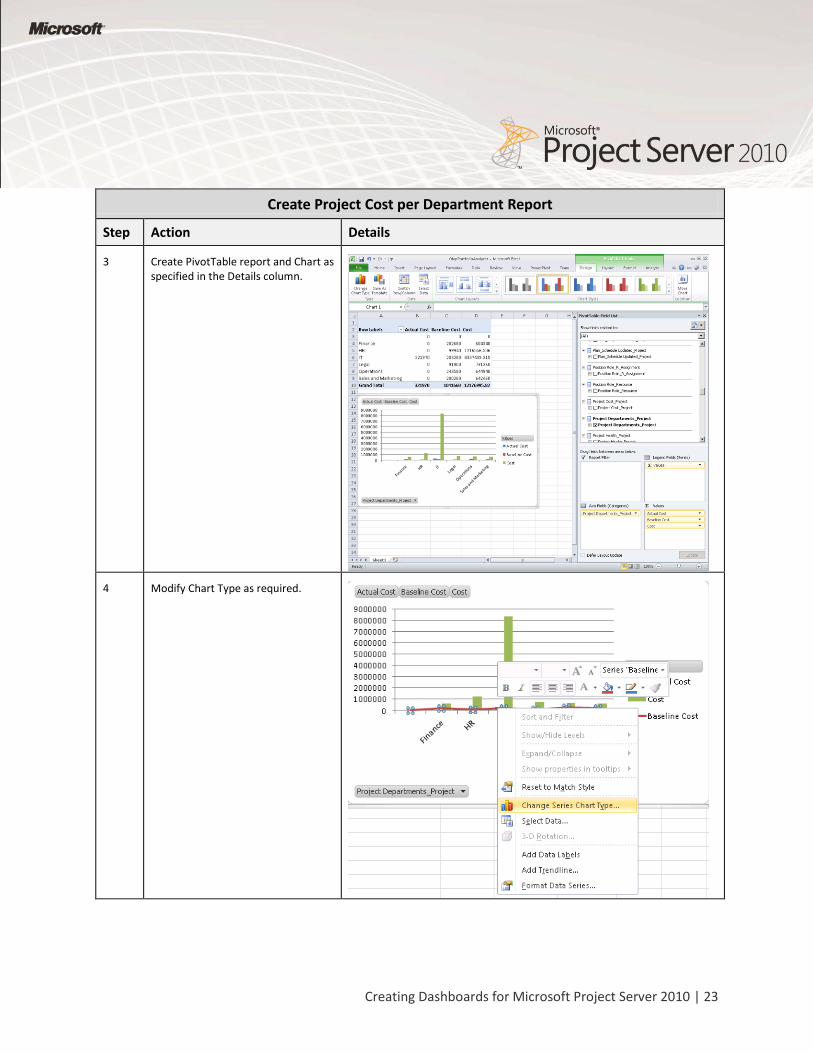
3 Create PivotTable report and Chart as specified in the Details column.
4 Modify Chart Type as required.

24 | Creating Reports
Create Project Cost per Department Report
Step Action Details
5 Select your chart Data Modify Chart Name.
6 Select File Save & Send Save to SharePoint Publish Options select all items in workbook you want to publish.
7 Save Excel file as Project Cost per Department.xlsx in the document library that will store all your Excel Services reports (Corporate Reports in this example).
Resource Availability by Role
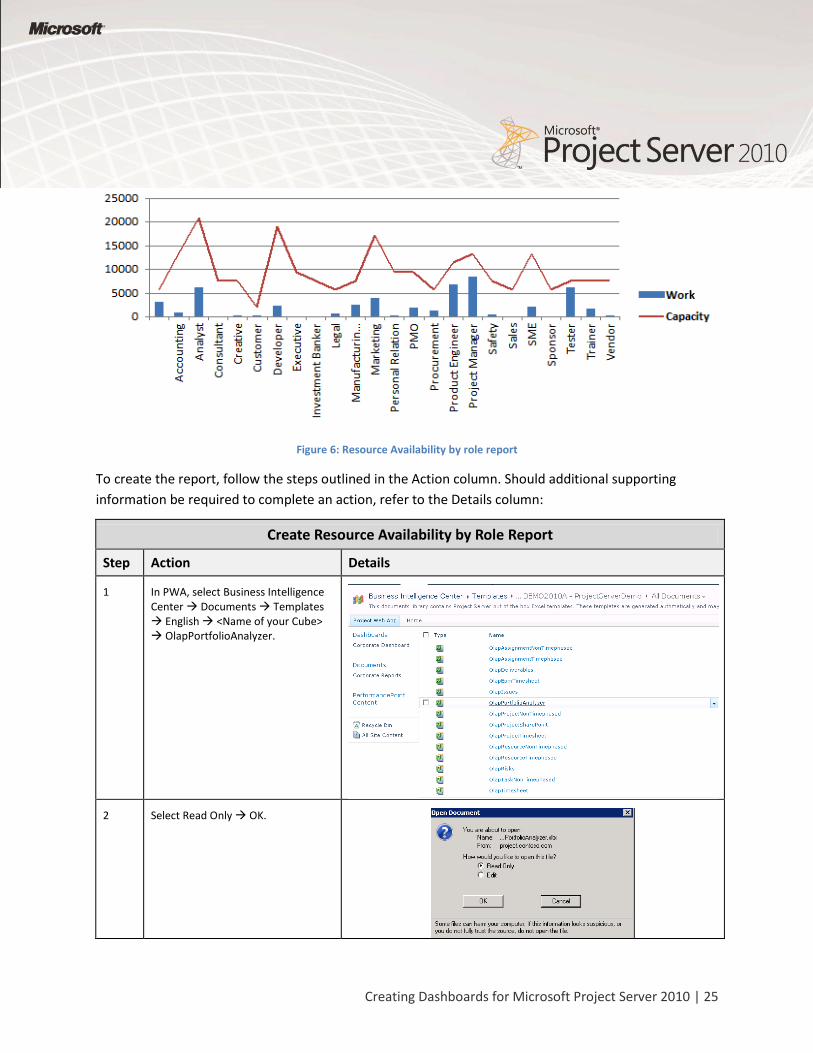
The Resource Availability by Role report is a histogram chart that displays Work and Capacity for each
resource role. This report is generated from the MSP_Portfolio_Analyzer cube that comes with Project
Server 2010.
Creating Dashboards for Microsoft Project Server 2010 | 25
Figure 6: Resource Availability by role report
To create the report, follow the steps outlined in the Action column. Should additional supporting
information be required to complete an action, refer to the Details column:
Create Resource Availability by Role Report
Step Action Details
1 In PWA, select Business Intelligence Center Documents Templates English <Name of your Cube> OlapPortfolioAnalyzer.
2 Select Read Only OK.
26 | Creating Reports
Create Resource Availability by Role Report
Step Action Details
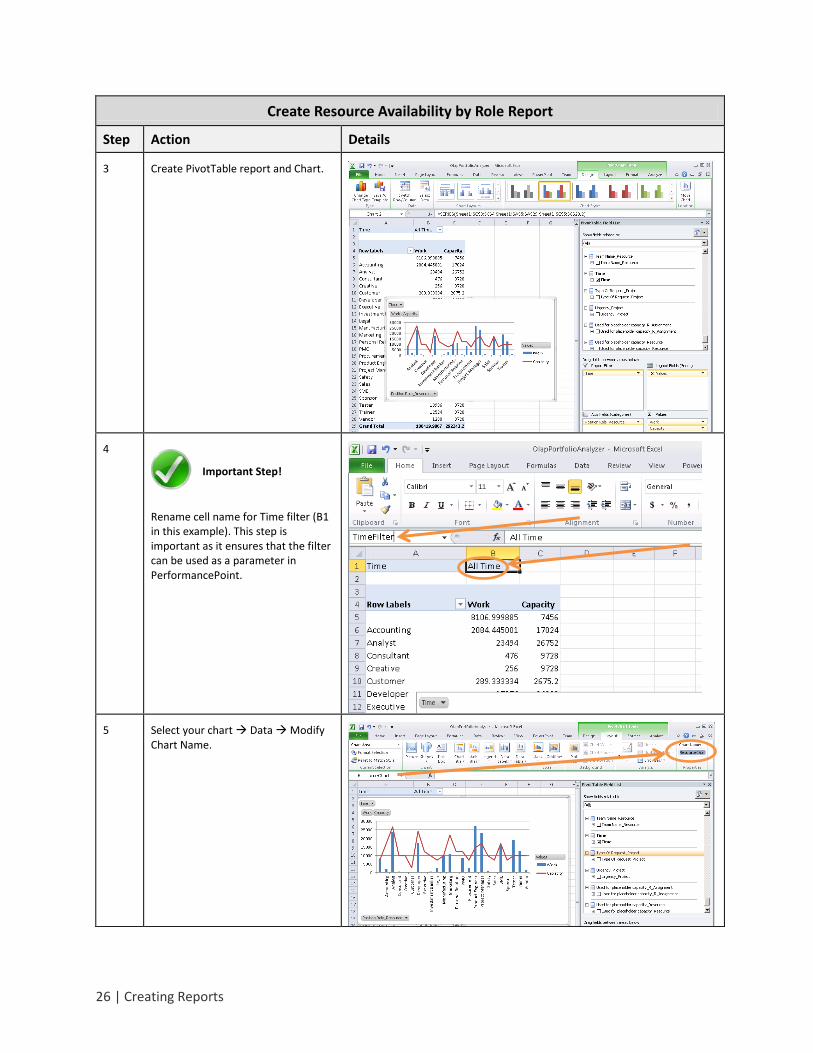
3 Create PivotTable report and Chart.
4
Important Step!
Rename cell name for Time filter (B1 in this example). This step is important as it ensures that the filter can be used as a parameter in PerformancePoint.
5 Select your chart Data Modify Chart Name.
Creating Dashboards for Microsoft Project Server 2010 | 27
Create Resource Availability by Role Report
Step Action Details
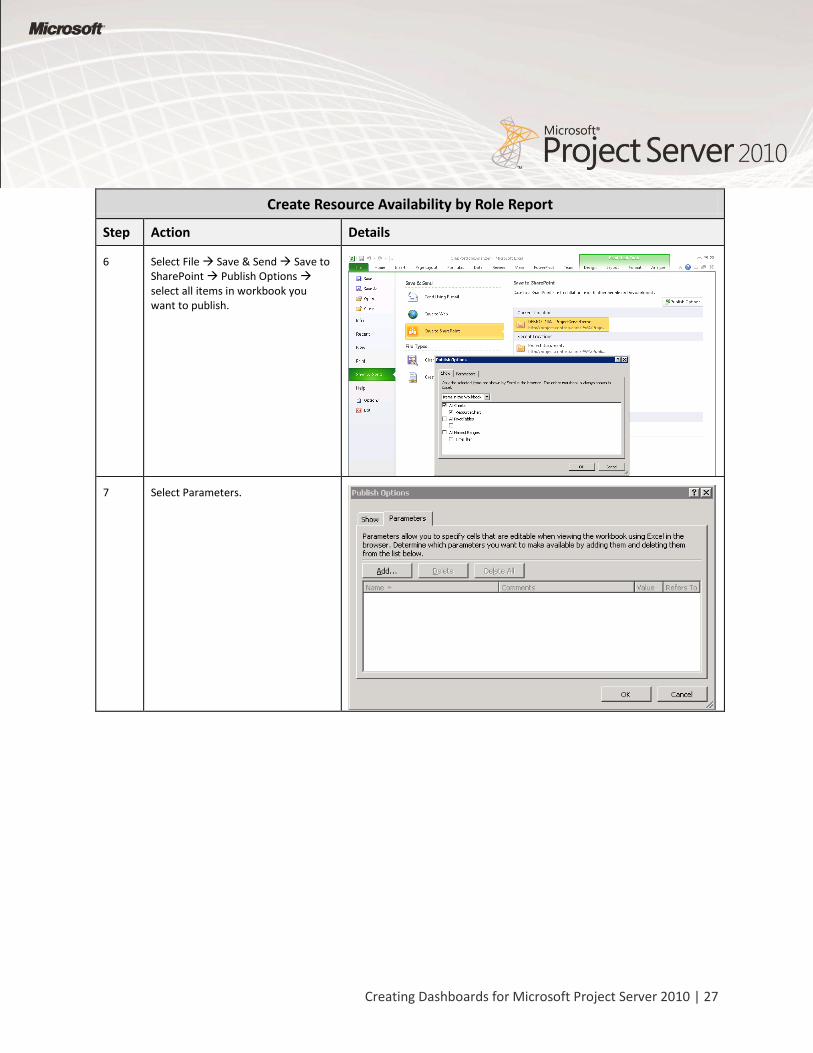
6 Select File Save & Send Save to SharePoint Publish Options select all items in workbook you want to publish.
7 Select Parameters.
28 | Creating Reports
Create Resource Availability by Role Report
Step Action Details
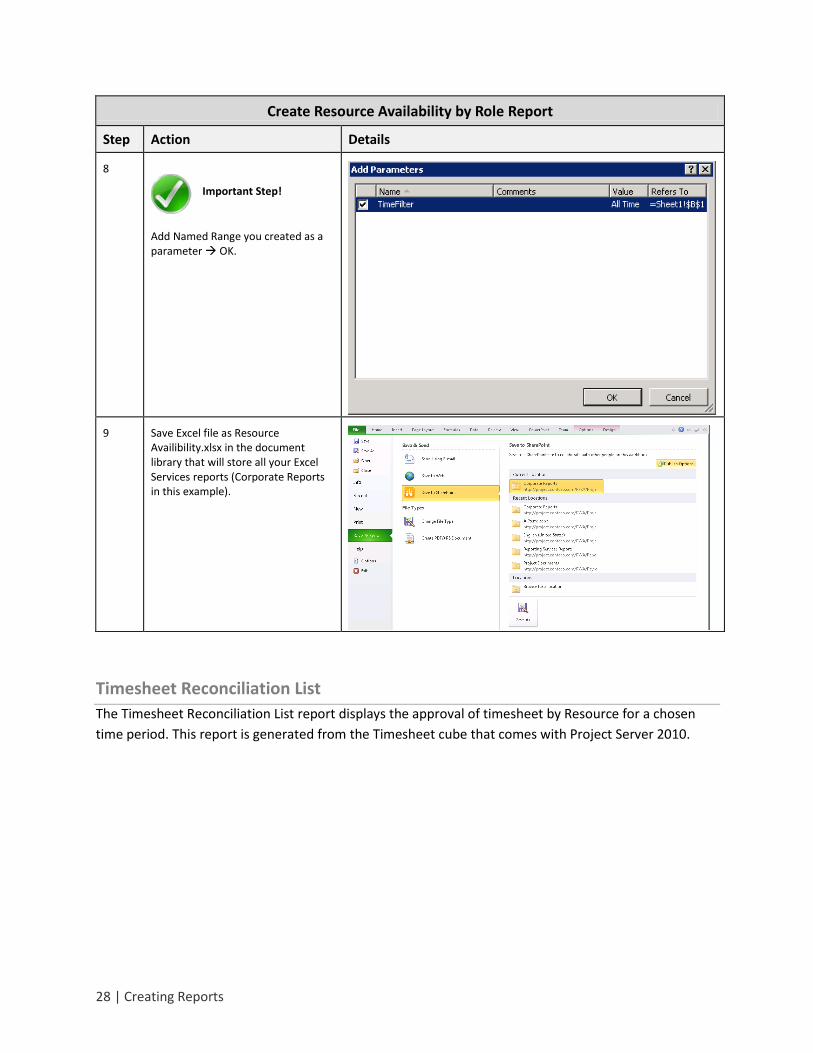
8
Important Step!
Add Named Range you created as a parameter OK.
9 Save Excel file as Resource Availibility.xlsx in the document library that will store all your Excel Services reports (Corporate Reports in this example).
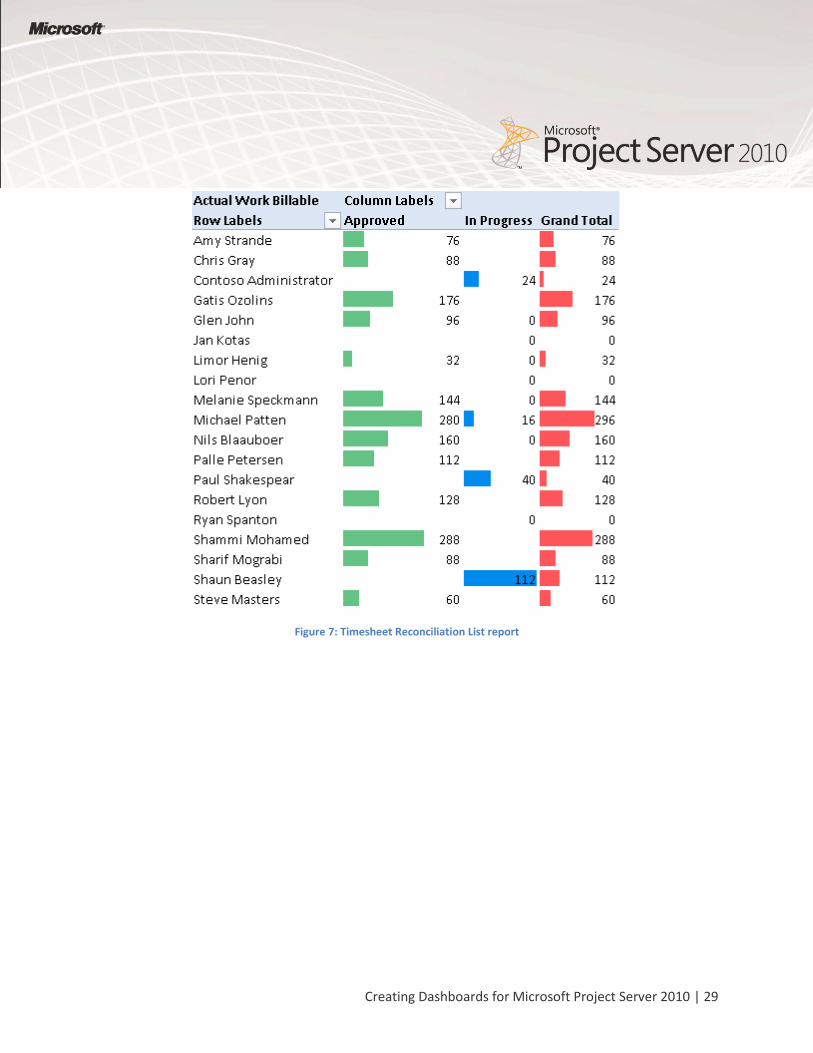
Timesheet Reconciliation List
The Timesheet Reconciliation List report displays the approval of timesheet by Resource for a chosen
time period. This report is generated from the Timesheet cube that comes with Project Server 2010.
Creating Dashboards for Microsoft Project Server 2010 | 29
Figure 7: Timesheet Reconciliation List report
30 | Creating Reports
To create the report, follow the steps outlined in the Action column. Should additional supporting
information be required to complete an action, refer to the Details column:
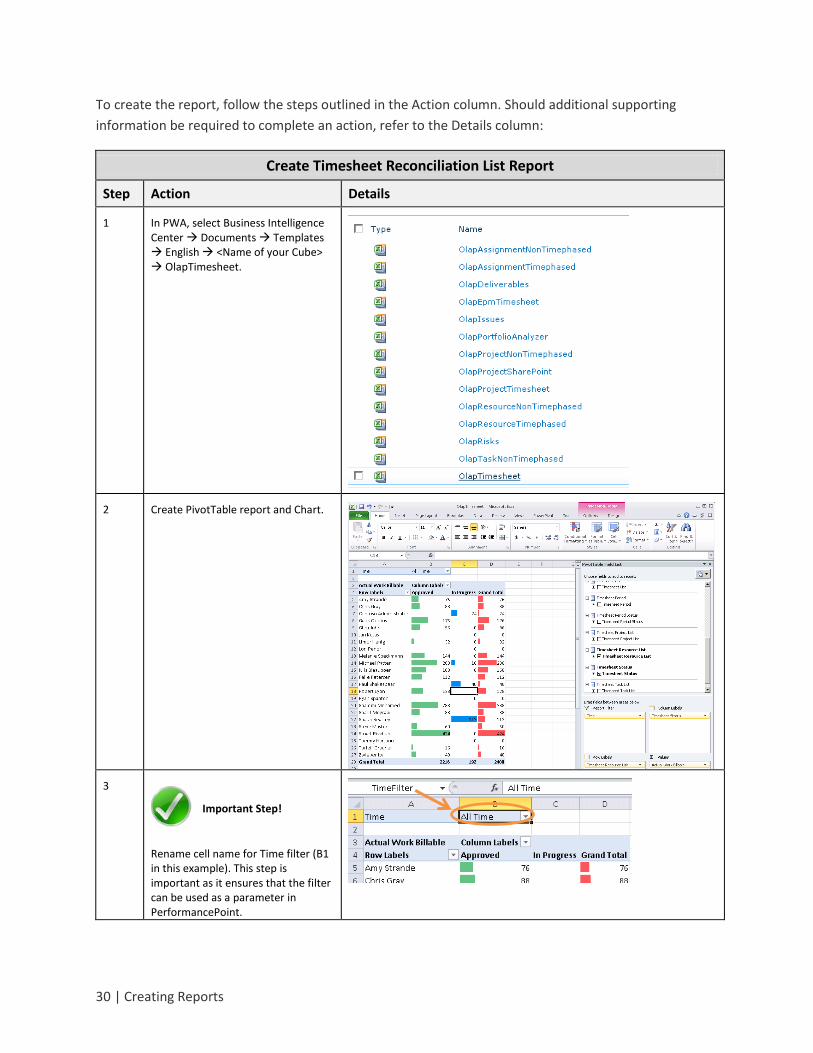
Create Timesheet Reconciliation List Report
Step Action Details
1 In PWA, select Business Intelligence Center Documents Templates English <Name of your Cube> OlapTimesheet.
2 Create PivotTable report and Chart.
3
Important Step!
Rename cell name for Time filter (B1 in this example). This step is important as it ensures that the filter can be used as a parameter in PerformancePoint.
Creating Dashboards for Microsoft Project Server 2010 | 31
Create Timesheet Reconciliation List Report
Step Action Details
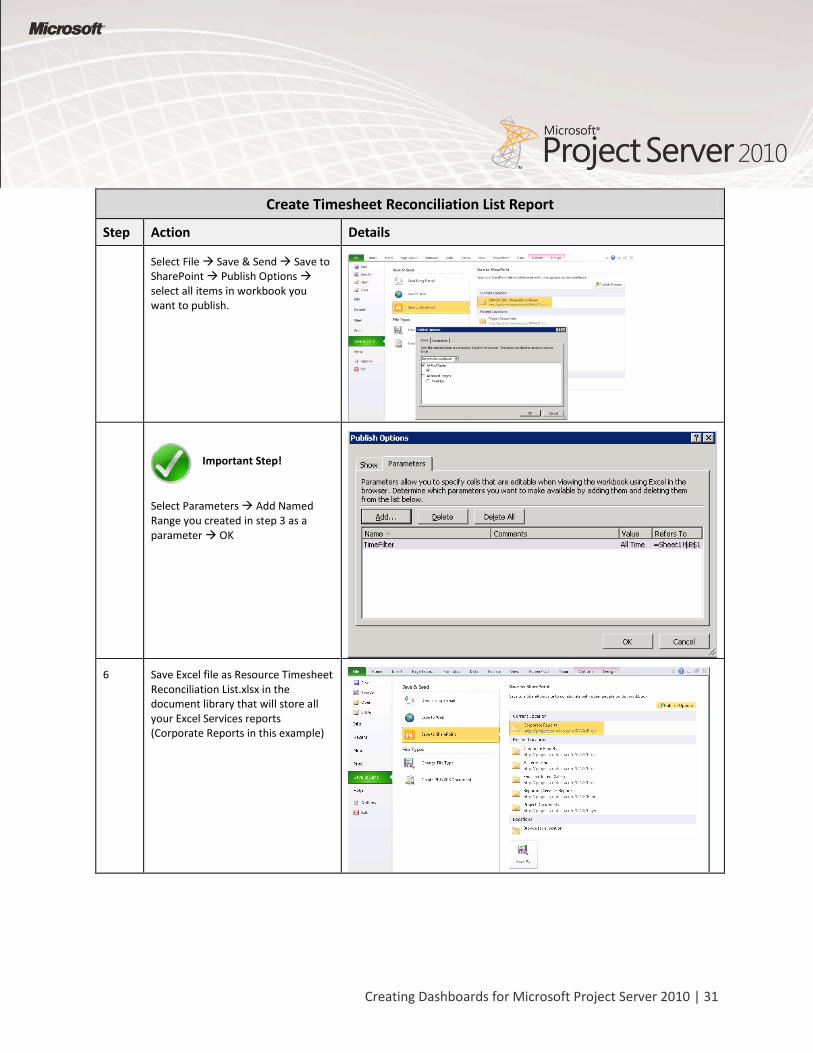
Select File Save & Send Save to SharePoint Publish Options select all items in workbook you want to publish.
Important Step!
Select Parameters Add Named Range you created in step 3 as a parameter OK
6 Save Excel file as Resource Timesheet Reconciliation List.xlsx in the document library that will store all your Excel Services reports (Corporate Reports in this example)

32 | Creating Reports
Creating Dashboards for Microsoft Project Server 2010 | 33
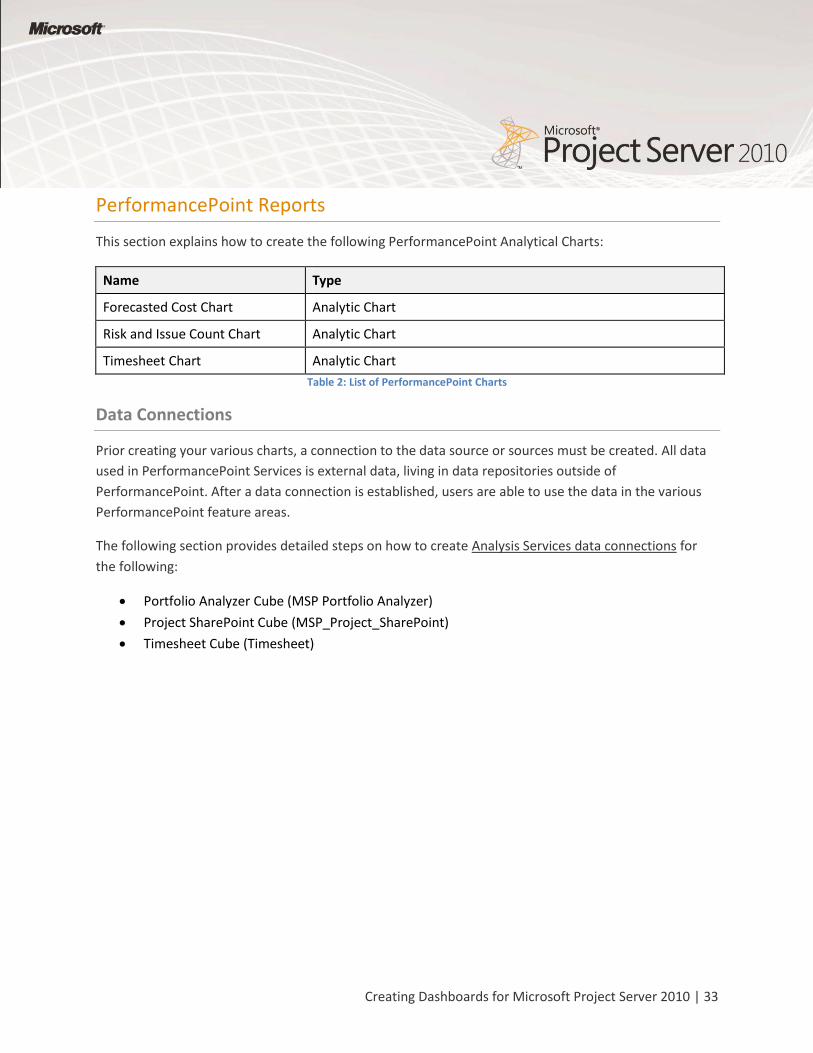
PerformancePoint Reports
This section explains how to create the following PerformancePoint Analytical Charts:
Name Type
Forecasted Cost Chart Analytic Chart
Risk and Issue Count Chart Analytic Chart
Timesheet Chart Analytic Chart
Table 2: List of PerformancePoint Charts
Data Connections
Prior creating your various charts, a connection to the data source or sources must be created. All data
used in PerformancePoint Services is external data, living in data repositories outside of
PerformancePoint. After a data connection is established, users are able to use the data in the various
PerformancePoint feature areas.
The following section provides detailed steps on how to create Analysis Services data connections for
the following:
Portfolio Analyzer Cube (MSP Portfolio Analyzer)
Project SharePoint Cube (MSP_Project_SharePoint)
Timesheet Cube (Timesheet)
34 | Creating Reports
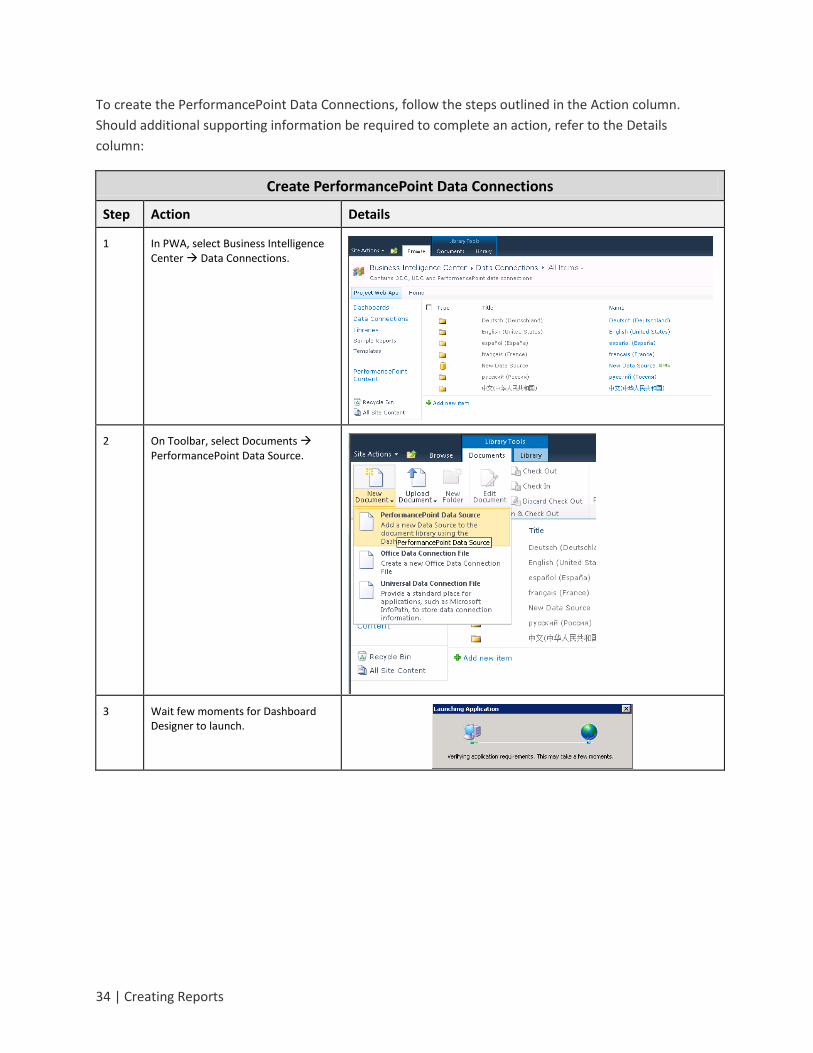
To create the PerformancePoint Data Connections, follow the steps outlined in the Action column.
Should additional supporting information be required to complete an action, refer to the Details
column:
Create PerformancePoint Data Connections
Step Action Details
1 In PWA, select Business Intelligence Center Data Connections.
2 On Toolbar, select Documents PerformancePoint Data Source.
3 Wait few moments for Dashboard Designer to launch.
Creating Dashboards for Microsoft Project Server 2010 | 35
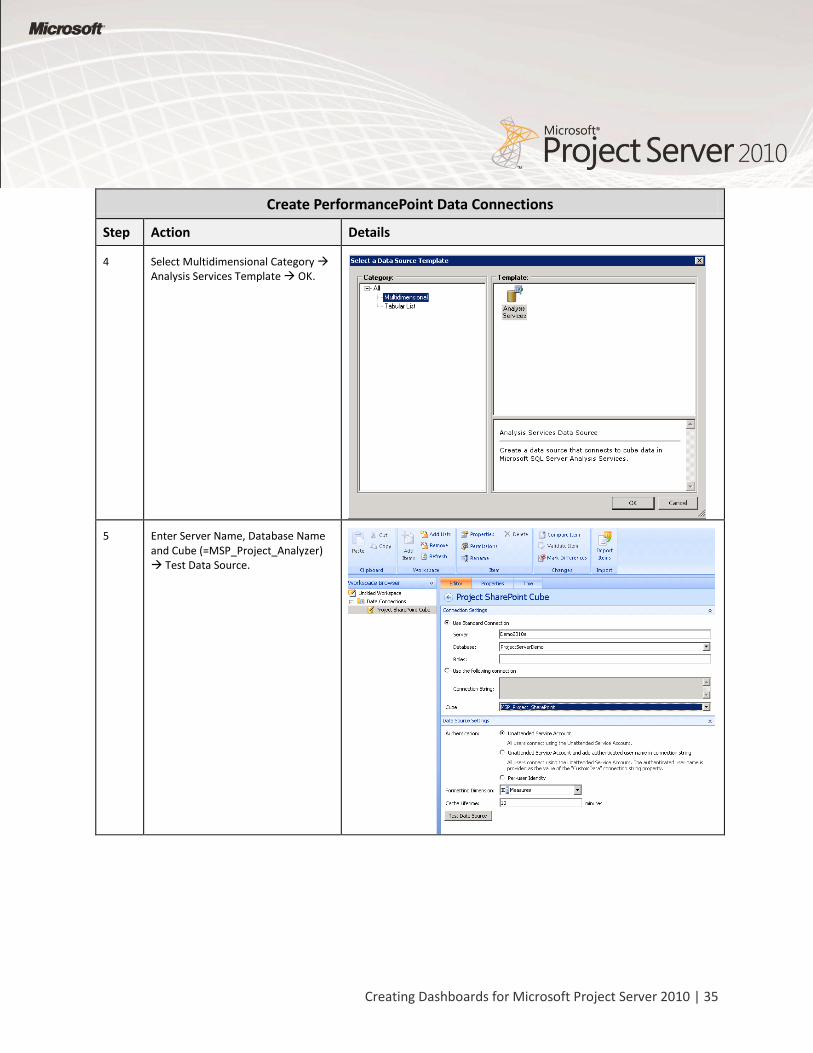
Create PerformancePoint Data Connections
Step Action Details
4 Select Multidimensional Category Analysis Services Template OK.
5 Enter Server Name, Database Name and Cube (=MSP_Project_Analyzer) Test Data Source.
36 | Creating Reports
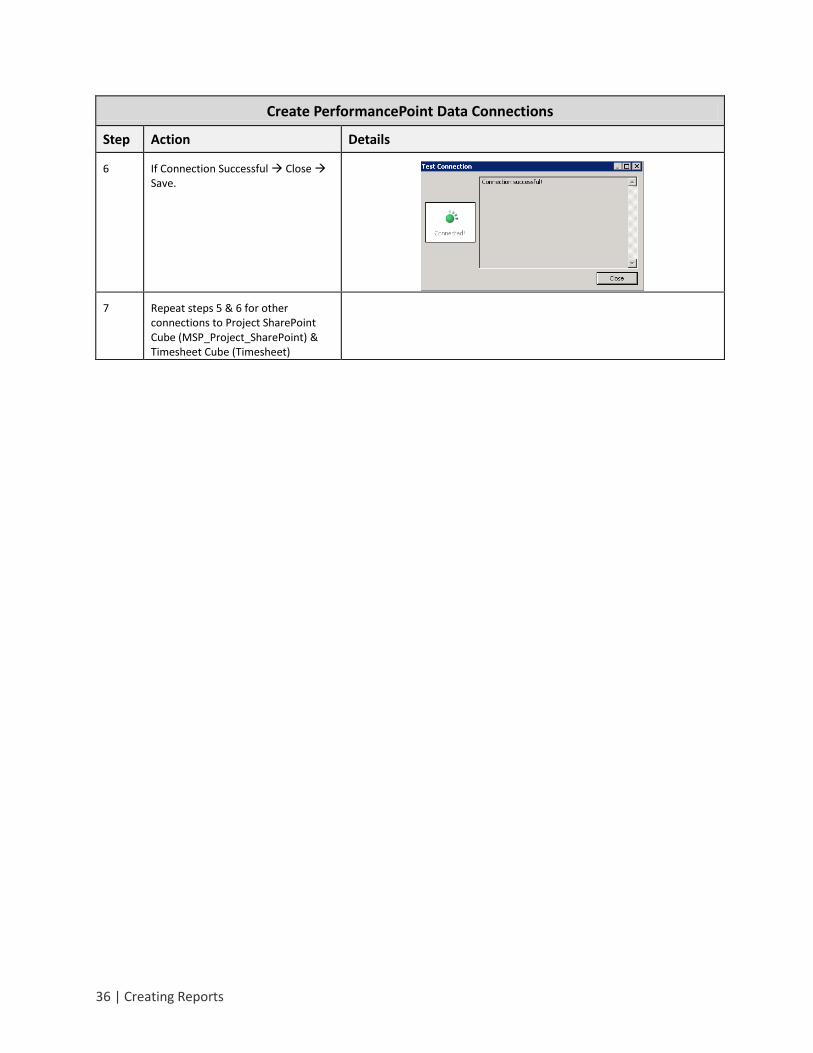
Create PerformancePoint Data Connections
Step Action Details
6 If Connection Successful Close Save.
7 Repeat steps 5 & 6 for other connections to Project SharePoint Cube (MSP_Project_SharePoint) & Timesheet Cube (Timesheet)
Creating Dashboards for Microsoft Project Server 2010 | 37
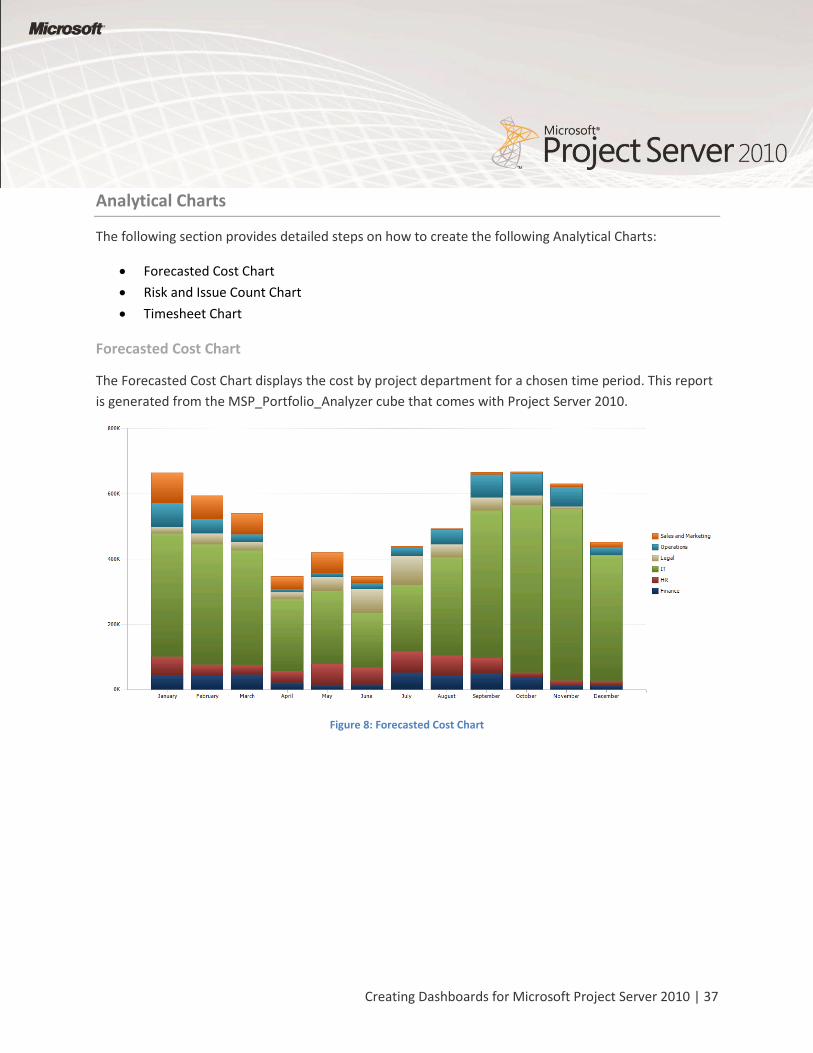
Analytical Charts
The following section provides detailed steps on how to create the following Analytical Charts:
Forecasted Cost Chart
Risk and Issue Count Chart
Timesheet Chart
Forecasted Cost Chart
The Forecasted Cost Chart displays the cost by project department for a chosen time period. This report
is generated from the MSP_Portfolio_Analyzer cube that comes with Project Server 2010.
Figure 8: Forecasted Cost Chart
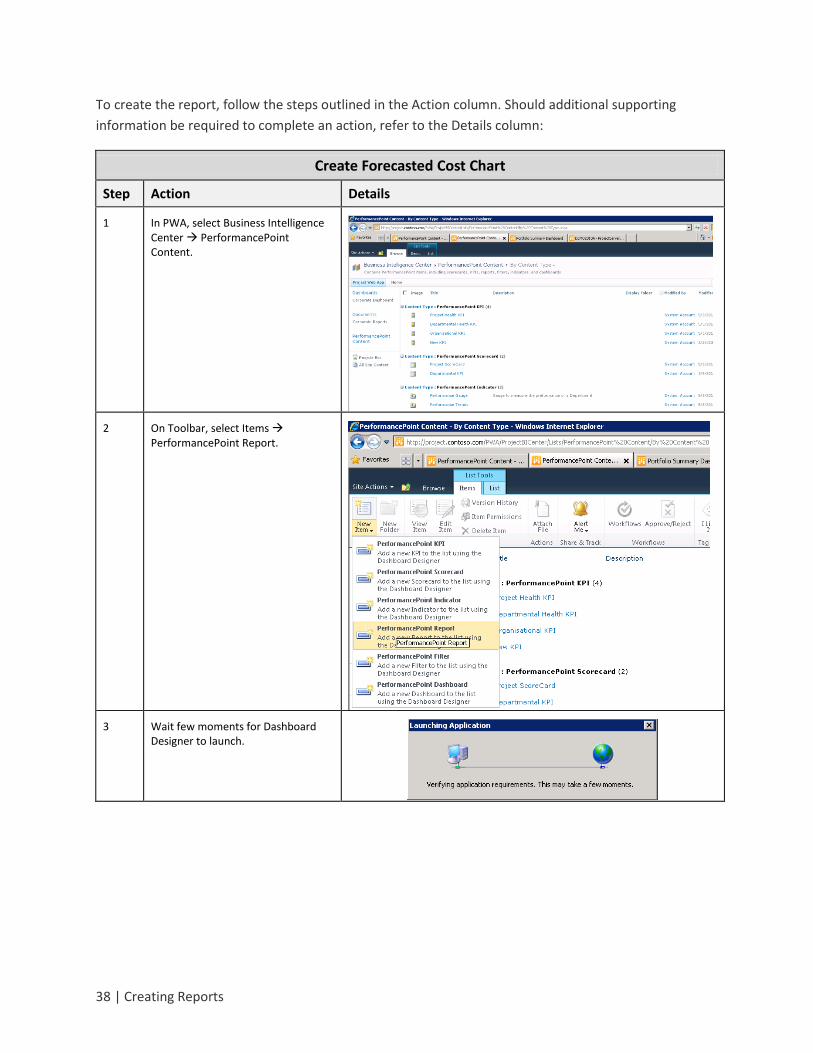
38 | Creating Reports
To create the report, follow the steps outlined in the Action column. Should additional supporting
information be required to complete an action, refer to the Details column:
Create Forecasted Cost Chart
Step Action Details
1 In PWA, select Business Intelligence Center PerformancePoint Content.
2 On Toolbar, select Items PerformancePoint Report.
3 Wait few moments for Dashboard Designer to launch.
Creating Dashboards for Microsoft Project Server 2010 | 39
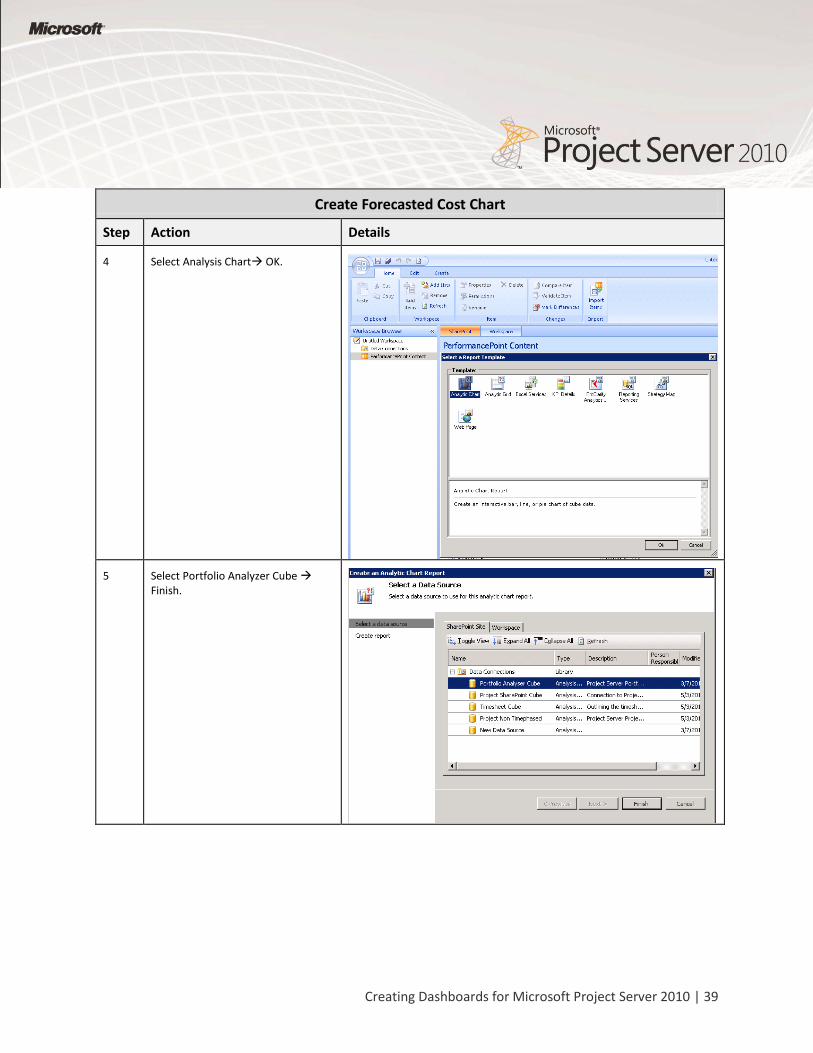
Create Forecasted Cost Chart
Step Action Details
4 Select Analysis Chart OK.
5 Select Portfolio Analyzer Cube Finish.
40 | Creating Reports
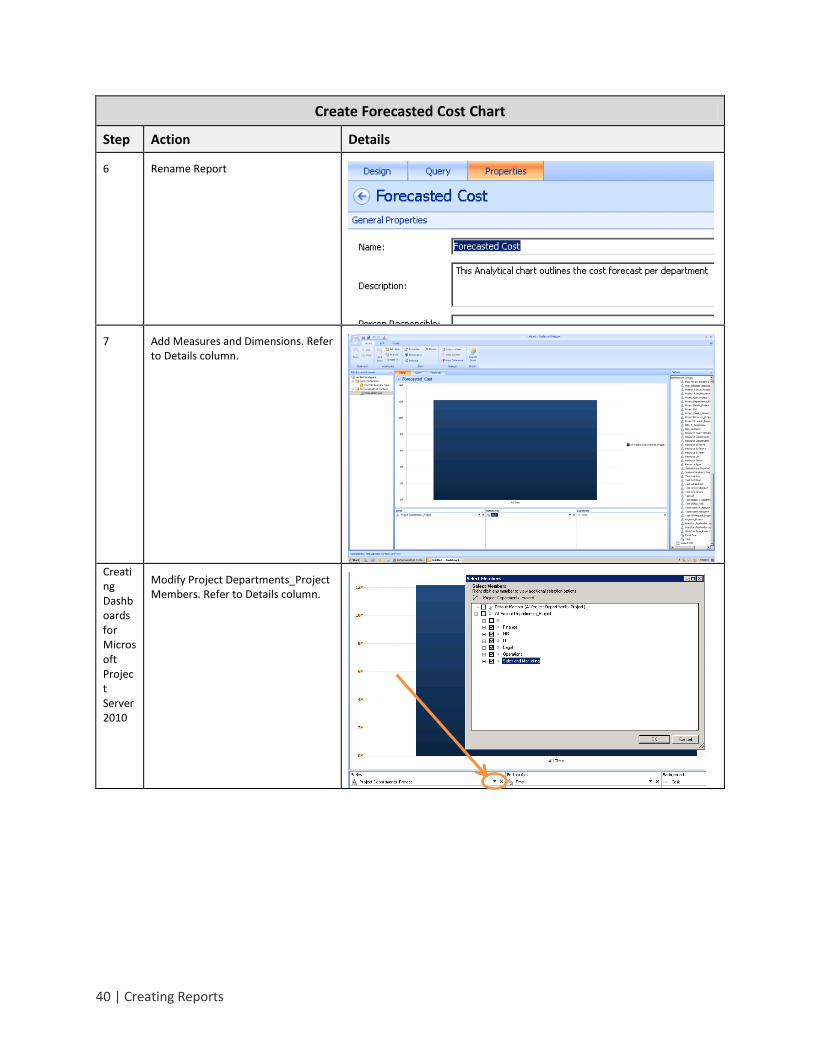
Create Forecasted Cost Chart
Step Action Details
6 Rename Report
7 Add Measures and Dimensions. Refer to Details column.
Creating Dashboards for Microsoft Project Server 2010
Modify Project Departments_Project Members. Refer to Details column.
Creating Dashboards for Microsoft Project Server 2010 | 41
Create Forecasted Cost Chart
Step Action Details
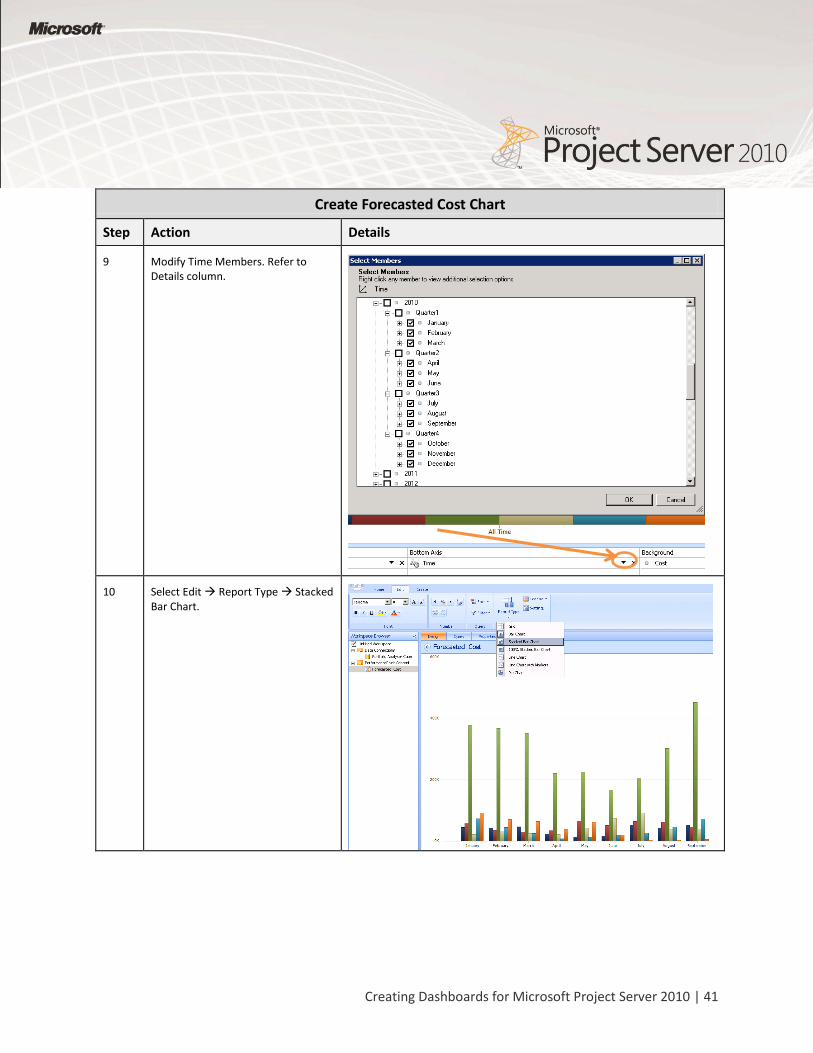
9 Modify Time Members. Refer to Details column.
10 Select Edit Report Type Stacked Bar Chart.
42 | Creating Reports
Create Forecasted Cost Chart
Step Action Details
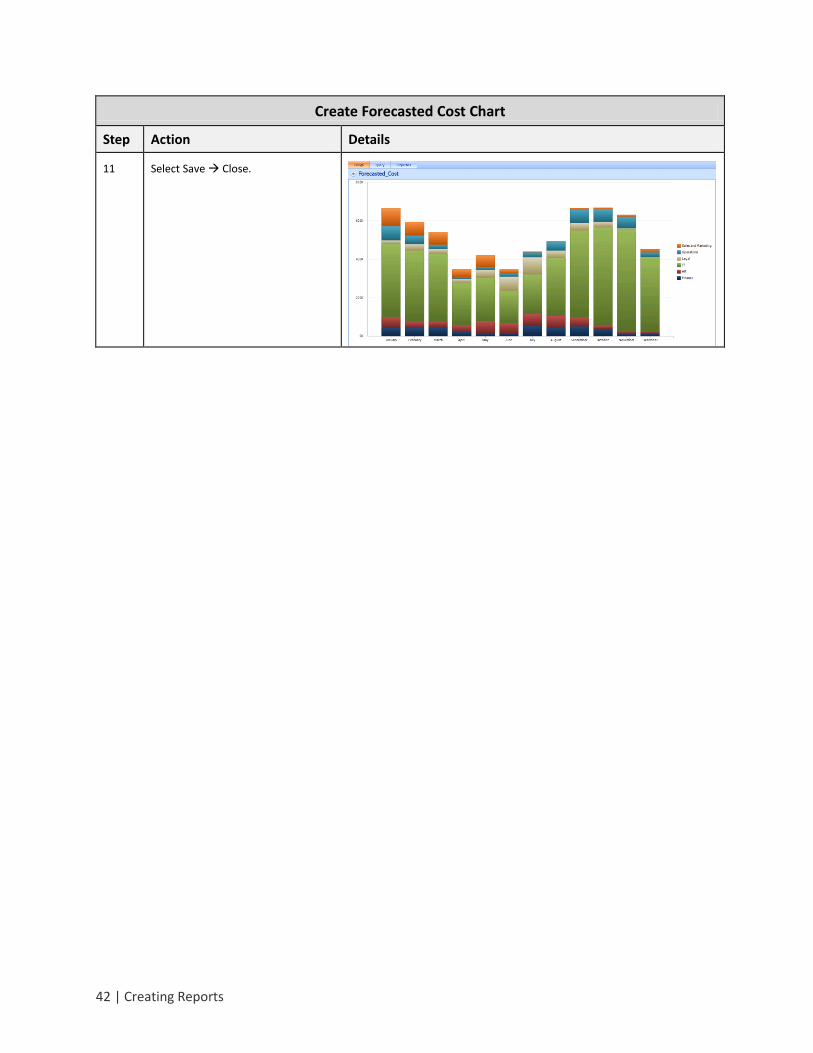
11 Select Save Close.
Creating Dashboards for Microsoft Project Server 2010 | 43
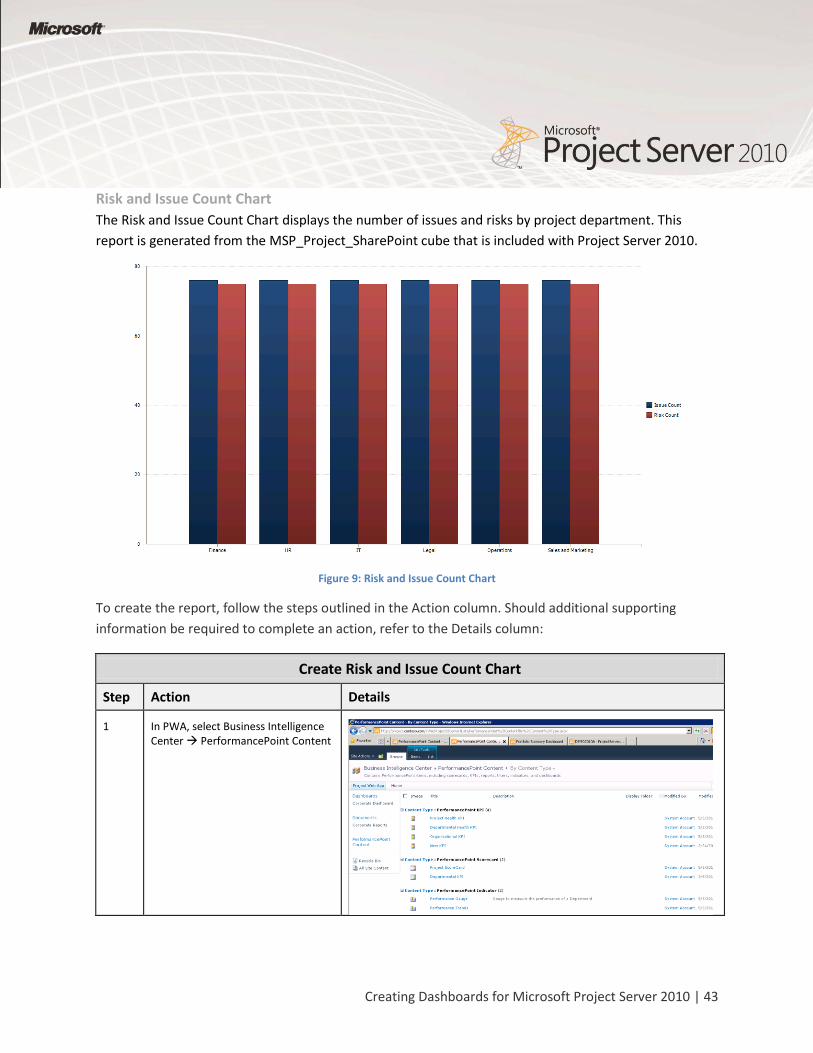
Risk and Issue Count Chart
The Risk and Issue Count Chart displays the number of issues and risks by project department. This
report is generated from the MSP_Project_SharePoint cube that is included with Project Server 2010.
Figure 9: Risk and Issue Count Chart
To create the report, follow the steps outlined in the Action column. Should additional supporting
information be required to complete an action, refer to the Details column:
Create Risk and Issue Count Chart
Step Action Details
1 In PWA, select Business Intelligence Center PerformancePoint Content
44 | Creating Reports
Create Risk and Issue Count Chart
Step Action Details
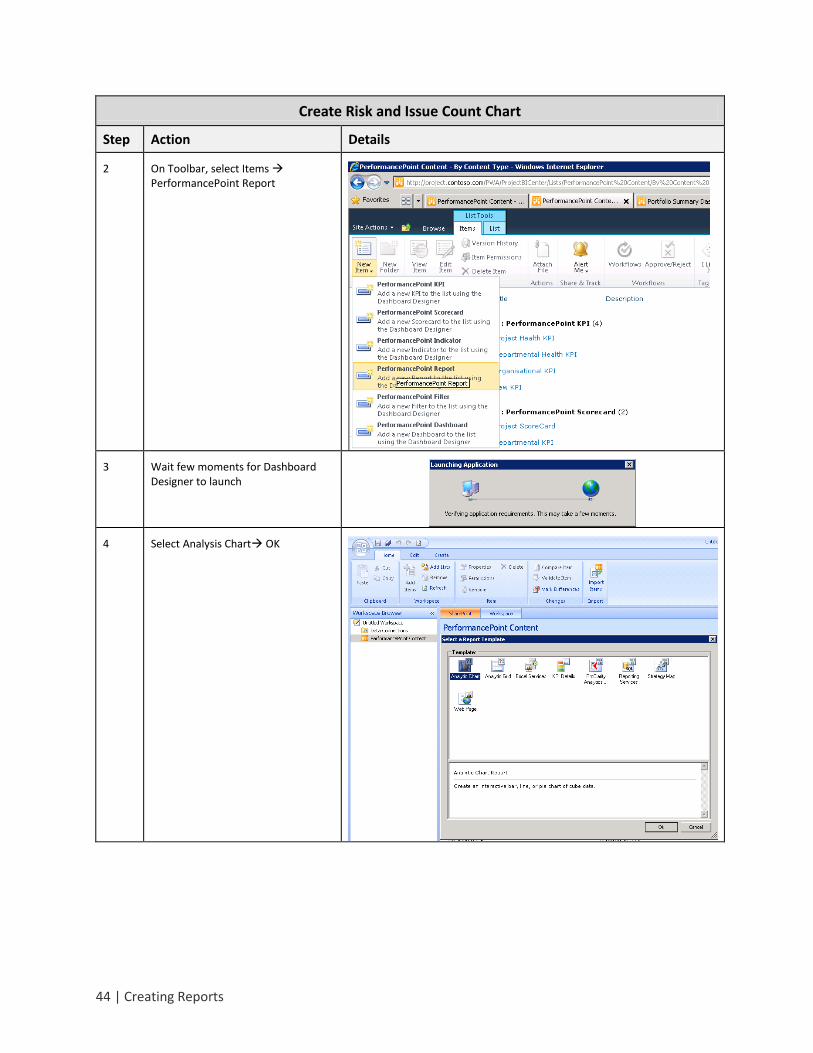
2 On Toolbar, select Items PerformancePoint Report
3 Wait few moments for Dashboard Designer to launch
4 Select Analysis Chart OK
Creating Dashboards for Microsoft Project Server 2010 | 45
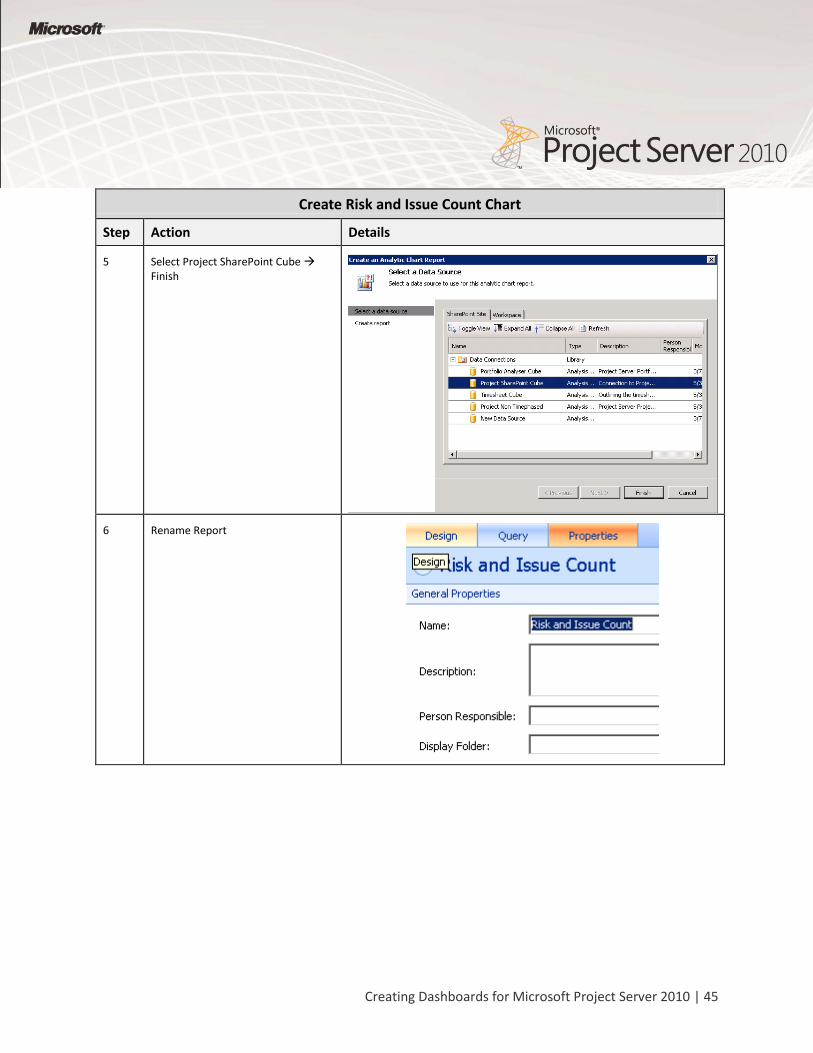
Create Risk and Issue Count Chart
Step Action Details
5 Select Project SharePoint Cube Finish
6 Rename Report
46 | Creating Reports
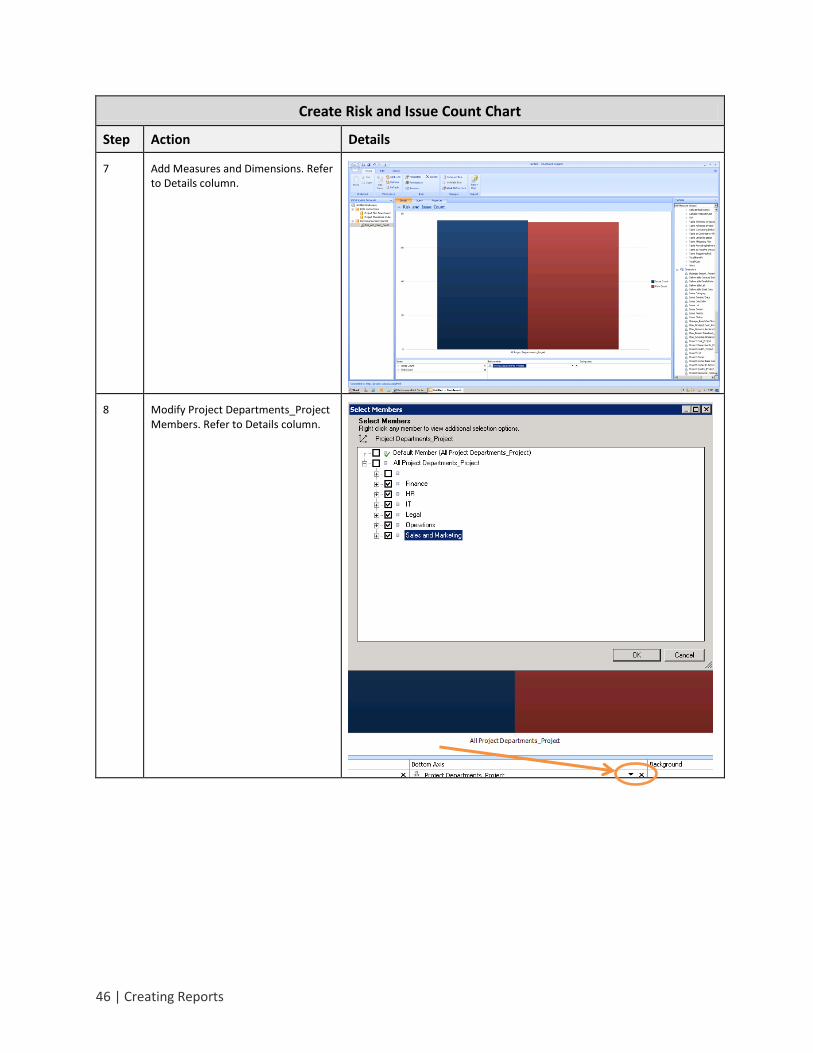
Create Risk and Issue Count Chart
Step Action Details
7 Add Measures and Dimensions. Refer to Details column.
8 Modify Project Departments_Project Members. Refer to Details column.
Creating Dashboards for Microsoft Project Server 2010 | 47
Create Risk and Issue Count Chart
Step Action Details
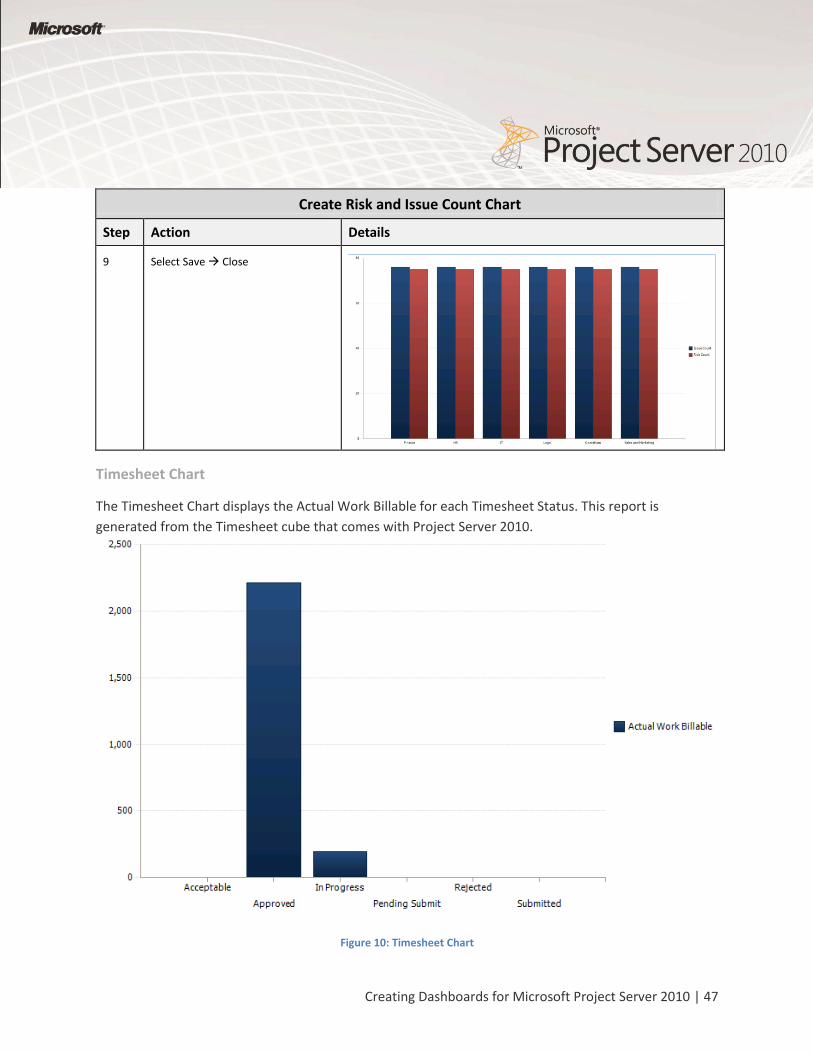
9 Select Save Close
Timesheet Chart
The Timesheet Chart displays the Actual Work Billable for each Timesheet Status. This report is
generated from the Timesheet cube that comes with Project Server 2010.
Figure 10: Timesheet Chart
48 | Creating Reports
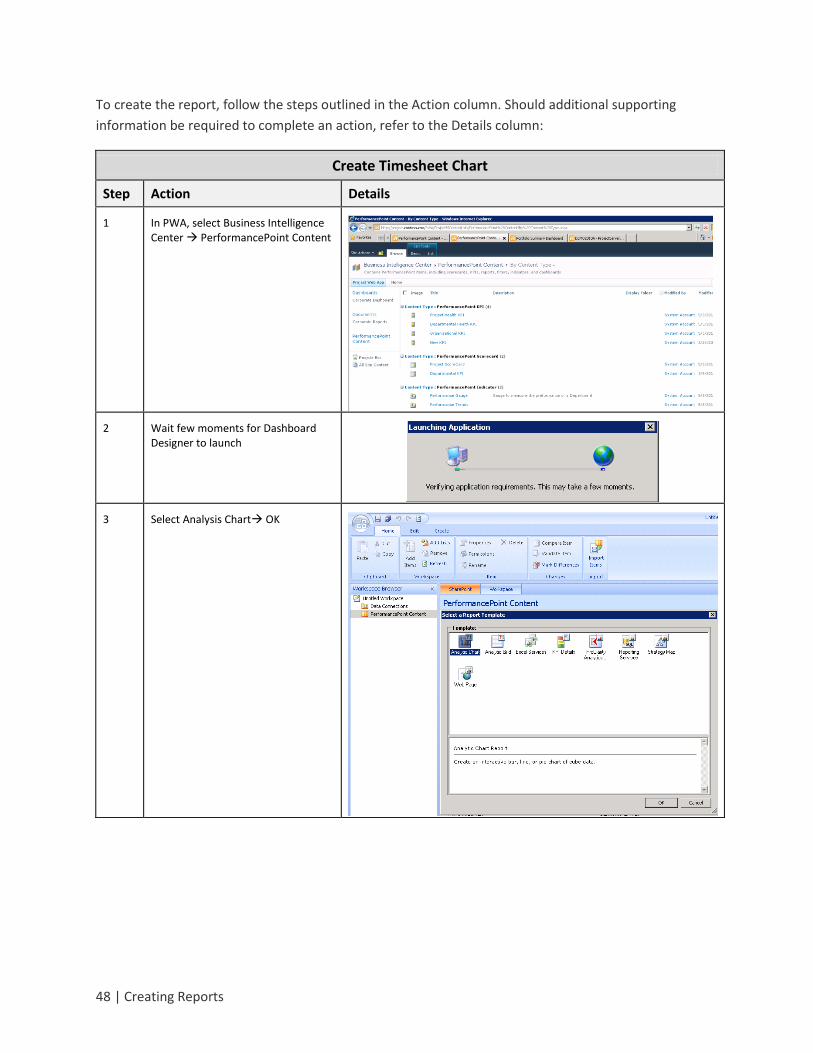
To create the report, follow the steps outlined in the Action column. Should additional supporting
information be required to complete an action, refer to the Details column:
Create Timesheet Chart
Step Action Details
1 In PWA, select Business Intelligence Center PerformancePoint Content
2 Wait few moments for Dashboard Designer to launch
3 Select Analysis Chart OK
Creating Dashboards for Microsoft Project Server 2010 | 49
Create Timesheet Chart
Step Action Details
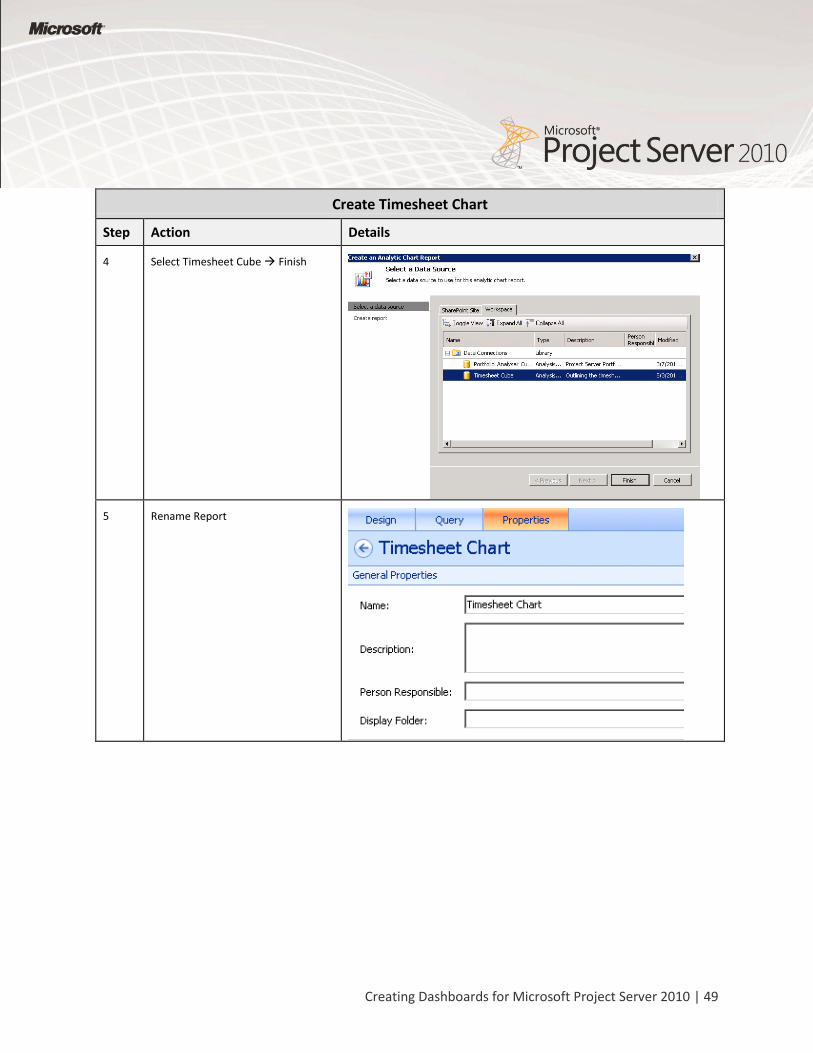
4 Select Timesheet Cube Finish
5 Rename Report
50 | Creating Reports
Create Timesheet Chart
Step Action Details
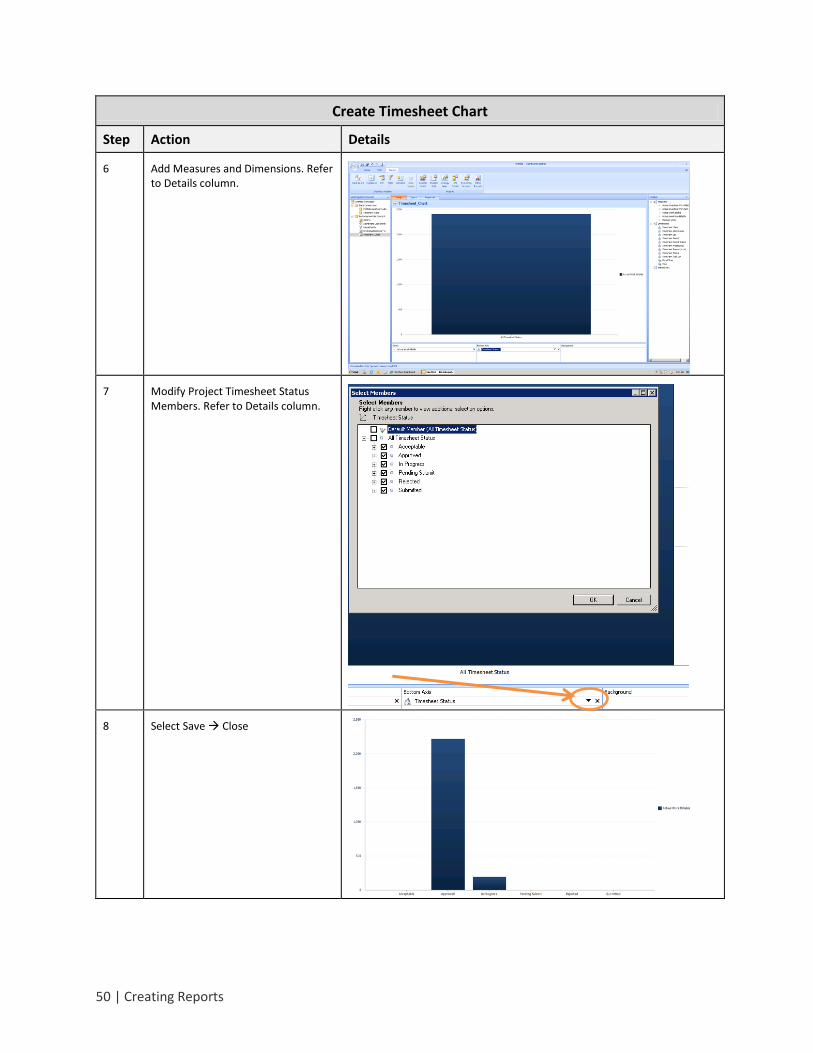
6 Add Measures and Dimensions. Refer to Details column.
7 Modify Project Timesheet Status Members. Refer to Details column.
8 Select Save Close

Creating Dashboards for Microsoft Project Server 2010 | 51
52 | Creating Reports
SQL Server Reporting Services Reports
This section explains how to create the following SQL Server Reporting Services reports:
Name Type
All KPIs Reporting Services
Project by Department Reporting Services
Table 3: List of SQL Server Reporting Services Reports
Document Library
Prior creating your SQL Server Reporting Services Report, you must create a library that will store your
shared data source (.rsds) files, report models (.smdl), and Report Builder report definition (.rdl) files.
Adding a Report Builder Report, Report Model, and Report Data Source content type to a library enables
the new command so that you can create new documents of that type. To add content types to a
library, you must be a site administrator or have Full Control level of permission.
To create the document library, follow the steps outlined in the Action column. Should additional
supporting information be required to complete an action, refer to the Details column:
Create Reporting Services Reports Document Library
Step Action Details
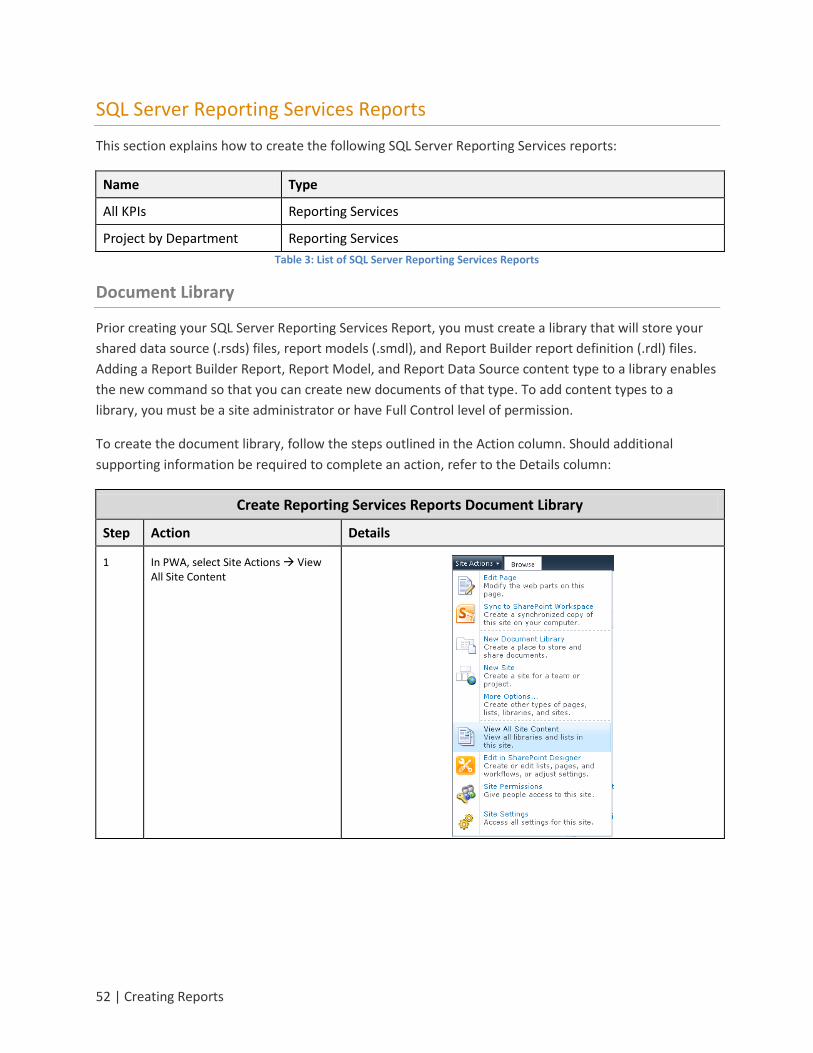
1 In PWA, select Site Actions View All Site Content
Creating Dashboards for Microsoft Project Server 2010 | 53
Create Reporting Services Reports Document Library
Step Action Details
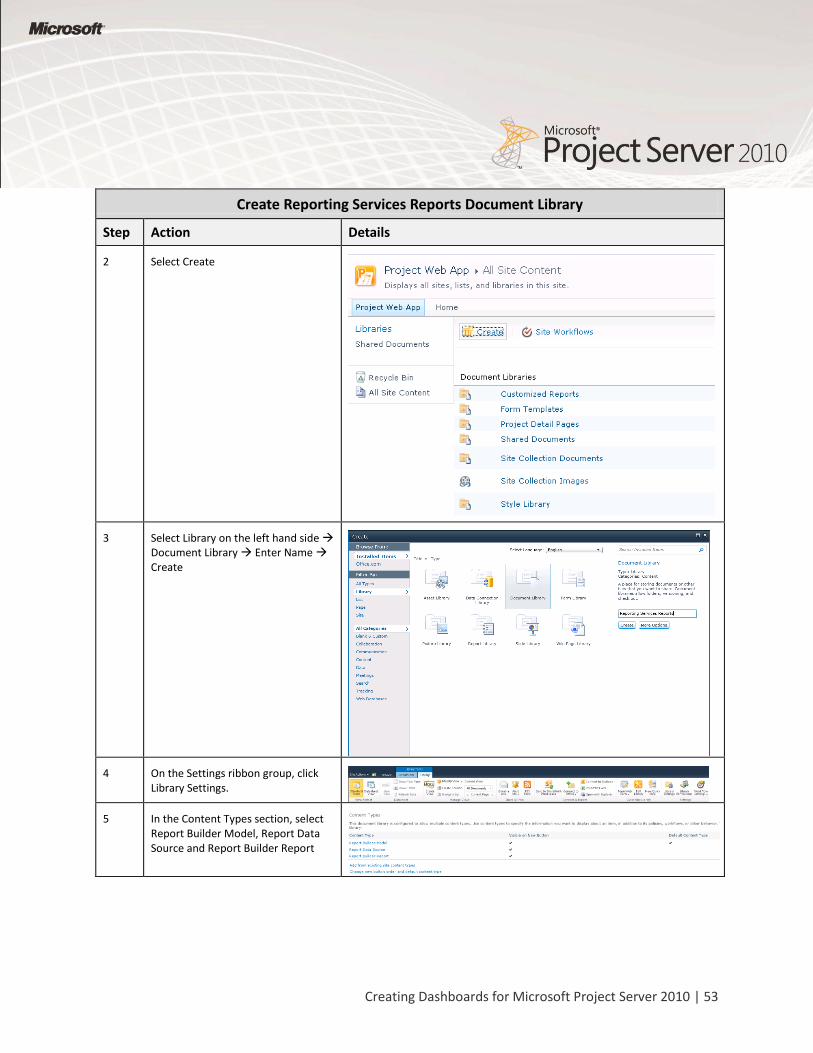
2 Select Create
3 Select Library on the left hand side Document Library Enter Name Create
4 On the Settings ribbon group, click Library Settings.
5 In the Content Types section, select Report Builder Model, Report Data Source and Report Builder Report
54 | Creating Reports
SQL Server Reporting Services Reports
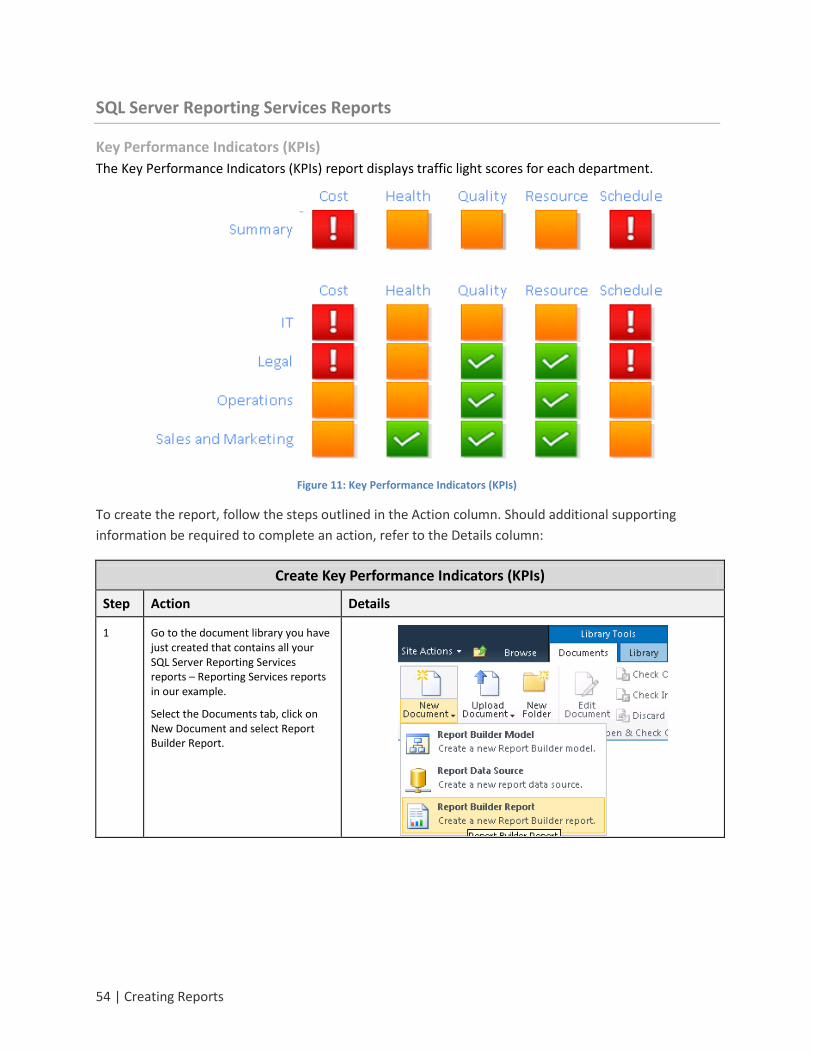
Key Performance Indicators (KPIs)
The Key Performance Indicators (KPIs) report displays traffic light scores for each department.
Figure 11: Key Performance Indicators (KPIs)
To create the report, follow the steps outlined in the Action column. Should additional supporting
information be required to complete an action, refer to the Details column:
Create Key Performance Indicators (KPIs)
Step Action Details
1 Go to the document library you have just created that contains all your SQL Server Reporting Services reports – Reporting Services reports in our example.
Select the Documents tab, click on New Document and select Report Builder Report.
Creating Dashboards for Microsoft Project Server 2010 | 55
Create Key Performance Indicators (KPIs)
Step Action Details
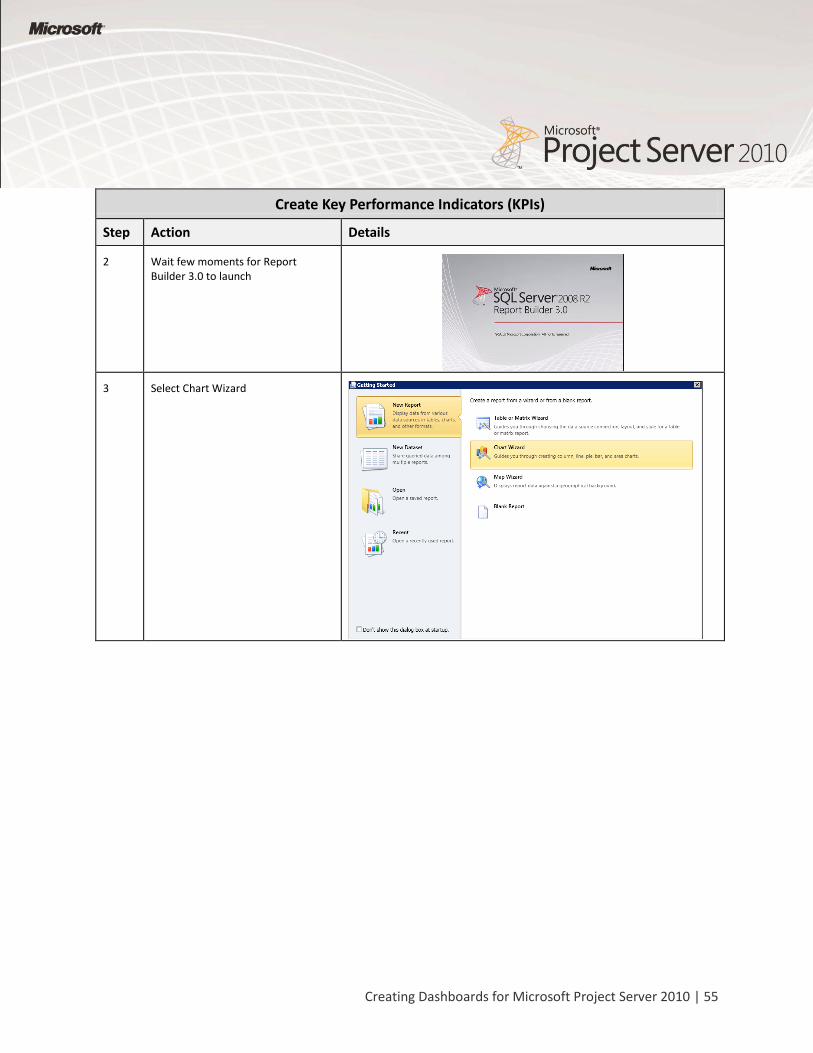
2 Wait few moments for Report Builder 3.0 to launch
3 Select Chart Wizard
56 | Creating Reports
Create Key Performance Indicators (KPIs)
Step Action Details
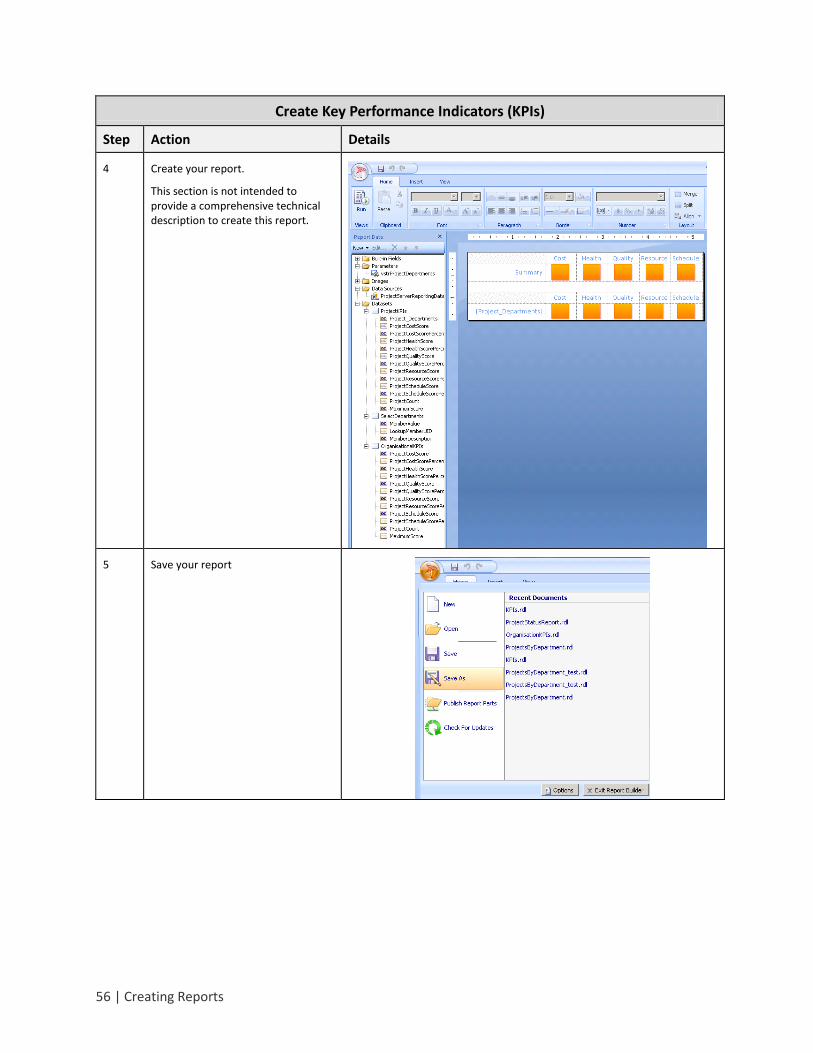
4 Create your report.
This section is not intended to provide a comprehensive technical description to create this report.
5 Save your report
Creating Dashboards for Microsoft Project Server 2010 | 57
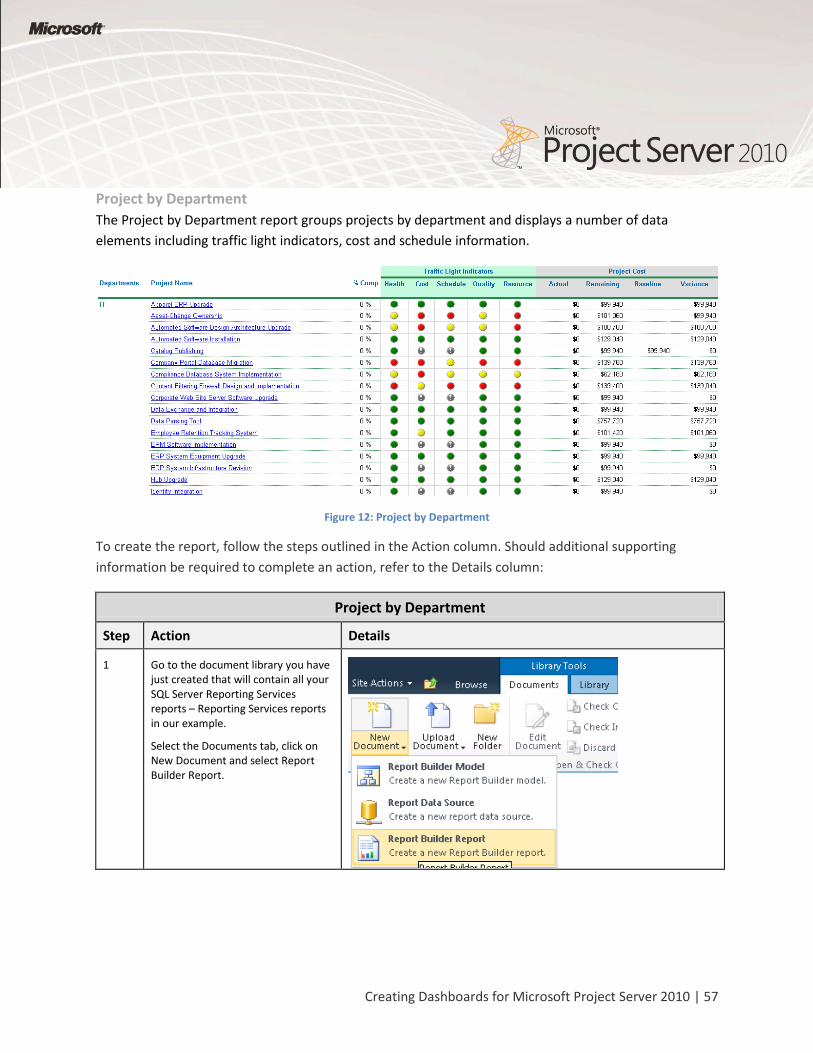
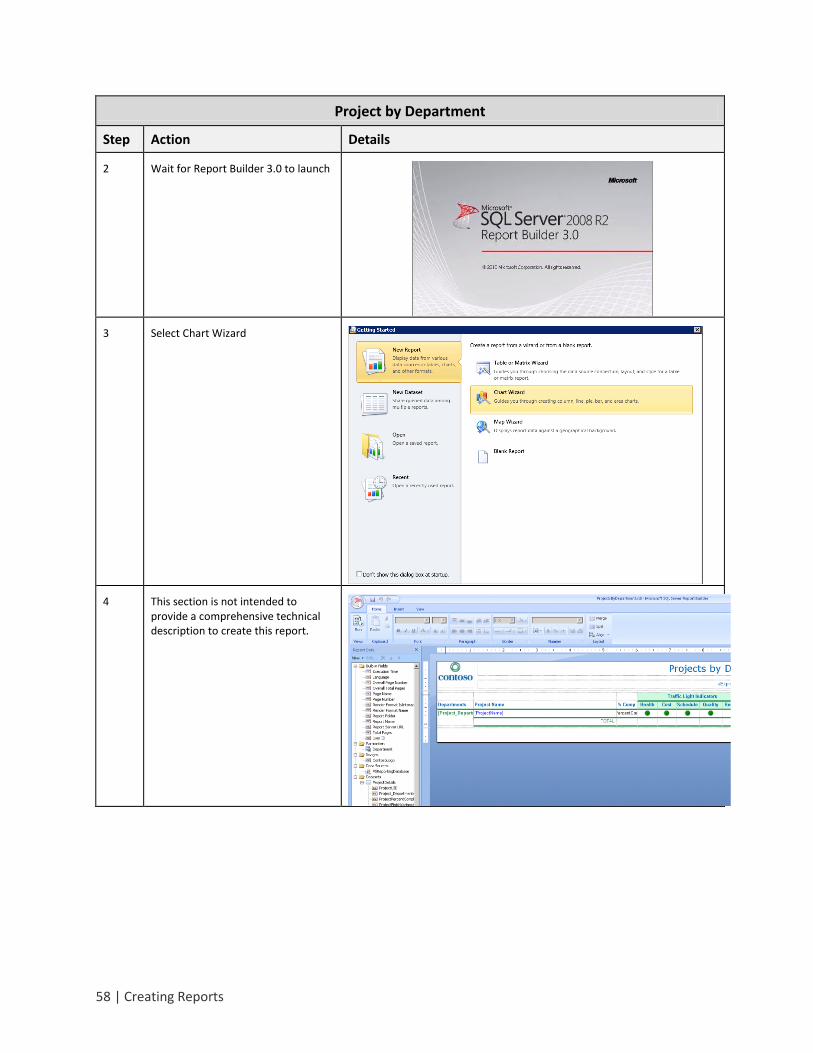
Project by Department
The Project by Department report groups projects by department and displays a number of data
elements including traffic light indicators, cost and schedule information.
Figure 12: Project by Department
To create the report, follow the steps outlined in the Action column. Should additional supporting
information be required to complete an action, refer to the Details column:
Project by Department
Step Action Details
1 Go to the document library you have just created that will contain all your SQL Server Reporting Services reports – Reporting Services reports in our example.
Select the Documents tab, click on New Document and select Report Builder Report.
58 | Creating Reports
Project by Department
Step Action Details
2 Wait for Report Builder 3.0 to launch
3 Select Chart Wizard
4 This section is not intended to provide a comprehensive technical description to create this report.
Creating Dashboards for Microsoft Project Server 2010 | 59
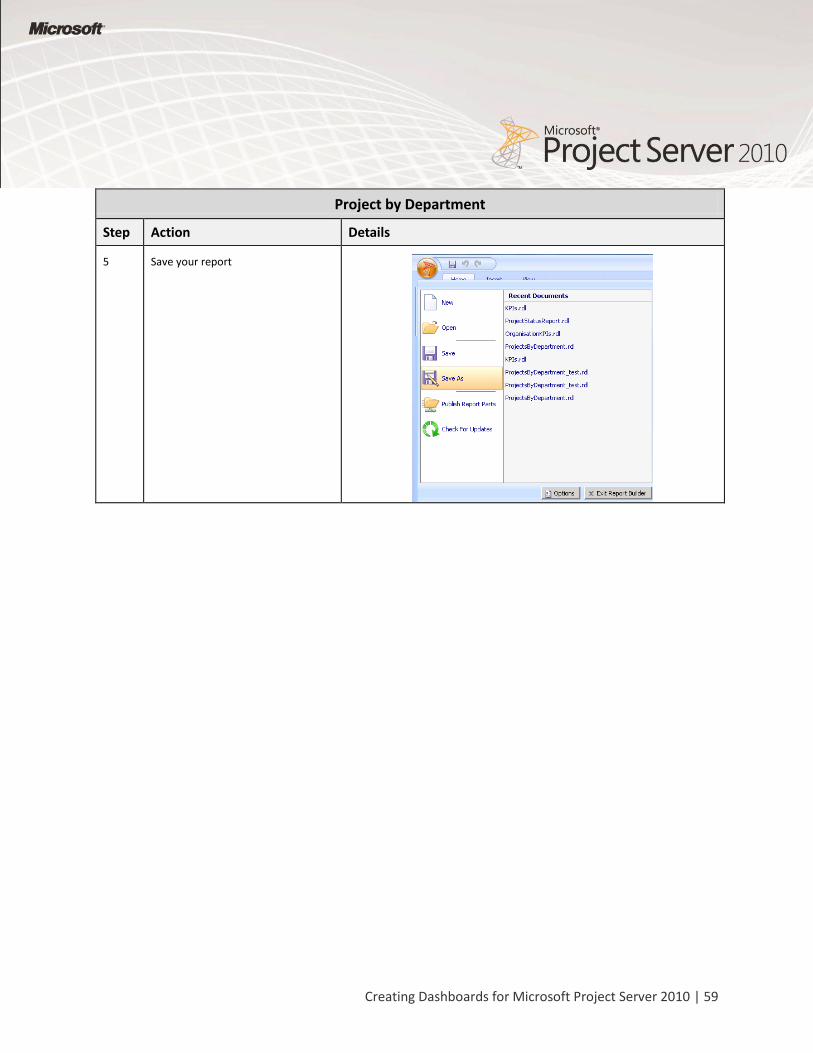
Project by Department
Step Action Details
5 Save your report
60 | Creating Dashboards by using PerformancePoint Services
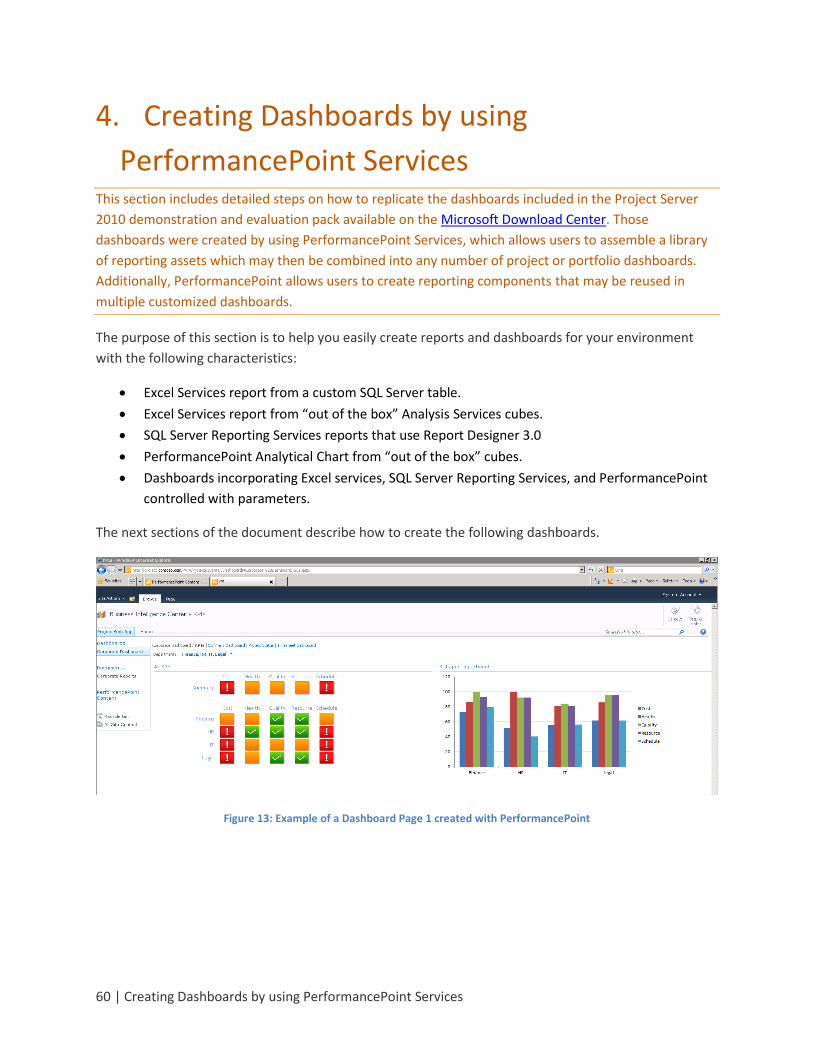
4. Creating Dashboards by using
PerformancePoint Services This section includes detailed steps on how to replicate the dashboards included in the Project Server
2010 demonstration and evaluation pack available on the Microsoft Download Center. Those
dashboards were created by using PerformancePoint Services, which allows users to assemble a library
of reporting assets which may then be combined into any number of project or portfolio dashboards.
Additionally, PerformancePoint allows users to create reporting components that may be reused in
multiple customized dashboards.
The purpose of this section is to help you easily create reports and dashboards for your environment
with the following characteristics:
Excel Services report from a custom SQL Server table.
Excel Services report from “out of the box” Analysis Services cubes.
SQL Server Reporting Services reports that use Report Designer 3.0
PerformancePoint Analytical Chart from “out of the box” cubes.
Dashboards incorporating Excel services, SQL Server Reporting Services, and PerformancePoint
controlled with parameters.
The next sections of the document describe how to create the following dashboards.
Figure 13: Example of a Dashboard Page 1 created with PerformancePoint
Creating Dashboards for Microsoft Project Server 2010 | 61
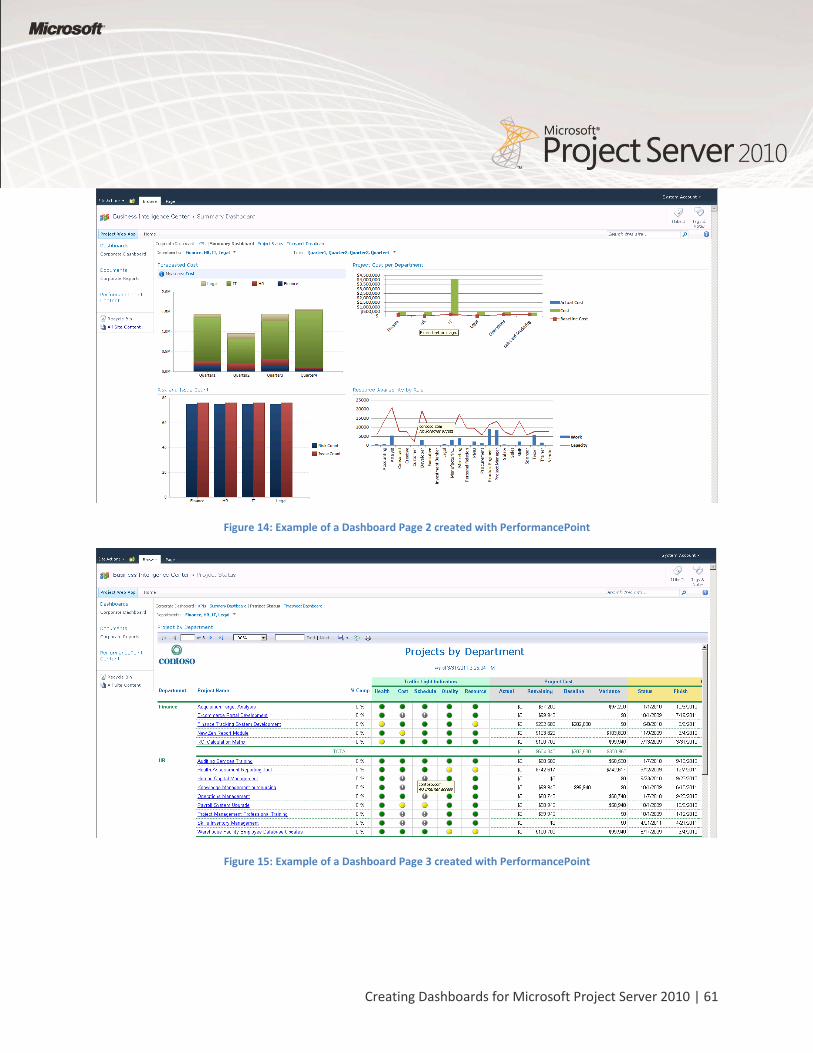
Figure 14: Example of a Dashboard Page 2 created with PerformancePoint
Figure 15: Example of a Dashboard Page 3 created with PerformancePoint
62 | Creating Dashboards by using PerformancePoint Services
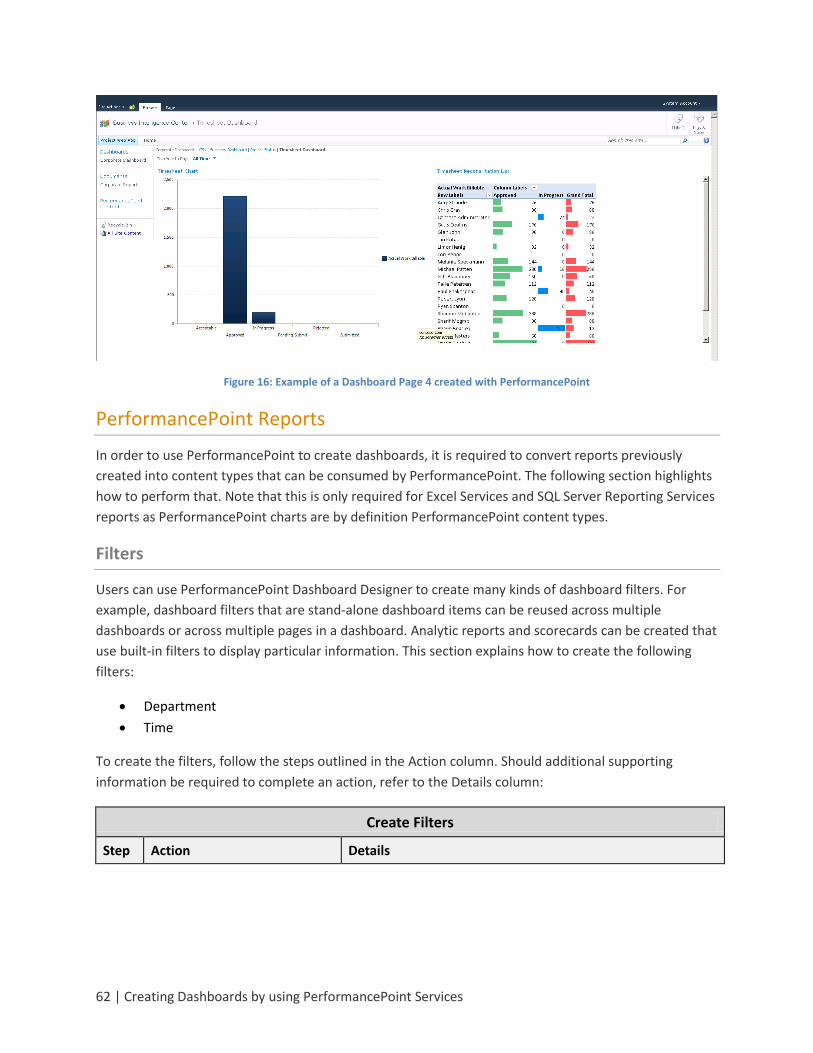
Figure 16: Example of a Dashboard Page 4 created with PerformancePoint
PerformancePoint Reports
In order to use PerformancePoint to create dashboards, it is required to convert reports previously
created into content types that can be consumed by PerformancePoint. The following section highlights
how to perform that. Note that this is only required for Excel Services and SQL Server Reporting Services
reports as PerformancePoint charts are by definition PerformancePoint content types.
Filters
Users can use PerformancePoint Dashboard Designer to create many kinds of dashboard filters. For
example, dashboard filters that are stand-alone dashboard items can be reused across multiple
dashboards or across multiple pages in a dashboard. Analytic reports and scorecards can be created that
use built-in filters to display particular information. This section explains how to create the following
filters:
Department
Time
To create the filters, follow the steps outlined in the Action column. Should additional supporting
information be required to complete an action, refer to the Details column:
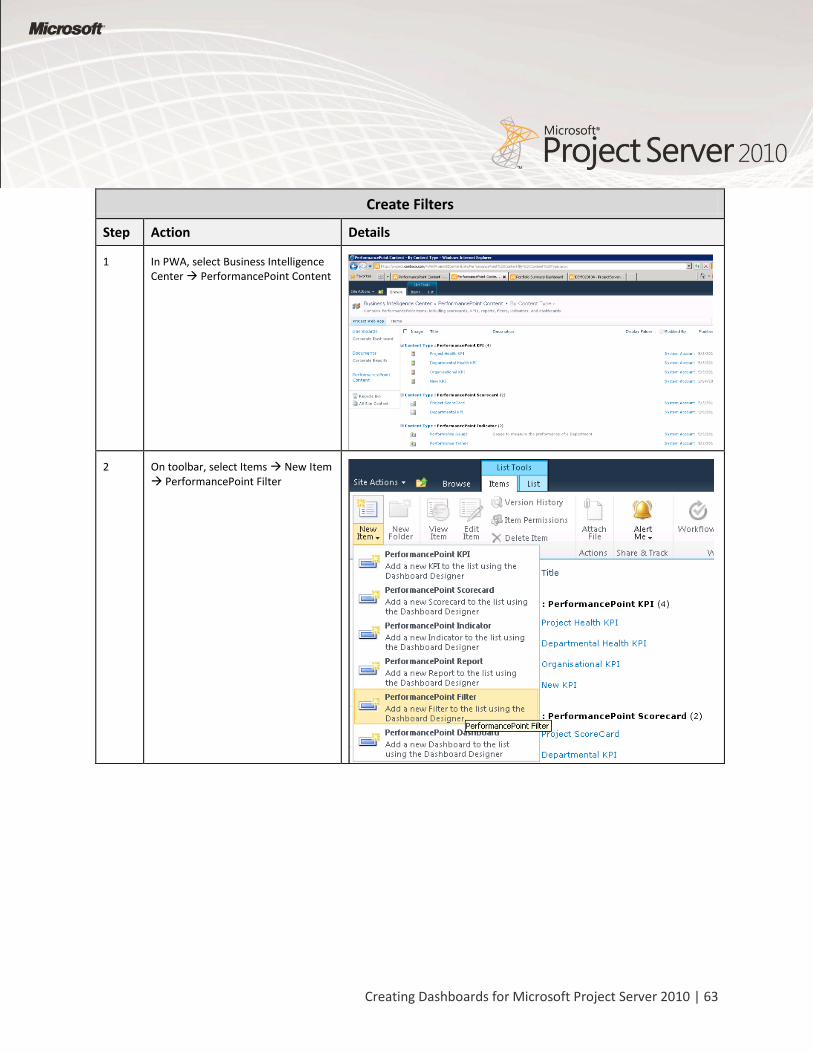
Create Filters
Step Action Details
Creating Dashboards for Microsoft Project Server 2010 | 63
Create Filters
Step Action Details
1 In PWA, select Business Intelligence Center PerformancePoint Content
2 On toolbar, select Items New Item PerformancePoint Filter
64 | Creating Dashboards by using PerformancePoint Services
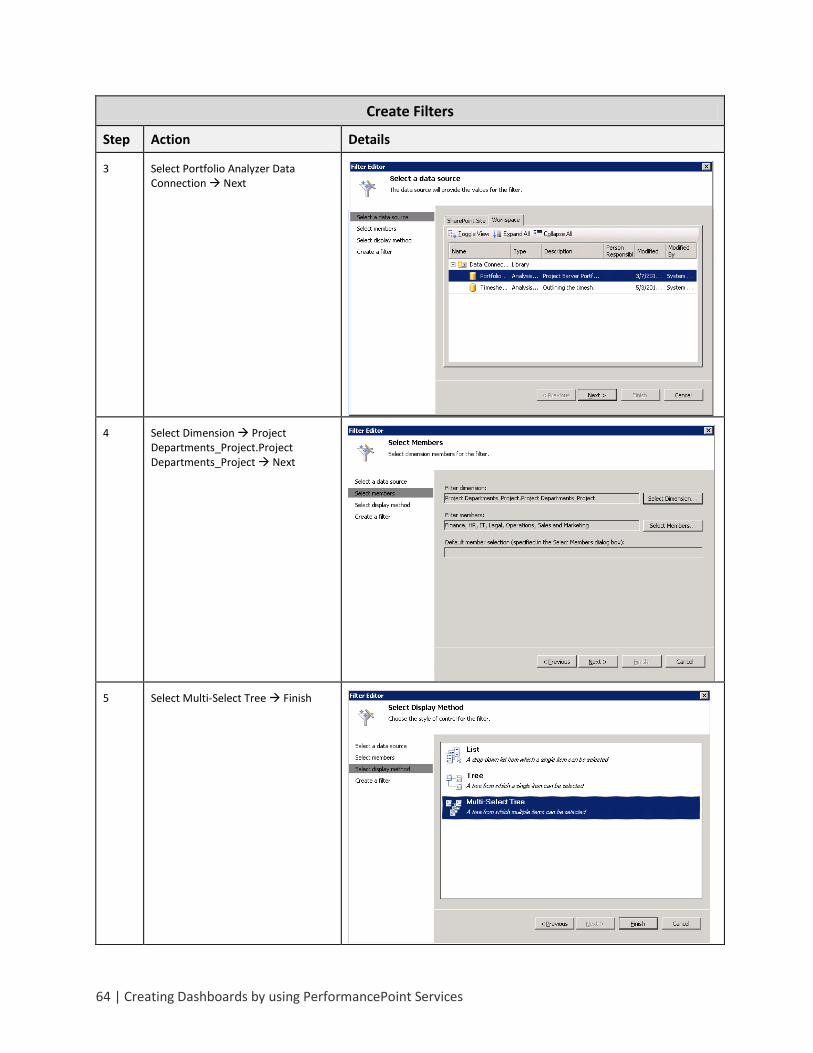
Create Filters
Step Action Details
3 Select Portfolio Analyzer Data Connection Next
4 Select Dimension Project Departments_Project.Project Departments_Project Next
5 Select Multi-Select Tree Finish
Creating Dashboards for Microsoft Project Server 2010 | 65
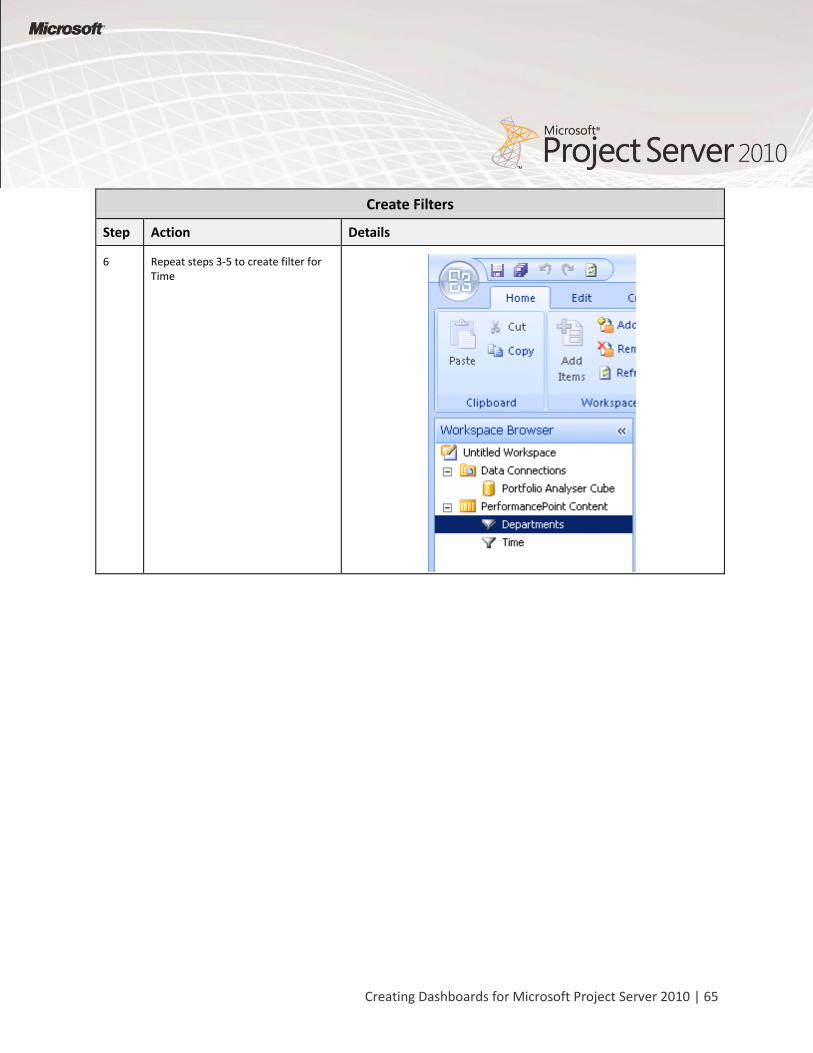
Create Filters
Step Action Details
6 Repeat steps 3-5 to create filter for Time
66 | Creating Dashboards by using PerformancePoint Services
Excel Services Reports
By using PerformancePoint Dashboard Designer, you can create Excel Services reports for your
dashboards. An Excel Services report is a Microsoft Excel workbook that was published to Microsoft
SharePoint Server 2010 by using Excel Services. Most Excel Services reports contain one or more charts
and tables. When you add an Excel Services report to a PerformancePoint dashboard, you reuse an
existing report that can contain views, such as PivotTable reports and PivotChart reports, which you
cannot create by using Dashboard Designer. For more information, see Create an Excel Services Report
by using Dashboard Designer.
This section of the document highlights how to create PerformancePoint reports for the following Excel
Services reports:
KPI Department per %
Project Cost per Department
Resource Availability by Role
Timesheet Reconciliation List
To create the reports, follow the steps outlined in the Action column. Should additional supporting
information be required to complete an action, refer to the Details column:
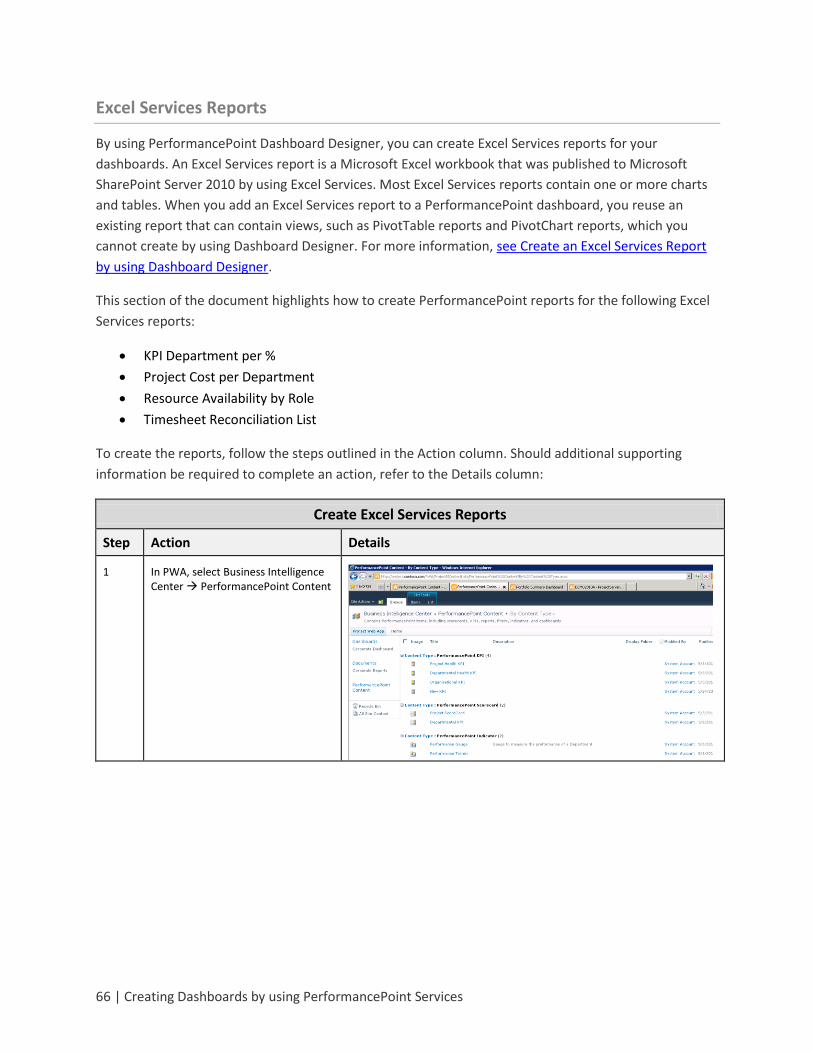
Create Excel Services Reports
Step Action Details
1 In PWA, select Business Intelligence Center PerformancePoint Content
Creating Dashboards for Microsoft Project Server 2010 | 67
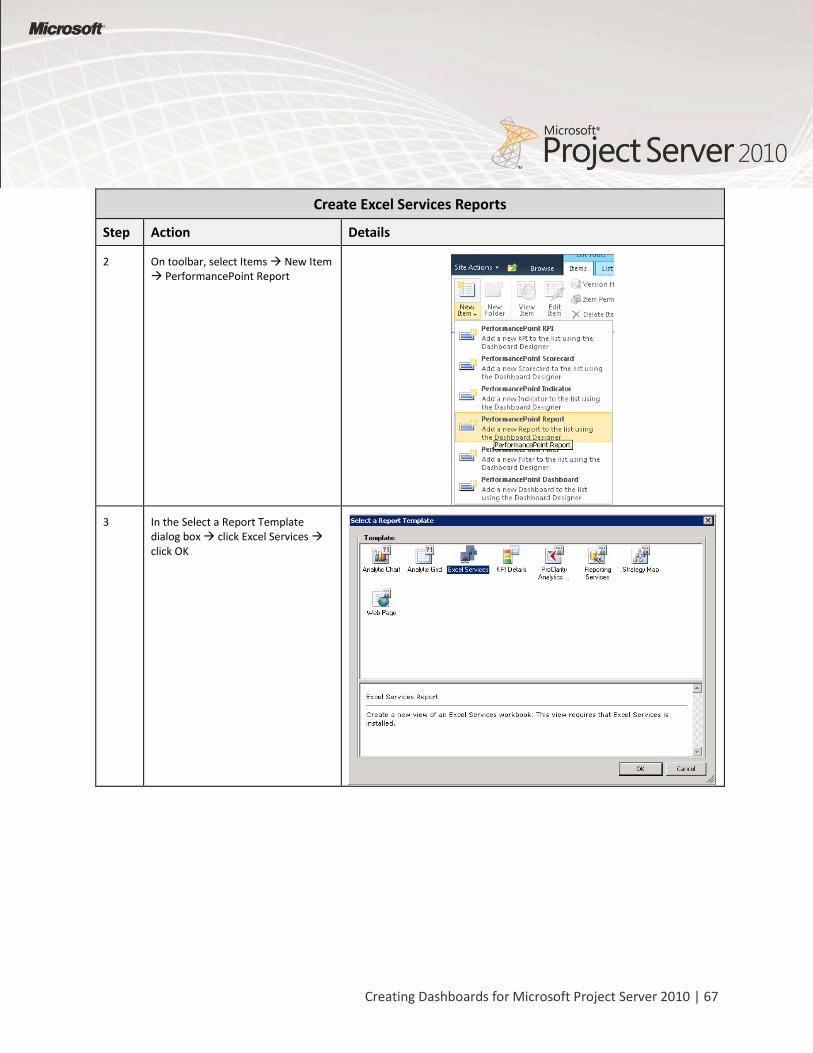
Create Excel Services Reports
Step Action Details
2 On toolbar, select Items New Item PerformancePoint Report
3 In the Select a Report Template dialog box click Excel Services click OK
68 | Creating Dashboards by using PerformancePoint Services
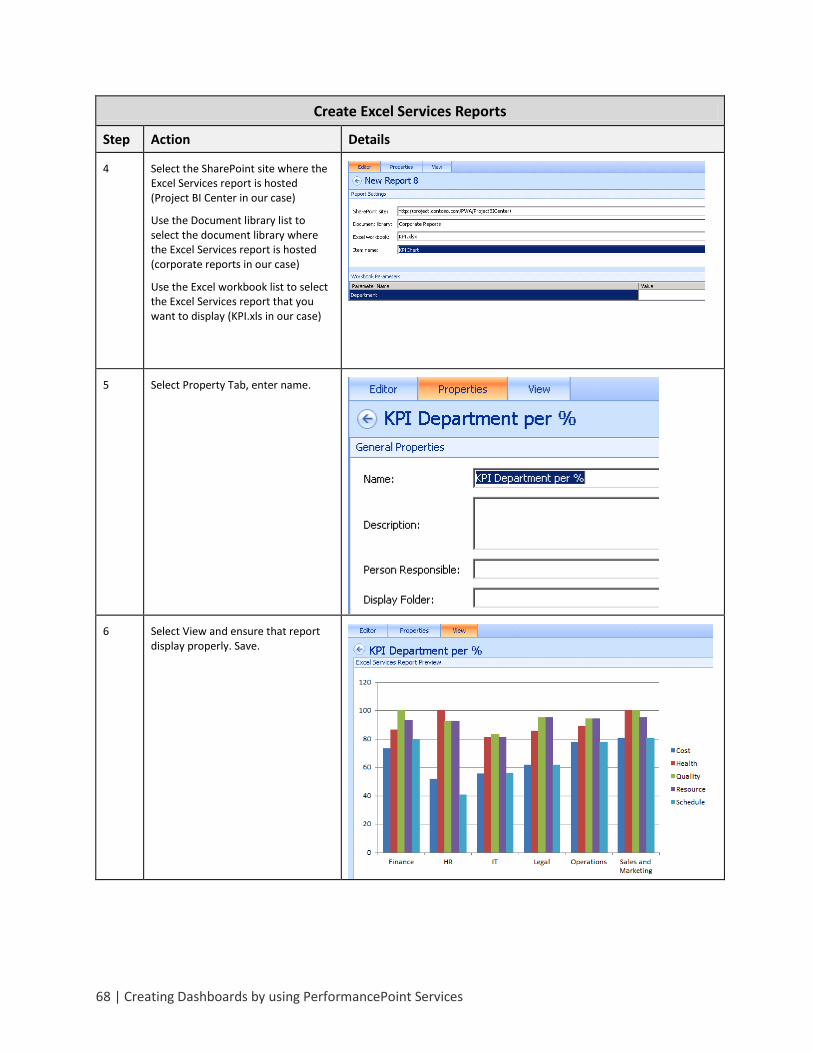
Create Excel Services Reports
Step Action Details
4 Select the SharePoint site where the Excel Services report is hosted (Project BI Center in our case)
Use the Document library list to select the document library where the Excel Services report is hosted (corporate reports in our case)
Use the Excel workbook list to select the Excel Services report that you want to display (KPI.xls in our case)
5 Select Property Tab, enter name.
6 Select View and ensure that report display properly. Save.
Creating Dashboards for Microsoft Project Server 2010 | 69
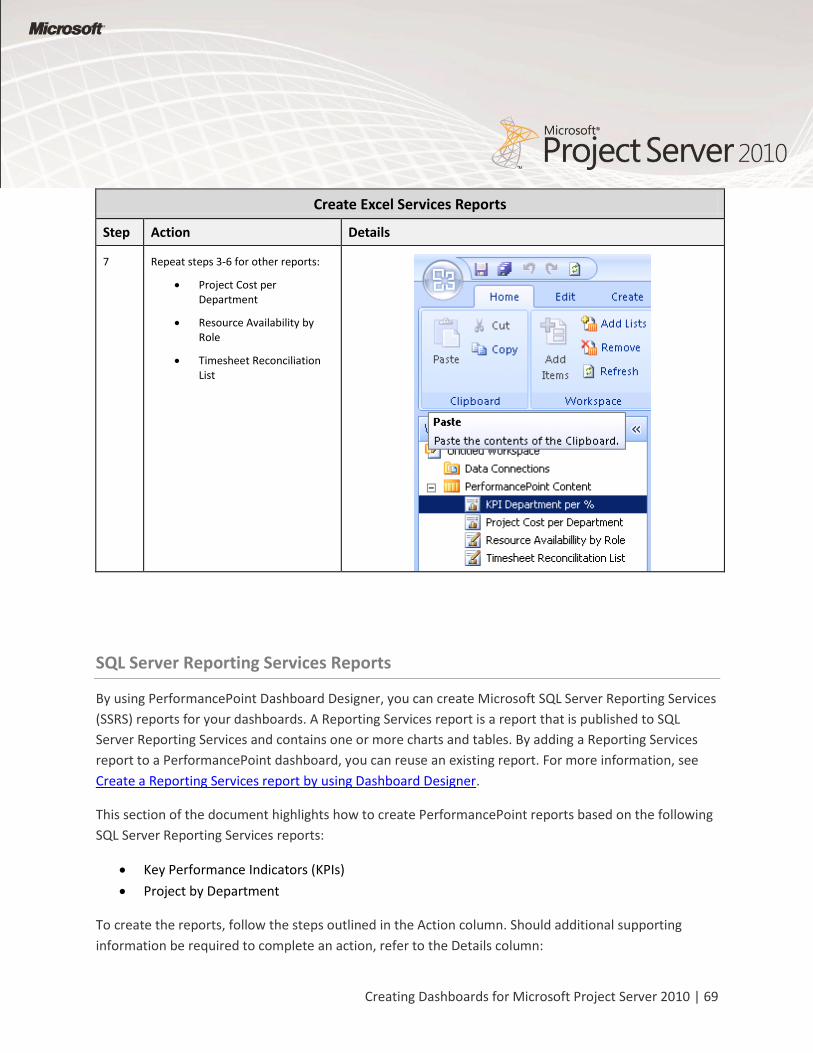
Create Excel Services Reports
Step Action Details
7 Repeat steps 3-6 for other reports:
Project Cost per Department
Resource Availability by Role
Timesheet Reconciliation List
SQL Server Reporting Services Reports
By using PerformancePoint Dashboard Designer, you can create Microsoft SQL Server Reporting Services
(SSRS) reports for your dashboards. A Reporting Services report is a report that is published to SQL
Server Reporting Services and contains one or more charts and tables. By adding a Reporting Services
report to a PerformancePoint dashboard, you can reuse an existing report. For more information, see
Create a Reporting Services report by using Dashboard Designer.
This section of the document highlights how to create PerformancePoint reports based on the following
SQL Server Reporting Services reports:
Key Performance Indicators (KPIs)
Project by Department
To create the reports, follow the steps outlined in the Action column. Should additional supporting
information be required to complete an action, refer to the Details column:
70 | Creating Dashboards by using PerformancePoint Services
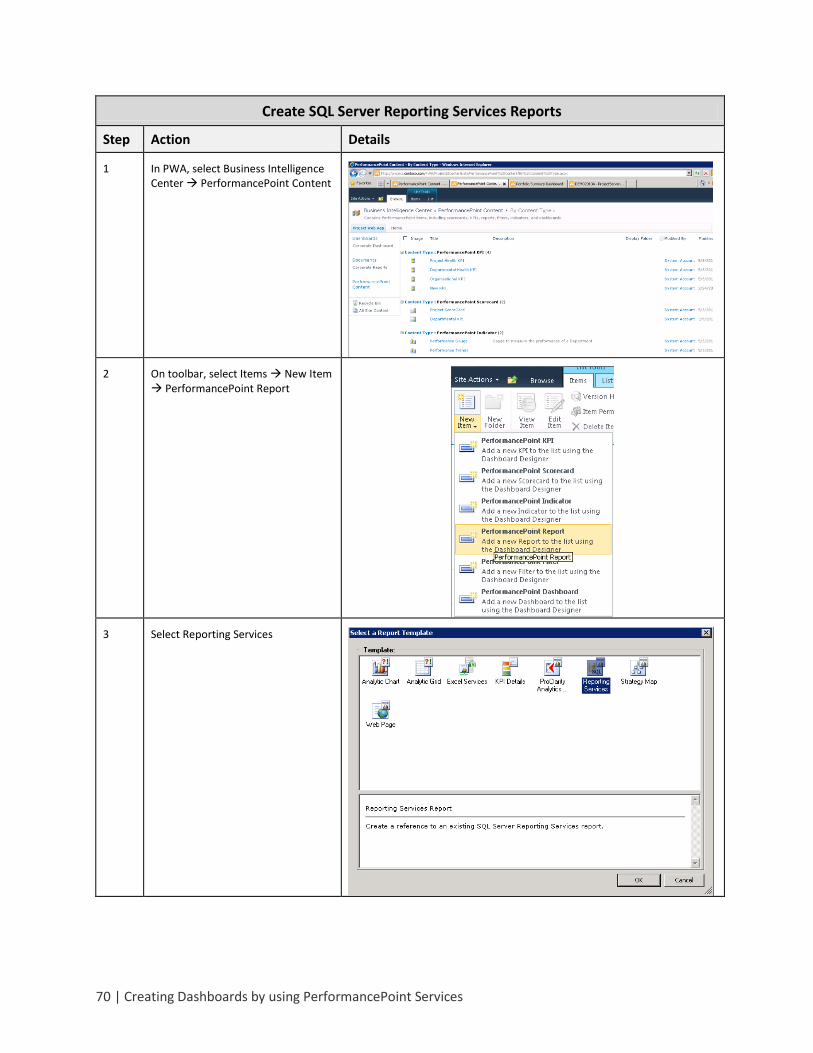
Create SQL Server Reporting Services Reports
Step Action Details
1 In PWA, select Business Intelligence Center PerformancePoint Content
2 On toolbar, select Items New Item PerformancePoint Report
3 Select Reporting Services
Creating Dashboards for Microsoft Project Server 2010 | 71
Create SQL Server Reporting Services Reports
Step Action Details
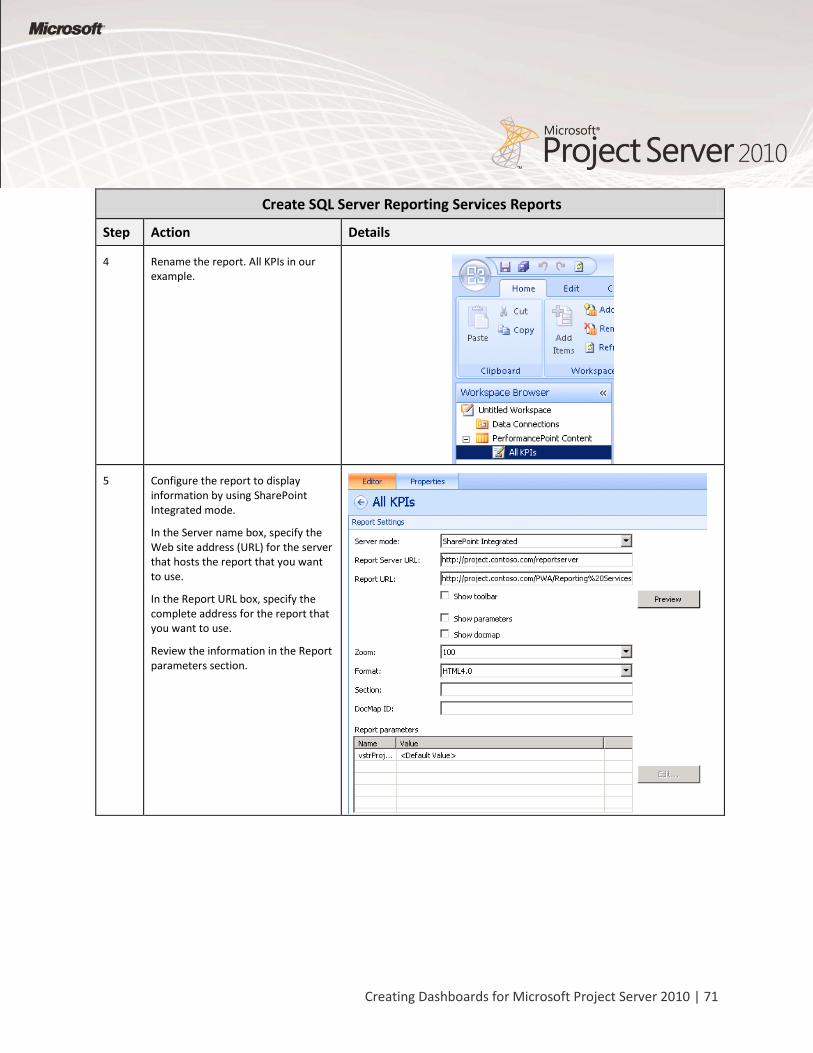
4 Rename the report. All KPIs in our example.
5 Configure the report to display information by using SharePoint Integrated mode.
In the Server name box, specify the Web site address (URL) for the server that hosts the report that you want to use.
In the Report URL box, specify the complete address for the report that you want to use.
Review the information in the Report parameters section.
72 | Creating Dashboards by using PerformancePoint Services
Create SQL Server Reporting Services Reports
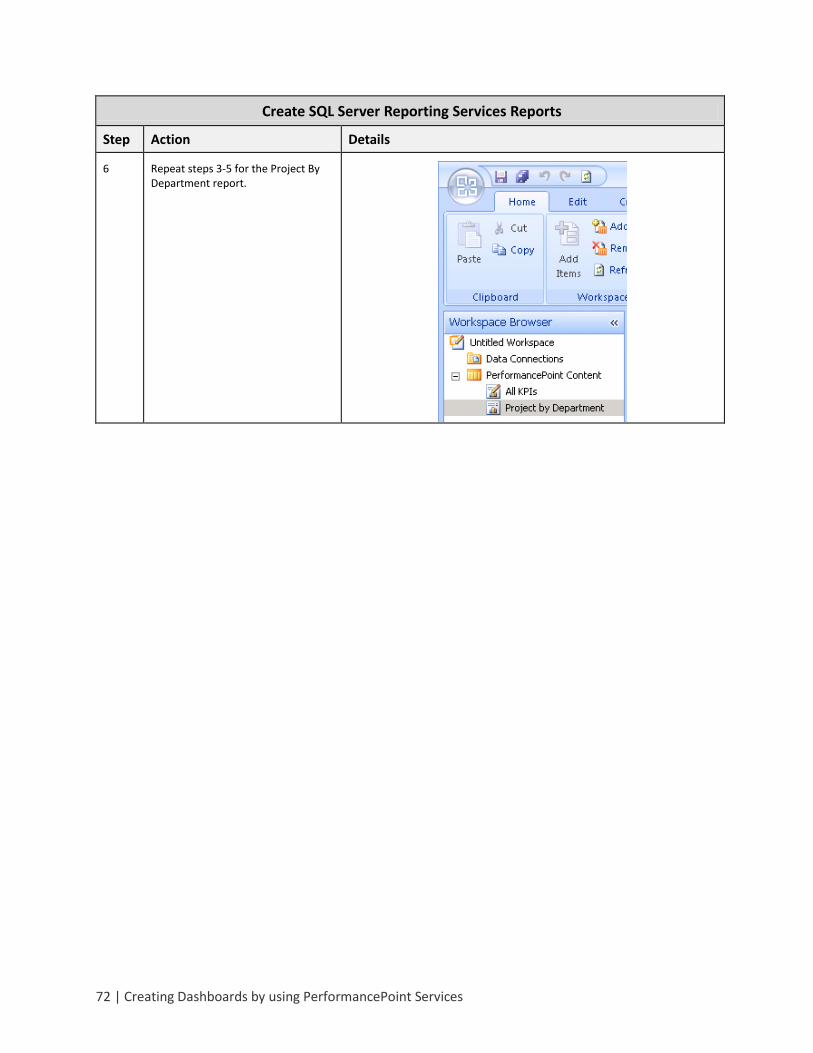
Step Action Details
6 Repeat steps 3-5 for the Project By Department report.
Creating Dashboards for Microsoft Project Server 2010 | 73
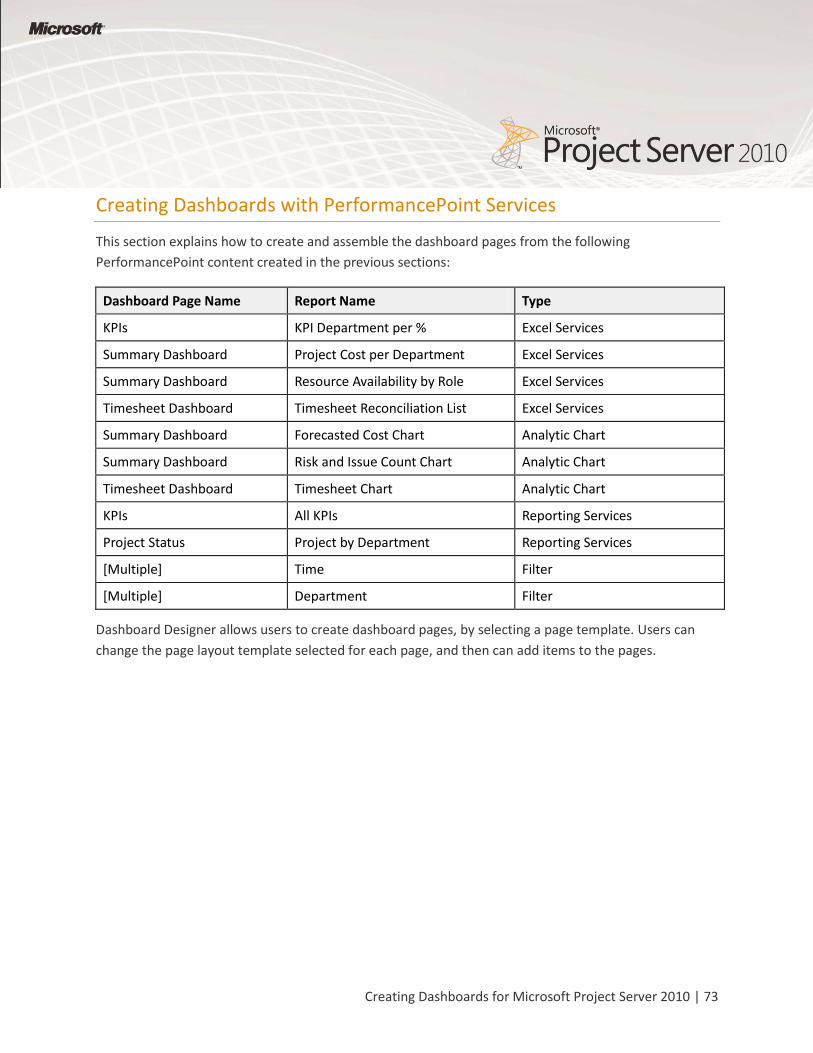
Creating Dashboards with PerformancePoint Services
This section explains how to create and assemble the dashboard pages from the following
PerformancePoint content created in the previous sections:
Dashboard Page Name Report Name Type
KPIs KPI Department per % Excel Services
Summary Dashboard Project Cost per Department Excel Services
Summary Dashboard Resource Availability by Role Excel Services
Timesheet Dashboard Timesheet Reconciliation List Excel Services
Summary Dashboard Forecasted Cost Chart Analytic Chart
Summary Dashboard Risk and Issue Count Chart Analytic Chart
Timesheet Dashboard Timesheet Chart Analytic Chart
KPIs All KPIs Reporting Services
Project Status Project by Department Reporting Services
[Multiple] Time Filter
[Multiple] Department Filter
Dashboard Designer allows users to create dashboard pages, by selecting a page template. Users can
change the page layout template selected for each page, and then can add items to the pages.
74 | Creating Dashboards by using PerformancePoint Services
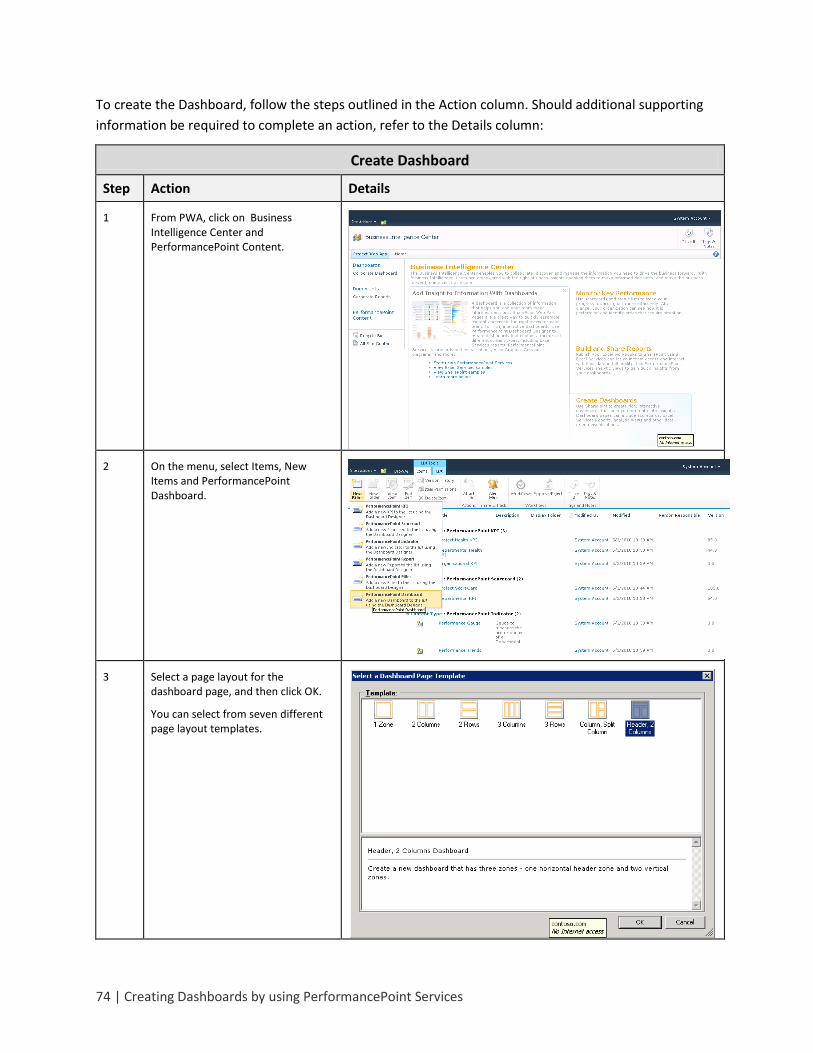
To create the Dashboard, follow the steps outlined in the Action column. Should additional supporting
information be required to complete an action, refer to the Details column:
Create Dashboard
Step Action Details
1 From PWA, click on Business Intelligence Center and PerformancePoint Content.
2 On the menu, select Items, New Items and PerformancePoint Dashboard.
3 Select a page layout for the dashboard page, and then click OK.
You can select from seven different page layout templates.
Creating Dashboards for Microsoft Project Server 2010 | 75
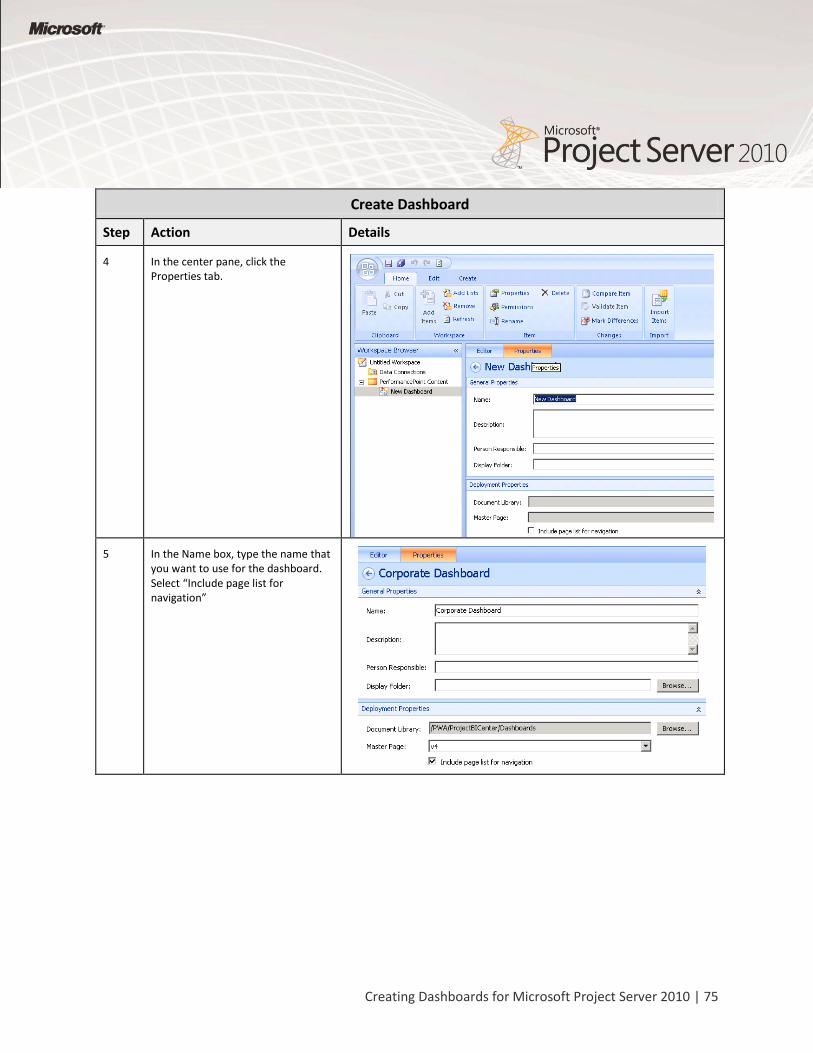
Create Dashboard
Step Action Details
4 In the center pane, click the Properties tab.
5 In the Name box, type the name that you want to use for the dashboard. Select “Include page list for navigation”
76 | Creating Dashboards by using PerformancePoint Services
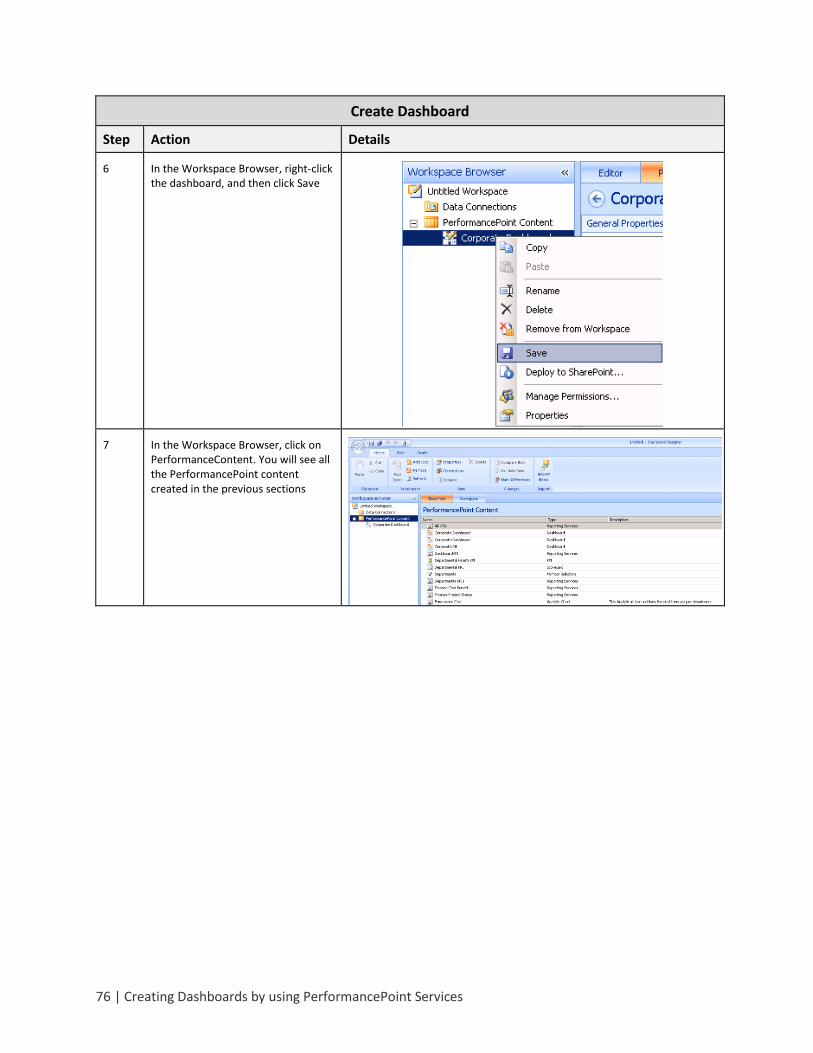
Create Dashboard
Step Action Details
6 In the Workspace Browser, right-click the dashboard, and then click Save
7 In the Workspace Browser, click on PerformanceContent. You will see all the PerformancePoint content created in the previous sections
Creating Dashboards for Microsoft Project Server 2010 | 77
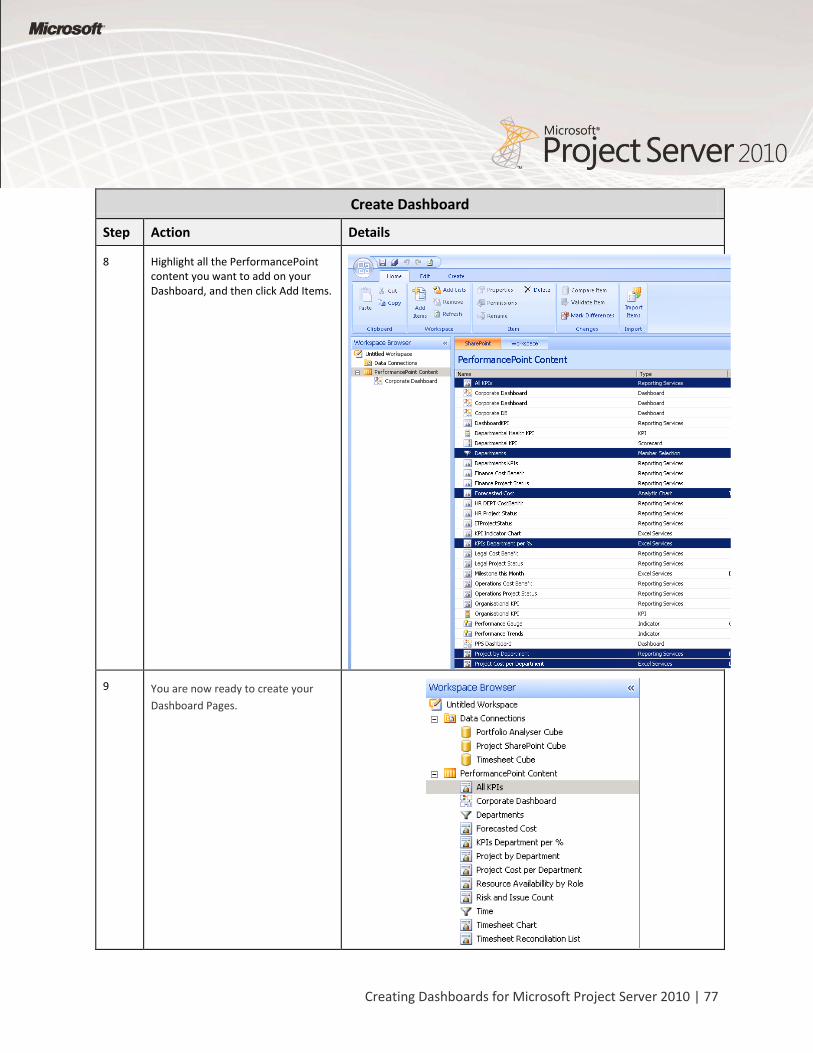
Create Dashboard
Step Action Details
8 Highlight all the PerformancePoint content you want to add on your Dashboard, and then click Add Items.
9 You are now ready to create your
Dashboard Pages.
78 | Creating Dashboards by using PerformancePoint Services
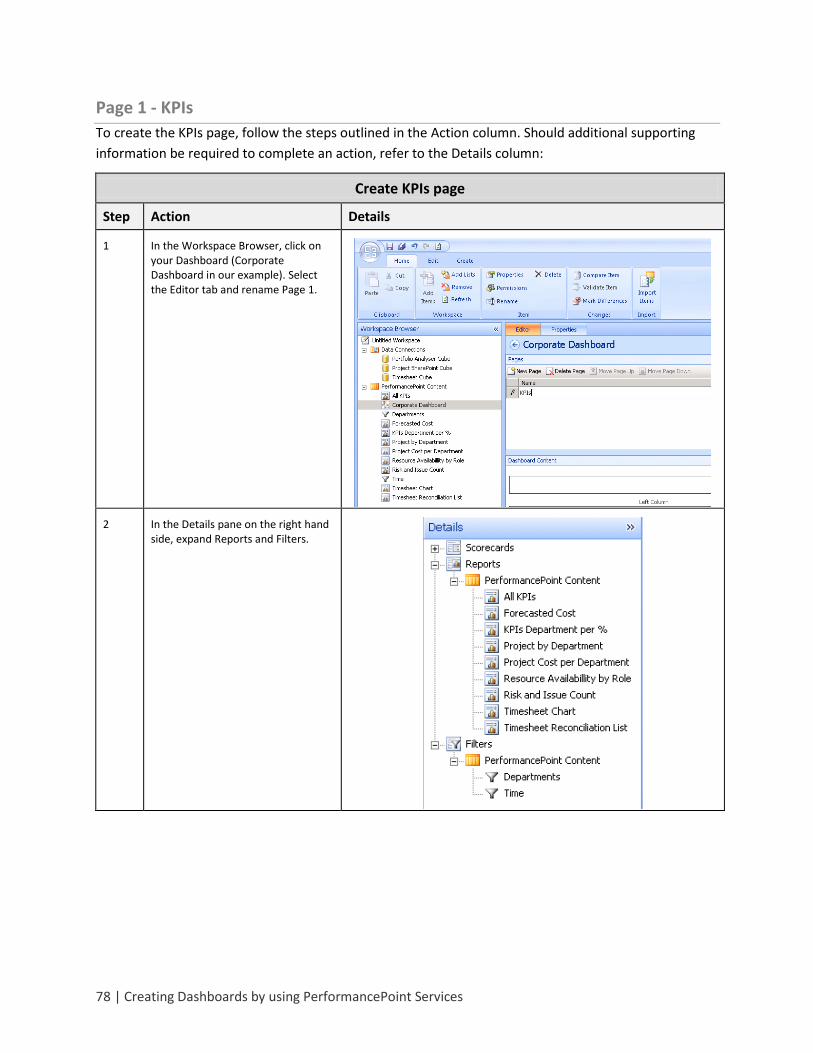
Page 1 - KPIs
To create the KPIs page, follow the steps outlined in the Action column. Should additional supporting
information be required to complete an action, refer to the Details column:
Create KPIs page
Step Action Details
1 In the Workspace Browser, click on your Dashboard (Corporate Dashboard in our example). Select the Editor tab and rename Page 1.
2 In the Details pane on the right hand side, expand Reports and Filters.
Creating Dashboards for Microsoft Project Server 2010 | 79
Create KPIs page
Step Action Details
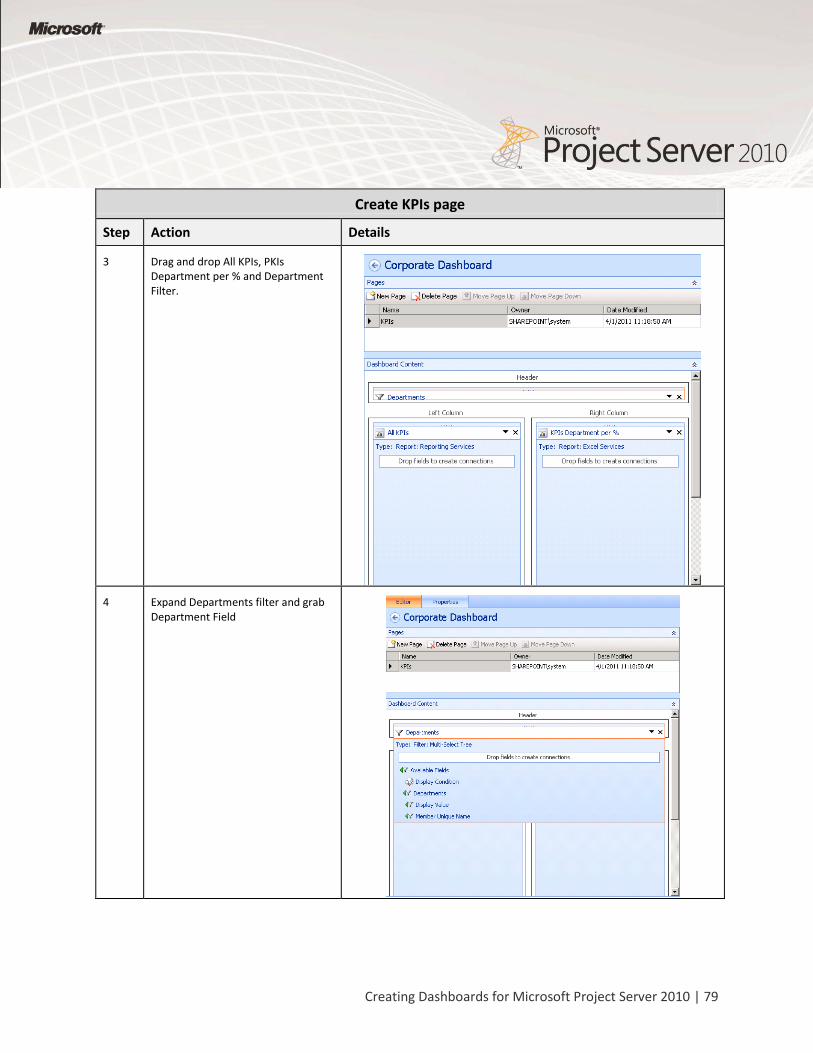
3 Drag and drop All KPIs, PKIs Department per % and Department Filter.
4 Expand Departments filter and grab Department Field
80 | Creating Dashboards by using PerformancePoint Services
Create KPIs page
Step Action Details
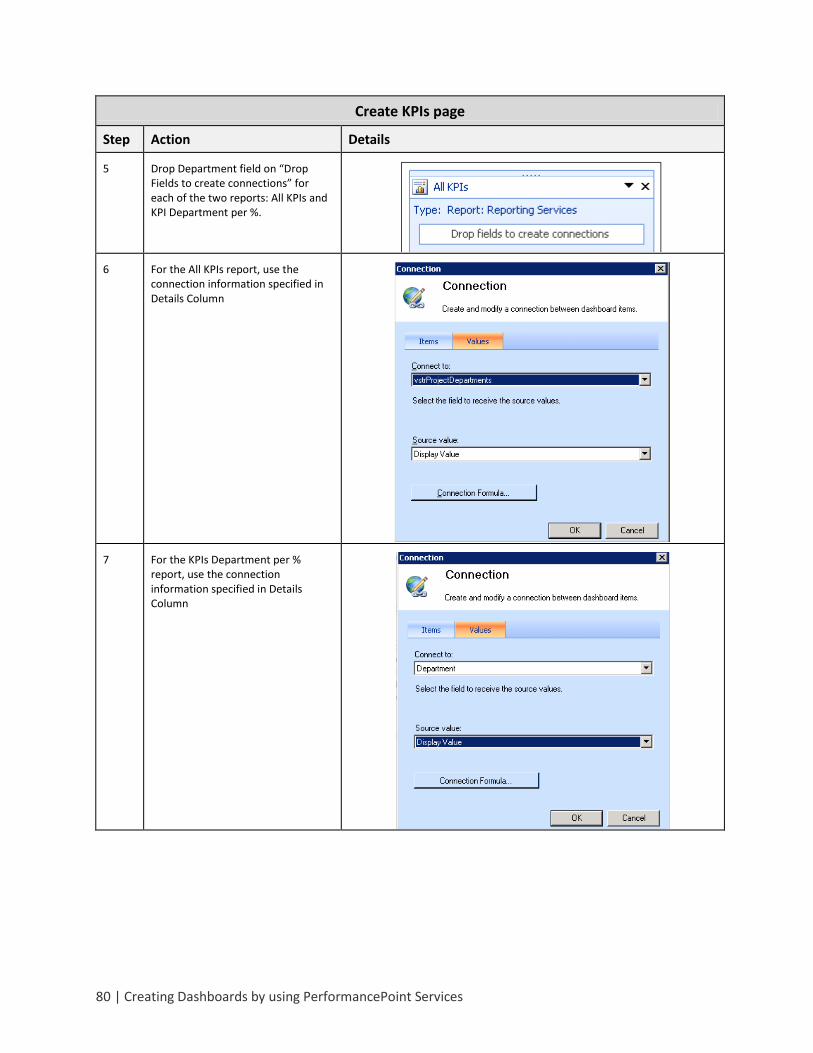
5 Drop Department field on “Drop Fields to create connections” for each of the two reports: All KPIs and KPI Department per %.
6 For the All KPIs report, use the connection information specified in Details Column
7 For the KPIs Department per % report, use the connection information specified in Details Column
Creating Dashboards for Microsoft Project Server 2010 | 81
Create KPIs page
Step Action Details
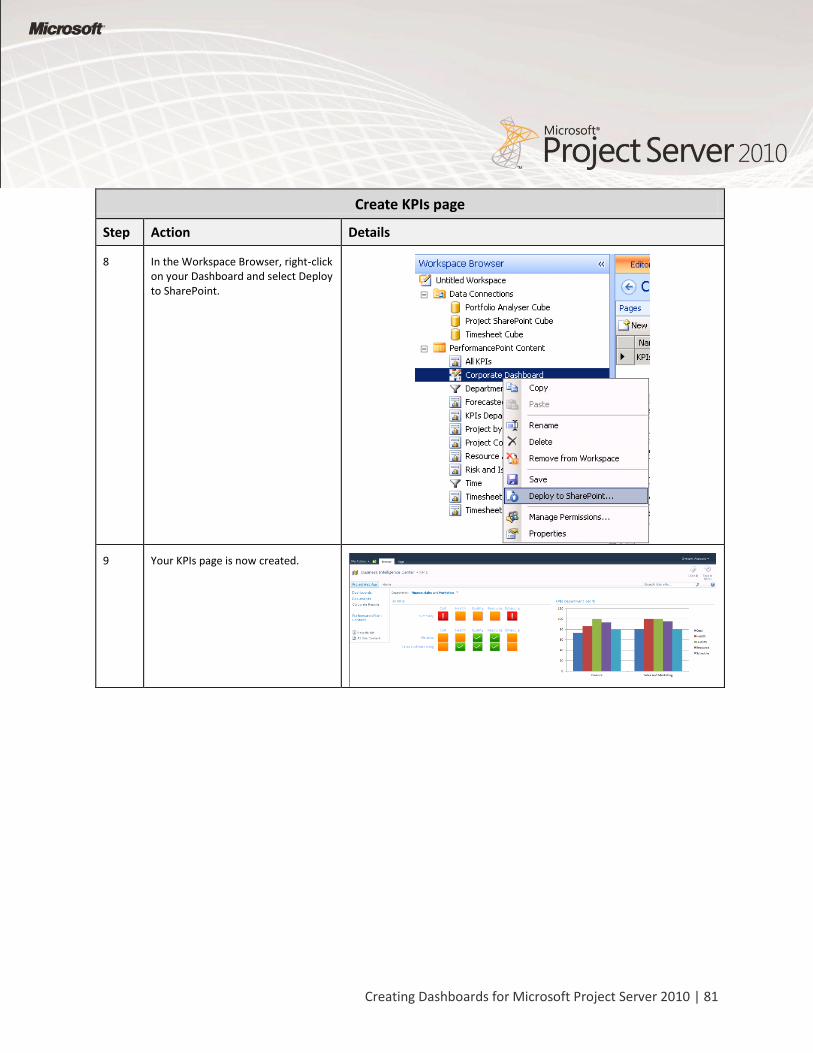
8 In the Workspace Browser, right-click on your Dashboard and select Deploy to SharePoint.
9 Your KPIs page is now created.
82 | Creating Dashboards by using PerformancePoint Services
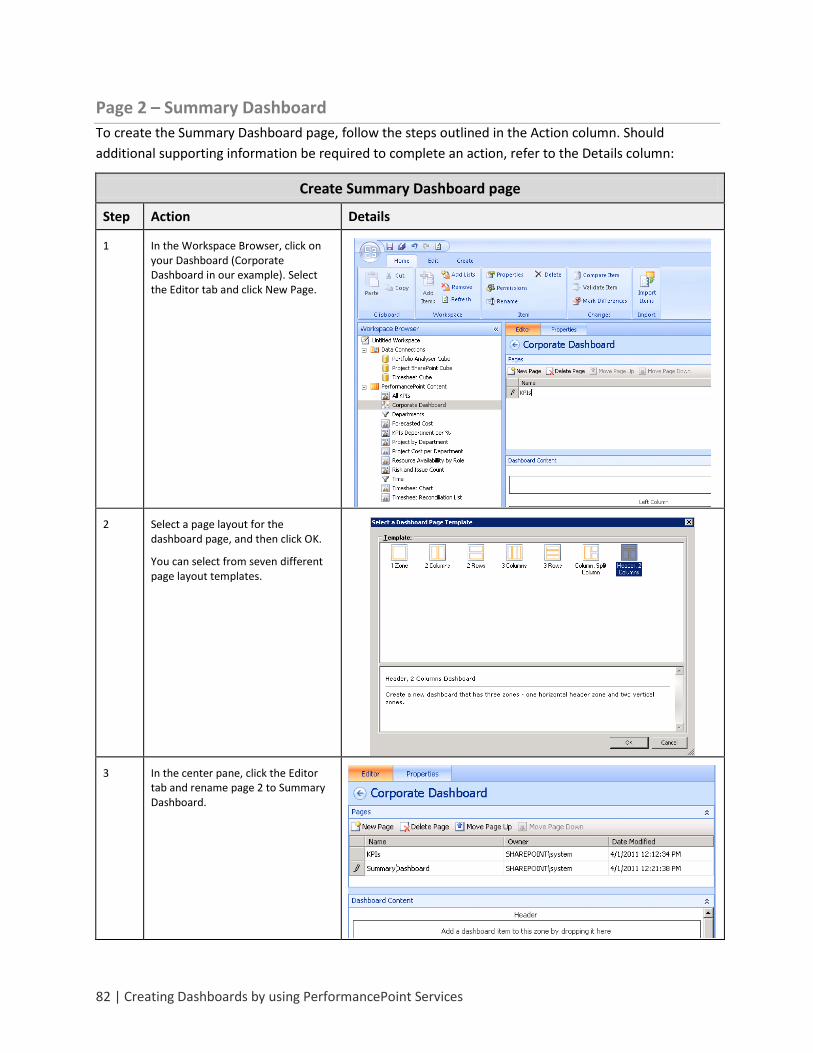
Page 2 – Summary Dashboard
To create the Summary Dashboard page, follow the steps outlined in the Action column. Should
additional supporting information be required to complete an action, refer to the Details column:
Create Summary Dashboard page
Step Action Details
1 In the Workspace Browser, click on your Dashboard (Corporate Dashboard in our example). Select the Editor tab and click New Page.
2 Select a page layout for the dashboard page, and then click OK.
You can select from seven different page layout templates.
3 In the center pane, click the Editor tab and rename page 2 to Summary Dashboard.
Creating Dashboards for Microsoft Project Server 2010 | 83
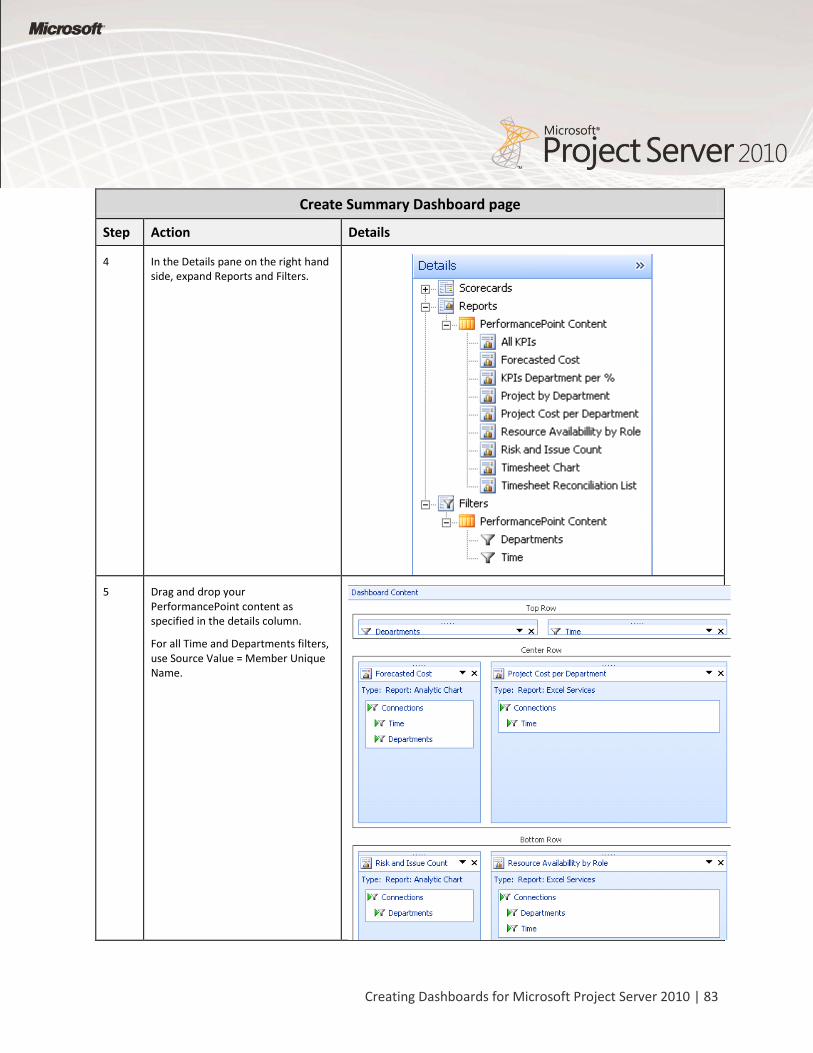
Create Summary Dashboard page
Step Action Details
4 In the Details pane on the right hand side, expand Reports and Filters.
5 Drag and drop your PerformancePoint content as specified in the details column.
For all Time and Departments filters, use Source Value = Member Unique Name.
84 | Creating Dashboards by using PerformancePoint Services
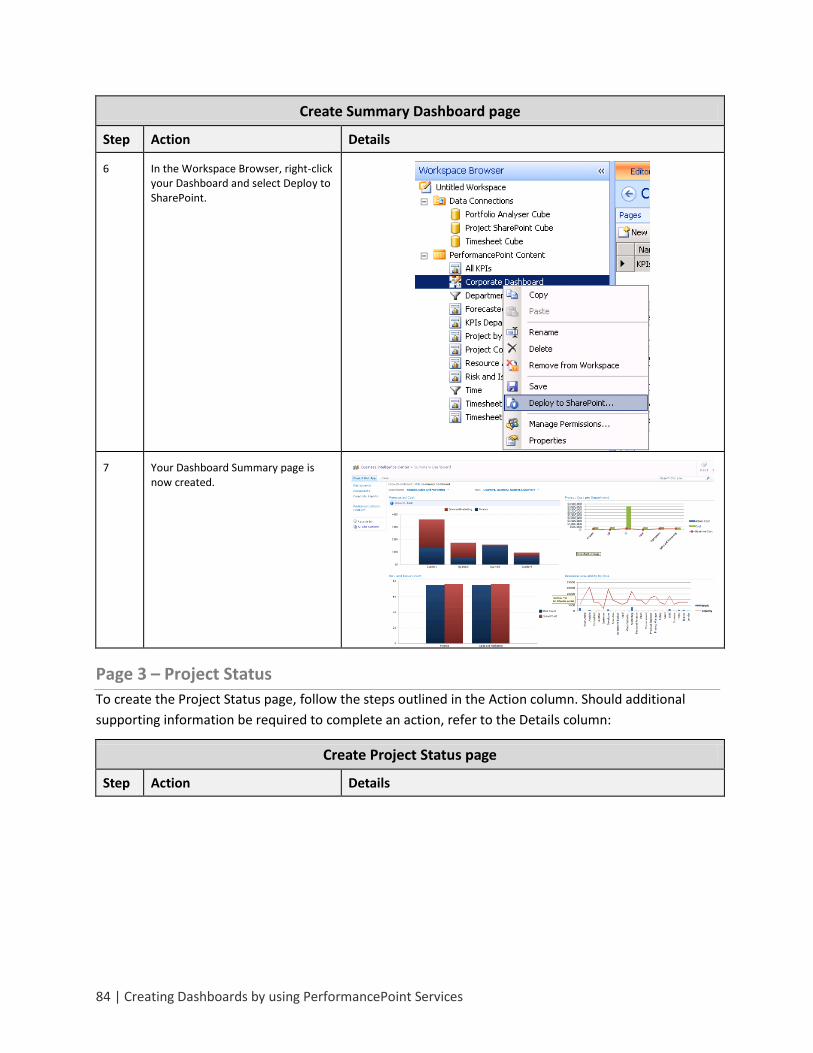
Create Summary Dashboard page
Step Action Details
6 In the Workspace Browser, right-click your Dashboard and select Deploy to SharePoint.
7 Your Dashboard Summary page is now created.
Page 3 – Project Status
To create the Project Status page, follow the steps outlined in the Action column. Should additional
supporting information be required to complete an action, refer to the Details column:
Create Project Status page
Step Action Details
Creating Dashboards for Microsoft Project Server 2010 | 85
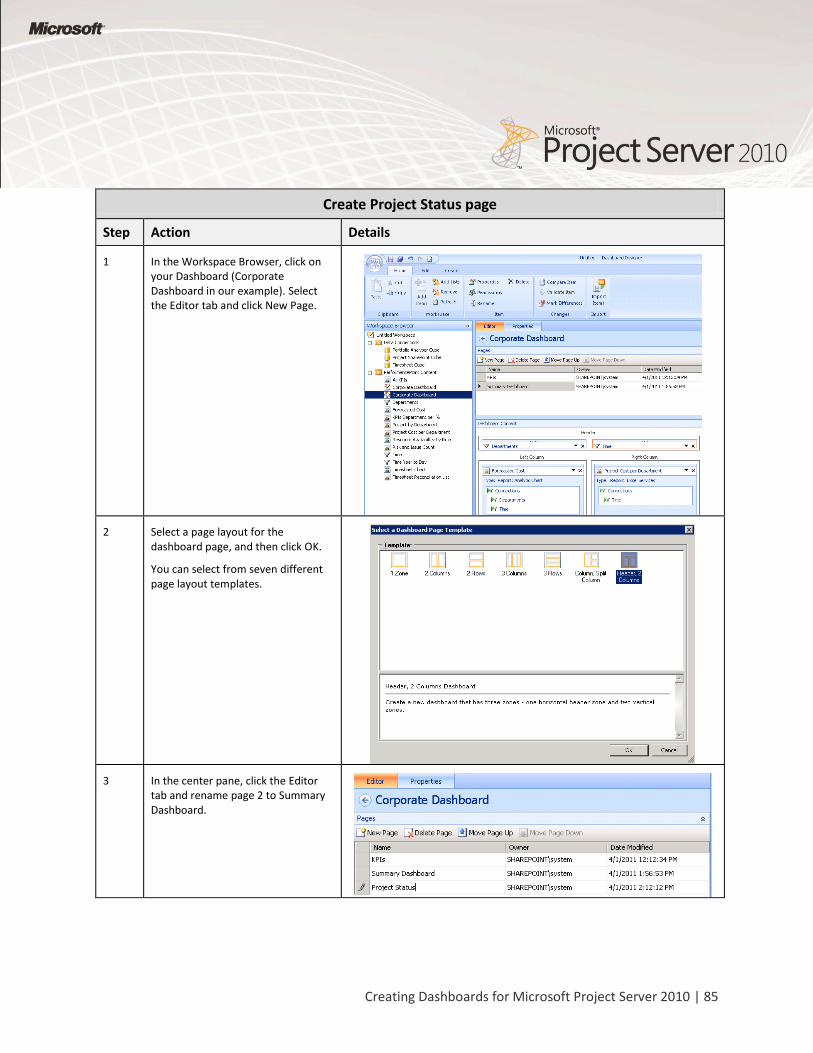
Create Project Status page
Step Action Details
1 In the Workspace Browser, click on your Dashboard (Corporate Dashboard in our example). Select the Editor tab and click New Page.
2 Select a page layout for the dashboard page, and then click OK.
You can select from seven different page layout templates.
3 In the center pane, click the Editor tab and rename page 2 to Summary Dashboard.
86 | Creating Dashboards by using PerformancePoint Services
Create Project Status page
Step Action Details
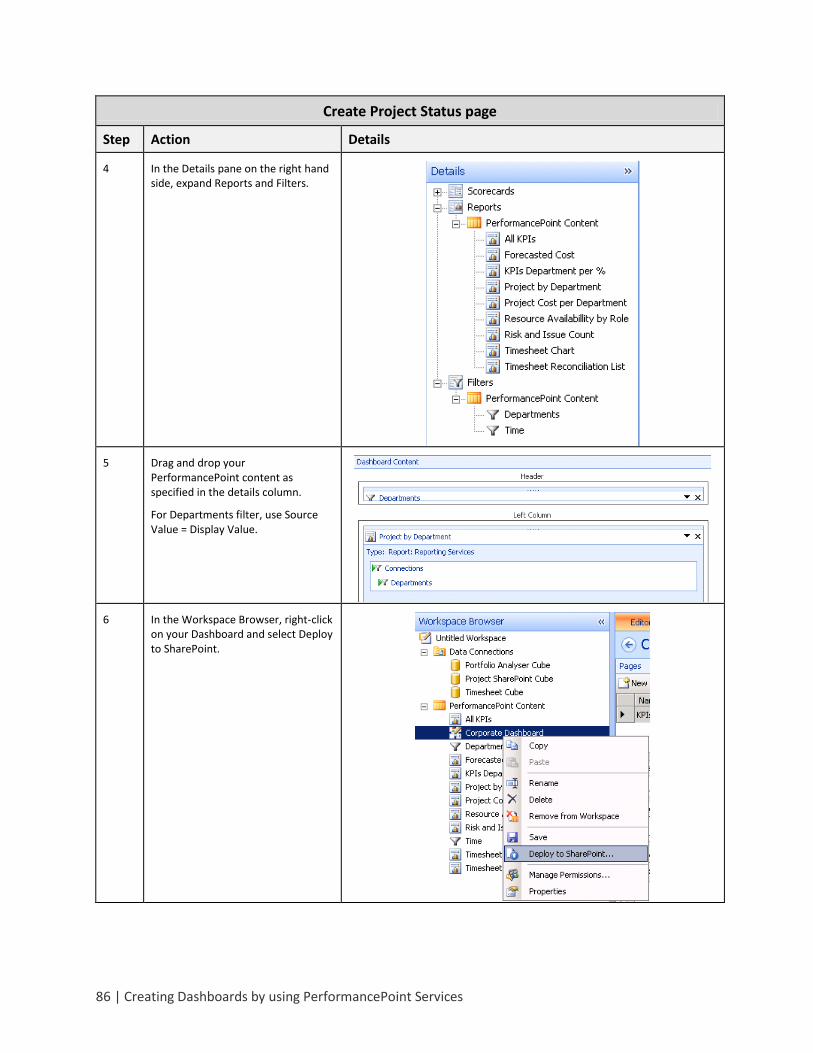
4 In the Details pane on the right hand side, expand Reports and Filters.
5 Drag and drop your PerformancePoint content as specified in the details column.
For Departments filter, use Source Value = Display Value.
6 In the Workspace Browser, right-click on your Dashboard and select Deploy to SharePoint.
Creating Dashboards for Microsoft Project Server 2010 | 87
Create Project Status page
Step Action Details
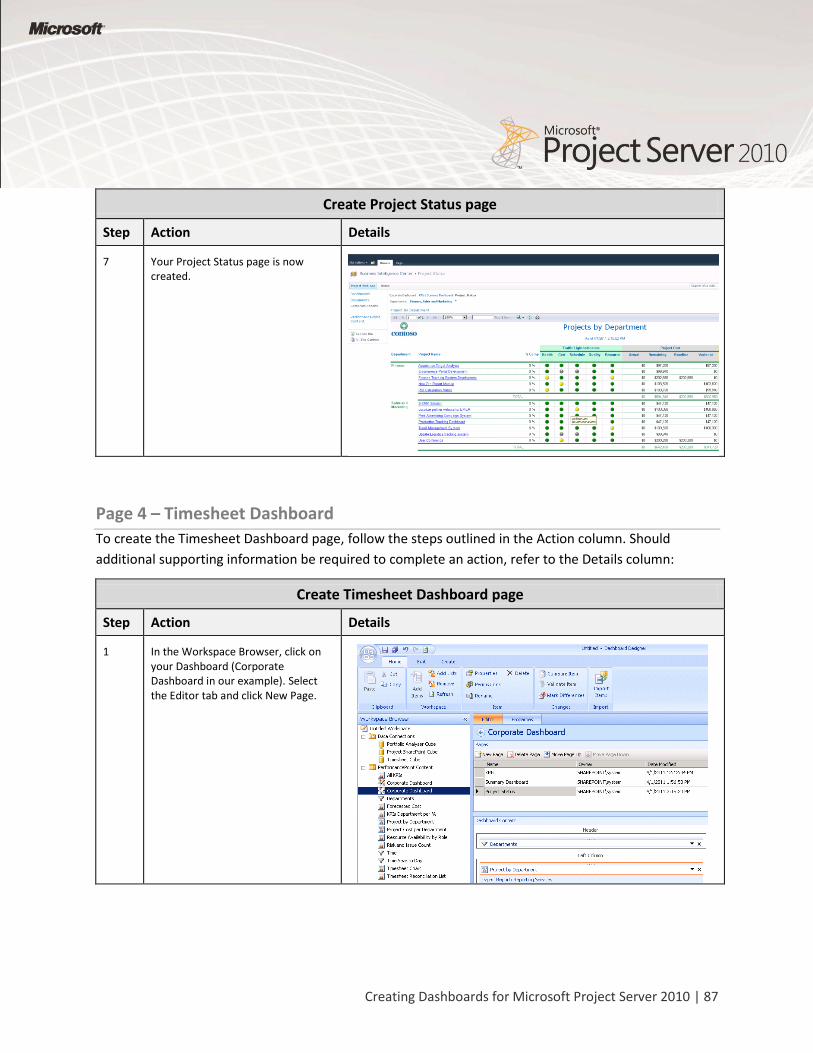
7 Your Project Status page is now created.
Page 4 – Timesheet Dashboard
To create the Timesheet Dashboard page, follow the steps outlined in the Action column. Should
additional supporting information be required to complete an action, refer to the Details column:
Create Timesheet Dashboard page
Step Action Details
1 In the Workspace Browser, click on your Dashboard (Corporate Dashboard in our example). Select the Editor tab and click New Page.
88 | Creating Dashboards by using PerformancePoint Services
Create Timesheet Dashboard page
Step Action Details
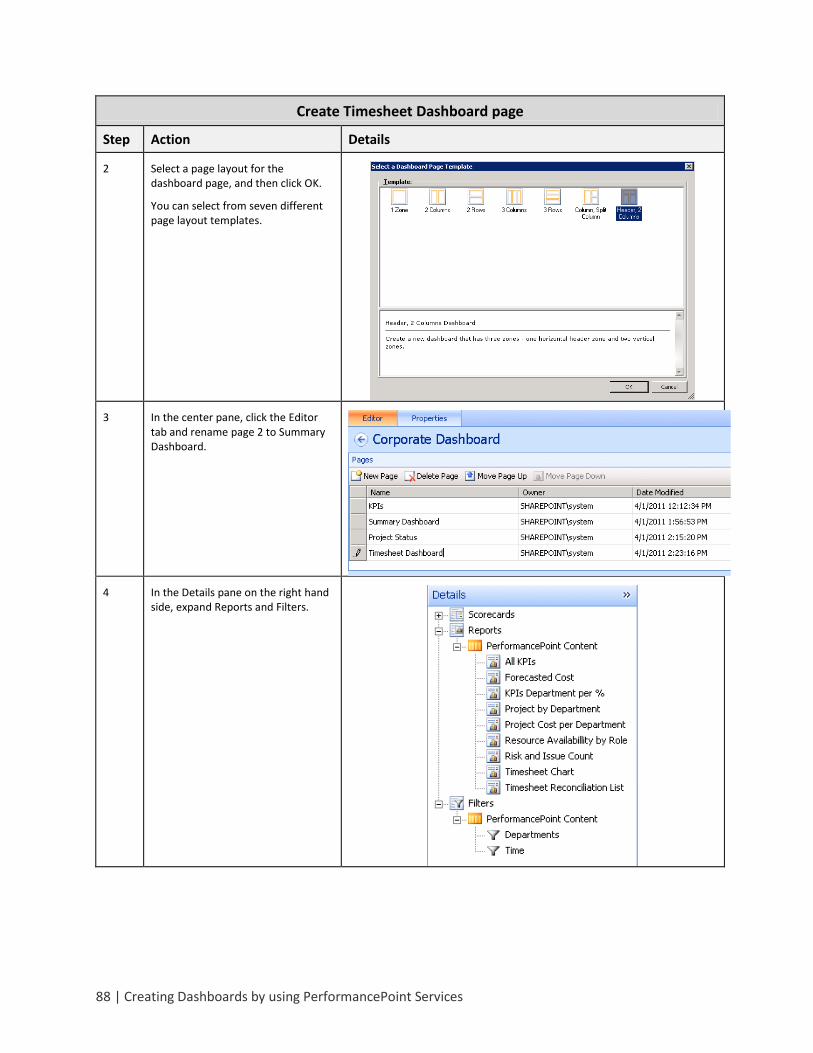
2 Select a page layout for the dashboard page, and then click OK.
You can select from seven different page layout templates.
3 In the center pane, click the Editor tab and rename page 2 to Summary Dashboard.
4 In the Details pane on the right hand side, expand Reports and Filters.
Creating Dashboards for Microsoft Project Server 2010 | 89
Create Timesheet Dashboard page
Step Action Details
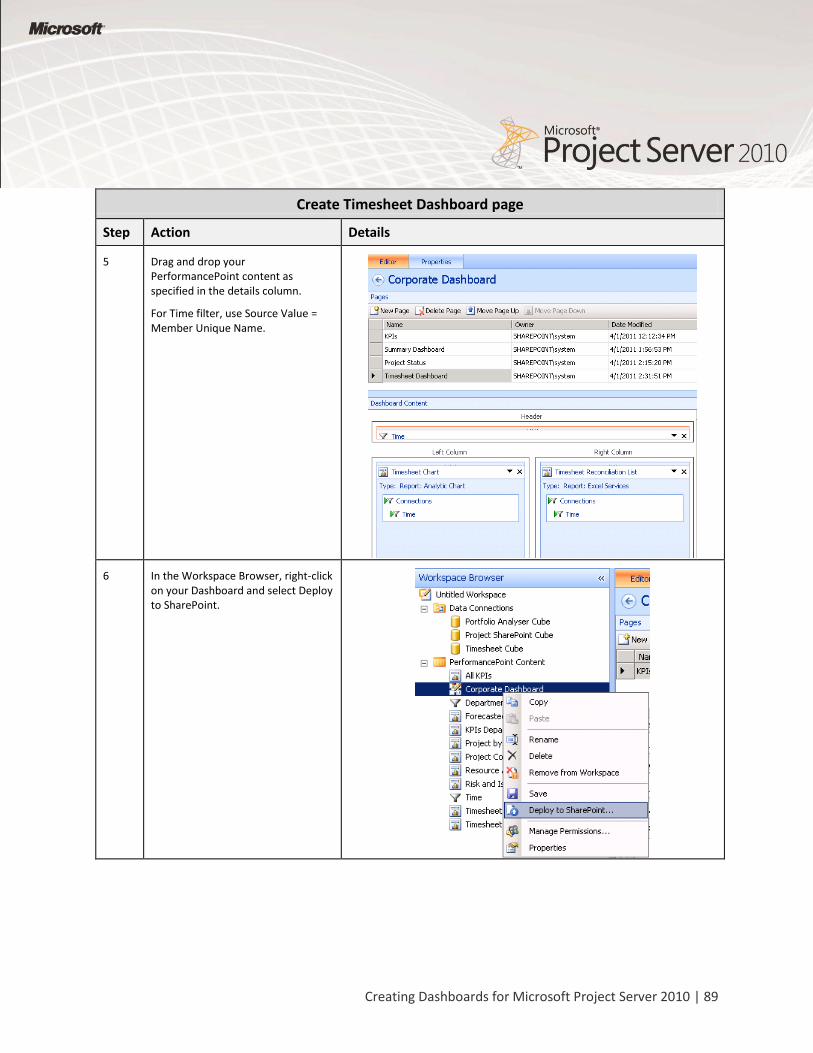
5 Drag and drop your PerformancePoint content as specified in the details column.
For Time filter, use Source Value = Member Unique Name.
6 In the Workspace Browser, right-click on your Dashboard and select Deploy to SharePoint.
90 | Creating Dashboards by using PerformancePoint Services
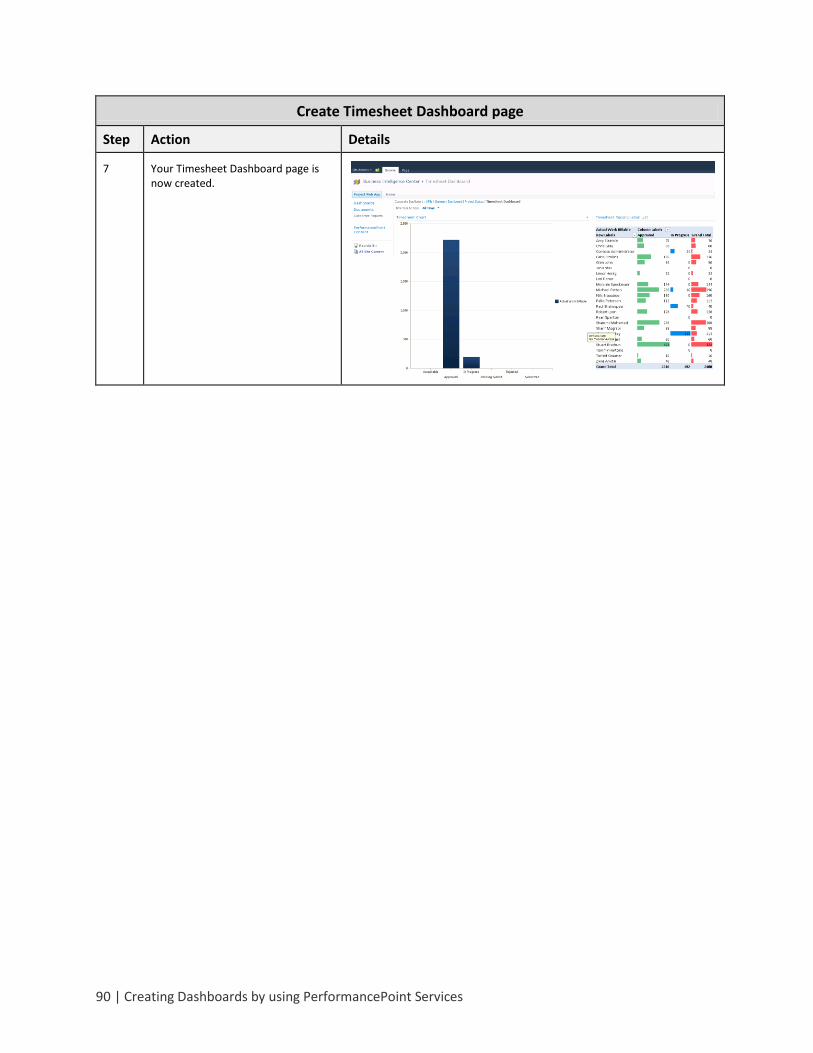
Create Timesheet Dashboard page
Step Action Details
7 Your Timesheet Dashboard page is now created.
Creating Dashboards for Microsoft Project Server 2010 | 91
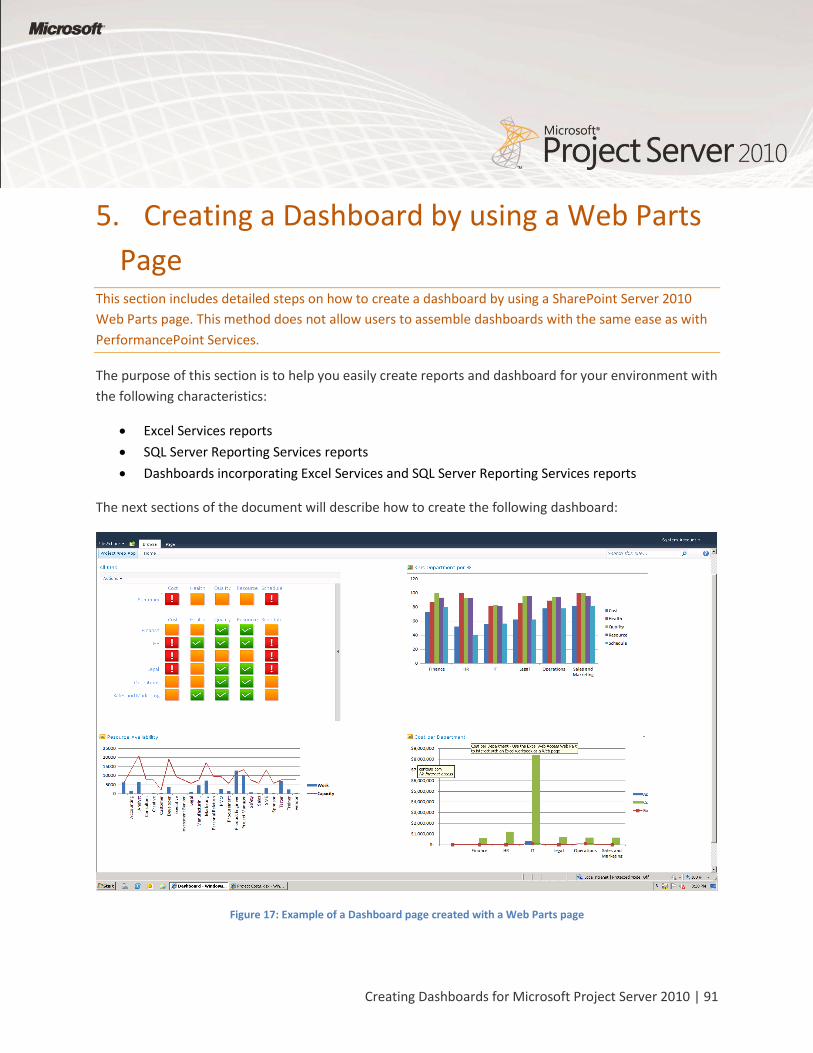
5. Creating a Dashboard by using a Web Parts
Page This section includes detailed steps on how to create a dashboard by using a SharePoint Server 2010
Web Parts page. This method does not allow users to assemble dashboards with the same ease as with
PerformancePoint Services.
The purpose of this section is to help you easily create reports and dashboard for your environment with
the following characteristics:
Excel Services reports
SQL Server Reporting Services reports
Dashboards incorporating Excel Services and SQL Server Reporting Services reports
The next sections of the document will describe how to create the following dashboard:
Figure 17: Example of a Dashboard page created with a Web Parts page
92 | Creating a Dashboard by using a Web Parts Page
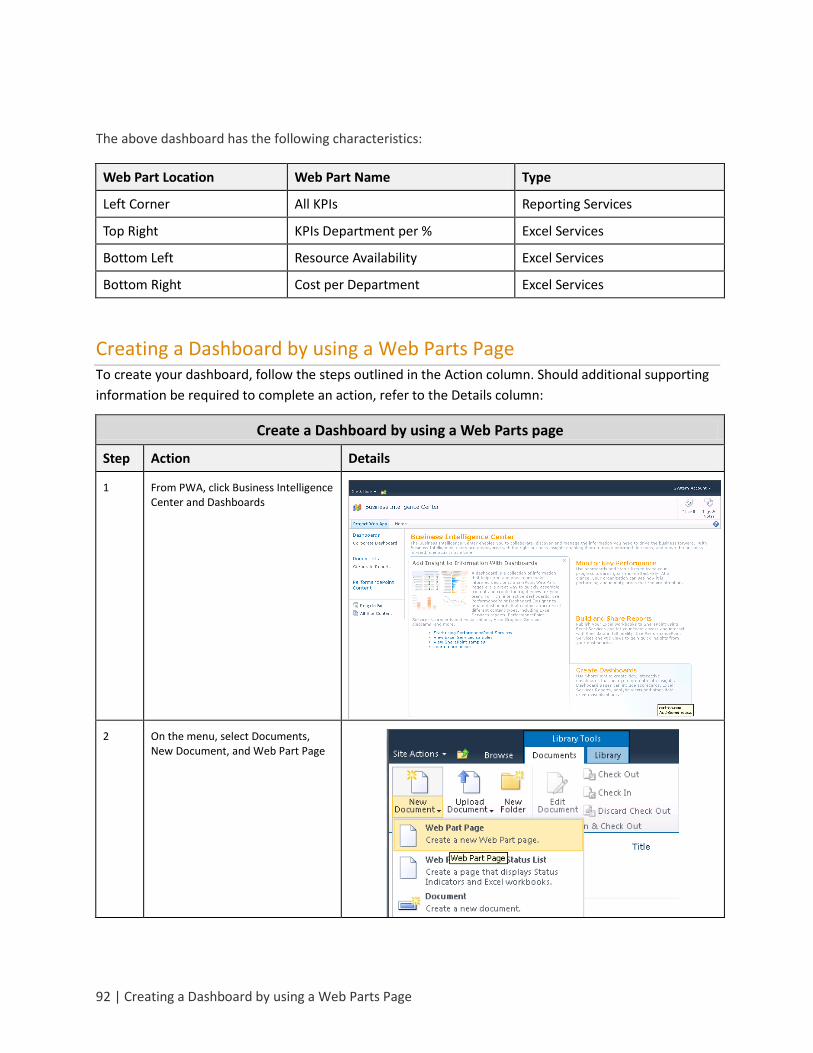
The above dashboard has the following characteristics:
Web Part Location Web Part Name Type
Left Corner All KPIs Reporting Services
Top Right KPIs Department per % Excel Services
Bottom Left Resource Availability Excel Services
Bottom Right Cost per Department Excel Services
Creating a Dashboard by using a Web Parts Page To create your dashboard, follow the steps outlined in the Action column. Should additional supporting
information be required to complete an action, refer to the Details column:
Create a Dashboard by using a Web Parts page
Step Action Details
1 From PWA, click Business Intelligence Center and Dashboards
2 On the menu, select Documents, New Document, and Web Part Page
Creating Dashboards for Microsoft Project Server 2010 | 93
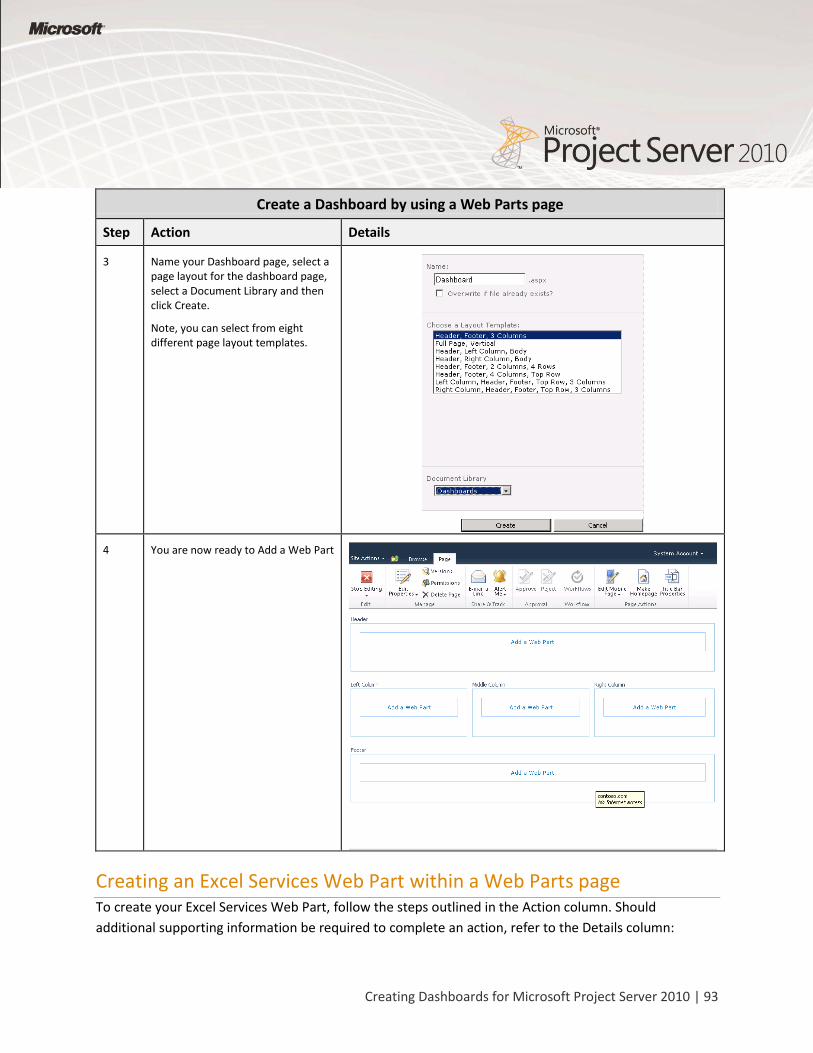
Create a Dashboard by using a Web Parts page
Step Action Details
3 Name your Dashboard page, select a page layout for the dashboard page, select a Document Library and then click Create.
Note, you can select from eight different page layout templates.
4 You are now ready to Add a Web Part
Creating an Excel Services Web Part within a Web Parts page To create your Excel Services Web Part, follow the steps outlined in the Action column. Should
additional supporting information be required to complete an action, refer to the Details column:
94 | Creating a Dashboard by using a Web Parts Page
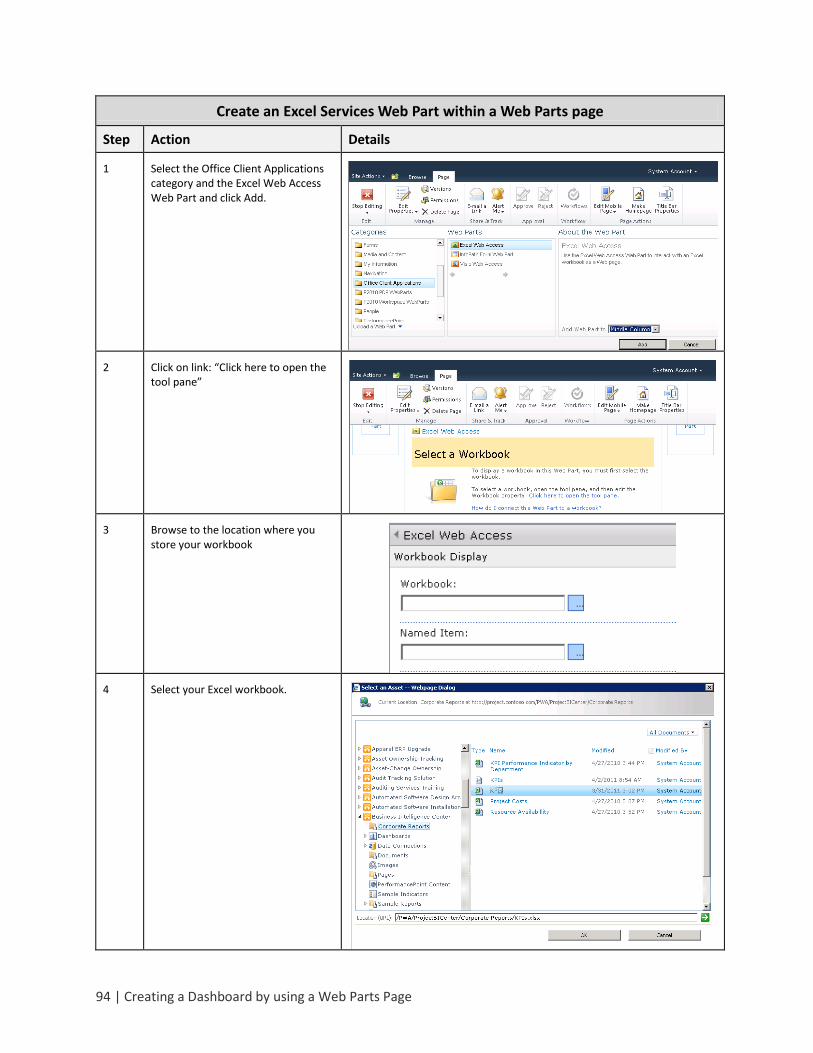
Create an Excel Services Web Part within a Web Parts page
Step Action Details
1 Select the Office Client Applications category and the Excel Web Access Web Part and click Add.
2 Click on link: “Click here to open the tool pane”
3 Browse to the location where you store your workbook
4 Select your Excel workbook.
Creating Dashboards for Microsoft Project Server 2010 | 95
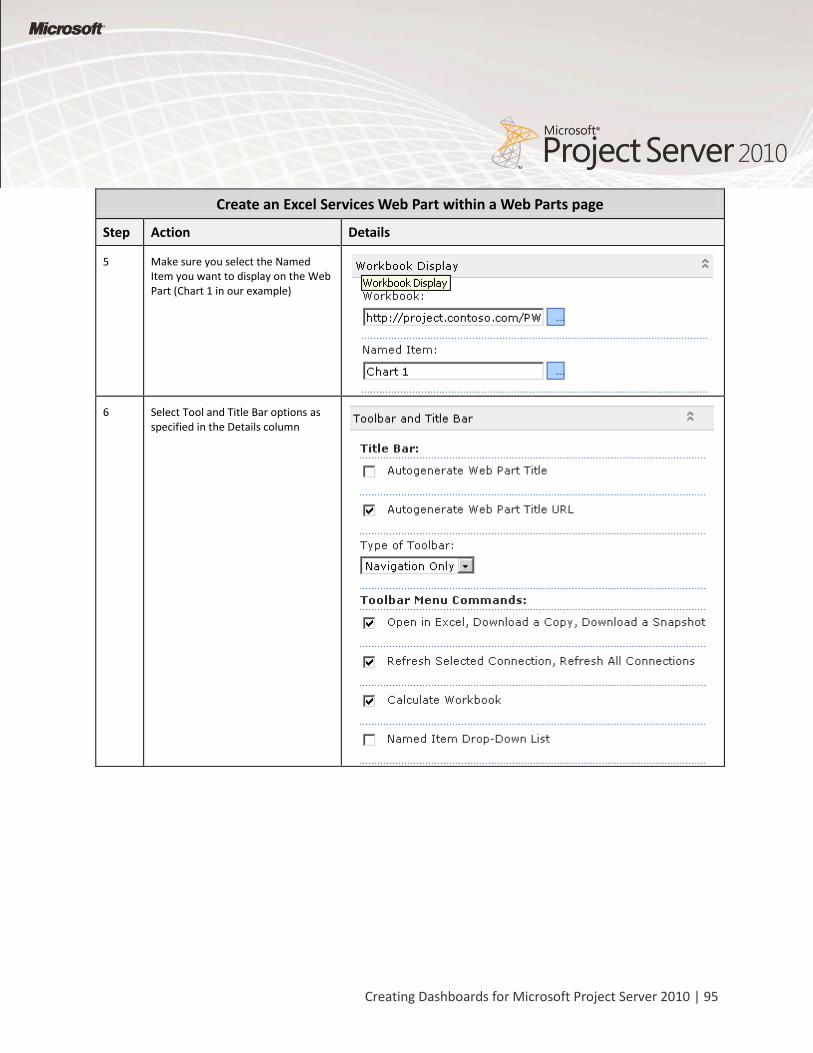
Create an Excel Services Web Part within a Web Parts page
Step Action Details
5 Make sure you select the Named Item you want to display on the Web Part (Chart 1 in our example)
6 Select Tool and Title Bar options as specified in the Details column
96 | Creating a Dashboard by using a Web Parts Page
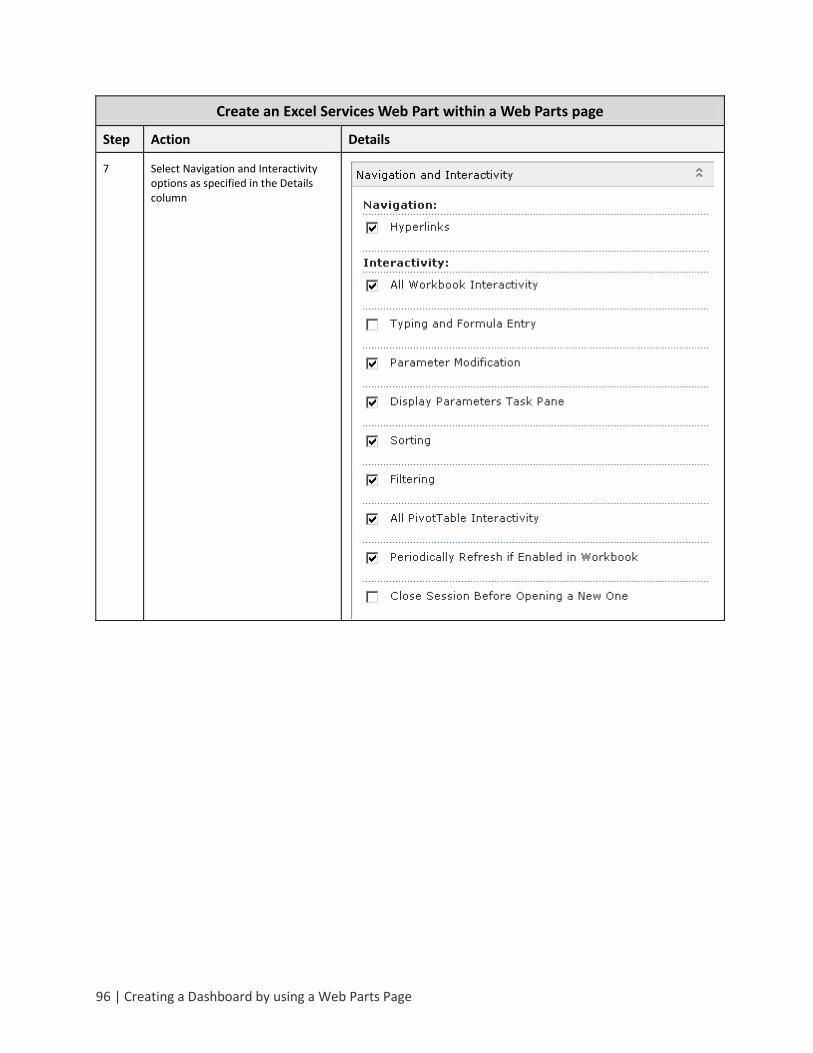
Create an Excel Services Web Part within a Web Parts page
Step Action Details
7 Select Navigation and Interactivity options as specified in the Details column
Creating Dashboards for Microsoft Project Server 2010 | 97
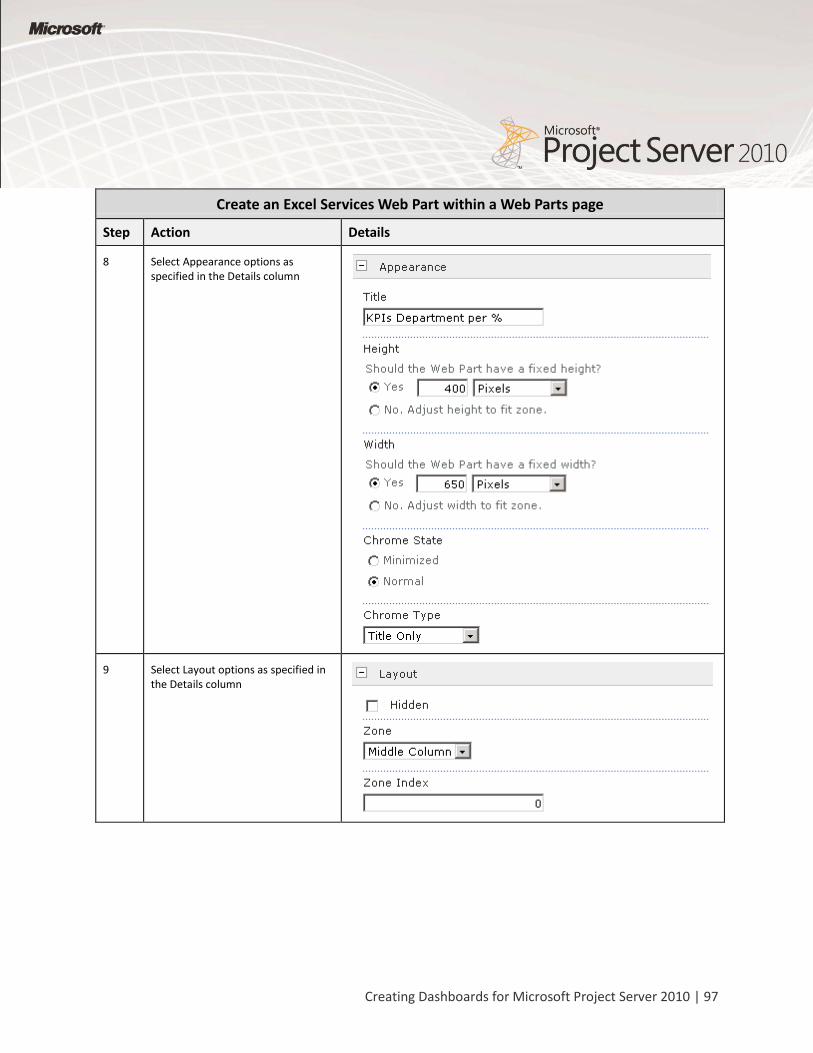
Create an Excel Services Web Part within a Web Parts page
Step Action Details
8 Select Appearance options as specified in the Details column
9 Select Layout options as specified in the Details column
98 | Creating a Dashboard by using a Web Parts Page
Create an Excel Services Web Part within a Web Parts page
Step Action Details
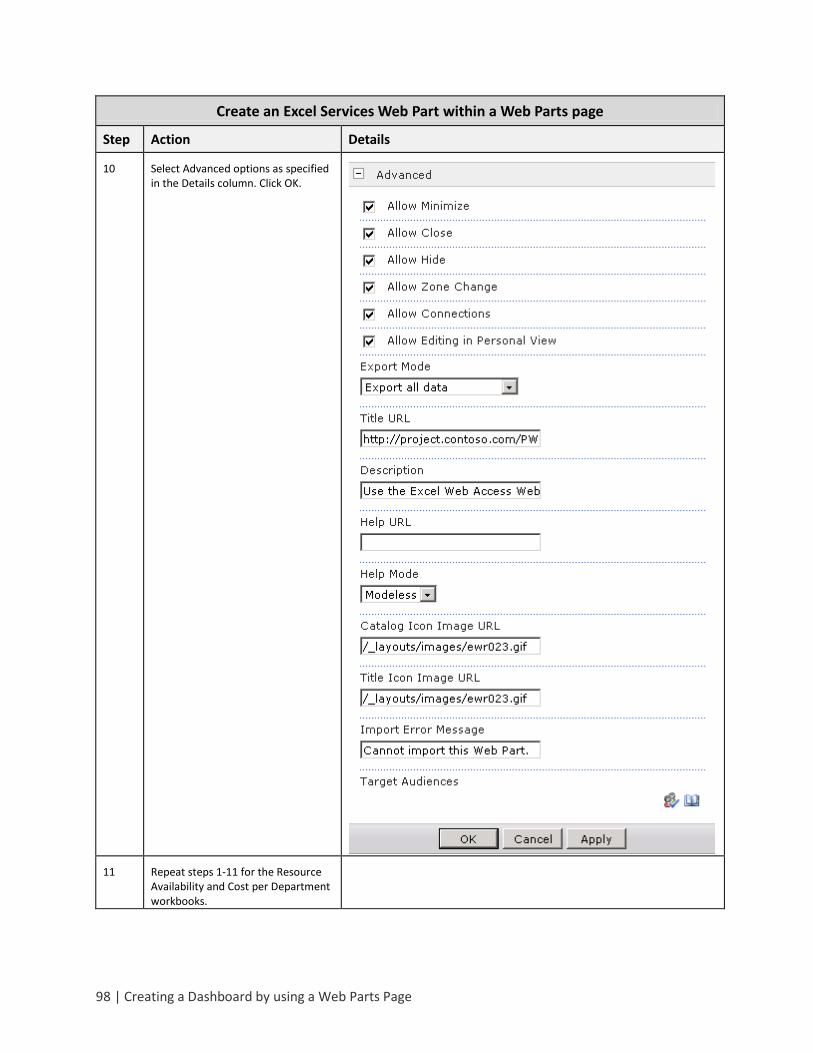
10 Select Advanced options as specified in the Details column. Click OK.
11 Repeat steps 1-11 for the Resource Availability and Cost per Department workbooks.
Creating Dashboards for Microsoft Project Server 2010 | 99
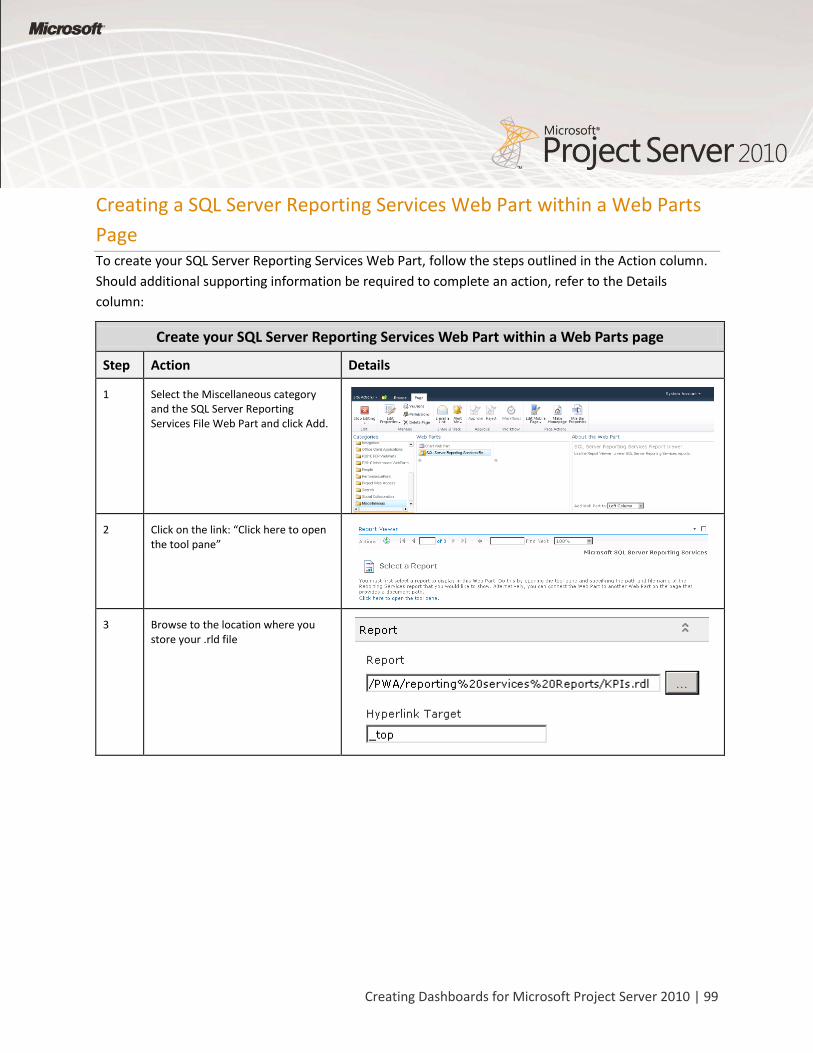
Creating a SQL Server Reporting Services Web Part within a Web Parts
Page To create your SQL Server Reporting Services Web Part, follow the steps outlined in the Action column.
Should additional supporting information be required to complete an action, refer to the Details
column:
Create your SQL Server Reporting Services Web Part within a Web Parts page
Step Action Details
1 Select the Miscellaneous category and the SQL Server Reporting Services File Web Part and click Add.
2 Click on the link: “Click here to open the tool pane”
3 Browse to the location where you store your .rld file
100 | Creating a Dashboard by using a Web Parts Page
Create your SQL Server Reporting Services Web Part within a Web Parts page
Step Action Details
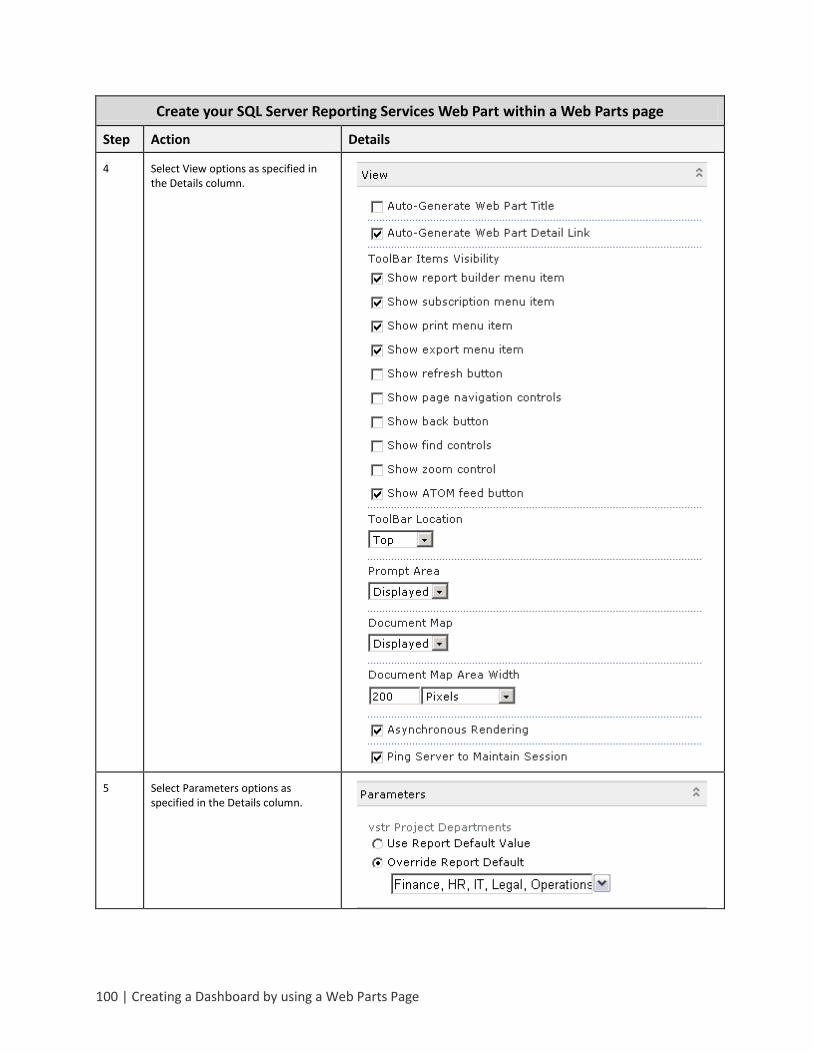
4 Select View options as specified in the Details column.
5 Select Parameters options as specified in the Details column.
Creating Dashboards for Microsoft Project Server 2010 | 101
Create your SQL Server Reporting Services Web Part within a Web Parts page
Step Action Details
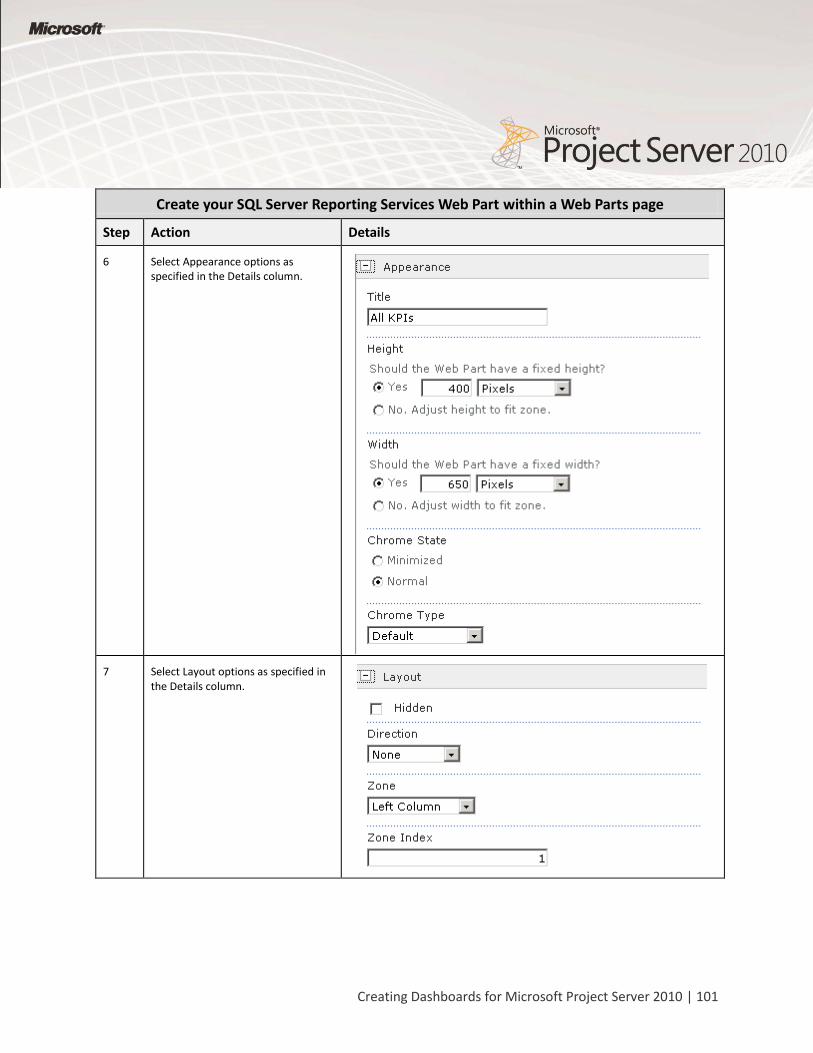
6 Select Appearance options as specified in the Details column.
7 Select Layout options as specified in the Details column.
102 | Conclusion
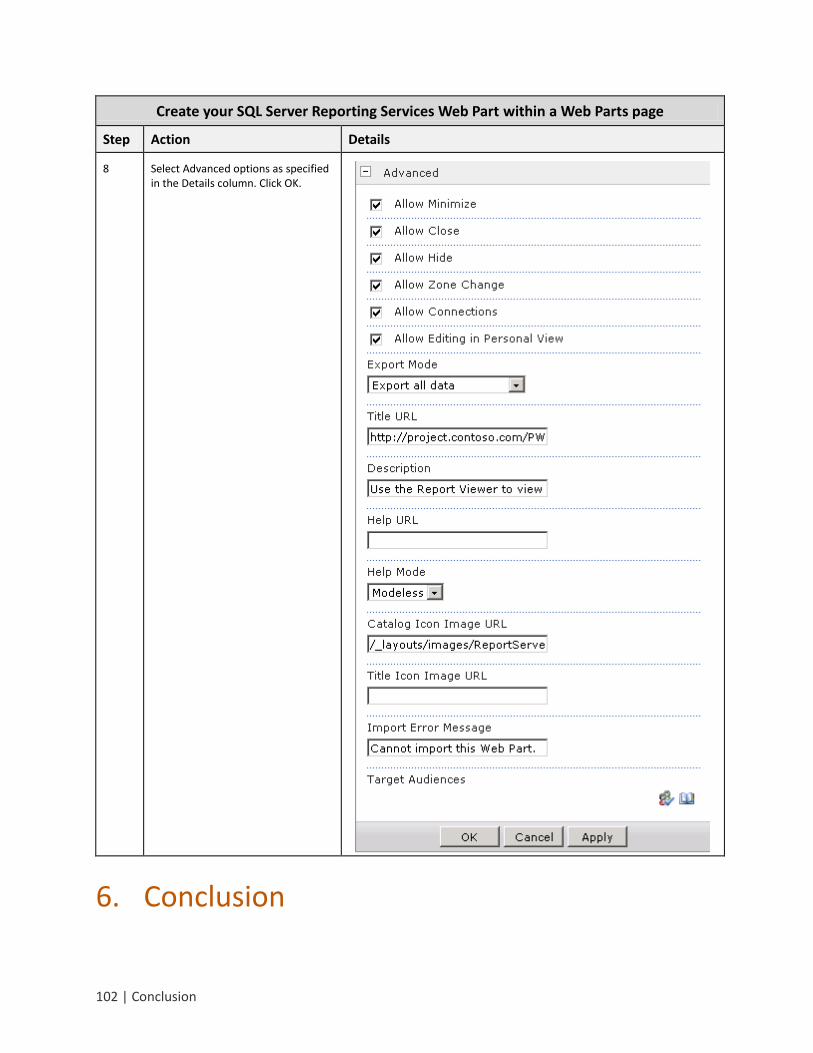
Create your SQL Server Reporting Services Web Part within a Web Parts page
Step Action Details
8 Select Advanced options as specified in the Details column. Click OK.
6. Conclusion
Creating Dashboards for Microsoft Project Server 2010 | 103
The purpose of this document is to provide sufficient detail to fully design and implement Business
Intelligence dashboards that support an Enterprise Project Management Solution (EPM), which consists
primarily of SharePoint Server 2010 and Project Server 2010. Specifically, this document examines the
two main ways of creating dashboards by using:
PerformancePoint Services
SharePoint Web Parts page
PerformancePoint Services is a more comprehensive method for creating dashboards as it allows users
to assemble a library of reporting assets which may then be combined into any number of project or
portfolio dashboards. Also, it allows the creation of filters that can function on stand-alone dashboard
items, across multiple dashboard items or across multiple pages in a dashboard.
It also includes detailed steps on how to replicate reports and dashboards included in the Project Server
2010 demonstration and evaluation pack available on the Microsoft Download Center. The purpose is to
help you easily create reports and dashboards for your environment with similar characteristics. For
additional information on Microsoft Project Server 2010 business intelligence, see Business Intelligence
in Project Server 2010.
104 | Appendix A – Enterprise Custom Fields
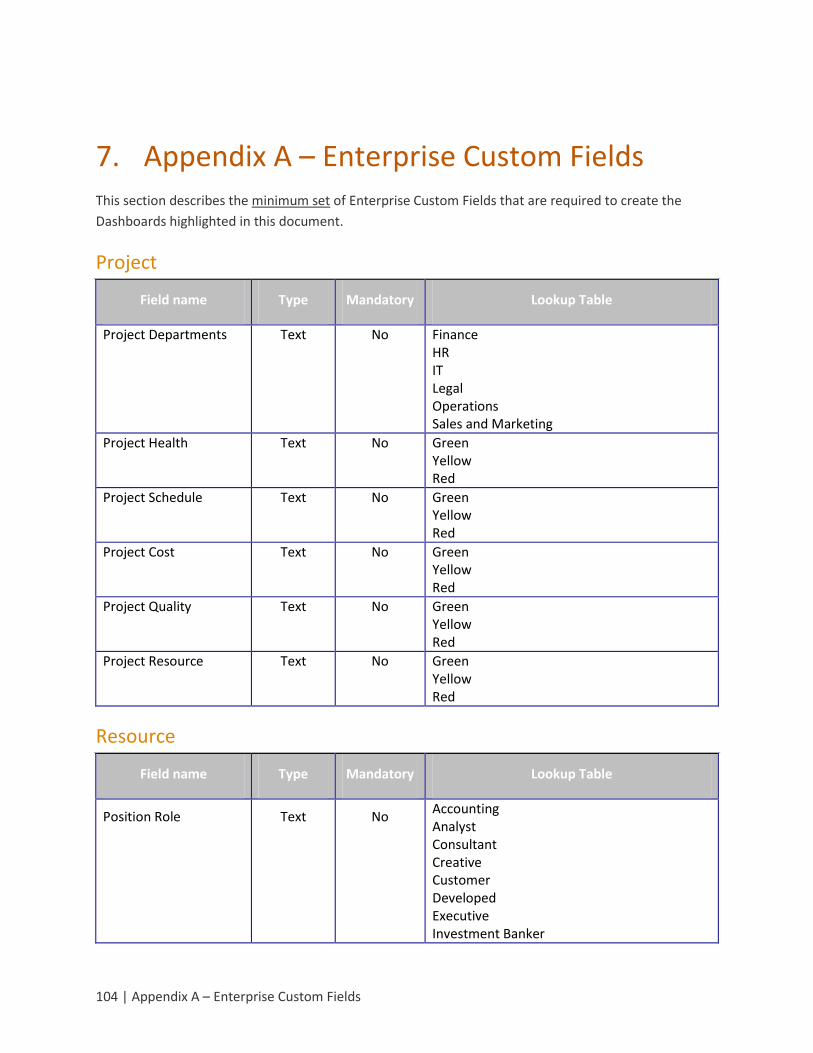
7. Appendix A – Enterprise Custom Fields This section describes the minimum set of Enterprise Custom Fields that are required to create the
Dashboards highlighted in this document.
Project
Field name Type Mandatory Lookup Table
Project Departments Text No Finance HR IT Legal Operations Sales and Marketing
Project Health Text No Green Yellow Red
Project Schedule Text No Green Yellow Red
Project Cost Text No Green Yellow Red
Project Quality Text No Green Yellow Red
Project Resource Text No Green Yellow Red
Resource
Field name Type Mandatory Lookup Table
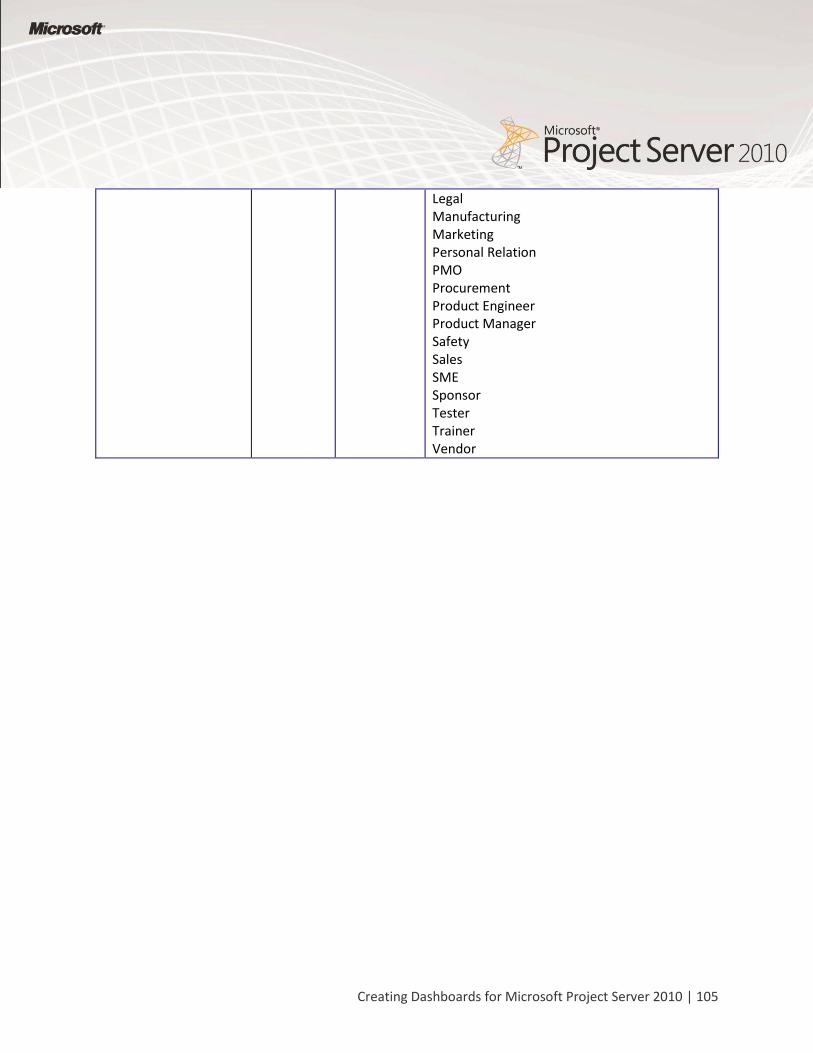
Position Role Text No Accounting Analyst Consultant Creative Customer Developed Executive Investment Banker
Creating Dashboards for Microsoft Project Server 2010 | 105
Legal Manufacturing Marketing Personal Relation PMO Procurement Product Engineer Product Manager Safety Sales SME Sponsor Tester Trainer Vendor
106 | Appendix B – IPMO Stored Procedures
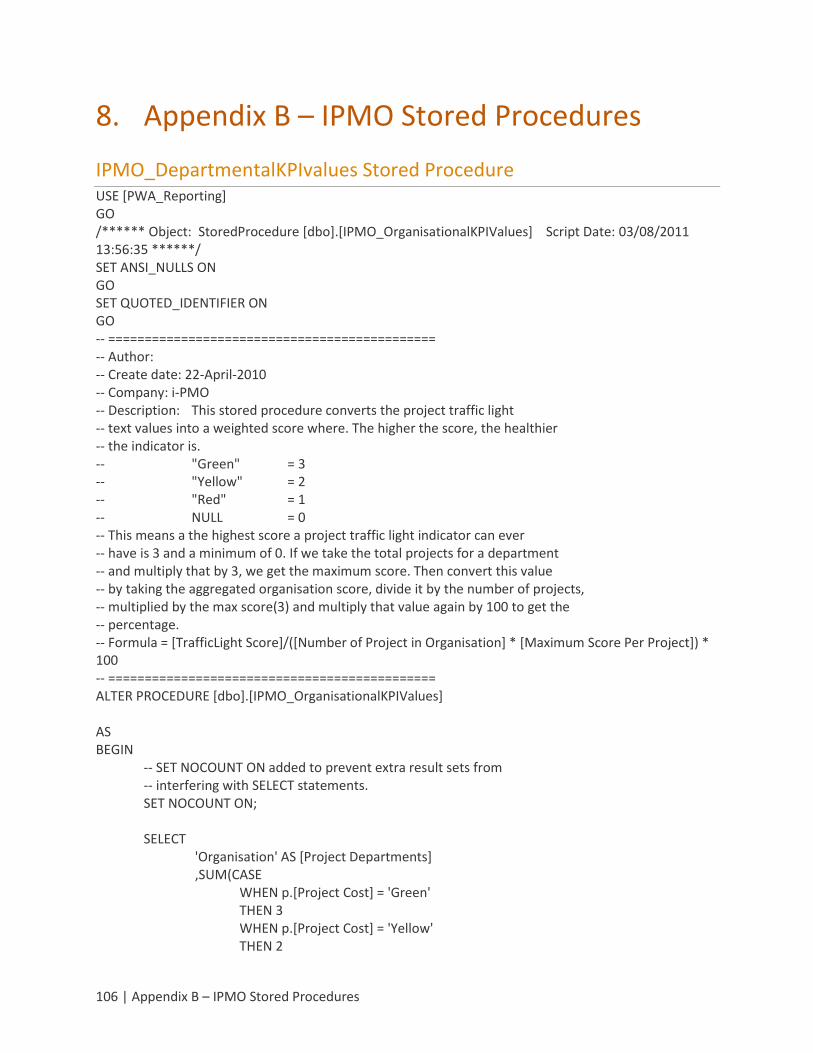
8. Appendix B – IPMO Stored Procedures
IPMO_DepartmentalKPIvalues Stored Procedure USE [PWA_Reporting] GO /****** Object: StoredProcedure [dbo].[IPMO_OrganisationalKPIValues] Script Date: 03/08/2011 13:56:35 ******/ SET ANSI_NULLS ON GO SET QUOTED_IDENTIFIER ON GO -- ============================================= -- Author: -- Create date: 22-April-2010 -- Company: i-PMO -- Description: This stored procedure converts the project traffic light -- text values into a weighted score where. The higher the score, the healthier -- the indicator is. -- "Green" = 3 -- "Yellow" = 2 -- "Red" = 1 -- NULL = 0 -- This means a the highest score a project traffic light indicator can ever -- have is 3 and a minimum of 0. If we take the total projects for a department -- and multiply that by 3, we get the maximum score. Then convert this value -- by taking the aggregated organisation score, divide it by the number of projects, -- multiplied by the max score(3) and multiply that value again by 100 to get the -- percentage. -- Formula = [TrafficLight Score]/([Number of Project in Organisation] * [Maximum Score Per Project]) * 100 -- ============================================= ALTER PROCEDURE [dbo].[IPMO_OrganisationalKPIValues] AS BEGIN -- SET NOCOUNT ON added to prevent extra result sets from -- interfering with SELECT statements. SET NOCOUNT ON; SELECT 'Organisation' AS [Project Departments] ,SUM(CASE WHEN p.[Project Cost] = 'Green' THEN 3 WHEN p.[Project Cost] = 'Yellow' THEN 2
Creating Dashboards for Microsoft Project Server 2010 | 107
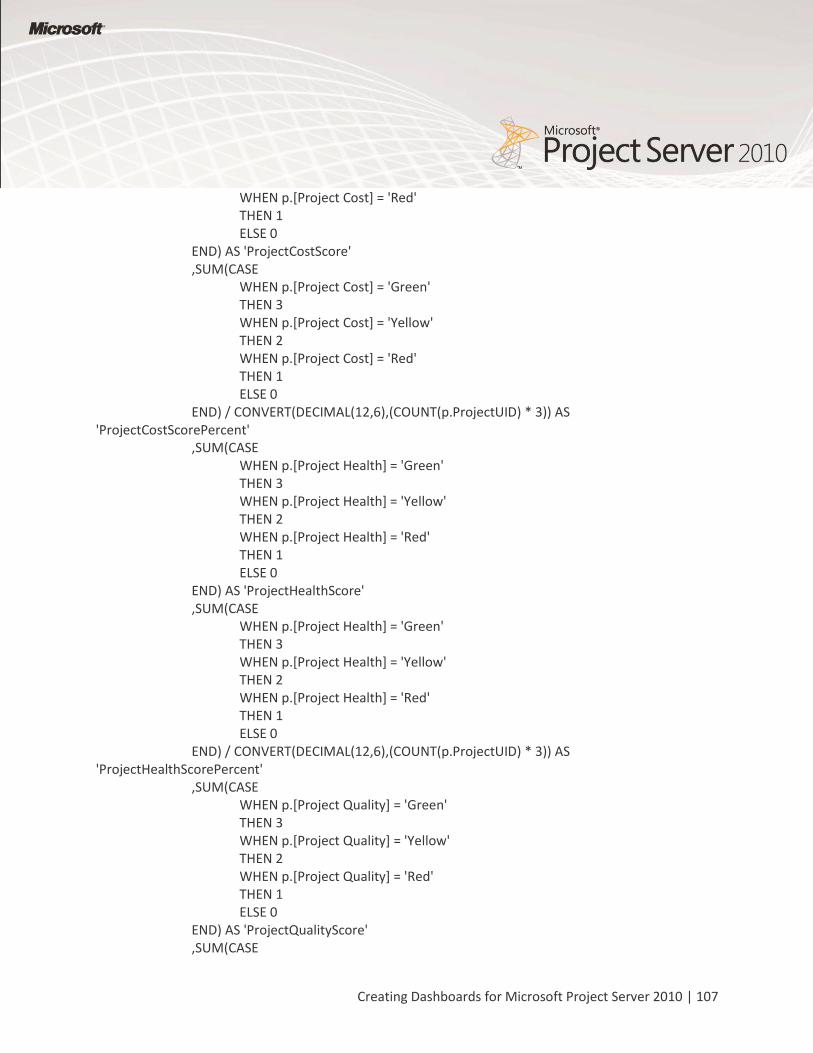
WHEN p.[Project Cost] = 'Red' THEN 1 ELSE 0 END) AS 'ProjectCostScore' ,SUM(CASE WHEN p.[Project Cost] = 'Green' THEN 3 WHEN p.[Project Cost] = 'Yellow' THEN 2 WHEN p.[Project Cost] = 'Red' THEN 1 ELSE 0 END) / CONVERT(DECIMAL(12,6),(COUNT(p.ProjectUID) * 3)) AS 'ProjectCostScorePercent' ,SUM(CASE WHEN p.[Project Health] = 'Green' THEN 3 WHEN p.[Project Health] = 'Yellow' THEN 2 WHEN p.[Project Health] = 'Red' THEN 1 ELSE 0 END) AS 'ProjectHealthScore' ,SUM(CASE WHEN p.[Project Health] = 'Green' THEN 3 WHEN p.[Project Health] = 'Yellow' THEN 2 WHEN p.[Project Health] = 'Red' THEN 1 ELSE 0 END) / CONVERT(DECIMAL(12,6),(COUNT(p.ProjectUID) * 3)) AS 'ProjectHealthScorePercent' ,SUM(CASE WHEN p.[Project Quality] = 'Green' THEN 3 WHEN p.[Project Quality] = 'Yellow' THEN 2 WHEN p.[Project Quality] = 'Red' THEN 1 ELSE 0 END) AS 'ProjectQualityScore' ,SUM(CASE
108 | Appendix B – IPMO Stored Procedures
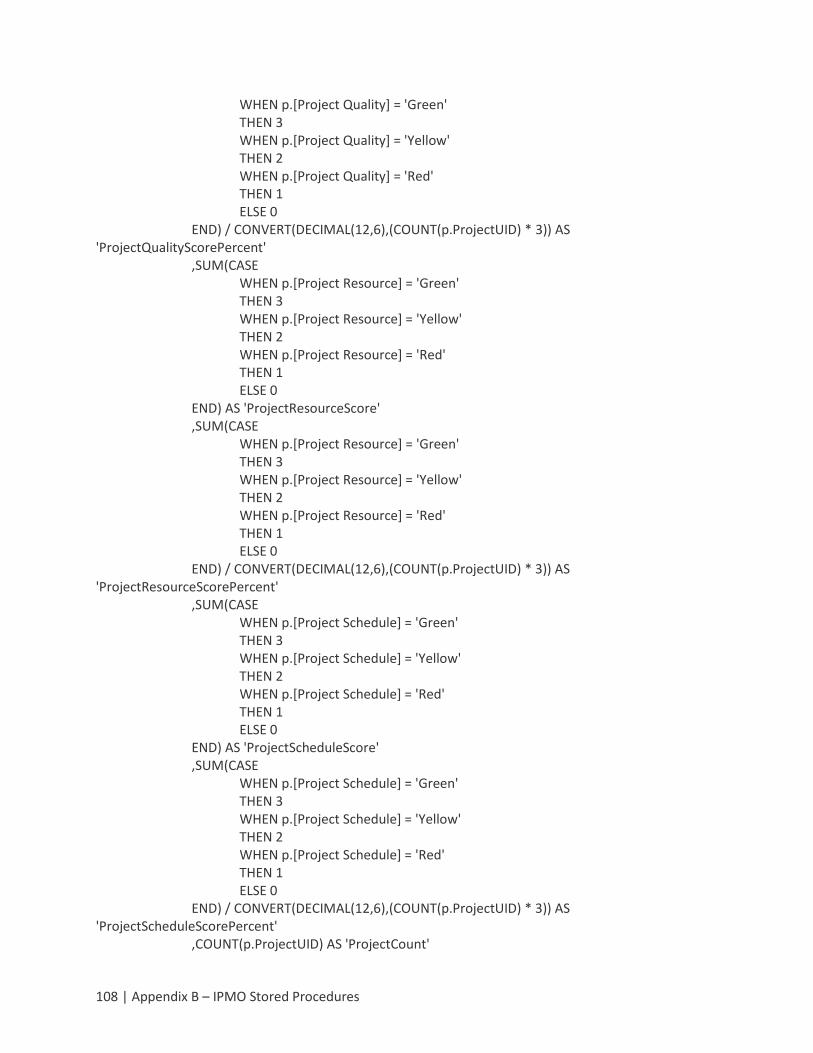
WHEN p.[Project Quality] = 'Green' THEN 3 WHEN p.[Project Quality] = 'Yellow' THEN 2 WHEN p.[Project Quality] = 'Red' THEN 1 ELSE 0 END) / CONVERT(DECIMAL(12,6),(COUNT(p.ProjectUID) * 3)) AS 'ProjectQualityScorePercent' ,SUM(CASE WHEN p.[Project Resource] = 'Green' THEN 3 WHEN p.[Project Resource] = 'Yellow' THEN 2 WHEN p.[Project Resource] = 'Red' THEN 1 ELSE 0 END) AS 'ProjectResourceScore' ,SUM(CASE WHEN p.[Project Resource] = 'Green' THEN 3 WHEN p.[Project Resource] = 'Yellow' THEN 2 WHEN p.[Project Resource] = 'Red' THEN 1 ELSE 0 END) / CONVERT(DECIMAL(12,6),(COUNT(p.ProjectUID) * 3)) AS 'ProjectResourceScorePercent' ,SUM(CASE WHEN p.[Project Schedule] = 'Green' THEN 3 WHEN p.[Project Schedule] = 'Yellow' THEN 2 WHEN p.[Project Schedule] = 'Red' THEN 1 ELSE 0 END) AS 'ProjectScheduleScore' ,SUM(CASE WHEN p.[Project Schedule] = 'Green' THEN 3 WHEN p.[Project Schedule] = 'Yellow' THEN 2 WHEN p.[Project Schedule] = 'Red' THEN 1 ELSE 0 END) / CONVERT(DECIMAL(12,6),(COUNT(p.ProjectUID) * 3)) AS 'ProjectScheduleScorePercent' ,COUNT(p.ProjectUID) AS 'ProjectCount'

Creating Dashboards for Microsoft Project Server 2010 | 109
,COUNT(p.ProjectUID) * 3 AS 'MaximumScore' FROM PWA_Reporting.dbo.MSP_EpmProject_UserView AS p END
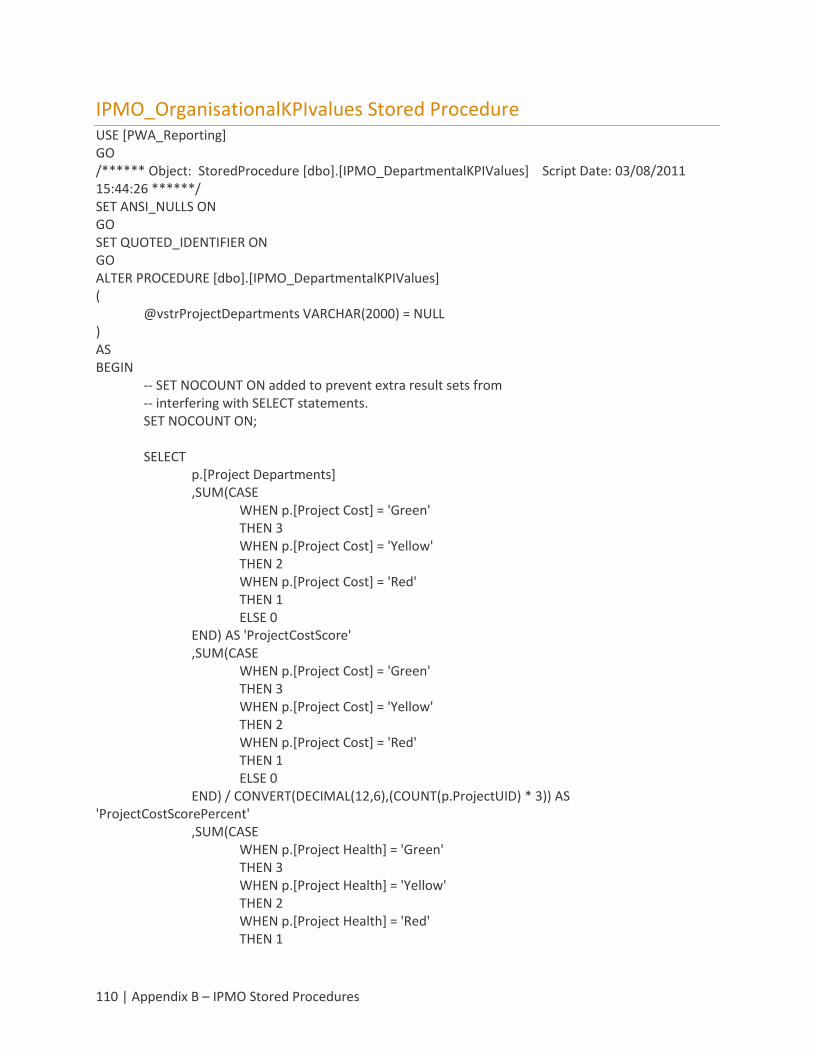
110 | Appendix B – IPMO Stored Procedures
IPMO_OrganisationalKPIvalues Stored Procedure USE [PWA_Reporting] GO /****** Object: StoredProcedure [dbo].[IPMO_DepartmentalKPIValues] Script Date: 03/08/2011 15:44:26 ******/ SET ANSI_NULLS ON GO SET QUOTED_IDENTIFIER ON GO ALTER PROCEDURE [dbo].[IPMO_DepartmentalKPIValues] ( @vstrProjectDepartments VARCHAR(2000) = NULL ) AS BEGIN -- SET NOCOUNT ON added to prevent extra result sets from -- interfering with SELECT statements. SET NOCOUNT ON; SELECT p.[Project Departments] ,SUM(CASE WHEN p.[Project Cost] = 'Green' THEN 3 WHEN p.[Project Cost] = 'Yellow' THEN 2 WHEN p.[Project Cost] = 'Red' THEN 1 ELSE 0 END) AS 'ProjectCostScore' ,SUM(CASE WHEN p.[Project Cost] = 'Green' THEN 3 WHEN p.[Project Cost] = 'Yellow' THEN 2 WHEN p.[Project Cost] = 'Red' THEN 1 ELSE 0 END) / CONVERT(DECIMAL(12,6),(COUNT(p.ProjectUID) * 3)) AS 'ProjectCostScorePercent' ,SUM(CASE WHEN p.[Project Health] = 'Green' THEN 3 WHEN p.[Project Health] = 'Yellow' THEN 2 WHEN p.[Project Health] = 'Red' THEN 1
Creating Dashboards for Microsoft Project Server 2010 | 111
ELSE 0 END) AS 'ProjectHealthScore' ,SUM(CASE WHEN p.[Project Health] = 'Green' THEN 3 WHEN p.[Project Health] = 'Yellow' THEN 2 WHEN p.[Project Health] = 'Red' THEN 1 ELSE 0 END) / CONVERT(DECIMAL(12,6),(COUNT(p.ProjectUID) * 3)) AS 'ProjectHealthScorePercent' ,SUM(CASE WHEN p.[Project Quality] = 'Green' THEN 3 WHEN p.[Project Quality] = 'Yellow' THEN 2 WHEN p.[Project Quality] = 'Red' THEN 1 ELSE 0 END) AS 'ProjectQualityScore' ,SUM(CASE WHEN p.[Project Quality] = 'Green' THEN 3 WHEN p.[Project Quality] = 'Yellow' THEN 2 WHEN p.[Project Quality] = 'Red' THEN 1 ELSE 0 END) / CONVERT(DECIMAL(12,6),(COUNT(p.ProjectUID) * 3)) AS 'ProjectQualityScorePercent' ,SUM(CASE WHEN p.[Project Resource] = 'Green' THEN 3 WHEN p.[Project Resource] = 'Yellow' THEN 2 WHEN p.[Project Resource] = 'Red' THEN 1 ELSE 0 END) AS 'ProjectResourceScore' ,SUM(CASE WHEN p.[Project Resource] = 'Green' THEN 3
112 | References
WHEN p.[Project Resource] = 'Yellow' THEN 2 WHEN p.[Project Resource] = 'Red' THEN 1 ELSE 0 END) / CONVERT(DECIMAL(12,6),(COUNT(p.ProjectUID) * 3)) AS 'ProjectResourceScorePercent' ,SUM(CASE WHEN p.[Project Schedule] = 'Green' THEN 3 WHEN p.[Project Schedule] = 'Yellow' THEN 2 WHEN p.[Project Schedule] = 'Red' THEN 1 ELSE 0 END) AS 'ProjectScheduleScore' ,SUM(CASE WHEN p.[Project Schedule] = 'Green' THEN 3 WHEN p.[Project Schedule] = 'Yellow' THEN 2 WHEN p.[Project Schedule] = 'Red' THEN 1 ELSE 0 END) / CONVERT(DECIMAL(12,6),(COUNT(p.ProjectUID) * 3)) AS 'ProjectScheduleScorePercent' ,COUNT(p.ProjectUID) AS 'ProjectCount' ,COUNT(p.ProjectUID) * 3 AS 'MaximumScore' FROM PWA_Reporting.dbo.MSP_EpmProject_UserView AS p WHERE (p.[Project Departments] IN (@vstrProjectDepartments) OR @vstrProjectDepartments IS NULL) GROUP BY p.[Project Departments] END
9. References
Learn about PerformancePoint report types
Create an Excel Services report by using Dashboard Designer
Project 2010 Overview for Developer – Build Cube Service
Create data connections (PerformancePoint Services)

Creating Dashboards for Microsoft Project Server 2010 | 113
How to: Use an Office Data Connection (.odc) with Reports (Reporting Services in SharePoint Integrated Mode)
How to: Add Report Server Content Types to a Library (Reporting Services in SharePoint Integrated Mode)
Create a Reporting Services report by using Dashboard Designer
Create an Excel Services report by using Dashboard Designer
Create a dashboard page by using Dashboard Designer
Create a dashboard page by using Dashboard Designer
Microsoft Project 2010 Resources:
Product information
Project 2010 product site: http://www.microsoft.com/project
Project Team Blog: http://blogs.msdn.com/project
End-User Product Help
Project 2010 Help http://office2010.microsoft.com/project-help
Project 2010 Help http://office2010.microsoft.com/project-server-help
Demand Management for Project 2010 - http://go.microsoft.com/?linkid=9739874
Business Intelligence for Project 2010 - http://go.microsoft.com/?linkid=9726143
Upgrade and Migration to Project 2010 - http://go.microsoft.com/?linkid=9676814
Interactive content - Videos & Sessions & Webcasts
http://www.microsoft.com/showcase/en/US/channels/microsoftproject
http://www.microsoft.com/events/series/epm.aspx
Project Professional 2010 and Project 2010 Demo Image:
Download: http://go.microsoft.com/?linkid=9713956
Hosted Virtual Lab: http://go.microsoft.com/?linkid=9713654
IT Professional related - TechNet
Tech Center: http://technet.microsoft.com/ProjectServer
Admin Blog: http://blogs.technet.com/projectadministration
Developer related - MSDN
Developer center: http://msdn.microsoft.com/Project
Programmability blog: http://blogs.msdn.com/project_programmability
Got Questions? Search or ask in the official Microsoft Forums!

114 | References
http://social.msdn.microsoft.com/Forums/en-
US/category/projectserver2010,projectprofessional2010/
SharePoint 2010 Products
http://sharepoint.microsoft.com
Creating Dashboards for Microsoft Project Server 2010 | 115
10. List of Figures Figure 1: Excel Services Report Example....................................................................................................... 7
Figure 2: PerformancePoint Analytic Chart Example .................................................................................... 8
Figure 3: SQL Server Reporting Services Report Example .......................................................................... 10
Figure 4: KPI Department per % report ...................................................................................................... 11
Figure 5: Project Cost per Department report ............................................................................................ 22
Figure 6: Resource Availability by role report ............................................................................................. 25
Figure 7: Timesheet Reconciliation List report ........................................................................................... 29
Figure 8: Forecasted Cost Chart .................................................................................................................. 37
Figure 9: Risk and Issue Count Chart........................................................................................................... 43
Figure 10: Timesheet Chart ......................................................................................................................... 47
Figure 11: Key Performance Indicators (KPIs) ............................................................................................. 54
Figure 12: Project by Department .............................................................................................................. 57
Figure 13: Example of a Dashboard Page 1 created with PerformancePoint ............................................. 60
Figure 14: Example of a Dashboard Page 2 created with PerformancePoint ............................................. 61
Figure 15: Example of a Dashboard Page 3 created with PerformancePoint ............................................. 61
Figure 16: Example of a Dashboard Page 4 created with PerformancePoint ............................................. 62
Figure 17: Example of a Dashboard page created with a Web Parts page ................................................. 91
11. List of Tables Table 1: List of Excel Services Reports ........................................................................................................ 11
Table 2: List of PerformancePoint Charts ................................................................................................... 33
Table 3: List of SQL Server Reporting Services Reports .............................................................................. 52