creating end-to-end solutions - · pdf fileviaduktstrasse 42, 4002 basel, switzerland. the...
TRANSCRIPT
Creating end-to-end solutions
FINANCIAL REPORT 2017

Financial Report 2017
Consolidated Financial Statement panalpina.com 2
Consolidated financial statements
CONTENTS
Consolidated income statement 3
Consolidated statement of comprehensive income 4
Consolidated statement of financial position 5
Consolidated statement of changes in equity 6
Consolidated statement of cash flows 8
Notes to the consolidated financial statements 9
Statutory auditor’s report on the audit 57
of the consolidated financial statements
Key figures (five-year review) 61
Consolidated statement of financial position 63
(five-year review)
CConsolidated Financial Statement panalpina.com 3
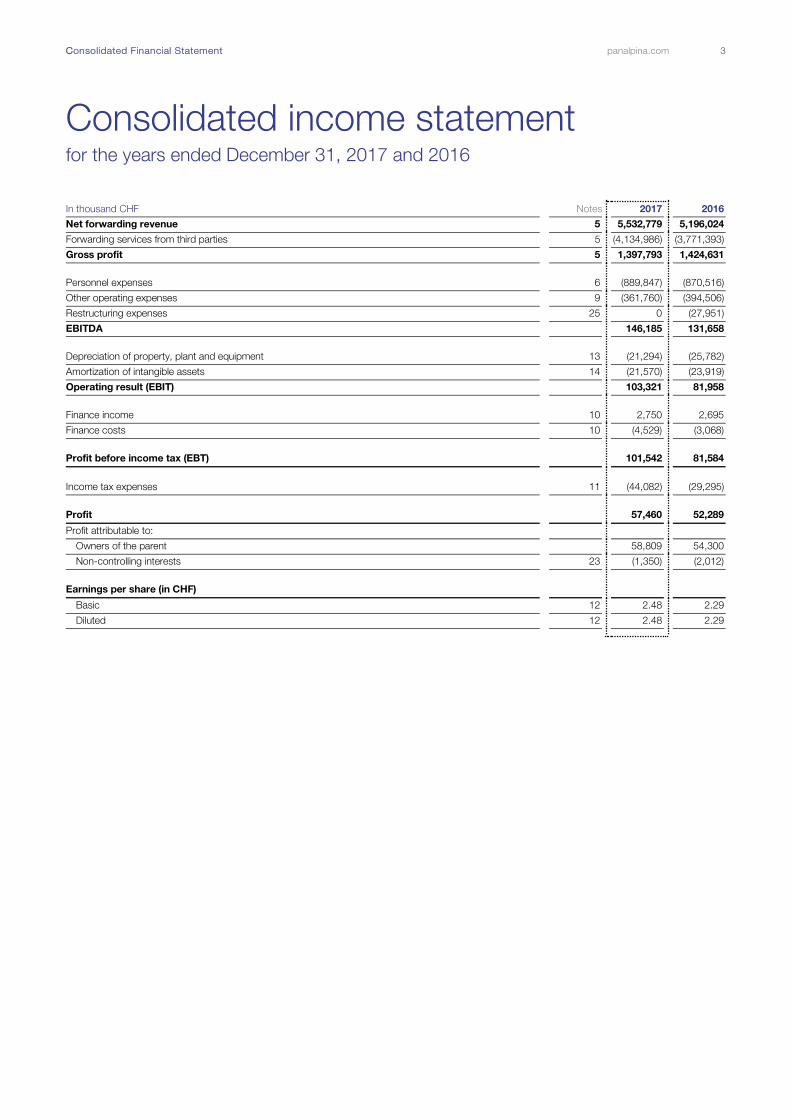
Consolidated income statement for the years ended December 31, 2017 and 2016
In thousand CHF Notes 2017 2016
Net forwarding revenue 5 5,532,779 5,196,024
Forwarding services from third parties 5 (4,134,986) (3,771,393)
Gross profit 5 1,397,793 1,424,631
Personnel expenses 6 (889,847) (870,516)
Other operating expenses 9 (361,760) (394,506)
Restructuring expenses 25 0 (27,951)
EBITDA 146,185 131,658
Depreciation of property, plant and equipment 13 (21,294) (25,782)
Amortization of intangible assets 14 (21,570) (23,919)
Operating result (EBIT) 103,321 81,958
Finance income 10 2,750 2,695
Finance costs 10 (4,529) (3,068)
Profit before income tax (EBT) 101,542 81,584
Income tax expenses 11 (44,082) (29,295)
Profit 57,460 52,289
Profit attributable to:
Owners of the parent 58,809 54,300
Non-controlling interests 23 (1,350) (2,012)
Earnings per share (in CHF)
Basic 12 2.48 2.29
Diluted 12 2.48 2.29
CConsolidated Financial Statement panalpina.com 4
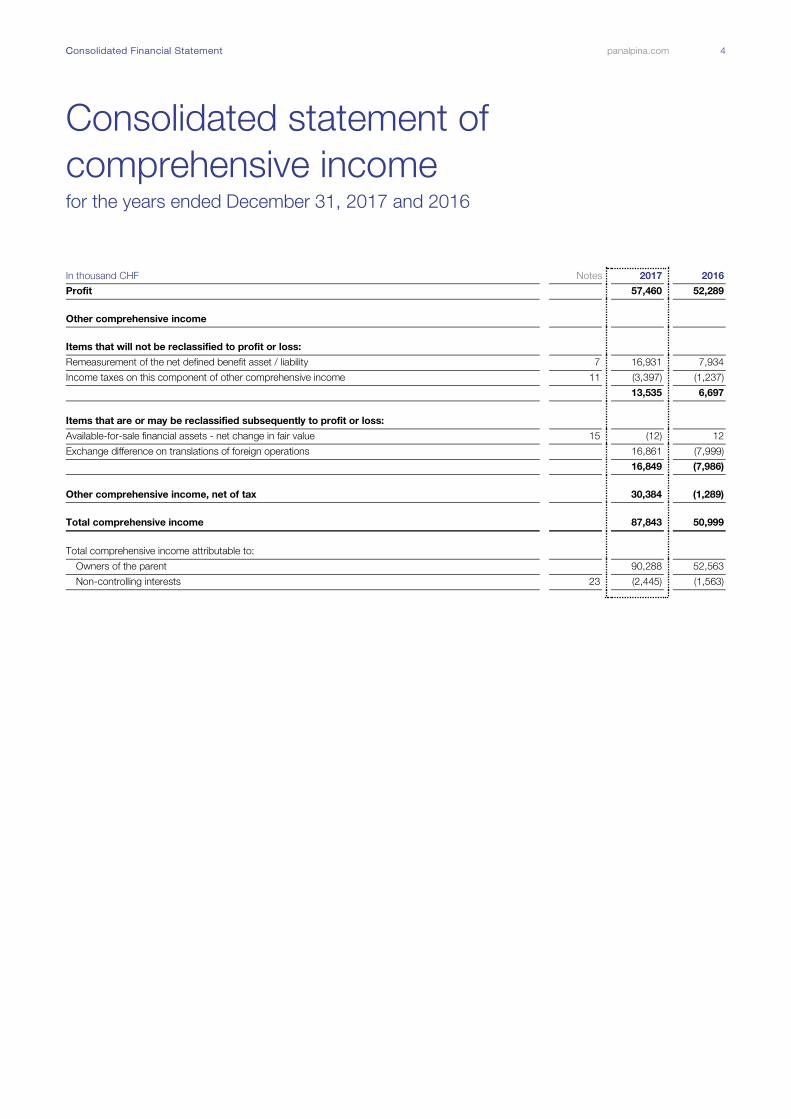
Consolidated statement of
comprehensive income for the years ended December 31, 2017 and 2016
In thousand CHF Notes 2017 2016
Profit 57,460 52,289
Other comprehensive income
Items that will not be reclassified to profit or loss:
Remeasurement of the net defined benefit asset / liability 7 16,931 7,934
Income taxes on this component of other comprehensive income 11 (3,397) (1,237)
13,535 6,697
Items that are or may be reclassified subsequently to profit or loss:
Available-for-sale financial assets - net change in fair value 15 (12) 12
Exchange difference on translations of foreign operations 16,861 (7,999)
16,849 (7,986)
Other comprehensive income, net of tax 30,384 (1,289)
Total comprehensive income 87,843 50,999
Total comprehensive income attributable to:
Owners of the parent 90,288 52,563
Non-controlling interests 23 (2,445) (1,563)
CConsolidated Financial Statement panalpina.com 5
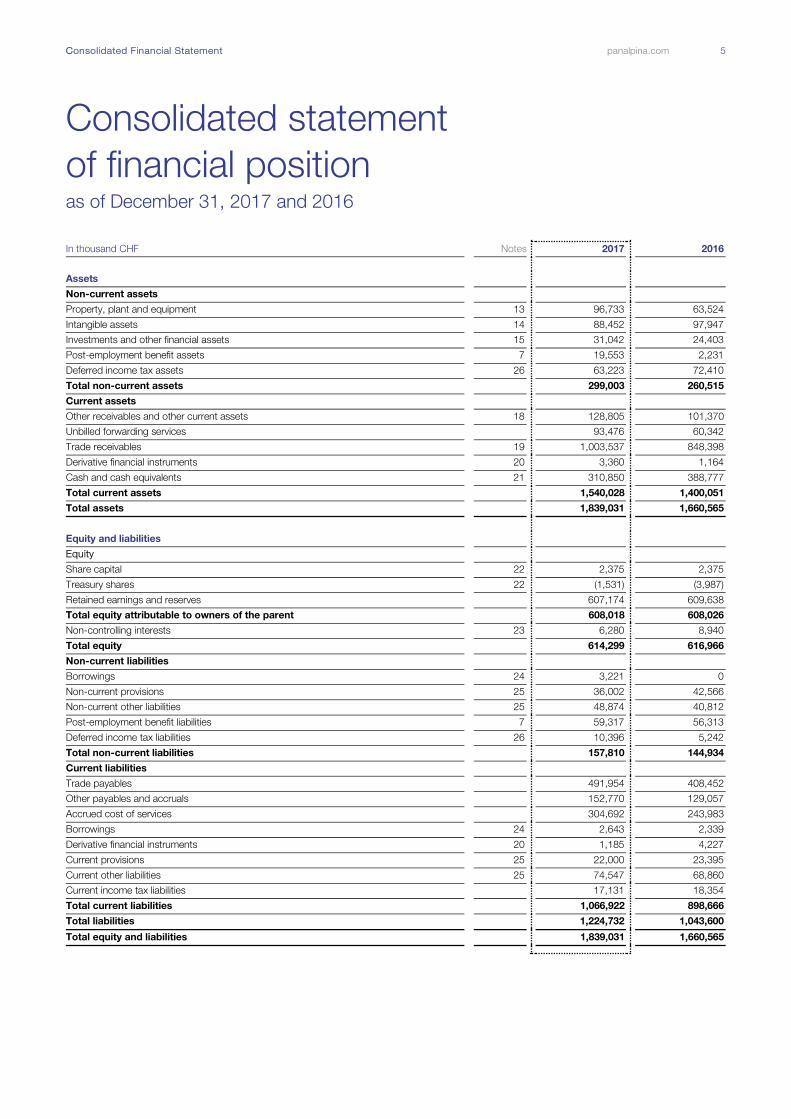
Consolidated statement
of financial position as of December 31, 2017 and 2016
In thousand CHF Notes 2017 2016
Assets
Non-current assets
Property, plant and equipment 13 96,733 63,524
Intangible assets 14 88,452 97,947
Investments and other financial assets 15 31,042 24,403
Post-employment benefit assets 7 19,553 2,231
Deferred income tax assets 26 63,223 72,410
Total non-current assets 299,003 260,515
Current assets
Other receivables and other current assets 18 128,805 101,370
Unbilled forwarding services 93,476 60,342
Trade receivables 19 1,003,537 848,398
Derivative financial instruments 20 3,360 1,164
Cash and cash equivalents 21 310,850 388,777
Total current assets 1,540,028 1,400,051
Total assets 1,839,031 1,660,565
Equity and liabilities
Equity
Share capital 22 2,375 2,375
Treasury shares 22 (1,531) (3,987)
Retained earnings and reserves 607,174 609,638
Total equity attributable to owners of the parent 608,018 608,026
Non-controlling interests 23 6,280 8,940
Total equity 614,299 616,966
Non-current liabilities
Borrowings 24 3,221 0
Non-current provisions 25 36,002 42,566
Non-current other liabilities 25 48,874 40,812
Post-employment benefit liabilities 7 59,317 56,313
Deferred income tax liabilities 26 10,396 5,242
Total non-current liabilities 157,810 144,934
Current liabilities
Trade payables 491,954 408,452
Other payables and accruals 152,770 129,057
Accrued cost of services 304,692 243,983
Borrowings 24 2,643 2,339
Derivative financial instruments 20 1,185 4,227
Current provisions 25 22,000 23,395
Current other liabilities 25 74,547 68,860
Current income tax liabilities 17,131 18,354
Total current liabilities 1,066,922 898,666
Total liabilities 1,224,732 1,043,600
Total equity and liabilities 1,839,031 1,660,565
CConsolidated Financial Statement panalpina.com 6
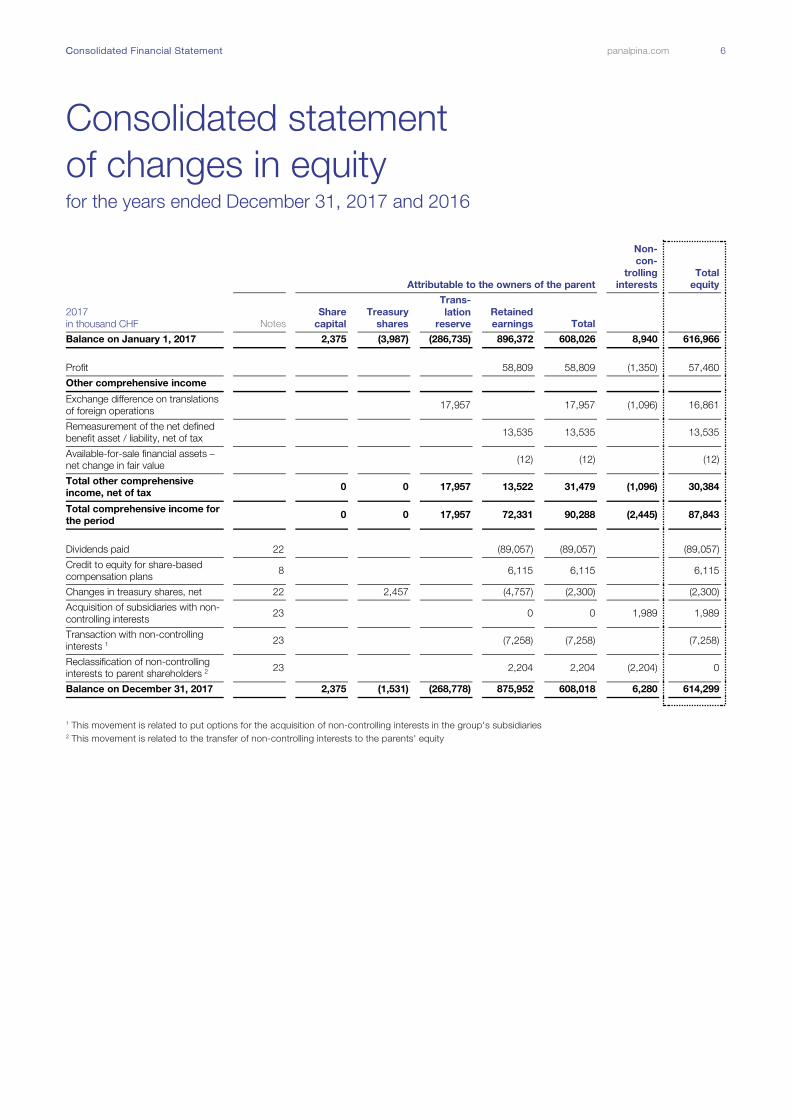
Consolidated statement
of changes in equity for the years ended December 31, 2017 and 2016
Attributable to the owners of the parent
Non-
con-
trolling
interests
Total
equity
2017
in thousand CHF Notes
Share
capital
Treasury
shares
Trans-
lation
reserve
Retained
earnings Total
Balance on January 1, 2017 2,375 (3,987) (286,735) 896,372 608,026 8,940 616,966
Profit 58,809 58,809 (1,350) 57,460
Other comprehensive income
Exchange difference on translations
of foreign operations
17,957 17,957 (1,096) 16,861
Remeasurement of the net defined
benefit asset / liability, net of tax
13,535 13,535 13,535
Available-for-sale financial assets –
net change in fair value
(12) (12) (12)
Total other comprehensive
income, net of tax
0 0 17,957 13,522 31,479 (1,096) 30,384
Total comprehensive income for
the period
0 0 17,957 72,331 90,288 (2,445) 87,843
Dividends paid 22 (89,057) (89,057) (89,057)
Credit to equity for share-based
compensation plans 8
6,115 6,115 6,115
Changes in treasury shares, net 22 2,457 (4,757) (2,300) (2,300)
Acquisition of subsidiaries with non-
controlling interests 23
0 0 1,989 1,989
Transaction with non-controlling
interests 1 23
(7,258) (7,258) (7,258)
Reclassification of non-controlling
interests to parent shareholders 2 23
2,204 2,204 (2,204) 0
Balance on December 31, 2017 2,375 (1,531) (268,778) 875,952 608,018 6,280 614,299 1 This movement is related to put options for the acquisition of non-controlling interests in the group's subsidiaries 2 This movement is related to the transfer of non-controlling interests to the parents' equity

CConsolidated Financial Statement panalpina.com 7
Attributable to the owners of the parent
Non-
con-
trolling
interests
Total
equity
2016
in thousand CHF Notes
Share
capital
Treasury
shares
Trans-
lation
reserve
Retained
earnings Total
Balance on January 1, 2016 2,375 (2,252) (278,288) 919,438 641,273 12,037 653,310
Profit 54,300 54,300 (2,012) 52,289
Other comprehensive income
Exchange difference on translations
of foreign operations (8,447) (8,447) 448 (7,999)
Remeasurement of the net defined
benefit asset / liability, net of tax 6,697 6,697 6,697
Available-for-sale financial assets –
net change in fair value 12 12 12
Total other comprehensive
income, net of tax 0 0 (8,447) 6,710 (1,737) 448 (1,289)
Total comprehensive income for
the period 0 0 (8,447) 61,010 52,563 (1,564) 50,999
Dividends paid 22 (83,097) (83,097) (83,097)
Credit to equity for share-based
compensation plans 8 5,252 5,252 5,252
Changes in treasury shares, net 22 (1,735) (2,296) (4,031) (4,031)
Acquisition of subsidiaries with non-
controlling interests 23 0 0 3,986 3,986
Transaction with non-controlling
interests 1 23 (9,453) (9,453) (9,453)
Reclassification of non-controlling
interests to parent shareholders 2 23 5,519 5,519 (5,519) 0
Balance on December 31, 2016 2,375 (3,987) (286,735) 896,372 608,026 8,940 616,966 1 This movement is related to a put option for an acquisition of a non-controlling interests in one of the group's subsidiaries 2 This movement is related to the transfer of non-controlling interests to the parents' equity

CConsolidated Financial Statement panalpina.com 8
Consolidated statement of cash flows for the years ended December 31, 2017 and 2016
In thousand CHF Notes 2017 2016
Profit 57,460 52,289
Income tax expenses 11 44,082 29,295
Depreciation of property, plant and equipment 13 21,294 25,782
Amortization of intangible assets 14 21,570 23,919
Interest income and dividend on available-for-sale financial assets 10 (2,232) (1,672)
Exchange differences 10 (512) (1,026)
Loss / (gain) on sales of property, plant and equipment 9 (329) (2,933)
Loss / (gain) on sales of financial assets 15 0 48
Expenses for share-based compensation plans 6 / 8 6,115 5,252
Other non-cash (income) and expenses 6,138 340
Subtotal cash flow from operations 153,586 131,293
Working capital adjustments:
(Increase) / decrease receivables, other current assets and unbilled forwarding services (175,106) 51,838
(Decrease) / increase payables and accruals incl. accrued cost of service 131,519 (43,370)
(Decrease) / increase non-current provisions and other liabilities (6,950) 11,994
(Decrease) / increase current provisions and other liabilities 2,563 (1,613)
Cash generated from operations 105,613 150,142
Interest paid 24 (1,220) (1,481)
Income taxes paid (37,087) (37,915)
Net cash from operating activities 67,306 110,747
Interests received 2,178 1,799
Dividends received 10 100 172
Proceeds from sale of property, plant and equipment and intangible assets 1,757 16,408
Proceeds from sale of investments 2,405 3,284
Proceeds from sale of other financial assets 15 0 9
Repayments of loans and long-term receivables 5,493 8,441
Acquisition of subsidiaries and other businesses, net of cash 29 (10,594) (21,278)
Purchase of property, plant and equipment (53,169) (23,344)
Purchase of intangible assets (828) (1,261)
Purchase of investments and other financial assets (11,589) (3,835)
Investments in long-term loans and long-term receivables (3,886) (4,542)
Net cash used in investing activities (68,132) (24,148)
Free cash flow (826) 86,599
Proceeds from short- and long-term borrowings 24 3,254 0
Repayment of short- and long-term borrowings 24 (82) (37)
Dividends paid (89,057) (83,097)
Purchase of treasury shares 22 (3,775) (7,031)
Sale of treasury shares 1,475 1,457
Net cash used in financing activities (88,184) (88,708)
Net increase / (decrease) in cash and cash equivalents (89,010) (2,109)
Cash and cash equivalents at the beginning of the year 21 388,777 392,260
Effect of exchange rate changes on cash and cash equivalents 17.2 11,084 (1,374)
Cash and cash equivalents at the end of the year 21 310,850 388,777
Consolidated Financial Statement panalpina.com 9
Notes to the consolidated financial
statements
1. General information
Panalpina World Transport (Holding) Ltd. (referred to hereafter as the Company) and its subsidiaries (collectively the "Group" and individually
"Group Companies") is one of the world’s leading providers of supply chain solutions. The company combines its core products of Air
Freight, Ocean Freight and Logistics to deliver globally integrated tailor-made end-to-end solutions. Drawing on in-depth industry
knowledge and customized IT systems, Panalpina manages the needs of its customers’ supply chains, no matter how demanding they
might be.
Panalpina World Transport (Holding) Ltd. is a limited company incorporated and domiciled in Basel. The registered address is
Viaduktstrasse 42, 4002 Basel, Switzerland. The Company shares are publicly traded and listed on the SIX Swiss Exchange in Zurich.
The consolidated financial statements for the year ending December 31, 2017, were authorized for issuance in accordance with a
resolution by the Board of Directors on March 2, 2018.
2. Summary of significant accounting policies
The principal accounting policies applied in the preparation of these Consolidated Financial Statements are set out below. These
policies have been consistently applied to all the years presented, unless otherwise stated.
2.1 Basis of preparation
The Consolidated Financial Statements are based on the accounts of the individual subsidiaries on December 31, which have been
drawn up according to uniform Group accounting principles.
2.2 Statement of compliance
The consolidated accounts have been prepared in accordance with International Financial Reporting Standards (IFRS) and comply with
Swiss law.
2.3 Changes in presentation
In 2017, there was no change in presentation compared to the prior year Consolidated Financial Statements except for the restructuring
expenses, which have been disclosed in the prior period as a separate line item in the consolidated income statement. As described in
the Consolidated Financial Statements 2016 under note 2.3, the restructuring expenses in the amount CHF 28.0 mio. related to the
right-sizing of certain energy solutions operations and sites, which was considered a fundamental change in the Group's strategy with
the outcome that the Group's footprint in the Oil and Gas industry was drastically reduced. Hence, due to its relevance for the
understanding of the Group’s financial performance, management decided to present the 2016 restructuring expenses as an additional
line item in the face of the consolidated income statement. The restructuring occurred during 2017 did however not represent such a
fundamental change in the group’s strategy or organizational footprint in a specific industry sector hence the restructuring expenses are
reported as part of personnel expenses and were not reclassified to this “separate item” line in the face of the consolidated income
statement.
2.4 Basis of measurement
The Consolidated Financial Statements have been prepared under the historical cost basis, except for available-for-sale financial assets,
financial assets and financial liabilities (including derivative instruments) at fair value through profit and loss and liabilities for cash-settled
share-based payment arrangements that have been measured at fair value. Net defined benefit liabilities (assets) are recognized at the
difference in fair value of the plan assets and the present value of the defined benefit obligation.
2.5 Presentation currency
The Consolidated Financial Statements are presented in Swiss francs (CHF), which is the functional currency of the company and all
values are rounded to the nearest thousand except where otherwise indicated.
2.6 Use of estimates and judgment
The preparation of the Consolidated Financial Statements in conformity with IFRS requires management to make judgments, estimates
and assumptions that affect application of accounting policies and the reported amounts of assets, liabilities, income and expenses. It
requires management to exercise its judgments and assumptions in the process of applying the Group’s accounting policies. Actual
results may differ from these estimates.
Estimates and underlying assumptions are reviewed on an ongoing basis. Deviations from estimates are recognized in the period in
which the estimates are revised and in any future periods affected. The areas involving a higher degree of judgment or complexity or
areas in which assumptions and estimates are significant to the Consolidated Financial Statements are disclosed in note 4.
As outlined in detail in the next section of this document, a number of the Group’s accounting policies and disclosures require the
measurement of fair values, for both financial and non-financial assets and liabilities. When measuring the fair value of an asset or a
liability, the Group uses market observable data as far as possible. Fair values are categorized into different levels in a fair value
hierarchy based on the inputs used in the valuation techniques as described in note 17. The Group recognizes transfers between levels
Consolidated Financial Statement panalpina.com 10
of the fair value hierarchy, if any, at the end of the reporting period during which the change has occurred. The methods used to
measure fair values are discussed further in note 3. Further information about the assumptions made in measuring fair values is included
in note 17.
3. Significant accounting policies
The accounting policies set out below have been applied consistently to all periods presented in these Consolidated Financial
Statements and have been applied consistently by Group entities. If necessary, comparative amounts have been re-represented to
conform with to current year’s presentation.
3.1 Changes in standards, interpretation and amendments
The adoption of the following new or amended standards and interpretations, that are effective for the financial year beginning on
January 1, 2017, did not have a material impact on the Group’s Consolidated Financial Statements:
o Amendments to IAS 12 --- Recognition of Deferred Tax Assets for Unrealized Losses
o Annual Improvements to IFRS Standards 2014---2016 Cycle --- Amendments to IFRS 12
o Amendments to IAS 7 --- Disclosure Initiative
The latter amendment, which was applied by the Group for the first time in the current year, introduces the disclosure of the
reconciliation of liabilities arising from financing activities. Consistent with the transition provision, the Group has not disclosed
comparative information (see note 24).
3.2 New and revised standards
The Group analyzed in detail upcoming new IFRS standards and revisions/amendments to IFRS standards and came to the conclusion,
that the following changes will be relevant for the Group. None of these changes have been early adopted yet.
IFRS 15 – Revenue from Contracts with Customers (effective date January 1, 2018)
The Group’s net forwarding revenue is resulting from rendering of forwarding and logistic services. In general, control is transferred to
the contractual counterparty and subsequently the Group’s performance obligations are met at the time of receipt of the services by the
counterparty. Based on the Group’s detailed assessment, the conclusion was reached that IFRS 15 is not significantly changing the
timing or amount of revenue recognized in respect to the agreements but will impact the level of disclosures.
The Group implemented the new standard on January 1, 2018 and applied the modified retrospective method, which requires the
recognition of the cumulative effect of initially applying IFRS 15, as of January 1, 2018, to the retained earnings and not restate prior
years. As noted above, IFRS 15 does not significantly change the amount or timing of revenue recognition in 2017 or prior periods,
consequently the cumulative adjustment to retained earnings will not be material.
IFRS 9 – Financial Instruments (effective date January 1, 2018)
The standard changes the requirements in terms of classification, measurement and impairment of financial instruments. The Group
came to the conclusion, that the main impact on the Group’s financial statements arises from the calculation of the bad debt provision
(by implementing the expected credit loss methodology), however based on current and potential future market and counterparty risk
this impact is not material.
The Group implemented the new standard on January 1, 2018 and applied the exemption from full retrospective application for the
reclassification and measurement requirements, including impairment, hence the comparative 2017 results have not been restated
when the new standard was applied.
IFRS 16 – Leases (effective date January 1, 2019)
The Group is early adopting IFRS 16 as from January 1, 2018 which substantially changes the Group’s Consolidated Financial
Statements. As disclosed in Note 28, the undiscounted operating lease commitments amount to CHF 397 mio. as of December 31,
2017. Under IFRS 16 the majority of these leases become on-balance sheet liabilities with underlying right-of-use assets. The Group
recognized approximately CHF 360 mio. of right of use assets and lease liabilities as of January 1, 2018. Also, the Group income
statement is impacted by a shift of approximately CHF 125 mio. from gross profit and other operating expenses to depreciation of right
of use assets and interest expenses. However given the current low interest rates, most of the CHF 125 mio. shift is reported under
depreciation of right of use assets.
The Group applies the cumulative catch-up approach, which requires the recognition of the cumulative effect of initially applying IFRS
16, as of January 1, 2018, to the retained earnings and not restate prior years. Since the Group recognizes the right-of-use assets at
the amount equal to the lease liabilities (as per IFRS 16C8(b)ii) there is no impact on the retained earnings.
The following other IFRS standards, interpretations or amendments, that are not yet effective, are not expected to have a material
impact on the Group:
• Amendments to IFRS 2 – Classification and Measurement of Share-based Payment Transactions (effective date January 1, 2018)
• IFRIC 22 – Foreign Currency Transactions and Advance Consideration (effective date January 1, 2018)
• Annual Improvements to IFRS Standards 2014–2016 Cycle – Amendments to IFRS 1 and IAS 28 (effective date January 1, 2018)
• Annual Improvements to IFRS Standards 2015–2017 Cycle (effective date January 1, 2019)
• Plan Amendment, Curtailment or Settlement – Amendments to IAS 19) (effective date January 1, 2019)
Consolidated Financial Statement panalpina.com 11
3.3 Basis of consolidation
3.3.1 Consolidation policy
The subsidiaries are those companies controlled, directly or indirectly, by Panalpina World Transport (Holding) Ltd. The Group controls
an entity when it is exposed to, or has rights to, variable returns from its involvement with the entity and has the ability to affect those
returns through its power over the entity. This control is normally evidenced when the Group owns, either directly or indirectly, more
than one half of the voting rights.
The Group also assesses existence of control where it does not have more than 50 percent of the voting power but is able to govern
the financial and operating policies by de-facto control. De-facto control may arise in circumstances where the size of the Group’s
voting rights relative to the size and dispersion of holdings of other shareholders give the Group the power to govern the financial and
operating policies. In some circumstances, control was also derived from the purpose and design of the investee or the Group’s ability
to direct the main activities of the subsidiary.
Subsidiaries are fully consolidated from the date on which control is transferred to the Group and they are de-consolidated from the
date that control ceases. In case of business combination, the Group applies the rules described in note 3.13.1 of this document.
Intercompany transactions, balances, income and expenses on transactions between Group companies are eliminated. Unrealized
losses are eliminated in the same way as unrealized gains.
Changes in ownership interest in subsidiaries without change of control
Transactions with non-controlling interests that do not result in loss of control are accounted for as equity transactions – that is, as
transactions with the owners in their capacity as owners. The difference between fair value of any consideration paid and the relevant
share acquired of the carrying value of net assets of the subsidiary is recorded in equity. Gains or losses on disposals to non-controlling
interests are also recorded in equity.
Disposal of subsidiaries
When the Group ceases to have control, any retained interest in the entity is remeasured to its fair value at the date when control is lost,
with the change in carrying amount recognized in the income statement. The fair value is the initial carrying amount for the purposes of
subsequent accounting for the retained interest as an associate, joint venture or financial asset. In addition, any amounts previously
recognized in other comprehensive income in respect of that entity are accounted for as if the Group had directly disposed of the
related assets or liabilities. Amounts previously recognized in other comprehensive income are reclassified to the income statement.
3.3.2 Scope of consolidation
The list of the principal group companies and participations considered for the establishment of the group's Consolidated Financial
Statements is disclosed in note 29.
3.3.3 Operating segment information
Management has determined the operating segments based on the reports reviewed by the Executive Board that are used to make
strategic decisions. The Executive Board considers the business from a geographic perspective as the Group’s operations are
predominately managed by geographical location. Headquarter activities are not separately reported but included in the respective
results of each segment in the segment information. The Executive Board assesses performance of the operating segments based on a
measure of adjusted operating result (Segment EBIT). This measurement basis excludes the effects on non-recurring expenditure from
the operating segments.
Revenue is attributed to an individual country based on the domicile of the entity issuing the invoices to the customer. Transfer prices
between operating segments are set out at arm’s-length basis.
Operating assets and liabilities consist of property, plant and equipment, goodwill and intangible assets, trade receivables / payables,
other assets and liabilities such as provisions and current income taxes, which can be reasonably attributed to the reported operating
segments. Non-operating assets and liabilities mainly include deferred income tax balances, post-employment benefit assets / liabilities
and financial assets / liabilities such as marketable securities and investments.
3.4 Foreign currency
3.4.1 Functional currency
Most Group companies use their local currency as their functional currency. Certain Group companies use other currencies (such as US
dollars or Euros) as their functional currency where this is the currency of the primary economic environment in which the entity or
branch operates.
3.4.2 Transactions and balances
Local transactions in other currencies are initially reported using the exchange rate at the date of the transaction or reporting date.
Gains and losses from the settlement of such transactions and gains and losses on transactions of monetary assets and liabilities
denominated in other currencies are included in the income statement, except when they arise on monetary items that, in substance,
form part of the Group’s net investment in a foreign entity. In such cases, the gains and losses are deferred into other comprehensive
income.
Non-monetary items that are measured in terms of historical cost in foreign currency are translated using the exchange rate as of the
dates of the initial transaction. Non-monetary items measured at fair value in a foreign currency are translated using the exchange rates
on the date on which the fair value is determined.

Consolidated Financial Statement panalpina.com 12
Changes in fair value of debt securities denominated in foreign currency classified as available-for-sale are split into components
resulting from changes in the amortized cost of the security and other changes in the carrying amount of the security. Foreign exchange
remeasurement differences related to changes in amortized cost are recognized in the income statement and other changes in the
carrying amount are recognized in other comprehensive income.
3.4.3 Presentation currency
On consolidation, assets and liabilities of Group companies using functional currency other than Swiss francs are translated into Swiss
francs using a year-end rate of exchange. Income, expenses and net income and cash flows are translated at the average rates of
exchange for the year. Translation differences due to the changes in exchange rates between the beginning and the end of the year and
the difference between net incomes translated at the average and year-end exchange rates are recognized as a separate component of
other comprehensive income.
On disposal of a foreign entity, the identified cumulative currency translation differences within equity relating to that foreign entity are
recognized in the income statement as part of the gain or loss on divestment. Any goodwill arising on the acquisition is treated as an
asset of the foreign operation and translated at the closing rate.
The following foreign currency exchange rates mostly impacted the current financial statements:
Statement of financial position1
Income statement and cash
flow statement2 Variance %
December
2017
December
2016
December
2017
December
2016
Statement of
financial
position 1
Income state-
ment and
cash flow
statement 2
BRL 0.296 0.314 BRL 0.309 0.284 BRL -5% 9%
CNY 0.150 0.147 CNY 0.146 0.148 CNY 2% -2%
EUR 1.169 1.071 EUR 1.110 1.090 EUR 9% 2%
GBP 1.316 1.255 GBP 1.267 1.335 GBP 5% -5%
MXN 0.050 0.049 MXN 0.052 0.053 MXN 1% -1%
PLN 0.280 0.243 PLN 0.261 0.250 PLN 15% 4%
SGD 0.732 0.707 SGD 0.713 0.713 SGD 4% 0%
USD 0.980 1.024 USD 0.985 0.985 USD -4% 0% 1 Period end rate 2 Period end average rate (i.e. year to date rate)
3.5 Revenue recognition
Net forwarding revenue includes amounts received, receivables and unbilled services for forwarding and logistics services performed
for customers after deducting trade discounts and volume rebates and excluding sales taxes and value-added taxes less charges for
customs and duty.
Trade discounts and volume rebates are recorded on an accrual basis consistent with recognition of the related revenue recorded as a
deduction for accounts receivable or as accrued liabilities. Such estimates are based on analyses of existing contractual obligations,
historical trends and the Group’s experience.
Revenue is recognized at the time the services are performed. Logistics projects with a longer period of delivery are recognized at the
stage of completion of the services on the reporting date. The stage of completion is assessed with reference to completion of the
specific transaction assessed on the basis of the actual service provided as a proportion of the total services to be provided. Where
necessary, single transactions are split into separately identifiable components to reflect the substance of the transaction. Conversely,
two or more transactions may be considered together for revenue recognition purposes, where the commercial effect cannot be
understood without reference to the series of transactions as a whole.
Gross profit includes net forwarding revenue from services rendered less related expenses for services provided by third parties net of
customs, duty and taxes. This is a key measurement for the group and also an industry practice.
Interest income is recognized as interest accrued using the effective interest method. Interest income is included in finance income in
the income statement.
Dividends are recognized when the Group’s right to receive the payment is established.
3.6 Forwarding services from third parties
Forwarding services from third parties include the corresponding direct services costs and related services costs rendered by a third
party. Trade discounts and volume rebates are recorded on an accrual basis consistent with the recognition of the related services.
3.7 Employee benefits
Wages, salaries, social security contributions, paid annual leave, sick leave and other benefits are paid or accrued undiscounted in the
year in which the associated services are rendered by employees of the Group. Legal or constructive obligations such as bonus or
profit-sharing plans are recognized for the amount expected to be paid in the year in which the services are provided and are presented
under other liabilities.

Consolidated Financial Statement panalpina.com 13
Termination benefits are expensed at the earlier of when the Group can no longer withdraw the offer of those benefits and when the
Group recognizes costs for a restructuring. If benefits are payable more than 12 months after the reporting date, then they are
discounted to their present value.
3.7.1 Pension obligations
Group companies operate various pension schemes. The schemes are generally funded through payments to insurance companies or
trustee-administered funds, determined by periodic actuarial calculations. The Group has both defined benefit and defined contribution
plans.
3.7.1.1 Defined Benefit Plan Typically defined benefit plans define an amount of pension benefit that an employee will receive on retirement, usually dependent on
one or more factors such as age, years of service and compensation.
The net defined benefit liability / asset recognized in the balance sheet in respect of defined benefit pension plans is the present value of
the defined benefit obligation at the end of the reporting period less the fair value of plan assets. The defined benefit obligation is
calculated annually by independent actuaries using the projected unit credit method. The present value of the defined benefit obligation
is determined by discounting the estimated future cash outflows using interest rate of high-quality corporate bonds that are
denominated in the currency in which the benefits will be paid and that have terms to maturity approximating to the terms of the related
pension obligation. In countries where there is no deep market in such bonds, the market rates on government bonds are used.
When the calculation results in a potential asset for the Group, the recognized asset is limited to the present value of economic benefits
available in the form of any future refunds from the plan or reduction in future contributions to the plan. To calculate the present value of
economic benefits, consideration is given to any applicable minimum funding requirements.
Remeasurements of the net defined benefit liability / asset which comprise actuarial gains and losses arising from changes in actuarial
assumptions (both demographic and financial) and experience adjustments, the return of plan assets (excluding interest) and the effect
of the asset ceiling (if any, excluding interest), are charged or credited immediately to equity in other comprehensive income. The Group
determines the net interest expense on the net defined benefit liability / asset at the beginning of the annual period by applying the
discount rate used to measure the defined benefit obligation at the beginning of the annual period to the net defined benefit liability /
asset, taking into account any changes in the net defined benefit liability / asset during the period as a result of contributions and benefit
payments. Net interest expense and other expenses related to defined benefit plans are recognized in the income statement under
“Personnel expenses”.
When the benefits of a defined benefit plan are changed or amended or when a defined benefit plan is curtailed, the resulting change in
benefit that relates to past service or the gain or loss on curtailment is recognized immediately in the income statement. The Group
recognizes gains and losses on the settlement of a defined benefit plan when the settlement occurs.
The Group applies the practical expedient and recognizes contributions from employees that are independent of the number of years of
service (including those that are a fixed percentage of an employee’s salary and are dependent on an employee’s age) as a reduction of
the service cost in the period in which the related service is rendered (IAS 19 paragraph 93 [b]).
3.7.1.2 Defined Contribution Plan A defined contribution plan is a pension plan under which the Group pays fixed contributions to publicly or privately administered
pension insurance plans on a mandatory, contractual or voluntary basis. The Group has no legal or contractual obligations to pay further
contributions if the fund does not hold sufficient assets to pay all employees the benefits relating to employee service in the current and
prior periods. The contributions are recognized as employee benefit expense when they are due. Prepaid contributions are recognized
as an asset to the extent that a cash refund or a reduction in the future payments is available.
3.7.2 Other long-term employee benefits
Net obligation in regard to long-term employee benefits other than pension plans is the amount of future benefits that employees have
earned in return for their service in the current and / or prior periods. Benefits are discounted to determine their present value and the
fair value of any related asset is deducted. This net amount is presented in non-current other liabilities in the balance sheet. The
expected costs of these benefits are accrued over the period of employment using the same method of valuation that is used for
defined benefit pension plans. Any actuarial gains or losses that consist of differences between assumptions and actual experiences
and the effects of changes in actuarial assumptions are recognized in the income statement in the period in which they arise.
3.7.3 Share-based compensation
The Group operates a number of equity-settled share-based compensation plans under which the entity receives services from
employees as consideration for equity or equity instruments (options) of the Group. The fair value of the employee services received in
exchange for the granting of the options and the discount on the shares granted is estimated at the grant date and recorded as an
expense over the vesting period. The expense is recognized as other employee benefits in the income statement. For equity-settled
plans, an increase in equity is recorded for this expense and any subsequent cash flows from exercises of vested awards are recorded
as changes in equity. For cash-settled plans, a liability is recorded that is measured at fair value at each reporting date with any
movements in fair value being recorded in the income statement. Any subsequent cash flows from exercise of vested awards are
recorded as a reduction of the liability.
3.8 Other operating expenses
Other operating expenses primarily include administrative expenses, communication expenses, rent and utilities expenses, travel and
promotion expenses, insurance expenses and claims, changes in provisions from impairments of trade receivables and collection
expenses and other operating expenses necessary to render forwarding revenue to third parties. The expenses are recognized when
the expenses recorded on an accrual basis have been incurred.
Consolidated Financial Statement panalpina.com 14
3.9 Finance income and costs
Finance income comprises interest income on funds invested, dividend income from investments, cash discounts, gains on disposals of
available-for-sale financial assets, changes in the fair value of financial assets at fair value through profit or loss and gains on derivatives
that are recognized in profit or loss. Interest income is recognized as it accrues in profit or loss using the effective interest method.
Finance costs comprise interest expenses on borrowings, unwinding of the discount on provisions, cash discounts, changes in the fair
value of financial assets at fair value through profit or loss, impairment losses recognized on financial assets, losses on hedging
instruments that are recognized in profit or loss, bank charges and bank guarantee fees. All borrowing costs are recognized in profit or
loss using the effective interest method.
3.10 Current and deferred income tax expenses
The tax expense for the period comprises current and deferred tax. Tax is recognized in the income statement, except to the extent that
it relates to items recognized in other comprehensive income or directly in equity. In this case, the tax impacts are also recognized in
other comprehensive income or directly in equity, respectively.
Current income tax is the expected tax payable on the taxable income for the year, using tax rates enacted or substantively enacted at
the reporting date, and any adjustment to tax payable in respect of previous years. Management periodically evaluates positions taken
in tax returns with respect to situations in which applicable tax regulation is subject to interpretation. It establishes provisions where
appropriate on the basis of amounts expected to be paid to the tax authorities.
Deferred income tax is recognized using the balance sheet method, providing for temporary differences between the carrying amounts
of assets and liabilities for financial reporting purposes and the amounts used for taxation purposes. Deferred income tax is not
recognized for the following temporary differences: the initial recognition of assets or liabilities in a transaction that is not a business
combination and that affects neither accounting nor taxable profit, and differences relating to investments in subsidiaries and associates
to the extent that it is probable that they will not reverse in the foreseeable future. In addition a deferred income tax liability is not
recognized for taxable temporary differences arising on the initial recognition of goodwill. Deferred tax is measured on an undiscounted
basis at the tax rates that are expected to be applied to the temporary differences when they reverse, based on the laws that have been
enacted or substantively enacted by the reporting date. Deferred income tax assets and liabilities are offset if there is a legally
enforceable right to offset current income tax liabilities and assets, and they relate to income taxes levied by the same tax authority on
the same taxable entity, or on different tax entities but they intend to settle current income tax liabilities and assets on a net basis or
their tax assets and liabilities will be realized simultaneously.
A deferred income tax asset is recognized for all deductible temporary differences, carry forward of unused tax credits and unused tax
losses to the extent that it is probable that future taxable profits will be available against which the temporary difference can be utilized.
Deferred income tax assets are reviewed at each reporting date and are reduced to the extent that it is no longer probable that the
related tax benefit will be realized.
Additional income taxes that arise from the distribution of dividends are recognized when the distribution is expected.
3.11 Property, plant and equipment
Property, plant and equipment are measured at cost, net of accumulated depreciation and / or accumulated impairment losses, if any.
Initially property, plant and equipment are recorded at cost of purchase or construction and include all costs directly attributable to
bringing the asset to the location and condition necessary for it to be capable of operating in the manner intended by management.
Interest and other borrowing costs for long-term construction projects are capitalized and included in the carrying value of the assets.
All other repair and maintenance costs of the day-to-day servicing are recognized in the income statement as incurred. The present
value of the expected cost for the decommissioning of the asset after its use is included in the cost of the respective asset if the
recognition criteria for a provision are met (while on the other hand, a corresponding provision is booked). When components of an item
of property, plant and equipment have different useful lives, they are accounted for as separate items of property, plant and equipment.
Gains and losses on a disposal of an item of property, plant and equipment are determined by comparing the proceeds from disposal
with the carrying amount of property, plant and equipment and are recognized net within other operating expenses in the income
statement. For additional information see note 9 – Other operating expenses.
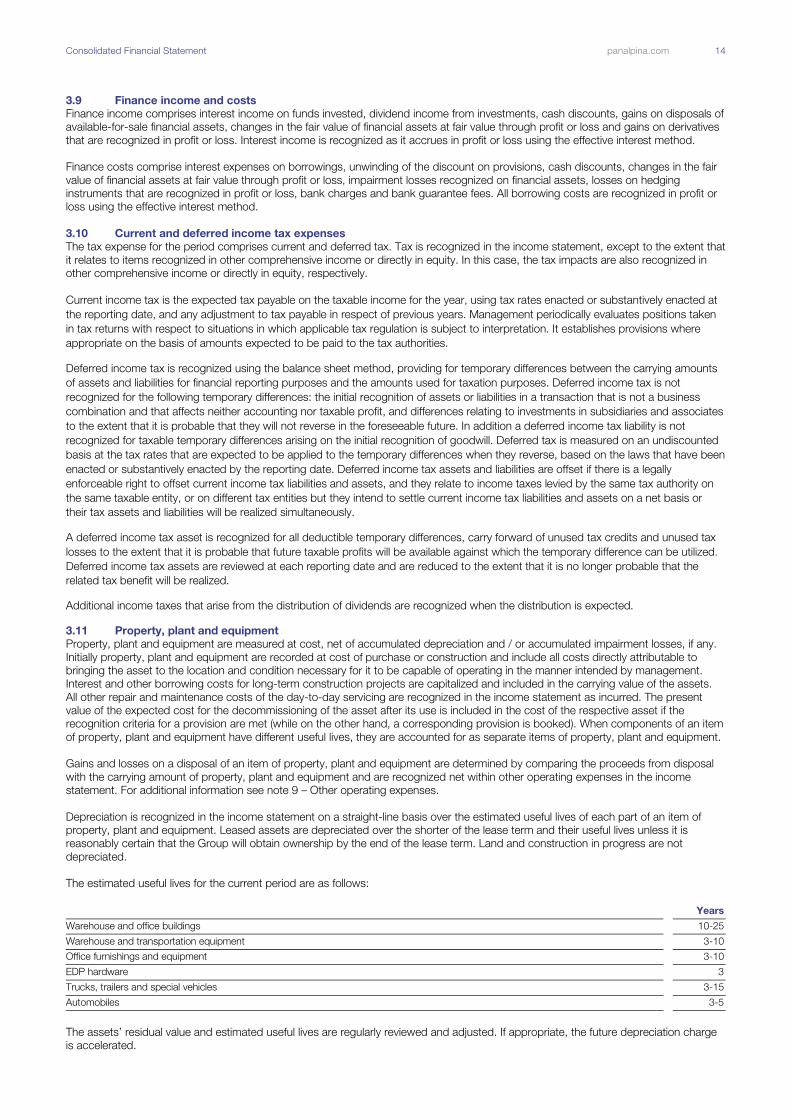
Depreciation is recognized in the income statement on a straight-line basis over the estimated useful lives of each part of an item of
property, plant and equipment. Leased assets are depreciated over the shorter of the lease term and their useful lives unless it is
reasonably certain that the Group will obtain ownership by the end of the lease term. Land and construction in progress are not
depreciated.
The estimated useful lives for the current period are as follows:
Years
Warehouse and office buildings 10-25
Warehouse and transportation equipment 3-10
Office furnishings and equipment 3-10
EDP hardware 3
Trucks, trailers and special vehicles 3-15
Automobiles 3-5
The assets’ residual value and estimated useful lives are regularly reviewed and adjusted. If appropriate, the future depreciation charge
is accelerated.
Consolidated Financial Statement panalpina.com 15
3.12 Leases
Where the Group is the lessee, leases of property, plant and equipment where the Group has substantially all of the risks and rewards
of ownership are classified as finance leases. Financial leases are capitalized at the start of the lease at fair value or the present value of
the minimum lease payments, if lower. Assets acquired under finance leases are depreciated in accordance with the Group’s policy on
property, plant and equipment. If there is no reasonable certainty that the Group will obtain ownership by the end of the lease term, the
asset is depreciated over the shorter of the lease term and useful life. The corresponding leasing obligations, net of finance charges, are
included in borrowings. The interest element of the finance cost is charged to the income statement over the lease period in order to
produce a constant periodic rate of interest on the remaining balance of the liability for each period.
Leases where substantially all of the risks and rewards of ownership are not transferred to the Group are classified as operating leases.
Payments made under operating leases are charged against the income statement on a straight-line basis over the period of the lease.
3.13 Intangible assets
3.13.1 Business combination and goodwill
Business combinations are accounted for using the acquisition method of accounting. The consideration transferred in a business
combination is measured at fair value at the date of acquisition and includes the cash paid plus the fair value at the date of exchange of
assets given, liabilities incurred or assumed and equity instruments issued by the Group. The fair value of the consideration transferred
also includes contingent consideration arrangements at fair value. Directly attributable acquisition-related costs are expensed in the
income statement.
At the date of acquisition the Group recognizes the identifiable assets acquired and the liabilities assumed at fair value. Where the
Group does not acquire 100 percent ownership of the acquired business, non-controlling interests are recorded as the proportion of the
fair value of the acquired net assets attributable to non-controlling interest.
Goodwill is initially measured as the excess of the aggregate of the consideration transferred and the fair value of non-controlling interest
over the net identifiable assets acquired and liabilities assumed. If this consideration is lower than the fair value of the net assets of the
subsidiary acquired, the difference is recognized in the income statement. Any goodwill and fair value adjustments are recorded as
assets and liabilities of the acquired business in the functional currency of that business.
If the initial accounting for a business combination is incomplete at the end of a reporting period, provisional amounts are used. During
the measurement period, the provisional amounts are retrospectively adjusted and additional assets and liabilities may be recognized, to
reflect new information obtained about the amounts recognized at acquisition date, had they been known.
Goodwill is not amortized but assessed for possible impairment at each reporting date or more frequently if events or changes in
circumstance indicate a potential impairment. For the purpose of impairment testing, goodwill acquired in a business combination is
allocated to each of the Group’s cash-generating units that are expected to benefit from the synergies of the combination, irrespective
of whether other assets or liabilities of the acquiree are assigned to those units. When the recoverable amount of the cash-generating
units, being the higher of its fair value less costs of disposal or its value in use, is less, then the carrying value of the goodwill is reduced
to its recoverable amount. The reduction is reported in the income statement as an impairment loss.
Changes in ownership interest in subsidiaries are accounted for as equity transactions if they occur after control has already been
obtained and if they do not result in a loss of control.
In situations where the Group grants the right to the holders of non-controlling interests to sell their shares at a future date (put option),
a financial (redemption) liability is recognized at the present value of the redemption amount with a corresponding entry in equity. Such
financial liability is subsequently remeasured at each reporting date through the income statement.
In terms of the disclosure requirements as defined in IFRS 3, management considered these requirements and came to the conclusion
for certain transactions, which are either individually or in aggregate below a certain threshold, these transactions will not be considered
material for disclosure purposes. Management will assess each transaction individually and in aggregate also considering qualitative
factors (e.g. strategic nature, impact on business model etc.) before deciding to which extent disclosures shall be included in the notes
to the Consolidated Financial Statements.
3.13.2 Customer list
Customer lists acquired in a business combination are recognized at fair value at the acquisition date. Customer lists have a finite useful
life and are carried at cost less accumulated amortization and accumulated impairment losses. Amortization is calculated using the
straight-line method over the expected life of the customer lists which is usually comprised between three to five years.
3.13.3 Computer software
Development costs that are directly attributable to the design and testing of identifiable and unique software products controlled by the
Group are recognized as intangible assets when the following criteria are met:
it is technically feasible to complete the software product so that it will be available for use;
management intends to complete the software product and use or sell it;
there is an ability to use or sell the software product;
it can be demonstrated how the software product will generate probable future economic benefits;
adequate technical, financial and other resources to complete the development and to use or sell the software product are
available; and
the expenditure attributable to the software product during its development can be reliably measured.
Directly attributable costs that are capitalized as part of the software product include software development costs, employee costs and
an appropriate portion of relevant overhead costs. Other development expenditures that do not meet these criteria are recognized as an

Consolidated Financial Statement panalpina.com 16
expense as incurred. Development costs previously recognized as expenses are not recognized as an asset in a subsequent period.
Costs associated with maintaining computer software programs are recognized as an expense as incurred. Computer software
development costs recognized as assets are amortized over their estimated useful life, which does not exceed three years (except for
SAP TM which was internally generated and where a useful life of 5 years is used).
3.13.4 Other intangible assets
Other intangible assets that are acquired by the Group that have finite useful lives are measured at cost less accumulated amortization
and accumulated impairment losses.
3.14 Impairment of property, plant and equipment and intangible assets (excl. goodwill)
An impairment assessment is carried out when there is evidence that an asset may be impaired. In addition, intangible assets that are
not yet available for use are tested for impairment annually. If any such indication exists, or when annual impairment testing for an asset
is required, the Group makes an estimate of the asset’s recoverable amount. An asset’s recoverable amount is the higher of an asset’s
or cash-generating unit’s fair value less costs of disposal and its value in use and is determined for an individual asset, unless the asset
does not generate cash inflows that are largely independent of those from other assets or asset groups. Where the carrying amount of
an asset exceeds its recoverable amount, the asset is impaired to its recoverable amount. In assessing value in use, the estimated
future cash flows are discounted to their present value using a pre-tax discount rate that reflects current market assessments of the
time value of money and the risks specific to the asset. An appropriate valuation model is used to determine fair value less costs of
disposal. These calculations are corroborated by valuation multiples, quoted share prices for publicly traded entities or other available
fair value indicators. Impairment losses are recognized in the income statement. When an impairment loss arises, the useful life of the
asset in question is reviewed and, if necessary, the future depreciation / amortization charge is accelerated.
3.15 Financial instruments
3.15.1 Amortized cost of financial instruments
Amortized cost is computed using the effective interest method less any allowance for impairment and principal repayment or reduction.
The calculation takes into account any premium or discount on acquisition and includes transaction costs that are an integral part of the
effective interest rate.
3.15.2 Financial assets
Financial assets, including cash and marketable securities, short-and long-term deposits, trade and other receivables, loans, quoted
and unquoted financial instruments and derivative financial instruments, are classified either as fair value through profit or loss, loans and
receivables, available-for-sale, or in exceptional cases, as held to maturity. The classification depends on the purpose for which the
financial assets were acquired. Management determines the classification of its financial assets at initial recognition. All financial assets
are initially recognized at fair value plus, in the case of investments not at fair value through profit or loss, directly attributable transaction
costs. All purchases and sales are recognized on the settlement date.
3.15.2.1 Subsequent measurement Financial assets at fair value through profit or loss
Financial assets at fair value through profit or loss include financial assets held for trading and financial assets designated on initial
recognition at fair value through profit or loss. Financial assets are classified as held for trading if they are acquired for the purpose of
selling in the near term. This category includes derivative financial instruments entered into by the Group. Financial assets at fair value
through profit or loss are carried on the statement of financial position at fair value with gains or losses recognized in the income
statement.
Loans and receivables
Loans and receivables are non-derivative financial assets with fixed or determinable payments that are not quoted in an active market.
Subsequent to initial recognition, they are measured at amortized cost using the effective interest method. Gains and losses are
recognized in the income statement when the loans and receivables are derecognized or impaired, as well as through the amortization
process.
Trade receivables originated by the Group are financial assets that are created by providing services directly to the debtor. Such
receivables are not quoted and are not originated with the intention to be sold immediately or in the near term. Receivables are
presented in current assets for maturities up to 12 months (accounting treatment of trade receivables is outlined in more detail in the
section: Trade receivables).
Available-for-sale financial assets
Available-for-sale financial assets are non-derivative financial assets that are designated as available-for-sale or are not classified in any
of the three preceding categories. Subsequent to initial recognition, available-for-sale financial asset are measured at fair value and
changes therein, other than impairment losses and foreign currency differences on debt instruments, are recognized in other
comprehensive income and accumulated in the fair value reserve. When the assets are derecognized, the gain or loss accumulated in
equity is reclassified to the income statement.
3.15.2.2 Impairment of financial assets Financial assets other than those classified as at fair value through profit or loss (including interests in an equity accounted investee) are
assessed at each reporting date to determine whether there is objective evidence of impairment. Objective evidence that financial
assets are impaired includes:
default or delinquency by a debtor (more than 180 days overdue);
restructuring of an amount due to the Group on terms that the Group would not consider otherwise;
Consolidated Financial Statement panalpina.com 17
indications that a debtor or issuer will enter bankruptcy;
adverse changes in the payment status of borrowers or issuers;
the disappearance of an active market for a security; or
observable data indicating that there is a measurable decrease in the expected cash flows from a group of financial assets.
For an investment in an equity security, objective evidence of impairment includes a significant or prolonged decline in its fair value
below its cost. The Group considers a decline of 20% to be significant and a period of nine months to be prolonged.
Loans and receivables
For financial assets at amortized costs, the Group considers evidence of impairment for these assets at both an individual asset and a
collective level. All individually significant assets are individually assessed for impairment. Those found not to be impaired are then
collectively assessed for any impairment that has been incurred but not yet individually identified. Assets that are not individually
significant are collectively assessed for impairment. Collective assessment is carried out by grouping together assets with similar risk
characteristics. In assessing collective impairment, the Group uses historical information on the timing of recoveries and the amount of
loss incurred, and makes an adjustment if current economic and credit conditions are such that the actual losses are likely to be greater
or lesser than suggested by historical trends.
An impairment loss is calculated as the difference between an asset’s carrying amount and the present value of the estimated future
cash flows discounted at the asset’s original effective interest rate. Losses are recognized in the income statement and reflected in an
allowance account. When the Group considers that there are no realistic prospects of recovery of the asset, the relevant amounts are
written off. If the amount of impairment loss subsequently decreases and the decrease can be related objectively to an event occurring
after the impairment was recognized, then the previously recognized impairment loss is reversed in the income statement.
For trade receivables, an allowance for doubtful accounts is recorded when there is objective evidence that the Group will not be able to
collect all amounts due according to the original terms of receivables (see examples above). Significant financial difficulties of the debtor,
probability that the debtor will enter bankruptcy or financial reorganization and default or delinquency in payments (more than 180 days
overdue) are considered indicators that the trade receivable is impaired. The amount of the provision is the difference between the
asset’s carrying amount and the present value of estimated future cash flows. The carrying amount of the asset is reduced through the
use of an allowance account and the amount of the loss is recognized in the income statement within other operating expenses. When
a trade receivable is uncollectible, it is written off against the allowance account for trade receivables.
Subsequent recoveries of amounts previously written off or 100 percent impaired are credited against other operating expenses in the
income statement. Trade discounts, volume rebates and similar allowances are recorded on an accrual basis consistent with the
recognition of the related sales, using estimates based on existing contractual obligations, historical trends and the Group’s experience.
Long-term accounts receivable are discounted to take into account the time value of money.
Available-for-sale financial assets
For Available-for-sale financial assets, impairment losses are recognized by reclassifying the losses accumulated in the fair value reserve
to profit or loss. The amount reclassified is the difference between the acquisition costs (net of any principal repayment and
amortization) and the current fair value, less any impairment loss previously recognized in profit or loss. If the fair value of an impaired
available-for-sale debt security subsequently increases and the increase can be related objectively to an event occurring after the
impairment loss was recognized, then the impairment loss is reversed through profit or loss; otherwise, it is reversed through OCI.
3.15.2.3 Derecognition of financial assets A financial asset is derecognized when:
the Group’s rights to receive cash flows from the asset have expired; or
the Group has transferred its rights to receive cash flows from the asset or has assumed an obligation to pay the received cash
flows in full without material delay to a third party under a ‘‘pass-through’’ arrangement; and either (a) the Group has transferred
substantially all the risks and rewards of the asset or (b) the Group has neither transferred nor retained substantially all the risks and
rewards of the asset, but has transferred control of the asset.
3.15.3 Financial liabilities
Financial liabilities are either classified as financial liabilities at fair value through profit or loss or as other financial liabilities. The Group
determines the classification of its financial liabilities at initial recognition. Financial liabilities are recognized initially at fair value plus, in the
case of loans and borrowings, directly attributable transaction costs. The Group’s financial liabilities include trade and other payables,
loans and borrowings and derivative financial instruments.
3.15.3.1 Subsequent measurement Financial liabilities at fair value through profit or loss include financial liabilities held for trading and financial liabilities designated on initial
recognition as at fair value through profit or loss. This category includes derivative financial instruments entered into by the Group. Gains
or losses on liabilities at fair value through profit or loss are recognized in the income statement.
3.15.3.2 Borrowings After initial recognition, interest-bearing loans and borrowings are subsequently measured at amortized cost. Any discount between the
net proceeds received and the principal value due on redemption is amortized over the duration of the debt instruments and is
recognized as part of financing costs using the effective interest method.
Consolidated Financial Statement panalpina.com 18
3.15.3.3 Derecognition of financial liabilities Financial liabilities are derecognized when the contractual obligations are discharged, cancelled or expired. Where a financial liability is
replaced by another from the same lender on substantially different terms, or the terms of an existing liability are substantially modified,
such an exchange or modification is treated as a derecognition of the original liability. The recognition of a new liability and the difference
in the respective carrying amounts is recognized in the income statement.
3.15.4 Derivatives
The Group holds derivative financial instruments to hedge its foreign currency risk exposures. Hedge accounting as defined under IAS
39 is not applied. Derivative financial instruments are initially recognized and subsequently carried at fair value. All changes in fair value
are recorded as financial income or financial costs in the period in which they arise. Embedded derivatives are recognized separately if
not closely related to the host contract and where the host contract is carried at amortized cost. Attributable transaction costs are
recognized in the income statement when incurred. Derivatives are carried as financial assets when the fair value is positive and as
financial liabilities when the fair value is negative.
3.15.5 Trade receivables
Trade receivables are carried at the original invoice amount less valuation adjustments for impairment, trade discounts, volume rebates
and similar allowances. Subsequently, accounts receivable are measured at amortized cost using the effective interest method.
3.16 Unbilled forwarding services
Unbilled forwarding services represent the gross unbilled amount expected to be collected from customers for forwarding services in
progress for which costs are incurred but not yet invoiced. For logistics projects and other services with a longer period of delivery,
recognized profits are included.
3.17 Cash and cash equivalents and other current financial assets
Cash and cash equivalents included in the statement of financial position and statement of cash flows represent cash on hand, bank
and postal checks, bills of exchange (net), current balance with banks and similar institutions and time deposits and highly liquid money
market papers with a maturity period of less than three months from the date of acquisition. Such balances are reported as cash only if
they are readily convertible to known amounts of cash and are subject to insignificant risk of change in value.
Other current financial assets include time deposits and highly liquid money market papers with a maturity period of between three
months and one year.
3.18 Share capital
Ordinary shares are classified as equity. Incremental costs directly attributable to the issue of new shares or options are recognized in
equity as a deduction, net of tax effects, from the proceeds.
3.19 Treasury shares
When share capital recognized as equity is repurchased, the amount of the consideration paid, which includes directly attributable
costs, is net of any tax effects and is recognized as a deduction from equity. Repurchased shares are classified as treasury shares and
are presented as a deduction from total equity. When treasury shares are sold or reissued subsequently, the amount received is
recognized as an increase in equity and the resulting surplus or deficit on the transaction is presented within retained earnings.
3.20 Retained earnings
Retained earnings contain legal reserves that are not distributable to the shareholders pursuant to Swiss law as well as accumulated
distributable profits, cumulative remeasurements of the net defined benefit liability / asset from post-employment plans net of taxes and
the fair value reserve for available-for-sale financial assets.
3.21 Translation reserve
The translation reserve comprises all foreign currency differences arising from the translation of the financial statements of foreign
operations.
3.22 Provisions
Provisions are recognized where a legal or constructive obligation has been incurred and if an outflow of resources is probable and can
be estimated reliably. Provisions are recorded for the estimated ultimate liability that is expected to arise, taking into account the time
value of money where material, determined by discounting the expected future cash flows at a pre-tax rate that reflects current market
assessments of the time value of money and the risks specific to the liability. The unwinding of the discount is recognized as finance
cost. Provisions are established for example for freight forwarding claims and decommissioning. Provisions for restructuring are
recognized only when the Group has approved a detailed and formal restructuring plan and the restructuring either has commenced or
has been announced publicly. Future operating costs are not provided for.
3.23 Fair value
Fair value is the price that would be received to sell an asset or paid to transfer a liability in an orderly transaction between market
participants at the measurement date. It is determined by reference to quoted market prices or by the use of established valuation
techniques such as option pricing models and the discounted cash flow method if quoted prices in an active market are not available.
Valuation techniques will incorporate observable market data about market conditions and other factors that are likely to affect the fair
value of a financial instrument. Valuation techniques are typically used for derivative financial instruments. Information on fair value
hierarchy is included in note 17 on risk management.

Consolidated Financial Statement panalpina.com 19
4. Critical judgments and accounting estimates
4.1 Judgments
4.1.1 Revenues
The Group utilizes independent contractors and third-party carriers in the performance of some transportation services. In all situations,
the Group acts as principal party to the transaction and consequently recognizes revenue on a gross basis.
4.2 Accounting estimates
4.2.1 Impairment of goodwill
The Group tests annually whether goodwill has suffered any impairment in accordance with the Group’s accounting policy and details
are disclosed in note 14 – Intangible assets, section: Impairment test for goodwill. The recoverable amounts of cash-generating units
(CGUs) have been determined based on value-in-use calculations. The underlying calculations require the use of estimates as further
described in note 14.2.
4.2.2 Pension and other post-employment benefits
The expense of defined benefit pension plans and other post-employment medical benefits and the present value of the pension
obligation are determined using actuarial valuations. The actuarial valuation involves making assumptions about discount rates, future
salary increases, mortality rates and future pension increases. All assumptions are reviewed at each reporting date. When determining
the appropriate discount rate, management considers the interest rates on high-quality corporate bonds (with an AAA or AA rating) in
the respective country and appropriate duration. The mortality rate is based on publicly available mortality tables for the specific country.
Future salary increases and pension increases are based on expected future inflation rates for the specific country. The actuarial
assumptions used may differ materially from actual results due to changes in market and economic conditions, higher or lower
withdrawal rates, longer or shorter life spans of participants and other changes in the factors assessed. These differences could impact
the assets or liabilities recognized in the statement of financial position in future periods. Additional information is disclosed in note 7.
4.2.3 Provisions
A number of subsidiaries are subject to litigation arising from the normal conduct of their businesses, as a result of which claims could
be raised against them.
The Group has established a captive reinsurance company that insures a dedicated risk portion of its errors and omissions, transporter
operator and commercial general liability programs. The exposure of its captive reinsurance company is limited by a third-party insurer
that covers losses exceeding an amount of CHF 1 million per incident and a total aggregate limit of CHF 9 million annually for claims
exceeding CHF 50,000 per incident. In a consolidated view, the Group, through its captive reinsurance company, bears the risks
insured with its captive reinsurance company up to the limit as if such risks were not insured at all. Furthermore, as third-party coverage
is subject to a considerable deductible and a total aggregated limit per year, the Group, in effect, bears the risk of damages, losses and
claims that are above such aggregated limits as well.
The Group used for the above-mentioned provision an actuarial calculation method, which requires for the calculation of the “incurred
but not reported reserves” (IBNR), among other estimations, the overall circumstances that may impact the future losses, such as the
growth of business. At December 31, 2017, the recognized liability for freight forwarding related claims amounts to CHF 23.7 million
(2016: CHF 22.0 million). If management decided to use the optimal actuarial calculation method, which takes into consideration only
the linear loss development according to historical figures, the carrying amount of claim provisions would be approximately CHF 4.6
million lower (2016: CHF 3.8 million). Using a more conservative percentile, the carrying amount of claim provisions would be
approximately CHF 4.8 million higher (2016: 2.0 million).
A restructuring provision is recognised when the Group has developed a detailed formal plan for the restructuring and has raised a valid
expectation in those affected that it will carry out the restructuring by starting to implement the plan or announcing its main features to
those affected by it. The measurement of a restructuring provision includes estimates but is limited to the directly identifiable
expenditures arising from the restructuring (which are those amounts that are both necessarily entailed by the restructuring and not
associated with the ongoing activities of the entity).
4.2.4 Deferred income tax assets
Deferred tax assets are recognized for unused tax losses carry-forwards to the extent that it is probable that taxable profit will be
available and the tax losses carry-forwards will be used to offset them. Significant management judgment is required to determine the
amount of deferred tax assets that can be recognized, based on the likely timing and level of future taxable profits.
The carrying value of recognized tax loss carry-forwards amounts to CHF 92.0 million resulting in a deferred tax asset of CHF 22.7
million (2016: CHF 86.8 million resulting in a deferred tax asset of CHF 26.8 million) and unrecognized tax loss carry-forwards to CHF
318.9 million (2016: 284.4 million). Further details are provided in note 26.
CHF 51.3 million (2016: CHF 41.3 million) of the net deferred tax assets arise in entities that have been loss making in 2017 or in 2016,
respectively. In evaluating whether it is probable that taxable profits will be earned in future accounting periods, all available evidence
was considered including the analysis of historical operating results and the assessment of the approved budgets, forecasts and
business plans.
4.2.5 Income taxes
As per December 31, 2017, the liability for current income taxes amounts to CHF 17.1 million (2016: CHF 18.4 million). The Group
reports also a prepaid income tax asset in the amount of CHF 28.0 million (2016: CHF 23.0 million). As the Group is subject to income
taxes in numerous jurisdictions, significant judgments are required in determining worldwide provisions for income taxes and the
recoverability of the prepaid income tax assets.

Consolidated Financial Statement panalpina.com 20
Some of these estimates are based on interpretations of existing tax laws or regulations. Management believes that the estimates are
reasonable and that the recognized liabilities for income tax-related uncertainties are adequate and the prepaid income tax assets are
recoverable.
Various external factors may have favorable or unfavorable effects on income taxes. These factors include, but are not limited to,
changes in tax law regulations and / or rates, changing interpretation of existing tax laws or regulations and changes in management
estimations. Such changes that arise could affect the income tax related assets and liabilities recognized in the statement of financial
position in future periods.
In particular, on December 22, 2017, the US tax legislation commonly known as the Tax Cuts and Jobs Act was signed into law by the
president, which includes substantial changes to the US taxation of individuals and businesses. Although the new law substantially
decreased tax rate applicable to corporations, we do not yet know all the consequences, including whether the law will have any
unintended consequences. Significant uncertainties remain as to how the US government will implement the new law, including with
respect to the so-called Base Erosion Anti-Abuse Tax. Additional information on the one–time impact from the tax rate decrease is
disclosed in note 11.
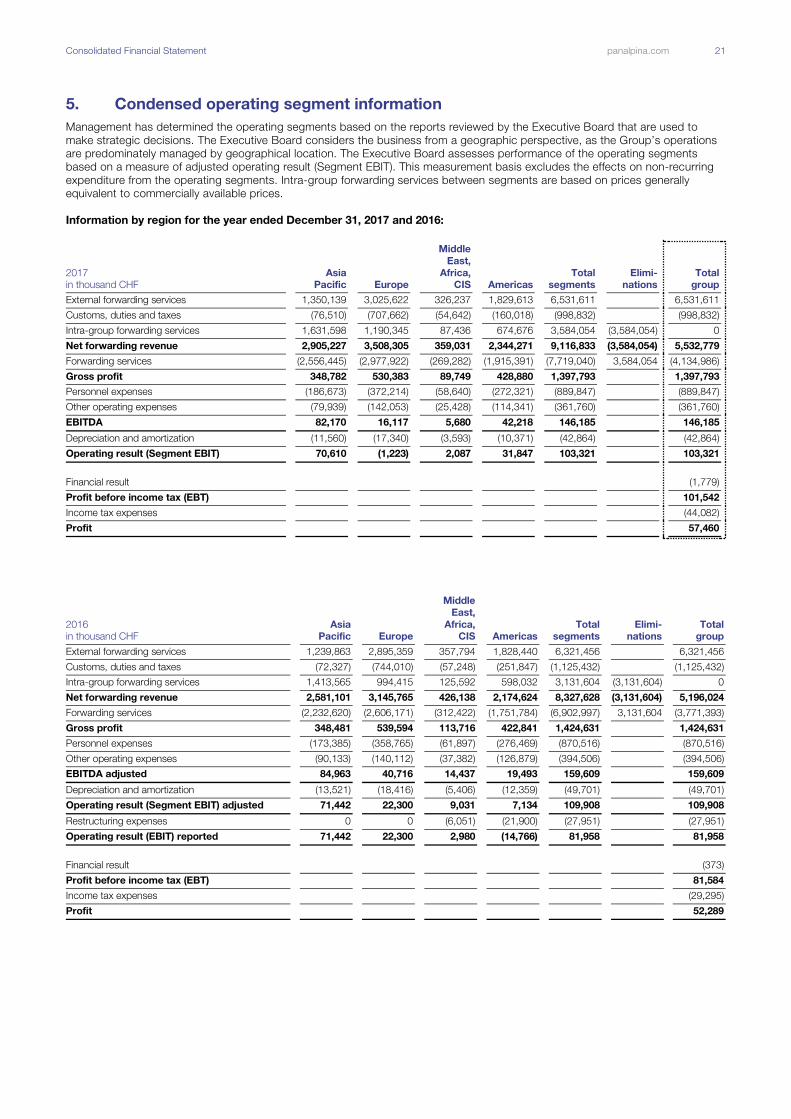
Consolidated Financial Statement panalpina.com 21
5. Condensed operating segment information
Management has determined the operating segments based on the reports reviewed by the Executive Board that are used to
make strategic decisions. The Executive Board considers the business from a geographic perspective, as the Group’s operations
are predominately managed by geographical location. The Executive Board assesses performance of the operating segments
based on a measure of adjusted operating result (Segment EBIT). This measurement basis excludes the effects on non-recurring
expenditure from the operating segments. Intra-group forwarding services between segments are based on prices generally
equivalent to commercially available prices.
Information by region for the year ended December 31, 2017 and 2016:
2017
in thousand CHF
Asia
Pacific Europe
Middle
East,
Africa,
CIS Americas
Total
segments
Elimi-
nations
Total
group
External forwarding services 1,350,139 3,025,622 326,237 1,829,613 6,531,611 6,531,611
Customs, duties and taxes (76,510) (707,662) (54,642) (160,018) (998,832) (998,832)
Intra-group forwarding services 1,631,598 1,190,345 87,436 674,676 3,584,054 (3,584,054) 0
Net forwarding revenue 2,905,227 3,508,305 359,031 2,344,271 9,116,833 (3,584,054) 5,532,779
Forwarding services (2,556,445) (2,977,922) (269,282) (1,915,391) (7,719,040) 3,584,054 (4,134,986)
Gross profit 348,782 530,383 89,749 428,880 1,397,793 1,397,793
Personnel expenses (186,673) (372,214) (58,640) (272,321) (889,847) (889,847)
Other operating expenses (79,939) (142,053) (25,428) (114,341) (361,760) (361,760)
EBITDA 82,170 16,117 5,680 42,218 146,185 146,185
Depreciation and amortization (11,560) (17,340) (3,593) (10,371) (42,864) (42,864)
Operating result (Segment EBIT) 70,610 (1,223) 2,087 31,847 103,321 103,321
Financial result (1,779)
Profit before income tax (EBT) 101,542
Income tax expenses (44,082)
Profit 57,460
2016
in thousand CHF
Asia
Pacific Europe
Middle
East,
Africa,
CIS Americas
Total
segments
Elimi-
nations
Total
group
External forwarding services 1,239,863 2,895,359 357,794 1,828,440 6,321,456 6,321,456
Customs, duties and taxes (72,327) (744,010) (57,248) (251,847) (1,125,432) (1,125,432)
Intra-group forwarding services 1,413,565 994,415 125,592 598,032 3,131,604 (3,131,604) 0
Net forwarding revenue 2,581,101 3,145,765 426,138 2,174,624 8,327,628 (3,131,604) 5,196,024
Forwarding services (2,232,620) (2,606,171) (312,422) (1,751,784) (6,902,997) 3,131,604 (3,771,393)
Gross profit 348,481 539,594 113,716 422,841 1,424,631 1,424,631
Personnel expenses (173,385) (358,765) (61,897) (276,469) (870,516) (870,516)
Other operating expenses (90,133) (140,112) (37,382) (126,879) (394,506) (394,506)
EBITDA adjusted 84,963 40,716 14,437 19,493 159,609 159,609
Depreciation and amortization (13,521) (18,416) (5,406) (12,359) (49,701) (49,701)
Operating result (Segment EBIT) adjusted 71,442 22,300 9,031 7,134 109,908 109,908
Restructuring expenses 0 0 (6,051) (21,900) (27,951) (27,951)
Operating result (EBIT) reported 71,442 22,300 2,980 (14,766) 81,958 81,958
Financial result (373)
Profit before income tax (EBT) 81,584
Income tax expenses (29,295)
Profit 52,289

Consolidated Financial Statement panalpina.com 22
Information by product for the year ended December 31, 2017 and 2016:
2017
in thousand CHF
Air
Freight
Ocean
Freight Logistics
Total
group
External forwarding services 3,362,403 2,574,996 594,211 6,531,611
Customs, duties and taxes (442,621) (500,714) (55,497) (998,832)
Net forwarding revenue 2,919,782 2,074,282 538,715 5,532,779
Forwarding services from third parties (2,280,337) (1,647,070) (207,579) (4,134,986)
Gross profit 639,445 427,212 331,136 1,397,793
Personnel expenses (379,324) (318,894) (191,629) (889,847)
Other operating expenses (131,164) (108,331) (122,266) (361,760)
EBITDA 128,957 (13) 17,242 146,185
Depreciation and amortization (18,610) (15,079) (9,175) (42,864)
Operating result (EBIT) 110,346 (15,092) 8,067 103,321
Financial result (1,779)
Profit before income tax (EBT) 101,542
Income tax expenses (44,082)
Profit 57,460
2016
in thousand CHF
Air
Freight
Ocean
Freight Logistics
Total
group
External forwarding services 3,122,014 2,567,294 632,148 6,321,456
Customs, duties and taxes (495,355) (568,875) (61,202) (1,125,432)
Net forwarding revenue 2,626,659 1,998,418 570,946 5,196,024
Forwarding services from third parties (2,031,472) (1,554,658) (185,263) (3,771,393)
Gross profit 595,187 443,761 385,684 1,424,631
Personnel expenses (347,347) (301,865) (221,304) (870,516)
Other operating expenses (133,256) (114,354) (146,896) (394,506)
EBITDA adjusted 114,584 27,542 17,484 159,609
Depreciation and amortization (21,133) (16,641) (11,927) (49,701)
Operating result (Segment EBIT) adjusted 93,451 10,901 5,557 109,908
Restructuring expenses (12,650) (11,501) (3,800) (27,951)
Operating result (EBIT) 80,801 (600) 1,757 81,958
Financial result (373)
Profit before income tax (EBT) 81,584
Income tax expenses (29,295)
Profit 52,289
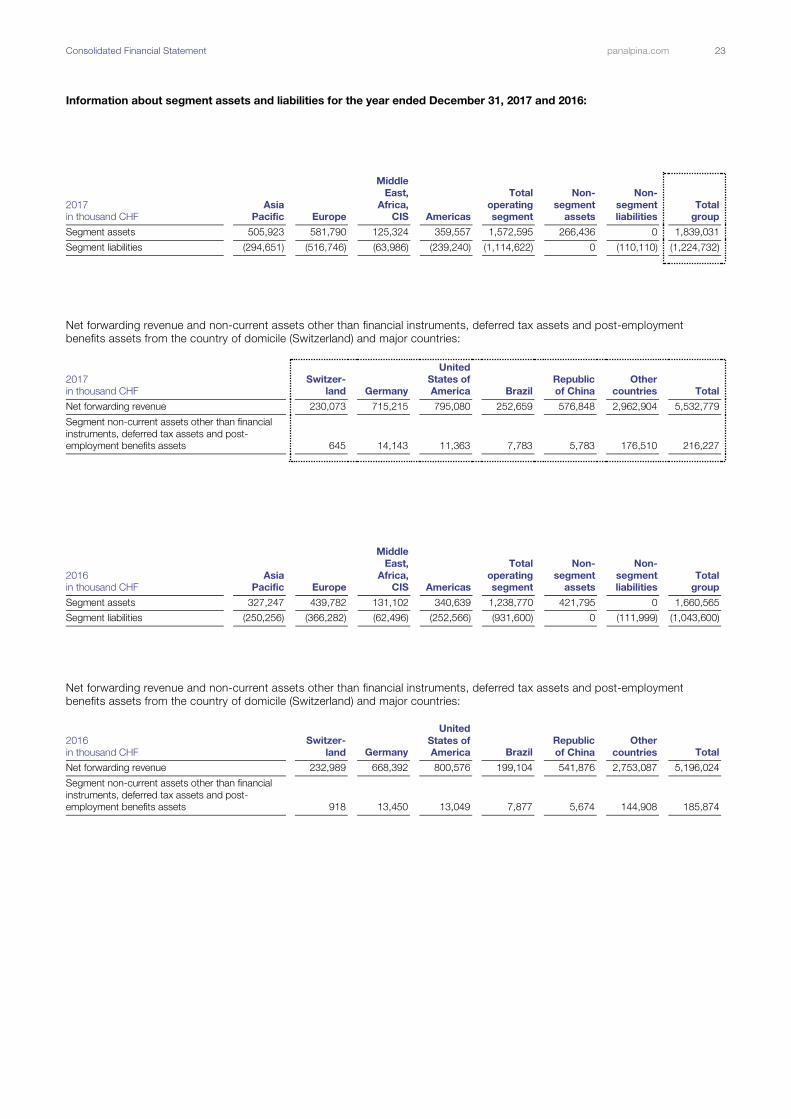
Consolidated Financial Statement panalpina.com 23
Information about segment assets and liabilities for the year ended December 31, 2017 and 2016:
2017
in thousand CHF
Asia
Pacific Europe
Middle
East,
Africa,
CIS Americas
Total
operating
segment
Non-
segment
assets
Non-
segment
liabilities
Total
group
Segment assets 505,923 581,790 125,324 359,557 1,572,595 266,436 0 1,839,031
Segment liabilities (294,651) (516,746) (63,986) (239,240) (1,114,622) 0 (110,110) (1,224,732)
Net forwarding revenue and non-current assets other than financial instruments, deferred tax assets and post-employment
benefits assets from the country of domicile (Switzerland) and major countries:
2017
in thousand CHF
Switzer-
land Germany
United
States of
America Brazil
Republic
of China
Other
countries Total
Net forwarding revenue 230,073 715,215 795,080 252,659 576,848 2,962,904 5,532,779
Segment non-current assets other than financial
instruments, deferred tax assets and post-
employment benefits assets 645 14,143 11,363 7,783 5,783 176,510 216,227
2016
in thousand CHF
Asia
Pacific Europe
Middle
East,
Africa,
CIS Americas
Total
operating
segment
Non-
segment
assets
Non-
segment
liabilities
Total
group
Segment assets 327,247 439,782 131,102 340,639 1,238,770 421,795 0 1,660,565
Segment liabilities (250,256) (366,282) (62,496) (252,566) (931,600) 0 (111,999) (1,043,600)
Net forwarding revenue and non-current assets other than financial instruments, deferred tax assets and post-employment
benefits assets from the country of domicile (Switzerland) and major countries:
2016
in thousand CHF
Switzer-
land Germany
United
States of
America Brazil
Republic
of China
Other
countries Total
Net forwarding revenue 232,989 668,392 800,576 199,104 541,876 2,753,087 5,196,024
Segment non-current assets other than financial
instruments, deferred tax assets and post-
employment benefits assets 918 13,450 13,049 7,877 5,674 144,908 185,874
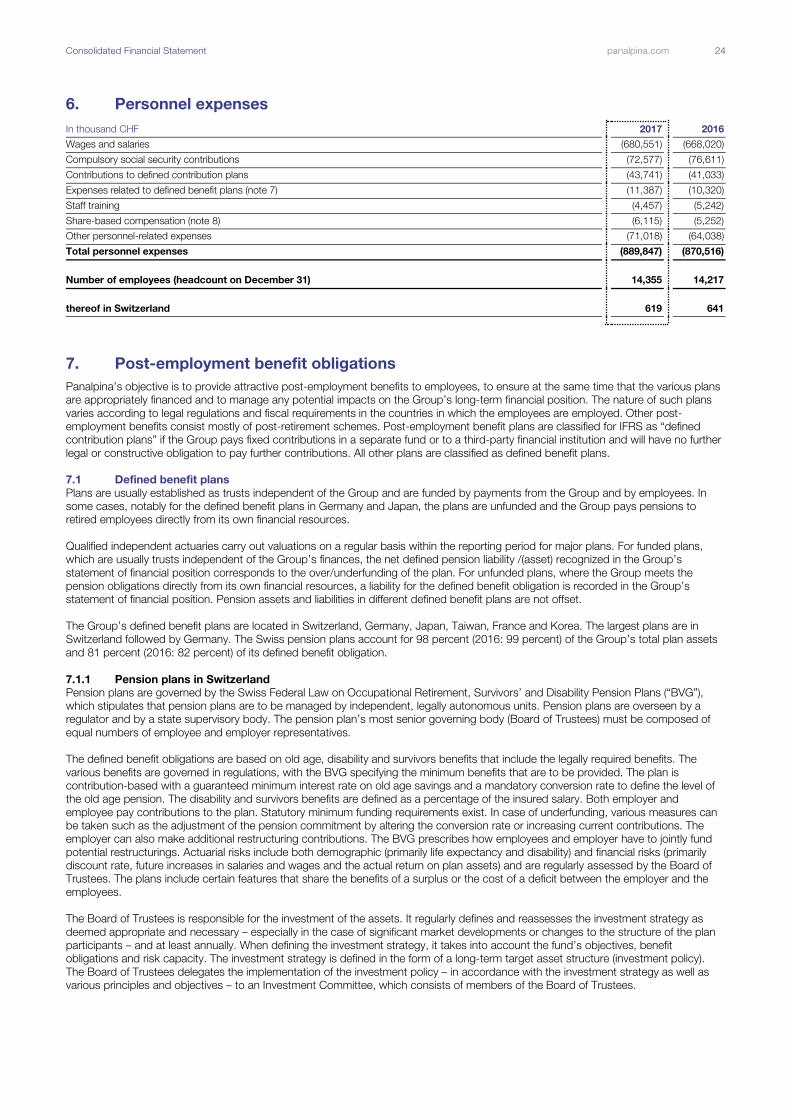
Consolidated Financial Statement panalpina.com 24
6. Personnel expenses In thousand CHF 2017 2016
Wages and salaries (680,551) (668,020)
Compulsory social security contributions (72,577) (76,611)
Contributions to defined contribution plans (43,741) (41,033)
Expenses related to defined benefit plans (note 7) (11,387) (10,320)
Staff training (4,457) (5,242)
Share-based compensation (note 8) (6,115) (5,252)
Other personnel-related expenses (71,018) (64,038)
Total personnel expenses (889,847) (870,516)
Number of employees (headcount on December 31) 14,355 14,217
thereof in Switzerland 619 641
7. Post-employment benefit obligations
Panalpina’s objective is to provide attractive post-employment benefits to employees, to ensure at the same time that the various plans
are appropriately financed and to manage any potential impacts on the Group’s long-term financial position. The nature of such plans
varies according to legal regulations and fiscal requirements in the countries in which the employees are employed. Other post-
employment benefits consist mostly of post-retirement schemes. Post-employment benefit plans are classified for IFRS as “defined
contribution plans” if the Group pays fixed contributions in a separate fund or to a third-party financial institution and will have no further
legal or constructive obligation to pay further contributions. All other plans are classified as defined benefit plans.
7.1 Defined benefit plans
Plans are usually established as trusts independent of the Group and are funded by payments from the Group and by employees. In
some cases, notably for the defined benefit plans in Germany and Japan, the plans are unfunded and the Group pays pensions to
retired employees directly from its own financial resources.
Qualified independent actuaries carry out valuations on a regular basis within the reporting period for major plans. For funded plans,
which are usually trusts independent of the Group’s finances, the net defined pension liability /(asset) recognized in the Group’s
statement of financial position corresponds to the over/underfunding of the plan. For unfunded plans, where the Group meets the
pension obligations directly from its own financial resources, a liability for the defined benefit obligation is recorded in the Group’s
statement of financial position. Pension assets and liabilities in different defined benefit plans are not offset.
The Group’s defined benefit plans are located in Switzerland, Germany, Japan, Taiwan, France and Korea. The largest plans are in
Switzerland followed by Germany. The Swiss pension plans account for 98 percent (2016: 99 percent) of the Group’s total plan assets
and 81 percent (2016: 82 percent) of its defined benefit obligation.
7.1.1 Pension plans in Switzerland
Pension plans are governed by the Swiss Federal Law on Occupational Retirement, Survivors’ and Disability Pension Plans (“BVG”),
which stipulates that pension plans are to be managed by independent, legally autonomous units. Pension plans are overseen by a
regulator and by a state supervisory body. The pension plan’s most senior governing body (Board of Trustees) must be composed of
equal numbers of employee and employer representatives.
The defined benefit obligations are based on old age, disability and survivors benefits that include the legally required benefits. The
various benefits are governed in regulations, with the BVG specifying the minimum benefits that are to be provided. The plan is
contribution-based with a guaranteed minimum interest rate on old age savings and a mandatory conversion rate to define the level of
the old age pension. The disability and survivors benefits are defined as a percentage of the insured salary. Both employer and
employee pay contributions to the plan. Statutory minimum funding requirements exist. In case of underfunding, various measures can
be taken such as the adjustment of the pension commitment by altering the conversion rate or increasing current contributions. The
employer can also make additional restructuring contributions. The BVG prescribes how employees and employer have to jointly fund
potential restructurings. Actuarial risks include both demographic (primarily life expectancy and disability) and financial risks (primarily
discount rate, future increases in salaries and wages and the actual return on plan assets) and are regularly assessed by the Board of
Trustees. The plans include certain features that share the benefits of a surplus or the cost of a deficit between the employer and the
employees.
The Board of Trustees is responsible for the investment of the assets. It regularly defines and reassesses the investment strategy as
deemed appropriate and necessary – especially in the case of significant market developments or changes to the structure of the plan
participants – and at least annually. When defining the investment strategy, it takes into account the fund’s objectives, benefit
obligations and risk capacity. The investment strategy is defined in the form of a long-term target asset structure (investment policy).
The Board of Trustees delegates the implementation of the investment policy – in accordance with the investment strategy as well as
various principles and objectives – to an Investment Committee, which consists of members of the Board of Trustees.
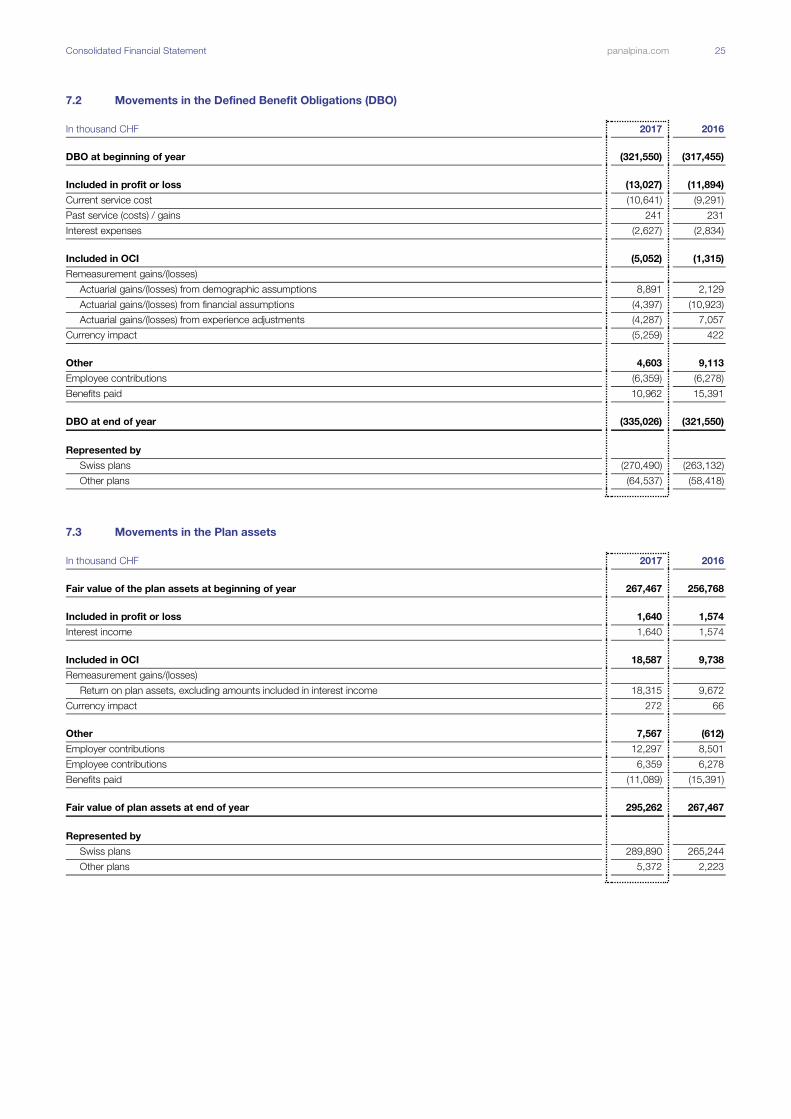
Consolidated Financial Statement panalpina.com 25
7.2 Movements in the Defined Benefit Obligations (DBO)
In thousand CHF 2017 2016
DBO at beginning of year (321,550) (317,455)
Included in profit or loss (13,027) (11,894)
Current service cost (10,641) (9,291)
Past service (costs) / gains 241 231
Interest expenses (2,627) (2,834)
Included in OCI (5,052) (1,315)
Remeasurement gains/(losses)
Actuarial gains/(losses) from demographic assumptions 8,891 2,129
Actuarial gains/(losses) from financial assumptions (4,397) (10,923)
Actuarial gains/(losses) from experience adjustments (4,287) 7,057
Currency impact (5,259) 422
Other 4,603 9,113
Employee contributions (6,359) (6,278)
Benefits paid 10,962 15,391
DBO at end of year (335,026) (321,550)
Represented by
Swiss plans (270,490) (263,132)
Other plans (64,537) (58,418)
7.3 Movements in the Plan assets
In thousand CHF 2017 2016
Fair value of the plan assets at beginning of year 267,467 256,768
Included in profit or loss 1,640 1,574
Interest income 1,640 1,574
Included in OCI 18,587 9,738
Remeasurement gains/(losses)
Return on plan assets, excluding amounts included in interest income 18,315 9,672
Currency impact 272 66
Other 7,567 (612)
Employer contributions 12,297 8,501
Employee contributions 6,359 6,278
Benefits paid (11,089) (15,391)
Fair value of plan assets at end of year 295,262 267,467
Represented by
Swiss plans 289,890 265,244
Other plans 5,372 2,223

Consolidated Financial Statement panalpina.com 26
7.4 Movements in the Net Defined Benefit Asset / (Liability)
In thousand CHF 2017 2016
Balance at beginning of year (54,082) (60,688)
Net impact included in profit or loss (11,387) (10,320)
Net impact included in OCI 13,535 8,423
Net impact other 12,171 8,501
Balance at end of year (39,764) (54,082)
Split into
Post-employment benefit assets 19,553 2,231
Post-employment benefit liabilities (59,317) (56,313)
(39,764) (54,082)
7.5 Plan assets
In thousand CHF 2017 2017 2016 2016
Major categories of plan assets
Cash and cash equivalents 11,135 3.77% 4,920 1.84%
Equity investments 102,004 34.55% 102,084 38.17%
Equities Switzerland 11,281 3.82% 18,772 7.02%
Equities Global 67,862 22.98% 64,140 23.98%
Equities Emerging Markets 11,549 3.91% 12,930 4.83%
Equities Small and Middle Cap 11,312 3.83% 6,242 2.33%
Bonds 133,328 45.16% 114,445 42.79%
Swiss Bonds (CHF) 63,471 21.50% 53,801 20.11%
Non-Swiss Bonds (CHF) 22,614 7.66% 24,781 9.26%
Non-Swiss Bonds (Foreign Currency) 33,133 11.22% 23,496 8.78%
Company Bonds 14,110 4.78% 12,368 4.62%
Hedge funds and private equity 0 0.00% 8,404 3.14%
Real estate funds Switzerland 48,795 16.53% 37,614 14.06%
Total 295,262 100.00% 267,467 100.00%
7.6 Defined benefit obligations (DBO)
7.6.1 Actuarial assumptions
Actuarial assumptions are unbiased and mutually compatible estimates of variables that determine the ultimate cost of providing post
employment benefits. They are set on an annual basis by local management and actuaries and are subject to approval by corporate
management. Actuarial assumptions consist of demographic assumptions on matters such as mortality and employee turnover and
financial assumptions on matters such as salary and benefit level as well as discount rates. The Group operates defined benefit plans in
several countries and the actuarial assumptions vary based on local economic and social conditions.
Demographic assumptions
The most significant demographic assumptions relate to mortality rates. The Group’s actuaries use mortality tables that take into
account historic patterns and expected changes, such as further increases in longevity. The mortality tables used for the major schemes
are:
20177
Switzerland BVG 2015 Generation table
Germany tables 2005 G from Klaus Heubeck
France table INSEE TV / TD 2010 / 2012

Consolidated Financial Statement panalpina.com 27
220166
Switzerland BVG 2015 Generation table
Germany tables 2005 G from Klaus Heubeck
France table INSEE TV / TD 2010 / 2012
In 2017, in order to improve the accuracy of the projections, the Group decided to use for the Swiss plan the CMI Mortality Projections
Model (as opposed to the Menthonnex model) for extrapolating future mortality improvements. This change led to a decrease of the
respective DBO in the amount of CHF 6.6 mio.
Rates of employee turnover, disability and early retirement are based on historical behavior within the Group companies. For the Swiss
plan, the Group used in 2017 the BVG 2015 Generation table together with a ratio of 80% to consider the degree of disability in its
estimate. This change led to a decrease of the respective DBO in the amount of CHF 2.3 mio.
Financial assumptions
These are based on market expectations for the period over which the obligations are to be settled. The assumptions used in the
actuarial valuations with stable currencies and interest are shown below (weighted averages):
In thousand CHF 2017 2016
Discount rate 0.81% 0.91%
Future salary increase 0.70% 0.80%
Future pension increase 0.25% 0.21%
Discount rates are determined with reference to market yields on high-quality corporate bonds. Expected rates of salary increases are
based on the latest expectation and historical behavior within Group entities. At December 31, 2017, the weighted average duration of
the DBO was 16.1 years (2016: 16.7 years). The Group expects to pay CHF 9.5 million in contributions in 2018 (2017: CHF 8.8 million).
DBO relating to the Swiss plans
At December 31, 2017, the duration of the DBO of CHF 270.5 million (2016: CHF 263.1 million) was approximately 16.0 years (2016:
approximately 16.9 years). 547 active members (2016: 549) and 177 pensioners (2016: 182) were included in the 2017 actuarial
valuation of the DBO.
DBO relating to the German plans
At December 31, 2017, the duration of the DBO of CHF 54.6 million (2016: CHF 49.1 million) was approximately 17.7 years (2016:
approximately 17.0 years) related to 556 (2016: 604) active members (DBO of CHF 16.9 million, 2016 CHF 16.7 million), to 599 (2016:
575) deferred members (DBO of CHF 14.0 million, 2016: CHF 11.4 million) and to 235 (2016: 230) pensioners (DBO of CHF 23.7
million, 2016: CHF 21.0 million).
7.6.2 Sensitivity analysis
Reasonably possible changes at the reporting date to one of the relevant actuarial assumptions, holding other assumptions constant,
would have affected the defined benefit obligation by the amounts shown below:
2017 In thousand CHF Increase Decrease
Discount rate (change of 0.3%) 16,772 (15,309)
Future salary change (change of 0.5%) (2,990) 3,143
Future pension change (change of 0.25%) (7,970) 8,542 2016 In thousand CHF Increase Decrease
Discount rate (change of 0.3%) 16,620 (15,408)
Future salary change (change of 0.5%) (2,827) 2,970
Future pension change (change of 0.25%) (9,291) 7,358
The sensitivity analysis above may not be representative of the actual change in the defined benefit obligation as it is unlikely that the
change in assumptions would occur in isolation of one another as some of the assumptions may be correlated.
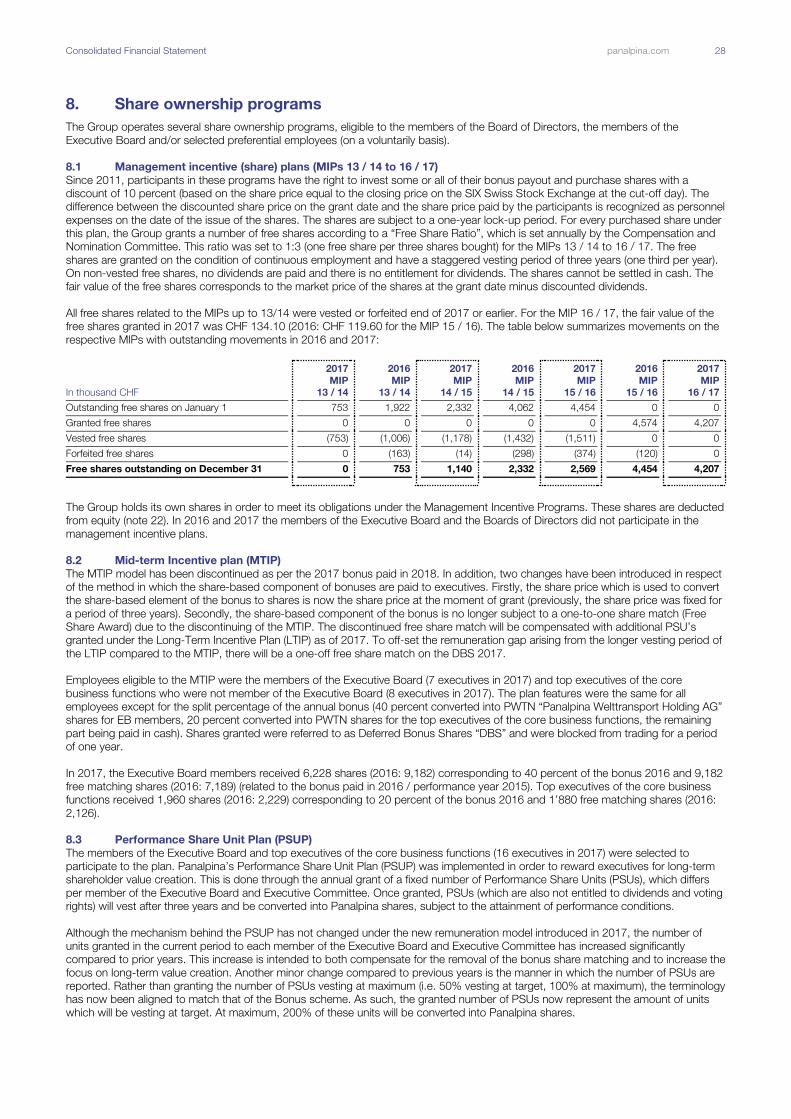
Consolidated Financial Statement panalpina.com 28
8. Share ownership programs
The Group operates several share ownership programs, eligible to the members of the Board of Directors, the members of the
Executive Board and/or selected preferential employees (on a voluntarily basis).
8.1 Management incentive (share) plans (MIPs 13 / 14 to 16 / 17)
Since 2011, participants in these programs have the right to invest some or all of their bonus payout and purchase shares with a
discount of 10 percent (based on the share price equal to the closing price on the SIX Swiss Stock Exchange at the cut-off day). The
difference between the discounted share price on the grant date and the share price paid by the participants is recognized as personnel
expenses on the date of the issue of the shares. The shares are subject to a one-year lock-up period. For every purchased share under
this plan, the Group grants a number of free shares according to a “Free Share Ratio”, which is set annually by the Compensation and
Nomination Committee. This ratio was set to 1:3 (one free share per three shares bought) for the MIPs 13 / 14 to 16 / 17. The free
shares are granted on the condition of continuous employment and have a staggered vesting period of three years (one third per year).
On non-vested free shares, no dividends are paid and there is no entitlement for dividends. The shares cannot be settled in cash. The
fair value of the free shares corresponds to the market price of the shares at the grant date minus discounted dividends.
All free shares related to the MIPs up to 13/14 were vested or forfeited end of 2017 or earlier. For the MIP 16 / 17, the fair value of the
free shares granted in 2017 was CHF 134.10 (2016: CHF 119.60 for the MIP 15 / 16). The table below summarizes movements on the
respective MIPs with outstanding movements in 2016 and 2017:
In thousand CHF
2017
MIP
13 / 14
2016
MIP
13 / 14
2017
MIP
14 / 15
2016
MIP
14 / 15
2017
MIP
15 / 16
2016
MIP
15 / 16
2017
MIP
16 / 17
Outstanding free shares on January 1 753 1,922 2,332 4,062 4,454 0 0
Granted free shares 0 0 0 0 0 4,574 4,207
Vested free shares (753) (1,006) (1,178) (1,432) (1,511) 0 0
Forfeited free shares 0 (163) (14) (298) (374) (120) 0
Free shares outstanding on December 31 0 753 1,140 2,332 2,569 4,454 4,207
The Group holds its own shares in order to meet its obligations under the Management Incentive Programs. These shares are deducted
from equity (note 22). In 2016 and 2017 the members of the Executive Board and the Boards of Directors did not participate in the
management incentive plans.
8.2 Mid-term Incentive plan (MTIP)
The MTIP model has been discontinued as per the 2017 bonus paid in 2018. In addition, two changes have been introduced in respect
of the method in which the share-based component of bonuses are paid to executives. Firstly, the share price which is used to convert
the share-based element of the bonus to shares is now the share price at the moment of grant (previously, the share price was fixed for
a period of three years). Secondly, the share-based component of the bonus is no longer subject to a one-to-one share match (Free
Share Award) due to the discontinuing of the MTIP. The discontinued free share match will be compensated with additional PSU’s
granted under the Long-Term Incentive Plan (LTIP) as of 2017. To off-set the remuneration gap arising from the longer vesting period of
the LTIP compared to the MTIP, there will be a one-off free share match on the DBS 2017.
Employees eligible to the MTIP were the members of the Executive Board (7 executives in 2017) and top executives of the core
business functions who were not member of the Executive Board (8 executives in 2017). The plan features were the same for all
employees except for the split percentage of the annual bonus (40 percent converted into PWTN “Panalpina Welttransport Holding AG”
shares for EB members, 20 percent converted into PWTN shares for the top executives of the core business functions, the remaining
part being paid in cash). Shares granted were referred to as Deferred Bonus Shares “DBS” and were blocked from trading for a period
of one year.
In 2017, the Executive Board members received 6,228 shares (2016: 9,182) corresponding to 40 percent of the bonus 2016 and 9,182
free matching shares (2016: 7,189) (related to the bonus paid in 2016 / performance year 2015). Top executives of the core business
functions received 1,960 shares (2016: 2,229) corresponding to 20 percent of the bonus 2016 and 1’880 free matching shares (2016:
2,126).
8.3 Performance Share Unit Plan (PSUP)
The members of the Executive Board and top executives of the core business functions (16 executives in 2017) were selected to
participate to the plan. Panalpina’s Performance Share Unit Plan (PSUP) was implemented in order to reward executives for long-term
shareholder value creation. This is done through the annual grant of a fixed number of Performance Share Units (PSUs), which differs
per member of the Executive Board and Executive Committee. Once granted, PSUs (which are also not entitled to dividends and voting
rights) will vest after three years and be converted into Panalpina shares, subject to the attainment of performance conditions.
Although the mechanism behind the PSUP has not changed under the new remuneration model introduced in 2017, the number of
units granted in the current period to each member of the Executive Board and Executive Committee has increased significantly
compared to prior years. This increase is intended to both compensate for the removal of the bonus share matching and to increase the
focus on long-term value creation. Another minor change compared to previous years is the manner in which the number of PSUs are
reported. Rather than granting the number of PSUs vesting at maximum (i.e. 50% vesting at target, 100% at maximum), the terminology
has now been aligned to match that of the Bonus scheme. As such, the granted number of PSUs now represent the amount of units
which will be vesting at target. At maximum, 200% of these units will be converted into Panalpina shares.
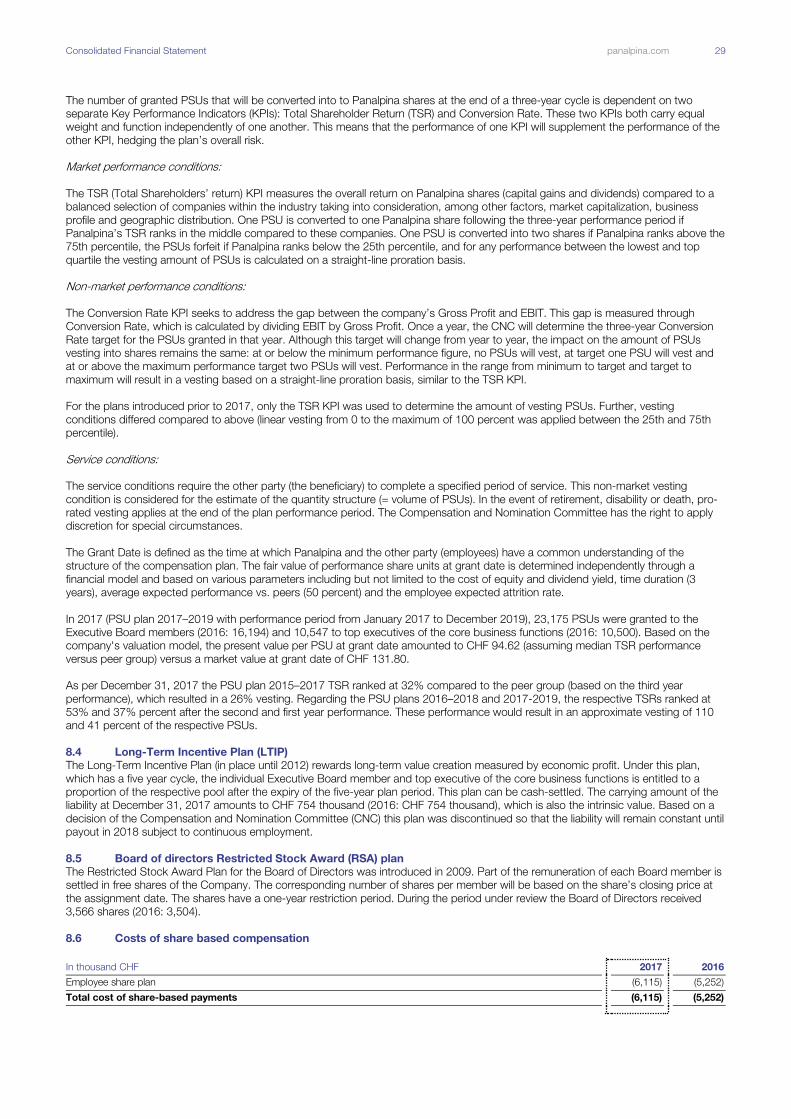
Consolidated Financial Statement panalpina.com 29
The number of granted PSUs that will be converted into to Panalpina shares at the end of a three-year cycle is dependent on two
separate Key Performance Indicators (KPIs): Total Shareholder Return (TSR) and Conversion Rate. These two KPIs both carry equal
weight and function independently of one another. This means that the performance of one KPI will supplement the performance of the
other KPI, hedging the plan’s overall risk.
Market performance conditions:
The TSR (Total Shareholders’ return) KPI measures the overall return on Panalpina shares (capital gains and dividends) compared to a
balanced selection of companies within the industry taking into consideration, among other factors, market capitalization, business
profile and geographic distribution. One PSU is converted to one Panalpina share following the three-year performance period if
Panalpina’s TSR ranks in the middle compared to these companies. One PSU is converted into two shares if Panalpina ranks above the
75th percentile, the PSUs forfeit if Panalpina ranks below the 25th percentile, and for any performance between the lowest and top
quartile the vesting amount of PSUs is calculated on a straight-line proration basis.
Non-market performance conditions:
The Conversion Rate KPI seeks to address the gap between the company’s Gross Profit and EBIT. This gap is measured through
Conversion Rate, which is calculated by dividing EBIT by Gross Profit. Once a year, the CNC will determine the three-year Conversion
Rate target for the PSUs granted in that year. Although this target will change from year to year, the impact on the amount of PSUs
vesting into shares remains the same: at or below the minimum performance figure, no PSUs will vest, at target one PSU will vest and
at or above the maximum performance target two PSUs will vest. Performance in the range from minimum to target and target to
maximum will result in a vesting based on a straight-line proration basis, similar to the TSR KPI.
For the plans introduced prior to 2017, only the TSR KPI was used to determine the amount of vesting PSUs. Further, vesting
conditions differed compared to above (linear vesting from 0 to the maximum of 100 percent was applied between the 25th and 75th
percentile).
Service conditions:
The service conditions require the other party (the beneficiary) to complete a specified period of service. This non-market vesting
condition is considered for the estimate of the quantity structure (= volume of PSUs). In the event of retirement, disability or death, pro-
rated vesting applies at the end of the plan performance period. The Compensation and Nomination Committee has the right to apply
discretion for special circumstances.
The Grant Date is defined as the time at which Panalpina and the other party (employees) have a common understanding of the
structure of the compensation plan. The fair value of performance share units at grant date is determined independently through a
financial model and based on various parameters including but not limited to the cost of equity and dividend yield, time duration (3
years), average expected performance vs. peers (50 percent) and the employee expected attrition rate.
In 2017 (PSU plan 2017–2019 with performance period from January 2017 to December 2019), 23,175 PSUs were granted to the
Executive Board members (2016: 16,194) and 10,547 to top executives of the core business functions (2016: 10,500). Based on the
company's valuation model, the present value per PSU at grant date amounted to CHF 94.62 (assuming median TSR performance
versus peer group) versus a market value at grant date of CHF 131.80.
As per December 31, 2017 the PSU plan 2015–2017 TSR ranked at 32% compared to the peer group (based on the third year
performance), which resulted in a 26% vesting. Regarding the PSU plans 2016–2018 and 2017-2019, the respective TSRs ranked at
53% and 37% percent after the second and first year performance. These performance would result in an approximate vesting of 110
and 41 percent of the respective PSUs.
8.4 Long-Term Incentive Plan (LTIP)
The Long-Term Incentive Plan (in place until 2012) rewards long-term value creation measured by economic profit. Under this plan,
which has a five year cycle, the individual Executive Board member and top executive of the core business functions is entitled to a
proportion of the respective pool after the expiry of the five-year plan period. This plan can be cash-settled. The carrying amount of the
liability at December 31, 2017 amounts to CHF 754 thousand (2016: CHF 754 thousand), which is also the intrinsic value. Based on a
decision of the Compensation and Nomination Committee (CNC) this plan was discontinued so that the liability will remain constant until
payout in 2018 subject to continuous employment.
8.5 Board of directors Restricted Stock Award (RSA) plan
The Restricted Stock Award Plan for the Board of Directors was introduced in 2009. Part of the remuneration of each Board member is
settled in free shares of the Company. The corresponding number of shares per member will be based on the share’s closing price at
the assignment date. The shares have a one-year restriction period. During the period under review the Board of Directors received
3,566 shares (2016: 3,504).
8.6 Costs of share based compensation
In thousand CHF 2017 2016
Employee share plan (6,115) (5,252)
Total cost of share-based payments (6,115) (5,252)
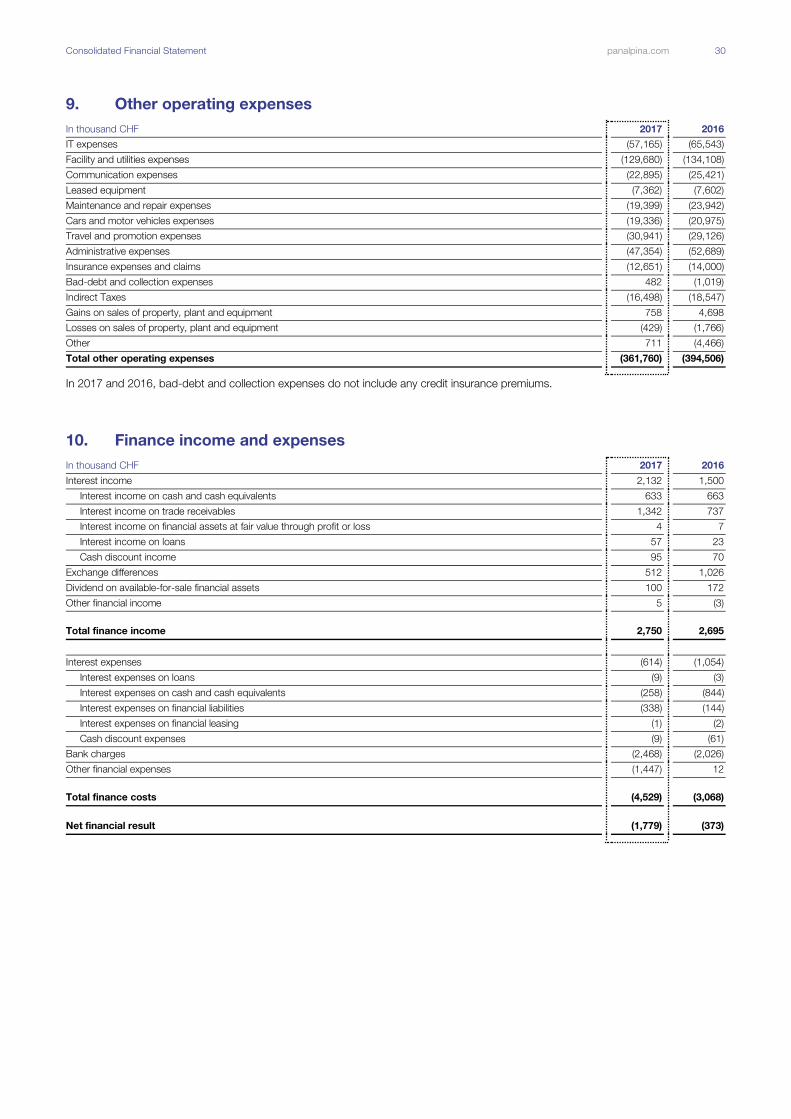
Consolidated Financial Statement panalpina.com 30
9. Other operating expenses In thousand CHF 2017 2016
IT expenses (57,165) (65,543)
Facility and utilities expenses (129,680) (134,108)
Communication expenses (22,895) (25,421)
Leased equipment (7,362) (7,602)
Maintenance and repair expenses (19,399) (23,942)
Cars and motor vehicles expenses (19,336) (20,975)
Travel and promotion expenses (30,941) (29,126)
Administrative expenses (47,354) (52,689)
Insurance expenses and claims (12,651) (14,000)
Bad-debt and collection expenses 482 (1,019)
Indirect Taxes (16,498) (18,547)
Gains on sales of property, plant and equipment 758 4,698
Losses on sales of property, plant and equipment (429) (1,766)
Other 711 (4,466)
Total other operating expenses (361,760) (394,506) In 2017 and 2016, bad-debt and collection expenses do not include any credit insurance premiums.
10. Finance income and expenses In thousand CHF 2017 2016
Interest income 2,132 1,500
Interest income on cash and cash equivalents 633 663
Interest income on trade receivables 1,342 737
Interest income on financial assets at fair value through profit or loss 4 7
Interest income on loans 57 23
Cash discount income 95 70
Exchange differences 512 1,026
Dividend on available-for-sale financial assets 100 172
Other financial income 5 (3)
Total finance income 2,750 2,695
Interest expenses (614) (1,054)
Interest expenses on loans (9) (3)
Interest expenses on cash and cash equivalents (258) (844)
Interest expenses on financial liabilities (338) (144)
Interest expenses on financial leasing (1) (2)
Cash discount expenses (9) (61)
Bank charges (2,468) (2,026)
Other financial expenses (1,447) 12
Total finance costs (4,529) (3,068)
Net financial result (1,779) (373)
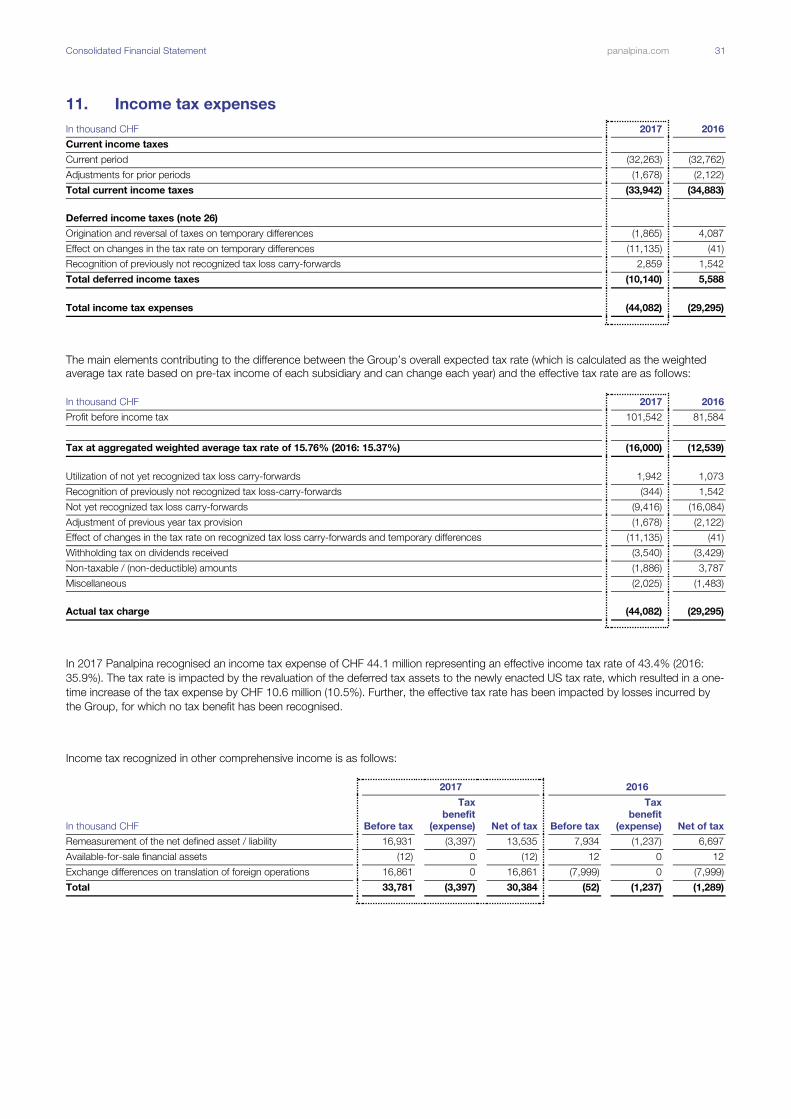
Consolidated Financial Statement panalpina.com 31
11. Income tax expenses In thousand CHF 2017 2016
Current income taxes
Current period (32,263) (32,762)
Adjustments for prior periods (1,678) (2,122)
Total current income taxes (33,942) (34,883)
Deferred income taxes (note 26)
Origination and reversal of taxes on temporary differences (1,865) 4,087
Effect on changes in the tax rate on temporary differences (11,135) (41)
Recognition of previously not recognized tax loss carry-forwards 2,859 1,542
Total deferred income taxes (10,140) 5,588
Total income tax expenses (44,082) (29,295)
The main elements contributing to the difference between the Group’s overall expected tax rate (which is calculated as the weighted
average tax rate based on pre-tax income of each subsidiary and can change each year) and the effective tax rate are as follows:
In thousand CHF 2017 2016
Profit before income tax 101,542 81,584
Tax at aggregated weighted average tax rate of 15.76% (2016: 15.37%) (16,000) (12,539)
Utilization of not yet recognized tax loss carry-forwards 1,942 1,073
Recognition of previously not recognized tax loss-carry-forwards (344) 1,542
Not yet recognized tax loss carry-forwards (9,416) (16,084)
Adjustment of previous year tax provision (1,678) (2,122)
Effect of changes in the tax rate on recognized tax loss carry-forwards and temporary differences (11,135) (41)
Withholding tax on dividends received (3,540) (3,429)
Non-taxable / (non-deductible) amounts (1,886) 3,787
Miscellaneous (2,025) (1,483)
Actual tax charge (44,082) (29,295)
In 2017 Panalpina recognised an income tax expense of CHF 44.1 million representing an effective income tax rate of 43.4% (2016:
35.9%). The tax rate is impacted by the revaluation of the deferred tax assets to the newly enacted US tax rate, which resulted in a one-
time increase of the tax expense by CHF 10.6 million (10.5%). Further, the effective tax rate has been impacted by losses incurred by
the Group, for which no tax benefit has been recognised.
Income tax recognized in other comprehensive income is as follows:
2017 2016
In thousand CHF Before tax
Tax
benefit
(expense) Net of tax Before tax
Tax
benefit
(expense) Net of tax
Remeasurement of the net defined asset / liability 16,931 (3,397) 13,535 7,934 (1,237) 6,697
Available-for-sale financial assets (12) 0 (12) 12 0 12
Exchange differences on translation of foreign operations 16,861 0 16,861 (7,999) 0 (7,999)
Total 33,781 (3,397) 30,384 (52) (1,237) (1,289)
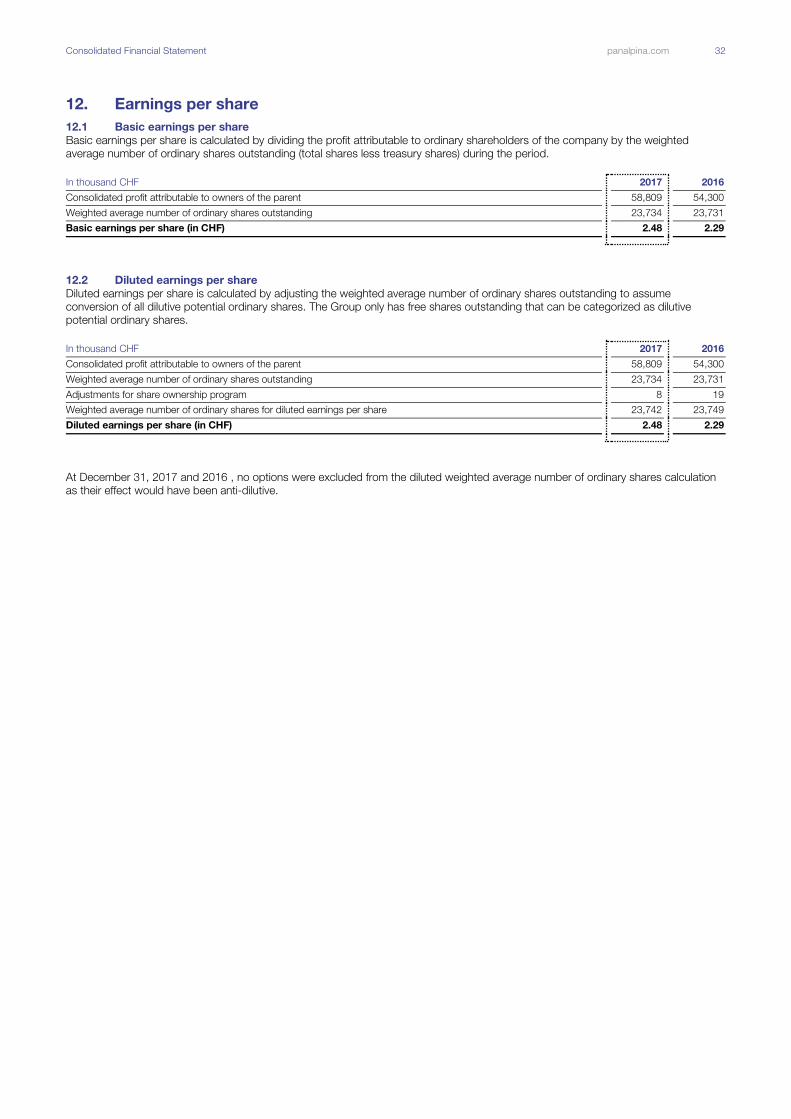
Consolidated Financial Statement panalpina.com 32
12. Earnings per share
12.1 Basic earnings per share
Basic earnings per share is calculated by dividing the profit attributable to ordinary shareholders of the company by the weighted
average number of ordinary shares outstanding (total shares less treasury shares) during the period.
In thousand CHF 2017 2016
Consolidated profit attributable to owners of the parent 58,809 54,300
Weighted average number of ordinary shares outstanding 23,734 23,731
Basic earnings per share (in CHF) 2.48 2.29
12.2 Diluted earnings per share
Diluted earnings per share is calculated by adjusting the weighted average number of ordinary shares outstanding to assume
conversion of all dilutive potential ordinary shares. The Group only has free shares outstanding that can be categorized as dilutive
potential ordinary shares.
In thousand CHF 2017 2016
Consolidated profit attributable to owners of the parent 58,809 54,300
Weighted average number of ordinary shares outstanding 23,734 23,731
Adjustments for share ownership program 8 19
Weighted average number of ordinary shares for diluted earnings per share 23,742 23,749
Diluted earnings per share (in CHF) 2.48 2.29
At December 31, 2017 and 2016 , no options were excluded from the diluted weighted average number of ordinary shares calculation
as their effect would have been anti-dilutive.

Consolidated Financial Statement panalpina.com 33
13. Property, plant and equipment
2017 In thousand CHF
Land and
buildings
Machi-
nery and
equipment
Vehicles
Construc-
tion in
progress
Total
Acquisition costs
Balance on January 1 106,489 184,468 12,859 919 304,736
Translation differences 3,155 2,160 (1) 684 5,998
Acquisition of subsidiaries and other businesses 118 501 396 0 1,015
Additions 12,550 13,782 1,143 26,169 53,644
Disposals and deletions (4,803) (18,068) (2,911) 0 (25,781)
Reclassifications (1,391) 1,397 (6) 0 0
Balance on December 31 116,119 184,241 11,480 27,773 339,613
Accumulated depreciation
Balance on January 1 (70,125) (160,494) (10,592) 0 (241,212)
Translation differences (2,195) (2,251) (390) 0 (4,836)
Additions (7,430) (12,812) (1,053) 0 (21,294)
Disposals and deletions 4,645 17,292 2,525 0 24,462
Reclassifications 1,040 (1,045) 6 0 0
Balance on December 31 (74,064) (159,311) (9,504) 0 (242,880)
Net book value on January 1 36,364 23,974 2,266 919 63,524
Net book value on December 31 42,055 24,929 1,976 27,773 96,733
Of which net book value of assets acquired under finance leases 0 0 30 0 30
2016 In thousand CHF
Land and
buildings
Machi-
nery and
equipment
Vehicles
Construc-
tion in
progress
Total
Acquisition costs
Balance on January 1 121,282 197,589 20,308 39 339,218
Translation differences (1,116) 2,658 (562) 2 982
Acquisition of subsidiaries and other businesses 164 686 17 24 892
Additions 10,801 12,952 1,436 893 26,082
Disposals and deletions (24,642) (29,456) (8,341) 0 (62,439)
Reclassifications 0 39 0 (39) 0
Balance on December 31 106,489 184,468 12,859 919 304,736
Accumulated depreciation
Balance on January 1 (73,877) (171,169) (15,706) 0 (260,752)
Translation differences 243 (2,328) 247 0 (1,838)
Additions (9,184) (15,296) (1,302) 0 (25,782)
Disposals and deletions 12,693 28,298 6,169 0 47,160
Balance on December 31 (70,125) (160,494) (10,592) 0 (241,212)
Net book value on January 1 47,405 26,420 4,602 39 78,466
Net book value on December 31 36,364 23,974 2,266 919 63,524
Of which net book value of assets acquired under finance leases 402 0 100 287 789
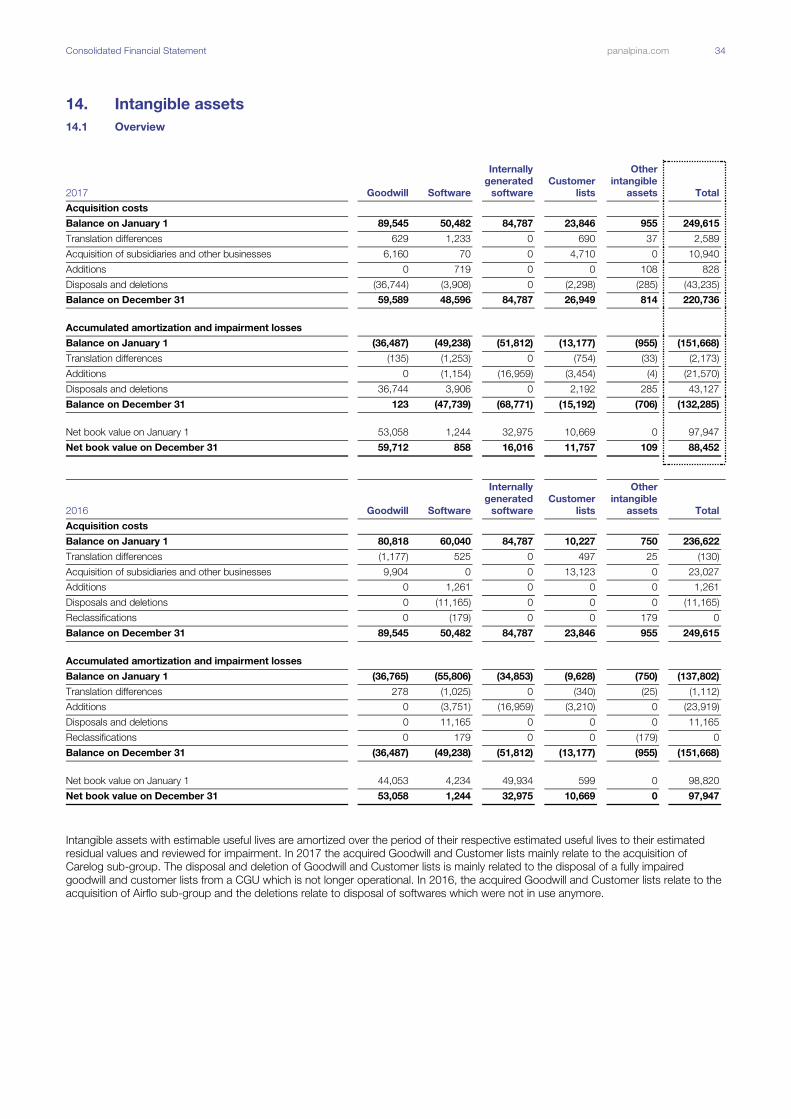
Consolidated Financial Statement panalpina.com 34
14. Intangible assets
14.1 Overview
2017 Goodwill Software
Internally
generated
software
Customer
lists
Other
intangible
assets Total
Acquisition costs
Balance on January 1 89,545 50,482 84,787 23,846 955 249,615
Translation differences 629 1,233 0 690 37 2,589
Acquisition of subsidiaries and other businesses 6,160 70 0 4,710 0 10,940
Additions 0 719 0 0 108 828
Disposals and deletions (36,744) (3,908) 0 (2,298) (285) (43,235)
Balance on December 31 59,589 48,596 84,787 26,949 814 220,736
Accumulated amortization and impairment losses
Balance on January 1 (36,487) (49,238) (51,812) (13,177) (955) (151,668)
Translation differences (135) (1,253) 0 (754) (33) (2,173)
Additions 0 (1,154) (16,959) (3,454) (4) (21,570)
Disposals and deletions 36,744 3,906 0 2,192 285 43,127
Balance on December 31 123 (47,739) (68,771) (15,192) (706) (132,285)
Net book value on January 1 53,058 1,244 32,975 10,669 0 97,947
Net book value on December 31 59,712 858 16,016 11,757 109 88,452
2016 Goodwill Software
Internally
generated
software
Customer
lists
Other
intangible
assets Total
Acquisition costs
Balance on January 1 80,818 60,040 84,787 10,227 750 236,622
Translation differences (1,177) 525 0 497 25 (130)
Acquisition of subsidiaries and other businesses 9,904 0 0 13,123 0 23,027
Additions 0 1,261 0 0 0 1,261
Disposals and deletions 0 (11,165) 0 0 0 (11,165)
Reclassifications 0 (179) 0 0 179 0
Balance on December 31 89,545 50,482 84,787 23,846 955 249,615
Accumulated amortization and impairment losses
Balance on January 1 (36,765) (55,806) (34,853) (9,628) (750) (137,802)
Translation differences 278 (1,025) 0 (340) (25) (1,112)
Additions 0 (3,751) (16,959) (3,210) 0 (23,919)
Disposals and deletions 0 11,165 0 0 0 11,165
Reclassifications 0 179 0 0 (179) 0
Balance on December 31 (36,487) (49,238) (51,812) (13,177) (955) (151,668)
Net book value on January 1 44,053 4,234 49,934 599 0 98,820
Net book value on December 31 53,058 1,244 32,975 10,669 0 97,947
Intangible assets with estimable useful lives are amortized over the period of their respective estimated useful lives to their estimated
residual values and reviewed for impairment. In 2017 the acquired Goodwill and Customer lists mainly relate to the acquisition of
Carelog sub-group. The disposal and deletion of Goodwill and Customer lists is mainly related to the disposal of a fully impaired
goodwill and customer lists from a CGU which is not longer operational. In 2016, the acquired Goodwill and Customer lists relate to the
acquisition of Airflo sub-group and the deletions relate to disposal of softwares which were not in use anymore.
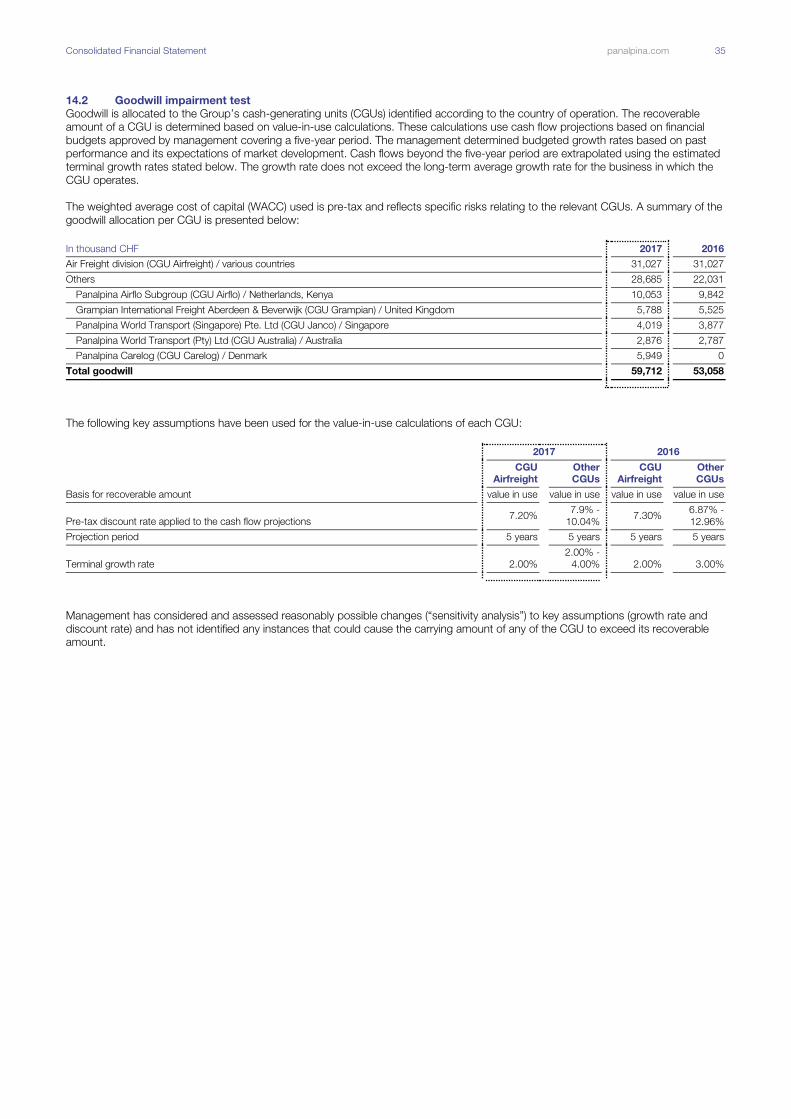
Consolidated Financial Statement panalpina.com 35
14.2 Goodwill impairment test
Goodwill is allocated to the Group’s cash-generating units (CGUs) identified according to the country of operation. The recoverable
amount of a CGU is determined based on value-in-use calculations. These calculations use cash flow projections based on financial
budgets approved by management covering a five-year period. The management determined budgeted growth rates based on past
performance and its expectations of market development. Cash flows beyond the five-year period are extrapolated using the estimated
terminal growth rates stated below. The growth rate does not exceed the long-term average growth rate for the business in which the
CGU operates.
The weighted average cost of capital (WACC) used is pre-tax and reflects specific risks relating to the relevant CGUs. A summary of the
goodwill allocation per CGU is presented below:
In thousand CHF 2017 2016
Air Freight division (CGU Airfreight) / various countries 31,027 31,027
Others 28,685 22,031
Panalpina Airflo Subgroup (CGU Airflo) / Netherlands, Kenya 10,053 9,842
Grampian International Freight Aberdeen & Beverwijk (CGU Grampian) / United Kingdom 5,788 5,525
Panalpina World Transport (Singapore) Pte. Ltd (CGU Janco) / Singapore 4,019 3,877
Panalpina World Transport (Pty) Ltd (CGU Australia) / Australia 2,876 2,787
Panalpina Carelog (CGU Carelog) / Denmark 5,949 0
Total goodwill 59,712 53,058
The following key assumptions have been used for the value-in-use calculations of each CGU:
2017 2016
CGU
Airfreight
Other
CGUs
CGU
Airfreight
Other
CGUs
Basis for recoverable amount value in use value in use value in use value in use
Pre-tax discount rate applied to the cash flow projections 7.20%
7.9% -
10.04% 7.30%
6.87% -
12.96%
Projection period 5 years 5 years 5 years 5 years
Terminal growth rate 2.00%
2.00% -
4.00% 2.00% 3.00%
Management has considered and assessed reasonably possible changes (“sensitivity analysis”) to key assumptions (growth rate and
discount rate) and has not identified any instances that could cause the carrying amount of any of the CGU to exceed its recoverable
amount.
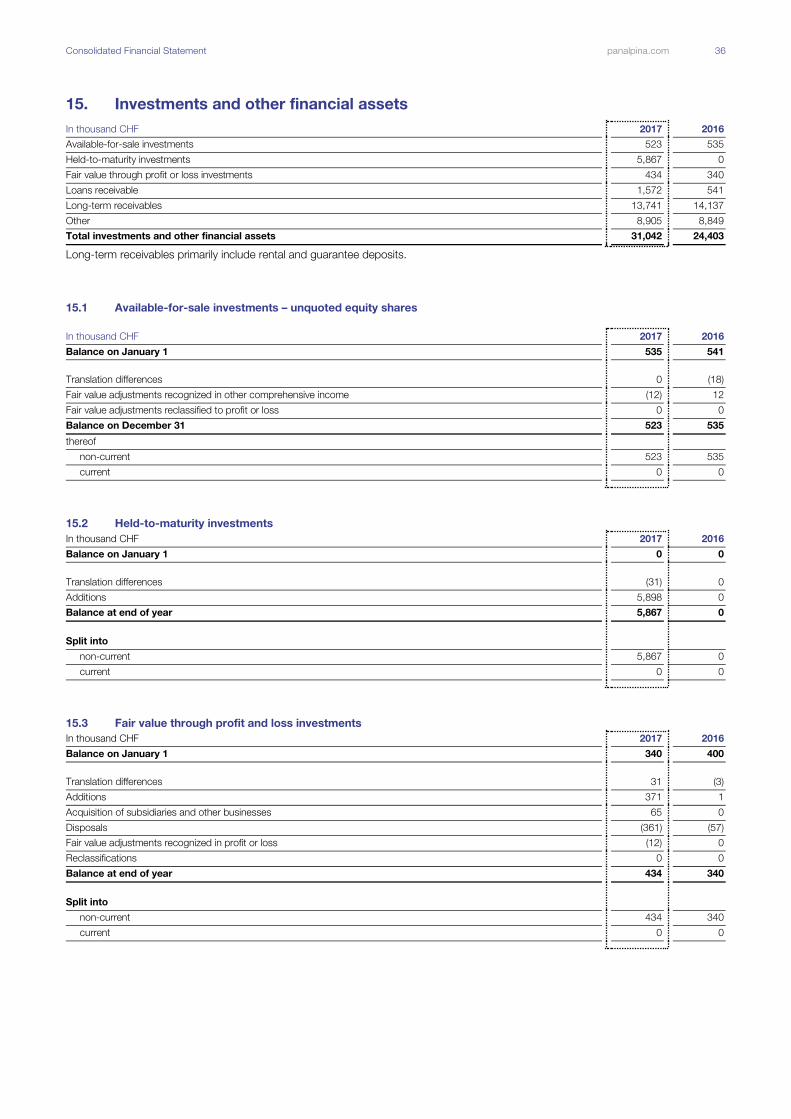
Consolidated Financial Statement panalpina.com 36
15. Investments and other financial assets In thousand CHF 2017 2016
Available-for-sale investments 523 535
Held-to-maturity investments 5,867 0
Fair value through profit or loss investments 434 340
Loans receivable 1,572 541
Long-term receivables 13,741 14,137
Other 8,905 8,849
Total investments and other financial assets 31,042 24,403 Long-term receivables primarily include rental and guarantee deposits.
15.1 Available-for-sale investments – unquoted equity shares
In thousand CHF 2017 2016
Balance on January 1 535 541
Translation differences 0 (18)
Fair value adjustments recognized in other comprehensive income (12) 12
Fair value adjustments reclassified to profit or loss 0 0
Balance on December 31 523 535
thereof
non-current 523 535
current 0 0
15.2 Held-to-maturity investments In thousand CHF 2017 2016
Balance on January 1 0 0
Translation differences (31) 0
Additions 5,898 0
Balance at end of year 5,867 0
Split into
non-current 5,867 0
current 0 0
15.3 Fair value through profit and loss investments In thousand CHF 2017 2016
Balance on January 1 340 400
Translation differences 31 (3)
Additions 371 1
Acquisition of subsidiaries and other businesses 65 0
Disposals (361) (57)
Fair value adjustments recognized in profit or loss (12) 0
Reclassifications 0 0
Balance at end of year 434 340
Split into
non-current 434 340
current 0 0

Consolidated Financial Statement panalpina.com 37
16. Group risk management
In the field of risk management, the Audit Risk and Compliance Committee (ARCC) approves the detailed and weighted risk map of the
Executive Board. It adopts the necessary measures for risk control and risk mitigation and reports the respective outcome to the Board
of Directors on an annual basis. The risk map itself covers any strategic, financial, operational, legal and compliance risks that could
significantly impact the Group’s ability to achieve its business goals and financial targets. Identified risks are weighted and prioritized by
the Executive Board according to their significance and likelihood of occurrence. For each risk, specific risk mitigation measures –
including their current status – are defined and responsibilities are allocated. The risk map, which is compiled by the Risk Review
Committee, chaired by the Corporate Secretary, for review by the Executive Board and the Audit Risk and Compliance Committee and
subsequently approved by the ARCC, contains risks identified and assessed by the respective corporate functions, selected country
management, Corporate Audit and the Group auditors. The annual risk map also features risks that have increased or decreased in the
course of the reporting year. Financial risk management specifically is described in further detail below.
17. Financial risk management
The Group’s principal financial liabilities, other than derivatives, comprise loans and borrowings, trade and other payables. The main
purpose of these financial liabilities is to raise funds and manage liquidity for Group operations. The Group has trade and other
receivables, loans, cash and short-term and long-term deposits that arise directly from its operations. The Group also holds available-
for-sale and held to maturity investments and enters into derivative transactions.
The Group is exposed to market risk, credit risk, liquidity risk and capital risk. The Group’s senior management oversees the
management of these risks. It is supported by a treasury risk committee that advises on financial risks and the appropriate financial risk
governance framework for the Group. The treasury risk committee provides assurance to the Group’s senior management that the
Group’s financial risk-taking activities are governed by appropriate policies and procedures and that financial risks are identified,
measured and managed in accordance with Group policies and Group risk appetite. All derivative activities for risk management
purposes are carried out by specialist teams that have the appropriate skills, experience and supervision. It is the Group’s policy that no
trading in derivatives for speculative purposes shall be undertaken.
The Board of Directors reviews and agrees on policies for managing each of these risks, which are summarized below.
17.1 Financial risk factors
Accounting classification and fair values of financial assets and liabilities
2017 in thousand CHF
Cash and
cash
equiva
-lents
Available-
for-sale
Held to
maturity
FVTPL
held
for
trading
Loans
and
receiv-
ables
Carrying
amount
Total
(fair
value)
Trade receivables 1,003,537 1,003,537 1,003,537
Other receivables 55,619 55,619 55,619
Unbilled forwarding services 93,476 93,476 93,476
Cash and cash equivalents 310,850 310,850 310,850
Derivative financial instruments 3,360 3,360 3,360
Investments:
Bonds and debentures 5,867 434 6,301 6,301
Shares 523 523 523
Third-party loans 1,572 1,572 1,572
Rental and guarantee deposits 13,741 13,741 13,741
Other 8,905 8,905 8,905
Total 310,850 523 5,867 3,795 1,176,849 1,497,884 1,497,884
2017 in thousand CHF
Financial
liabilities
at FVTPL
Financial
liabilities
at
amortized
cost
Carrying
amount
Total
(fair
value)
Payables and accruals (949,416) (949,416) (949,416)
Borrowings (5,863) (5,863) (5,863)
Finance lease liabilities 0 0 0
Derivative financial instruments (1,185) (1,185) (1,185)
Total (1,185) (955,279) (956,465) (956,465)
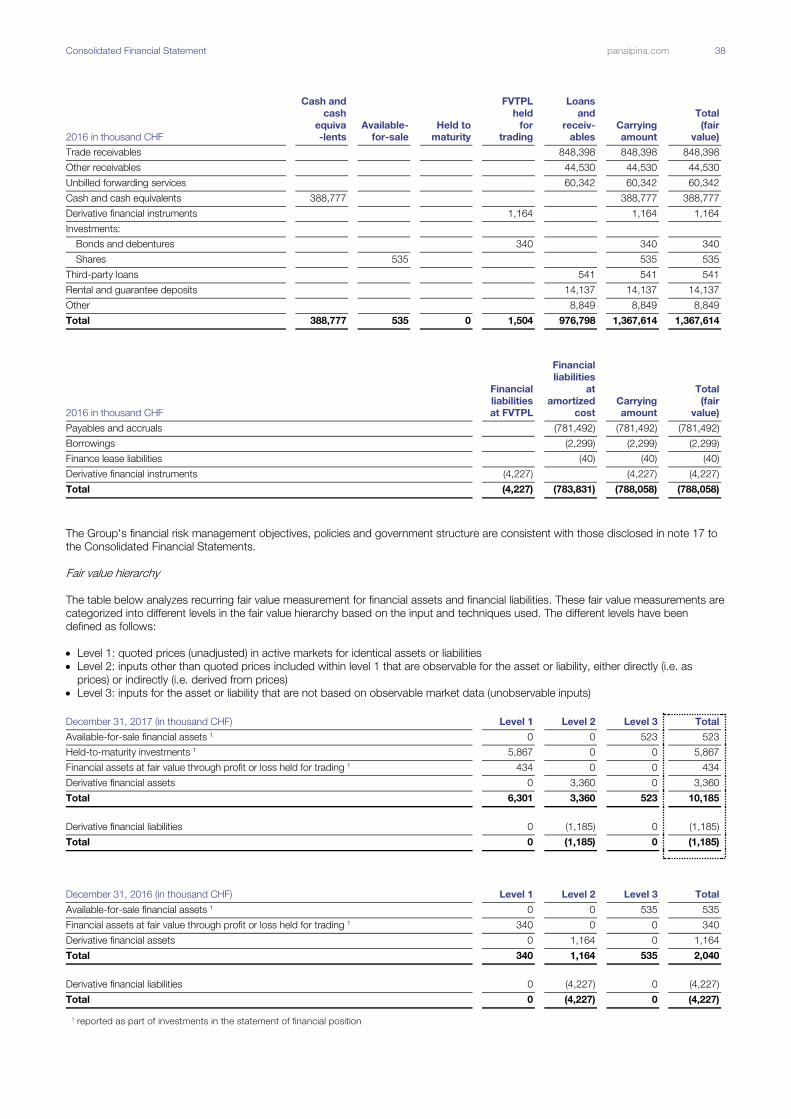
Consolidated Financial Statement panalpina.com 38
2016 in thousand CHF
Cash and
cash
equiva
-lents
Available-
for-sale
Held to
maturity
FVTPL
held
for
trading
Loans
and
receiv-
ables
Carrying
amount
Total
(fair
value)
Trade receivables 848,398 848,398 848,398
Other receivables 44,530 44,530 44,530
Unbilled forwarding services 60,342 60,342 60,342
Cash and cash equivalents 388,777 388,777 388,777
Derivative financial instruments 1,164 1,164 1,164
Investments:
Bonds and debentures 340 340 340
Shares 535 535 535
Third-party loans 541 541 541
Rental and guarantee deposits 14,137 14,137 14,137
Other 8,849 8,849 8,849
Total 388,777 535 0 1,504 976,798 1,367,614 1,367,614
2016 in thousand CHF
Financial
liabilities
at FVTPL
Financial
liabilities
at
amortized
cost
Carrying
amount
Total
(fair
value)
Payables and accruals (781,492) (781,492) (781,492)
Borrowings (2,299) (2,299) (2,299)
Finance lease liabilities (40) (40) (40)
Derivative financial instruments (4,227) (4,227) (4,227)
Total (4,227) (783,831) (788,058) (788,058)
The Group's financial risk management objectives, policies and government structure are consistent with those disclosed in note 17 to
the Consolidated Financial Statements.
Fair value hierarchy
The table below analyzes recurring fair value measurement for financial assets and financial liabilities. These fair value measurements are
categorized into different levels in the fair value hierarchy based on the input and techniques used. The different levels have been
defined as follows:
Level 1: quoted prices (unadjusted) in active markets for identical assets or liabilities
Level 2: inputs other than quoted prices included within level 1 that are observable for the asset or liability, either directly (i.e. as
prices) or indirectly (i.e. derived from prices)
Level 3: inputs for the asset or liability that are not based on observable market data (unobservable inputs)
December 31, 2017 (in thousand CHF) Level 1 Level 2 Level 3 Total
Available-for-sale financial assets 1 0 0 523 523
Held-to-maturity investments 1 5,867 0 0 5,867
Financial assets at fair value through profit or loss held for trading 1 434 0 0 434
Derivative financial assets 0 3,360 0 3,360
Total 6,301 3,360 523 10,185
Derivative financial liabilities 0 (1,185) 0 (1,185)
Total 0 (1,185) 0 (1,185)
December 31, 2016 (in thousand CHF) Level 1 Level 2 Level 3 Total
Available-for-sale financial assets 1 0 0 535 535
Financial assets at fair value through profit or loss held for trading 1 340 0 0 340
Derivative financial assets 0 1,164 0 1,164
Total 340 1,164 535 2,040
Derivative financial liabilities 0 (4,227) 0 (4,227)
Total 0 (4,227) 0 (4,227) 1 reported as part of investments in the statement of financial position
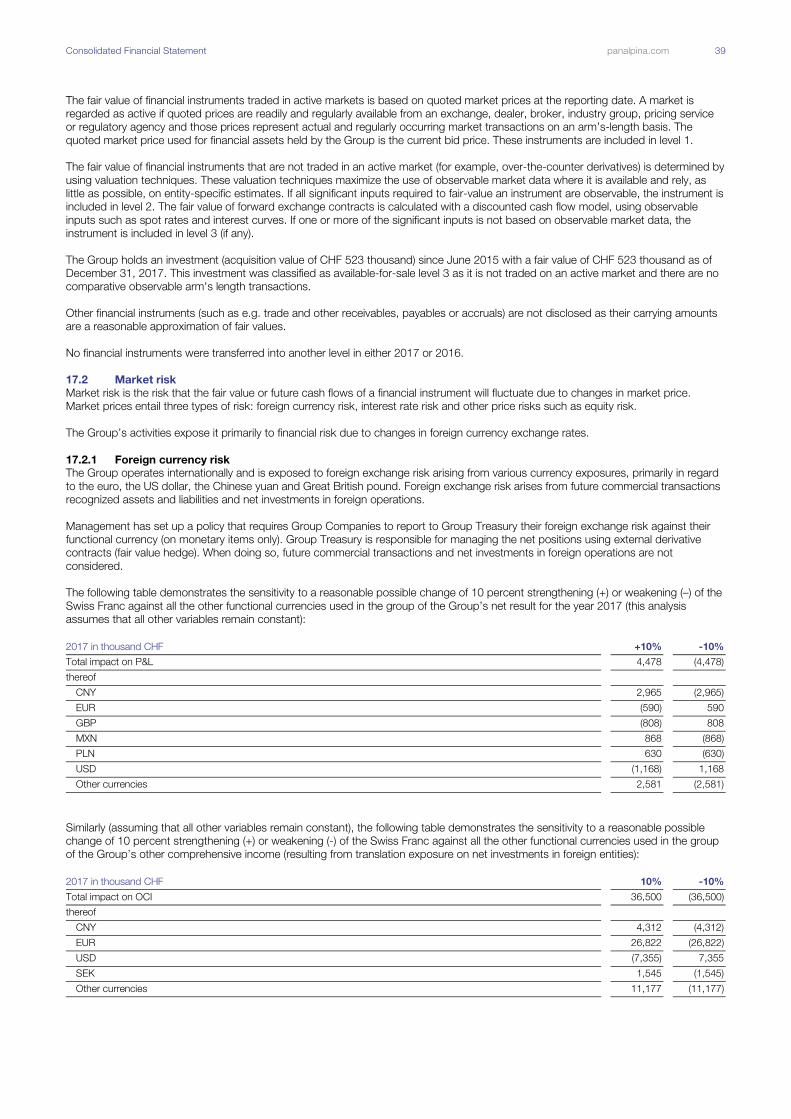
Consolidated Financial Statement panalpina.com 39
The fair value of financial instruments traded in active markets is based on quoted market prices at the reporting date. A market is
regarded as active if quoted prices are readily and regularly available from an exchange, dealer, broker, industry group, pricing service
or regulatory agency and those prices represent actual and regularly occurring market transactions on an arm’s-length basis. The
quoted market price used for financial assets held by the Group is the current bid price. These instruments are included in level 1.
The fair value of financial instruments that are not traded in an active market (for example, over-the-counter derivatives) is determined by
using valuation techniques. These valuation techniques maximize the use of observable market data where it is available and rely, as
little as possible, on entity-specific estimates. If all significant inputs required to fair-value an instrument are observable, the instrument is
included in level 2. The fair value of forward exchange contracts is calculated with a discounted cash flow model, using observable
inputs such as spot rates and interest curves. If one or more of the significant inputs is not based on observable market data, the
instrument is included in level 3 (if any).
The Group holds an investment (acquisition value of CHF 523 thousand) since June 2015 with a fair value of CHF 523 thousand as of
December 31, 2017. This investment was classified as available-for-sale level 3 as it is not traded on an active market and there are no
comparative observable arm's length transactions.
Other financial instruments (such as e.g. trade and other receivables, payables or accruals) are not disclosed as their carrying amounts
are a reasonable approximation of fair values.
No financial instruments were transferred into another level in either 2017 or 2016.
17.2 Market risk
Market risk is the risk that the fair value or future cash flows of a financial instrument will fluctuate due to changes in market price.
Market prices entail three types of risk: foreign currency risk, interest rate risk and other price risks such as equity risk.
The Group’s activities expose it primarily to financial risk due to changes in foreign currency exchange rates.
17.2.1 Foreign currency risk
The Group operates internationally and is exposed to foreign exchange risk arising from various currency exposures, primarily in regard
to the euro, the US dollar, the Chinese yuan and Great British pound. Foreign exchange risk arises from future commercial transactions
recognized assets and liabilities and net investments in foreign operations.
Management has set up a policy that requires Group Companies to report to Group Treasury their foreign exchange risk against their
functional currency (on monetary items only). Group Treasury is responsible for managing the net positions using external derivative
contracts (fair value hedge). When doing so, future commercial transactions and net investments in foreign operations are not
considered.
The following table demonstrates the sensitivity to a reasonable possible change of 10 percent strengthening (+) or weakening (–) of the
Swiss Franc against all the other functional currencies used in the group of the Group’s net result for the year 2017 (this analysis
assumes that all other variables remain constant):
2017 in thousand CHF +10% -10%
Total impact on P&L 4,478 (4,478)
thereof
CNY 2,965 (2,965)
EUR (590) 590
GBP (808) 808
MXN 868 (868)
PLN 630 (630)
USD (1,168) 1,168
Other currencies 2,581 (2,581)
Similarly (assuming that all other variables remain constant), the following table demonstrates the sensitivity to a reasonable possible
change of 10 percent strengthening (+) or weakening (-) of the Swiss Franc against all the other functional currencies used in the group
of the Group’s other comprehensive income (resulting from translation exposure on net investments in foreign entities):
2017 in thousand CHF 10% -10%
Total impact on OCI 36,500 (36,500)
thereof
CNY 4,312 (4,312)
EUR 26,822 (26,822)
USD (7,355) 7,355
SEK 1,545 (1,545)
Other currencies 11,177 (11,177)
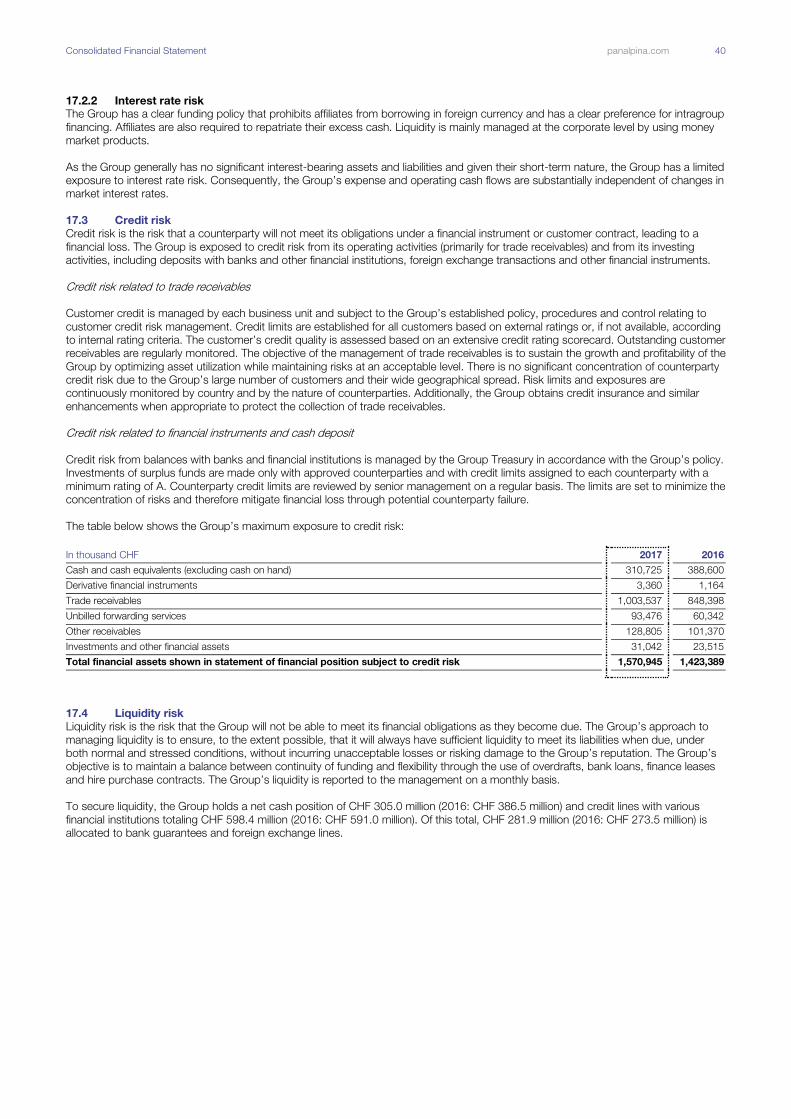
Consolidated Financial Statement panalpina.com 40
17.2.2 Interest rate risk
The Group has a clear funding policy that prohibits affiliates from borrowing in foreign currency and has a clear preference for intragroup
financing. Affiliates are also required to repatriate their excess cash. Liquidity is mainly managed at the corporate level by using money
market products.
As the Group generally has no significant interest-bearing assets and liabilities and given their short-term nature, the Group has a limited
exposure to interest rate risk. Consequently, the Group’s expense and operating cash flows are substantially independent of changes in
market interest rates.
17.3 Credit risk
Credit risk is the risk that a counterparty will not meet its obligations under a financial instrument or customer contract, leading to a
financial loss. The Group is exposed to credit risk from its operating activities (primarily for trade receivables) and from its investing
activities, including deposits with banks and other financial institutions, foreign exchange transactions and other financial instruments.
Credit risk related to trade receivables
Customer credit is managed by each business unit and subject to the Group’s established policy, procedures and control relating to
customer credit risk management. Credit limits are established for all customers based on external ratings or, if not available, according
to internal rating criteria. The customer’s credit quality is assessed based on an extensive credit rating scorecard. Outstanding customer
receivables are regularly monitored. The objective of the management of trade receivables is to sustain the growth and profitability of the
Group by optimizing asset utilization while maintaining risks at an acceptable level. There is no significant concentration of counterparty
credit risk due to the Group’s large number of customers and their wide geographical spread. Risk limits and exposures are
continuously monitored by country and by the nature of counterparties. Additionally, the Group obtains credit insurance and similar
enhancements when appropriate to protect the collection of trade receivables.
Credit risk related to financial instruments and cash deposit
Credit risk from balances with banks and financial institutions is managed by the Group Treasury in accordance with the Group’s policy.
Investments of surplus funds are made only with approved counterparties and with credit limits assigned to each counterparty with a
minimum rating of A. Counterparty credit limits are reviewed by senior management on a regular basis. The limits are set to minimize the
concentration of risks and therefore mitigate financial loss through potential counterparty failure.
The table below shows the Group’s maximum exposure to credit risk:
In thousand CHF 2017 2016
Cash and cash equivalents (excluding cash on hand) 310,725 388,600
Derivative financial instruments 3,360 1,164
Trade receivables 1,003,537 848,398
Unbilled forwarding services 93,476 60,342
Other receivables 128,805 101,370
Investments and other financial assets 31,042 23,515
Total financial assets shown in statement of financial position subject to credit risk 1,570,945 1,423,389
17.4 Liquidity risk
Liquidity risk is the risk that the Group will not be able to meet its financial obligations as they become due. The Group’s approach to
managing liquidity is to ensure, to the extent possible, that it will always have sufficient liquidity to meet its liabilities when due, under
both normal and stressed conditions, without incurring unacceptable losses or risking damage to the Group’s reputation. The Group’s
objective is to maintain a balance between continuity of funding and flexibility through the use of overdrafts, bank loans, finance leases
and hire purchase contracts. The Group’s liquidity is reported to the management on a monthly basis.
To secure liquidity, the Group holds a net cash position of CHF 305.0 million (2016: CHF 386.5 million) and credit lines with various
financial institutions totaling CHF 598.4 million (2016: CHF 591.0 million). Of this total, CHF 281.9 million (2016: CHF 273.5 million) is
allocated to bank guarantees and foreign exchange lines.

Consolidated Financial Statement panalpina.com 41
The table below summarizes the maturity profile of the Group’s financial liabilities at December 31, 2017 and 2016 based on contractual
undiscounted payments (the prior year table has been adjusted to only present financial liabilities):
2017 in thousand CHF
between
1 and 3
months
between
3 months
and
1 year
between
1 and 5
years
Total
remaining
contrac-
tual
payments
Borrowings (2,302) (344) (4,280) (6,927)
Trade payables (467,876) (19,752) (4,326) (491,954)
Other payables (72,916) (2,637) (2,237) (77,790)
Total non derivative financial liabilities (543,094) (22,734) (10,843) (576,670)
Foreign exchange contracts
Cash inflow 175,272 2,694 0 177,966
Cash outflow (176,434) (2,746) 0 (179,180)
Total derivative financial liabilities (1,162) (52) 0 (1,214)
Total (544,255) (22,786) (10,843) (577,884)
2016 in thousand CHF
between
1 and 3
months
between
3 months
and
1 year
between
1 and 5
years
Total
remaining
contractu
al
payments
Borrowings (2,334) (5) 0 (2,339)
Trade payables (384,460) (23,992) 0 (408,452)
Other payables (51,674) (4,108) 0 (55,781)
Total non derivative financial liabilities (438,468) (28,105) 0 (466,573)
Foreign exchange contracts
Cash inflow 495,899 9,148 0 505,047
Cash outflow (499,884) (9,162) 0 (509,046)
Total derivative financial liabilities (3,985) (14) 0 (3,999)
Total (442,453) (28,119) 0 (470,572)
It has to be noted, that for the borrowings disclosed above, interests expenses have been considered hereby preventing a direct
reconciliation with the statement of financial position.
17.5 Capital risk management
The Group’s objectives when managing capital are to safeguard its ability to continue as a going concern in order to provide returns for
shareholders and benefits for other stakeholders and to maintain an optimal capital structure to reduce the cost of capital. In order to
maintain or adjust the capital structure, the Group may adjust the amount of dividends paid to shareholders, return capital to
shareholders, issue new shares or sell assets to reduce debts. Capital is monitored on the basis of the equity ratio, which is calculated
as equity (including non-controlling interests) as a percentage of total assets. This is reported to the management as part of the Group’s
regular internal management reporting. The Group’s capital and equity ratio is shown in the table below:
In thousand CHF 2017 2016
Capital and reserves attributable to Panalpina shareholders 608,018 608,026
Equity attributable to non-controlling interests 6,280 8,940
Total equity 614,299 616,966
Total assets 1,839,031 1,660,565
Equity ratio 33.4% 37.2%

Consolidated Financial Statement panalpina.com 42
18. Other receivables and other current assets In thousand CHF 2017 2016
Prepaid Income Tax 27,950 23,030
Other Tax receivables (VAT, withholding tax) 45,246 33,853
Accrued income 1,750 730
Other current financial assets 40 43
Personnel advances 381 822
Social security and payroll taxes (717) 63
Prepaid rent expenses 4,699 6,450
Prepaid communication and IT expenses 3,752 1,995
Supplier rebates 30,589 23,339
Others 15,115 11,046
Total other receivables and other current assets 128,805 101,370
19. Trade receivables In thousand CHF 2017 2016
Commercial clients 1,009,926 859,755
Agents 7,468 7,216
Total trade receivables (gross values) 1,017,394 866,970
Allowance for doubtful trade receivables (13,857) (18,572)
Total trade receivables (net) 1,003,537 848,398
Europe 452,095 353,405
thereof European Union and Rest of Europe 407,456 313,540
thereof Switzerland 44,639 39,865
Asia Pacific 196,374 177,427
Middle East, Africa, CIS 68,753 51,893
Americas 286,315 265,673
Total trade receivables (net) 1,003,537 848,398
There is no concentration of credit risk with regard to trade receivables, as the Group has a large number of customers that are
dispersed internationally.
Panalpina establishes its overall allowance for doubtful trade receivables based on its historical loss experiences. Significant financial
difficulties of the debtor are individually impaired. The maximum exposure to credit risk on the reporting date is the carrying amount of
net trade receivables mentioned above. Based on past experience, the Group does not anticipate writing off not-past-due or
unprovided trade receivables. The change in provisions for impaired trade receivables have been included in other operating expenses
in the income statement.
The following table summarizes the movement in the allowance for doubtful trade receivables:
In thousand CHF 2017 2016
Balance as of January 1 18,572 25,358
Receivables written off during the year as uncollectible (4,109) (7,753)
Changes in allowance for doubtful trade receivables (607) 967
Balance as of December 31 13,857 18,572
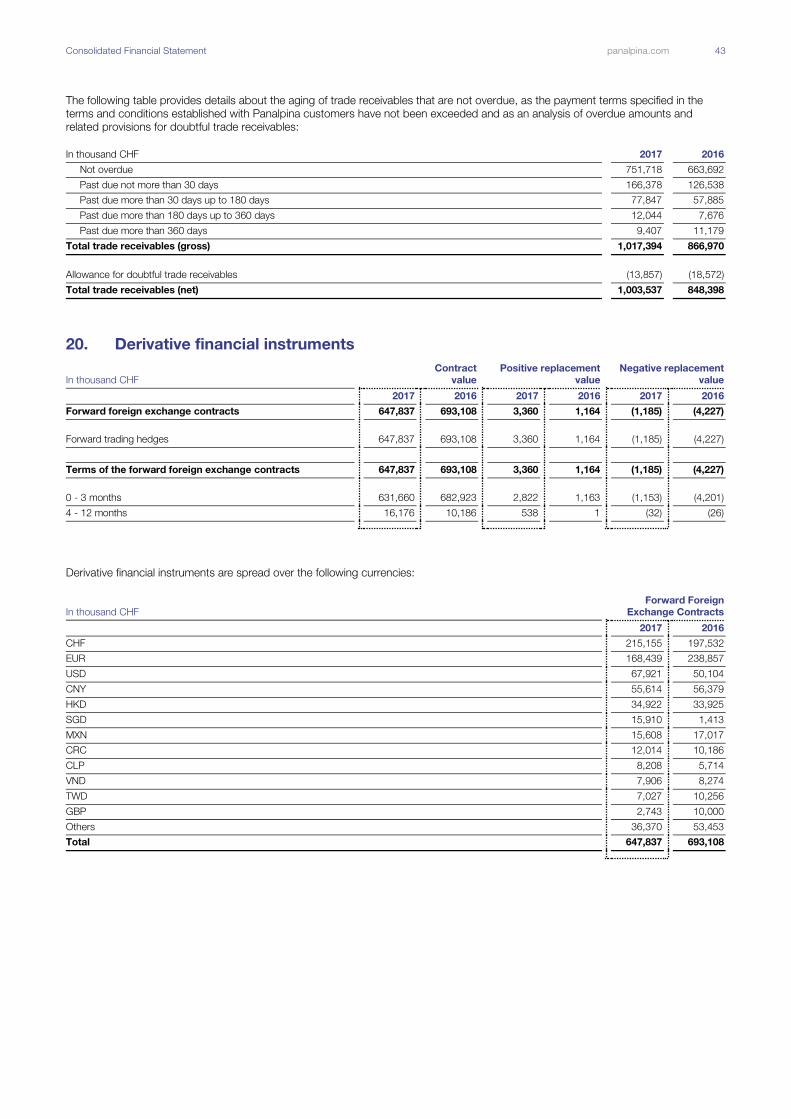
Consolidated Financial Statement panalpina.com 43
The following table provides details about the aging of trade receivables that are not overdue, as the payment terms specified in the
terms and conditions established with Panalpina customers have not been exceeded and as an analysis of overdue amounts and
related provisions for doubtful trade receivables:
In thousand CHF 2017 2016
Not overdue 751,718 663,692
Past due not more than 30 days 166,378 126,538
Past due more than 30 days up to 180 days 77,847 57,885
Past due more than 180 days up to 360 days 12,044 7,676
Past due more than 360 days 9,407 11,179
Total trade receivables (gross) 1,017,394 866,970
Allowance for doubtful trade receivables (13,857) (18,572)
Total trade receivables (net) 1,003,537 848,398
20. Derivative financial instruments
In thousand CHF
Contract
value
Positive replacement
value
Negative replacement
value
2017 2016 2017 2016 2017 2016
Forward foreign exchange contracts 647,837 693,108 3,360 1,164 (1,185) (4,227)
Forward trading hedges 647,837 693,108 3,360 1,164 (1,185) (4,227)
Terms of the forward foreign exchange contracts 647,837 693,108 3,360 1,164 (1,185) (4,227)
0 - 3 months 631,660 682,923 2,822 1,163 (1,153) (4,201)
4 - 12 months 16,176 10,186 538 1 (32) (26)
Derivative financial instruments are spread over the following currencies:
In thousand CHF
Forward Foreign
Exchange Contracts
2017 2016
CHF 215,155 197,532
EUR 168,439 238,857
USD 67,921 50,104
CNY 55,614 56,379
HKD 34,922 33,925
SGD 15,910 1,413
MXN 15,608 17,017
CRC 12,014 10,186
CLP 8,208 5,714
VND 7,906 8,274
TWD 7,027 10,256
GBP 2,743 10,000
Others 36,370 53,453
Total 647,837 693,108
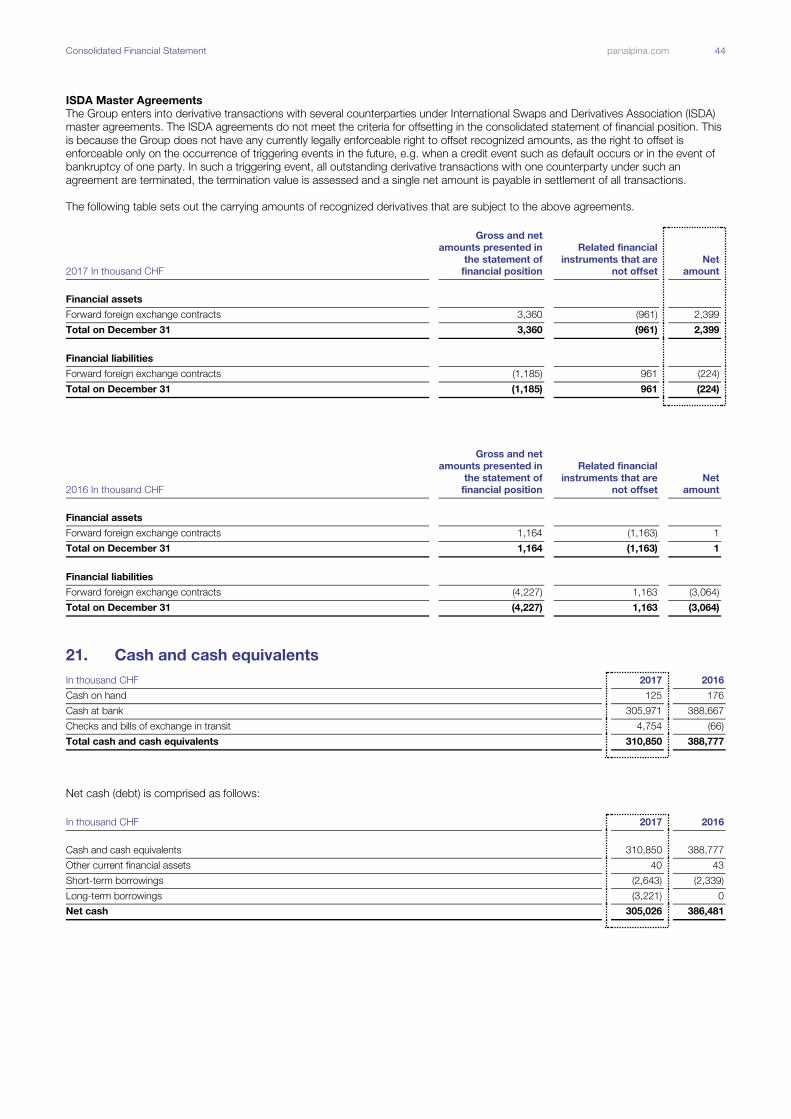
Consolidated Financial Statement panalpina.com 44
ISDA Master Agreements
The Group enters into derivative transactions with several counterparties under International Swaps and Derivatives Association (ISDA)
master agreements. The ISDA agreements do not meet the criteria for offsetting in the consolidated statement of financial position. This
is because the Group does not have any currently legally enforceable right to offset recognized amounts, as the right to offset is
enforceable only on the occurrence of triggering events in the future, e.g. when a credit event such as default occurs or in the event of
bankruptcy of one party. In such a triggering event, all outstanding derivative transactions with one counterparty under such an
agreement are terminated, the termination value is assessed and a single net amount is payable in settlement of all transactions.
The following table sets out the carrying amounts of recognized derivatives that are subject to the above agreements.
2017 In thousand CHF
Gross and net
amounts presented in
the statement of
financial position
Related financial
instruments that are
not offset
Net
amount
Financial assets
Forward foreign exchange contracts 3,360 (961) 2,399
Total on December 31 3,360 (961) 2,399
Financial liabilities
Forward foreign exchange contracts (1,185) 961 (224)
Total on December 31 (1,185) 961 (224)
2016 In thousand CHF
Gross and net
amounts presented in
the statement of
financial position
Related financial
instruments that are
not offset
Net
amount
Financial assets
Forward foreign exchange contracts 1,164 (1,163) 1
Total on December 31 1,164 (1,163) 1
Financial liabilities
Forward foreign exchange contracts (4,227) 1,163 (3,064)
Total on December 31 (4,227) 1,163 (3,064)
21. Cash and cash equivalents In thousand CHF 2017 2016
Cash on hand 125 176
Cash at bank 305,971 388,667
Checks and bills of exchange in transit 4,754 (66)
Total cash and cash equivalents 310,850 388,777
Net cash (debt) is comprised as follows:
In thousand CHF 2017 2016
Cash and cash equivalents 310,850 388,777
Other current financial assets 40 43
Short-term borrowings (2,643) (2,339)
Long-term borrowings (3,221) 0
Net cash 305,026 386,481
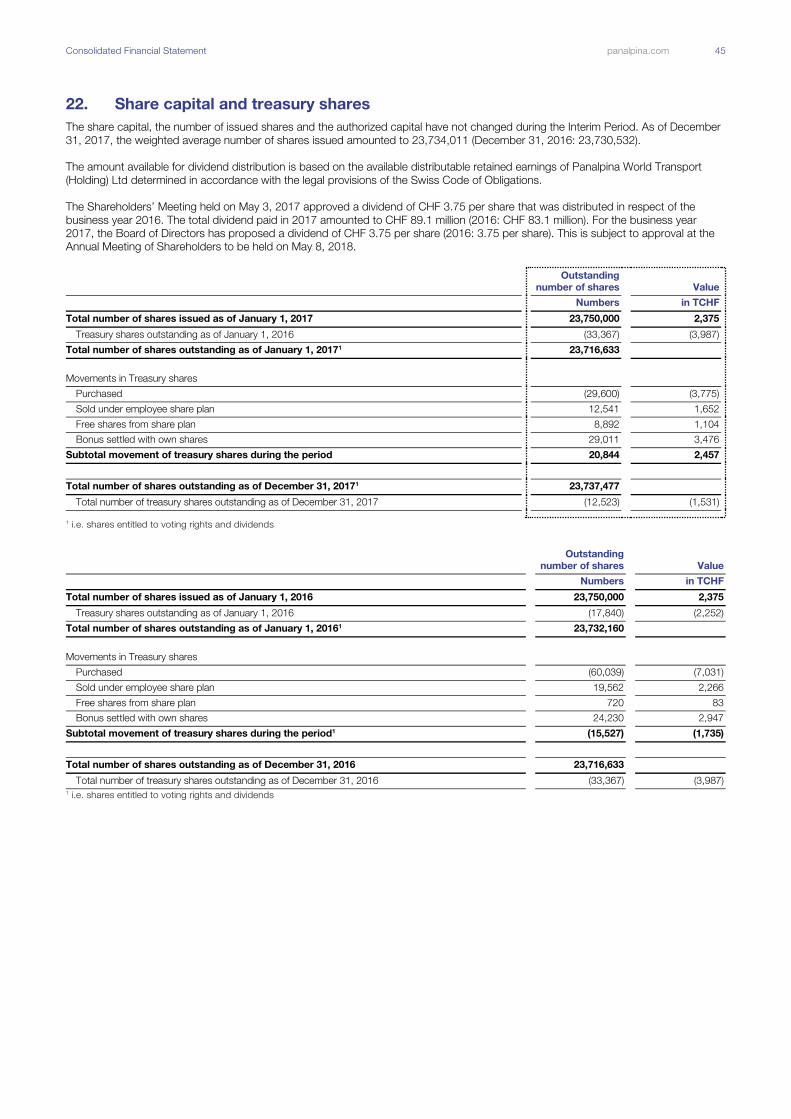
Consolidated Financial Statement panalpina.com 45
22. Share capital and treasury shares
The share capital, the number of issued shares and the authorized capital have not changed during the Interim Period. As of December
31, 2017, the weighted average number of shares issued amounted to 23,734,011 (December 31, 2016: 23,730,532).
The amount available for dividend distribution is based on the available distributable retained earnings of Panalpina World Transport
(Holding) Ltd determined in accordance with the legal provisions of the Swiss Code of Obligations.
The Shareholders’ Meeting held on May 3, 2017 approved a dividend of CHF 3.75 per share that was distributed in respect of the
business year 2016. The total dividend paid in 2017 amounted to CHF 89.1 million (2016: CHF 83.1 million). For the business year
2017, the Board of Directors has proposed a dividend of CHF 3.75 per share (2016: 3.75 per share). This is subject to approval at the
Annual Meeting of Shareholders to be held on May 8, 2018.
Outstanding
number of shares Value
Numbers in TCHF
Total number of shares issued as of January 1, 2017 23,750,000 2,375
Treasury shares outstanding as of January 1, 2016 (33,367) (3,987)
Total number of shares outstanding as of January 1, 20171 23,716,633
Movements in Treasury shares
Purchased (29,600) (3,775)
Sold under employee share plan 12,541 1,652
Free shares from share plan 8,892 1,104
Bonus settled with own shares 29,011 3,476
Subtotal movement of treasury shares during the period 20,844 2,457
Total number of shares outstanding as of December 31, 20171 23,737,477
Total number of treasury shares outstanding as of December 31, 2017 (12,523) (1,531) 1 i.e. shares entitled to voting rights and dividends
Outstanding
number of shares Value
Numbers in TCHF
Total number of shares issued as of January 1, 2016 23,750,000 2,375
Treasury shares outstanding as of January 1, 2016 (17,840) (2,252)
Total number of shares outstanding as of January 1, 20161 23,732,160
Movements in Treasury shares
Purchased (60,039) (7,031)
Sold under employee share plan 19,562 2,266
Free shares from share plan 720 83
Bonus settled with own shares 24,230 2,947
Subtotal movement of treasury shares during the period1 (15,527) (1,735)
Total number of shares outstanding as of December 31, 2016 23,716,633
Total number of treasury shares outstanding as of December 31, 2016 (33,367) (3,987)
1 i.e. shares entitled to voting rights and dividends
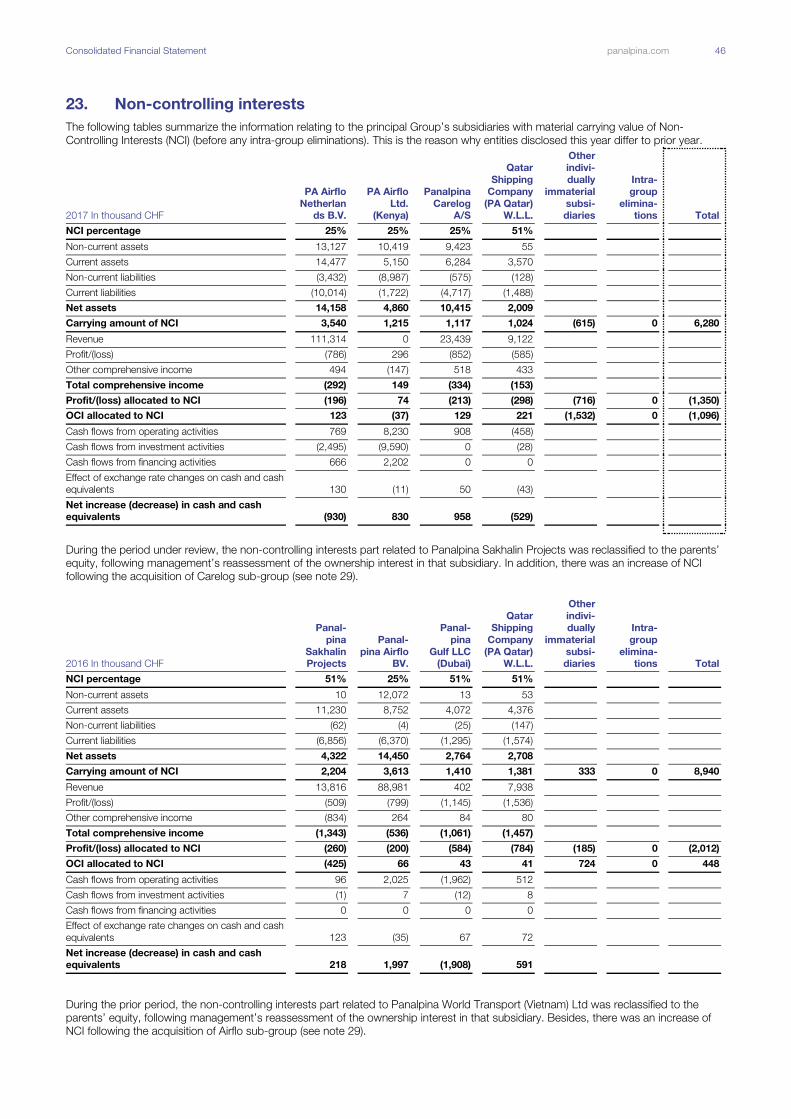
Consolidated Financial Statement panalpina.com 46
23. Non-controlling interests
The following tables summarize the information relating to the principal Group’s subsidiaries with material carrying value of Non-
Controlling Interests (NCI) (before any intra-group eliminations). This is the reason why entities disclosed this year differ to prior year.
2017 In thousand CHF
PA Airflo
Netherlan
ds B.V.
PA Airflo
Ltd.
(Kenya)
Panalpina
Carelog
A/S
Qatar
Shipping
Company
(PA Qatar)
W.L.L.
Other
indivi-
dually
immaterial
subsi-
diaries
Intra-
group
elimina-
tions Total
NCI percentage 25% 25% 25% 51%
Non-current assets 13,127 10,419 9,423 55
Current assets 14,477 5,150 6,284 3,570
Non-current liabilities (3,432) (8,987) (575) (128)
Current liabilities (10,014) (1,722) (4,717) (1,488)
Net assets 14,158 4,860 10,415 2,009
Carrying amount of NCI 3,540 1,215 1,117 1,024 (615) 0 6,280
Revenue 111,314 0 23,439 9,122
Profit/(loss) (786) 296 (852) (585)
Other comprehensive income 494 (147) 518 433
Total comprehensive income (292) 149 (334) (153)
Profit/(loss) allocated to NCI (196) 74 (213) (298) (716) 0 (1,350)
OCI allocated to NCI 123 (37) 129 221 (1,532) 0 (1,096)
Cash flows from operating activities 769 8,230 908 (458)
Cash flows from investment activities (2,495) (9,590) 0 (28)
Cash flows from financing activities 666 2,202 0 0
Effect of exchange rate changes on cash and cash
equivalents 130 (11) 50 (43)
Net increase (decrease) in cash and cash
equivalents (930) 830 958 (529)
During the period under review, the non-controlling interests part related to Panalpina Sakhalin Projects was reclassified to the parents’
equity, following management’s reassessment of the ownership interest in that subsidiary. In addition, there was an increase of NCI
following the acquisition of Carelog sub-group (see note 29).
2016 In thousand CHF
Panal-
pina
Sakhalin
Projects
Panal-
pina Airflo
BV.
Panal-
pina
Gulf LLC
(Dubai)
Qatar
Shipping
Company
(PA Qatar)
W.L.L.
Other
indivi-
dually
immaterial
subsi-
diaries
Intra-
group
elimina-
tions Total
NCI percentage 51% 25% 51% 51%
Non-current assets 10 12,072 13 53
Current assets 11,230 8,752 4,072 4,376
Non-current liabilities (62) (4) (25) (147)
Current liabilities (6,856) (6,370) (1,295) (1,574)
Net assets 4,322 14,450 2,764 2,708
Carrying amount of NCI 2,204 3,613 1,410 1,381 333 0 8,940
Revenue 13,816 88,981 402 7,938
Profit/(loss) (509) (799) (1,145) (1,536)
Other comprehensive income (834) 264 84 80
Total comprehensive income (1,343) (536) (1,061) (1,457)
Profit/(loss) allocated to NCI (260) (200) (584) (784) (185) 0 (2,012)
OCI allocated to NCI (425) 66 43 41 724 0 448
Cash flows from operating activities 96 2,025 (1,962) 512
Cash flows from investment activities (1) 7 (12) 8
Cash flows from financing activities 0 0 0 0
Effect of exchange rate changes on cash and cash
equivalents 123 (35) 67 72
Net increase (decrease) in cash and cash
equivalents 218 1,997 (1,908) 591
During the prior period, the non-controlling interests part related to Panalpina World Transport (Vietnam) Ltd was reclassified to the
parents’ equity, following management’s reassessment of the ownership interest in that subsidiary. Besides, there was an increase of
NCI following the acquisition of Airflo sub-group (see note 29).
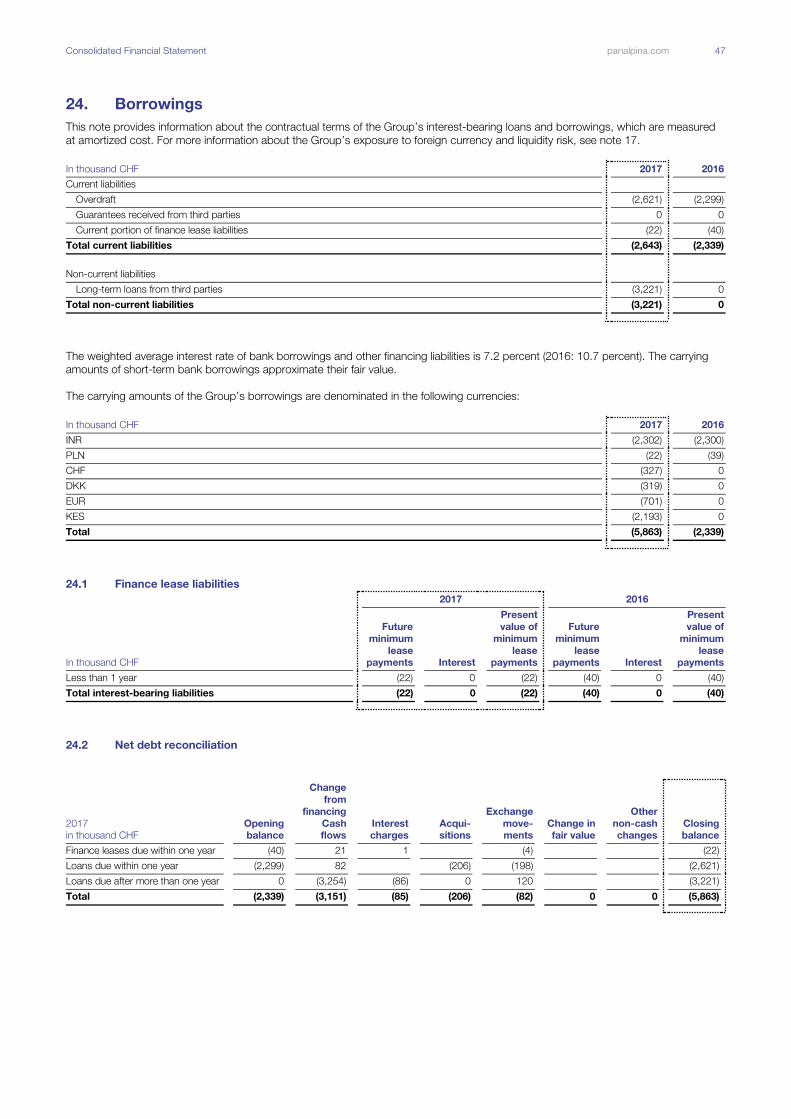
Consolidated Financial Statement panalpina.com 47
24. Borrowings
This note provides information about the contractual terms of the Group’s interest-bearing loans and borrowings, which are measured
at amortized cost. For more information about the Group’s exposure to foreign currency and liquidity risk, see note 17.
In thousand CHF 2017 2016
Current liabilities
Overdraft (2,621) (2,299)
Guarantees received from third parties 0 0
Current portion of finance lease liabilities (22) (40)
Total current liabilities (2,643) (2,339)
Non-current liabilities
Long-term loans from third parties (3,221) 0
Total non-current liabilities (3,221) 0
The weighted average interest rate of bank borrowings and other financing liabilities is 7.2 percent (2016: 10.7 percent). The carrying
amounts of short-term bank borrowings approximate their fair value.
The carrying amounts of the Group’s borrowings are denominated in the following currencies:
In thousand CHF 2017 2016
INR (2,302) (2,300)
PLN (22) (39)
CHF (327) 0
DKK (319) 0
EUR (701) 0
KES (2,193) 0
Total (5,863) (2,339)
24.1 Finance lease liabilities 2017 2016
In thousand CHF
Future
minimum
lease
payments Interest
Present
value of
minimum
lease
payments
Future
minimum
lease
payments Interest
Present
value of
minimum
lease
payments
Less than 1 year (22) 0 (22) (40) 0 (40)
Total interest-bearing liabilities (22) 0 (22) (40) 0 (40)
24.2 Net debt reconciliation
2017
in thousand CHF
Opening
balance
Change
from
financing
Cash
flows
Interest
charges
Acqui-
sitions
Exchange
move-
ments
Change in
fair value
Other
non-cash
changes
Closing
balance
Finance leases due within one year (40) 21 1 (4) (22)
Loans due within one year (2,299) 82 (206) (198) (2,621)
Loans due after more than one year 0 (3,254) (86) 0 120 (3,221)
Total (2,339) (3,151) (85) (206) (82) 0 0 (5,863)
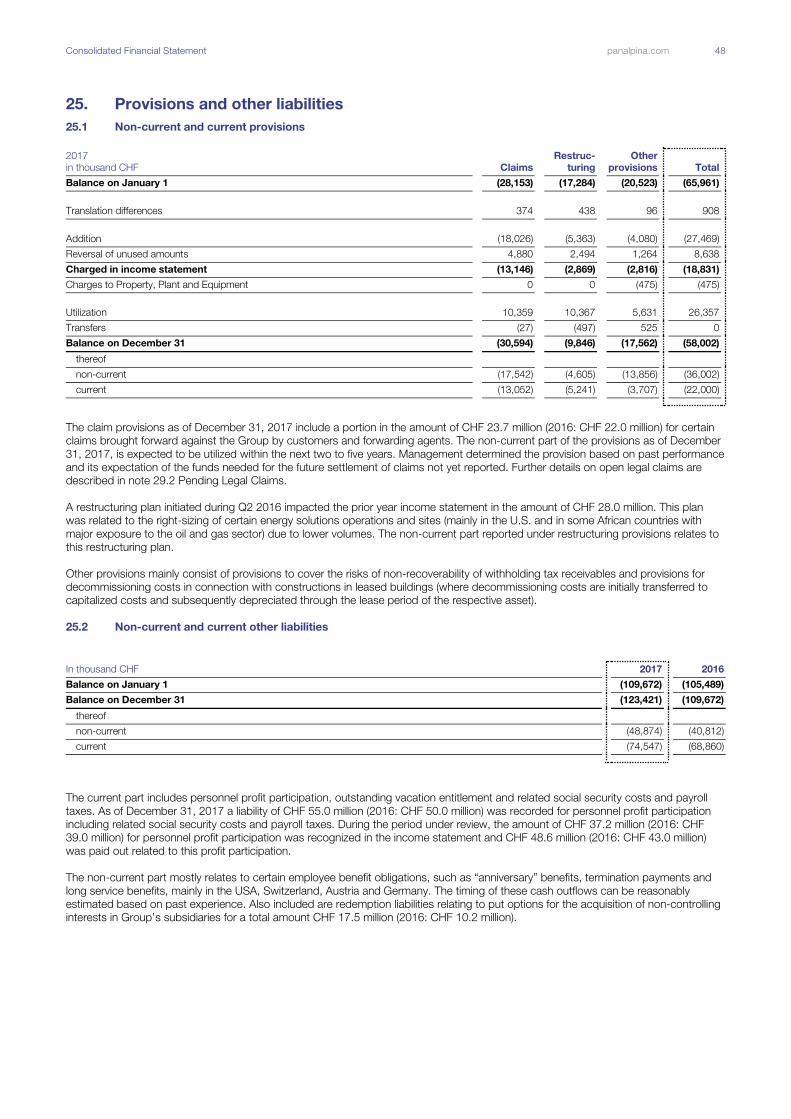
Consolidated Financial Statement panalpina.com 48
25. Provisions and other liabilities
25.1 Non-current and current provisions
2017
in thousand CHF Claims
Restruc-
turing
Other
provisions Total
Balance on January 1 (28,153) (17,284) (20,523) (65,961)
Translation differences 374 438 96 908
Addition (18,026) (5,363) (4,080) (27,469)
Reversal of unused amounts 4,880 2,494 1,264 8,638
Charged in income statement (13,146) (2,869) (2,816) (18,831)
Charges to Property, Plant and Equipment 0 0 (475) (475)
Utilization 10,359 10,367 5,631 26,357
Transfers (27) (497) 525 0
Balance on December 31 (30,594) (9,846) (17,562) (58,002)
thereof
non-current (17,542) (4,605) (13,856) (36,002)
current (13,052) (5,241) (3,707) (22,000)
The claim provisions as of December 31, 2017 include a portion in the amount of CHF 23.7 million (2016: CHF 22.0 million) for certain
claims brought forward against the Group by customers and forwarding agents. The non-current part of the provisions as of December
31, 2017, is expected to be utilized within the next two to five years. Management determined the provision based on past performance
and its expectation of the funds needed for the future settlement of claims not yet reported. Further details on open legal claims are
described in note 29.2 Pending Legal Claims.
A restructuring plan initiated during Q2 2016 impacted the prior year income statement in the amount of CHF 28.0 million. This plan
was related to the right-sizing of certain energy solutions operations and sites (mainly in the U.S. and in some African countries with
major exposure to the oil and gas sector) due to lower volumes. The non-current part reported under restructuring provisions relates to
this restructuring plan.
Other provisions mainly consist of provisions to cover the risks of non-recoverability of withholding tax receivables and provisions for
decommissioning costs in connection with constructions in leased buildings (where decommissioning costs are initially transferred to
capitalized costs and subsequently depreciated through the lease period of the respective asset).
25.2 Non-current and current other liabilities
In thousand CHF 2017 2016
Balance on January 1 (109,672) (105,489)
Balance on December 31 (123,421) (109,672)
thereof
non-current (48,874) (40,812)
current (74,547) (68,860)
The current part includes personnel profit participation, outstanding vacation entitlement and related social security costs and payroll
taxes. As of December 31, 2017 a liability of CHF 55.0 million (2016: CHF 50.0 million) was recorded for personnel profit participation
including related social security costs and payroll taxes. During the period under review, the amount of CHF 37.2 million (2016: CHF
39.0 million) for personnel profit participation was recognized in the income statement and CHF 48.6 million (2016: CHF 43.0 million)
was paid out related to this profit participation.
The non-current part mostly relates to certain employee benefit obligations, such as “anniversary” benefits, termination payments and
long service benefits, mainly in the USA, Switzerland, Austria and Germany. The timing of these cash outflows can be reasonably
estimated based on past experience. Also included are redemption liabilities relating to put options for the acquisition of non-controlling
interests in Group’s subsidiaries for a total amount CHF 17.5 million (2016: CHF 10.2 million).

Consolidated Financial Statement panalpina.com 49
26. Deferred income taxes
Deferred taxes are related to the following statement of financial position items:
2017 In thousand CHF
Receiv-
ables
Fixed
assets
Provi-
sions
Post-em-
ployment
benefits Others
Deduct-
ible
loss
carry-
forwards Total
Net deferred income tax balance at January 1 1,606 14,714 12,738 9,455 1,856 26,799 67,167
Recognized translation differences 24 225 195 0 28 (271) 202
Recognized in income statement 4,743 (11,577) 2,183 (214) (1,418) (3,856) (10,139)
Recognized in OCI 0 0 0 (3,397) 0 0 (3,397)
Acquired in business combinations 0 0 0 0 (1,005) 0 (1,005)
Net deferred income tax balance at December 31 6,373 3,362 15,116 5,843 (540) 22,673 52,827
Thereof deferred income tax assets 63,223
Thereof deferred income tax liabilities (10,396)
2016 In thousand CHF
Receiv-
ables
Fixed
assets
Provi-
sions
Post-em-
ployment
benefits Others
Deduct-
ible
loss
carry-
forwards Total
Net deferred income tax balance at January 1 1,796 4,824 11,087 10,536 7,334 24,586 60,163
Recognized translation differences 128 106 66 (6) 20 430 744
Recognized in income statement (317) 7,874 1,585 162 (5,498) 1,783 5,588
Recognized in OCI 0 0 0 (1,237) 0 0 (1,237)
Acquired in business combinations 0 1,910 0 0 0 0 1,910
Net deferred income tax balance at December 31 1,606 14,714 12,738 9,455 1,856 26,799 67,167
Thereof deferred income tax assets 72,410
Thereof deferred income tax liabilities (5,242)
Year of expiry of unrecognized tax loss carry-forwards (in thousand CHF) 2017 2016
2017 n/a 1,279
2018 680 764
2019 8,069 3,939
2020 7,168 4,147
2021 10,015 12,582
2022 6,964 5,866
Later 136,817 133,580
No expiry date 149,191 122,278
Total unrecognized tax loss carry-forwards 318,904 284,435
The total increase of CHF 34.5 million (2016: increase of CHF 46.7 million) derived mainly from generated tax losses during the year in
the United Kingdom and in Italy which were only partially offset by tax loss carry forwards utilized in the U.S.A. and in the Netherlands.
Deferred tax liabilities have not been recognized for withholding tax and other taxes that would be payable on the remittance of earnings
of subsidiaries, where such amounts are currently regarded as permanently reinvested. The total unremitted earnings of the Group
amounted to CHF 38.7 million as at December 31, 2017 (2016: CHF 48.9 million).
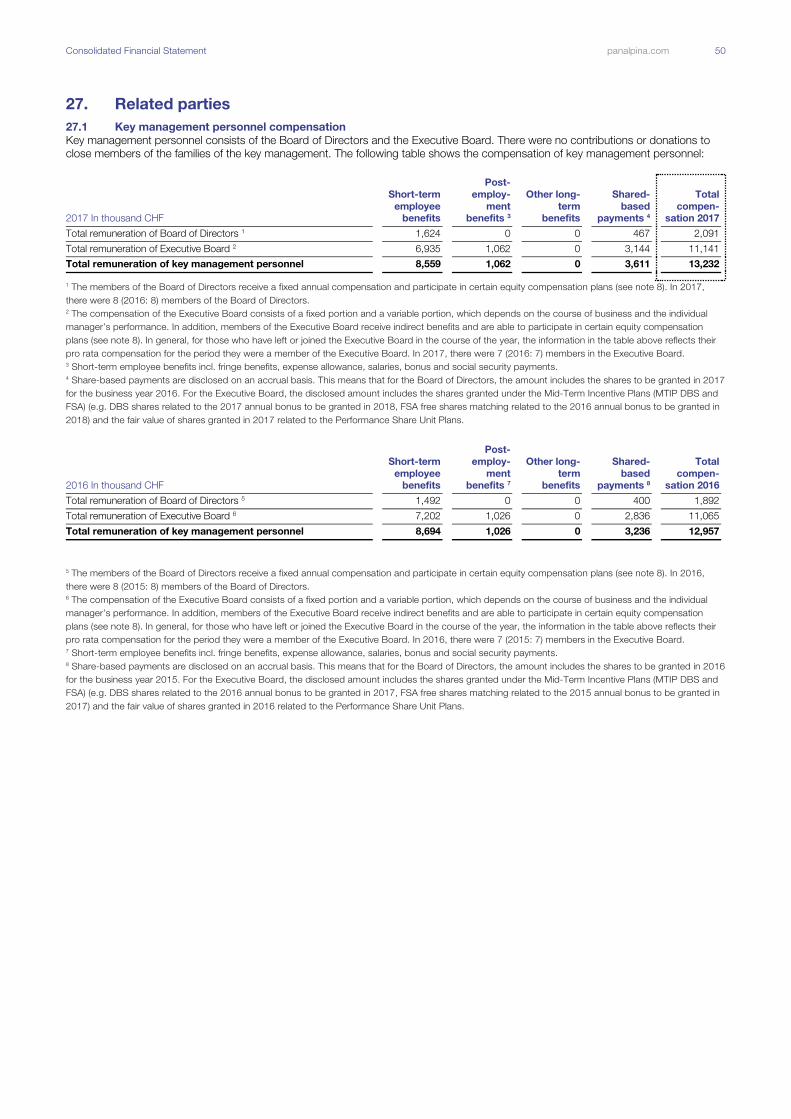
Consolidated Financial Statement panalpina.com 50
27. Related parties
27.1 Key management personnel compensation
Key management personnel consists of the Board of Directors and the Executive Board. There were no contributions or donations to
close members of the families of the key management. The following table shows the compensation of key management personnel:
2017 In thousand CHF
Short-term
employee
benefits
Post-
employ-
ment
benefits 3
Other long-
term
benefits
Shared-
based
payments 4
Total
compen-
sation 2017
Total remuneration of Board of Directors 1 1,624 0 0 467 2,091
Total remuneration of Executive Board 2 6,935 1,062 0 3,144 11,141
Total remuneration of key management personnel 8,559 1,062 0 3,611 13,232 1 The members of the Board of Directors receive a fixed annual compensation and participate in certain equity compensation plans (see note 8). In 2017,
there were 8 (2016: 8) members of the Board of Directors. 2 The compensation of the Executive Board consists of a fixed portion and a variable portion, which depends on the course of business and the individual
manager’s performance. In addition, members of the Executive Board receive indirect benefits and are able to participate in certain equity compensation
plans (see note 8). In general, for those who have left or joined the Executive Board in the course of the year, the information in the table above reflects their
pro rata compensation for the period they were a member of the Executive Board. In 2017, there were 7 (2016: 7) members in the Executive Board. 3 Short-term employee benefits incl. fringe benefits, expense allowance, salaries, bonus and social security payments. 4 Share-based payments are disclosed on an accrual basis. This means that for the Board of Directors, the amount includes the shares to be granted in 2017
for the business year 2016. For the Executive Board, the disclosed amount includes the shares granted under the Mid-Term Incentive Plans (MTIP DBS and
FSA) (e.g. DBS shares related to the 2017 annual bonus to be granted in 2018, FSA free shares matching related to the 2016 annual bonus to be granted in
2018) and the fair value of shares granted in 2017 related to the Performance Share Unit Plans.
2016 In thousand CHF
Short-term
employee
benefits
Post-
employ-
ment
benefits 7
Other long-
term
benefits
Shared-
based
payments 8
Total
compen-
sation 2016
Total remuneration of Board of Directors 5 1,492 0 0 400 1,892
Total remuneration of Executive Board 6 7,202 1,026 0 2,836 11,065
Total remuneration of key management personnel 8,694 1,026 0 3,236 12,957
5 The members of the Board of Directors receive a fixed annual compensation and participate in certain equity compensation plans (see note 8). In 2016,
there were 8 (2015: 8) members of the Board of Directors. 6 The compensation of the Executive Board consists of a fixed portion and a variable portion, which depends on the course of business and the individual
manager’s performance. In addition, members of the Executive Board receive indirect benefits and are able to participate in certain equity compensation
plans (see note 8). In general, for those who have left or joined the Executive Board in the course of the year, the information in the table above reflects their
pro rata compensation for the period they were a member of the Executive Board. In 2016, there were 7 (2015: 7) members in the Executive Board. 7 Short-term employee benefits incl. fringe benefits, expense allowance, salaries, bonus and social security payments. 8 Share-based payments are disclosed on an accrual basis. This means that for the Board of Directors, the amount includes the shares to be granted in 2016
for the business year 2015. For the Executive Board, the disclosed amount includes the shares granted under the Mid-Term Incentive Plans (MTIP DBS and
FSA) (e.g. DBS shares related to the 2016 annual bonus to be granted in 2017, FSA free shares matching related to the 2015 annual bonus to be granted in
2017) and the fair value of shares granted in 2016 related to the Performance Share Unit Plans.

Consolidated Financial Statement panalpina.com 51
The following table shows the equity holdings in Panalpina World Transport (Holding) Ltd of key management personnel and their
related parties in line with article 663c of the Swiss Code of Obligations (no options were held by Board of Directors or Executive Board
members as of December 31, 2017 and 2016).
Number of PWT nominal shares 2017 2016
Board of Directors
Peter Ulber, Chairman 20,540 8,586
Beat Walti, Vice Chairman 2,552 2,173
Ilias Läber, Member 1,561 1,182
Thomas E. Kern, Member 1,267 888
Pamela Knapp, Member 817 438
Chris E. Muntwyler, Member 2,552 2,173
Dirk Reich, Member (from May 4, 2017) 0 n/a
Roger Schmid, Member (until May 3, 2017) n/a 6,875
Knud Elmholdt Stubkjær, Member 2,125 1,746
Total Board of Directors on December 31 31,414 24,061
Executive Board
Stefan Karlen, Chief Executive Officer 4,273 2,633
Robert Erni, Chief Financial Officer 8,839 9,370
Karl Weyeneth, Chief Commercial Officer 8,286 5,006
Christoph Hess, General Counsel and Corporate Secretary 2,825 3,871
Karsten Breum, Chief Human Resources 2,595 1,036
Ralf Morawietz, Chief Information Officer 1,085 158
Andy Weber, Chief Operating Officer 2,113 759
Total Executive Board on December 31 30,016 22,833
Total Related Parties on December 31 61,430 46,894
27.2 Major shareholder
As of December 31, 2017, Ernst Göhner Stiftung holds 45.9 percent (2016: 45.9 percent) of the share capital of Panalpina World
Transport (Holding) Ltd.
27.3 Other related parties
The major shareholder (as described above), pension funds and all subsidiaries are defined as parties related to the Group. Apart from
the transactions with related parties mentioned below, we refer to notes 7 and 8.
27.4 Other related party transactions
In 2016, the Group provided management services to the Swiss Pension Fund which were fully recharged at arm’s length. These
services amounted to CHF 22 thousand in 2016 and were outsourced to a third party in April 2016.
Panalpina Welttransport GmbH in Germany leased two buildings from an affiliate of Ernst Göhner Stiftung, one in Stuttgart and one in
Nuremberg. The leases were paid at arm’s length and amounted to CHF 2.4 million in the fiscal year 2016. These rents with a related
party ceased in July 2016 as Ernst Göhner Stiftung sold the buildings to a third party.
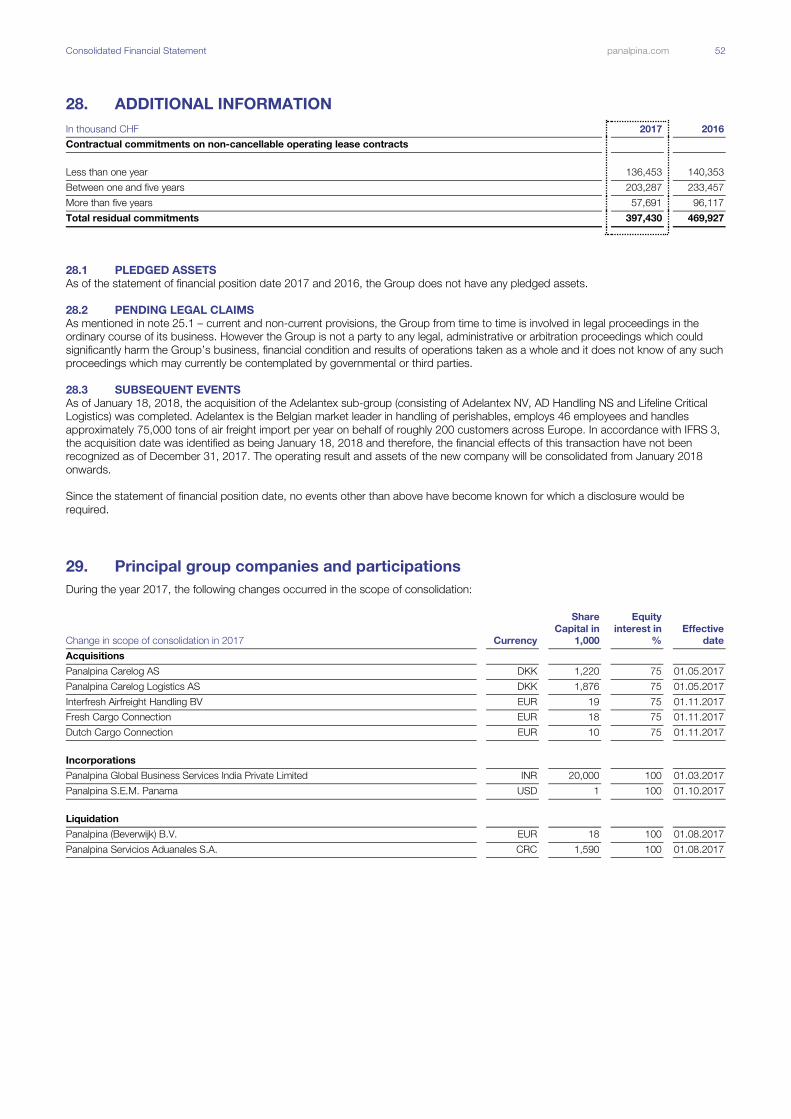
Consolidated Financial Statement panalpina.com 52
28. ADDITIONAL INFORMATION In thousand CHF 2017 2016
Contractual commitments on non-cancellable operating lease contracts
Less than one year 136,453 140,353
Between one and five years 203,287 233,457
More than five years 57,691 96,117
Total residual commitments 397,430 469,927
28.1 PLEDGED ASSETS
As of the statement of financial position date 2017 and 2016, the Group does not have any pledged assets.
28.2 PENDING LEGAL CLAIMS
As mentioned in note 25.1 – current and non-current provisions, the Group from time to time is involved in legal proceedings in the
ordinary course of its business. However the Group is not a party to any legal, administrative or arbitration proceedings which could
significantly harm the Group’s business, financial condition and results of operations taken as a whole and it does not know of any such
proceedings which may currently be contemplated by governmental or third parties.
28.3 SUBSEQUENT EVENTS
As of January 18, 2018, the acquisition of the Adelantex sub-group (consisting of Adelantex NV, AD Handling NS and Lifeline Critical
Logistics) was completed. Adelantex is the Belgian market leader in handling of perishables, employs 46 employees and handles
approximately 75,000 tons of air freight import per year on behalf of roughly 200 customers across Europe. In accordance with IFRS 3,
the acquisition date was identified as being January 18, 2018 and therefore, the financial effects of this transaction have not been
recognized as of December 31, 2017. The operating result and assets of the new company will be consolidated from January 2018
onwards.
Since the statement of financial position date, no events other than above have become known for which a disclosure would be
required.
29. Principal group companies and participations
During the year 2017, the following changes occurred in the scope of consolidation:
Change in scope of consolidation in 2017 Currency
Share
Capital in
1,000
Equity
interest in
%
Effective
date
Acquisitions
Panalpina Carelog AS DKK 1,220 75 01.05.2017
Panalpina Carelog Logistics AS DKK 1,876 75 01.05.2017
Interfresh Airfreight Handling BV EUR 19 75 01.11.2017
Fresh Cargo Connection EUR 18 75 01.11.2017
Dutch Cargo Connection EUR 10 75 01.11.2017
Incorporations
Panalpina Global Business Services India Private Limited INR 20,000 100 01.03.2017
Panalpina S.E.M. Panama USD 1 100 01.10.2017
Liquidation
Panalpina (Beverwijk) B.V. EUR 18 100 01.08.2017
Panalpina Servicios Aduanales S.A. CRC 1,590 100 01.08.2017
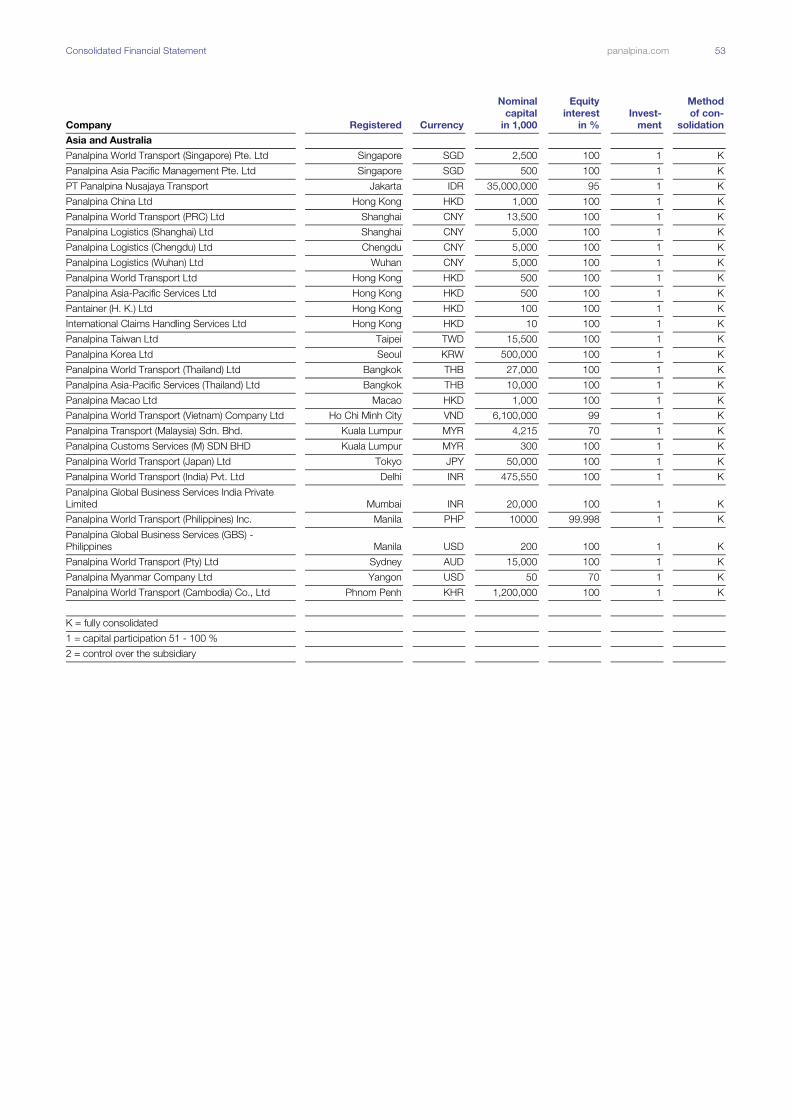
Consolidated Financial Statement panalpina.com 53
Company Registered Currency
Nominal
capital
in 1,000
Equity
interest
in %
Invest-
ment
Method
of con-
solidation
Asia and Australia
Panalpina World Transport (Singapore) Pte. Ltd Singapore SGD 2,500 100 1 K
Panalpina Asia Pacific Management Pte. Ltd Singapore SGD 500 100 1 K
PT Panalpina Nusajaya Transport Jakarta IDR 35,000,000 95 1 K
Panalpina China Ltd Hong Kong HKD 1,000 100 1 K
Panalpina World Transport (PRC) Ltd Shanghai CNY 13,500 100 1 K
Panalpina Logistics (Shanghai) Ltd Shanghai CNY 5,000 100 1 K
Panalpina Logistics (Chengdu) Ltd Chengdu CNY 5,000 100 1 K
Panalpina Logistics (Wuhan) Ltd Wuhan CNY 5,000 100 1 K
Panalpina World Transport Ltd Hong Kong HKD 500 100 1 K
Panalpina Asia-Pacific Services Ltd Hong Kong HKD 500 100 1 K
Pantainer (H. K.) Ltd Hong Kong HKD 100 100 1 K
International Claims Handling Services Ltd Hong Kong HKD 10 100 1 K
Panalpina Taiwan Ltd Taipei TWD 15,500 100 1 K
Panalpina Korea Ltd Seoul KRW 500,000 100 1 K
Panalpina World Transport (Thailand) Ltd Bangkok THB 27,000 100 1 K
Panalpina Asia-Pacific Services (Thailand) Ltd Bangkok THB 10,000 100 1 K
Panalpina Macao Ltd Macao HKD 1,000 100 1 K
Panalpina World Transport (Vietnam) Company Ltd Ho Chi Minh City VND 6,100,000 99 1 K
Panalpina Transport (Malaysia) Sdn. Bhd. Kuala Lumpur MYR 4,215 70 1 K
Panalpina Customs Services (M) SDN BHD Kuala Lumpur MYR 300 100 1 K
Panalpina World Transport (Japan) Ltd Tokyo JPY 50,000 100 1 K
Panalpina World Transport (India) Pvt. Ltd Delhi INR 475,550 100 1 K
Panalpina Global Business Services India Private
Limited Mumbai INR 20,000 100 1 K
Panalpina World Transport (Philippines) Inc. Manila PHP 10000 99.998 1 K
Panalpina Global Business Services (GBS) -
Philippines Manila USD 200 100 1 K
Panalpina World Transport (Pty) Ltd Sydney AUD 15,000 100 1 K
Panalpina Myanmar Company Ltd Yangon USD 50 70 1 K
Panalpina World Transport (Cambodia) Co., Ltd Phnom Penh KHR 1,200,000 100 1 K
K = fully consolidated
1 = capital participation 51 - 100 %
2 = control over the subsidiary
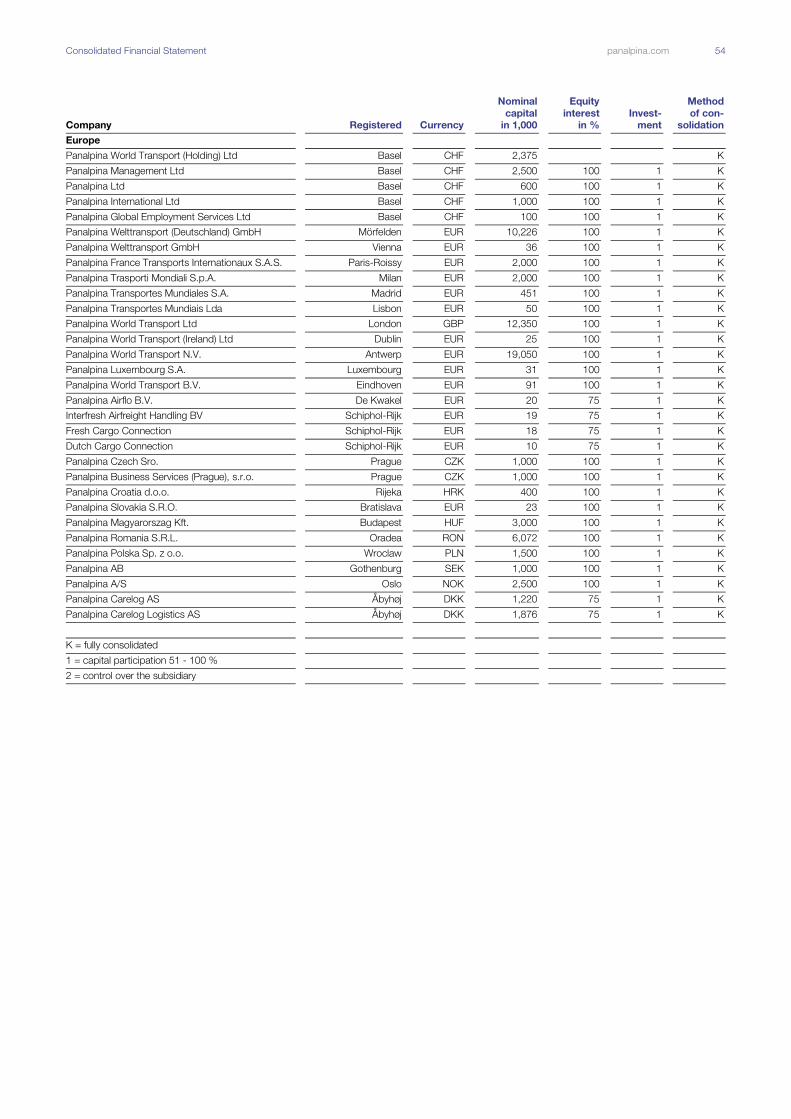
Consolidated Financial Statement panalpina.com 54
Company Registered Currency
Nominal
capital
in 1,000
Equity
interest
in %
Invest-
ment
Method
of con-
solidation
Europe
Panalpina World Transport (Holding) Ltd Basel CHF 2,375 K
Panalpina Management Ltd Basel CHF 2,500 100 1 K
Panalpina Ltd Basel CHF 600 100 1 K
Panalpina International Ltd Basel CHF 1,000 100 1 K
Panalpina Global Employment Services Ltd Basel CHF 100 100 1 K
Panalpina Welttransport (Deutschland) GmbH Mörfelden EUR 10,226 100 1 K
Panalpina Welttransport GmbH Vienna EUR 36 100 1 K
Panalpina France Transports Internationaux S.A.S. Paris-Roissy EUR 2,000 100 1 K
Panalpina Trasporti Mondiali S.p.A. Milan EUR 2,000 100 1 K
Panalpina Transportes Mundiales S.A. Madrid EUR 451 100 1 K
Panalpina Transportes Mundiais Lda Lisbon EUR 50 100 1 K
Panalpina World Transport Ltd London GBP 12,350 100 1 K
Panalpina World Transport (Ireland) Ltd Dublin EUR 25 100 1 K
Panalpina World Transport N.V. Antwerp EUR 19,050 100 1 K
Panalpina Luxembourg S.A. Luxembourg EUR 31 100 1 K
Panalpina World Transport B.V. Eindhoven EUR 91 100 1 K
Panalpina Airflo B.V. De Kwakel EUR 20 75 1 K
Interfresh Airfreight Handling BV Schiphol-Rijk EUR 19 75 1 K
Fresh Cargo Connection Schiphol-Rijk EUR 18 75 1 K
Dutch Cargo Connection Schiphol-Rijk EUR 10 75 1 K
Panalpina Czech Sro. Prague CZK 1,000 100 1 K
Panalpina Business Services (Prague), s.r.o. Prague CZK 1,000 100 1 K
Panalpina Croatia d.o.o. Rijeka HRK 400 100 1 K
Panalpina Slovakia S.R.O. Bratislava EUR 23 100 1 K
Panalpina Magyarorszag Kft. Budapest HUF 3,000 100 1 K
Panalpina Romania S.R.L. Oradea RON 6,072 100 1 K
Panalpina Polska Sp. z o.o. Wroclaw PLN 1,500 100 1 K
Panalpina AB Gothenburg SEK 1,000 100 1 K
Panalpina A/S Oslo NOK 2,500 100 1 K
Panalpina Carelog AS Åbyhøj DKK 1,220 75 1 K
Panalpina Carelog Logistics AS Åbyhøj DKK 1,876 75 1 K
K = fully consolidated
1 = capital participation 51 - 100 %
2 = control over the subsidiary
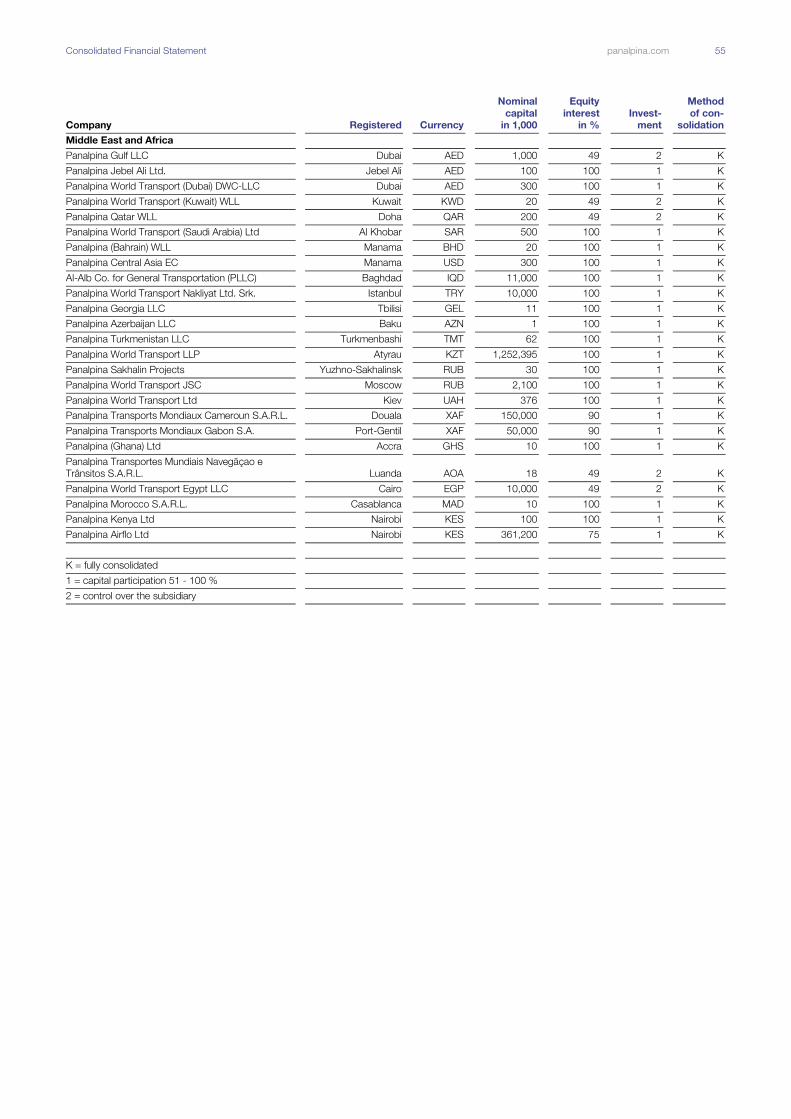
Consolidated Financial Statement panalpina.com 55
Company Registered Currency
Nominal
capital
in 1,000
Equity
interest
in %
Invest-
ment
Method
of con-
solidation
Middle East and Africa
Panalpina Gulf LLC Dubai AED 1,000 49 2 K
Panalpina Jebel Ali Ltd. Jebel Ali AED 100 100 1 K
Panalpina World Transport (Dubai) DWC-LLC Dubai AED 300 100 1 K
Panalpina World Transport (Kuwait) WLL Kuwait KWD 20 49 2 K
Panalpina Qatar WLL Doha QAR 200 49 2 K
Panalpina World Transport (Saudi Arabia) Ltd Al Khobar SAR 500 100 1 K
Panalpina (Bahrain) WLL Manama BHD 20 100 1 K
Panalpina Central Asia EC Manama USD 300 100 1 K
Al-Alb Co. for General Transportation (PLLC) Baghdad IQD 11,000 100 1 K
Panalpina World Transport Nakliyat Ltd. Srk. Istanbul TRY 10,000 100 1 K
Panalpina Georgia LLC Tbilisi GEL 11 100 1 K
Panalpina Azerbaijan LLC Baku AZN 1 100 1 K
Panalpina Turkmenistan LLC Turkmenbashi TMT 62 100 1 K
Panalpina World Transport LLP Atyrau KZT 1,252,395 100 1 K
Panalpina Sakhalin Projects Yuzhno-Sakhalinsk RUB 30 100 1 K
Panalpina World Transport JSC Moscow RUB 2,100 100 1 K
Panalpina World Transport Ltd Kiev UAH 376 100 1 K
Panalpina Transports Mondiaux Cameroun S.A.R.L. Douala XAF 150,000 90 1 K
Panalpina Transports Mondiaux Gabon S.A. Port-Gentil XAF 50,000 90 1 K
Panalpina (Ghana) Ltd Accra GHS 10 100 1 K
Panalpina Transportes Mundiais Navegãçao e
Trânsitos S.A.R.L. Luanda AOA 18 49 2 K
Panalpina World Transport Egypt LLC Cairo EGP 10,000 49 2 K
Panalpina Morocco S.A.R.L. Casablanca MAD 10 100 1 K
Panalpina Kenya Ltd Nairobi KES 100 100 1 K
Panalpina Airflo Ltd Nairobi KES 361,200 75 1 K
K = fully consolidated
1 = capital participation 51 - 100 %
2 = control over the subsidiary

Consolidated Financial Statement panalpina.com 56
Company Registered Currency
Nominal
capital
in 1,000
Equity
interest
in %
Invest-
ment
Method
of con-
solidation
North, Central and South America
Panalpina Inc. Miami USD 138,000 100 1 K
International Claims Handling Services Inc. Miami USD 1 100 1 K
Panalpina Inc. Toronto CAD 100 100 1 K
Panalpina Transportes Mundiales, S.A. de C.V. Mexico City MXN 35,834 100 1 K
Panalpina S.A. Panama City USD 1,250 100 1 K
Almacenadora Mercantil S.A. Panama City USD 25 100 1 K
Panalpina S.E.M. Panama Panama City USD 1 100 1 K
Panalpina S.A. de C.V. San Salvador SVC 100 100 1 K
Panalpina Transportes Mundiales S.A. San José CRC 2,500 100 1 K
Panalpina Uruguay Transportes Mundiales S.A. Montevideo UYU 4,093 100 1 K
Panalpina S.A. Santa Fé de Bogotá COP 7,450,838 100 1 K
DAPSA Depositos Aduaneros Panalpina S.A. Santa Fé de Bogotá COP 2,815,208 100 1 K
Panalpina C.A. Caracas VEF 969,308 100 1 K
Panalpina Ecuador S.A. Quito USD 100 100 1 K
Panalpina Transportes Mundiales S.A. Lima PEN 4,008 100 1 K
Panalpina Ltda. São Paulo BRL 186,474 100 1 K
Panalpina Chile Transportes Mundiales Ltda. Santiago CLP 3,505,817 100 1 K
Panalpina Transportes Mundiales S.A. Buenos Aires ARS 9,742 100 1 K
Panalpina Transportes Mundiales S.R.L. Santo Domingo DOP 1,000 100 1 K
Mondi Reinsurance Ltd Hamilton CHF 1,000 100 1 K
Panalpina FMS, Inc. (Washington) Jersey City USD 1 100 1 K
K = fully consolidated
1 = capital participation 51 - 100 %
2 = control over the subsidiary
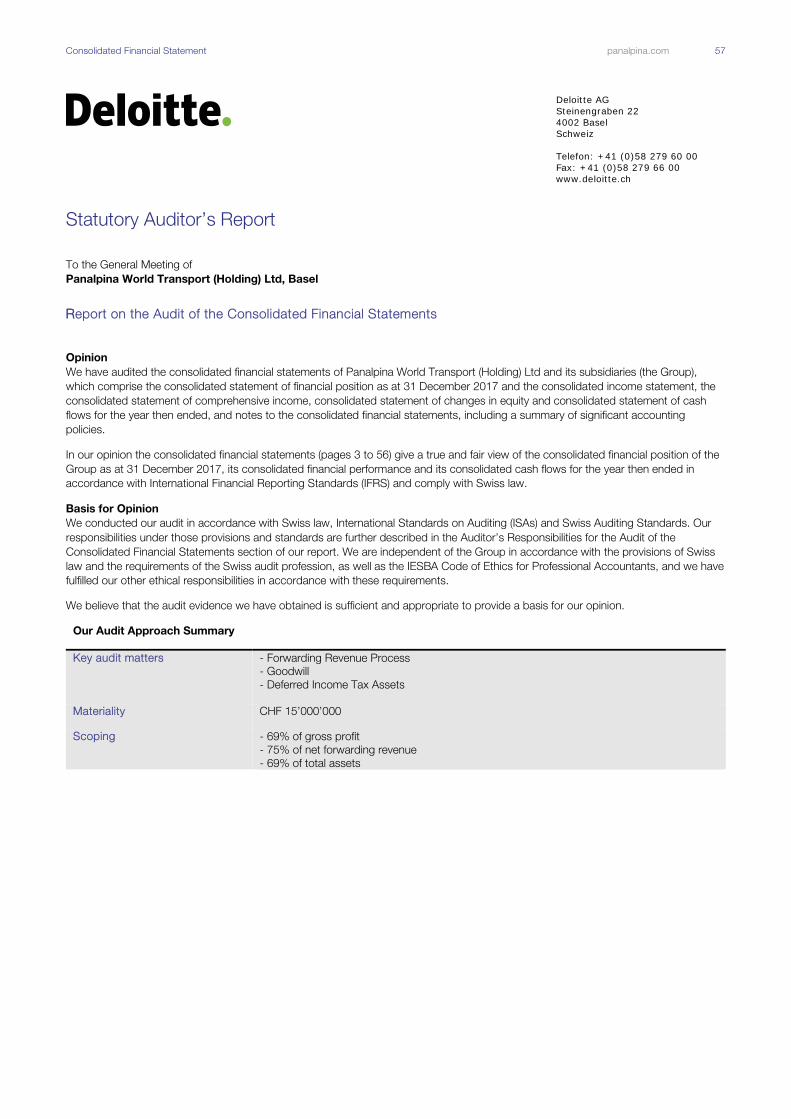
Consolidated Financial Statement panalpina.com 57
Statutory Auditor’s Report
To the General Meeting of
Panalpina World Transport (Holding) Ltd, Basel
RReport on the Audit of the Consolidated Financial Statements
Opinion
We have audited the consolidated financial statements of Panalpina World Transport (Holding) Ltd and its subsidiaries (the Group),
which comprise the consolidated statement of financial position as at 31 December 2017 and the consolidated income statement, the
consolidated statement of comprehensive income, consolidated statement of changes in equity and consolidated statement of cash
flows for the year then ended, and notes to the consolidated financial statements, including a summary of significant accounting
policies.
In our opinion the consolidated financial statements (pages 3 to 56) give a true and fair view of the consolidated financial position of the
Group as at 31 December 2017, its consolidated financial performance and its consolidated cash flows for the year then ended in
accordance with International Financial Reporting Standards (IFRS) and comply with Swiss law.
Basis for Opinion
We conducted our audit in accordance with Swiss law, International Standards on Auditing (ISAs) and Swiss Auditing Standards. Our
responsibilities under those provisions and standards are further described in the Auditor’s Responsibilities for the Audit of the
Consolidated Financial Statements section of our report. We are independent of the Group in accordance with the provisions of Swiss
law and the requirements of the Swiss audit profession, as well as the IESBA Code of Ethics for Professional Accountants, and we have
fulfilled our other ethical responsibilities in accordance with these requirements.
We believe that the audit evidence we have obtained is sufficient and appropriate to provide a basis for our opinion.
Our Audit Approach Summary
Key audit matters - Forwarding Revenue Process
- Goodwill
- Deferred Income Tax Assets
Materiality CHF 15’000’000
Scoping - 69% of gross profit
- 75% of net forwarding revenue
- 69% of total assets
Deloitte AGSteinengraben 224002 BaselSchweiz
Telefon: +41 (0)58 279 60 00Fax: +41 (0)58 279 66 00www.deloitte.ch

Consolidated Financial Statement panalpina.com 58
Report on Key Audit Matters based on the circular 1/2015 of the Federal Audit Oversight Authority
Key audit matters are those matters that, in our professional judgment, were of most significance in our audit of the consolidated
financial statements of the current period. These matters were addressed in the context of our audit of the consolidated financial
statements as a whole, and in forming our opinion thereon, and we do not provide a separate opinion on these matters.
Forwarding revenue process (revenue and cost recognition)
KKey audit matter HHow the scope of our audit responded to the key audit
mmatter
The forwarding revenue process is defined by the major revenue
stream which comprises the proceeds received from customers
for the performance of forwarding services included in net
forwarding revenues, trade receivables and unbilled forwarding
services. Forwarding services from third parties include the
corresponding direct services costs, trade payables and related
accrued cost of services.
The Group recognizes net forwarding revenue and the costs of
the respective forwarding services from third parties at the time
the services are performed, resulting in a gross profit. At reporting
date, management judgement is required in estimating the timing
and amount of revenue as well as costs for services performed,
whenever third party suppliers have not yet confirmed the final
costs.
At 31 December 2017 unbilled forwarding services in the amount
of CHF 93.5 million and accrued cost of services in the amount of
CHF 304.7 million are recorded.
Our focus on this area is due to the fact that the determination of
revenue and costs at year-end as well as the date at which
revenue is recognized, require a high level of management’s
judgement and estimation.
The accounting policy applied by the Group is explained in the
notes to the consolidated financial statements in the sections 3.5,
3.6, 3.15.5, 3.16 and 4.1.1. Further details on revenue, related
costs and receivables are disclosed in notes 5 and 19 to the
consolidated financial statements.
We have assessed the appropriateness of the Group’s
accounting policy for revenue recognition and related accrual
accounts in terms of the applicable accounting standards.
An understanding of the forwarding process has been
obtained, the design and implementation of the related internal
controls was assessed and the relevant controls have been
tested for operating effectiveness. Substantive testing has
been performed to cover the identified risks.
During our audit we also considered the IT environment and
automated controls involved.
We challenged the appropriateness of the assumptions made
by management in relation to the determination of the
estimated revenue and costs, among others, by a comparison
of historical margins and by considering the historical accuracy
of management’s estimates.
We assessed the appropriateness of the assumptions in
relation to the revenue recognition date by challenging
transactions which took place before and after the balance
sheet date, to evaluate whether revenue was recognized in the
correct period. We did this by agreeing forwarding files to
underlying documentation on a sample basis.
In addition, we considered the appropriateness of the related
disclosures in the consolidated financial statements.
Goodwill
Key audit matter How the scope of our audit responded to the key audit
matter
At 31 December 2017, the Group discloses goodwill arising from
acquisitions for an amount of CHF 59.7 million.
Goodwill is tested for impairment at least once annually. If there
are any indicators of possible impairment, such impairment testing
is performed more frequently.
Impairment testing uses future cash flow projections covering a
five-year period which is based on financial budgets approved by
management. Management determined budgeted growth rates
based on past performance and its expectations of markets
development. Cash flows beyond the five-year period are
extrapolated using estimated terminal growth rates.
Our audit is focused on key judgmental areas involved in
management’s assessment of the future performance, the
definition of assumptions included in the impairment model, the
discount and growth rates applied to assess the recoverability of
the goodwill.
The accounting policy applied by the Group is explained in the
notes to the consolidated financial statements in the sections
3.13.1 and 4.2.1. Further details on goodwill are disclosed in note
14 to the consolidated financial statements.
We assessed the impairment models used by the group,
including the key assumptions applied for their computation.
We evaluated the design and tested the implementation of the
relevant controls around the impairment tests performed on
goodwill.
We challenged the appropriateness of the future cash flows
and growth rates used in the models for the different CGUs, by
analysing the developments against historical results and by
corroborative inquiries with key management on the major
underlying factors used in the projections. We further
considered the forecasted developments in the projections
against macroeconomic and sector specific market
expectations.
We have involved internal valuation specialists to assist us in
reviewing the valuation models (validity of the model,
completeness and mathematical accuracy) and validating the
discount rates applied to ensure compliance with IAS 36
“Impairment of Assets”.
We assessed management’s sensitivity analysis on changes in
key assumptions and considered the appropriateness of the
related disclosures in the consolidated financial statements.

Consolidated Financial Statement panalpina.com 59
Deferred income tax assets
KKey audit matter HHow the scope of our audit responded to the key audit
mmatter
Deferred income tax assets of CHF 63.2 million have been
recognized by the Group as per 31 December 2017.
Deferred income tax assets relate to unused incurred tax losses
and other deductible temporary differences. The Group records
deferred income tax assets for unused tax losses to the extent
that it is probable that future taxable profit will be available against
which the tax losses can be utilized.
We consider the recognition of deferred tax assets in respect of
these tax losses and other deductible temporary differences as a
significant risk as it requires significant management judgement,
which involves inherent uncertainty in forecasting timing and level
of future taxable profits and the ability of the Group to offset its
accumulated tax losses against these estimated profits.
The accounting policy applied by the Group is explained in the
notes to the consolidated financial statements in the section 3.10,
4.2.4. Further details on deferred taxes are disclosed in note 26 to
the consolidated financial statements.
We have challenged the reasonableness of the profit forecasts
upon which the planned loss utilisation is based by comparing
projected business performances with actual results and
investigated on any significant assumptions with an impact on
future profits.
We have evaluated the design and tested the implementation
of the relevant controls in connection with the recognition and
valuation of the deferred tax assets.
Additionally, we have involved tax experts in the evaluation of
the model used to recognise deferred tax assets and the tax
rates applied. We have tested the existence of the local tax
losses carried forward and benchmarked the assumptions
used with other areas of our audit, including cash flow
forecasts, business plans and our understanding of the
performance of the Group and individual components.
We have also evaluated the appropriateness of the disclosures
relating to deferred income tax assets in the consolidated
financial statements.
Our application of materiality
We define materiality as the magnitude of misstatement in the financial statements that makes it probable that the economic decisions
of a reasonably knowledgeable person would be changed or influenced. We use materiality both in planning the scope of our audit work
and in evaluating the results of our work.
We determined materiality for the group to be CHF 15’000’000, which is around 1% of the gross profit, and below 2.5% of equity.
We agreed with the Audit Risk & Compliance Committee that we report to the Committee all audit differences in excess of CHF
300’000, as well as differences below that threshold that, in our view, warranted reporting on qualitative grounds. We also report to the
Audit Risk & Compliance Committee on disclosure matters that we identified when assessing the overall presentation of the financial
statements.
An overview of the scope of our audit
Our group audit was scoped by obtaining an understanding of the group and its environment, including group-wide controls, and
assessing the risks of material misstatement at group level. Based on this assessment, we focused our group audit scope primarily on
the audit work at 19 key locations. 17 of these were subject to a full audit, whilst the remaining 2 were subject to an audit of specified
account balances where the extent of our testing was based on our assessment of the risks of material misstatement and of the
materiality of the group’s operations at those locations. These 19 locations represent the principal business units and account for 69%
of the group’s gross profit, 75% of the group’s net forwarding revenue and 69% of the group’s total assets. They were also selected to
provide an appropriate basis for undertaking audit work to address the risks of material misstatement identified above. Our audit work
at the 19 locations was executed at levels of materiality applicable to each individual entity which were lower than group materiality and
ranged from CHF 7’500’000 to CHF 9’750’000.
At the parent entity level we also tested the consolidation process and carried out analytical procedures to confirm our conclusion that
there were no significant risks of material misstatement of the aggregated financial information of the remaining components not subject
to audit or audit of specified account balances.
Other Information in the Annual Report
The Board of Directors is responsible for the other information in the annual report. The other information comprises all information
included in the annual report, but does not include the consolidated financial statements, the stand-alone financial statements of the
Company, the remuneration report and our auditor’s reports thereon. The other information in the annual report is expected to be made
available to us after the date of this auditor’s report.
Our opinion on the consolidated financial statements does not cover the other information in the annual report and we do not express
any form of assurance conclusion thereon.
In connection with our audit of the consolidated financial statements, our responsibility is to read the other information in the annual
report and, in doing so, consider whether the other information is materially inconsistent with the consolidated financial statements or
our knowledge obtained in the audit, or otherwise appears to be materially misstated.
Consolidated Financial Statement panalpina.com 60
Responsibility of the Board of Directors for the Consolidated Financial Statements
The Board of Directors is responsible for the preparation of the consolidated financial statements that give a true and fair view in
accordance with IFRS and the provisions of Swiss law, and for such internal control as the Board of Directors determines is necessary
to enable the preparation of consolidated financial statements that are free from material misstatement, whether due to fraud or error.
In preparing the consolidated financial statements, the Board of Directors is responsible for assessing the Group’s ability to continue as
a going concern, disclosing, as applicable, matters related to going concern and using the going concern basis of accounting unless
the Board of Directors either intends to liquidate the Group or to cease operations, or has no realistic alternative but to do so.
Auditor’s Responsibilities for the Audit of the Consolidated Financial Statements
Our objectives are to obtain reasonable assurance about whether the consolidated financial statements as a whole are free from
material misstatement, whether due to fraud or error, and to issue an auditor’s report that includes our opinion. Reasonable assurance
is a high level of assurance, but is not a guarantee that an audit conducted in accordance with Swiss law, ISAs and Swiss Auditing
Standards will always detect a material misstatement when it exists. Misstatements can arise from fraud or error and are considered
material if, individually or in the aggregate, they could reasonably be expected to influence the economic decisions of users taken on the
basis of these consolidated financial statements.
A further description of our responsibilities for the audit of the consolidated financial statements is located at the website of
EXPERTsuisse: http://expertsuisse.ch/en/audit-report-for-public-companies. This description forms part of our auditor’s report.
Other matter
The consolidated financial statements of the Company for the year ended on 31 December 2016 were audited by another auditor
whose report, dated on 23 February 2017, expressed an unqualified opinion on those financial statements.
Report on Other Legal and Regulatory Requirements
In accordance with article 728a paragraph 1 item 3 CO and Swiss Auditing Standard 890, we confirm that an internal control system
exists, which has been designed for the preparation of consolidated financial statements according to the instructions of the Board of
Directors.
We recommend that the consolidated financial statements submitted to you be approved.
Deloitte AG
Fabien Lussu Robert Renz
Licensed Audit Expert Licensed Audit Expert
Auditor in Charge
Basel, 2 March 2018

Consolidated Financial Statement panalpina.com 61
Key figures in CHF Five-year review
In million CHF 2017 2016 2015 2014 2013
Forwarding services 6,532 6,321 7,129 8,172 8,175
Change in % 3.32 (11.33) (12.77) (0.03) 1.35
Net forwarding revenue 5,533 5,196 5,855 6,707 6,758
Change in % 6.48 (11.26) (12.70) (0.75) 2.13
Gross profit 1,398 1,425 1,474 1,586 1,561
Change in % (1.88) (3.34) (7.07) 1.60 6.55
in % of net revenue 25.26 27.42 25.17 23.65 23.10
Profit 57.5 52.3 88.2 86.5 11.7
Change in % 9.89 (40.73) 1.97 639.50 (116.30)
in % of gross profit 4.11 3.67 5.99 5.46 0.75
Operating result before depreciation and amortization (EBITDA) 146.2 131.7 168.3 174.0 119.8
Change in % 11.04 (21.79) (3.26) 45.26 250.29
in % of gross profit 10.46 9.24 11.42 10.97 7.67
Operating result before amortization (EBITA) 124.9 105.9 140.5 142.1 85.5
Change in % 17.96 (24.62) (1.12) 66.15 2,658.06
in % of gross profit 8.94 7.43 9.53 8.96 5.48
Operating result (EBIT) 103.3 82.0 117.2 116.7 48.0
Change in % 26.06 (30.09) 0.44 143.19 (221.21)
in % of gross profit 7.39 5.75 7.95 7.36 3.07
Cash generated from operations 105.6 150.1 187.4 152.9 73.8
Change in % (29.66) (19.87) 22.54 107.19 (286.36)
in % of gross profit 7.56 10.54 12.71 9.64 4.73
Net cash from operating activities 67.3 110.8 151.7 123.0 42.5
Change in % (39.22) (26.98) 23.27 189.48 (159.44)
in % of gross profit 4.82 7.77 10.29 7.76 2.72
Free cash flow (0.8) 86.6 142.8 87.0 (5.5)
Change in % (100.96) (39.34) 64.08 (1,681.84) (93.28)
in % of gross profit (0.06) 6.08 9.69 5.49 (0.35)
Net (operational) working capital 1 300.4 256.3 285.0 384.8 389.1
Change in % 17.19 (10.07) (25.94) (1.10) 13.44
1 Net (operational) working capital includes movements on Trade receivables, Unbilled forwarding services, Trade payable and Accrued costs of services.
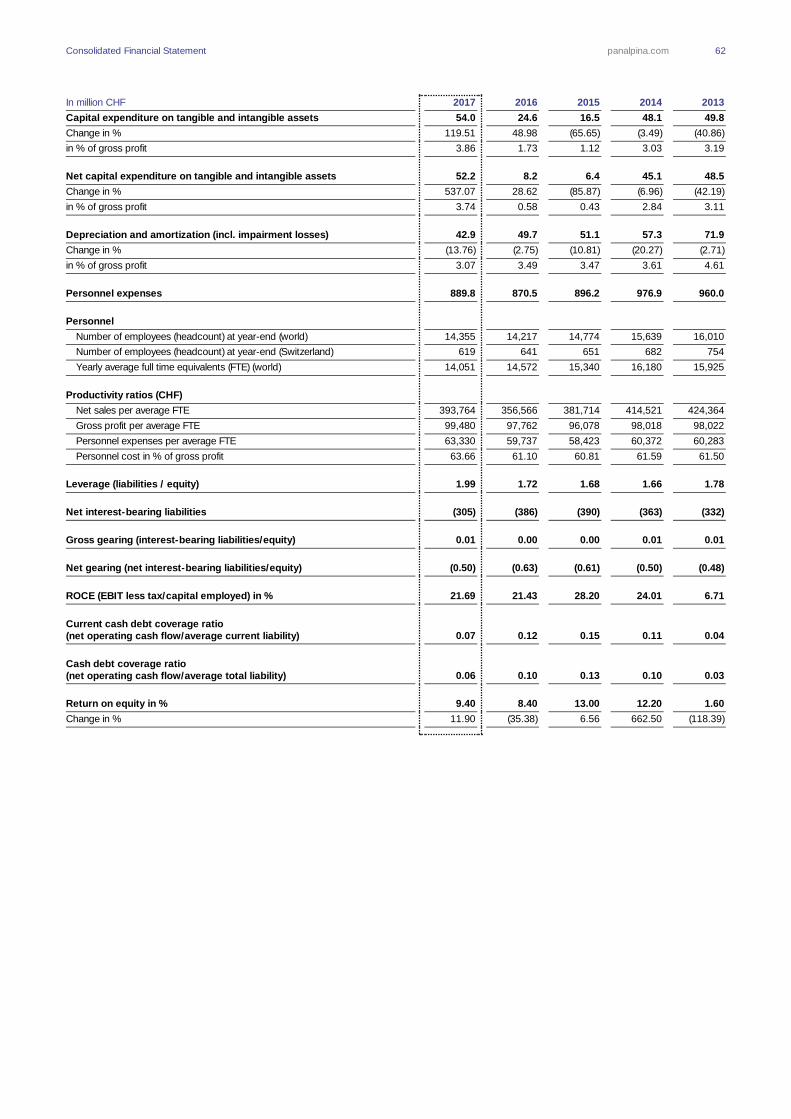
Consolidated Financial Statement panalpina.com 62
In million CHF 2017 2016 2015 2014 2013
Capital expenditure on tangible and intangible assets 54.0 24.6 16.5 48.1 49.8
Change in % 119.51 48.98 (65.65) (3.49) (40.86)
in % of gross profit 3.86 1.73 1.12 3.03 3.19
Net capital expenditure on tangible and intangible assets 52.2 8.2 6.4 45.1 48.5
Change in % 537.07 28.62 (85.87) (6.96) (42.19)
in % of gross profit 3.74 0.58 0.43 2.84 3.11
Depreciation and amortization (incl. impairment losses) 42.9 49.7 51.1 57.3 71.9
Change in % (13.76) (2.75) (10.81) (20.27) (2.71)
in % of gross profit 3.07 3.49 3.47 3.61 4.61
Personnel expenses 889.8 870.5 896.2 976.9 960.0
Personnel
Number of employees (headcount) at year-end (world) 14,355 14,217 14,774 15,639 16,010
Number of employees (headcount) at year-end (Switzerland) 619 641 651 682 754
Yearly average full time equivalents (FTE) (world) 14,051 14,572 15,340 16,180 15,925
Productivity ratios (CHF)
Net sales per average FTE 393,764 356,566 381,714 414,521 424,364
Gross profit per average FTE 99,480 97,762 96,078 98,018 98,022
Personnel expenses per average FTE 63,330 59,737 58,423 60,372 60,283
Personnel cost in % of gross profit 63.66 61.10 60.81 61.59 61.50
Leverage (liabilities / equity) 1.99 1.72 1.68 1.66 1.78
Net interest-bearing liabilities (305) (386) (390) (363) (332)
Gross gearing (interest-bearing liabilities/equity) 0.01 0.00 0.00 0.01 0.01
Net gearing (net interest-bearing liabilities/equity) (0.50) (0.63) (0.61) (0.50) (0.48)
ROCE (EBIT less tax/capital employed) in % 21.69 21.43 28.20 24.01 6.71
Current cash debt coverage ratio (net operating cash flow/average current liability) 0.07 0.12 0.15 0.11 0.04
Cash debt coverage ratio (net operating cash flow/average total liability) 0.06 0.10 0.13 0.10 0.03
Return on equity in % 9.40 8.40 13.00 12.20 1.60
Change in % 11.90 (35.38) 6.56 662.50 (118.39)

Consolidated Financial Statement panalpina.com 63
Consolidated statement of financial
position in CHF Five-year review
In million CHF 2017 2016 2015 2014 2013
ASSETS 1,839 1,661 1,728 1,930 1,949
Change in % 10.75 (3.89) (10.46) (0.99) (0.41)
Non-current assets 299 261 275 329 351
Change in % 14.77 (5.16) (16.61) (6.15) (3.04)
Property, plant and equipment 97 64 78 104 119
Change in % 52.28 (19.04) (24.76) (12.37) (8.46)
Financial and deferred tax assets 114 99 97 103 114
Change in % 14.91 1.69 (5.52) (9.57) 16.33
Intangible assets 88 98 99 122 118
Change in % (9.70) (0.88) (19.02) 3.41 (11.94)
Current assets 1,540 1,400 1,453 1,600 1,598
Change in % 10.00 (3.65) (9.20) 0.15 0.19
Liquid funds 311 389 392 372 337
Change in % (20.04) (0.89) 5.43 10.40 (14.25)
Receivables and other current assets 1,229 1,011 1,061 1,228 1,261
Change in % 21.55 (4.67) (13.63) (2.59) 4.91
LIABILITIES AND EQUITY 1,839 1,661 1,728 1,930 1,949
Change in % 10.75 (3.89) (10.46) (0.99) (0.42)
Equity 614 608 641 721 697
Change in % 1.03 (5.18) (11.05) 3.43 (5.04)
Share capital 2 2 2 2 2
Change in % 0.00 0.00 0.00 0.00 0.00
Treasury shares (2) (4) (2) (2) (3)
Change in % (61.65) 77.05 7.80 (30.37) (70.00)
Translation reserves (269) (287) (278) (187) (188)
Change in % (6.26) 3.09 49.02 (0.72) 13.94
Retained earnings and other reserves 876 896 919 907 886
Change in % (2.28) (2.49) 1.33 2.40 (2.32)
Non-controlling interests 6 9 12 12 12
Liabilities 1,225 1,044 1,074 1,197 1,240
Change in % 17.36 (2.87) (10.20) (3.50) 2.14
Payables, accruals and deferred income 1,036 861 911 991 1,002
Change in % 20.30 (5.46) (8.08) (1.08) (1.09)
Borrowings and other financial liabilities 7 7 3 9 5
Change in % 7.31 142.55 (68.67) 72.80 66.67
Provisions and other liabilities 181 176 161 197 233
Change in % 3.30 9.34 (18.35) (15.57) 17.68
Annual Financial Statements panalpina.com 64
Annual financial statements Panalpina World Transport (Holding) Ltd., Basel
CONTENTS
Income Statement 65
Balance Sheet 66
Notes to the Financial Statements 67
Appropriation of Available Earnings 71
Report of the Statutory Auditor 72
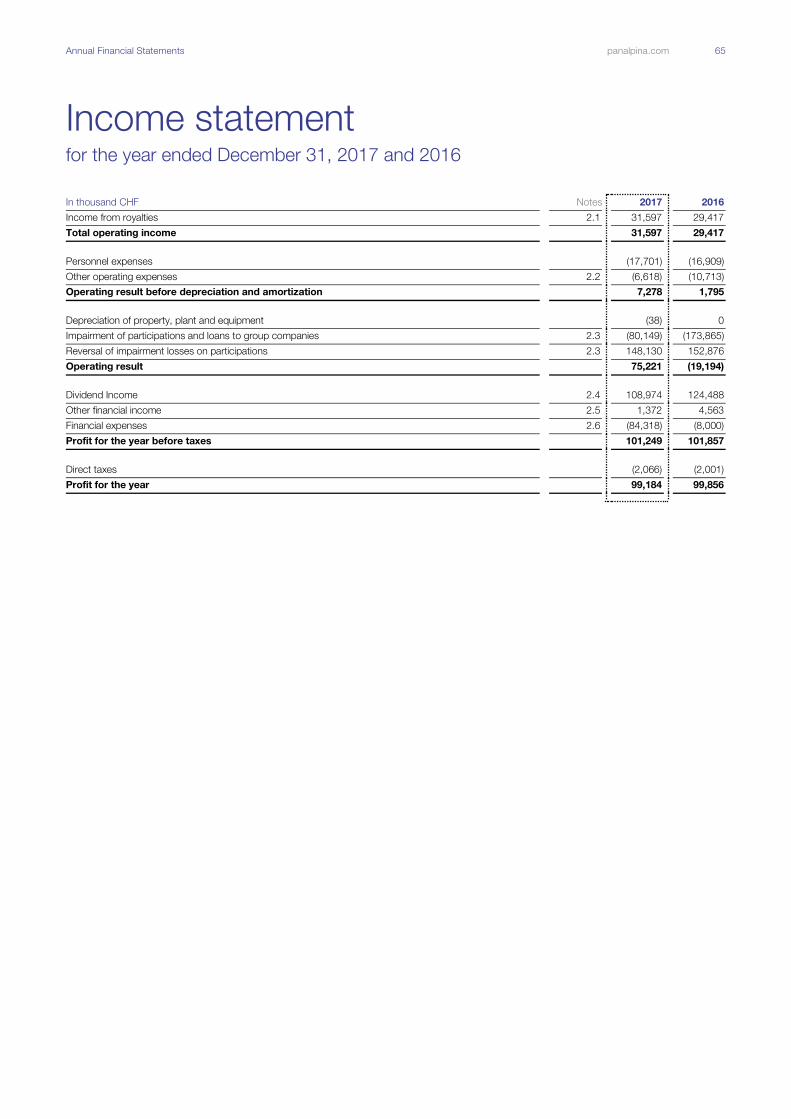
Annual Financial Statements panalpina.com 65
Income statement for the year ended December 31, 2017 and 2016
In thousand CHF Notes 2017 2016
Income from royalties 2.1 31,597 29,417
Total operating income 31,597 29,417
Personnel expenses (17,701) (16,909)
Other operating expenses 2.2 (6,618) (10,713)
Operating result before depreciation and amortization 7,278 1,795
Depreciation of property, plant and equipment (38) 0
Impairment of participations and loans to group companies 2.3 (80,149) (173,865)
Reversal of impairment losses on participations 2.3 148,130 152,876
Operating result 75,221 (19,194)
Dividend Income 2.4 108,974 124,488
Other financial income 2.5 1,372 4,563
Financial expenses 2.6 (84,318) (8,000)
Profit for the year before taxes 101,249 101,857
Direct taxes (2,066) (2,001)
Profit for the year 99,184 99,856

Annual Financial Statements panalpina.com 66
Balance sheet as of December 31, 2017 and 2016
In thousand CHF Notes 2017 2016
Assets
Cash and cash equivalents 1,610 39,813
Receivables from services
From group companies 17 1,865
Cash pool receivables from group companies 2.10 21,644 0
Other short-term receivables
From third parties 162 122
From group companies 301 5,421
Prepaid expenses and accrued income 2.7 8,748 31,032
Total current assets 32,483 78,253
Financial assets
Long-term loans to group companies and other long-term financial assets 2.8 162,335 170,075
Participations 2.9 796,342 660,195
Property, plant and equipment 78 0
Total fixed assets 958,756 830,270
Total assets 991,238 908,523
Liabilities
Liabilities from goods and services
Due to third parties 0 28
Due to group companies 224 100
Cash pool liabilities due to group companies 2.10 0 18,597
Short-term interest bearing liabilities
Due to group companies 32,700 30,500
Other short-term liabilities
Due to third parties 1,182 894
Due to related parties (Personalvorsorgestiftung der PWT) 152 106
Accrued liabilities and accrued expenses 2.11 4,390 5,132
Total current liabilities 38,649 55,357
Long-term interest bearing liabilities
Due to group companies 0 70
Other long-term liabilities
Due to third parties 0 754
Long-term provisions 2.12 97,933 10,268
Total non-current liabilities 97,933 11,092
Total liabilities 136,582 66,449
Equity
Share capital 3.3 2,375 2,375
Legal retained earnings
General legal retained earnings 475 475
Free reserves 264,268 264,268
Available earnings
Profit brought forward 489,886 479,087
Profit for the year 99,184 99,856
Treasury shares 2.13 (1,531) (3,987)
Total equity 854,657 842,074
Total liabilities and equity 991,238 908,523
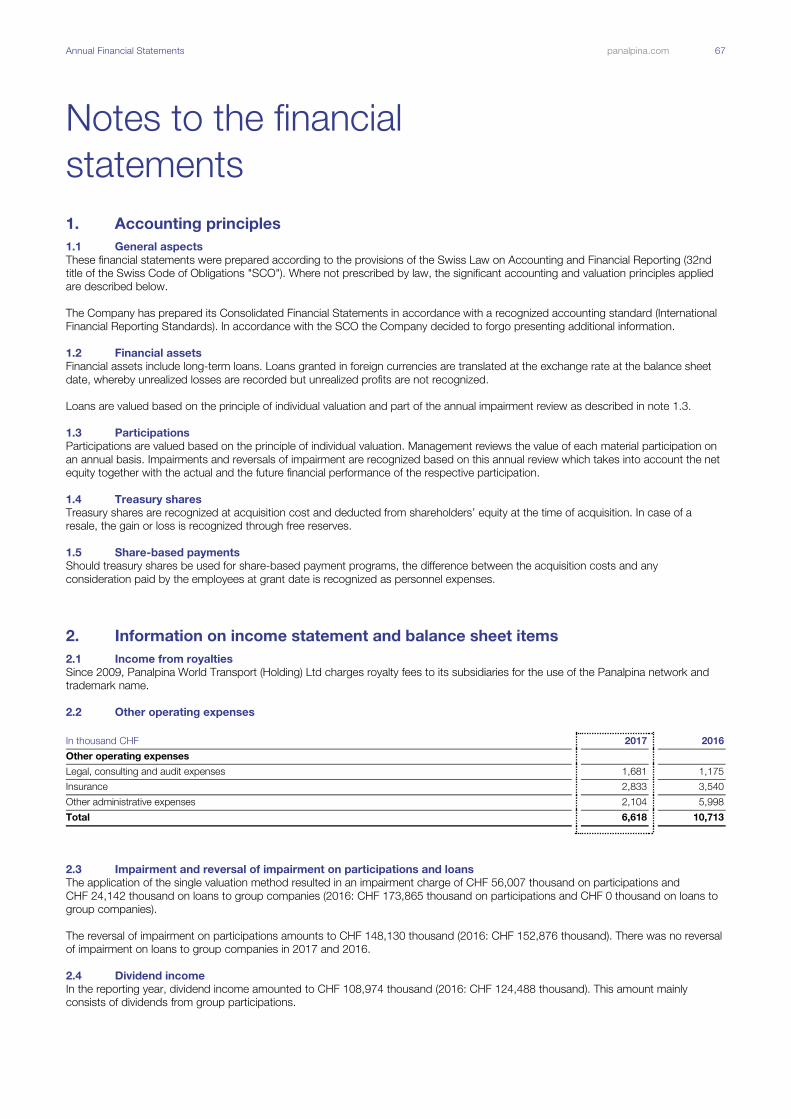
Annual Financial Statements panalpina.com 67
Notes to the financial
statements
1. Accounting principles
1.1 General aspects
These financial statements were prepared according to the provisions of the Swiss Law on Accounting and Financial Reporting (32nd
title of the Swiss Code of Obligations "SCO"). Where not prescribed by law, the significant accounting and valuation principles applied
are described below.
The Company has prepared its Consolidated Financial Statements in accordance with a recognized accounting standard (International
Financial Reporting Standards). In accordance with the SCO the Company decided to forgo presenting additional information.
1.2 Financial assets
Financial assets include long-term loans. Loans granted in foreign currencies are translated at the exchange rate at the balance sheet
date, whereby unrealized losses are recorded but unrealized profits are not recognized.
Loans are valued based on the principle of individual valuation and part of the annual impairment review as described in note 1.3.
1.3 Participations
Participations are valued based on the principle of individual valuation. Management reviews the value of each material participation on
an annual basis. Impairments and reversals of impairment are recognized based on this annual review which takes into account the net
equity together with the actual and the future financial performance of the respective participation.
1.4 Treasury shares
Treasury shares are recognized at acquisition cost and deducted from shareholders’ equity at the time of acquisition. In case of a
resale, the gain or loss is recognized through free reserves.
1.5 Share-based payments
Should treasury shares be used for share-based payment programs, the difference between the acquisition costs and any
consideration paid by the employees at grant date is recognized as personnel expenses.
2. Information on income statement and balance sheet items
2.1 Income from royalties
Since 2009, Panalpina World Transport (Holding) Ltd charges royalty fees to its subsidiaries for the use of the Panalpina network and
trademark name.
2.2 Other operating expenses
In thousand CHF 2017 2016
Other operating expenses
Legal, consulting and audit expenses 1,681 1,175
Insurance 2,833 3,540
Other administrative expenses 2,104 5,998
Total 6,618 10,713
2.3 Impairment and reversal of impairment on participations and loans
The application of the single valuation method resulted in an impairment charge of CHF 56,007 thousand on participations and
CHF 24,142 thousand on loans to group companies (2016: CHF 173,865 thousand on participations and CHF 0 thousand on loans to
group companies).
The reversal of impairment on participations amounts to CHF 148,130 thousand (2016: CHF 152,876 thousand). There was no reversal
of impairment on loans to group companies in 2017 and 2016.
2.4 Dividend income
In the reporting year, dividend income amounted to CHF 108,974 thousand (2016: CHF 124,488 thousand). This amount mainly
consists of dividends from group participations.
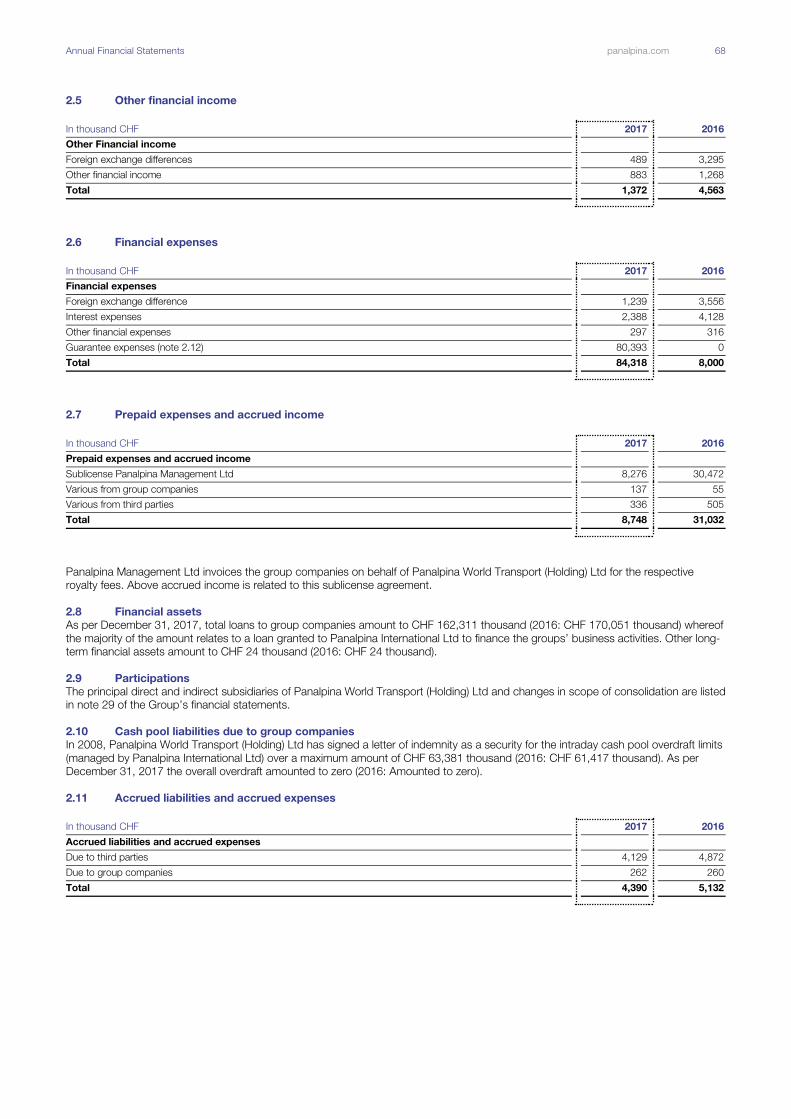
Annual Financial Statements panalpina.com 68
2.5 Other financial income
In thousand CHF 2017 2016
Other Financial income
Foreign exchange differences 489 3,295
Other financial income 883 1,268
Total 1,372 4,563
2.6 Financial expenses
In thousand CHF 2017 2016
Financial expenses
Foreign exchange difference 1,239 3,556
Interest expenses 2,388 4,128
Other financial expenses 297 316
Guarantee expenses (note 2.12) 80,393 0
Total 84,318 8,000
2.7 Prepaid expenses and accrued income
In thousand CHF 2017 2016
Prepaid expenses and accrued income
Sublicense Panalpina Management Ltd 8,276 30,472
Various from group companies 137 55
Various from third parties 336 505
Total 8,748 31,032
Panalpina Management Ltd invoices the group companies on behalf of Panalpina World Transport (Holding) Ltd for the respective
royalty fees. Above accrued income is related to this sublicense agreement.
2.8 Financial assets
As per December 31, 2017, total loans to group companies amount to CHF 162,311 thousand (2016: CHF 170,051 thousand) whereof
the majority of the amount relates to a loan granted to Panalpina International Ltd to finance the groups’ business activities. Other long-
term financial assets amount to CHF 24 thousand (2016: CHF 24 thousand).
2.9 Participations
The principal direct and indirect subsidiaries of Panalpina World Transport (Holding) Ltd and changes in scope of consolidation are listed
in note 29 of the Group’s financial statements.
2.10 Cash pool liabilities due to group companies
In 2008, Panalpina World Transport (Holding) Ltd has signed a letter of indemnity as a security for the intraday cash pool overdraft limits
(managed by Panalpina International Ltd) over a maximum amount of CHF 63,381 thousand (2016: CHF 61,417 thousand). As per
December 31, 2017 the overall overdraft amounted to zero (2016: Amounted to zero).
2.11 Accrued liabilities and accrued expenses
In thousand CHF 2017 2016
Accrued liabilities and accrued expenses
Due to third parties 4,129 4,872
Due to group companies 262 260
Total 4,390 5,132
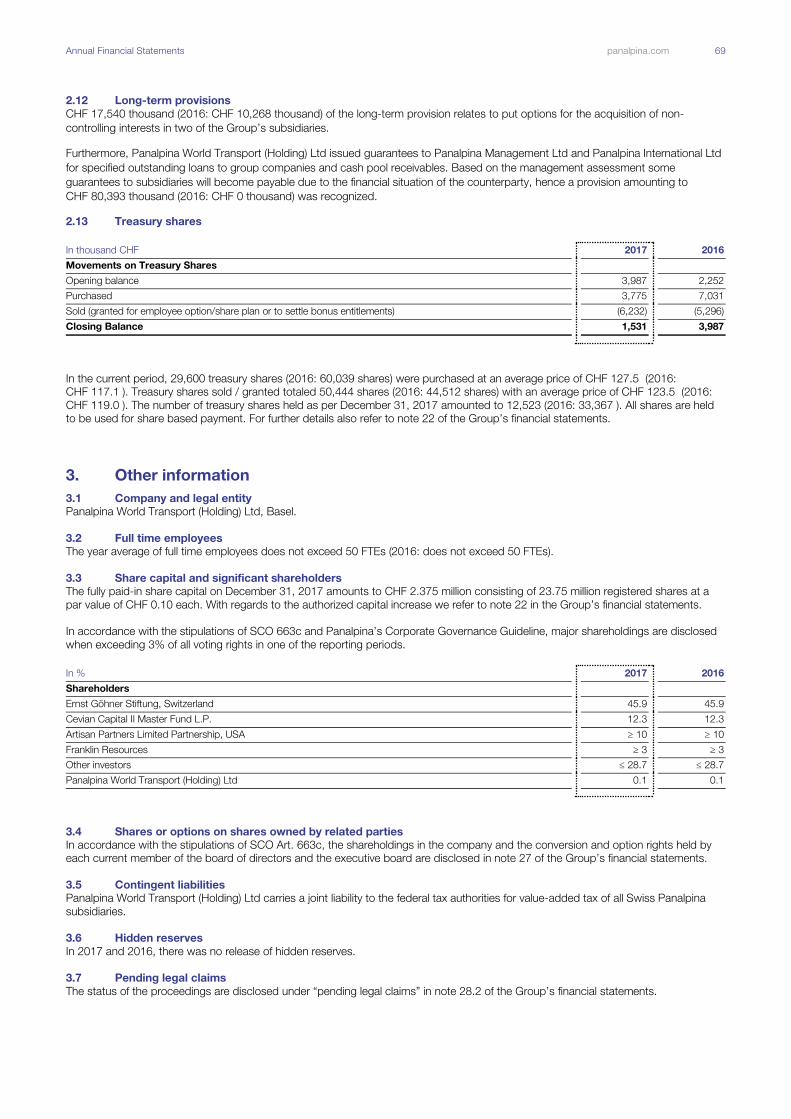
Annual Financial Statements panalpina.com 69
2.12 Long-term provisions
CHF 17,540 thousand (2016: CHF 10,268 thousand) of the long-term provision relates to put options for the acquisition of non-
controlling interests in two of the Group’s subsidiaries.
Furthermore, Panalpina World Transport (Holding) Ltd issued guarantees to Panalpina Management Ltd and Panalpina International Ltd
for specified outstanding loans to group companies and cash pool receivables. Based on the management assessment some
guarantees to subsidiaries will become payable due to the financial situation of the counterparty, hence a provision amounting to
CHF 80,393 thousand (2016: CHF 0 thousand) was recognized.
2.13 Treasury shares
In thousand CHF 2017 2016
Movements on Treasury Shares
Opening balance 3,987 2,252
Purchased 3,775 7,031
Sold (granted for employee option/share plan or to settle bonus entitlements) (6,232) (5,296)
Closing Balance 1,531 3,987
In the current period, 29,600 treasury shares (2016: 60,039 shares) were purchased at an average price of CHF 127.5 (2016:
CHF 117.1 ). Treasury shares sold / granted totaled 50,444 shares (2016: 44,512 shares) with an average price of CHF 123.5 (2016:
CHF 119.0 ). The number of treasury shares held as per December 31, 2017 amounted to 12,523 (2016: 33,367 ). All shares are held
to be used for share based payment. For further details also refer to note 22 of the Group’s financial statements.
3. Other information
3.1 Company and legal entity
Panalpina World Transport (Holding) Ltd, Basel.
3.2 Full time employees
The year average of full time employees does not exceed 50 FTEs (2016: does not exceed 50 FTEs).
3.3 Share capital and significant shareholders
The fully paid-in share capital on December 31, 2017 amounts to CHF 2.375 million consisting of 23.75 million registered shares at a
par value of CHF 0.10 each. With regards to the authorized capital increase we refer to note 22 in the Group’s financial statements.
In accordance with the stipulations of SCO 663c and Panalpina’s Corporate Governance Guideline, major shareholdings are disclosed
when exceeding 3% of all voting rights in one of the reporting periods.
In % 2017 2016
Shareholders
Ernst Göhner Stiftung, Switzerland 45.9 45.9
Cevian Capital II Master Fund L.P. 12.3 12.3
Artisan Partners Limited Partnership, USA ≥ 10 ≥ 10
Franklin Resources ≥ 3 ≥ 3
Other investors ≤ 28.7 ≤ 28.7
Panalpina World Transport (Holding) Ltd 0.1 0.1
3.4 Shares or options on shares owned by related parties
In accordance with the stipulations of SCO Art. 663c, the shareholdings in the company and the conversion and option rights held by
each current member of the board of directors and the executive board are disclosed in note 27 of the Group’s financial statements.
3.5 Contingent liabilities
Panalpina World Transport (Holding) Ltd carries a joint liability to the federal tax authorities for value-added tax of all Swiss Panalpina
subsidiaries.
3.6 Hidden reserves
In 2017 and 2016, there was no release of hidden reserves.
3.7 Pending legal claims
The status of the proceedings are disclosed under “pending legal claims” in note 28.2 of the Group’s financial statements.
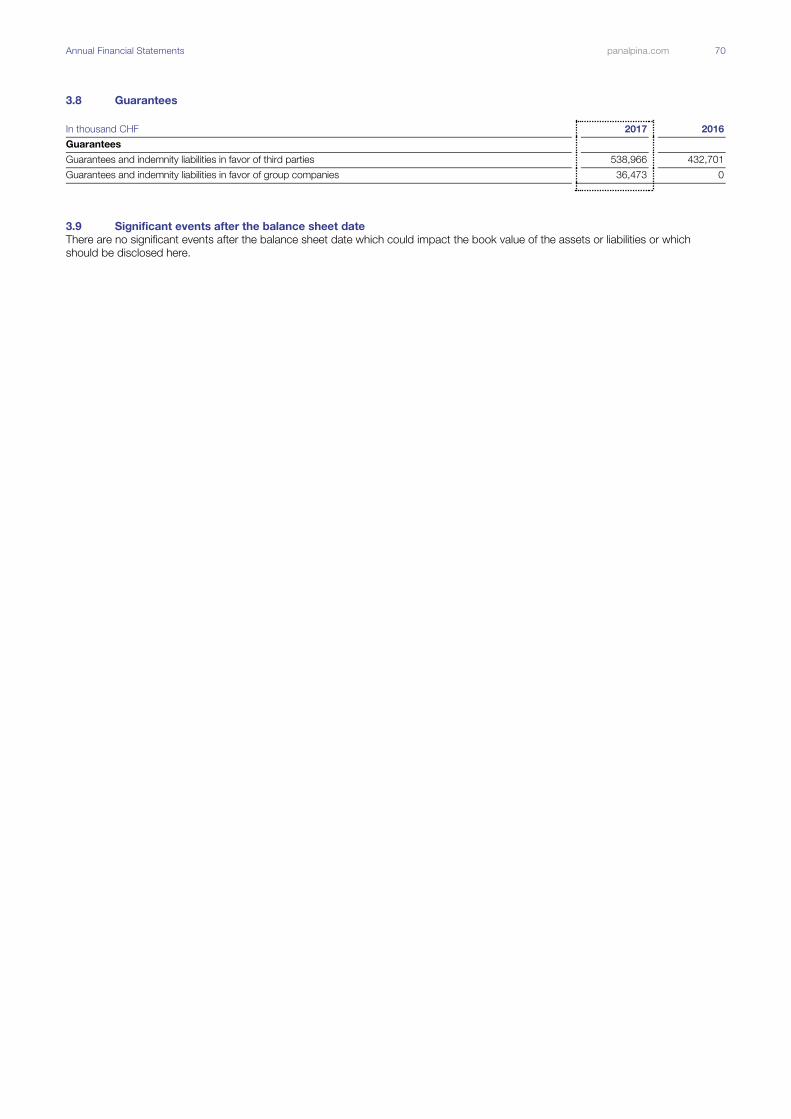
Annual Financial Statements panalpina.com 70
3.8 Guarantees
In thousand CHF 2017 2016
Guarantees
Guarantees and indemnity liabilities in favor of third parties 538,966 432,701
Guarantees and indemnity liabilities in favor of group companies 36,473 0
3.9 Significant events after the balance sheet date
There are no significant events after the balance sheet date which could impact the book value of the assets or liabilities or which
should be disclosed here.
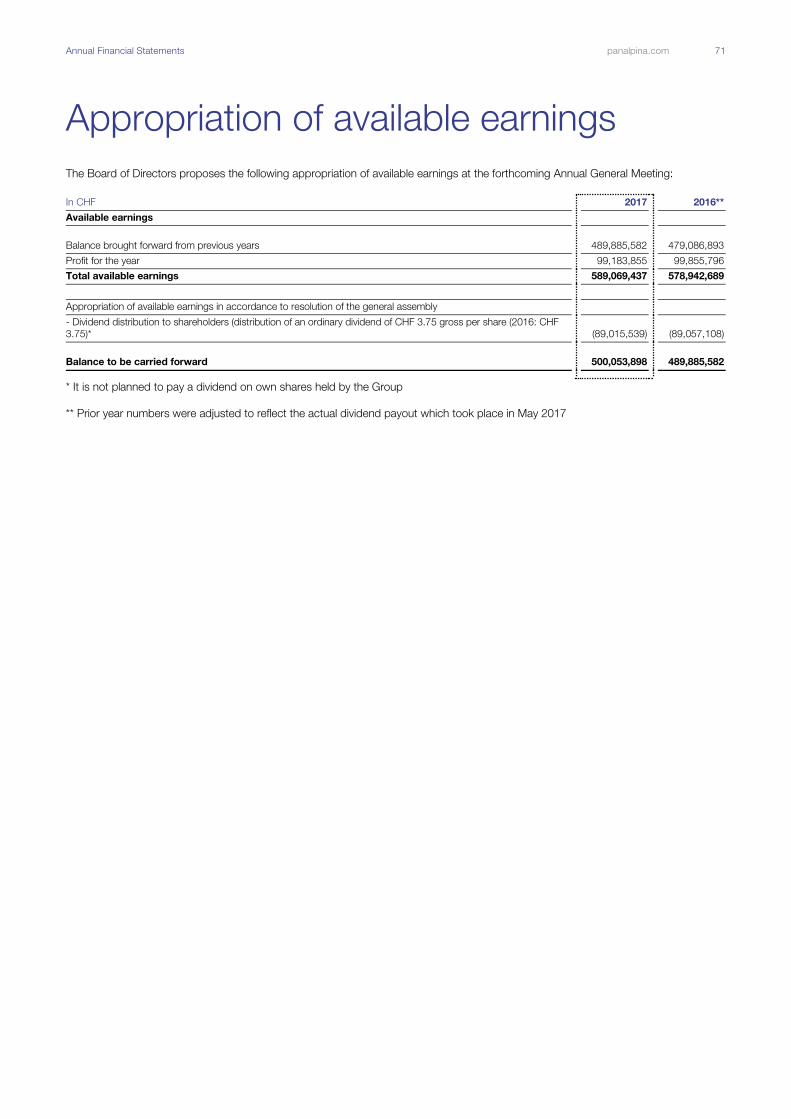
Annual Financial Statements panalpina.com 71
Appropriation of available earnings
The Board of Directors proposes the following appropriation of available earnings at the forthcoming Annual General Meeting:
In CHF 2017 2016**
Available earnings
Balance brought forward from previous years 489,885,582 479,086,893
Profit for the year 99,183,855 99,855,796
Total available earnings 589,069,437 578,942,689
Appropriation of available earnings in accordance to resolution of the general assembly
- Dividend distribution to shareholders (distribution of an ordinary dividend of CHF 3.75 gross per share (2016: CHF
3.75)* (89,015,539) (89,057,108)
Balance to be carried forward 500,053,898 489,885,582 * It is not planned to pay a dividend on own shares held by the Group
** Prior year numbers were adjusted to reflect the actual dividend payout which took place in May 2017

Annual Financial Statements panalpina.com 72
Statutory Auditor’s Report
To the General Meeting of
Panalpina World Transport (Holding) Ltd, Basel
RReport on the Audit of the Financial Statements
Opinion
We have audited the financial statements of Panalpina World Transport (Holding) Ltd, which comprise the balance sheet as at
31 December 2017 and the income statement and notes for the year then ended, including a summary of significant accounting
policies.
In our opinion the financial statements (pages 65 to 71) as at 31 December 2017 comply with Swiss law and the company’s articles of
incorporation.
Basis for Opinion
We conducted our audit in accordance with Swiss law and Swiss Auditing Standards. Our responsibilities under those provisions and
standards are further described in the Auditor’s Responsibilities for the Audit of the Financial Statements section of our report. We are
independent of the entity in accordance with the provisions of Swiss law and the requirements of the Swiss audit profession and we
have fulfilled our other ethical responsibilities in accordance with these requirements.
We believe that the audit evidence we have obtained is sufficient and appropriate to provide a basis for our opinion.
Report on Key Audit Matters based on the circular 1/2015 of the Federal Audit Oversight Authority
Key audit matters are those matters that, in our professional judgment, were of most significance in our audit of the financial statements
of the current period. These matters were addressed in the context of our audit of the financial statements as a whole, and in forming
our opinion thereon, and we do not provide a separate opinion on these matters.
Investments and Loans
Key audit matter How the scope of our audit responded to the key audit
matter
As of 31 December 2017, investments in, and loans to Group
companies represented 97% of the Company’s total assets and
amounted to CHF 958.7 million.
The valuation of the investments and loans is performed on an
individual basis in accordance with the Swiss Code of Obligations.
The recorded amounts of the investments and loans are compared
to the equity balance at valuation date as well as the capitalised
earnings or profit projections using to calculate the enterprise value.
Due to the significance of the carrying amount of the investments in,
and loans to Group companies as well as the judgement involved in
the assessment of the valuation, this matter was deemed to be a
key audit matter.
For further information on the investments and loans, please refer to
the notes 1.2, 1.3, 2.3, 2.8 and 2.9 to the financial statements.
Management uses a predefined impairment testing model to
identify the potential need for the impairment of investments
and loans.
We assessed the difference between the carrying amounts of
the investments including the loans compared to the equity
balances or enterprise values of the related entities. We
furthermore tested the assumptions used by management in
connection with the capitalized earnings and discount rate
used.
Deloitte AGSteinengraben 224002 BaselSchweiz
Telefon: +41 (0)58 279 60 00Fax: +41 (0)58 279 66 00www.deloitte.ch

Annual Financial Statements panalpina.com 73
Responsibility of the Board of Directors for the Financial Statements
The Board of Directors is responsible for the preparation of the financial statements in accordance with the provisions of Swiss law and
the company’s articles of incorporation, and for such internal control as the Board of Directors determines is necessary to enable the
preparation of financial statements that are free from material misstatement, whether due to fraud or error.
In preparing the financial statements, the Board of Directors is responsible for assessing the entity’s ability to continue as a going
concern, disclosing, as applicable, matters related to going concern and using the going concern basis of accounting unless the Board
of Directors either intends to liquidate the entity or to cease operations, or has no realistic alternative but to do so.
Auditor’s Responsibilities for the Audit of the Financial Statements
Our objectives are to obtain reasonable assurance about whether the financial statements as a whole are free from material
misstatement, whether due to fraud or error, and to issue an auditor’s report that includes our opinion. Reasonable assurance is a high
level of assurance, but is not a guarantee that an audit conducted in accordance with Swiss law and Swiss Auditing Standards will
always detect a material misstatement when it exists. Misstatements can arise from fraud or error and are considered material if,
individually or in the aggregate, they could reasonably be expected to influence the economic decisions of users taken on the basis of
these financial statements.
A further description of our responsibilities for the audit of the financial statements is located at the website of EXPERTsuisse:
http://expertsuisse.ch/en/audit-report-for-public-companies. This description forms part of our auditor’s report.
Other matter
The financial statements of the company for the year ended on 31 December 2016 were audited by another auditor whose report,
dated on 23 February 2017, expressed an unqualified opinion on those financial statements.
Report on Other Legal and Regulatory Requirements
In accordance with article 728a paragraph 1 item 3 CO and Swiss Auditing Standard 890, we confirm that an internal control system
exists, which has been designed for the preparation of financial statements according to the instructions of the Board of Directors.
We further confirm that the proposed appropriation of available earnings complies with Swiss law and the company’s articles of
incorporation. We recommend that the financial statements submitted to you be approved.
Deloitte AG
Fabien Lussu Robert Renz
Licensed Audit Expert Licensed Audit Expert
Auditor in Charge
Basel, 2 March 2018

Panalpina World
Transport (Holding) Ltd.
Viaduktstrasse 42
P.O. Box
CH-4002 Basel
Phone: +41 61 226 11 11
Fax: +41 61 226 11 01
www.panalpina.com
Publisher
Panalpina World Transport (Holding) Ltd