creating investor intelligence thinking bulbs · recovery phase, hyderabad realty sector was...
TRANSCRIPT

THINKING BULBS
ISSUE I, SEPTEMBER 2012
PROPEQUITY Creating Investor Intelligence

HYDERABAD: BACK IN RECKONING?

H2 2008 – H2 2009
The time period was characterized by pessimistic global economic scenario The Real Estate market tumbled with decline in new launches as well as absorption
All the major micro markets witnessed a decline in capital values Project execution marred by cash crunch as well as parching absorption
The City emerged as one of the prominent IT/ITeS hub of the country Area around the Hi-Tech city emerged as the new growth corridor
Peripheral areas such as Madhapur, Miyapur, Gachibowli, Kukatpally and Kondapur gained prominence from the IT/ITeS momentum
Development of New CBD ~ areas in proximity to erstwhile airport Areas such as Punjagutta, Soumajiguda, Banjara Hills, Jubilee Hills, etc gained prominence
Residential activity gained momentum in South East locations such as Dilsukhnagar, L B Nagar, etc. Spillover of demand attributable to space congestion within old city areas
2000 – H1 2008
1990 – 1999
Real estate activity predominantly concentrated in old city areas such as Abids, Musheerabad, Begumpet, Srinagar Colony, Marredpally, etc.
City characterized by low rise, high density developments with limited infrastructure PRE 1990
H2 2009 – Till Date
Political instability due to strong agitations over Telangana issue Developers wary of new launches, absorption affected by uncertainty over fate of Hyderabad
Subdued real estate activity with fewer new launches & stagnation in capital values Emergence of peripheral location such as Shamirpet, Nallagandla, Alwal, Tellapur as new residential
corridors
In the decade gone by, the Hyderabad real estate story has witnessed it all, from being the cynosure of Real Estate developers and investors to being witness to an extended lull period caused by financial and political turmoil. The city witnessed a strong growth in residential supply as well as capital values until first half year of 2008. Post the slump triggered by the global financial crisis, the city has failed to replicate the growth rate of pre 2008 years. The political turmoil on Telangana issue could not have happened at a worse time for Hyderabad real estate. While other markets entered a resurgence phase, recovery in Hyderabad realty sector was marred by political uncertainty emanating from the demand of statehood for Telangana. The period after the year 2008 has been characterized by fewer project launches and declining or at best stagnating capital values. The existing residential capital values for the city are still lower than the peak price levels of 2008. Given the presence of strong real estate drivers such as infrastructure and commercial activity in the city, the existing capital value seems lucrative primarily on account of undervaluation and affordability compared to other cities.
Is Hyderabad Real Estate story back in Reckoning?
3 Thinking Bulbs | Hyderabad: Back in Reckoning?

Over the past decade, Hyderabad has evolved from the commonly apprehended image of an under-developed tier - III city into a vibrant city with thriving business opportunity and a major center of employment. With increasing presence of human capital intensive firms/corporations such as IT/ITeS, the city witnessed huge activity in Real Estate. The city witnessed huge supply and astonishing price appreciation backed by healthy absorption. Weighted average capital values for residential Real Estate escalated from approx. INR 1,000 per sq. ft. in the year 2000 to INR 3,100 per sq. ft. by Q3 2008 exhibiting an annual appreciation of approximately 15%.
However, events of the last five years have put brakes on the growth story. Capital appreciation has given way to capital depreciation. Ebullience of the developers has made way for pessimism. The weighted average capital value has witnessed a decline from INR 3,100 per sq. ft. in Q3 2008 to INR 2,980 per sq. ft. by the end of Q1 2012 exhibiting a negative annual return of 1.4%.

1. Hyderabad Demand Supply Scenario – Residential Real Estate
Until first half of the year 2008, the real
estate activity in Hyderabad was at its
peak. Real Estate in the city was
characterized by numerous new
launches backed by positive market
sentiments and bullish developers. The
city’s real estate capital values
increased at a scorching pace till
2006-07 after which it fell sharply.
Firstly, the market boom was hit by the
economic pessimism originating from
the global financial turmoil. The time
period between H2 2008 and H1 2010
witnessed decline in launches as well
absorption and huge build-up of
inventory peaking to an average of 28
months for the entire year in 2009.
Post 2009, the inventory overhang has
stubbornly floated in the red zone. Even
in the instance of absorption
outstripping demand as in the case of
H1 2010, inventory overhang had not
dropped below 22 months. Presently,
the inventory overhang remains at 27
months which is 24% of the total supply
till date.
Post H1 2010; while the real estate
activity in all the major cities entered a
recovery phase, Hyderabad realty
sector was affected by uncertainty
originating from the political turmoil
over Telangana issue. Developers and
buyers have been shying away from the
market fearing a price crash in the
event of violent agitations. All this has
culminated in to stagnation in real
estate activity as well as real estate
capital values in the city.
10,8
78
8,12
9
5,74
9
5,30
5
2,95
8
9,07
9
7,86
9
3,65
5
2,21
3
2,79
1
3,45
3
3,11
1
4,13
4
4,20
8
5,37
9
6,39
7
3,69
8
2,94
7
0
5
10
15
20
25
30
0
2,000
4,000
6,000
8,000
10,000
12,000
H1 2008 H2 2008 H1 2009 H2 2009 H1 2010 H2 2010 H1 2011 H2 2011 H1 2012(YTD)
LIN
E -
Inve
ntor
y O
verh
ang
BARS
- U
nits
Exhibit 1: Supply-Absorption Dynamics* [H1 2008- H1 2012 (YTD)]
New Launch New Launch AbsorptionTrend Inventory Overhang(Months of Inventory)
*Note: The data pertains to apartments only
Even with a decline in new launches, the inventory
overhang has not come down below 22 months over the last
three years underlining the loss of faith of the buyers in the city
5 Thinking Bulbs | Hyderabad: Back in Reckoning?

2. Capital Values Trend – Residential Real Estate
The capital values of residential real estate in the city have witnessed major decline till the first quarter of year
2010. Owing to the pessimistic economic scenario, the city witnessed fewer launches and subdued absorption. The real estate capital values however witnessed a reversal of declining trend in the second quarter of 2010 which is attributable to the limited new launches.
Since H2 2010, the direction of capital values’ movement for the city appears to be in consonance with other major cities; however the quantum of jump has been meager.
Over the last three quarters, real estate activity across markets has been subdued on account of liquidity crunch, an already declining demand further hit by rising interest rates and over all global economic uncertainty. Residential real estate capital values exhibit an appreciation of 2 % in the first quarter of 2012. This increase in
capital values is primarily on account of higher demand for projects approaching completion.
2.1 Residential Real Estate Capital Values Trend – Prominent Micro Markets of Hyderabad
The average capital value in Hyderabad at the city level has witnessed a decline of approx. 1% over the period H2 2007 to H1 2012. The major trends emerging out of the capital values are as follows:
• Major fall in prices has been witnessed in Jubilee Hills, Bachupally, Kompally Medchal and Nalagandala.
• Prominent micro markets which have witnessed an appreciation in capital values include Alwal, Shamirpet, Himayat Nagar, Rajendra Nagar, Kukatpally & Banjara Hills.
• Micro Markets of South Hyderabad have provided better appreciation over the other micro markets of the city.
0.7% 0.4% 1.7% 0.4%
-1.3% -4.0% -2.6% -3.6% -1.2% -0.8%
0.0% 0.5% 1.7% 1.8% 1.6% 0.8% 1.1% 2.2% 0.4%
3,001 3,099
2,700
2,981
-5%
-3%
-1%
1%
3%
5%
1,500
1,700
1,900
2,100
2,300
2,500
2,700
2,900
3,100
3,300
Q3
2007
Q4
2007
Q1
2008
Q2
2008
Q3
2008
Q4
2008
Q1
2009
Q2
2009
Q3
2009
Q4
2009
Q1
2010
Q2
2010
Q3
2010
Q4
2010
Q1
2011
Q2
2011
Q3
2011
Q4
2011
Q1
2012
Q 2
201
2
BARS
- P
erce
ntag
e
LIN
E -
INR
per s
q. ft
.
Exhibit 2: Hyderabad - Capital Value Trend
% Change Q-o-Q WAP - Absorbed
2
6 Thinking Bulbs | Hyderabad: Back in Reckoning?

NORTH HYDERABAD
Exhibit 3: Region-Wise Index of Capital Values Movement in Prominent Micro Markets of Hyderabad [Base July 2007 =100
SOUTH HYDERABAD
EAST HYDERABAD
WEST HYDERABAD
CENTRAL HYDERABAD
Hyderabad’s residential real estate market witnessed a positive trend in Q1 2012 in micro markets close to the IT and Financial district of Hi-Tech City. Locations such as Kukatpally, Miyapur, Kondapur, Chandanagar, Lingampally and Kondapur witnessed an
appreciation in capital values.
Peripheral locations such as Tellapur, Nallagandla, Shamirpet and Alwal have gained prominence over the last 2 – 3 quarters. The overall capital value appreciation has been modest, fluctuating between 2-4% in these markets.
Established locations such as Jubilee Hills, Soumajigudda, Begumpet, and Punjagutta have witnessed some price correction/stagnation. Ready-to-move-in Residential apartments or apartments nearing completion would witness healthy appreciation in near future on account of end user led demand
Table 1: Capital Values Trend - Prominent Micro Markets [Over the Period H2 2007 - H1 2012 (YTD)]
105
147
113 120
80
100
120
140
160Mehdipattnam Himayat Nagar Attapur Rajendra Nagar
114
88 84
140
81
100
70
90
110
130
Alwal Kapra KompallyShamirpet Medchal Bachupally
110
136
88
70
85
100
115
130
Tarnaka Amberpet Uppal
120
106 107
85
96 89
70
85
100
115
130
Kondapur Kukatpally Miyapur MadhapurNallagandla Tellapur Gachibowli
125 115
90
102
146
80
100
120
140
160
Q3-
2007
Q4-
2007
Q1-
2008
Q2-
2008
Q3-
2008
Q4-
2008
Q1-
2009
Q2-
2009
Q3-
2009
Q4-
2009
Q1-
2010
Q2-
2010
Q3-
2010
Q4-
2010
Q1-
2011
Q2-
2011
Q3-
2011
Q4-
2011
Q1-
2012
Q2-
2012
Secunderabad Punjagutta SounmajiguddaBegumpet Banjara Hills
7 Thinking Bulbs | Hyderabad: Back in Reckoning?

2.2 Capital Value Trend – Comparison with Other Cities
Real Estate capital values in all the major cities of India witnessed an appreciating trend until the onslaught of the global financial crisis of 2007. Capital values across all cities plummeted post Q2 2008. While most of the cities have recovered from the nadir of 2008-09 and have breached the previous pinnacle of 2008, capital
values in Hyderabad still hover below the peak of Q3 2008. Capital values of Residential Real Estate witnessed a decline from INR 3,000 per sq. ft. to INR 2,980 per sq. ft. over the period Q3 2007 to Q2 2012 exhibiting a negative annual return of approximately 0.2%.
As per the index of capital value movement with base (Base=100) as
capital values existent in Jan 2008, Residential real estate capital value in Hyderabad is floating below its previous peak. The price index score in case of Hyderabad in Q2 2012 remains at 105, ranking among one of the worst performing markets.
Capital values’ stagnation in case of Hyderabad cannot be explained by plain demand supply mismatch. The
drop in the index is in-spite-of constrained new supply in the recent years. The drop can be attributed to the cautious approach of developers as well as buyers in the wake of political uncertainty post H2 2009. Buyers are exercising caution in investing in to new launches fearing execution delays. In the recent quarters, prices have largely been driven by resale activity pointing to the end user driven demand seeking units approaching completion.
8 Thinking Bulbs | Hyderabad: Back in Reckoning?
Gurgaon: 175
NOIDA: 152 Mumbai: 163
Navi Mumbai: 170
Chennai: 133
Hyderabad: 105
Pune: 146 Bangalore: 149
Kolkata: 166
80
105
130
155
180
Q1
2008
Q2
2008
Q3
2008
Q4
2008
Q1
2009
Q2
2009
Q3
2009
Q4
2009
Q1
2010
Q2
2010
Q3
2010
Q4
2010
Q1
2011
Q2
2011
Q3
2011
Q4
2011
Q1
2012
Q2
2012
Exhibit 4: Index of Capital Values Movement of Hyderabad and Other Prominent Cities [Base Jan 2008 =100]
Gurgaon NOIDA Mumbai Navi Mumbai BangaloreChennai Hyderabad Pune Kolkata
Note: The Index calculation is based on weighted average capital values of selected representative projects of various/selective regions within the city The index is based in primary market as well as secondary market prices of the selected representative projects only

2.3 Is Residential Real Estate in Hyderabad Undervalued?
2.3.1 Comparison of Hyderabad with Other Cities on the Basis of Real Estate Growth Drivers
Availability of Developable Land
The city outskirts have ample developable land, which are available at attractive prices compared to any peripheral locations of other cities. Unlike constraints of major cities such as Delhi and Mumbai, the city has huge availability of developable land.
Commercial Drivers
The real estate development in a city bears a direct proportionality to the economic activity in the city well supported by the social and physical infrastructure. All the major cities of India have witnessed incredible growth in real estate activity over the last decade primarily on account of emergence of human capital intensive industries such as IT/ITES, Automobile and to some extent BFSI (Banking, Financial Services & Insurance). Off all the sectors, the contribution of IT/ITES has been the highest in generating
buying propensity among the masses primarily owing to the higher average income levels in the sector. This is one of the primary reasons for higher real estate development in the cities with higher IT/ITES activities. Hyderabad houses approximately 700 IT/ITES organizations providing direct employment to 2.75 lacs people and indirect employment to 11 lacs people.
Hyderabad is also rapidly catching up as a major destination for product development with presence of approximately 470 IT product development start-ups.
Table 2 exhibits the primary and secondary commercial driver for major cities of India. Apart from the large presence of IT/ITES companies, Hyderabad has also witnessed
Table 2: Primary & Secondary Growth Drivers for the Major Cities and their Scale of Contribution Cities Primary Driver Scale Secondary Driver Scale Gurgaon IT/ITES High Automobile High NOIDA IT/ITES Moderate Manufacturing Low Mumbai BFSI Very High IT/ITES High Navi Mumbai IT/ITES Low BFSI Moderate Thane Manufacturing High IT/ITES Low Bangalore IT/ITES Very High BFSI Low Chennai IT/ITES High Automobile High Hyderabad IT/ITES High BFSI Moderate Pune IT/ITES High Automobile High Kolkata IT/ITES Moderate Small Scale Industries Moderate
“Hyderabad accounts for 12% of the Indian software
exports providing direct employment to about 2.75
lacs people as well as indirect employment to
about 11 lacs professionals”
- NASSCOM report “March of South Brigade, June 2012”
9 Thinking Bulbs | Hyderabad: Back in Reckoning?

3,89
6
3,48
7
5,00
0
7,00
0
5,00
0
4,44
0
4,80
0
4,90
0
3,08
0
3,22
0 4,
400
5,07
0
4,60
0
1,000
3,000
5,000
7,000
Mad
hapu
r
Gac
hibo
wli
Begu
mpe
t
Banj
ara
Hill
s
Sect
ors
99 -
115
Sect
ors
90 -
95
Kala
mbo
li
Kam
othe
Mys
ore
Hig
hway
Jala
hali
Thak
urli
Ow
ale
Bapg
aon
Hyderabad Gurgaon Navi Mumbai Bangalore Thane
Cap
ital V
alue
INR
per s
q. ft
.
Exhibit 5: Wt. Avg. Capital Value H1 2012 (YTD) - Comparison of Micro Market Across Cities
significant activity in Pharma, Biotech as well as BFSI sector. On this count, the city scores at par with many other commercial hubs of India.
Physical & Social Infrastructure
The city of Hyderabad boasts of a healthy physical and social infrastructure on following counts:
• Well planned arterial as well as peripheral roads.
• World class Airport offering excellent connectivity to major international destinations.
• A large concentration of quality educational institutes producing large pool of technically trained talent every year.
Law & Order
Until 2009, the city was largely peaceful. Post 2009, the city has scored low on this parameter. This is the only parameter on which the city has lagged
behind its close peers such as Bangalore, Chennai, Pune and Kolkata. The political uncertainty over Telangana issue and fear of violent agitations has been keeping developer as well as consumer away from the market. On the other hand, developers have been feeling cost pressures owing to mounting construction cost; increasing cost of capital and stagnating capital values. Developers cannot reduce the prices significantly, while buyers are waiting for some degree of price correction. Price appreciation on the other hand has been marred by subdued absorption levels. This emerges out to be the prime reason for relatively subdued real estate pricing in Hyderabad.
2.3.2 Capital Value – Comparison with Micro Market of other Cities
The capital values of residential units in the prime locations in Hyderabad are comparable or in some cases lower than the peripheral locations of
10 Thinking Bulbs | Hyderabad: Back in Reckoning?

Gurgaon, Navi Mumbai, Thane and Bangalore.
Exhibit 5 highlights the lucrativeness of existing real estate capital values in Hyderabad. The existing price levels in the prime locations of Hyderabad with superlative physical and social infrastructure are comparable to the existing capital values of peripheral location of other cities.
Hyderabad ranks at par or superior in some cases on almost all the parameters influencing value of real estate. However, average capital values existing in the city ranks lowest amongst the nine comparable cities taken into account. As evident form the Exhibit 5, peripheral locations of Navi Mumbai such as Kalamboli & Kamothe command a price which is at par with Begumpet (centrally located micro market) and higher than Gachibowli & Madhapur (Prime locations close to the
Financial district and Hi-Tech City). Peripheral & futuristic locations of Gurgaon such as the New Gurgaon (Sector 90 – 95) and Dwarka Expressway (Sector 99 – 115)
command higher weighted average capital values compared to the established location of Hyderabad.
On the basis of comparative analysis of existing capital values in Hyderabad with the existing capital values across other Indian cities at a city level as well as at micro market level, it can be deduced that the real estate in the city is undervalued.
3. Advantage Hyderabad
3.1 Undervalued Market w.r.t. Other Cities
Hyderabad commands lowest capital value as well as lowest index value (Exhibit: 4) amongst the nine major cities of India. However, the quantum of difference can be accurately estimated by comparing Hyderabad with its close comparable. An analysis of capital values of Hyderabad with close comparables such as Bangalore, Pune, Chennai & Kolkata (Exhibit: 6) establishes that the average capital value in Hyderabad is going at a discount of approximately 30%.
Comparison of Hyderabad with its close comparable such as Bangalore, Pune,
Chennai & Kolkata, reveals the fact that the average
capital value in Hyderabad is going at a discount of
approximately 30%
The average capital values of residential units in the prime locations of Hyderabad are
comparable or in some cases cheaper than the average capital values existing in
peripheral locations of Gurgaon, Navi Mumbai and
Thane
11 Thinking Bulbs | Hyderabad: Back in Reckoning?
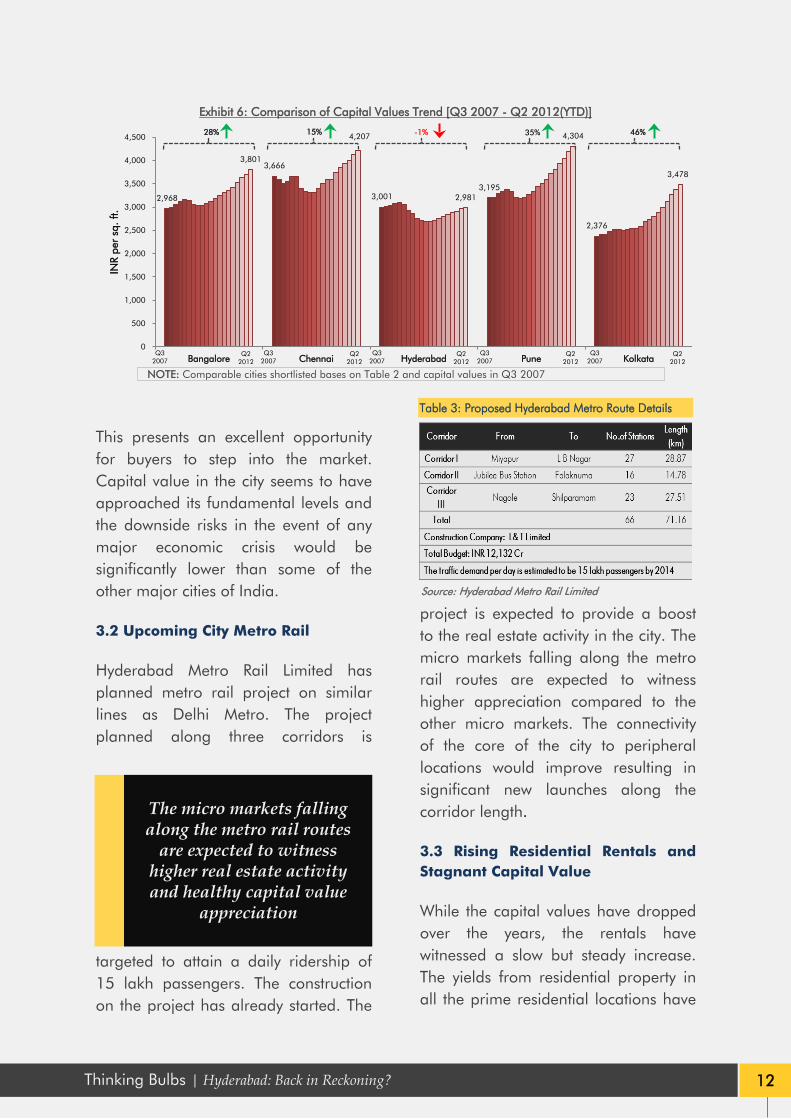
This presents an excellent opportunity for buyers to step into the market. Capital value in the city seems to have approached its fundamental levels and the downside risks in the event of any major economic crisis would be significantly lower than some of the other major cities of India.
3.2 Upcoming City Metro Rail
Hyderabad Metro Rail Limited has planned metro rail project on similar lines as Delhi Metro. The project planned along three corridors is
targeted to attain a daily ridership of 15 lakh passengers. The construction on the project has already started. The
project is expected to provide a boost to the real estate activity in the city. The micro markets falling along the metro rail routes are expected to witness higher appreciation compared to the other micro markets. The connectivity of the core of the city to peripheral locations would improve resulting in significant new launches along the corridor length.
3.3 Rising Residential Rentals and Stagnant Capital Value
While the capital values have dropped over the years, the rentals have witnessed a slow but steady increase. The yields from residential property in all the prime residential locations have
The micro markets falling along the metro rail routes
are expected to witness higher real estate activity and healthy capital value
appreciation
2,968
3,666
3,001 3,195
2,376
3,801
4,207
2,981
4,304
3,478
0
500
1,000
1,500
2,000
2,500
3,000
3,500
4,000
4,500
Bangalore Chennai Hyderabad Pune Kolkata
INR
per
sq. f
t. Exhibit 6: Comparison of Capital Values Trend [Q3 2007 - Q2 2012(YTD)]
28% 46% 15% -1%
Q3 2007 Q2
2012 Q3 2007 Q2
2012 Q3 2007 Q2
2012 Q3 2007 Q2
2012 Q3 2007 Q2
2012
Table 3: Proposed Hyderabad Metro Route Details
Source: Hyderabad Metro Rail Limited
NOTE: Comparable cities shortlisted bases on Table 2 and capital values in Q3 2007
12 Thinking Bulbs | Hyderabad: Back in Reckoning?
been on an upward trajectory varying in the range of 3% to 5%. Increasing rental yield is a result of stagnation in new launches and an indicator of increasing end user demand. A higher yield and lower capital values indicates a shortening gap between rental cash out flow and approximate recurring liability (EMI) for purchasing a housing unit. Such a gap makes home buying more lucrative.
4. Investing in Hyderabad- Risk Vs. Opportunities
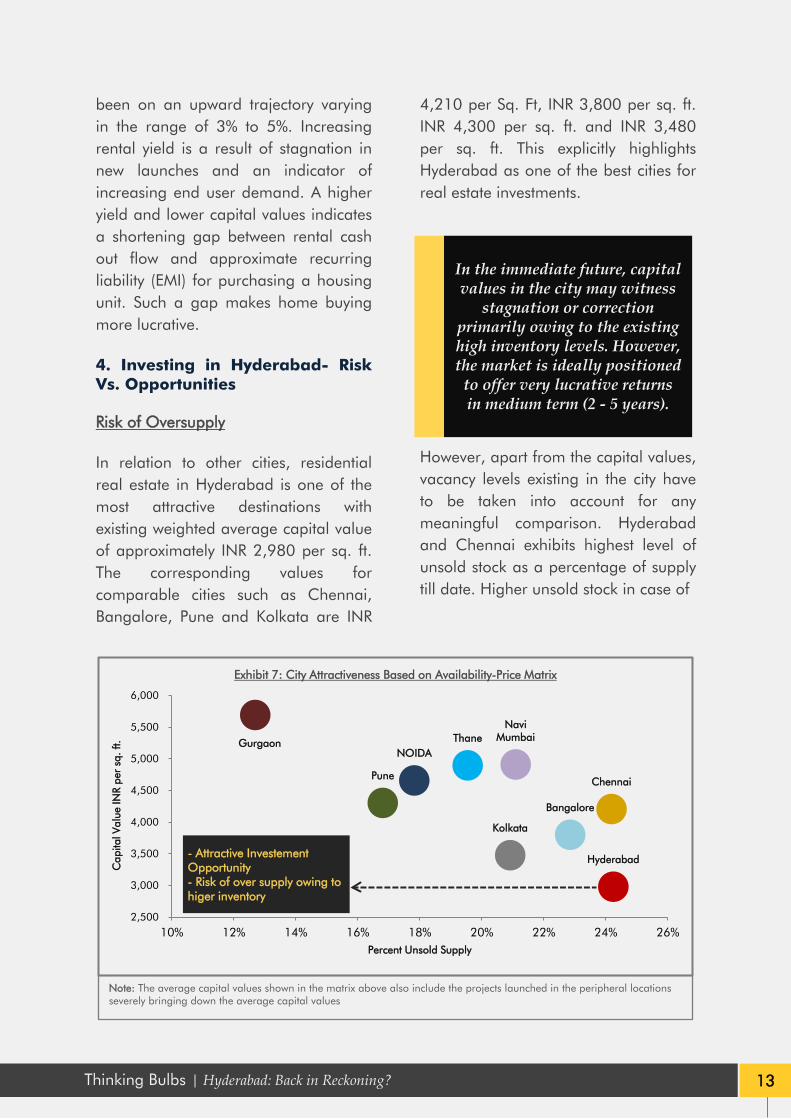
Risk of Oversupply
In relation to other cities, residential real estate in Hyderabad is one of the most attractive destinations with existing weighted average capital value of approximately INR 2,980 per sq. ft. The corresponding values for comparable cities such as Chennai, Bangalore, Pune and Kolkata are INR
4,210 per Sq. Ft, INR 3,800 per sq. ft. INR 4,300 per sq. ft. and INR 3,480 per sq. ft. This explicitly highlights Hyderabad as one of the best cities for real estate investments.
However, apart from the capital values, vacancy levels existing in the city have to be taken into account for any meaningful comparison. Hyderabad and Chennai exhibits highest level of unsold stock as a percentage of supply till date. Higher unsold stock in case of
Gurgaon NOIDA
Navi Mumbai Thane
Bangalore
Chennai
Hyderabad
Pune
Kolkata
2,500
3,000
3,500
4,000
4,500
5,000
5,500
6,000
10% 12% 14% 16% 18% 20% 22% 24% 26%
Cap
ital V
alue
INR
per
sq. f
t.
Percent Unsold Supply
Exhibit 7: City Attractiveness Based on Availability-Price Matrix
- Attractive Investement Opportunity - Risk of over supply owing to higer inventory
Note: The average capital values shown in the matrix above also include the projects launched in the peripheral locations severely bringing down the average capital values
In the immediate future, capital values in the city may witness
stagnation or correction primarily owing to the existing high inventory levels. However, the market is ideally positioned
to offer very lucrative returns in medium term (2 - 5 years).
13 Thinking Bulbs | Hyderabad: Back in Reckoning?
Chennai is on account of large quantum of new launches. However, when analyzed in terms of months, the 24% level of inventory in case of Chennai translates into 13 months of inventory owing to higher absorption rate. This exhibits the fact that if backed by optimism and healthy absorption rate the inventory overhang is manageable and will prevent it from reaching alarming level.
In the immediate future, capital values in the city may witness stagnation or correction primarily owing to the existing high inventory levels. However, the market is ideally positioned to offer very lucrative returns in medium term (2 - 5 years). The long term opportunity with respect to real estate investments overweighs the short term risks associated with it.
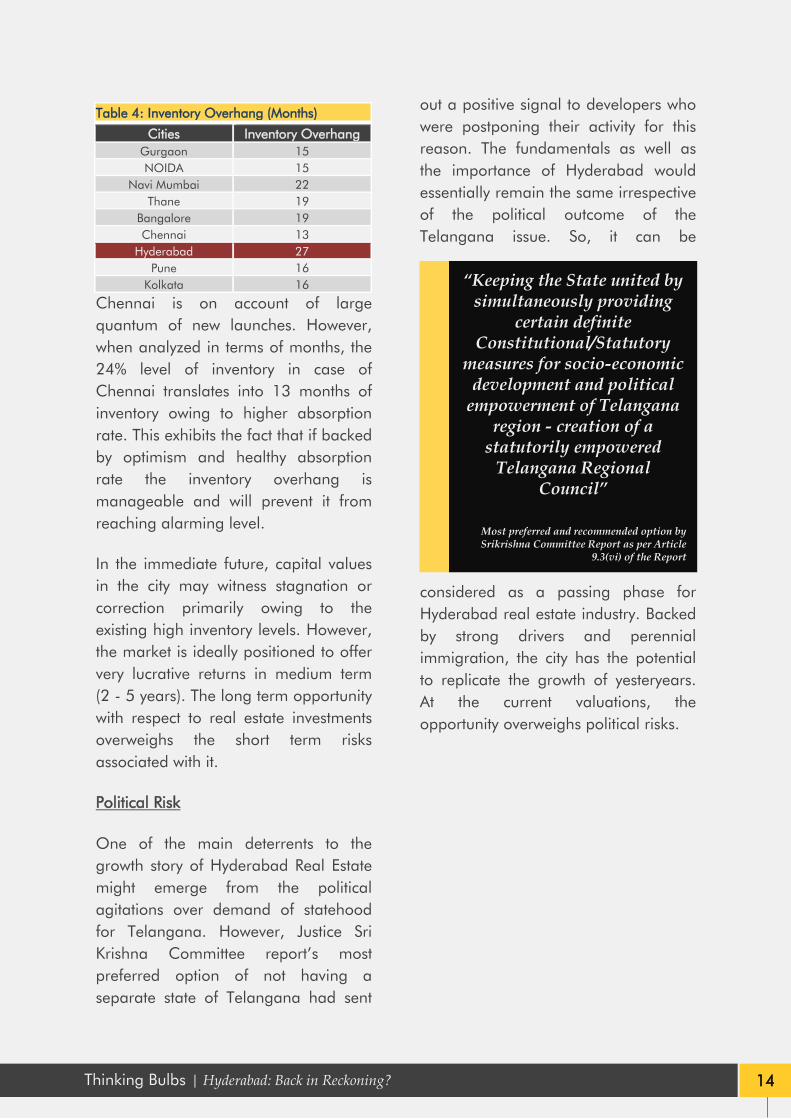
Political Risk
One of the main deterrents to the growth story of Hyderabad Real Estate might emerge from the political agitations over demand of statehood for Telangana. However, Justice Sri Krishna Committee report’s most preferred option of not having a separate state of Telangana had sent
out a positive signal to developers who were postponing their activity for this reason. The fundamentals as well as the importance of Hyderabad would essentially remain the same irrespective of the political outcome of the Telangana issue. So, it can be
considered as a passing phase for Hyderabad real estate industry. Backed by strong drivers and perennial immigration, the city has the potential to replicate the growth of yesteryears. At the current valuations, the opportunity overweighs political risks.
Table 4: Inventory Overhang (Months)
Cities Inventory Overhang Gurgaon 15 NOIDA 15
Navi Mumbai 22 Thane 19
Bangalore 19 Chennai 13
Hyderabad 27 Pune 16
Kolkata 16 “Keeping the State united by simultaneously providing
certain definite Constitutional/Statutory
measures for socio-economic development and political
empowerment of Telangana region - creation of a
statutorily empowered Telangana Regional
Council”
Most preferred and recommended option by Srikrishna Committee Report as per Article
9.3(vi) of the Report
14 Thinking Bulbs | Hyderabad: Back in Reckoning?

5. Outlook
The residential real estate capital values in the city of Hyderabad are undoubtedly at lucrative levels. None-the-less, the risk of political uncertainty and marginal fall in capital values due to any violent agitations cannot be over looked. The main challenge for the buyers would be timing the entry into the market. On the other hand, stagnant capital values coupled with increasing input cost have already squeezed developer’s margins. Developers are keen to generate quick cash flows. To lure home buyers, developers would resort to affordable segment projects at lucrative capital values coupled with freebies and interesting schemes.
In case pessimistic macroeconomic scenario sustains, the region may witness a price correction of 5% to 10%. However in medium term investments in the city’s real estate can generate an annual return of 12% to 15% from current levels in addition to rental income from assets.
In the given economic scenario, investing in Hyderabad makes more sense primarily on account of valuations. In the long run, Hyderabad can undeniably compete with the hottest real estate markets in India. To summarize, the long term opportunities overweighs short term risks.

AUTHORS
GAURAV PANDEY
SENIOR VICE PRESIDENT HEAD - RESEARCH & CONSULTING
ASHUTOSH KASHYAP SENIOR ANALYST
RESEARCH & CONSULTING

RESEARCH & CONSULTING
The Research & Consulting team undertakes bespoke assignments. It currently services key
marquee funds, developers and investors and has developed solutions that are strategic
and impactful. The consulting services cover the entire gambit from Strategy Advisory to all
Research Solutions. Some of the service offerings are tabled below:
Location Advisory
Development Consulting
Strategic Consulting
Research City Reports
Location Strategy
Concept Testing Studies
Entry Strategy Studies
White Papers
City demographics, economic base, infrastructure initiative
Supply & demand dynamics across asset class
High & Best Use Feasibility Studies
Market Trends
City spatial growth pattern
Real Estate investment strategy
Product Mix Assessment Studies
Market & Business Potential Studies
Industry Overview
Supply & Absorption trends
Economic & Financial Impact Assessment
Optimal Development Strategy
Construction industry specific studies
Monthly trackers
Capital value and rental trends
Business Risk Mitigation Study
Demand Assessment studies
Consumer survey analysis and product-mix advisory
Investment per PE Deal Tracking
Mapping of existing and upcoming developments
End-user perspective /insight Studies
17 Thinking Bulbs | Hyderabad: Back in Reckoning?

ABOUT FOUNDER & CEO
SAMIR JASUJA
FOUNDER & CHIEF EXECUTIVE OFFICER
P E Analytics has been founded by Samir Jasuja, a serial entrepreneur with over 18 years of domain experience in Real Estate, PE & Financial Services. ABOUT PROPEQUITY
PropEquity is India’s first online real estate intelligence platform that tracks over 45,000
projects of 8,200 developers over 40 cities and features over 5 years of catalogued data
on the platform.
P.E. Analytics, the company behind PropEquity is built on pure innovation. The products
created by the company are unique in Indian context and have been validated by the
market and marquee customers. The company’s endeavor is to create an information
service enterprise through continuous innovation and integration of real time data,
analytics and cutting edge technology to achieve higher transparency. Its key beneficiaries
include over 100 Real Estate PE Funds, Developers, Institutions, Retail and other industries
that need research, data and analytics. It currently has 250 employees.
PropEquity’s offering include Collateral Risk Management, Realty Index, B2C - One Click
Report and Catchment Area Analysis.
Catch us live at NDTV Profit's "The Property Show".
18 Thinking Bulbs | Hyderabad: Back in Reckoning?

Experience the features, functionalities and benefits of PropEquity through an interactive demonstration. To arrange a trial please contact: AVINASH JHA Hand phone: +91 9819771005. +91 22 67420794 Email: [email protected] VAISHALI PAWAH Hand phone: +91 9810111697. +91 124 4522750 Email: [email protected] POOJA VERMA Hand phone: +91 9811888816. +91 124 4522745 REGISTERED OFFICE: D4 Commercial Complex, Paschimi Marg, Vasant Vihar, New Delhi – 110057 We have offices in Gurgaon, Mumbai and Bangalore. Email: [email protected] www.propequity.in
COPYRIGHT © PROPEQUITY. ALL RIGHTS RESERVED.
No part or whole of this publication should be published without prior written permission from PropEquity. The contents, information and data in this publication should be regarded just as a general guide. While care has been taken in its preparation, no representation is made or responsibility accepted for the precision of the whole or any of the part. We highlight and stress that forecasting, data analysis and projections of any nature are challenging & difficult tasks which at best should be regarded as an indicative assessment of possibilities rather than certainties. Collection of data carries risks of inaccuracies and the readers are advised not to make any judgments based on this publication. The process of making forward projections involves assumptions regarding numerous variables which are acutely sensitive to changing conditions, variations in any one of which may significantly affect the outcome, and we draw your attention to this factor. We once again highlight, PropEquity and the authors of the publication would not be responsible for any conclusions, data and analysis as reflected/shown/depicted/presented and/or drawn from this publication.