creating more reliable business critical enterprise - citeseer
TRANSCRIPT

Creating more reliable business criticalenterprise systems using RUP and
System Safety
Thomas Hermansen
TDT4735 - System Engineering, Depth Study
Fall 2005
Supervisor: Tor St̊alhane
Department of Computer and Information Science, NTNU,Trondheim, Norway.
December 20, 2005

Abstract
Today more and more companies acquire enterprise-scale solutions fortheir organization. Enterprise-scale solutions connect departments and busi-ness functions in the organization so that the coordination, communicationand work flow between them are optimized. The advantages of these enter-prise systems come at the price of vulnerability. When systems get moreinterconnected and complex, they are also more prone to faults that can de-velop into system-wide ripple effects that cripple the whole organization. Ifany business critical parts of the system are affected, this can be devastatingfor a company. Business critical parts are those parts of the system thatare imperative for the day-to-day run of the business, and help the businessconduct its primary functions. The consequence of a fault in a business crit-ical function can be the loss of profit, the loss of clients, and even the lossof the business itself. The aim of this study is to propose a way to combinethe Rational Unified Process (RUP) with the methods from the field of Sys-tem Safety to develop more reliant business-critical systems, with focus onenterprise-scale systems.

2

Preface
This project is carried out as a compulsory part of the “Depth Study” course(TDT4735) given by the Department of Computer and Information Scienceat the Norwegian University of Science and Technology (NTNU). The courseis taken one semester prior to the Master thesis and aims to give the stu-dents specialized knowledge in a field they later can base their Master thesison. The project was given by BUCS research group, which is centered oncomponent-based development in business-critical software. I would like tothank my supervisor Dr. Ing Tor St̊alhane for feedback and suggestions, andfor giving me the ability to define my own project description within the scopeof BUCS.
Trondheim, December 20, 2005Thomas Hermansen
3

Contents
1 Introduction 131.1 The aim of the study . . . . . . . . . . . . . . . . . . . . . . . 131.2 Report Outline . . . . . . . . . . . . . . . . . . . . . . . . . . 141.3 Definitions . . . . . . . . . . . . . . . . . . . . . . . . . . . . . 15
1.3.1 System Safety . . . . . . . . . . . . . . . . . . . . . . . 151.3.2 Rational Unified Process . . . . . . . . . . . . . . . . . 161.3.3 Enterprise systems . . . . . . . . . . . . . . . . . . . . 161.3.4 Business critical systems . . . . . . . . . . . . . . . . . 16
1.4 The Case . . . . . . . . . . . . . . . . . . . . . . . . . . . . . 17
2 Prestudy 182.1 The Rational Unified Process . . . . . . . . . . . . . . . . . . 18
2.1.1 What is RUP? . . . . . . . . . . . . . . . . . . . . . . 182.1.2 The RUP Meta model . . . . . . . . . . . . . . . . . . 232.1.3 Extending RUP . . . . . . . . . . . . . . . . . . . . . . 24
2.2 Current Work . . . . . . . . . . . . . . . . . . . . . . . . . . . 252.2.1 System Safety in Software Engineering . . . . . . . . . 262.2.2 Reliability analysis in process frameworks . . . . . . . 262.2.3 RUP-Extensions . . . . . . . . . . . . . . . . . . . . . . 27
2.3 Risk . . . . . . . . . . . . . . . . . . . . . . . . . . . . . . . . 272.3.1 What is risk? . . . . . . . . . . . . . . . . . . . . . . . 272.3.2 Risk terminology . . . . . . . . . . . . . . . . . . . . . 272.3.3 Risk Management . . . . . . . . . . . . . . . . . . . . . 282.3.4 Risk Management Process . . . . . . . . . . . . . . . . 302.3.5 Risk lifecycle in RUP . . . . . . . . . . . . . . . . . . . 31
2.4 Enterprise Systems . . . . . . . . . . . . . . . . . . . . . . . . 332.4.1 The nature of Enterprise Systems . . . . . . . . . . . . 332.4.2 Enterprise Architectures . . . . . . . . . . . . . . . . . 34
2.5 Enterprise Risk . . . . . . . . . . . . . . . . . . . . . . . . . . 362.5.1 Common enterprise risks . . . . . . . . . . . . . . . . . 362.5.2 Business Continuity Planning . . . . . . . . . . . . . . 38
4

CONTENTS
2.6 Relevant Standards . . . . . . . . . . . . . . . . . . . . . . . . 392.6.1 IEC l7799 - Information Security . . . . . . . . . . . . 392.6.2 IEC 61508 - Functional Safety . . . . . . . . . . . . . . 41
2.7 Representation of UML-models . . . . . . . . . . . . . . . . . 41
3 Research 433.1 Research agenda . . . . . . . . . . . . . . . . . . . . . . . . . 43
3.1.1 Choosing method configurations . . . . . . . . . . . . . 433.1.2 Propose an integration . . . . . . . . . . . . . . . . . . 463.1.3 Evaluate possibilities of automation . . . . . . . . . . . 47
3.2 Research process . . . . . . . . . . . . . . . . . . . . . . . . . 473.2.1 Choosing method configurations . . . . . . . . . . . . . 473.2.2 Propose a integration . . . . . . . . . . . . . . . . . . . 493.2.3 Evaluate possibilities of automation . . . . . . . . . . . 50
3.3 Requirements . . . . . . . . . . . . . . . . . . . . . . . . . . . 503.3.1 Method evaluation . . . . . . . . . . . . . . . . . . . . 513.3.2 Process integration . . . . . . . . . . . . . . . . . . . . 513.3.3 Automation of process . . . . . . . . . . . . . . . . . . 53
4 Defining a conceptual model of the enterprise 544.1 A Conceptual model . . . . . . . . . . . . . . . . . . . . . . . 544.2 The Enterprise Criticality Assessment . . . . . . . . . . . . . . 55
5 Method Evaluation 605.1 Preliminary Hazard Analysis (PHA) . . . . . . . . . . . . . . 605.2 Failure Modes and Effects Analysis (FMEA) . . . . . . . . . . 635.3 Hazard and operability study (HAZOP) . . . . . . . . . . . . 675.4 Fault Tree Analysis (FTA) . . . . . . . . . . . . . . . . . . . . 705.5 Cause-Consequence Analysis (CCA) . . . . . . . . . . . . . . . 74
6 Extension of method configurations 786.1 PHA and Use Case Diagram/Component Diagram . . . . . . . 786.2 FMEA and Component Diagram . . . . . . . . . . . . . . . . 846.3 HAZOP and Business Sequence Diagram . . . . . . . . . . . . 876.4 FTA and Enterprise Criticality Assessment . . . . . . . . . . . 916.5 CCA and a list of fallible points . . . . . . . . . . . . . . . . . 95
7 Comparison and selection of method configurations 997.1 Enterprise risks . . . . . . . . . . . . . . . . . . . . . . . . . . 997.2 General software risks . . . . . . . . . . . . . . . . . . . . . . 1017.3 Process related issues . . . . . . . . . . . . . . . . . . . . . . . 102
5

CONTENTS
7.4 Selection of configurations . . . . . . . . . . . . . . . . . . . . 103
8 Integration with RUP 1078.1 Defining Activities . . . . . . . . . . . . . . . . . . . . . . . . 1078.2 Defining Work Flows . . . . . . . . . . . . . . . . . . . . . . . 111
8.2.1 Enterprise Criticality Assessment . . . . . . . . . . . . 1118.2.2 System and requirements analysis . . . . . . . . . . . . 1118.2.3 Risk treatment . . . . . . . . . . . . . . . . . . . . . . 1148.2.4 Creation of maintenance plans . . . . . . . . . . . . . . 1148.2.5 Creation of BCPs and policies . . . . . . . . . . . . . . 115
8.3 Structuring Selectable Components . . . . . . . . . . . . . . . 1188.4 Defining a Common Risk Notation . . . . . . . . . . . . . . . 119
9 Automation of the process 1219.1 Automation through diagrams . . . . . . . . . . . . . . . . . . 1219.2 Automation through risk association . . . . . . . . . . . . . . 124
10 Applying the process 12610.1 An example application . . . . . . . . . . . . . . . . . . . . . . 126
10.1.1 Inception . . . . . . . . . . . . . . . . . . . . . . . . . 12810.1.2 Elaboration . . . . . . . . . . . . . . . . . . . . . . . . 12910.1.3 Construction . . . . . . . . . . . . . . . . . . . . . . . 12910.1.4 Transition . . . . . . . . . . . . . . . . . . . . . . . . . 129
10.2 The ideal application . . . . . . . . . . . . . . . . . . . . . . . 129
11 Discussion 13311.1 Method Evaluation . . . . . . . . . . . . . . . . . . . . . . . . 13311.2 Configuration Extension . . . . . . . . . . . . . . . . . . . . . 13411.3 Configuration Selection . . . . . . . . . . . . . . . . . . . . . . 134
11.3.1 Recommended configurations . . . . . . . . . . . . . . 13411.4 The Integration . . . . . . . . . . . . . . . . . . . . . . . . . . 13711.5 Process Automation . . . . . . . . . . . . . . . . . . . . . . . 137
12 Conclusion and future work 14012.1 Conclusion . . . . . . . . . . . . . . . . . . . . . . . . . . . . . 14012.2 Future work . . . . . . . . . . . . . . . . . . . . . . . . . . . . 141
A Comparison of methods - Rationale 143A.1 Enterprise risks . . . . . . . . . . . . . . . . . . . . . . . . . . 143A.2 General software risks . . . . . . . . . . . . . . . . . . . . . . 150A.3 Process aspects . . . . . . . . . . . . . . . . . . . . . . . . . . 153
6

CONTENTS
B Enterprise HAZOP parameters and guide words 157
C The case 162C.1 Component Diagram . . . . . . . . . . . . . . . . . . . . . . . 162C.2 Business Sequence Diagrams . . . . . . . . . . . . . . . . . . . 163C.3 Use Case Diagrams . . . . . . . . . . . . . . . . . . . . . . . . 163
7

List of Figures
1.1 System safety extended RUP process. . . . . . . . . . . . . . . 131.2 The case enterprise. . . . . . . . . . . . . . . . . . . . . . . . . 17
2.1 The waterfall process. . . . . . . . . . . . . . . . . . . . . . . . 192.2 The iterative method. . . . . . . . . . . . . . . . . . . . . . . . 192.3 The RUP iterative process (From www.rational.com). . . . . . 222.4 The phases and disciplines of RUP (From www.rational.com). 222.5 The RUP meta model. . . . . . . . . . . . . . . . . . . . . . . 232.6 The RUP process model. . . . . . . . . . . . . . . . . . . . . . 242.7 The RUP extension process. . . . . . . . . . . . . . . . . . . . 252.8 Risk migration. . . . . . . . . . . . . . . . . . . . . . . . . . . 282.9 The risk management process, [18]. . . . . . . . . . . . . . . . 302.10 RUP Risk lifecycle. . . . . . . . . . . . . . . . . . . . . . . . . 322.11 The Enterprise Information Architecture. . . . . . . . . . . . . 342.12 The Enterprise Information Infrastructure. . . . . . . . . . . . 352.13 The business Continuity Planning. . . . . . . . . . . . . . . . 39
3.1 The process of choosing method configurations. . . . . . . . . 483.2 The integration process. . . . . . . . . . . . . . . . . . . . . . 493.3 The process of creating a process based on requirements. . . . 503.4 The automation process. . . . . . . . . . . . . . . . . . . . . . 51
4.1 The enterprise organization. . . . . . . . . . . . . . . . . . . . 554.2 A conceptual model of the enterprise. . . . . . . . . . . . . . . 554.3 The enterprise. . . . . . . . . . . . . . . . . . . . . . . . . . . 564.4 Critical business processes. . . . . . . . . . . . . . . . . . . . . 56
5.1 PHA in the conceptual model. . . . . . . . . . . . . . . . . . . 625.2 An example FMEA output. . . . . . . . . . . . . . . . . . . . 655.3 FMEA in the conceptual model. . . . . . . . . . . . . . . . . . 665.4 An example process engineering system. . . . . . . . . . . . . 675.5 HAZOP in the conceptual model. . . . . . . . . . . . . . . . . 69
8

LIST OF FIGURES
5.6 FTA tree symbols. . . . . . . . . . . . . . . . . . . . . . . . . 725.7 Typical FTA tree. . . . . . . . . . . . . . . . . . . . . . . . . . 735.8 FTA in the conceptual model. . . . . . . . . . . . . . . . . . . 745.9 A typical CCA diagram. . . . . . . . . . . . . . . . . . . . . . 765.10 CCA in the conceptual model. . . . . . . . . . . . . . . . . . . 77
6.1 System Component Diagram. . . . . . . . . . . . . . . . . . . 816.2 Use Case Diagram - Administration system. . . . . . . . . . . 826.3 Use Case Diagram - Printing system. . . . . . . . . . . . . . . 836.4 System Component Diagram. . . . . . . . . . . . . . . . . . . 846.5 Inventory System Component Diagram. . . . . . . . . . . . . . 856.6 FMEA on Inventory Subsystem. . . . . . . . . . . . . . . . . . 866.7 IT operation modes. . . . . . . . . . . . . . . . . . . . . . . . 876.8 U2A business process parameters. . . . . . . . . . . . . . . . . 896.9 B2B/B2C business process parameters. . . . . . . . . . . . . . 906.10 C2C business process parameters. . . . . . . . . . . . . . . . . 906.11 H2H business process parameters. . . . . . . . . . . . . . . . . 916.12 The Printing System - Business Sequence Diagram. . . . . . . 956.13 FTA-tree for the “Newspaper is delayed”. . . . . . . . . . . . . 966.14 CCA diagram for “Printing system fails”. . . . . . . . . . . . . 97
7.1 Summary - Relative configuration performance. . . . . . . . . 1047.2 Number of risks/aspects with relative score above 1.5 per con-
figuration. . . . . . . . . . . . . . . . . . . . . . . . . . . . . . 1047.3 The configurations main foci in the enterprise conceptual model.105
8.1 Risk related work. . . . . . . . . . . . . . . . . . . . . . . . . . 1078.2 The risk related work done in a typical waterfall process. . . . 1088.3 Activities and their related artifacts. . . . . . . . . . . . . . . 1098.4 Risk work process in a typical iteration. . . . . . . . . . . . . . 1098.5 System Safety Discipline - work flow. . . . . . . . . . . . . . . 1128.6 Enterprise assessment - work flow. . . . . . . . . . . . . . . . . 1128.7 Risk analysis - work flow. . . . . . . . . . . . . . . . . . . . . . 1138.8 Risk treatment - work flow. . . . . . . . . . . . . . . . . . . . 1148.9 Creation of maintenance plans - work flow. . . . . . . . . . . . 1158.10 Creation of BCPs and policies - work flow. . . . . . . . . . . . 1168.11 Implemented functionality by iteration. . . . . . . . . . . . . . 1178.12 Reliability analysis by iteration. . . . . . . . . . . . . . . . . . 1178.13 The phases and disciplines of the extended RUP. . . . . . . . . 1188.14 The process components. . . . . . . . . . . . . . . . . . . . . . 1198.15 The Risk Matrix. . . . . . . . . . . . . . . . . . . . . . . . . . 119
9

LIST OF FIGURES
9.1 A small Component Diagram. . . . . . . . . . . . . . . . . . . 1229.2 The automatic creation of cue-phrases. . . . . . . . . . . . . . 1229.3 Risk association. . . . . . . . . . . . . . . . . . . . . . . . . . 125
10.1 Using the extended process on the case. . . . . . . . . . . . . . 12710.2 Criticality throughout the enterprise. . . . . . . . . . . . . . . 131
C.1 System Component Diagram. . . . . . . . . . . . . . . . . . . 162C.2 Business Sequence Diagram - Publishing system. . . . . . . . . 163C.3 Business Sequence Diagram - Printing system. . . . . . . . . . 164C.4 Business Sequence Diagram - Distribution system. . . . . . . . 164C.5 Use Case Diagram - Printing system. . . . . . . . . . . . . . . 165C.6 Use Case Diagram - Inventory system. . . . . . . . . . . . . . 168C.7 Use Case Diagram - Publishing system. . . . . . . . . . . . . . 170C.8 Use Case Diagram - Administration system. . . . . . . . . . . 173C.9 Use Case Diagram - Transport logistics system. . . . . . . . . 177
10

List of Tables
3.1 Method evaluation requirements. . . . . . . . . . . . . . . . . 513.2 Integration requirements. . . . . . . . . . . . . . . . . . . . . . 523.3 Automation requirements . . . . . . . . . . . . . . . . . . . . 53
4.1 Business aspects and their critical qualities . . . . . . . . . . . 58
5.1 An example PHA output. . . . . . . . . . . . . . . . . . . . . 615.2 The criticality matrix. . . . . . . . . . . . . . . . . . . . . . . 655.3 An example HAZOP output. . . . . . . . . . . . . . . . . . . . 68
6.1 PHA on the Administration System. . . . . . . . . . . . . . . 806.2 PHA on the Printing System. . . . . . . . . . . . . . . . . . . 816.3 Inventory System criticality matrix. . . . . . . . . . . . . . . . 856.4 HAZOP output for the printing system - I. . . . . . . . . . . . 926.5 HAZOP output for the printing system - II. . . . . . . . . . . 936.6 HAZOP output for the printing system - III. . . . . . . . . . . 94
7.1 Configuration performance on key enterprise risks. . . . . . . . 1007.2 Relative configuration performance on key enterprise risks. . . 1017.3 Configuration performance on general software risks. . . . . . 1017.4 Relative configuration performance on general software risks . 1027.5 Configuration performance on process related issues. . . . . . . 1027.6 Relative configuration performance on process related issues. . 103
8.1 Activities and Artifacts in the extended process - I. . . . . . . 1108.2 Activities and Artifacts in the extended process - II. . . . . . . 1118.3 Risk Analysis - Configurations. . . . . . . . . . . . . . . . . . 113
11.1 Method evaluation requirements - a review. . . . . . . . . . . . 13311.2 Integration requirements - a review. . . . . . . . . . . . . . . . 13811.3 Automation requirements - a review. . . . . . . . . . . . . . . 139
B.1 Generic guide words and their meaning. . . . . . . . . . . . . . 157
11

LIST OF TABLES
B.2 IT Operation Mode - Communication - Parameters. . . . . . . 158B.3 IT Operation Mode - Processing - Parameters. . . . . . . . . . 158B.4 IT Operation Mode - Storage - Parameters. . . . . . . . . . . 158B.5 IT Operation Mode - Configuration - Parameters. . . . . . . . 158B.6 Enterprise Relation - U2A - Parameters. . . . . . . . . . . . . 159B.7 Enterprise Relation - A2U - Parameters. . . . . . . . . . . . . 159B.8 Enterprise Relation - B2B/B2C - Service - Parameters. . . . . 159B.9 Enterprise Relation - B2B/B2C - Purchase - Parameters. . . . 159B.10 Enterprise Relation - B2B/B2C - Sale - Parameters. . . . . . . 160B.11 Enterprise Relation - C2C - Purchase - Parameters. . . . . . . 160B.12 Enterprise Relation - C2C - Sale - Parameters. . . . . . . . . . 160B.13 Enterprise Relation - C2C - Parameters. . . . . . . . . . . . . 160B.14 Enterprise Relation - H2H - Parameters. . . . . . . . . . . . . 161
12

Chapter 1
Introduction
1.1 The aim of the study
The aim of this study is to evaluate methods from the System Safety fieldwith respect to their applicability to the development of business-criticalsoftware on an enterprise-scale using the Rational Unified Process (RUP)framework. In other words, how can we combine the strengths of RUP andSystem Safety to develop more reliable business critical enterprise systems?
Figure 1.1: System safety extended RUP process.
Figure 1.1 explains the aim of this extended RUP process. By using Sys-
13

CHAPTER 1. INTRODUCTION
tem Safety methods, software models, best-practice standards, and domainknowledge about the enterprise as an input, we aim to achieve the followingas output: 1) Produce a better architecture to handle risks that threaten thecritical parts of the system. 2) Improved business processes to handle therisks. 3) A way to manage these risks. 4) A set of safety and maintenanceprocedures that can be performed after development.
The methods will use UML-diagrams1 as input and identify threats againstthe critical business functions in the organization that uses the system, sothat it can better protect itself against them. These methods include:
• Failure Modes and Effects Analysis (FMEA)
• Fault Tree Analysis (FTA)
• Hazard and operability study (HAZOP)
• Preliminary Hazard Analysis (PHA)
• Cause-Consequence Analysis (CCA)
Each of these methods will be evaluated with respect to their ability to assessthe reliability of the enterprise, and a selection of methods will be made forthe integration with RUP.
The study will also investigate the possibility of building tools that auto-mate the extended process. These tools can assist the developer through theprocess, making it easier to use and more efficient.
1.2 Report Outline
Chapter 1 gives an introduction to the project.
A description of the results acquired during a preliminary literature study ispresented in chapter 2
Chapter 3 describes the agenda of my project and how the work was con-ducted.
1Unified Modeling Language is the industry standard for modeling software.
14

1.3. DEFINITIONS
From the research done in chapter 2, I will propose a conceptual model toview the relationships between the system, the environment and the require-ments of the stakeholders in chapter 4
In chapter 5 the methods are evaluated on the three qualities, relevancy, us-ability and complexity. I will also show where in the conceptual model of theenterprise they would be most effective in finding risks, and pair them up witha input (either a diagram or a document) to create method configurations.
The method configurations will be extended and altered to provide a betterapproach to finding the enterprise risks in chapter 6, and then these extendedmethod configurations are compared on how well they perform on a set ofrisks and aspects in chapter 7.
Chapter 8 proposes a way to integrate the methods into the RUP by creatinga set of new activities. Chapter 9 will propose several ways to automate theprocess to make it less time consuming. Whilst Chapter 10 will show howthe process may be tailored to one example project.
Chapter 11 gives a discussion of the results of the project, and chapter 12.1includes some concluding words, and a proposal for future work.
1.3 Definitions
1.3.1 System Safety
The field of System Safety is a set of methods and practices to assess the risksconnected with the development and execution of a system, so that we cantake appropriate measures to minimize these risks. System Safety is aboutwhat and how things can go wrong.
System Safety is widely used in traditional engineering fields, but due toobvious differences between Software Engineering and traditional engineeringfields, and the relative immaturity of Software Engineering, few of thesemethods are used in the Software Engineering industry today.
There are mainly two reasons for this. First, many of these methods do nottransfer into the domain of Software Engineering very well. Second, thereis no tradition of using these methods, and they are not a part of existingwell-known frameworks for development of software systems.
15

CHAPTER 1. INTRODUCTION
1.3.2 Rational Unified Process
The Rational Unified Process (RUP) 2 is a process framework developedby Rational Software, now fully owned by IBM. A process framework isa systematic description of the process of software development, defininggoals, tasks, and plans, and distributing work among the participants in theproject. RUP lets the user configure a custom process of development whichis tailored to the projects needs based on proven best practices. RUP providesa web-based electronic process guide that guides the whole development teamthrough the development process.
RUP is based upon the idea of iterative development, as apposed to thetraditional Waterfall process (Figure 2.1). The main focus of RUP is therequirements and the architecture of the system(s).
1.3.3 Enterprise systems
Enterprise systems are systems that integrates the business functions in anorganization to maximize the efficiency and the flexibility of the organization.
1.3.4 Business critical systems
A business critical system is a system that the organization is fully relianton to conduct its business. A breakdown in a business critical system willhalter the business itself.
More and more companies are integrating enterprise scale solutions, connect-ing and optimizing the work flow and communication between departmentssuch as Administration, Stocks, Production etc. This decrease in efficiencycomes at the price of vulnerability. An error in one part of the system cancause severe ripple effects and halter the whole organization as a business.Therefore it is highly important that these risks are identified and taken intothe consideration during the development of the system.
2http://www.rational.com/products/rup/
16

1.4. THE CASE
1.4 The Case
To demonstrate and test the methods, I have constructed a case scenario.The case is an enterprise system at a newspaper consisting of the followingsix subsystems:
The Printing System. Operates the press and printing process.
The Inventory System. Keeps track of inventory and manages purchases.
The Publishing System. This system is used by journalists to publishcontents to the paper and the web page.
The Administration System. Keeps track of advertising-customers, sub-scribers, invoices etc.
The Transport Logistics System. Deals with the distribution of the pa-per after printing.
Web server. Provides a web page where the newspaper can post news.
Figure 1.2 shows the layout of the organization:
Figure 1.2: The case enterprise.
A more detailed description of this case and UML-models can be found inAppendix C.
17

Chapter 2
Prestudy
The project was started by a literature study of the central aspects in thescope of the project. The following section will describe the main issues Ifound important to my study.
2.1 The Rational Unified Process
2.1.1 What is RUP?
RUP is a process framework which takes basis in the iterative process ofthe developing software. The iterative process differs from the traditionalWaterfall process.
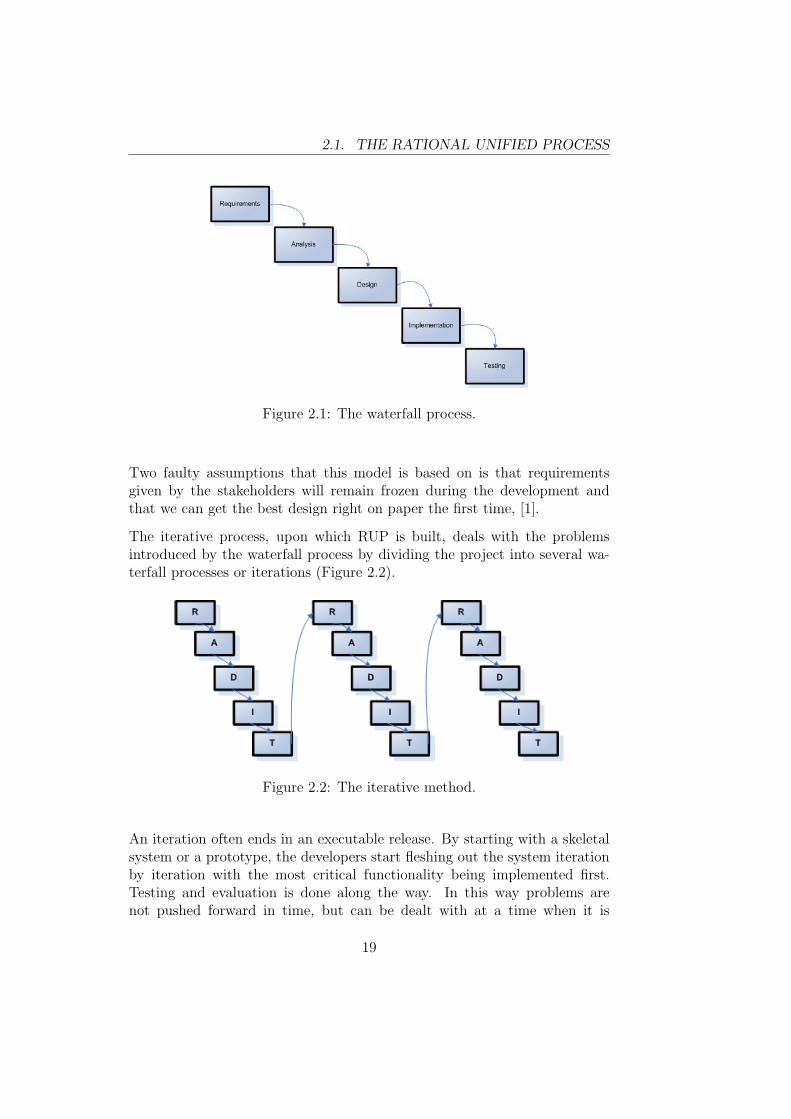
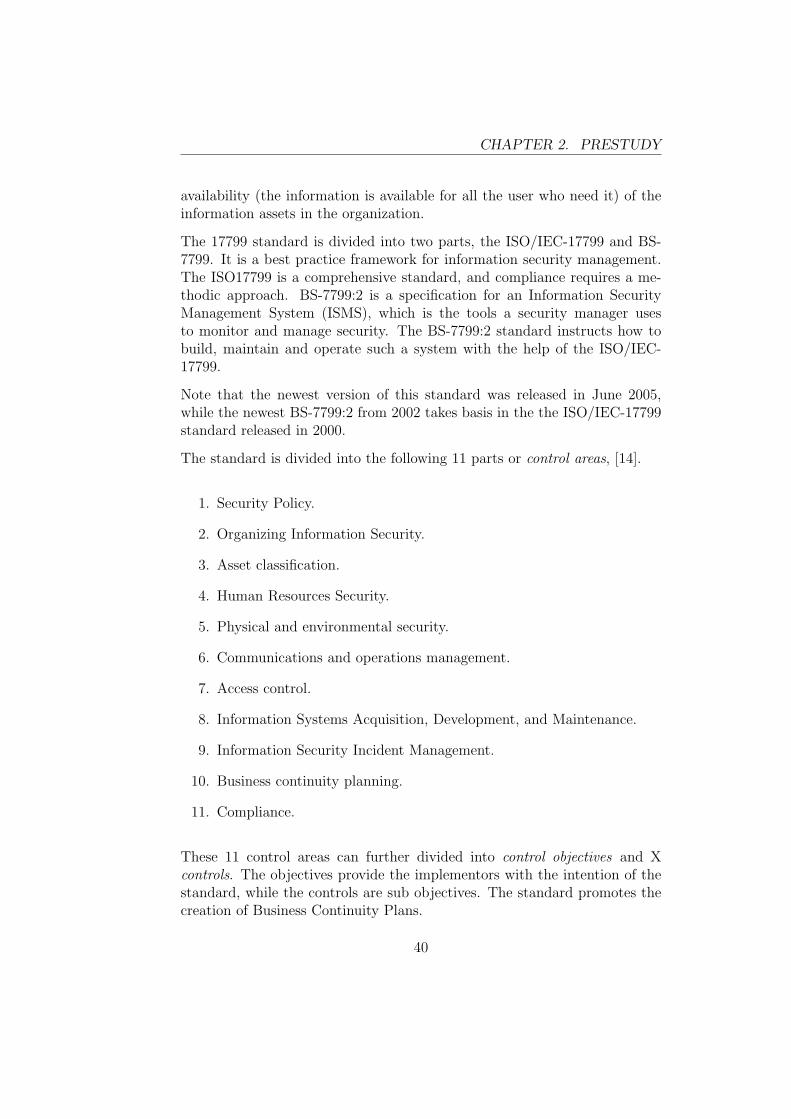
The Waterfall process (Figure 2.1) assumes that you first collect the re-quirements of the system, analyze the problem, then design the solution,implement it, test it and then you are done. Such a process may be effectivefor small software projects where the requirements are clear and the teamfully understands the goals and challenges that exist within the given project.However, when projects scale up and involve multiple end-users and subsys-tems, you may encounter a scenario where during the testing of the system,you find out that this system is not what the end-user wanted, or perhapsthe system do not meet a specific quality requirement and therefore needsto be redesigned. At this point the system is well into its development, andsuch changes are costly and may very well produce new problems. In short,one can say that this process tend to delay the detection and treatment ofproblems.
18
2.1. THE RATIONAL UNIFIED PROCESS
Figure 2.1: The waterfall process.
Two faulty assumptions that this model is based on is that requirementsgiven by the stakeholders will remain frozen during the development andthat we can get the best design right on paper the first time, [1].
The iterative process, upon which RUP is built, deals with the problemsintroduced by the waterfall process by dividing the project into several wa-terfall processes or iterations (Figure 2.2).
Figure 2.2: The iterative method.
An iteration often ends in an executable release. By starting with a skeletalsystem or a prototype, the developers start fleshing out the system iterationby iteration with the most critical functionality being implemented first.Testing and evaluation is done along the way. In this way problems arenot pushed forward in time, but can be dealt with at a time when it is
19

CHAPTER 2. PRESTUDY
easy and manageable to perform the change, with minimal effects on othercomponents.
RUP is divided into four phases :
Inception. Stakeholders agree on requirements and estimate the cost, risk,and schedule of the project.
Elaboration. Establish the architectural base and create an architecturalprototype.
Construction. Construct the prototype into the final system and test it.
Transition. Move the system from development to the end user. This in-cludes activities like hardware installation, staff training etc.
Each of these phases consists of a number of iterations, which in turn are likesmall waterfall projects. The activities performed in the project are dividedinto disciplines. Each discipline creates and uses artifacts, which are centralpieces of information. The RUP-process consists of the following disciplines:
Business modeling. This discipline include activities that analyze, create,refine, and extend the business processes in the organization. In mostcases we do not create the business processes from scratch, but we needto understand them. The discipline is mainly performed early in theproject lifetime. Artifacts include the business model, business visiondocument etc.
Requirements. This discipline includes analyzing and understanding theneeds of the stakeholders and managing the changes in requirements.Just like business modeling, the majority of time spent in this dis-cipline is done early the project, but the management of changes inrequirement is a project-long activity. Central artifacts include UseCase models, requirements specification etc.
Analysis and Design. This discipline is concentrated around the analysisand design of the architecture of the system. Some central artifactsinclude system diagrams and user-interface prototypes. It is performedin all phases, but mainly in the Elaboration phase.
Implementation. The discipline consist of the planning of the integration,the development of components, and the integration of these compo-nents. Some artifacts include the integration plan and the builds. The
20

2.1. THE RATIONAL UNIFIED PROCESS
discipline is mainly performed in the Elaboration and Constructionphases, but plays a role in all phases.
Test. The Test discipline consists of planning, performing, and evaluatingtests of the system. These tests ensure that the components are per-forming satisfactory with such aspects as quality attributes, user re-quirements etc. Typical artifacts are Test Plan and Test Results.
Deployment. This discipline consists of testing the software in its finaloperational environment. The packing, distribution, and installationof the software and training of end users.
Configuration and Change Management. This discipline ensures thatthe project artifacts maintain their integrity. When a change is per-formed it is ensured that this change is updated in all relevant artifacts,that is to maintain consistency between artifacts and the project. Italso adds traceability to the project.
Project Management. This discipline consists of the activities of manag-ing the project, such as resource planning, follow-up etc.
Environment. The Environment discipline are the activities supportingand providing the infrastructure, tools, compilers etc (the environment)needed to develop and test the system.
Each of the phases are divided into iterations. Figure 2.3. shows the iterativeprocess of RUP.
Before the development is started, there is some business modeling and initialplanning. Then the project enters an iterative process of Planning - Require-ments - Analysis and Design - Implementation - Testing - Evaluation. Whenthe development is complete, it is deployed. Typically the inception phaseconsists of a single iteration, elaboration consists of two, construction is di-vided into multiple iterations depending on the size of the project, and lastlythe transition phase is often divided into two iterations, [1].
The amount of work spent in each discipline in each iteration varies overthe lifetime of the project. Typically there is not spent a lot of time on theimplementation discipline in the inception phase (the two first iterations).Figure 2.4 indicates how the workload may vary from iteration to iterationin a typical project. The height of the graphs is the amount of work spentin the given iteration in the given discipline.
RUP is based on the following six best practices, [1].
21

CHAPTER 2. PRESTUDY
Figure 2.3: The RUP iterative process (From www.rational.com).
Figure 2.4: The phases and disciplines of RUP (From www.rational.com).
22

2.1. THE RATIONAL UNIFIED PROCESS
• Develop iteratively.
• Manage requirements.
• Use component architecture.
• Model visually.
• Continuously verify quality.
• Manage change.
2.1.2 The RUP Meta model
The RUP Meta model, shown in Figure 2.5, explains the interrelation be-tween the different parts of RUP. We can use this model to get a short, butconcise overview of the different parts of the RUP process.
Figure 2.5: The RUP meta model.
An artifact is a piece of information that is either used or produced byactivities in the RUP process. Workers take on roles that performs theseactivities and have responsibility for the artifacts. A discipline is a group
23

CHAPTER 2. PRESTUDY
of activities within the same field which are logically grouped together orinterdependent. To each discipline several roles are associated. The workflowdetail is the relation between the different activities within the discipline. Aphase consists of several work flows, and the phases and disciplines togetherconstitute the RUP lifecycle, [16].
As seen in Figure 2.5, the different process elements are either: 1) behavioral,that is something that is performed, like a phase, or 2) structural, that issomething that is physically recorded, like a artifact.
The process is defined by a process model. The process model is madeup by several process components. Each process component is made up byprocess elements. A process component may also be made up by other processcomponents. The process component is a central part of the process as itthe building blocks that project mangers use to construct their own tailoredproject, [16]. The extended process needs to be structured into componentsthat are selectable at the configuration of a RUP-project. The process isstructured as shown in Figure 2.6.
Figure 2.6: The RUP process model.
2.1.3 Extending RUP
IBM promotes and encourages the creation of extensions and alterations ofthe RUP process. They offer the modeling software “IBM Rational ProcessWorkbench”, which lets users tailor their own process within the RUP andcreate plug-ins. The process of making a process is defined by the ProcessEngineering Process (PEP).
24

2.2. CURRENT WORK
Figure 2.7: The RUP extension process.
The extensions process (Figure 2.7) is based on the standard RUP processmodel (Figure 2.6) and a set of requirements for the extended process. Theserequirements are used to define an extended process model. The extendedprocess model introduces new process elements in the current RUP model ifneeded. Perhaps a project needs something to represent a “sub artifact” toclearly indicates that a artifact is a subset of another, the base RUP processmodel does not define such a element.
With basis in this extended process model, we begin creating the compo-nents that constitute the different parts of the extended process. For eachcomponent we create artifacts with associated roles and activities. Finallywe produce a work flow detail, that is a diagram which show the relationbetween the previously mentioned parts, [16].
2.2 Current Work
Before starting my work, I had to do some research to see what current workhad been made in the same field. Not only to build upon, but also to ensure
25

CHAPTER 2. PRESTUDY
that I am not doing anything that is previously done in a satisfactory way.
2.2.1 System Safety in Software Engineering
The use of System Safety methods in Software Engineering is well describedin the literature. Several textbooks have been written in this field, [5], [10],but it has not been widely adopted by the industry.
2.2.2 Reliability analysis in process frameworks
The current efforts in the RUP-framework to handle risk only deals with therisk concerning the project itself. That is the risk of not meeting a milestoneon time etc. This work will focus on the reliability aspect of risk.
There has been some research on how Safety Methods can be integratedin the RUP-process in the Inception phase, [2]. This work focused on howPHA and HAZOP could be used early in the process to produce a SafetyRequirement Specification, which is a document that captures importantsafety requirements. They did not look into other phases of RUP.
Fredriksen [3] proposes an integration with RUP that deals with the relia-bility aspect, not with the specific use of methods from the System Safetyfield, but rather how to use RUP to meet the requirement of the IEC61508standard. The IEC61508 is an international standard for developing safe sys-tems. It addresses functional safety of electrical/electronic/programmableelectronic (E/E/PR) safety-related systems. Likewise, there has been donework on integrating the same standard with Extreme Programming (XP)process framework, [4].
The CORAS-methodology combines Unified Process (UP) and UML to de-velop security critical computer systems, [15]. IT-security is the confiden-tiality, integrity, availability, and accountability of information. This is onlya subset of the field of “business critical systems” which not only considersinformation security, but also threats to all aspects of the computer systemsthat may cripple the business, that being processes, resources, legal obliga-tions etc. Also the CORAS-methodology aims at general computer systems,while this methodology will concentrate on Enterprise systems. The CORAS-project ran from 2001 to 2005.
26

2.3. RISK
2.2.3 RUP-Extensions
There exists a wide range of extensions created to RUP, both by IBM them-selves and different third party companies. These often concern the use ofspecific technologies (Web services, .NET, Java etc) or specific fields of de-velopment (Web development etc). The most famous extension is perhapsthe “Enterprise Unified Process” (EUP), which helps the enterprise organi-zations manage software after it is developed as well as during development.This is done by introducing the two new phases, “Production” and “Retire-ment”, as well as a set of disciplines like “Strategic reuse”, “Software processimprovement”, and “Enterprise Administration”.
2.3 Risk
2.3.1 What is risk?
A risk is the possibility of something (usually negative) that may happen inthe future, [11].
2.3.2 Risk terminology
A hazard or a threat is a is a set of conditions that may lead to an undesirableevent. Risk can also be viewed as the probability of an threat or hazard tooccur (its likelihood) multiplied with the consequence, also known as thecriticality.
Risk management is the process of identifying, prioritizing, recording, treat-ing, and monitoring risks, [12].
Risk managers must consider two dimensions of risk, its consequence andits possibility, and find a balance between these two. Risks can be dividedinto two groups, accepted and unaccepted risks. Risk managers will have totransform unacceptable into acceptable risks (Figure 2.8). This is called riskmigration or mitigation, and can be done in two dimensions. You can try tolimit the consequences of the risk, and you can try to lower the possibility ofthe risk to occur.
A fault is a undesirable state of the system, a failure is the loss of function-ality in a system. A fault may not result in a failure, but failure is always
27

CHAPTER 2. PRESTUDY
Figure 2.8: Risk migration.
caused by faults. A secondary failure is a failure that is caused by stress ex-ceeding the levels in which the system-component is designed for. A primaryfailure is a failure the occurs even tough the the component is not pushingits stress levels. That is a component which is incorrectly designed, selected,or installed.
2.3.3 Risk Management
Risk management can be divided into a set of activities, [17]:
Identify. The identification activity is to discover the risks that face thesystem. This is done by gathering data about about the system.
Analyze. The analysis of risks is taking the gathered risk data from thesystem and turning it into decision-making information.
Plan. The planning activity deals with how we handle the risk. That isto make decisions and actions out of risk information. There are fourways to deal with a risk:
1. Change the design.
2. Create a plan to handle the risk.
3. Accept the risk.
4. Transfer the risk.
28

2.3. RISK
The first possible action is to change the design of the system, thatis to build a barrier into the system or rework the architecture to re-duce the risk. The second action is to accept the risk and prepare forit by creating plans. This includes plans that minimize the chance ofoccurrence of the risk (maintenance plans) and plans that tell the orga-nization what to do when the risk is realized (emergency plans). Thisis an option when the cost of taking a well prepared risk is cheaperthan to redesign the system.
The third option is to accept the risk and do no planning for it. Inthese cases the criticality of the risk is so low that neither planning orredesigning is worth the effort.
The last option is to transfer it, that is to pass the responsibility theanother part. One example of risk transferal is insurance.
Track. Risk tracking is the activity of recording and monitoring the risks.All risks uncovered should be organized and available for the people whoneeds that information, and there should be some “watchdog mecha-nism” that alerts the organization when a risk has triggered.
Control. Risk control is the activity of implementing and controlling theplans and policies.
Communicate. The activity serves the need to communicate the risk tothe the involved parties, that being workers, customers etc.
It is important to remember that the job of the risk manager is not to min-imize the occurrence of every risk, which is something that might seem ra-tional for someone new to the field. Rather, the goal is to minimize the crit-icality. For most companies in the world, criticality is measured in currency.We do not need to construct the most sophisticated fire-prevention systemin the world (likelihood reduction) when we can simply sign an insurance.
However, there is more to the job of the risk manager than considering dollarfigures, the one factor that really complicates the work is the value of humanlife. By setting the value unlimited every possible safety feature concerninghuman safety considered would be implemented, this forces companies to puta value on human life.
29

CHAPTER 2. PRESTUDY
2.3.4 Risk Management Process
The risk management process (Figure 2.9) describes the interrelation of ac-tivities which is performed in the risk management discipline. It is the sys-tematic application of these activities. It is this process we want to matchas closely as possible with the RUP-process.
Figure 2.9: The risk management process, [18].
The first thing done before the analysis is the definition of the scope. Thescope defines how deep into the system, or out of the system, we should gowhen finding risks.
Risk identification means verbalizing a possible threat: “There could be afire in the reactor”. Analyzing the risks means finding the consequences ofit: “That would halt our production for days.”
Consulting means that we need to consult the people with specific compe-tence to help us find the criticality of the risk: “Call the chief engineer and
30

2.3. RISK
ask him about the possibility of fire”. It is not required, nor expected, thatthe risk analysts have complete knowledge about every aspect of the system.
Risk evaluation means giving the risk qualitative or quantitative data toevaluate the severity: “A fire would happen every year on average, and thereis a 75 percent chance that a fire would stop production for a week or more”.
Treating the risks means taking appropriate actions to handle it: “We needto install fire extinguishers near the reactors”.
Communication is about telling the people who is involved with the risksabout it: “Propose for the management that they order eight fire extinguishersand set up a training session for the workers.”
Risk monitoring is about keeping track of the risks, this is mainly done byrecording the risks so they can be accessed at later stages. When recordingthe risks, it is usual to use the risk management matrix, which is a table thatstores one risk for each row, and has multiple columns describing propertiesof the risk. These properties should include:
• A unique ID to represent the risk.
• A description of the risk.
• The source of the risk.
• The criticality of the risk (likelihood, consequence).
• Preventive measures.
• Who is responsible for the risk.
And of course, any other properties that might be relevant for the givensystem. In our case, working with software components and classes, it wouldperhaps be wise to link the risks with these entities.
2.3.5 Risk lifecycle in RUP
Risks are not static across the development timeline. Every time we changesomething in the system, we open the possibility of new risks being inducedin the system. The risk manager needs to know when and how new risksmay be induced in the system to handle them. Figure 2.10 shows a schematic
31

CHAPTER 2. PRESTUDY
Figure 2.10: RUP Risk lifecycle.
overview of how risks are induced and mitigated during a typical RUP projectlife cycle.
Before the project is started, there exists a set of risks in the enterpriseenvironment. These are risks that still will be present when the system isfully developed and installed, like fires, theft, regulations etc.
The iteration starts out by creating a set of requirements that express thefunctionality of the system. These requirements can both mitigate risksand create risks, or both. Consider the requirement “The user should ableto shutdown the system with a button”, this requirement may have beenimplemented to shutdown the system during a malicious attack from a hacker,yet it also induces the risk of someone shutting down the system by accident.
When the requirements are complete, the analysis and design can start. Inthis process the architects create a design to meet the requirements. Thisdesign creates and mitigates a set of risks. For example a buffer used incommunications will produce risks of overflow, or a component for networktrafficking opens the possibility of unwanted external access.
In the design and analysis phase, some of the requirements may be altered.Maybe the architect didn’t understand the requirements, or perhaps some ofthe requirements are achievable. These changes in requirements will createand/or mitigate risks. When the design is complete, the implementationphase can begin. This phase may also spawn changes in requirements anddesign, which in turn mitigate and create new risks. Finally the system is
32

2.4. ENTERPRISE SYSTEMS
tested, and this phase may also spawn changes in requirements and design,as this is the first time that the system is run in full and therefore coulduncover a set of problems that was not present earlier.
The result of this life cycle is that for every change we do in the system,we should consider its repercussion. It may spawn new risks, or change thenature of other risks. It would be very beneficiary to associate the risks withsystem entities (components, classes, subsystems etc) and other risks. Inchapter 9 I will propose a way to do this.
2.4 Enterprise Systems
2.4.1 The nature of Enterprise Systems
What are the important characteristics of Enterprise Systems? By knowingthis we can use this information to create a better process.
In [7] we see that the typical Enterprise Systems are net centric, that is, theyuse a client-server architecture. This is logical as many users need to accessthe same information in the enterprise system. By storing the data centrally,it is easily accessed by users across the organization. Not only over LAN,but also over the internet, as organization can span over large geographicdistances. Enterprise solutions can also connect to other organizations forbusiness to business commerce and collaboration. Enterprise systems aretherefore highly distributed systems with a high degree of information flowand many transactions.
A study of large companies using enterprise systems showed that 70-80 per-cent of all transactions was made in legacy1 systems, often developed in oldlanguages like COBOL2, which means a lot of effort in the development ofan enterprise system is connecting old systems with new, [8].
1Computer systems or application programs which are outdated and incompatible withother systems, but are too costly to replace or redesign. They are often large, intimidating,and difficult to modify. -http://www.rigi.csc.uvic.ca/Pages/description/glossary.html
2Common Business Oriented Language. Programming language developed in the 1960sfor the creation of financial and administrational software.
33

CHAPTER 2. PRESTUDY
2.4.2 Enterprise Architectures
I came across two different ways to view the enterprise systems from an ITarchitectural point of view: The Enterprise Information Architecture andthe Enterprise Information Infrastructure.
Enterprise Information Architecture.
In [7] an architecture for defining the enterprise system is proposed. TheEnterprise Information Architecture (Figure 2.11) is a layered frameworkthat expresses the different parts and considerations in an enterprise systems.
Figure 2.11: The Enterprise Information Architecture.
Environment. Factors that affect both technical and business requirements.These include both internal and external factors. Internal environmen-tal factors can be business strategy or profit considerations. Externalenvironmental factors include governmental regulation and local busi-ness culture.
Business requirements. The business needs of the organization.
Data Architecture. The structure of the organizations data need, bothrelations and entities. Who consumes and produces what?
34

2.4. ENTERPRISE SYSTEMS
Application. The applications that provide the members of the organiza-tion with the tools to perform their business functions.
Infrastructure. Software systems that are used by several applications.
Systems software. 3rd party systems needed to run the system. (data-bases, operating systems etc)
Hardware/Network. The physical infrastructure needed to run the sys-tem. (computers, mainframes and telephone lines etc)
An enterprise system is a complicated structure which has issues on all ofthese planes or views.
Enterprise Information Infrastructure.
[8] proposes another layered framework, the Enterprise Information Infrastruc-ture (Figure 2.12). It depicts on what levels of the enterprise the informationmay be viewed at.
Figure 2.12: The Enterprise Information Infrastructure.
Application. The applications that enables the end-users to perform theirbusiness functions.
35

CHAPTER 2. PRESTUDY
Communication. Systems providing online information.
Computing. Physical processing of information.
Internet. Managed online transport of data between computers.
Computer networks. Physical transport over public telecommunicationlines.
The Application layer can be divided into five distinctive relations, or waysto conduct business. These include:
• U2A - User to Application (client applications etc).
• A2A - Application to Application (automated processes etc).
• B2B - Business to Business (integrated logistics systems etc).
• B2C - Business to Consumer (online stores etc).
• C2C - Consumer to Consumer (auctions etc).
These layers are of course not neatly partitioned in the enterprise system,rather the system is a soup of all these, which makes it very hard to separateone technology from another, [8]. This architecture gives a better technicaloverview, than the EIA. The EIA on the other hand takes a more socio-technical approach.
2.5 Enterprise Risk
2.5.1 Common enterprise risks
What are the main risks facing an enterprise system? By identifying theserisks, we can rate the system safety methods based on their ability to uncoverthese risks.
36

2.5. ENTERPRISE RISK
Loss of service
The most prominent risk facing businesses, according to [12], is failure tosoftware and hardware. Loss of service is the condition that occurs whena user is trying to use a service in an information system and the servicedoes not respond or give the wanted functionality. A service may be locatedin-house or purchased from a vendor. Enterprise systems are often highlyservice-oriented.
Legacy integration problems
Most organizations sit on a vast collection of old computer systems. Beforetechnology and infrastructure made it possible to create integrated enterprisesolutions, each of the departments had their own computer system, oftenmade by different vendors. When these organizations wants to integratetheir business functions, they may have to keep many of these old systems(legacy systems) for economical or practical reasons. This introduces a wellknown problem in the enterprise domain, the legacy integration problem.Getting the systems, new and old, integrated without any problems.
The integrations problems can divided into two kinds: 1) Putting together(using glue code3) the developed parts and the legacy parts (a developmentalissue) and 2) Getting these components to run smoothly with each other (Aconfiguration-time/runtime issue). When developing enterprise systems, onewill encounter both.
Loss of vital data
A very prominent risk facing modern organizations is data loss. When data isstored centralized and made accessible for many parts, it is harder to protectthe data, [8]. It is estimated that for every hour downtime in the averagebusiness in the UK industry costs £450 000. The probability of surviving adowntime steadily increase by the hour. After 72 hours, the chance of losingthe business is 40 percent. One of the largest contributing risks here is theloss of vital data. Governmental compliance requires businesses to deliverinformation about the business for tax, legal, and corruption reasons. Bynot delivering this information, the business may be heavily fined, or even be
3The code required to glue the components together, that is to create interfaces thatenables them to communicate.
37

CHAPTER 2. PRESTUDY
forced to close down. This means that the business has to put a value on theirdata, and protect them thereafter. Much of the information in the enterprisesystem fit the label of “business critical information”, such as customer-listsand invoices. The loss of vital data can be disastrous for the organization,and is a considerable risk.
Network failure
Enterprise systems are distributed systems that rely on network infrastruc-ture for communication. A network failure will cripple the organization.
Ripple Effects
Ripple effect is not a risk per se, but rather an effect that describes the risksin their “ability” to propagate and multiply. The interconnectedness of theenterprise systems means that many problems that arise locally will not beisolated, but will cause ripple effects that spread throughout the system.
Human errors and risks
Many routines will be automated in the integrated enterprise environment,but still humans will play a considerable part of the organization, and, wherehumans are present, the risk of human errors is present. An employee mightpunch in the wrong data etc. Employees might not only harm the companyby undeliberate actions, but also deliberately. A disgruntled employee maysteal sensitive data and sell it to competitors.
2.5.2 Business Continuity Planning
The safety of a business critical system is more than just the barriers andsafety features built into the system. It is also the maintenance and safetyprocedures that is done post development. Business Continuity Planning isa methodology for backing up and restoring business functions once they aredown. Its phases are shown in the figure below (Figure 2.13).
An important task in this field is to identify critical business functions andprotecting them. The first phase is assessing the risks, that is, finding thesecritical business functions.
38

2.6. RELEVANT STANDARDS
Figure 2.13: The business Continuity Planning.
The second phase is recovery planning. This is to decide what we need to doto get this unit up and running again. How much and which resources areneeded etc. The third phase is writing the recovery plans, which are docu-ments that describe how to handle an failure in the system. Which teams canhelp who? Which external services and vendors do we need to contact? Thefourth phase is testing and maintenance of the plans. The plans’ feasibilityis tested, and the staff is trained to deal with given situations, [13].
When working with consistency business plans in highly distributed envi-ronments, such as enterprise systems, it is important to find all interdepart-mental dependencies, all external dependencies, and outsourced operationsbefore starting. This is done so we can easily spot the consequences of onefunction failure and the possible causes, [13].
2.6 Relevant Standards
Established standards provide a good source of best practice. By investigat-ing the standards closely related to my research, I might be able to borrowvaluable parts.
2.6.1 IEC l7799 - Information Security
Information security is the confidentiality (only the people with access tothe data should read it), integrity (the data is not tampered with), and
39
CHAPTER 2. PRESTUDY
availability (the information is available for all the user who need it) of theinformation assets in the organization.
The 17799 standard is divided into two parts, the ISO/IEC-17799 and BS-7799. It is a best practice framework for information security management.The ISO17799 is a comprehensive standard, and compliance requires a me-thodic approach. BS-7799:2 is a specification for an Information SecurityManagement System (ISMS), which is the tools a security manager usesto monitor and manage security. The BS-7799:2 standard instructs how tobuild, maintain and operate such a system with the help of the ISO/IEC-17799.
Note that the newest version of this standard was released in June 2005,while the newest BS-7799:2 from 2002 takes basis in the the ISO/IEC-17799standard released in 2000.
The standard is divided into the following 11 parts or control areas, [14].
1. Security Policy.
2. Organizing Information Security.
3. Asset classification.
4. Human Resources Security.
5. Physical and environmental security.
6. Communications and operations management.
7. Access control.
8. Information Systems Acquisition, Development, and Maintenance.
9. Information Security Incident Management.
10. Business continuity planning.
11. Compliance.
These 11 control areas can further divided into control objectives and Xcontrols. The objectives provide the implementors with the intention of thestandard, while the controls are sub objectives. The standard promotes thecreation of Business Continuity Plans.
40

2.7. REPRESENTATION OF UML-MODELS
We can use this standard to better understand which aspects that are im-portant to consider when dealing with information. My goal is to use theparts that are important for general enterprise architectures, yet keep thisprocess as simple and light weight as possible. If an organization has a veryhigh information security need, such as a medical office or a public office,they can implement this standard beside the extended RUP-process.
2.6.2 IEC 61508 - Functional Safety
Functional safety is protection from equipment and systems operating in-correctly. The 61508 is a best practice standard using functional safetyin development of electrical/electronic/programmable electronic (E/E/PR)systems. The standard proposes framework for the complete life-cycle fordevelopment, which includes phases like planning, realization, installation,operation, maintenance etc, [3].
This is industry standard practice when dealing with systems that has sen-sors, controller logic, communications, and actuators. Typical systems in-clude auto pilots, elevator systems, fire prevention systems etc, which isfundamentally different from enterprise systems. That is not to say that wecould not use it, but that we may find a better solution based the nature ofenterprise systems.
When defining functional safety, we must 1) Define the safety function re-quirement (what the function must do) and 2) Define the safety functionintegrity requirement. (What is the highest risk level we can accept on thisgiven function), [3].
This makes sense, because as described in section 2.3.3, we do not haveto protect ourselves against every risk, rather we must weigh the cost ofprotection, and the cost taking the risk.
In my extended process, it would be wise to include something of this manner,that puts a criticality level on the business functions, resources etc in theenterprise. This is done in section 4.2.
2.7 Representation of UML-models
RUP aims to minimize the documentation created by the process and tostore and represent as much as possible in UML-models. We may have the
41

CHAPTER 2. PRESTUDY
need to store information between phases in the process and even createour own tools. We have the ability to do this with the XMI format forstoring UML-models, by using so called XMI-extensions. This means wecan store information and access it without ruining the models readability inother modeling-tools (Enterprise Architect, Magic Draw, Rational Rose etc).These programs will ignore our extensions, just as our tools would ignoreextensions made by other modeling-tools, [9].
42

Chapter 3
Research
3.1 Research agenda
The following sections will describe my agenda for this study. I have sep-arated the work into three distinct tasks. First I will choose the methodconfigurations, then I will propose an integration with the RUP-frameworkbased on these configurations and, finally, I will evaluate this process’ poten-tial of being automated.
3.1.1 Choosing method configurations
The methods will be evaluated by a series of criteria:
Relevancy
First I want to find out how well this method fits my goal of integratingSystem Safety and RUP. This will later help with the integration effort.
1. How well does a particular method suit the Software Engineers generalneeds?
2. What type of UML-diagram(s) can this method take basis in?
3. What kinds of faults could the method uncover?
43
CHAPTER 3. RESEARCH
4. What kinds of faults could the method fail to uncover?
5. Where in the conceptual model of the enterprise would the method fitin (See Chapter 4)?
Complexity.
Some methods may be relevant, but are too complex. I will therefore inves-tigate the complexity of each method.
1. How much resources does the method need?
2. How long will it take to perform?
3. How much documentation is needed and produced?
4. What is input and output of the method?
Usability.
Some of the methods may be performed in collaboration with stakeholders,therefore the usability aspect of the method may be important.
1. How much training is needed to use the method?
2. How easy is it to train participants?
When the methods have been paired up with diagrams or documents, whichthey can take basis in, we have a set of method configurations. These con-figurations will then be evaluated, to see which are fit for integration withRUP.
Finally, the configurations will be evaluated on a selection of relevant crite-ria in tree categories: Enterprise risks, general software risks, and processaspects.
44

3.1. RESEARCH AGENDA
1. Enterprise risks.
How well do the configurations perform on these six key risks that hauntenterprise systems?
• Loss of service.
• Legacy integration problems.
• Loss of vital data.
• Network failure.
• Ripple effects.
• Human errors.
A description of these risks are found in section 2.5.1.
2. General software risks.
How well do the configurations perform on the following five well known risksthat haunt general software systems?
Storage capacity problems. Problems that arise when a application isnot able to store data, mainly because of the lack of storage space.
Transport capacity problems. Transport capacity problems occur whenthe bandwidth of the infrastructure cannot handle the load.
Process capacity problems. Process capacity problems occur when thesystems cannot handle more workload. A typical example would be atransaction based system breaking down due to many transactions.
Information semantic/syntactic errors. Information semantic errors oc-cur when a user or a system interprets information wrongly by giving ita different meaning than the originator intended. Information syntaxerrors occur when a system interprets information using the anothersyntax (structure) than the originator used.
45

CHAPTER 3. RESEARCH
3. Process aspects.
How well do the configurations perform on the following five aspects thatmeasure the methods ability of being smoothly integrated with RUP.
Required method knowledge. Some methods are easy to use and canbe easily taught to inexperienced participants right before the methodis performed, whilst other methods require that the participants haveexperience.
Required system knowledge How much knowledge about the system isrequired to perform the system? That is, both technical and socio-technical.
Time consumption. How much time does it take to perform the method?
Relations to preexisting artifacts. Can we use any of the preexisting ar-tifacts in RUP as input to any of the methods? This would make themethod less time consuming compared to other methods.
Documentation generation and consumption. RUP aims to minimizethe amount of documentation produced. Therefore we will rate themethods on how much documentation they need as input, as well ashow much they produce.
3.1.2 Propose an integration
How can we best integrate the evaluated method configurations with theRUP-framework? This question in turn raises several other questions:
1. Which configurations can be used together?
2. Which configurations have overlapping features?
3. Which configurations complement each other?
4. Which configurations can be used in which phases?
5. How do these configurations affect the different disciplines in RUP?
6. Can we create several profiles (configurations of method-configurations)thattend to different needs?
46

3.2. RESEARCH PROCESS
7. How can we store relevant information during the process?
8. How do the configurations relate to the RUP-disciplines?
3.1.3 Evaluate possibilities of automation
When the process is created we must see if we can make it more efficient andeasy to use by automating it. We will systemically consider the followingaspects:
Input/Output
1. What kind of input would this tool need and how would it get it?
2. What kind of output will this tool produce and how will it representit?
3. What would the interface look like?
Gain
1. Is there much to be gained by automating this configuration?
2. Will it make the integration with RUP easier?
3. Can the knowledge gained during the process be saved?
3.2 Research process
3.2.1 Choosing method configurations
The process is described in Figure 3.1.
The first thing we do is to find a configuration of method and input. We willinvestigate different configurations until we find a configuration which suitssoftware engineering, meets the requirements set down (see section 3.1.1),and performs satisfactorily on the case.
47

CHAPTER 3. RESEARCH
Figure 3.1: The process of choosing method configurations.
48

3.2. RESEARCH PROCESS
After this process, we have a set of configurations, which then will be ex-tended and altered to better assess enterprise environments. These extendedconfigurations are again tested against a set of risks and aspects, and anyconfiguration that performs unsatisfactorily, is discarded.
3.2.2 Propose a integration
Based on the questions previously listed in 3.1.2, I will propose an integrationof RUP and the configurations. (Figure 3.2).
Figure 3.2: The integration process.
“Create a process based on requirements” can further be divided into thefollowing tasks (Figure 3.3). This process is a coarse version of the RUPextension process (Figure 2.7).
First I will decide which information that is needed by the process (input)and which information that needs to be created (output). Then I will be seewhether the process model of RUP needs to be extended with more elementsto capture my requirements. After this, the process will be divided intoartifacts, roles, and activities to handle the input and create the output.The activities will be grouped into components, and finally I will distributethe work in the RUP lifecycle.
49

CHAPTER 3. RESEARCH
Figure 3.3: The process of creating a process based on requirements.
3.2.3 Evaluate possibilities of automation
When we have a set of configurations and an integrated process, we may lookfor ways to automate it. The main reason for automation is to minimize thetime spent in the risk analysis. A more effective approach translates into amore focused risk analysis, and more time to risk analysis, if needed.
Figure 3.4 shows the process of automating the extended process. Theprocess is to propose an automation and continually altering it to suit aset of requirements which are defined in the next section.
3.3 Requirements
When creating the extended process, I will base it on a set of requirementsthat are defined to ensure satisfactory integration.
50

3.3. REQUIREMENTS
Figure 3.4: The automation process.
3.3.1 Method evaluation
If needed, alterations should be performed on the methods and the followingrequirements are proposed to ensure an effective method:
Requirement Source NotesThe configurations should be suited for soft-ware engineering.
Aim of study None
The configurations should be suited for Enter-prise risk assessment.
Aim of study None
The configurations should be suited for use inthe RUP process.
Aim of study None
Table 3.1: Method evaluation requirements.
3.3.2 Process integration
The following requirements is proposed to ensure a good integration withRUP.
51

CHAPTER 3. RESEARCH
Requirement Source NotesThe process should not produce large amountsof document
RUP A RUP feature
The process should be if possible customizable RUP A RUP featureThe process should incorporate the risk man-agement process
Risk management None
The process should not loose track of risks be-tween phases and iterations
Risk management None
A system or environmental change, shouldspawn a investigation to find new risks, or tosee if any related risks are changed by this ac-tion.
RUP risk life cycle See section2.3.5.
The process should start with an assessmentof the criticality of the enterprise.
IEC61508 None
The process should offer the possibility tomake maintenance plans.
IEC61508 None
The extended process should be integratedas seamlessly as possibly with the preexistingRUP-process. That is use as much informa-tion already captured by the RUP-process aspossible. If possible, the process will use pre-existing artifacts and have logical connectionswith the current disciplines and phases.
BUCS BUCS choice offocus, [22].
The process should offer the possibility to cre-ate Business Continuity Plans
IEC1799 The standardpromotes theuse of BCPs
The Business Continuity Plans should take ba-sis the critical functions in the enterprise
BCP See 2.5.2
The process should use System Safety methodsthat most easily uncovers typical risks in theenterprise setting
Aim of study None
All the methods should record the risk in thesame format, with the same properties andquantities
None For the sake ofsimplicity
Table 3.2: Integration requirements.
52

3.3. REQUIREMENTS
3.3.3 Automation of process
The following requirements are proposed to ensure a good automation of theprocess.
Requirement Source NotesThe automation should make the process moreefficient.
None None
The automation should make the process eas-ier to perform.
None None
Table 3.3: Automation requirements
53

Chapter 4
Defining a conceptual model ofthe enterprise
This chapter will introduce a conceptual model of the enterprise, as well asan assessment method that uses this model to identify the critical parts ofthe enterprise before the other methods are applied. The latter will ensurethat the all of the risk analysts have knowledge about the enterprise beforebeginning the analysis.
4.1 A Conceptual model
We use conceptual models to describe complex entities in an attempt toreason about and understand them.
The enterprise organization can be viewed as a set of business goals whichis realized by a set of functions. These functions consume, refine, and createresources (Figure 4.1). Resources in an enterprise setting is mainly infor-mation. Business functions report to management, which in turn definesthe business goals. The business functions use infrastructure for support toperform their function.
We can introduce a conceptual model of the enterprise as a whole, bothencompassing the system and the organization (Figure 4.2). The model goesfrom generality to speciality as it goes from the top to the bottom.
The requirements of the system is realized by a system, consisting of one ormore subsystems, which in turn is divided into software components. The
54

4.2. THE ENTERPRISE CRITICALITY ASSESSMENT
Figure 4.1: The enterprise organization.
requirements are also realized by a set environmental aspects like enterpriseresources, infrastructure etc. Later, when we need to make a selection ofmethods to include in the process, we can use this model as a way to ensurethat our pick does not skip essential parts of the enterprise.
Figure 4.2: A conceptual model of the enterprise.
4.2 The Enterprise Criticality Assessment
Before any of the methods are performed, the analysts should have an overviewof which parts of the organization that are critical. The Enterprise CriticalityAssessment is a document that captures the critical parts of the organization.
As described in the previous section, the enterprise organization can be
55

CHAPTER 4. DEFINING A CONCEPTUAL MODEL OF THEENTERPRISE
viewed as a set of business goals which is realized by a set of operations.These operations consume, refine, and create resources (Figure 4.3).
Figure 4.3: The enterprise.
When looking at business critical aspects of the system, we can use this as aplatform. When the system consists of business goals, operations, infrastruc-ture, and resources, a business critical system has to have either criticalbusiness goals, critical operations, critical infrastructure, or critical resources(Figure 4.4).
Figure 4.4: Critical business processes.
When the goal of the extended process is to protect the business-criticalityof the system, it would be to great help to identify the critical parts fromthe non-critical. This way we may more easily locate relevant risks anddo not have to use to much time on the non-critical parts, which wouldbe counterproductive. The Enterprise Criticality Assessment is a documentthat captures the critical aspects of the systems environment. The documentsimply lists the following:
• Critical resources.
• Critical business functions.
56

4.2. THE ENTERPRISE CRITICALITY ASSESSMENT
• Critical business goals.
• Critical Infrastructure.
Also, I will introduce a way to grade how critical the critical resources, busi-ness functions and infrastructure are. This way, when the risk analyst finda risk threatening one of these, they can look up in this document to see towhat degree they need to protect it.
There are two kinds of criticality, the availability and the value. Availabilityis to what degree it is important to have the aspect available, whilst value,how valuable the aspect is to the organization.
Business functions, resources, and infrastructure has the quality of availabil-ity, which can be divided into three:
1. High availability - Should be available 24/7. Should never becomeunavailable, or at least be available within a minuscule amount of timeafter it has broken down.
2. Medium availability - Should be up and running within a short periodsi.e couple of hours. If needed, the time should be specified.
3. Low availability - Some downtime is tolerated, it should be up andrunning within a working day. If needed, the time should be specified.
When it comes to value, only resources have this quality. The value of in-frastructure and business functions, lies in their availability. But, with re-sources such as information, we can both loose access to them, and we canloose them altogether. Value is divided into three:
1. High value - The resource cannot be lost, it is unique.
2. Medium value - The resource is reproducible and may be lost, butmust be reproduced within a short time. If needed, the time should bespecified.
3. Low value - The resource is reproducible and may be lost, but don’thave to be reproduced within a working day or more. If needed, thetime should be specified.
If we consider the newspaper enterprise system example, we can define thefollowing critical aspects (the criticality levels is defined in the parentheses).
57

CHAPTER 4. DEFINING A CONCEPTUAL MODEL OF THEENTERPRISE
Availability ValueBusiness Functions Yes No
Resources Yes YesBusiness goals No NoInfrastructure Yes No
Table 4.1: Business aspects and their critical qualities
Critical Resources:
• Invoice Information (LA, HV).
• Subscriber Information (MA, HV).
• Newspaper Contents (HA, HV).
• Paper (MA, MV).
• Ink (MA, MV).
Critical business functions:
• Get newspaper to consumer (MA).
• Host web page (MA).
• Bill customers (MA).
Critical business goals:
• Maintain operability of 99 percent.
• Avoid lawsuits caused by personal infringement.
• Maintain 20 percent market share.
Critical Infrastructure:
• LAN (MA).
• The press (MA).
58

4.2. THE ENTERPRISE CRITICALITY ASSESSMENT
• The mainframes (HA).
• Electricity (HA).
One might argue that paper and ink falls out of the Software Engineeringdiscipline as it is a physical resource, and computer systems use informa-tion as their resource, but as long as the administration and purchase ofthese resources falls under the system, and the printing system is reliant onthese resources, we must consider them. In the next section I will presentthe methods. Keep in mind then, that all of these methods should be per-formed after the enterprise criticality assessment is performed and read bythe method-performers.
59

Chapter 5
Method Evaluation
This section will present and evaluate each of the proposed methods. Most inthe presentations of the methods are taken from [6], unless other is specified.
The methods will be paired up with a input (a document or a diagram) toform a configuration. The configurations will be chosen so that they focus ondifferent parts of the conceptual enterprise model. The idea is to have a setof configurations that each, more or less, is specialized in one of the aspectof the enterprise, and together complement each other.
5.1 Preliminary Hazard Analysis (PHA)
PHA (Preliminary Hazard Analysis) is a method performed to find risks earlyin the planning of a system and is often the basis for later work in the riskanalysis. The PHA is done by listing dangers associated with each of theelements in the system. For each danger found, the possible causes, conse-quences, and severity of the danger are recorded. The method is performedby three consecutive steps:
1. Collection. The collection will be done very early in the design of thesystem. Not every detail will be known about the system, but thedifferent subsystems should be known, as well as the main interactionsbetween them. If the method has been performed on similar casesbefore, the information from these cases may be of value for the currentone.
60

5.1. PRELIMINARY HAZARD ANALYSIS (PHA)
2. Analysis. First we identify every danger that threatens the system. Thenwe list the possible causes that can produce the situation, their con-sequences, and a proposal for minimizing or removing the threat. Allof these scenarios will then be rated by their severity. You may alsoadd other factors that may be relevant at a later stage, such as cost toimplement etc.
3. Documentation. The output of the method is a table that lists theresults found in the analysis.
In the general method the following aspects should be considered, [6]:
1. Dangerous equipment and materials (such as poisonous materials andcutters)
2. Environmental risks (such as natural catastrophes)
3. Process-risks (such as fires etc)
4. Safety related equipment. (Fire extinguishers, protective wear etc)
5. Operation, maintenance and emergency procedures (Human errors,maintenance procedures etc)
These aspects are important in many engineering disciplines, but when look-ing at business critical software systems in the enterprise, we are better offby creating our own list of important aspects. These extensions will be de-scribed later in the “Extending the methods” chapter. The risks found willbe recorded in a table such as Table 5.1.
Danger Cause Consequence Severity Prev. action(s)Database isdown
Power failure Loss of business Critical Purchase and installUPS 1 for databaseserver
Database isdown
Server is down Loss of business Critical Keep database at twodifferent servers
Table 5.1: An example PHA output.
61

CHAPTER 5. METHOD EVALUATION
Relevancy
This method suits the software engineer’s needs as modern computer softwareis composed of subsystems/components that interact with each other. It cantake basis in the UML Use Case Diagram or Class Diagram. The methodshould probably be performed before the Class Diagram is finished, since thearchitecture of the system will be affected by the changes made to minimize orremove the dangers uncovered by the method. That is not to say that the thismethod couldn’t and should’t be used with the Class Diagram, but ratherthat the method should be applied to Use Case Diagrams first. Anotherimportant issue is that when we do the iterative process, we need to dividethe functionality into pieces that we implement, I think that it is mucheasier to divide an Use Case Diagram into chunks of functionality comparedto the Class Diagram. Also since this method should be performed when arough sketch of the system is complete, I also include the System ComponentDiagram, which shows the interrelation between the different subsystems.
The strength of the method is finding what could go wrong with the system,but not necessarily how. The method does not need any altering to suitour needs, but I will propose a extension in the “Extending the methods”chapter. Since this method is not systematic, it requires that the participantshas knowledge about which risks that face the different parts of the system.
Returning to the conceptual model of the enterprise, PHA with Use Case andComponent Diagram would fit in the top layers (marked as red in Figure 5.1).That is the requirements and high level analysis of the enterprise system andits environment.
Figure 5.1: PHA in the conceptual model.
62

5.2. FAILURE MODES AND EFFECTS ANALYSIS (FMEA)
Complexity.
The method can be performed by one person, but it is important that thisperson has expertise in all the technologies involved and knowledge aboutthe domain in which the system is going to operate. Because of this, the testis usually performed by a group of people that complement each other withdifferent expertise. The time required to perform the method varies with thesize of the system and the scope of the analysis. The method produces amoderate amount of documentation which is also dependent on the size ofthe system and the scope.
Usability.
The method itself is very easy to learn and use. Participants do not need alot of training prior to the execution of the method, making it easy to havestakeholders contribute in this process.
5.2 Failure Modes and Effects Analysis (FMEA)
The FMEA is often performed at a later stage than the PHA. The FMEAis typically performed when the design of the system is nearing completionand the main parts of the system are defined. Unlike PHA, it is a systematicmethod for assessing risk. This means that it is more thorough than the PHA,but also more complex and time consuming. Being systematic, it minimizesthe chance that the participants of the method misses possible risks. A faultmode is an instance where the functionality of the system differs from that itwas intended to do. Before the method is applied we need to do the following:
1. Divide the system into subsystems which can be analyzed indepen-dently.
2. Create a function-diagram which describes which subsystems that in-teract with each other.
3. List each component in each subsystem.
The output of the method is a form that lists the fault modes, that faceeach component in the system. The table will typically have the followingcolumns:
63

CHAPTER 5. METHOD EVALUATION
Reference number. A unique reference number assigned to each fault mode.
Function. The function of the component.
Fault mode. A fault mode is a case where the function does not performits predefined function.
Cause. The cause of this fault mode.
Detection. How is this fault mode detected?
Consequence on other functions. What other functions are affected whenthis fault mode occurs. Function relations can be found in the function-diagram.
Consequence on this function. How is this function affected by the faultmode.
Failure rate. How often does this fault occur.
Failure grade. What is the severity of this fault.
Preventive measure. What kind of preventive measures can be created tohandle this fault mode.
Figure 5.2. shows a typical FMEA output.
Failure grade is divided into four categories:
Catastrophic. A failure resulting in loss of human lives, or prohibits thesystem from performing its main function.
Critical. A failure that affects the system to perform below some predefinedlimits of acceptance, and is a threat to human life or health.
Great. A failure that affects the system to perform below some predefinedlimits of acceptance, but can be handled with countermeasures.
Small. A failure that affects the system to perform above some predefinedlimits of acceptance.
Failure rate is also divided into six categories:
Very improbable. one time per 1000 years or less frequent.
64

5.2. FAILURE MODES AND EFFECTS ANALYSIS (FMEA)
Figure 5.2: An example FMEA output.
Improbable. one time per 100 year.
Unlikely. one time per 10 year.
Probable. one time per year.
Frequent. one time per month, or more frequent.
With these two measures we can define the criticality of the system with thecriticality matrix (Table 5.2).
Small Great Critical CatastrophicFrequentProbableUnlikely
ImprobableVery improbable
Table 5.2: The criticality matrix.
This diagram divides each fault mode into 20 possible criticalities. A com-ponent may have fault modes scattered across this diagram. The closer to
65

CHAPTER 5. METHOD EVALUATION
the upper-right corner a fault mode is located, the more critical it is for thecomponent. Likewise, the closer to the lower left corner a fault mode is lo-cated, the less critical it is. This diagram can be used as a rudimentary wayof sorting the risks by criticality.
Relevancy
As RUP promotes the use of componential development, this method suitsour needs very well. The method should be used at a time when the sub-systems and their functions are clear. This method is excellent at findingproblems that arise when one component of the system malfunctions andfinding the repercussions of these faults. The method fails to uncover faultsin the socio-technical aspect of the system, such as human errors etc. Atypical input would be a Class Diagram or Component Diagram. I have cho-sen the Component Diagrams, as it is less detailed and better captures therelations between the subsystems and subcomponents. The level of detail inthe Component Diagram is the components of the subsystems.
Returning to the conceptual model of the enterprise, we can say that theFMEA fits best in at the component level (Figure 5.3).
Figure 5.3: FMEA in the conceptual model.
Complexity.
Because of the systematic nature of the FMEA method, it will produce largequantities of documentation. The performer of the method needs to havecomplete knowledge about the the system, its components, and how theyinteract.
66

5.3. HAZARD AND OPERABILITY STUDY (HAZOP)
Usability.
The method is easy to perform once you know the systems structure andprocesses.
5.3 Hazard and operability study (HAZOP)
HAZOP is usually used in process engineering, such as the development ofchemical plants. HAZOP is a systematic method that investigates the subcomponents (often processes) of a system. HAZOP considers the hazards(external consequences) and operability (internal consequences) of the sys-tem. The system is divided into study nodes, which are analyzed usingguide-words and parameters.
Take the example of engineering a chemical process with one container con-taining one liquid, substance A, and one containing another liquid, substanceB. These two liquids are transported into a reaction chamber, where a newsubstance is created, substance C. The creation of Substance C requires theright ratio of mix of substance A and B (Figure 5.4).
Figure 5.4: An example process engineering system.
The system is divided into three study nodes, which are the parts of thesystem where something may go wrong and that we want to investigate into.
67

CHAPTER 5. METHOD EVALUATION
In this example the three pipelines are the study node (A-pipe, B-pipe, andC-pipe). Then a set of parameters is defined. Parameters are properties ofthe study node we want to study, like flow and temperature. Finally a set ofguide words is defined. Guide words are used to investigate how the systemmay differ from the desired state, typical guide words would be no, more,less etc. The HAZOP applies each guide word, on each parameter, for eachstudy node to systematically consider all possible risks. A scenario would be“no flow in the pipe A” or “less temperature in Pipe B”. Table 5.3 shows theinput of this method applied on the example.
StudyNode
Parameter Guideword
Deviance Consequence PreventiveAction(s)
PipelineA
Flow No No flow inpipeline A
The productionof substance Cis stopped, andthe substance Cin the reactionchamber andstorage tank isspoiled
Stop the C-valve andB-valve to stopthe processand investigatedeviance.
PipelineA
Flow More Abnormalhigh flow inpipeline A
Overflow in thereaction cham-ber and the sub-stance C in thereaction cham-ber and storagetank is spoiled
Try to regulatethe A-valve toobtain normalflow, or closethe C-valve andB-valve to stopthe process.
PipelineA
Flow Less Too low flowin pipeline A
Underflow inthe reactionchamber andthe substance Cin the reactionchamber andstorage tank isspoiled
Try to regulatethe A-valve toobtain normalflow, or closethe C-valve andB-valve to stopthe process.
Table 5.3: An example HAZOP output.
Relevancy
This method would be useful in the development of enterprise systems asthese systems are highly process-oriented. It is not hard to see a similaritybetween the enterprise system and the process engineering example presented
68

5.3. HAZARD AND OPERABILITY STUDY (HAZOP)
above: Business functions, human or automated, in an organization can beviewed as reaction chambers in which information from different parts in theorganization are refined. A typical input would be a diagram that capturesthe process in the organization and systems, such as a sequence diagram orcommunication diagram. I choose to use the ‘Business Sequence Diagram”which is like a standard System Sequence Diagram, but it with a broaderscope which encompass multiple systems and business entities such as work-ers, customers, databases, and other technical systems. It does not onlyshow the processes, but also the sequence in which they are executed. Themethod would perform well in uncovering risks facing the system when de-viances in processes are encountered, and their consequence on both technicaland socio-technical aspects. A set of specialized guide words and parameterswill have to be created. See chapter 6.
The HAZOP fits in the at the layer of subsystems and the different entitiesin the environment like resources, infrastructure etc (Figure 5.5), as theseare the entities in the Business Sequence Diagram.
Figure 5.5: HAZOP in the conceptual model.
Complexity.
This method should use several specialists with knowledge about the systemand the domain it is going to operate in. The meeting should be lead byan HAZOP-leader which have experience in the method, [6]. The amount oftime this method requires would depend on the size of the system. The inputof this method would be a diagram showing the processes of the system weconsider, and the output would be tables of risks.
69

CHAPTER 5. METHOD EVALUATION
Usability.
The combination of guide word and parameters will produce deviances whichare easy for the participants to analyze and understand. Therefore themethod would not require that the participants are trained in advance. Theleadership role, on the other hand, does require some experience.
5.4 Fault Tree Analysis (FTA)
Fault Tree Analysis, or FTA, is the most widely used method for analyzingrisks. It is a logical diagram used to express the link between an unwantedevent in the system and the faults that cause this event. The method isdivided into five steps:
1. Problem definition and analytical boundaries.
2. Fault Tree construction.
3. Estimate minimal cut sets and path sets.
4. Qualitative analysis of the fault tree.
5. Quantitative analysis of the fault tree.
Problem definition and analytical boundaries. First we define the un-wanted event, also known as the top event, that we want to protect our-self against. This description needs to be precise, and there are threeaspects that must be considered: Which type of event, where does itoccur, and when. The analytical boundaries defines which parts of thesystem that is treated in this particular analysis. Some parts of thesystem don’t need to be analyzed because they are not interrelated.Also we need to decide which external threats we are going include.The initial conditions are defined. These are the states the system iscurrently in when top event occurs. Lastly, the level of detail is set,which defines how deep into the system we are willing to go to findcauses.
Fault Tree construction. By taking basis in the top-event, we analyzewhich other system events that may cause the top-event. These system-events are then connected to the top-event by using logical gates. This
70

5.4. FAULT TREE ANALYSIS (FTA)
is recursively repeated for all events until we reach the maximum levelof detail. Risks uncovered underway may be recorded in a textual formor just represented in the diagram. There are three kinds of faults:
1. Primary faults: A function fault that occurs within the system.
2. Secondary faults: A function fault that is caused by overload.
3. Command faults: A function is correctly functioning, but is ap-plied at the wrong time/place.
Primary faults are often the leaf nodes of the diagram, while secondaryand command-faults needs to be further analyzed. The gates shouldalways be completed before doing other gates at the same level, thisway the focus of the risk analysts will be narrow, and ultimately delivera more focused approach.
Estimate minimal cut sets and path sets. The cut set in a fault tree isthe set of all input events that can set off the top-event. A cut set isminimal if it cannot be reduced to a smaller cut set. The path set isthe set of inputs that by not triggering, will not produce the top event.A path set is minimal if it cannot be reduced to a smaller path set.
Analyze tree. The qualitative and/or quantitative analysis of the tree.Qualitative analysis can be obtained by giving the links numeric prob-abilities. An OR gate would add the incoming probabilities, while theAND gate would multiply them. The multiplication in the AND-gatemight sound more serious, but as all probabilities are 1.0 or less, thismeans that the outgoing risk is lower than the incoming, which makessense. The risk of two events occurring is always lower than just oneof them. The AND-gates stacks the risks and therefore poses a greaterthreat. This gives the basis for the rudimentary qualitative rule thatthe more OR-gates you have, the more probable the top-event is, andthe OR-gates are the ones you need to strengthen. This is of courseis a very rudimentary rule, as it does not encompass probabilities orcriticalities. But by calculating the risk at every node, you will get aclear picture of the risks concerning the system.
A benefit of the FTA is finding common causes. A common cause is anevent that triggers two or more fault tree elements. A typical commoncause is power outage. Common causes are of course often more severethan they usually appear. Common causes are found though the useof cut sets. Another benefit is risk trade off analysis, which is providedby the use path sets.
71

CHAPTER 5. METHOD EVALUATION
The strength of FTA lies in its ability to be analyzed and quantified.[21] provides a good coverage of these matters.
Figure 5.6 shows the most common graphical symbols used in the FTA dia-gram:
Figure 5.6: FTA tree symbols.
These symbols are used as follows:
• Event - A single event in the system with consequences (output con-nections) and causes (input connections)
• OR gate - An event with an OR-gate will trigger if one of the inputevents triggers.
• AND gate - An event with an AND-gate will trigger if all the inputevents triggers.
• Normal input - An event that can be prevented, like a componentfailure.
• Secondary input - An event that cannot be prevented, like an earth-quake.
• Conditional - A condition to a event.
• Transfer - The branch is stopped, but it has a subbranch which is itsown tree. This prevents trees from getting too large.
Figure 5.7 shows a typical FMEA with the top-event ’Database is down’.
72

5.4. FAULT TREE ANALYSIS (FTA)
Figure 5.7: Typical FTA tree.
Relevancy
The input of this method is the top-event, which itself is an identified threat.Therefore, rather than this method to take basis in an UML-model, it wouldbe easier to use the output of a preliminary method, such as the EnterpriseCriticality Assessment. This will be presented in chapter 6.
The strength of the method is the way it incorporates socio-technical aspectsas well as purely technical, therefore this method will perform well when itcomes to finding all types of threats facing the system.
Returning to the conceptual model of the enterprise, this method configura-tion would analyze all layers except Requirements and Components.
Complexity.
The output of the method, the Fault Tree, is a very compact way of therepresenting the results. It also shows the interconnectedness of the faults inan very effective and compact way. This also means that the method couldbe fairly quick, but this is dependant on the scope of the analysis, and the
73

CHAPTER 5. METHOD EVALUATION
Figure 5.8: FTA in the conceptual model.
level of detail.
The fact that it is top-down makes it more easy to make a thorough analysis.It is easier to divide an event into causing events, rather than divide an eventinto pre-conditional events.
Usability.
The logical gates may be confusing for someone who has never worked withthem before, but once that threshold is passed, this method serves as aneasy and powerful method. The participants would typically be persons whohave a good overview of both the technical architecture of the system andthe environment it is going to operate in, and the business processes in thesystem.
Whilst the previous methods it was beneficiary that someone with socio-technical knowledge, that is someone that knows the organization and envi-ronment as well as the system, I would say that in this method it should behighly recommended, perhaps even required.
5.5 Cause-Consequence Analysis (CCA)
Cause-Consequence Analysis (CCA), like FTA, is a logical diagram. WhilstFTA starts at an unwanted event and finds the initiating critical events thatresults in this event, the CCA starts at the other end. Given a initiatingcritical event, what are the consequences? The method can be divided into
74
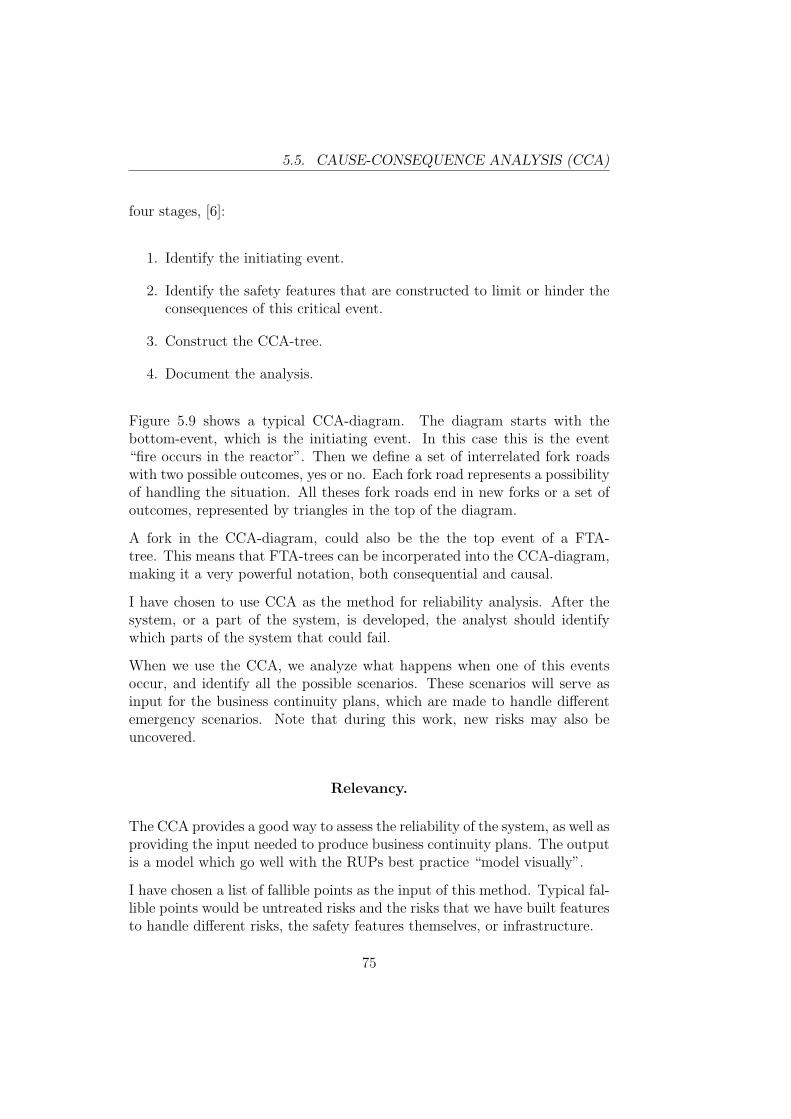
5.5. CAUSE-CONSEQUENCE ANALYSIS (CCA)
four stages, [6]:
1. Identify the initiating event.
2. Identify the safety features that are constructed to limit or hinder theconsequences of this critical event.
3. Construct the CCA-tree.
4. Document the analysis.
Figure 5.9 shows a typical CCA-diagram. The diagram starts with thebottom-event, which is the initiating event. In this case this is the event“fire occurs in the reactor”. Then we define a set of interrelated fork roadswith two possible outcomes, yes or no. Each fork road represents a possibilityof handling the situation. All theses fork roads end in new forks or a set ofoutcomes, represented by triangles in the top of the diagram.
A fork in the CCA-diagram, could also be the the top event of a FTA-tree. This means that FTA-trees can be incorperated into the CCA-diagram,making it a very powerful notation, both consequential and causal.
I have chosen to use CCA as the method for reliability analysis. After thesystem, or a part of the system, is developed, the analyst should identifywhich parts of the system that could fail.
When we use the CCA, we analyze what happens when one of this eventsoccur, and identify all the possible scenarios. These scenarios will serve asinput for the business continuity plans, which are made to handle differentemergency scenarios. Note that during this work, new risks may also beuncovered.
Relevancy.
The CCA provides a good way to assess the reliability of the system, as well asproviding the input needed to produce business continuity plans. The outputis a model which go well with the RUPs best practice “model visually”.
I have chosen a list of fallible points as the input of this method. Typical fal-lible points would be untreated risks and the risks that we have built featuresto handle different risks, the safety features themselves, or infrastructure.
75

CHAPTER 5. METHOD EVALUATION
Figure 5.9: A typical CCA diagram.
In the conceptual model of the enterprise it would encompass all layers, asreliability is something that is important throughout the enterprise (Figure5.10).
Complexity.
The representation of the output is simple and concise, and the methoddoes not require a lot of resources. The analyst(s) would only need a list ofimplemented safety features, a list of treated and untreated risks, and a listof critical infrastructure. The construction of the tree is very simple as itonly produces two links at each node.
Usability.
The method does not require any in-depth training of the participants, andthe simple logical structure makes it easy to construct the diagram, even forpeople who have never used it before.
76

5.5. CAUSE-CONSEQUENCE ANALYSIS (CCA)
Figure 5.10: CCA in the conceptual model.
77

Chapter 6
Extension of methodconfigurations
In the last chapter we introduced a set of configurations, whose abilitiesstraight out of the box, to be used in uncovering risks facing the enterprise,was varied. In this section I will extend and alter these methods so thatthey fit our needs better, and I will use them on my case enterprise fordemonstration purposes. These configurations include:
• PHA and Use Case Diagram/High Level Component Diagram.
• FMEA and Low Level Component Diagram.
• FTA and the Enterprise Criticality Assesment.
• HAZOP and the Business Sequence Diagram.
• CCA and a set of fallible points.
6.1 PHA and Use Case Diagram/ComponentDiagram
As descried in section 5.1, the literature describes some important aspects toconsider when doing the PHA. Many of these aspects are not issues in busi-ness critical software systems, and many issues in business critical softwaresystems are not covered by these aspects.
78

6.1. PHA AND USE CASE DIAGRAM/COMPONENT DIAGRAM
The EIA (Enterprise Information Architecture) divides the enterprise sys-tems into layers of consideration when creating and integrating enterprisesystems.
1. Environment.
2. Business requirements.
3. Data Architecture.
4. Application.
5. Infrastructure.
6. Systems software.
7. Hardware/Network.
When using the method on UML-diagrams, we are mainly focusing on theApplication layer. The Enterprise is a complicated structure that span allover these layers. The Application layer is dependent on the well-functioningof all of the sub layers to perform successfully itself. It would therefore bewise to consider all manifestations a use case makes in the other layers andthe risks associated with each of these.
A database may have some data that is wrongly labeled by meta data (dataarchitecture layer), the database-server may break down (hardware layer),the database software may bug (application layer), and we may store personalinformation about someone which is illegal by law (environment layer).
Example use.
First, we need some overview of the system, which is provided by the SystemComponent Diagram (Figure 6.1).
Then we will use the Use Case Diagram representing the main functionalityof the Administration System as the basis for the analysis (Figure 6.2). Byusing the PHA method, the output shown in Table 6.1 can be produced.
Consider another use case, from the Printing system (Figure 6.3). With thismodel as basis for the method, we can produce output in found in Table 6.2.
79

CHAPTER 6. EXTENSION OF METHOD CONFIGURATIONS
Danger Cause Consequence Severity Prev. action(s)Subscriber data-base is corrupted
Failure in data-base vendorsoftware
Loss of sub-scriber, whichin turn resultsin the loss ofprofit, and pos-sibly the lossof the businessitself
Critical Backup database regu-larly
Invoice databaseis corrupted
Failure in data-base vendorsoftware
Loss ofmoney,andpossibly theloss of thebusiness itself
Critical Backup database regu-larly
System gener-ates too few (ornone) subscriberinvoices
Failure in theprocessing ofsubscriber data
The loss ofmoney
Critical Perform consistencycheck between Sub-scriber and Invoicedatabase (such ascount)
Order is created,but invoice is notmade, and it goesunnoticed
Fault in Ad-ministrationSystem, net-work or Invoicedatabase
Loss of money Severe Check that both orderand invoice is created
Order is edited,but invoice is up-dated, and it goesunnoticed
Fault in Ad-ministrationSystem, net-work or Invoicedatabase
Loss of moneyor clients, freudallegationsagainst thebusiness
Severe Perform consistencycheck between orderand invoice
Order is edited,but invoice is up-dated, and it goesunnoticed
Fault in Ad-ministrationSystem, net-work or Invoicedatabase
Loss of clients,freud allega-tions againstthe business
Severe Check that both orderand invoice is removed
Table 6.1: PHA on the Administration System.
80

6.1. PHA AND USE CASE DIAGRAM/COMPONENT DIAGRAM
Figure 6.1: System Component Diagram.
Danger Cause Consequence Severity Prev. action(s)Printing systemdoes not indicatethe right amountof ink or paperleft in press
Ink or paperlevel sensorsnot functioning
Delay in print Normal Perform regular main-tenance
Request of ink re-fill or paper is notreceived at Inven-tory
Fault in ei-ther Inventorysystem, Print-ing system ornetwork
Delay in print-ing
Normal Give feedback to thePrint Manager that therequest has been sentsuccessfully
The press stopsprinting
Power grid fail-ure
Delay in print-ing
Normal Install in-house powergenerator
The Print Man-ager signals theTransport depart-ment that theprinting is done,but the message isnot received
Fault in ei-ther Inventorysystem, Print-ing system ornetwork
Delay in distrib-ution
Normal Give feedback to thePrint Manager that therequest has been sentsuccessfully or makethe process manual
Table 6.2: PHA on the Printing System.
81
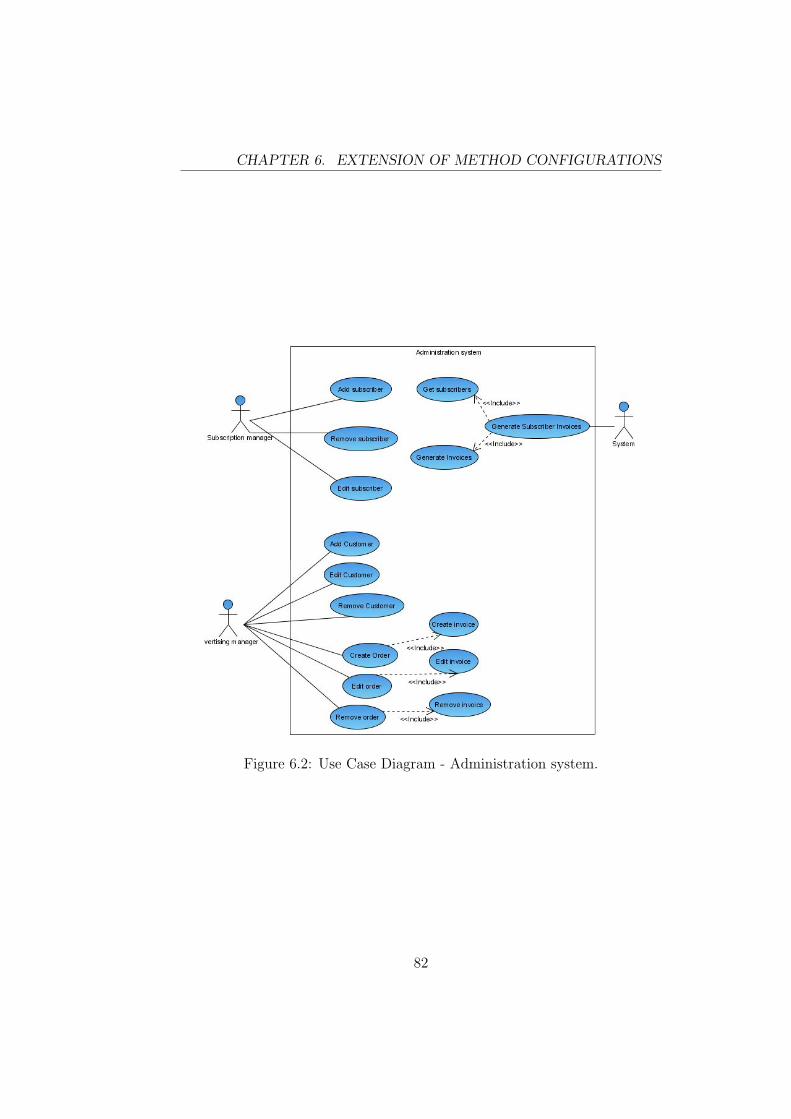
CHAPTER 6. EXTENSION OF METHOD CONFIGURATIONS
Figure 6.2: Use Case Diagram - Administration system.
82

6.1. PHA AND USE CASE DIAGRAM/COMPONENT DIAGRAM
Figure 6.3: Use Case Diagram - Printing system.
83

CHAPTER 6. EXTENSION OF METHOD CONFIGURATIONS
6.2 FMEA and Component Diagram
Figure 6.4: System Component Diagram.
Again considering the EIA-architecture in Figure 6.4, each of components inthe system can be at risk from risks in all of the layers of the EIA-architecture.For example, a transaction of information within the system can have risksassociated with itself in all the layers of the model. The transaction canbe a violation of a law (Environment), the information can have differentsemantic meaning to the different parties (Data Architecture), it can beaffected by a database being down (Systems software/Hardware) etc. TheEIA-architecture will help the FMEA to become even more thorough, bynot only forcing the systematic evaluation of each component, but also eachpossible domain that it can affect.
Example use.
The subsystem can be divided into several components in a subsystem-levelComponent Diagram. We can use the Component Diagram of the InventorySystem (Figure 6.5) as an input to the FMEA method. The result is pre-sented in Table 6.6. There is no need to make a function-diagram that showsthe relation between the components, as this is depicted in the diagram itself.
For each of the components of the subsystem, we can set up a criticality ma-trix (Table 6.3). The DatabaseHandler component’s fault modes are markedwith an X, The Order Form GUI component’s fault modes are marked withan O:
84

6.2. FMEA AND COMPONENT DIAGRAM
Figure 6.5: Inventory System Component Diagram.
Small Great Critical CatastrophicFrequentProbable X OUnlikely X
ImprobableVery improbable
Table 6.3: Inventory System criticality matrix.
85

CHAPTER 6. EXTENSION OF METHOD CONFIGURATIONS
Figure 6.6: FMEA on Inventory Subsystem.
86

6.3. HAZOP AND BUSINESS SEQUENCE DIAGRAM
The matrix states that the DatabaseHandler in the Inventory system doesnot have a high criticality, whilst the Order Form GUI component has amedium high criticality.
6.3 HAZOP and Business Sequence Diagram
A computer system can be divided into four distinctive modes of operation,[19].
1. IT systems process information.
2. IT systems store information.
3. IT systems communicate information
4. IT systems can be configured.
We can define a set of parameters for each of these modes (Figure 6.7).
Figure 6.7: IT operation modes.
An system action like getting data from a database could be divided intofour steps from this model:
1. The application would notice (communicate) to the database the dataneeded.
87

CHAPTER 6. EXTENSION OF METHOD CONFIGURATIONS
2. Database system would process the request.
3. The database system would send the data (communicate).
4. The application would process the data.
For a more detailed explanation of each parameters and their guide words,see Appendix B.
The model in Figure 6.7 is a very technical and general one. The enterpriseenvironment introduces human behavior and relations with other businessentities, like vendors etc. We need to extend these four points with moreenterprise specific aspects.
The Enterprise architecture defines five relations: U2A, A2A, B2B, B2C andC2C. We can use these to extend the general IT operations, making it suitthe enterprise environment better. Not only will we be able to produce morecentral parameters, but we may also introduce human behavior.
Each of these relations will have a unique set of parameters, as well as theparameters defined in Figure 6.7. A2A will not be included as it does notprovide anything beyond that of the general IT operation modes. Also, Iwill add another relation, The H2H (Human to Human), so that we may alsoanalyze the gaps, if any, between the systems that may be connected by ahuman to human interaction.
U2A.
Starting with the U2A relation, we divide this into “User too application”and “Application to user”. The user may input data, or view data (Figure6.8).
To get an idea how these enterprise relations extend the general IT-modes,we can extend the example presented earlier with the application retrievingdata from a database server, This time we incorporate a user that enters thedata he/she wants, and reads off the screen afterwards:
1. The user inputs the data he/she wants to get.
2. The application would notice (communicate) to the database the dataneeded.
88

6.3. HAZOP AND BUSINESS SEQUENCE DIAGRAM
Figure 6.8: U2A business process parameters.
3. Database system would process the request.
4. The database system would send (communicate).
5. The application would process the data.
6. The application outputs the data on the screen.
B2B/B2C.
The Business to Business and Business to Consumer relations involves eitherthe use of a service (a consumer uses a service from a company, or a companyuses a service from another company) or commerce (a consumer or a companybuys something from a company). The company can either purchase or sell(Figure 6.9).
C2C.
Some companies let consumers interact with consumers, and apply a micropayment business model1, where one part is the seller and another part is thepurchaser. There might also be a exchange where no monetary transactionis performed (Figure 6.10).
1A business model where a company facilitates the commence between two parts andis payed a microscopic part of the transaction.
89

CHAPTER 6. EXTENSION OF METHOD CONFIGURATIONS
Figure 6.9: B2B/B2C business process parameters.
Figure 6.10: C2C business process parameters.
90

6.4. FTA AND ENTERPRISE CRITICALITY ASSESSMENT
H2H.
Finally we have the Human to Human relation, for the cases where there areno IT infrastructure connecting two persons that interacts, yet the interactionstill constitutes a important part of the overall system function.
Figure 6.11: H2H business process parameters.
Example use.
I will take basis in the Printing System Business Sequence Diagram (Figure6.12). Table 6.4 - 6.6 show the output of the method on the first studynodes. As HAZOP produces a lot of documentation, I will not do this forevery study node, only a few so that the main principles of the method aredemonstrated.
6.4 FTA and Enterprise Criticality Assess-ment
All of these method configurations, as previously mentioned, should be per-formed with the Enterprise Critical Assessment document in mind. I proposethat the FTA goes further than that, and takes basis in this document forinput. The aim of the method is then to protect these critical parts. Thetop-events would then be formulated as the negation of the desired state ofthe critical part.
Example use.
Let us consider the critical business function “Get newspaper to consumer”.Protecting this could be formulated as the top-event, “paper is delayed”,
91

CHAPTER 6. EXTENSION OF METHOD CONFIGURATIONS
StudyNode
Mode Parameter+ Guideword
Deviance Consequence Preventive Action(s)
Noticecontentis ready(Publish-ing Systemto PrintingSystem)
Communication Time +Early
The print-ing isstared tooearly
An in-completepapers isprinted
Implement a featurethat checks if the con-tents is ready
Noticecontentis ready(Publish-ing Systemto PrintingSystem)
Communication Time +Later
The print-ing isstarted toolate be-cause of afault in thePublishingSystem
The paperis delayed
Implement a featurewhich kicks in if theprinting system has towait sufficiently longfor the message, andcommunicates withthe Publishing system,checks if it has sent amessage, or force it todo a self diagnostic. Ifsomething is wrong, anappropriate managerwould be alerted
Noticecontentis ready(Publish-ing Systemto PrintingSystem)
Communication Time +Never
The print-ing systemnever re-ceives therequestthat is sent
The paperis neverprinted
Have the printing sys-tem communicate tothe publishing systemthat it has received theorder to start printing,this forces the publish-ing system to resend
Noticecontentis ready(Publish-ing Systemto PrintingSystem)
Communication Time +Never
The print-ing systemnever re-ceives therequestbecause itis neversent
The paperis neverprinted
None, the PrintingManager will actwhen if the delay issufficiently long
Table 6.4: HAZOP output for the printing system - I.
92

6.4. FTA AND ENTERPRISE CRITICALITY ASSESSMENT
StudyNode
Mode Parameter+ Guideword
Deviance Consequence Preventive Action(s)
Noticecontentis ready(Publish-ing Systemto PrintingSystem)
Communication Validity+ Otherthan
The print-ing isstartedtoo earlybecause ofa wronglysent mes-sage
An incom-plete paperis printed
Implement a featurethat checks if the con-tent is ready
Noticecontentis ready(PrintingSystem toPrintingManager)
Communication Time +Early
The print-ing isstared tooearly
An in-completepapers isprinted,loss ofmoney
None, if the featurein column 1 is im-plemented, this stagenever occurs
Noticecontentis ready(PrintingSystem toPrintingManager)
Communication Time +Later
The man-ager re-ceives theorder tostart print-ing too latebecausethe
Paper ispossiblydelayed
None, the Print Man-ager would investigateif he had to sufficientlylong after the deadlinefor the order
Noticecontentis ready(PrintingSystem toPrintingManager)
Communication Time +Never
The orderis sent andthe man-ager neverreceivesthe orderto startprinting
The paperis neverprinted
Have the Print Man-ager confirm that hehas received the order,or else resend
Noticecontentis ready(PrintingSystem toPrintingManager)
Communication Validity+ Otherthan
The print-ing isorderedbefore thecontent isready
An incom-plete paperis printed
Since this action isfully automated, a ran-dom triggering of thisaction is probably notsparked without thePrinting System firstreceiving an order fromthe Print Manager
Table 6.5: HAZOP output for the printing system - II.
93

CHAPTER 6. EXTENSION OF METHOD CONFIGURATIONS
StudyNode
Mode Parameter+ Guideword
Deviance Consequence Preventive Action(s)
EngagePrinting
U2A Validity+ Otherthan
The man-ager startsthe print-ing when itshould notbe started
Incompletepaper isprinted
Have a dialogue win-dows that asks if themanager is sure thathe wants to start theprinting
EngagePrinting
U2A SemanticCoher-ence +Otherthan
The man-ager doesnot under-stand themeaning ofhis action
The print-ing isprema-turelystarted
See above
EngagePrinting
Communication Time +never
The print-ing neverstarts
The man-ager thinksthat theprint-ing hasstarted,when it hasnot, anda possi-ble delaymay beintroduced
Create a policy thatthe Print Managerneeds to physicallycheck the printing hasstarted after he hasordered it
......
......
......
Table 6.6: HAZOP output for the printing system - III.
94
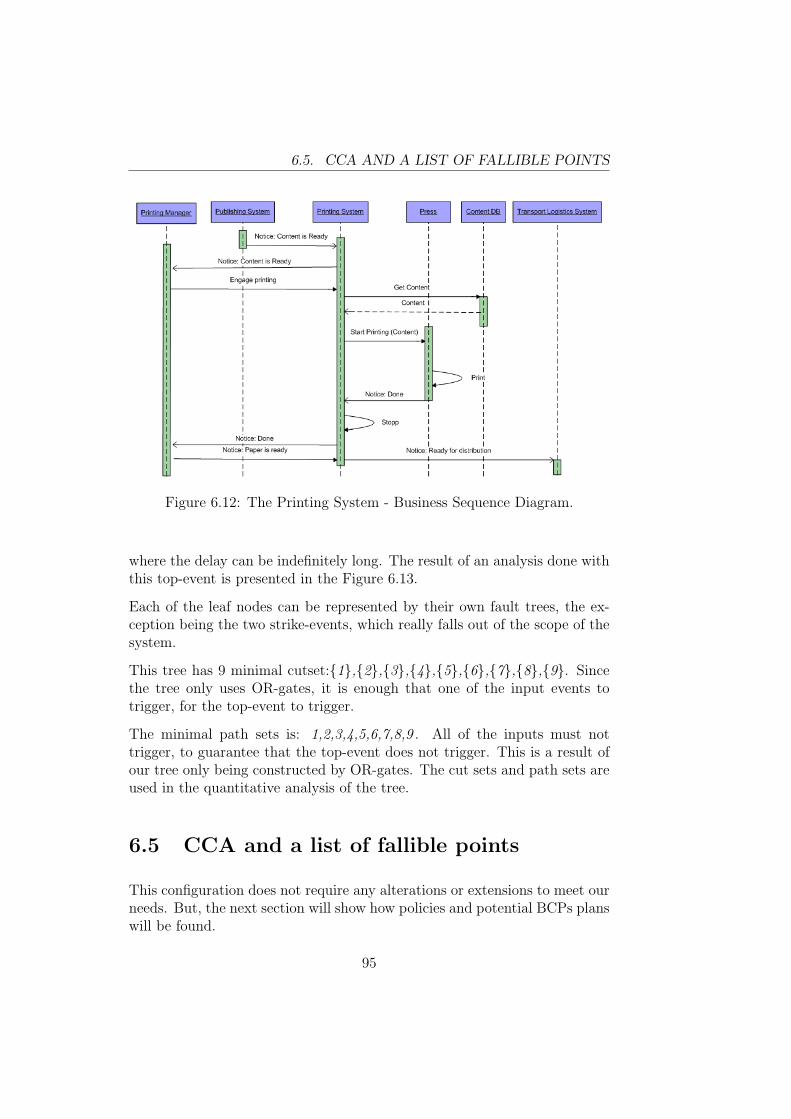
6.5. CCA AND A LIST OF FALLIBLE POINTS
Figure 6.12: The Printing System - Business Sequence Diagram.
where the delay can be indefinitely long. The result of an analysis done withthis top-event is presented in the Figure 6.13.
Each of the leaf nodes can be represented by their own fault trees, the ex-ception being the two strike-events, which really falls out of the scope of thesystem.
This tree has 9 minimal cutset:{1},{2},{3},{4},{5},{6},{7},{8},{9}. Sincethe tree only uses OR-gates, it is enough that one of the input events totrigger, for the top-event to trigger.
The minimal path sets is: 1,2,3,4,5,6,7,8,9 . All of the inputs must nottrigger, to guarantee that the top-event does not trigger. This is a result ofour tree only being constructed by OR-gates. The cut sets and path sets areused in the quantitative analysis of the tree.
6.5 CCA and a list of fallible points
This configuration does not require any alterations or extensions to meet ourneeds. But, the next section will show how policies and potential BCPs planswill be found.
95

CHAPTER 6. EXTENSION OF METHOD CONFIGURATIONS
Figure 6.13: FTA-tree for the “Newspaper is delayed”.
96

6.5. CCA AND A LIST OF FALLIBLE POINTS
Example use.
Consider again the enterprise system of the newspaper, where the printingsystem is imperative for printing the paper. If this subsystem fails beforedeadline, the whole production is delayed until its restored. Let us nowconsider the initiating event: “Printing system fails”. From this root we canproduce the following CCA-diagram (Figure 6.14).
Figure 6.14: CCA diagram for “Printing system fails”.
Let us say that this reliability analysis is performed after the design of thegiven subsystem and that we have designed a safety feature to handle thisvery failure. This feature is two parallel systems running, one is handling allthe requests, whilst the other is standing by, ready to take over in case theother fails.
The first fork road is the success of this implemented feature, either thisfeature works or not. If it works, then the paper is not delayed. If it doesn’t
97

CHAPTER 6. EXTENSION OF METHOD CONFIGURATIONS
work, we come to a new fork. We can then try to reboot the system to seeif a clean start will eliminate the problem. At this stage we are beginningto uncover scenarios that we create business continuity plans for, as wellas policies along the way. For example we can add the policy: “When asubsystem fails, restart”. If the system is back and running after a reboot,there will be no delay. If the system does not run after reboot, IT-personnelmay be instructed to uncover the error. We can now add another policy: “Ifsystems does not function after reboot, contact the IT-department”. If theIT-personnel cannot locate the error before deadline, the newspaper may beforced to look for other printing presses in the local area. If they find theerror, the paper is delayed only if they don’t manage to fix it before deadline.Looking for other local printers is a task that is not easily formulated as asimple policy. It requires much more resources, coordinated work, and back-ground information. Therefore it falls under the field of Business ContinuityPlans (BCPs). The print manager should have BCPs that instructs himabout other nearby printing presses and how to contact them, his spendinglimit, how to coordinate the sudden change in distribution etc.
98

Chapter 7
Comparison and selection ofmethod configurations
I will assess the configurations with respect to their ability to uncover a setof risks with a numerical number in the interval from 1 to 5, where 5 is thebest score. These performances is not based on empirical data, so I havewritten a rationale in Appendix A which describes why I have the assignedthe given score to each risk/method configuration.
I have divided the the comparison into three: 1) The configurations abilityto assess key enterprise risks (See section 2.5.1), 2) The configurations abilityto assess general software risks (See section 3.1.1), and 3) The configurationsability to fulfill the process related requirements that we have set (See section3.1.1).
7.1 Enterprise risks
The assessment of the methods (See Appendix A) is presented in Table 2.5.1.All risks are considered equally important, i.e there is no weighting of therisks. To save space in the score-tables in this section, only the method islisted, not the input. So even though the table lists “PHA”, it represents“PHA with Use Case Diagram”.
All configurations achieve a perfect score at at least one risk (All MAX valuesin the last column is 5). Also, every risk has a configuration that performsperfect score on it, except Network failure” which has a maximum score of
99

CHAPTER 7. COMPARISON AND SELECTION OF METHODCONFIGURATIONS
Risk PHA FMEA HAZOP FTA CCA MAX AVGLoss of service 3 3 5 3 3 5 3.4Legacy integra-tion problems
1 5 2.5 1.5 2 5 2.4
Loss of vitaldata
2 2 4 5 4 5 3.4
Network failure 1 2 2.5 4 4 4 2.7Ripple effects 2 2.5 4 1 5 5 2.9Human errors 5 2 3 4 4.5 5 3.7AVG 2.33 2.75 3.5 3.08 3.08 - -MAX 5 5 5 5 5 - -
Table 7.1: Configuration performance on key enterprise risks.
4.
This means that all of our needs would be covered if we went for everyconfiguration, but we must also investigate the possibility that some config-urations may have strengths that overlap, and that we can discard one ormore of them.
Another way to look at the data, is to consider the relative strength of eachconfiguration, that is, how they perform compared to other methods on agiven risk. This way we have the option to pick only a few methods and yetensure that they perform well in all the risks compared to other options.
Table 7.2 shows the relative strength of the configurations, which is the scorethey achieved minus the average score of all of the configurations on thatgiven risk. A negative number means that the configuration performs poorlycompared to others, while a positive number means that the configurationperforms better compared to others. These numbers are also averaged forevery risk and every configuration to give a better overview of the strengths.The two bottom rows show the maximum relative strength and the averagerelative strength of each of the configuration.
PHA/Use Case and FMEA/Component Diagram come out as poor configu-rations to handle enterprise risks compared to the others. FTA/EnterpriseCriticality Assessment comes out as an average configuration, whilst HA-ZOP/Business Sequence Diagram and CCA/Fallible points scored the best.FMEA/Component Diagram had the best relative strength of 2.6 in LegacyIntegration problems, which is something that should be considered whenselecting configurations later.
100

7.2. GENERAL SOFTWARE RISKS
Risk PHA FMEA HAZOP FTA CCA MAXLoss of service -0.4 -0.4 +1.6 -0.4 -0.4 +1.6Legacy integration prob-lems
-1.4 +2.6 +0.1 -0.9 -0.4 +2.6
Loss of vital data -1.4 -1.4 +0.6 +1.6 +0.6 +1.6Network failure -1.7 -0.7 -0.2 +1.3 +1.3 +1.3Ripple effects -0.9 -0.4 +1.1 -1.9 +2.1 +2.1Human errors +1.3 -1.7 -0.7 -0.3 +0.8 +1.3AVG -0.58 -0.33 +0.41 -0.1 +0.66 -MAX +1.3 +2.6 +1.1 +1.6 +2.1 -
Table 7.2: Relative configuration performance on key enterprise risks.
7.2 General software risks
The assessment of the configurations on general software risks (See AppendixA) is presented in Table 7.3. All risks are considered equally important.
Risk PHA FMEA HAZOP FTA CCA MAX AVGStorage capacityproblems
1.5 2.5 4.5 3.5 2.5 4.5 2.9
Transport capacityproblems
1.5 2 4.5 3.5 2.5 4.5 2.8
Process capacityproblems
2 2.5 4.5 3.5 2.5 4.5 3
Information seman-tic and syntactic er-rors
2 2.5 5 3 2.5 5 3
Component failure 1 5 1 1.5 1 5 1.9AVG 1.6 2.9 3.9 3 2.2MAX 2 5 5 3.5 2.5
Table 7.3: Configuration performance on general software risks.
It seems that all risks have a configuration that achieves a near perfect scoreat them (All MAX values in the last column is at least 4.5). Again, overall,it is HAZOP and Business Sequence Diagram that comes out as the winner.
With respect to these risks, HAZOP with Business Sequence Diagram is thesuperior alternative with an average relative strength of 1.18. Much of thiscan be credited to the selection of guide words and parameters for enterpriseand software systems, and the richness in detail of the Business Sequence
101

CHAPTER 7. COMPARISON AND SELECTION OF METHODCONFIGURATIONS
Risk PHA FMEA HAZOP FTA CCA MAXStorage capacityproblems
-1.4 -0.4 +1.6 +0.6 -0.4 +1.6
Transport capacityproblems
-1.3 -0.8 +1.7 +0.7 -0.3 +1.7
Process capacityproblems
-1.0 -0.5 +1.5 +0.5 -0.5 +1.5
Information seman-tic and syntactic er-rors
-1.0 -0.5 +2.0 0.0 -0.5 +2.0
Component failure -0.9 +3.1 -0.9 -0.4 -0.1 3.1AVG -1.12 +0.18 +1.18 +0.28 -0.36MAX -0.9 +3.1 +1.7 +0.7 -0.1
Table 7.4: Relative configuration performance on general software risks
Diagram model.
7.3 Process related issues
The configurations performance on the process related issues are located inTable 7.5 and Table 7.6. The reasons for assigning these scores are presentedin Appendix A.
Risk PHA FMEA HAZOP FTA CCA MAX AVGRequired methodknowledge
4 3 2 2.5 3.0 4 2.9
Required systemknowledge
4 2 2.5 1.5 2.0 4 2.4
Time consumption 4 1.5 2.0 3 3 4 3.5Relation to preexist-ing RUP artifacts
5 1 2 2 1.5 5 2.3
Documentationgenera-tion/consumption
3 1.5 1.5 3 3.5 3.5 2.5
AVG 4 1.8 2.0 2.6 2.6MAX 5 3 2.5 3 3.5
Table 7.5: Configuration performance on process related issues.
102

7.4. SELECTION OF CONFIGURATIONS
Risk PHA FMEA HAZOP FTA CCA MAXRequired method knowl-edge
+1.1 -0.1 -0.9 -0.4 +0.1 +1.1
Required system knowl-edge
+1.6 -0.6 -0.1 -0.9 -0.4 +1.6
Time consumption +0.5 -2.0 -1.5 -0.5 -0.5 +0.5Relation to preexistingRUP artifacts
+2.7 -1.3 -0.3 -0.3 -0.8 +2.7
Documentation genera-tion/consumption
+0.5 -1.0 -1.0 +0.5 +1.0 +1.0
AVG +1.28 -1.0 -0.76 -0.32 -0.12MAX +2.7 -0.1 -0.1 +0.5 +1.0
Table 7.6: Relative configuration performance on process related issues.
7.4 Selection of configurations
Figure 7.1 shows the average relative strength for each configuration in eachof the three categories, as well as the overall score. The overall score is aweighted average of the categories with the following weights:
1. Software risks: 4/10.
2. Enterprise risks: 4/10.
3. Process related issues: 2/10.
The reason for this weighting, is that I consider the configurations ability touncover the important kind of risks more important than how smoothly theywill fit the RUP process.
All of the configurations perform better than the average of the others in atleast one category. HAZOP, FTA, and CCA perform overall better than theaverage. HAZOP is the superior configuration, whilst the PHA and FMEAperforms overall most poorly.
Before discarding the PHA and the FMEA, I must see if any of them performsvery well on a particular risk. This is the only thing that can justify thepoor overall performance. Figure 7.2 shows how many risks the differentconfiguration are exceptionally good at. Exceptionally good is defined as arelative strength of +1.5 compared to other configurations.
103

CHAPTER 7. COMPARISON AND SELECTION OF METHODCONFIGURATIONS
Figure 7.1: Summary - Relative configuration performance.
Figure 7.2: Number of risks/aspects with relative score above 1.5 per config-uration.
104

7.4. SELECTION OF CONFIGURATIONS
On this statistics FMEA and PHA outperforms FTA and CCA. By droppingFMEA and PHA, we would loose exceptional performance on 4 out of 15risks/aspects. Given this, I choose to use every configuration in the integra-tion. I will not make it required to use all of the configuration of methods inthe integrated process, as configurability is a very central part of RUP.
Later I will use this statistics to propose some recommended configurationsof method-configurations.
Returning to the conceptual model of the enterprise, we can see where eachmethod fits in (Figure 7.3).
Figure 7.3: The configurations main foci in the enterprise conceptual model.
The requirements define the system and is analyzed by the PHA method.The requirements are realized by the Enterprise System (the executable soft-ware system) and the Enterprise Environment (resources, infrastructure etc).We use FTA to analyze the risks connected to the enterprise environmentas previously seen. For example one can use the FTA to assess the risksconnected to the storage of invoice data (a resource) or the reliability of thelocal area network (an infrastructure). The Enterprise System is divided intosubsystems. The subsystems, in turn, are divided into components, which isanalyzed by the FMEA.
The risk connected to two interacting entities A and B, is the sum of the risksconnected to each entity, as well as the risks connected with the interactionof those entities:
Risk[AB] = Risk[A] + Risk[B] + Risk[A’s interaction with B].
105

CHAPTER 7. COMPARISON AND SELECTION OF METHODCONFIGURATIONS
In other words, we also need to analyze the interaction between the environ-ment and the system. This interaction is captured by the Business SequenceDiagrams, which both incorporates environmental aspects like resources, in-frastructure etc, as well as the subsystems. The Business Sequence Diagramis the basis for the HAZOP method.
If one wishes to use all of the methods, they all fit perfectly as the FTAanalyzes the environment, the FMEA analyzes the systems, and HAZOPanalyzes the interaction between them.
Not all users would use all of the methods, it would probably be wise toalways choose the method(s) that one feels suits a given iteration or projectbest.
If the project manager for some reason, such as time constraints, would onlyuse one configurations, I would propose the HAZOP with Business SequenceDiagram and specialized parameters, which seems to perform best on the keyrisks.
106

Chapter 8
Integration with RUP
This chapter will propose a way to integrate the method configurations tothe base RUP-process.
8.1 Defining Activities
The natural place to start in the extension of RUP is to define the work wewant to incorporate in the process, (Figure 8.1).
Figure 8.1: Risk related work.
The first thing we need is the enterprise assessment to understand the enter-prise and its critical parts. Then we need risk assessment, which is neededto uncover the risks by risk analysis, either by system analysis, requirementsanalysis, or reliability analysis. Lastly we need risk management to handle
107

CHAPTER 8. INTEGRATION WITH RUP
these risks. When managing risks we need to record, monitor, and treat them.When we treat risks, we either perform system changes, or we create plansand policies that deals with them.
If we consider a non-iterative process with the three distinctive non-overlappingphases: pre-development, development, and post-development, the followingwould be a natural way to structure the work into the following activities(Figure 8.2).
Figure 8.2: The risk related work done in a typical waterfall process.
The next natural step is to define what artifacts each of these activities needand how the artifacts are interrelated. Figure 8.3 shows the dependenciesand Table 8.1-8.2 lists and describes the activities and artifacts.
We have now defined the activities and linked them to key artifacts. Fi-nally we may construct the relation between the activities in the temporaldimension. We can clearly see that four phases (not to be confused withRUP-phases) emerge, (Figure 8.4).
First the enterprise is assessed, then the requirements are analyzed, then thesystem is analyzed, and lastly the reliability is assessed. Risks are recorded,and the design and the requirements are changed during these three activities.The risk monitoring is invoked every time something in the system is changed.These three phases will be the back bone of the extended RUP process. Theextended process could easily by modified by changing the methods, but thephases would stand permanent.
108

8.1. DEFINING ACTIVITIES
Figure 8.3: Activities and their related artifacts.
Figure 8.4: Risk work process in a typical iteration.
109

CHAPTER 8. INTEGRATION WITH RUP
Name Type DescriptionUse case model Artifact(s) The Use case model depicts the functionality of the system
from the users point of viewSystem models Artifact(s) Models that depict the system, both structurally and be-
haviorallyImplemented safetyfeature list
Artifact A list that contains all the safety features and measuresthat have been implemented
Risk overview Artifact The risk overview is a storage where all the risks uncoveredare recorded.
System analysis Activity The analysis of the system. It takes basis in the systemmodels and the Enterprise Criticality Assessment. Alsothe process may uncover critical aspects in the enterprise.
Requirements analysis Activity The analysis of the requirements. It takes basis in the Usecase models
Perform designchanges
Activity Based on risks (Risk list). The design of the system ischanged to mitigate a given risk. The Implemented featurelist is updated if the change can be classified as a feature.If any new functions, infrastructure, resources etc is addedto the environment, the Enterprise Criticality Documentis appended.
Monitor risks Activity Some risks may be a common risk for many parts of thesystem, or the risks criticality may change, therefore weneed to monitor the risks during the development of thesystem.
Record risks Activity When analyzing the system, we need to record the un-covered risks. This process appends risks to the Riskoverview.
Reliability analysis Activity The reliability of the implemented safety features and thecritical enterprise is analyzed. This activity produces theReliability assessment as well as it records risks.
Create plans and poli-cies
Activity See Create business continuity plans, Create policies andBusiness Continuity Plans
Reliability assessment Artifact The Reliability assessment is the result of the reliabilityanalysis and contains possible reliability issues
Create business conti-nuity plans
Activity The process of creating business continuity plans based onthe risks and reliability assessment. See Business Conti-nuity Plan
Create maintenanceplans
Activity The process of creating maintenance plans based on therisks and reliability assessment. See Maintenance Plans
Create policies Activity Create policies for the organization based on the risks andreliability assessment. See Policies
Table 8.1: Activities and Artifacts in the extended process - I.
110

8.2. DEFINING WORK FLOWS
Business ContinuityPlans
Artifact(s) A BCP is a plan that describes how the organizationshould act during disasters to get the functions up andrunning again.
Policies Artifact(s) A policy is rule on how the organization should handle asituation. A policy may be: “Always report a failure”
Maintenance Plans Artifact(s) A maintenance plan describes how and how often mainte-nance should be performed.
Enterprise assessment Activity The activity of assessing the critical aspects of the enter-prise. See section 4.2
Enterprise CriticalityAssessment
Artifact Documents the enterprise’s critical resources, infrastruc-ture, business goals and infrastructure
Table 8.2: Activities and Artifacts in the extended process - II.
8.2 Defining Work Flows
Figure 8.5 shows the work flow of the system safety discipline.
Each of these activities will be divided into sub-activities and their relationsto other RUP-aspects such as roles and artifacts is presented in the nextsections.
8.2.1 Enterprise Criticality Assessment
The Enterprise Critical Assessment is a document that lists the critical partsof the enterprise (See Section 4.2), and the process of creating this artifactis presented in Figure 8.6.
The process is simply listing the critical goals, functions, resources, and in-frastructure connected to the functionality implemented in that given itera-tion. This is appended to the document together with the previously definedcritical aspects, so that when the project is done, we have a complete list.Company and governmental regulations should be stated as business goals.
8.2.2 System and requirements analysis
The Risk Analysis is the process of finding, analyzing, and recording risks(Figure 8.7).
The first activity is to define the scope within which boundaries of the system
111

CHAPTER 8. INTEGRATION WITH RUP
Figure 8.5: System Safety Discipline - work flow.
Figure 8.6: Enterprise assessment - work flow.
112

8.2. DEFINING WORK FLOWS
Figure 8.7: Risk analysis - work flow.
the analysis should be performed (how wide), and how detailed the analysisshould be (how deep). The process now enters a cyclic mode where thefirst activity is to take basis in a document and/or a model representing thefunctionality that will be implement in the given iteration (Table 8.3 liststhe inputs of each method.), and identify a single risk.
Method InputPHA Use Case Diagram, System Component Diagram, Re-
quirements Document(Optional)FMEA Sub System Component DiagramHAZOP Business Sequence DiagramFTA Enterprise Criticality Assessment
Table 8.3: Risk Analysis - Configurations.
When the risk has been identified, it is analyzed. That is, the consequencesof the risk is found, and if needed, quantified. We then evaluate the criti-cality of the risk. How serious is it? Here we take basis in the EnterpriseCriticality Assessment (ECA), which defines which functions, resources, andinfrastructure that we need to protect. We must also consider company reg-ulations, governmental regulations that we need to comply with. These willbe defined in the ECA as business goals. The risk, with related information,is recorded in the risk overview. This may or may not include informationon how to treat it. If the risk analysts finds a possible treatment they mayrecord it. They may also come up with a solution for treatment under the“treat risks”-activity. When the risk is recorded, we go back to the basisdiagram/document and find the next risk. This is done until the analysis iscomplete.
113

CHAPTER 8. INTEGRATION WITH RUP
8.2.3 Risk treatment
When all of the risks connected with the given iteration’s development isfound, we can begin to treat them. We treat risks by changing the architec-ture, functionality, and by making policies. This process is shown in Figure8.8.
Figure 8.8: Risk treatment - work flow.
For each risk in the risk overview, we decide whether we want to treat itor not. If we decide to treat it, we change the architecture/functionality oradd a policy to handle it. Then we mark it as treated in the risk overview.The next step is to review the related risks. Did some of these risks alsoget treated at the same time? Did some new risks emerge? Either way, weupdate the risk overview. If the change can be called a safety feature, that isa software construct designed to handle a specific risk, we add this to a listof safety features. This list will later be used for reliability analysis.
Note that in some projects, the architects may have the rights to performchanges on the architecture, whilst in other, they have to be approved by aproject manager. This is the reason why I have kept the activity “treat risk”so general, so that organizations don’t have to leave their own policies to usethis extended process.
8.2.4 Creation of maintenance plans
Maintenance plans are plans that instruct how and when maintenance tothe system should be performed. When a part of the system is completed,
114
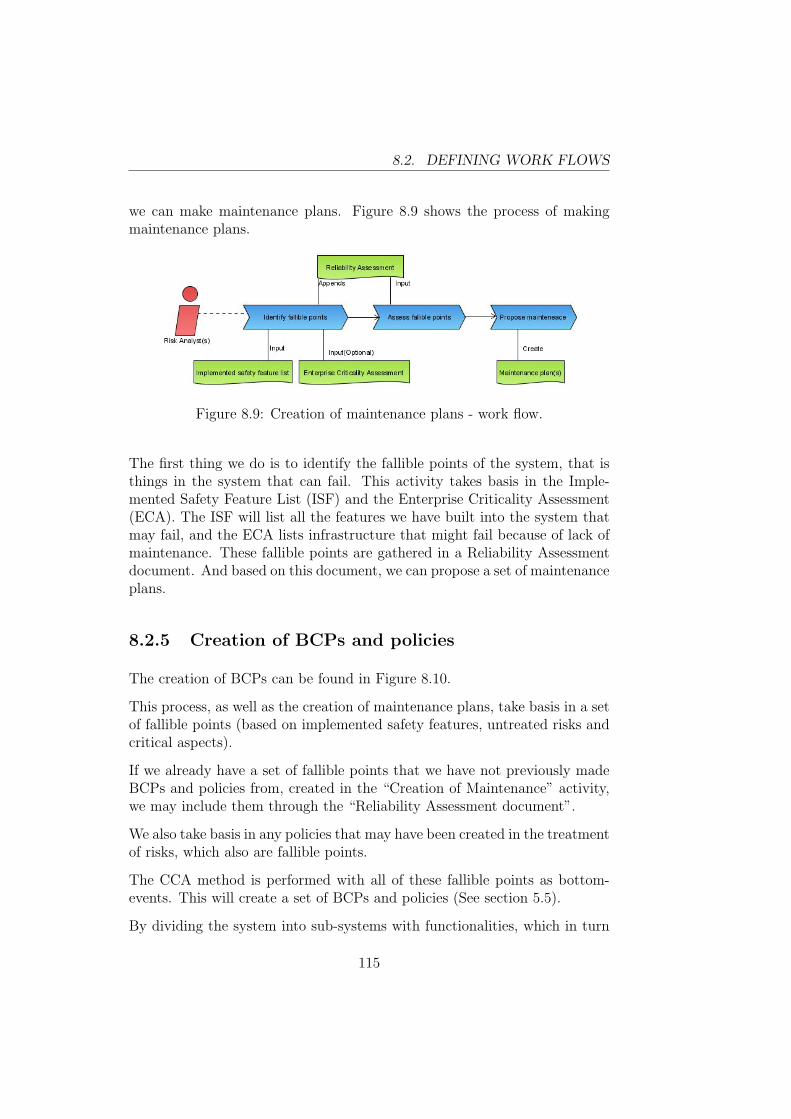
8.2. DEFINING WORK FLOWS
we can make maintenance plans. Figure 8.9 shows the process of makingmaintenance plans.
Figure 8.9: Creation of maintenance plans - work flow.
The first thing we do is to identify the fallible points of the system, that isthings in the system that can fail. This activity takes basis in the Imple-mented Safety Feature List (ISF) and the Enterprise Criticality Assessment(ECA). The ISF will list all the features we have built into the system thatmay fail, and the ECA lists infrastructure that might fail because of lack ofmaintenance. These fallible points are gathered in a Reliability Assessmentdocument. And based on this document, we can propose a set of maintenanceplans.
8.2.5 Creation of BCPs and policies
The creation of BCPs can be found in Figure 8.10.
This process, as well as the creation of maintenance plans, take basis in a setof fallible points (based on implemented safety features, untreated risks andcritical aspects).
If we already have a set of fallible points that we have not previously madeBCPs and policies from, created in the “Creation of Maintenance” activity,we may include them through the “Reliability Assessment document”.
We also take basis in any policies that may have been created in the treatmentof risks, which also are fallible points.
The CCA method is performed with all of these fallible points as bottom-events. This will create a set of BCPs and policies (See section 5.5).
By dividing the system into sub-systems with functionalities, which in turn
115

CHAPTER 8. INTEGRATION WITH RUP
Figure 8.10: Creation of BCPs and policies - work flow.
is divided into sub-functionalities, we can depict how the system grows overeach iteration in Figure 8.11.
When a high level piece of functionality like “Administrate subscribers” isdivided into several parts and developed over two or more iterations, like“Add subscriber” and “Edit subscriber”, one can do a risk analysis on theseseparate parts independently. On the other hand, when it comes to makingBCPs for this functionality, it would not make any sense to first make a BCPsto handle the situation if the “Add subscriber” functionality is down, as wellas the “Edit subscriber” functionality. It would make sense to only make aBCP for the failure of the high level functionality, “Administrate subscribers.
The result of this is that the two last activities, the creation of maintenanceplans, and BCPs and policies, of the work done in a the risk related work(Figure 8.5) need not be performed in every iteration. These activities wouldtypically be done when all of the sub-functionalities of a sub-functionality,or all the functionalities of a sub-system is done. These activities could alsobe performed when the system is fully developed.
Figure 8.12 shows how the system/requirements analysis and the reliabilityanalysis may vary from iteration to iteration. The ovally encircled items areitems which system/requirements analysis is performed on, while the rectan-gular encircled items, are items which the reliability analysis is performed(BCPs and maintenance plans).
The reliability analysis is not done until a logically grouped chunk of func-tionality is finished. Requirements/system analysis is done mainly in the first
116

8.2. DEFINING WORK FLOWS
Figure 8.11: Implemented functionality by iteration.
Figure 8.12: Reliability analysis by iteration.
117

CHAPTER 8. INTEGRATION WITH RUP
part of the project, while the reliability is done later. Also there is spent moretime on requirements analysis in the earlier stages than system analysis. Thereason for this is that it is easy to analyze the requirements at start, but thesystem analysis has to be done alongside with the design of the system. Wecan visualize all of this by extending Figure 2.4, which depicted the amountof work typically done in each iteration in each discipline, (Figure 8.13).
Figure 8.13: The phases and disciplines of the extended RUP.
8.3 Structuring Selectable Components
We can structure the work into components which can be selected at theconfiguration of the RUP process, (Figure 8.14).
The green components are components that are selectable, if one componentis selected, at least one of the sub component has to be selected.
118
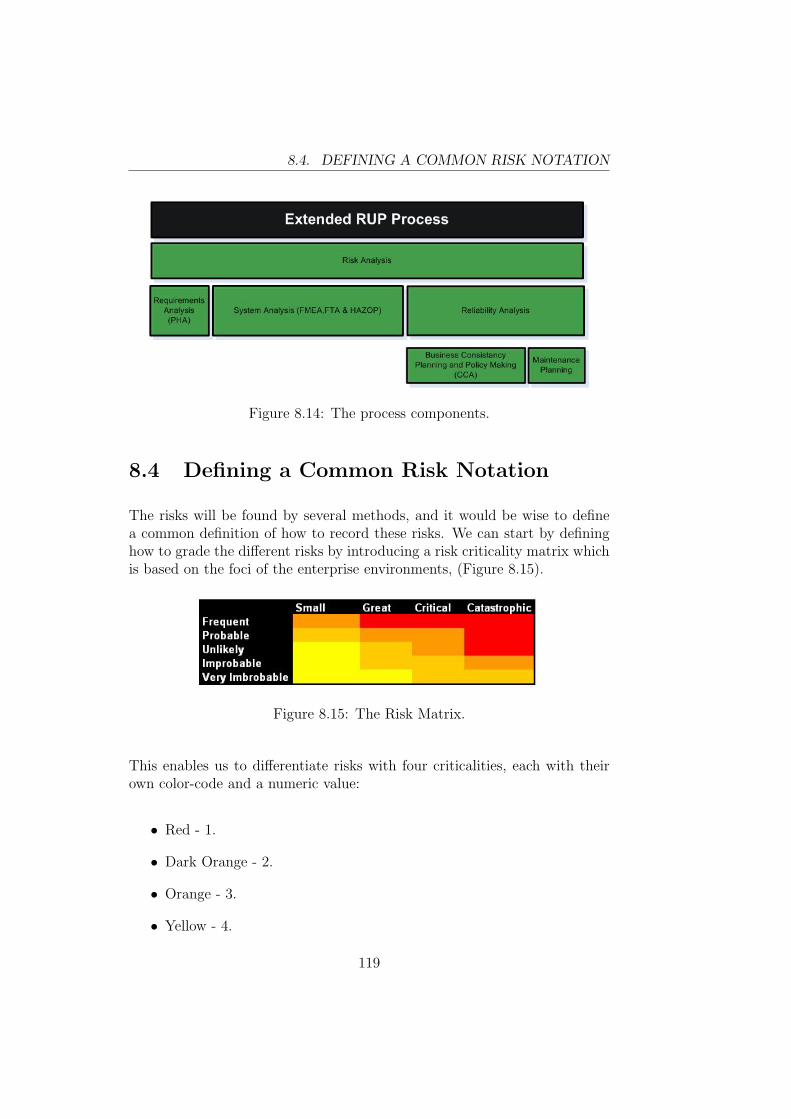
8.4. DEFINING A COMMON RISK NOTATION
Figure 8.14: The process components.
8.4 Defining a Common Risk Notation
The risks will be found by several methods, and it would be wise to definea common definition of how to record these risks. We can start by defininghow to grade the different risks by introducing a risk criticality matrix whichis based on the foci of the enterprise environments, (Figure 8.15).
Figure 8.15: The Risk Matrix.
This enables us to differentiate risks with four criticalities, each with theirown color-code and a numeric value:
• Red - 1.
• Dark Orange - 2.
• Orange - 3.
• Yellow - 4.
119

CHAPTER 8. INTEGRATION WITH RUP
Criticality is the result of the two factors consequence and likelihood. Theconsequences are divided into four categories:
Catastrophic. A risk resulting in the loss of the business, i.e bankruptcy,or loss of human lives.
Critical. A risk resulting in loss of considerable money or market, or humanhealth.
Great. A resulting in the loss of money or market.
Small. A risk resulting in no or a minor financial loss.
Also the likelihood is divided into five categories:
Very improbable. One time per 1000 years or less frequent.
Improbable. One time per 100 year.
Unlikely. One time per 10 year.
Probable. One time per year.
Frequent. One time per month, or more frequent.
Yellow risks would be ignored, orange should be monitored, dark orangeshould most likely be treated, and lastly, red risks should most definitely betreated.
Besides a way to grade the risks, we also need additional information whenwe record the risk:
• A unique ID to represent the risk.
• A description of the risk.
• The source of the risk.
• The consequence of the risk.
• Proposed preventive measures.
• Who is responsible for the risk.
• One or more pointers to a part of the system used for risk association(see section 9.2).
120

Chapter 9
Automation of the process
The extended process created in this work, as well as all extended processes,is automated by creating a RUP plug-in, which is a web based process guidethat describes the different activities, roles etc. But can the process beautomated further by the use of information technology? These are are somesuggestions on how automation may be carried out. I will consider two waysof automation: 1) Automation through diagram files, 2) Automation throughrisk association.
9.1 Automation through diagrams
Digitally stored diagrams made by modeling software have the property ofbeing able to have data extracted from them. Can we use this property tofurther automate the process? I will assess each method.
PHA
Consider a Use Case Diagram or a Component Diagram, which is the in-put of the PHA method, stored in XMI-format1. This XMI-file will haveinformation about the entities and their dependencies.
Consider the small Component Diagram in Figure 9.1. Figure 9.2 showshow the two components “Contents Server” and “Printing System” is storedin a XMI file, as well as how the association between them “get contents
1A standard format for storing UML diagrams. See section 2.7.
121

CHAPTER 9. AUTOMATION OF THE PROCESS
Figure 9.1: A small Component Diagram.
from”, can be extracted and combined into the phrase: Risks connected with“Printing system gets content from Contents Server”, which may serve asa que-phrase for the risk analysts. Likewise, similar data can be extractedfrom Use Case diagrams. This does not provide a lot of help or give a lot ofautomation to the performer(s) of the PHA method, but it could help theperformer(s) to avoid missing a component in the system, and also providea partially filled out PHA-form.
Figure 9.2: The automatic creation of cue-phrases.
FMEA
FMEA also takes basis in the Component Diagram, and therefore we mayextract the same kind of information described in 9.2. Being systematic,it requires that the performer(s) assess every possible interaction betweencomponents that interact, a generated output of all possible relations wouldlimit the possibility that the performer(s) missed a relation. Likewise, as
122

9.1. AUTOMATION THROUGH DIAGRAMS
with the automation of the PHA method, it would also save time spent inanalysis by the creation of partially filled out FMEA form.
HAZOP
If the user was presented with a Business Sequence Diagram visually, theperformers could mark each action by one or more of these four modes:
• Processing.
• Storage.
• Communication.
• Configuration.
As well as by one of these relations:
• U2A.
• A2U.
• B2C/B2B - Commerce.
• B2C/B2B - Service.
• C2C - Sale.
• C2C - Purchase.
• C2C - Exchange.
• H2H.
For example, the action “Journalist gets article contents from contents data-base” would then be labeled “Communication, Store, U2A”, which meansthat it is an action where the user interacts with an application, and thatthere is communication and storage of data involved. When all of the ac-tions were labeled like this, we could generate a schematic form with all ofthe possible guide words and parameters. As for the previous methods thiswould both be a time saver, as well as a way to ensure that we don’t missout a parameter or guide word.
123

CHAPTER 9. AUTOMATION OF THE PROCESS
The extra labeling information could be saved as an extension (See section2.7) in the XMI file. All this would require that an application could visualizethese diagrams, as well as appending additional data about the actions wasdeveloped.
FTA/CCA
Since the FTA and the CCA, do not take basis in a diagram, there is nothingto automate through diagram use.
9.2 Automation through risk association
As described in section 2.3.5, even the smallest change in a system, even thosethat are made to mitigate a risk, may cause new risks. Not only does newfeatures produce risks to everything that interacts with them, but also risks toeverything that shares the same environment. For example, the developmentof a feature that frequently takes backup of some structured data containsrisks concerned with this feature corrupting the data (and therefore halteringall other business processes that are reliant on this information), as well asthe possibility that the feature may cause the system which it is incorporatedinto, to crash (by for example poor programming, interface mismatches etc).
To combat this, I defined a sub activity in the extended RUP activity “risktreating” called “Review related risks” (See Figure 8.8). This sub-activityincludes both checking if related risks are affected, as well as recording anynew risks that may have evolved.
This poses the question: How do risks relate? Risks may be related ontwo levels. The first is a purely technical one, which components (or othersoftware constitutes at different levels) does the risk relate to, and whatother risks relate to the same component? In other words, the runtime re-lation. The second is the relation that transcends from runtime into thesocio-technical domain. Which resources, business functions, and other envi-ronmental aspects are the risks related to, and which other risks are relatedto the same?
Figure 9.3 shows how the risk overview may be linked to entities in the UMLXMI-files, by using relational pointers.
By storing the risks in a XML-format we achieve two things:
124

9.2. AUTOMATION THROUGH RISK ASSOCIATION
Figure 9.3: Risk association.
• It is an open standard that can be used on multiple platforms.
• The presentation of risks can be done through XSLT-transformations2,which most modern browsers support. The fact that the browser per-form the processing, means that we don’t have to set up a web server,but can simply share the XML and XSLT-file on the LAN, or sendthem from local user to local user. This way the risk overview caneasily be shared by distributed users.
2A transformation language that transforms XML documents into new documents, likeXML, X-HTML, and PDF
125

Chapter 10
Applying the process
Not all iterations may include safety related works, and even those whichdo, may have different configurations of methods, since all the methods areoptional in any given iteration. This creates a myriad of ways to apply theextended process to a given project. This is of course a desired feature whichprovides us with the flexibility to take on all kinds of projects.
This chapter will first show an example application, and then present anideal way to apply the safety related work, with respect to minimizing therisk work. Keep in mind that what is most effective with respect to theamount of risk work, is not the same as what is effective for the project as awhole.
For one example, even though, as you will see, the ideal way is to finish allthe business sequence diagrams before entering the Construction-phase, it isnot given that this can be done in a given project. Perhaps the stakeholderswant to see some sub-systems up and running and in use before they approvethe system wide architecture.
The ideal application should then only be something you should try to matchif the nature of the project allows you to it. Trying to force a project into it,will only halter the project as a whole.
10.1 An example application
Every project is unique. In some cases all the requirements may be readyin the initial Inception iteration, whilst in others, they may be gradually
126

10.1. AN EXAMPLE APPLICATION
Figure 10.1: Using the extended process on the case.
127

CHAPTER 10. APPLYING THE PROCESS
introduced well into the Construction-phase. In some cases the completehigh level system architecture (depicting subsystems, databases etc) may befinished before entering the Construction-phase, whilst in other projects thehigh level architecture may emerge during the Construction-iterations as thelow-level architecture is fleshed out.
Therefore it would not be possible for me to define a definite way of com-bining the four sub-activities of enterprise assessment, requirements-analysis,system-analysis, and reliability-analysis.
The strength of the sub-activities is that they can be done in almost anysequence, and in parallel. To show an application of the process, I will applyit to a specific case. The given case has the following properties.
1. All requirements are provided by the stakeholders in the Inception-phase.
2. The high level architecture is finished in the Inception-phase.
3. The interactions between the subsystems are created in the Elaboration-phase.
4. The subsystems and their architecture are created during the Construc-tion iterations.
5. No prototype is created in the Elaboration.
Figure 10.1 depicts how the extended process may be applied to this givenproject, the following sections will describe the work done in each of the fourphases. Green states are the uses of the extended process. The blue statesconstitutes other RUP base activities that have a relation with the greenstates.
10.1.1 Inception
The first step is to assess the critical aspects of the enterprise with an Enter-prise Assessment. Then a set of Use Case diagrams and System Componentdiagram(s) are created. PHA is performed one this set of Use Case diagrams.If there are more sets of Use Case Diagrams, we go through the same processagain. Lastly, the Enterprise Assessment document is updated if new criticalaspects have been uncovered.
128
10.2. THE IDEAL APPLICATION
10.1.2 Elaboration
In the Inception-phase we found a set of critical aspects. These will serve asinput for the FTA, which will hopefully uncover a set of risks which will helpus design a less critical high level architecture.
The interaction in the high level architecture is defined by making BusinessSequence Diagrams for the typical uses of the system. Each time a diagramis finished, it is analyzed by the HAZOP method. The phase is finishedby updating the Enterprise Criticality Assessment document, and if needed,perform FTA on these new entries.
10.1.3 Construction
In the Construction-phase we will see the development of the subsystems.We start by analyzing the requirements in connection with each subsystem.Then a Subsystem Component Diagram is created, which serves as the inputfor the FMEA method. After the subsystem is developed, we may performa reliability analysis on it.
10.1.4 Transition
In the Transition-phase we finish the reliability analysis of the system.
10.2 The ideal application
Note that the given application is the one I found most effective with respectto minimizing the amount of components needed to be analyzed. This doesnot directly translate into the most time effective way for the project as awhole. This is described in the introduction of this chapter.
I will propose a way to use these configurations to provide a logical comple-mentary way to use them together without too much overhead.
Risk analysis can be time consuming, and it would be preferable if we couldminimize the amount of work done. This is where the layered model inFigure 7.3 is practical. A brute force bottom up risk analysis beginning withthe analysis of all the components, then subsystems and then the complete
129

CHAPTER 10. APPLYING THE PROCESS
enterprise as one, would require a lot of work. I will now propose a methodfor limiting the analysis work.
Consider that to protect the critical parts of the enterprise, we only need toprotect the critical entities. After all, it is these critical entities which givethe system the critical property itself.
During PHA and Enterprise Assessment we manage to define which func-tionalities or requirements that are critical to the enterprise. Subsystemsthat are created to realize these critical requirements are themselves critical.This criticality can further be divided into the components in the subsystem.A critical subsystem can both have critical and non-critical components. Asubsystem that is non-critical would have no critical components.
A subsystem may also critical if none of the requirements it realizes is critical.This is where the Enterprise Environment comes in. A subsystem creatingor handling a critical resource (that is resource that a critical system wouldneed) would automatically become critical itself. Any infrastructure a criticalsubsystem uses would become critical.
Figure 10.2 depicts the interrelation between all these parts of the system.Critical components are marked red, non-critical are marked green. Onlythe red entities will need to be analyzed. But how could such a model becreated? Keep in mind that the coloring of these entities will not be knownfrom start and will have to be fleshed out during the analysis, but withthe rule set described previously in this section on how a components arerendered critical, we can establish a preferred sequence of doing the methodsthat would ultimately minimize the amount of work needed to be done inthe risk analysis.
Let us sum this rule set up in a concise manner:
1. A critical business function is realized by critical requirements.
2. Resources needed to fulfill critical requirements are themselves critical.
3. Infrastructure needed to fulfill critical requirements are themselves crit-ical.
4. Subsystems that fulfill critical requirements are themselves critical.
5. Critical subsystems are divided into at least one critical components.
130

10.2. THE IDEAL APPLICATION
Figure 10.2: Criticality throughout the enterprise.
When we first do the ECA, or PHA on the requirements, we get an idea ofwhat is critical and non-critical. We can call this the first sweep (or coloring)of the model. For example, from the PHA, it is easy to see that the salesdata is important for the pricing in an online store, but it may not be soeasy to see that the generation of this data are critical as well. The secondsweep, which is done by HAZOP, will make this “hidden” criticality appear.The Business Sequence Diagram will let us trail dependencies throughout thesystem. After the second sweep, we know which subsystems that are critical,and likewise, we know which components that are critical. By discardingthe non-critical ones, we may limit the amount of work done in FMEA inanalyzing the components. As FMEA is a time consuming method, this isvery valuable. This proposes the following way of sequencing the analysis.
1. Define critical resources, infrastructure, business functions and, require-ments - (Enterprise Criticality Assessment).
2. Perform PHA.
3. Do FTA, if needed, on critical infrastructure, business functions, busi-ness goals, and resources.
4. Do HAZOP on Business Sequence Diagram.
5. Update critical aspects (see 1.).
6. Do FTA, if needed, on new critical infrastructure, business functions,business goals, and resources.
131

CHAPTER 10. APPLYING THE PROCESS
7. Do FMEA on critical components.
8. Make maintenance plans for critical aspects.
9. Make BCPs and policies for critical business functions.
FTA and PHA would typically be done in the Inception and Elaboration.HAZOP would be used in Elaboration once the main architecture emerges.FMEA would be mainly performed in the Construction phase, where each ofthe subsystems will be created. And lastly, the reliability analysis, with CCA,would mainly be performed in late Construction and in the Transition-phase.
132
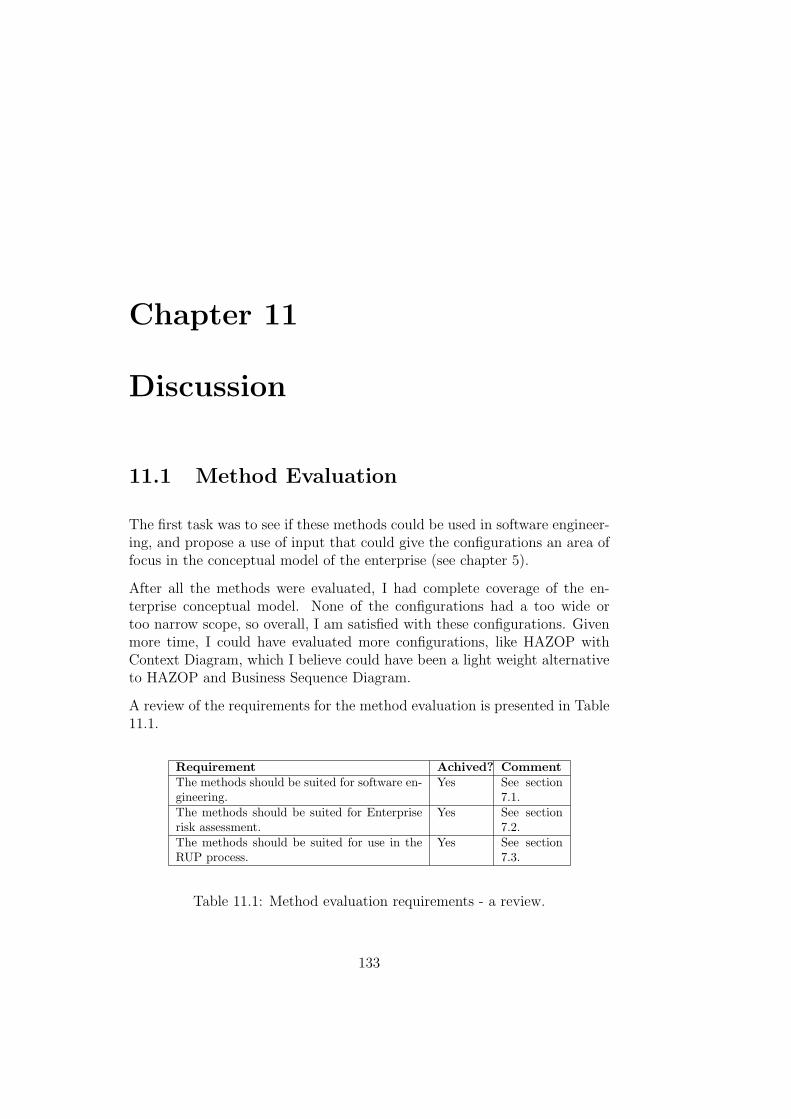
Chapter 11
Discussion
11.1 Method Evaluation
The first task was to see if these methods could be used in software engineer-ing, and propose a use of input that could give the configurations an area offocus in the conceptual model of the enterprise (see chapter 5).
After all the methods were evaluated, I had complete coverage of the en-terprise conceptual model. None of the configurations had a too wide ortoo narrow scope, so overall, I am satisfied with these configurations. Givenmore time, I could have evaluated more configurations, like HAZOP withContext Diagram, which I believe could have been a light weight alternativeto HAZOP and Business Sequence Diagram.
A review of the requirements for the method evaluation is presented in Table11.1.
Requirement Achived? CommentThe methods should be suited for software en-gineering.
Yes See section7.1.
The methods should be suited for Enterpriserisk assessment.
Yes See section7.2.
The methods should be suited for use in theRUP process.
Yes See section7.3.
Table 11.1: Method evaluation requirements - a review.
133
CHAPTER 11. DISCUSSION
11.2 Configuration Extension
The next task was to tailor the configurations for the enterprise setting. Thismeant introduction of check-lists, specialized HAZOP-parameters etc (seechapter 6). Given the time scope of the project, I am satisfied with theseextensions. Given more time, more thorough check lists that incorporatedcommon risks could have been made. As of now, the risk analyst is notasked to look after a special kind of risk, but rather look for a risk in aspecial domain of the enterprise through the use of the EIA and the EII (seesection 2.4.2).
11.3 Configuration Selection
The configurations were selected after a review of their performance on a setof issues (risks and process-aspects). The results were obtained by reasoninglogically about the nature of the problem domain and the features of theconfigurations, but also by testing the configurations on the case scenario inAppendix C.
My findings was that all the configurations performed well on some issues,and that to get a complete coverage of the conceptual mode, one had to applyall of them (see chapter 7). The fact that the configurations complementedeach other in performance on a set of risks, was not a surprise since theycomplemented in the conceptual model. At that time I had two choices,either go back to the conceptual model and propose new method/diagramconfigurations that gave a complete coverage of the conceptual model withfewer configurations, or I could keep all the configurations. I chose the latter,and made all the configurations optional, so that a user of the process that isfamiliar with the configurations could apply them when needed. This makessense as most iterations most likely won’t focus on all of the layers of theconceptual model.
11.3.1 Recommended configurations
As mentioned earlier, although the use of all configurations would provide acomplete coverage, most project managers would only use a few of them. Inthis section I will propose a set of configurations for the project managerswho want to use one, two, or three methods. I will not consider CCA, since
134

11.3. CONFIGURATION SELECTION
it is the only proposed method for reliability related analysis, and therefor isthe only choice, given that the project manager wants to perform reliabilityanalysis.
One configuration
If only one configurations is selected, I suggest that either HAZOP or PHAis selected.
HAZOP
HAZOP/Business Sequence Diagram is by far the most effective configura-tion according to my findings. The Business Sequence Diagrams capturesthe nature of the enterprise, with distributed systems and centrally storeddatabases, and a high level of information flow. The specialized parametersalso helps the risk analysts keep a centered focus on the important aspectsof the enterprise.
HAZOP/BCP had an average of 3.5/5 on enterprise risks, and 3.9/5 ongeneral software risks, which makes it an good configuration for uncoveringrisks. It achieved an exceptionally good score at 5 out of 16 risks/aspects.This is the highest one can achieve with the use of only one configuration.
PHA
Compared to the other configurations, the PHA/Use Case Diagram did notperform very well with respect to the risks, but its closeness with the baseRUP process through its input, and the fact that it can be performed veryearly and is quick, makes it a good choice. It achieved an exceptionally goodscore at 2 out of 16 risks/aspects. The PHA would be the choice of theproject manager who had the least amount of time for system safety.
Two configurations
If only two configurations are selected, I would propose to use either HAZOPand FMEA, or HAZOP and PHA.
135

CHAPTER 11. DISCUSSION
HAZOP and PHA
The reason for choosing HAZOP and PHA is mentioned in the earlier sec-tions. Together they would give an exceptional performance on 7 out of 16risks and aspects. This is the highest any two configurations can achievetogether.
HAZOP and FMEA
HAZOP is superior at for finding risks connected with the interplay betweensubsystems, but what if one found a very critical subsystem, how could youanalyze it further? The Business Sequence Diagrams of HAZOP depicts ahigh level description of this subsystem, and that will not help us to analyzethe inner workings of the subsystem. FMEA with a low level ComponentDiagram would provide a more thorough analysis of the subsystems.
Together, these two configurations would complement each other with theirhigh level/low level focus, and would give an exceptional performance 7 outof 16 risks. This is the highest score any two configurations can achievetogether.
Three or more configurations
If one wishes to use three configurations, HAZOP, PHA and FMEA is rec-ommended.
HAZOP, PHA and FMEA
This combination would both provide a high level/low level approach, andthe possibility to do risk analysis early in the project. I believe that thisconfiguration would give the best performance, time consumption considered.It would give an exceptional performance 9 out of 16 risks/aspects. This isthe highest any three configurations can achieve together.
What about FTA?
I believe that FTA should only be applied in special circumstances, that iswhen the special features of FTA is required. For example when we have
136

11.4. THE INTEGRATION
identified a single entity in the enterprise environment that we must protectat all costs, and the causal events that leads to its undesired state are unclear,and needs a thorough analysis that spans both in the technical and socio-technical domain.
11.4 The Integration
The review of the process integration requirements are found in Table 11.2.All, but three was fully achieved. These include:
• “The extended process should be integrated as seamlessly as possibly withthe preexisting RUP-process”. Given more time, we would perhaps havefound a more seamless integration.
• “The process should use System Safety methods that most easily un-covers typical risks in the enterprise setting”. Only a set of methodswas investigated, given more time, it could be possible to assess moremethods.
• “The process should offer the possibility to create Business ContinuityPlans”. The creation of BCPs was the only activity from the BCP-process that was adopted. No activities for maintaining and followingthese plans up was made. The reason for this is that my process isa development process, but once you introduce the other parts of theBCP-process, you will introduce activities in the post development. Seesection 2.5.2.
Apart from that, I am satisfied with the given integration. It is both highlyflexible, and gives the project manager a broad range of tools to uncover risksin a given setting. That being requirements, high level architectural design,or low level architectural design.
11.5 Process Automation
The automation proposal (chapter 9) was not a central part of my work. Ibelieve, however, I found some minor points of automation. I am certainthat there is a lot more potential for automation, if only given more time forinvestigation.
137
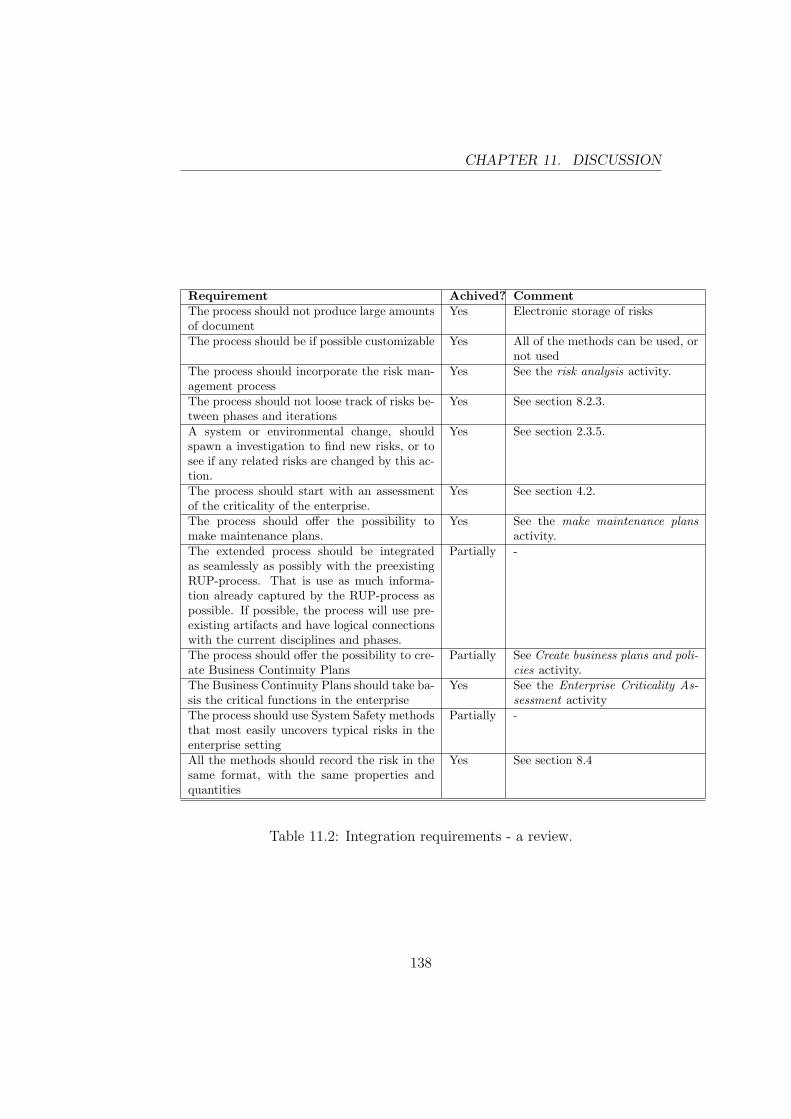
CHAPTER 11. DISCUSSION
Requirement Achived? CommentThe process should not produce large amountsof document
Yes Electronic storage of risks
The process should be if possible customizable Yes All of the methods can be used, ornot used
The process should incorporate the risk man-agement process
Yes See the risk analysis activity.
The process should not loose track of risks be-tween phases and iterations
Yes See section 8.2.3.
A system or environmental change, shouldspawn a investigation to find new risks, or tosee if any related risks are changed by this ac-tion.
Yes See section 2.3.5.
The process should start with an assessmentof the criticality of the enterprise.
Yes See section 4.2.
The process should offer the possibility tomake maintenance plans.
Yes See the make maintenance plansactivity.
The extended process should be integratedas seamlessly as possibly with the preexistingRUP-process. That is use as much informa-tion already captured by the RUP-process aspossible. If possible, the process will use pre-existing artifacts and have logical connectionswith the current disciplines and phases.
Partially -
The process should offer the possibility to cre-ate Business Continuity Plans
Partially See Create business plans and poli-cies activity.
The Business Continuity Plans should take ba-sis the critical functions in the enterprise
Yes See the Enterprise Criticality As-sessment activity
The process should use System Safety methodsthat most easily uncovers typical risks in theenterprise setting
Partially -
All the methods should record the risk in thesame format, with the same properties andquantities
Yes See section 8.4
Table 11.2: Integration requirements - a review.
138

11.5. PROCESS AUTOMATION
The review of the process automation requirements is found in Table 11.3.One was fully archived, another was not. The one that was only partiallyachieved is:
• “The automation should make the process easier to perform”. The riskassociation feature may add complexity to the usability of the process,but it is needed to add efficiency.
This is really just a minor point. It is only natural that some measures toincrease affectivity will result in a more complex use.
Requirement Achived? CommentThe automation should make the process moreefficient.
Yes -
The automation should make the process eas-ier to perform
Partially -
Table 11.3: Automation requirements - a review.
139
Chapter 12
Conclusion and future work
12.1 Conclusion
The project was started by doing a literature study of system safety, RUP,and enterprise systems.
Based on this study I defined a conceptual layered model of the enterprisewhich was both technical and socio-technical. A set of System Safety meth-ods combined with UML models, called configurations, was selected. Theseconfiguration focused on different parts of the conceptual model. This wasdone so that the we had a set of methods with a narrow focus that could beapplied to specific parts of the system, rather than having a lot of generalmethod with wide focus.
The configurations (five of them in number) were altered and extended tobest provide us with a good tool for analyzing the enterprise, and then eval-uated with respect to their performance on a set of risks that typically hauntthe enterprise and general software projects. The configurations was alsoevaluated on their ability to be fitted to RUP. HAZOP and Business Se-quence Diagram came out as the far superior configuration. Based on thisevaluation, all of the configurations where selected to be integrated to theprocess, since they all complement each other.
The configurations was then integrated into the RUP process. This wasachieved by creating four risk-analysis disciplines. 1) The analysis of theenterprise environment, which provided the risk analysts knowledge aboutthe given enterprise in question. 2) The analysis of the requirements. 3)
140

12.2. FUTURE WORK
The analysis of the system, both from a high level and low level architecturalview. 4) The analysis of the reliability of the enterprise as a whole.
A typical project would not use every configuration. I therefore proposedsome suggestions for projects that want to use either one, two, or three ofthe configurations.
For the projects that only wishes to use a single configuration, I recommendHAZOP/Business Sequence Diagram or PHA/Use Case Diagram.
For the projects that wishes to only use two configurations, I recommendHAZOP/Business Sequence Diagram and FMEA/Component Diagram, orHAZOP/Business Sequence Diagram and PHA/Use Case Diagram.
For the projects that wishes to use three methods, I recommend HAZOP/BusinessSequence Diagram, PHA/Use Case Diagram, and FMEA/Component Dia-gram.
I also proposed an ideal sequence of applying the methods that minimizedthe risk work,if the project manager chose to use all of the methods.
Lastly, a proposal for automating the process beyond the creation of a RUPplug-in (an electronic process guide) was proposed.
12.2 Future work
I propose the following for future work:
Study more relevant standards. Like the IEC62198 - ”Project risk manage-ment”, IS 13335 - ”Management of Information and Communication Tech-nology Security”, and 15408 - ”Information Technology Risk”.
Create a more detailed conceptual model of the enterprise to ensure that theselected method has skipped an important aspect.
Evaluate more system safety methods like ”Safety Management and Organi-zation Review Technique” (SMORT) and Markov Analysis. Also investigatemore configurations. One example mentioned earlier was Context Diagramand HAZOP.
Incorporate the field of Information Security better into the process, eitherthrough new activities, or by extending the methods with more elaboratecheck-lists. Currently, only the HAZOP/Business Sequence Diagram can
141

CHAPTER 12. CONCLUSION AND FUTURE WORK
be said to have a good basis in Information Security through the use ofspecialized parameters.
Evaluate the method configurations by giving a set of industrial cases andinstructions to a a group of developers, and measure the results to make abetter selection.
Create a RUP plug-in based on the proposed activities and create softwarethat implements the features described in the chapter 9.
Extend the Enterprise Criticality Assessment to capture more qualities thanvalue and availability. Information, for example could be rated on the neededlevel of confidentiality.
142

Appendix A
Comparison of methods -Rationale
A.1 Enterprise risks
Loss of service
PHA and Use Case Diagram. The Use Case Diagram will describethe system at a very early point of development. The use case will explainthe functional requirements of the system, that is, how do the stakeholderswant the system to function. We can divide services into two kinds, oneis the service that is not specified by the stakeholders, but implemented bythe developers to fulfill a functional requirement. The second is a servicespecified by the stakeholders as a part of the functional requirement. Thelatter will of course be described in the Use Case Diagram, the prior will notbe introduced until later in the system design. Given this, I would say thatthe PHA method on the Use Case Diagram provides a fairly good way touncover risks connected with loss of service. (score: 3/5)
FMEA and Component Diagram. The System Component Diagramdepicts the subsystems and services such as databases and external services,which is a very good foundation to reason about the implication of loss ofservice. The FMEA method forces us to consider the interaction betweenthese. A Subsystem Component Diagram, on the other hand, depicts thecomponents of the subsystem, which does not that often consist of services.
143

APPENDIX A. COMPARISON OF METHODS - RATIONALE
Services are used to provide a functionality across multiple systems. OverallI would say that it gives a satisfactory way of uncovering risks connectedwith the loss of service. (score: 3/5)
HAZOP and Business Sequence Diagram. When the system designhas reached the level of the business sequence diagram, every use of a servicewill be known and described. The sequence diagram will not only showwho invokes the service, but also how, why, and the relation with otherevents. The last point will make it easy to determine the consequences of theparticular loss of service. Overall, this provides an excellent way of reasoningabout risks connected with the loss of service. (score: 5/5)
FTA. The FTA method takes basis in an unwanted event (top event) andpropagates backwards by dividing the event into causing events. This re-quires the performer(s) of the methods to identify the denial of service as apossible consequence. Once that has happened, the only consequence of thisloss of service is the top-event. By setting ’loss of service X’ as a top event,we can reason about how this failure comes about (the causes), but not theconsequences of it. Overall FTA is a fairly good method, it is good at findingthe causes of a loss of service, but not good at determining the consequences.(score: 3/5)
CCA. The CCA starts by defining a set of triggering events. Denial ofservice would be a suitable candidate for such an event. It would be easy touncover the consequences, but impossible to find the causes of loss of service.In this way it would be complimentary to FTA. (score: 3/5)
Conclusion. We see that the risk of loss of service is divided into two types,the causes and the consequences. HAZOP, FMEA, and PHA caters the needof analyzing both these aspects. HAZOP comes out as the superior method.CCA’s strength lies with the consequences, and FTA with the causes. Theirweaknesses lies in their lack of ability to analyze the other aspect.
144

A.1. ENTERPRISE RISKS
Legacy integration problems
PHA and Use Case Diagram. The Use Case Diagram is made at a veryearly stage and does not necessarily show every subsystem or the intercon-nection of the systems. Rather it captures the uses of the systems. Thismakes this combination of model and method a very poor tool for handlingintegration problems. (score: 1/5)
FMEA and Component Diagram. The Component Diagram will showevery component (legacy or newly developed) of the system and how theyare connected. The FMEA method will force us to systematically go thoughevery possible interaction between these. This gives an excellent way touncover the problems concerning integration of the new and the old. (score:5/5)
HAZOP and Business Sequence Diagram. The Business Sequence Di-agrams show the sequences of actions that the systems performs. This modelis based on the assumption that the integration is complete and successful.It can be used to analyze the consequences of a legacy component/subsystemthat does not interact the way it should with a newly developed one. How-ever, the Business Sequence Diagram does seldom go into component-leveldetail, rather into subsystems. Overall it is mediocre method. (score: 2.5/5)
FTA. The legacy integration can be introduced in the FTA analysis in twoways. Either it must be specified as a top-event, or it must be found as acause for the top-event. Both require that the participants of the methodhas knowledge about legacy integration problems and identifies it during thesession, unlike the systematic FMEA with Component Diagram which forcesthe participants of that method to consider every possible inter-componentialissue. Overall the FTA does not offer a good way to handle these risks. (score:1.5/5)
CCA. The CCA method suffers from the same faults as the FTA, as it isalso is dependent on the knowledge of the participants. The CCA, however,provide a much better way to find and reason about the consequences oflegacy integration problems, but this is only a slight improvement. (score:2/5)
145

APPENDIX A. COMPARISON OF METHODS - RATIONALE
Conclusion. The one method that really stands out on this issue is theFMEA with Component Diagram and a systematic approach. HAZOP whichtakes basis in a partially componential model and is systematic also pro-vides some help. The others, on the other hand, have their basis in non-componential diagrams, are non-systematic of nature, and performs poorly.
Loss of vital data
PHA and Use Case Diagram. The Use Case Diagram shows mainly theuses of the system. The information flow and storage throughout the systemcan be captured as a part of the functional requirements, but it would notgive a complete coverage. Mainly the user-related information queries wouldbe captured, but the information queries engaged by systems would not becaptured by the Use Case Diagram. (score: 2/5)
FMEA and Component Diagram. The system Component Diagrams(that depicts the subsystems and their interrelation) would provide a goodbasis to reason about risks connected to the loss of vital data. The subsystemComponent Diagram (that depicts the software components and their inter-relation) would provide a rather poor basis, as information flows from systemto system, rather than from component to component within a subsystem.(score: 2/5)
HAZOP and Business Sequence Diagram. The Business SequenceDiagram will capture the information flow of the organization. It will alsoshow which actions that were previously performed and the action that willfollow. HAZOP provides a way to systematically consider different thingsthat can go wrong. Altogether this gives this configuration of method andinput a good way to deal with the protection of vital data. (score: 4/5)
FTA. The FTA provides a very good way to find the aspects that pose athreat to the vital data. This requires that the performer identifies the vitaldata and uses “Vital Data X is unavailable/lost” as a top-event as describedin the section about FTA. FTA provides an excellent way to protect businesscritical data. (score: 5/5)
146

A.1. ENTERPRISE RISKS
CCA. The CCA method takes basis in an unwanted event. The performerof the method needs to know what data is business critical and the events thatmay render the data to become unavailable. It is a good method in connectionwith the analysis of the reliability of the barriers and safety procedures thathas been provided to strengthen the availability of the business critical data.(score: 4/5)
Conclusion. PHA and FMEA performs poorly with respect to this risk,HAZOP and CCA provides a fairly good approach. FTA stands out as thewinner in terms of finding causes that can threaten the vital data, which ismore important when considering risks, than the effects of losing vital data,which the CCA-approach would do.
Network failure
PHA and Use Case Diagram. The Use Case Diagram will mainly cap-ture the uses, not which parts of the system that uses the network, andtherefore it hard to use this configuration of method and model to reasonabout network failures. (score: 1/5)
FMEA and Component Diagram. The System Component Diagram,which shows the interrelation between subsystems and enterprise resourceswill provide a good way to assess the risks connected with network failure, buta poor way to assess the risks that cause network failure. The more detailedSubsystem Component Diagram will not show the same interrelatedness ofcomponents. Overall a poor method. (score: 2/5)
HAZOP and Business Sequence Diagram. The Business SequenceDiagram and the HAZOP-method will perform well with respect to the con-sequences of network failure, as network activity will be shown in the model.With respect to the causes of network failure, it will not perform that well.Overall a mediocre method. (score: 2.5/5).
FTA and CCA. Again we see the complimentary features of FTA andCCA. CCA will give us a good way to find the risks of network failure, whileFTA will provide a good way of finding the causes of network failure. Theyboth provide a good way to find these risks. (score: 4/5)
147

APPENDIX A. COMPARISON OF METHODS - RATIONALE
Conclusion. FTA and CCA provides the best way to uncover network fail-ure risks, the other methods perform poorly. The exception being HAZOP,which constitutes a mediocre approach.
Ripple Effects
PHA and Use Case Diagram. The use case shows the uses of the system,but not the interconnectedness of the functions. The Use Case may showhow the user adds a new invoice to the database, but not the effects of thisinvoice not being recorded as intended. It can to some degree show whichusers that share the same functionality (by sharing a functionality “bubble”in the model), but it is overall a poor method. (score: 2/5)
FMEA and Component Diagram. The system Component Diagram,which shows the interrelation between subsystems and enterprise resources,gives a fairly good way to reason the ripple effects that can occur when asystem or resource is down. The more detailed Component Diagram, whichdivides the subsystems into components, does only show the local effects ofa failure. Overall a mediocre method. (2.5/5)
HAZOP and Business Sequence Diagram. The Business Sequence Di-agram will show the actions performed by the system. If it fails at one point,one can easily see which other parts of the organization that are involved.The systematic approach provided by HAZOP makes this combination verythorough. (score: 4/5)
FTA. The study of ripple effects requires a bottom-up process, whilst theFTA is a top-down method. We can find causes to an event, but not theconsequences. (score: 1/5)
CCA. Unlike FTA, CCA is a bottom-up method that takes basis in a singleevent and investigates the consequences of that event. This makes the CCAa good method for studying risks with respect to ripple effects. (score: 4/5)
Conclusion. HAZOP and CCA stand out as the two methods that give usa good approach in studying the ripple effects in an enterprise system.
148
A.1. ENTERPRISE RISKS
Human errors
PHA and Use Case Diagram. The Use Case Diagram captures thehuman involvement with the system, and therefore provides a good basis tofind risks concerning human errors. This analysis should be performed twice,once before the development of the system starts, so that the system may bedesigned to limit human errors, and once after the design is finished, so onecan find the risks connected to the use of the developed system. (score: 5/5)
FMEA and Component Diagram. The only human involvement shownin the Component Diagram is graphical user interfaces (GUI), which whenanalyzed, can uncover faults concerning misuse of the GUI. (score: 2/5)
HAZOP and Business Sequence Diagram. The Business SequenceDiagram will show the uses of the system performed by the users as well asthe system action that follow. This way one can study both where humanerrors can occur, and find the consequences they cause in the system. (score:3/5)
FTA. The FTA provides an excellent way to handle socio-technical aspectssuch as human errors, but it requires that the performer(s) of the methodrecognizes them. Overall a good method. (score: 4/5)
CCA. The CCA provides a good way to both find human errors and studythe consequences of them. The first requires that the bottom-event is anevent that somehow could be stopped by a human, but that this human failsin this task. The latter requires that we set a human error as bottom-eventand reason about the consequential events. (score: 4.5/5)
Conclusion. All of the methods except the FMEA do an good job withthis particular risk.
149

APPENDIX A. COMPARISON OF METHODS - RATIONALE
A.2 General software risks
Storage capacity problems
PHA and Use Case Diagram. The Use Case Diagram makes it hard touncover the risks of storage capacity. First, there must be defined a pieceof functionality that explicitly states that it stores information and then therisk analyst has to identify the risk of storage problems. (score: 1.5/5)
FMEA and Component Diagram. The system component overviewdiagram, will show how the different systems communicate with each otherand with resources (such as databases). This can to some degree uncoverstorage capacity risks, but it lacks a detailed process overview. (score: 2.5/5)
HAZOP and Business Sequence Diagram. Unlike the Component Di-agram, the Business Sequence Diagram shows in more detail the storage pro-cedures that the system uses, details like when, and which operations thatfollows and precede current storage operations. Given the systematic natureof the HAZOP method, with specialized guide words and parameters for theenterprise systems, this gives the analyst a good tool for determining theconsequences of such problems. (score: 4.5/5)
FTA. The FTA provides a fairly good way to uncover problems of storage,but not to find consequences of a storage problem. (score: 3.5/5)
CCA. The CCA provides a good way to handle consequences of storageproblems once it is identified. With this information the developer can de-termine whether it is an acceptable risk or not. (score: 2.5/5)
Conclusion. Again, HAZOP outperforms the other methods and FTA alsocomes out well. The rest of the methods perform mediocre.
Transport capacity problems
PHA and Use Case Diagram. The Use Case Diagram does not capturethe information flow in the systems, and is therefore a poor basis for spotting
150
A.2. GENERAL SOFTWARE RISKS
potential transport capacity problems. (score: 1/5)
FMEA and Component Diagram. The Component Diagram at enter-prise level may gives fairly good overview of which systems that communicate,but it does not depict what kind of information that is sent, or when it issent. (score: 2.5/5)
HAZOP and Business Sequence Diagram. The Business Sequence Di-agram extends the Component Diagram by offering information about whatkind of data that is sent, when, and in what sequence. The systematic HA-ZOP method with guide words and parameters created to handle enterprisesituations gives the analyst an excellent tool for spotting transport capacityproblems. (score: 4.5/5)
FTA. Given that the performer(s) of the FTA method is acquainted withtransport capacity problems, it could be easily derived from using top-eventslike “Service X fails”. (score: 3.5/5)
CCA. CCA can deal with the consequences of transport capacity problems,by using it as an bottom-event, but it is very hard to find the causes oftransport capacity related problems. (score: 2.5/5)
Conclusion. HAZOP again outperforms the other methods, the FTA alsocomes out well. The rest of the methods perform poor to mediocre.
Process capacity problems
PHA and Use Case Diagram. The Use Case Diagram shows function-ality, which correlates to processing of some kind. (score: 2.0/5)
FMEA and Component Diagram. The enterprise level Component Di-agram depicts the subsystems and the resources and the uses between them.It is very hard to extract any processing information from it. The systemlevel component diagram, on the other hand, depicts the inner workings ofthe subsystems, and makes a good basis to study processing capacity prob-lems using the FMEA. (score: 2.0/5)
151

APPENDIX A. COMPARISON OF METHODS - RATIONALE
HAZOP and Business Sequence Diagram. The Business SequenceDiagram typically shows uses in the system which covers both processingand communication. Not only does it show what processing is done, but alsowhen, and in which sequence. Given the systematic nature of HAZOP, withdesignated parameters and guide words to suit the enterprise developer, thisis an overall good method. (score: 4.5/5)
FTA. The FTA would easily allow the performer(s) of the method to iden-tify processing problems by using a top event like “Service X fail”, but itsnon-systematic nature would force the performer(s) themselves to spot it.(score: 3.5/5)
CCA. The CCA method would not find a set of possible processing prob-lems and their causes given its bottom-up nature, but it would let us analyzethe consequences of such problems. (score: 2.5/5)
Conclusion. Not surprisingly it is HAZOP that takes basis in a process-oriented model that comes out as the winner.
Information semantic/syntactic errors
PHA and Use Case Diagram. The Use Case Diagram can depict theflow and processing of data as pieces of functionality, but the performer(s)of the method must have knowledge about both the possibility of syntac-tic/semantic errors and about what kind of information that is sent. (score:2/5)
FMEA and Component Diagram. The Component Diagrams wouldshow the different uses of information, but just like use case, it would requirethat someone has knowledge about both these kinds of error and in-depthknowledge about the actual information being handled. (score: 2.5/5)
HAZOP and Business Sequence Diagram. The HAZOP method withspecialized guide words and parameters, which was presented earlier, usesboth semantics and syntax as parameters. The Business Sequence Diagram
152

A.3. PROCESS ASPECTS
gives a detailed overview of information flow and processing, resulting in anexcellent method. (score: 5/5)
FTA. The FTA could uncover these errors, but that would require that theperformer(s) identified them as the root cause of some other event. (score:3/5)
CCA. CCA would be suitable for analyzing the consequences of these er-rors once they were identified. Syntactic errors would be quite easy to removeonce identified (parse checks etc). Semantic errors on the other hand, espe-cially human related errors, would be harder to fully eliminate, and one wouldbenefit from investigating them further once they are found. (score: 2.5/5)
Conclusion The HAZOP incorporates semantic and syntactic errors asa parameter and achieves a perfect score. The rest of the methods scoremediocre scores on this issue.
A.3 Process aspects
Required method knowledge
PHA and Use Case Diagram. The PHA is very easy to learn, andis very straight forward. None of the three stages would be confusing fornewcomers. (score: 4/5)
FMEA and Component Diagram. The FMEA is a fairly simple method,but adds some complexity comparing to the PHA. (score: 3/5)
HAZOP and Business Sequence Diagram The HAZOP is a compli-cated method. The approach with parameters and guide words is complex.(score: 2/5)
FTA. The FTA method is a moderately complex method to learn, thegreatest obstacle is learning the logical symbols. (score: 2.5/5)
153

APPENDIX A. COMPARISON OF METHODS - RATIONALE
CCA. The CCA is simpler than the FTA, it has only two possible outputs,while the FTA has several inputs. (score: 3/5)
Conclusion. All the methods except HAZOP and FTA are fairly easy touse.
Required system knowledge
PHA and Use Case Diagram. PHA does not require that the performershave a lot of knowledge about the specific system. The required informationthat the method takes basis in, is provided by the use case model. (score:4/5)
FMEA and Component Diagram. The FMEA requires that the per-former has a good knowledge about the system, since the method requireshim or her to consider the different fault modes impact the other functions.(score: 2/5)
HAZOP and Business Sequence Diagram. When the performer(s)of the method analyzes the consequences of a risk, the Business SequenceDiagram provides a good basis as it depicts the how the enterprise events arerelated, yet some knowledge is preferable to fully identify all consequences.(score: 2.5/5)
FTA. The FTA requires that the performer(s) has a broad knowledge ofthe system, as they do not have a model to draw possible causes from. (score:1.5/5)
CCA. The CCA, like the FTA, requires that the performer(s) has a goodknowledge about the system and the environment. (score: 2/5)
Conclusion. Most of the method requires some knowledge about the sys-tem, the exception being the PHA. One obvious reason for this is the factthat when the PHA is performed, very little of the system design is done.
154

A.3. PROCESS ASPECTS
Time consumption
PHA and Use Case Diagram. The PHA is quick and simple method.(score: 4/5)
FMEA and Component Diagram. The systematic nature of FMEAmakes it a very time consuming method. (score: 1/5)
HAZOP and Business Sequence Diagram. Just like FMEA, the sys-tematic nature of HAZOP makes it a very time consuming method. (score:2/5)
FTA and CCA. Both the FTA and CCA are not time consuming methods.The fact that they are not systematic, gives the performer(s) the possibilityto only investigate the risks they see fit to investigate. (score: 3/5)
Conclusion. Not surprisingly, the systematic methods are the ones thattakes long time to perform. Systematic methods are great for thoroughanalysis, but it comes at the price of high time consumption.
Relations to preexisting artifacts
PHA and Use Case Diagram. The Use Case Diagram is perhaps themost central model in RUP and is always created early in the project. Thismeans that all of the input to this method could be taken from preexistingartifacts. (score: 5/5)
FMEA and Component Diagram. The Component Diagram is an op-tional model in RUP, that is, it is not required that the architects of thesystem uses it. (score: 1/5)
HAZOP and Business Sequence Diagram. The Business SequenceDiagram could be based on the Business use case diagrams, which wouldgive some relation with preexisting artifacts. (score: 2/5)
155

APPENDIX A. COMPARISON OF METHODS - RATIONALE
FTA. The FTA takes basis in the critical resources, infrastructure, andfunctions in the enterprise. A good place to start for identifying these wouldbe the business use cases. (score: 2/5)
CCA. I see no relation between the artifacts in RUP and the CCA method.(score: 1/5)
Conclusion The PHA takes basis in a RUP artifact, the others use to somedegree the pre-existing artifacts, but overall there is little in common.
Documentation generation and consumption
PHA and Use Case Diagram. The method does not produce largeamounts of documentation. The documentation consists mainly of possi-ble design measures to meet a set of risks identified at a very early stage ofthe development. (score: 3/5)
FMEA and Component Diagram. The systematic nature of the FMEAforces us to consider all possible fault modes, which will produce large amountsof documentation. (score: 1.5/5)
HAZOP and Business Sequence Diagram. The systematic nature ofthe HAZOP forces as to consider a large set of possible faults, which willproduce large amounts of documentation. (score: 1.5/5)
FTA and CCA. Both FTA and CCA produce very little documentationsince much of the output is in the form of a model. (score: 3.5/5)
Conclusion. The systematic methods produce large quantities of docu-mentation compared to the non-systematic. The FTA and CCA method,which output, a model, produces smaller quantities of documentation.
156

Appendix B
Enterprise HAZOP parametersand guide words
I took basis in a set of generic HAZOP guide words, [20], and selected themost relevant for each parameter, as some of them made no sense in combina-tion with the parameters. An example is “early destination” which makes nosense, and could perhaps be interpreted as something being delivered earlyto it’s destination, but I already have a parameter defined as time to handlethat. By eliminating some guide words, I can make the method less timeconsuming. Table B.1 shows the generic guide words I have proposed.
Guide word DescriptionNo or not Negation of intentMore or less Increase and decreaseAs well as Qualitative increasePart of Qualitative decreaseReverse The oppositeOther than SubstitutionBefore or after Deviance in clock timeEarly or Late Deviance in sequenceNever Never occurs
Table B.1: Generic guide words and their meaning.
157

APPENDIX B. ENTERPRISE HAZOP PARAMETERS AND GUIDEWORDS
Parameter Description Guide wordsAmount The amount of data that is
sentmore, less, no
Time The time which the communi-cation is performed
before, after, earlier, later,never
Destination The destination of the data no, other than, more, lessLoad The load of the medium of
communicationless, more, no
Speed The speed of the communica-tion
less, more, no
Validity The validity, or correctness ofthe communication
other than, reverse
Table B.2: IT Operation Mode - Communication - Parameters.
Parameter Description Guide wordsLoad The load of the hardware do-
ing the processingless, more, no
Validity The validity of the processing,that is the correctness
other than, reverse
Table B.3: IT Operation Mode - Processing - Parameters.
Parameter Description Guide wordsTime The time the storage is per-
formedbefore, later, never
Capacity The capacity of the mediumthat the media is stored to
no, less
Destination The destination of the data no, other than, more, lessAmount The amount of data that is
storedmore, less, no
Table B.4: IT Operation Mode - Storage - Parameters.
Parameter Description Guide wordsValidity The validity, or the correct-
ness of the configurationother than, reverse
Time The time which the configura-tion is done
before, after, earlier, later,never
Table B.5: IT Operation Mode - Configuration - Parameters.
158

Parameter Description Guide wordsSemantic coherence To which degree the user
understands what the inputmeans
no, other than, as well as, partof, reverse
Syntax The syntax of the entereddata, either in format or se-quence
other than
Validity The validity, or correctness ofthe data entered
other than, reverse
Table B.6: Enterprise Relation - U2A - Parameters.
Parameter Description Guide wordsSemantic coherence To which degree the user un-
derstands the outputno, other than, as well as, partof, reverse
Syntax The syntax of the presenteddata, either in format or se-quence
other than
Validity The validity, or correctness ofthe data presented
other than, reverse
Table B.7: Enterprise Relation - A2U - Parameters.
Parameter Description Guide wordsValidity The validity, or correctness of
the service.other than, reverse
Availability The availability of the service no, part of, lessSemantic coherence To which degree the user un-
derstands the serviceno, other than, as well as, partof, reverse
Table B.8: Enterprise Relation - B2B/B2C - Service - Parameters.
Parameter Description Guide wordsValidity The validity, or correctness of
the purchaseother than, reverse
Availability The availability of the itemsold
no, part of, less
Semantic coherence To which degree the user un-derstands the product beingsold
no, other than, as well as, partof, reverse
Table B.9: Enterprise Relation - B2B/B2C - Purchase - Parameters.
159

APPENDIX B. ENTERPRISE HAZOP PARAMETERS AND GUIDEWORDS
Parameter Description Guide wordsValidity The validity, or correctness of
the sale.other than, reverse
Semantic coherence To which degree the user un-derstands the product
no, other than, as well as, partof, reverse
Table B.10: Enterprise Relation - B2B/B2C - Sale - Parameters.
Parameter Description Guide wordsValidity The validity, or correctness of
the purchaseother than, reverse
Availability The availability of the itemsold
no, part of, less
Semantic coherence To which degree the user un-derstands the product beingsold
no, other than, as well as, partof, reverse
Table B.11: Enterprise Relation - C2C - Purchase - Parameters.
Parameter Description Guide wordsValidity The validity, or correctness of
the saleother than, reverse
Semantic coherence To which degree the user un-derstands the product
no, other than, as well as, partof, reverse
Table B.12: Enterprise Relation - C2C - Sale - Parameters.
Parameter Description Guide wordsValidity The validity, or correctness of
the exchangeother than, reverse
Semantic coherence To which degree the con-sumers understands the ex-change
no, other than, as well as, partof, reverse
Table B.13: Enterprise Relation - C2C - Parameters.
160

Parameter Description Guide wordsIntent The Intent of the initiator other thanValidity The validity, or correctness of
the interactionother than, reverse
Semantic coherence To which degree the personsmean the same thing
no, other than, as well as, partof, reverse
Time The time of the interaction before, after, earlier,later,never
Table B.14: Enterprise Relation - H2H - Parameters.
161
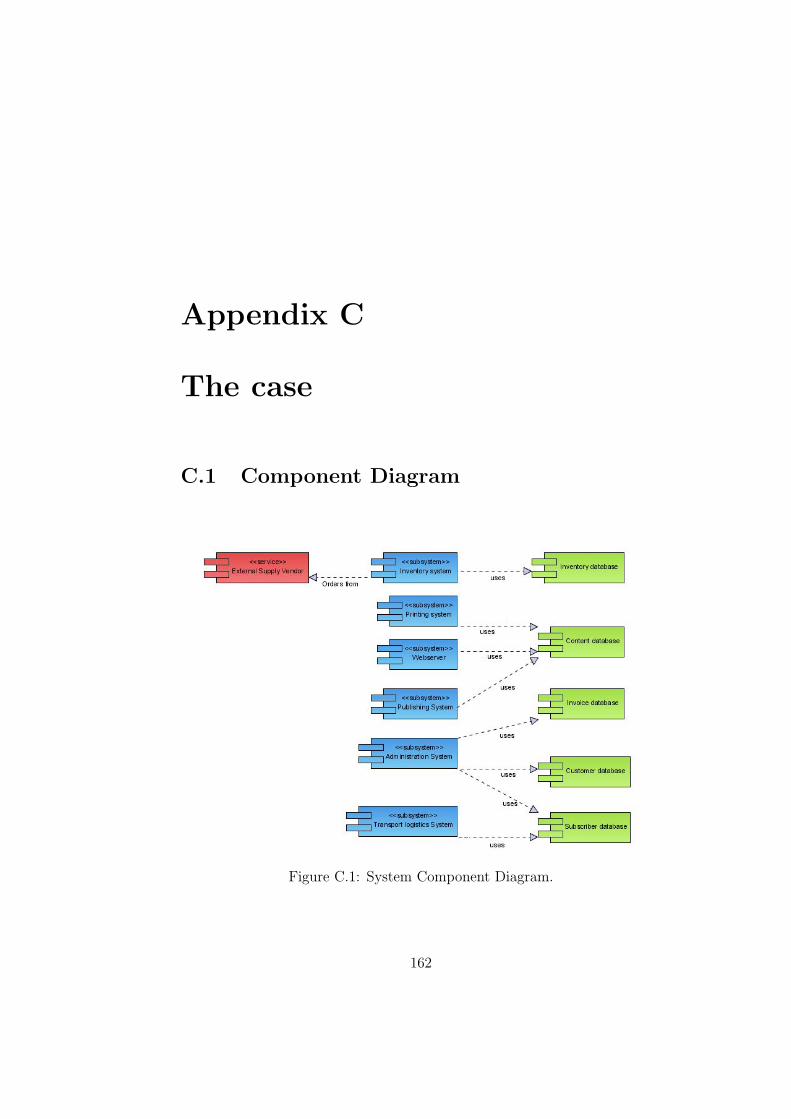
Appendix C
The case
C.1 Component Diagram
Figure C.1: System Component Diagram.
162

C.2. BUSINESS SEQUENCE DIAGRAMS
C.2 Business Sequence Diagrams
Business sequence diagrams is an efficient way to model the business flow inthe organization. Unlike standard sequence diagrams, which are constrainedto one system, this model encompasses also business entities such as cus-tomers, employees, database servers, systems etc.
Figure C.2: Business Sequence Diagram - Publishing system.
C.3 Use Case Diagrams
Printing System
Name: Check Ink LevelsActor: PrintManager
163

APPENDIX C. THE CASE
Figure C.3: Business Sequence Diagram - Printing system.
Figure C.4: Business Sequence Diagram - Distribution system.
164
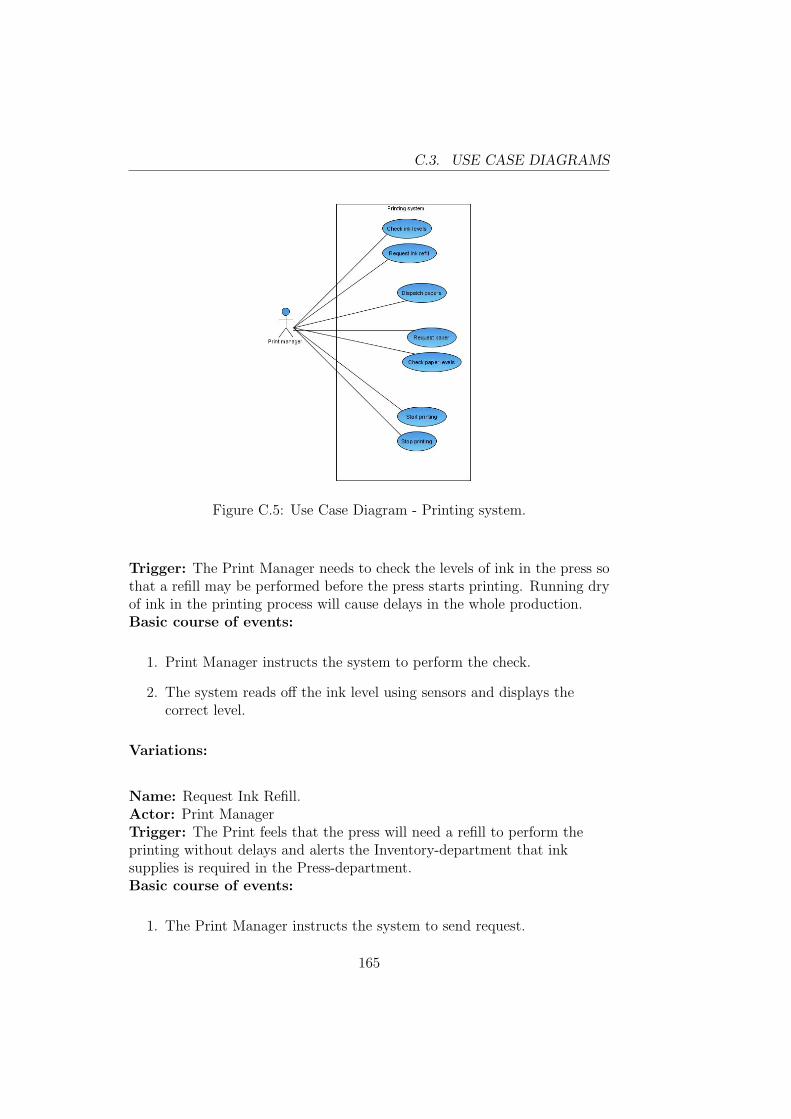
C.3. USE CASE DIAGRAMS
Figure C.5: Use Case Diagram - Printing system.
Trigger: The Print Manager needs to check the levels of ink in the press sothat a refill may be performed before the press starts printing. Running dryof ink in the printing process will cause delays in the whole production.Basic course of events:
1. Print Manager instructs the system to perform the check.
2. The system reads off the ink level using sensors and displays thecorrect level.
Variations:
Name: Request Ink Refill.Actor: Print ManagerTrigger: The Print feels that the press will need a refill to perform theprinting without delays and alerts the Inventory-department that inksupplies is required in the Press-department.Basic course of events:
1. The Print Manager instructs the system to send request.
165

APPENDIX C. THE CASE
2. The Printing system sends the request to the Inventory-system.
3. The Inventory Department receives the message.
Variations:
Name: Dispatch papersActor: Print ManagerTrigger: The newspaper is finished in the press.Basic course of events:
1. The Print Manager orders the system to send a notice to the LogisticsSystem that distribution can begin.
2. The Printing system dispatches the message.
3. The Logistics system receives and processes the message.
Variations:
Name: Check paper LevelsActor: Print Manager.Trigger: The Print Manager needs to check the levels of paper in thepress, so that a refill may be performed before the press starts printing.Running empty of paper in the printing process will cause delays in thewhole production.Basic course of events:
1. Print Manager instructs the system to perform the check.
2. The system reads of the paper level using sensors and displays thecorrect level.
Variations:
Name: Request paper refill.Actor: Print ManagerTrigger: The Print Manager feels that the press will need a refill toperform the printing without delays, and alerts the Inventory-departmentthat paper supplies is required in the Press-department.Basic course of events:
166

C.3. USE CASE DIAGRAMS
1. The Print Manager instructs the system to send request.
2. The systems sends the request to the Inventory-system.
Variations:
Name: Start PrintingActor: Print ManagerTrigger: The content of that given days’ newspaper is ready and theprinting is commenced.
Basic course of events:
1. The Print Manager gets a notification that the content is ready.
2. The Print Managers instructs the system to start the printing.
3. The System engages the printing.
Variations:
Name: Stop PrintingActor: Print ManagerTrigger: The Print Manager for some reason needs to stop the printingprocess.
Basic course of events:
1. The Print Manager instructs the System to stop the printing.
2. The System stops the printing.
Variations:
Inventory System
Name: Dispatch PaperActor: Inventory Manager
167

APPENDIX C. THE CASE
Figure C.6: Use Case Diagram - Inventory system.
Trigger: The Inventory Manager has received the notification of a refill ofpaper in the Printing-department.Basic course of events:
1. The manager checks the levels of paper in the Inventory.
2. The manager instructs Inventory workers to bring the paper to thePrinting-department.
3. The manager updates the Inventory levels.
Variations:
Name: Dispatch InkActor: Inventory ManagerTrigger: The Inventory Manager has received the notification of a refill ofink in the Printing-department.Basic course of events: See: “Dispatch paper”. Paper is ink.
Name: Order paperActor: Inventory Manager
168

C.3. USE CASE DIAGRAMS
Trigger: The Inventory Manager needs to purchase more paper for theInventory.
Basic course of events:
1. The manager selects that he wants to buy paper.
2. The manager enter the amount.
3. The manager confirms the purchase.
Variations:.
Name: Order inkActor: Inventory ManagerTrigger: The Inventory Manager needs to purchase more ink for theInventory.Basic course of events: See: “Order ink” variation point: Paper is ink.
Name: Check ink levelsActor: Inventory ManagerTrigger: The Inventory Manager needs to check the levels of ink in theInventory.Basic course of events:
1. The manager requests a check of the level.
2. The system queries the Inventory database and displays the number.
Variations:
Name: Check paper levels:Actor: Inventory ManagerTrigger: The Inventory Manager needs to check the levels of paper in theInventory.Basic course of events: See: “Check ink level” variation point: Ink isPaper.
169

APPENDIX C. THE CASE
Publishing System
Figure C.7: Use Case Diagram - Publishing system.
Name: Create ArticleActor: JournalistTrigger: A journalist wishes to start writing an article.
Basic course of events:
1. The journalist chooses to create an article from a menu.
2. An empty article is displayed.
Variations:
Name: Save ArticleActor: Journalist
170

C.3. USE CASE DIAGRAMS
Trigger: A journalist wishes to save an article in the contents-database.Basic course of events:
1. The journalist chooses to save an article from a menu.
2. The Systems stores the article to the contents-database.
Variations:
Name: Edit ArticleActor: JournalistTrigger: A journalist wishes to edit an article in the content database.Basic course of events:
1. The journalist chooses to edit an article from a menu.
2. The Systems retrieves this article from the contents-database anddisplays it.
Variations:
Name: Publish ArticleActor: JournalistTrigger: A journalist wishes to publish an article in the contents-database.Basic course of events:
1. The journalist chooses to publish an article from a menu.
2. The Systems sets this article as published in the contents-database.The article will now be visible at the web page and is ready to beprinted.
Variations:
Name: Manage LayoutActor: Layout WorkerTrigger: Articles and adds from the Content-DB needs to fitted into anewspaper format before it is printed.
Basic course of events:
171

APPENDIX C. THE CASE
1. The manager changes the layout of the paper.
2. The manager saves the layout.
Variations:
Name: Engage printingActor: Layout ManagerTrigger: The papers layout and contents is ready, and the Layout Managernotices the Printing-department system that the printing ca engage.Basic course of events:
1. The manager instructs the system to start printing.
2. The system sends a notification to the Printing-system.
Variations:
Administration System
Name: Add subscriberActor: Subscription ManagerTrigger: A new subscriber needs to be entered into the database.Basic course of events:
1. The manager chooses that he wants to add a new subscriber.
2. The manager fills out information about the subscriber and choosesto save it.
3. The system adds the subscriber to the Subscriber-DB.
Variations:
Name: Remove SubscriberActor: Subscription ManagerTrigger: A subscriber must be removed from the database.Basic course of events:
172

C.3. USE CASE DIAGRAMS
Figure C.8: Use Case Diagram - Administration system.
173

APPENDIX C. THE CASE
1. The manager chooses that he wants to remove a subscriber.
2. The manager selects the subscriber and confirms the choice.
3. The system removes the subscriber from the Subscriber-DB.
Variations:
Name: Edit SubscriberActor: Subscription ManagerTrigger: A subscriber’s information must be updated in the database.Basic course of events:
1. The manager chooses that he wants to edit a subscriber.
2. The manager selects the subscriber and confirms the choice.
3. The manager changes the information and confirms that the edit isdone.
4. The system saves the subscriber from the Subscriber-DB.
Variations:
Name: Create CustomerActor:Advertising-manager.Trigger: The manager needs to add an new advertiser in the database.Basic course of events:See: “Create Subscriber” Customer is Subscriberand Subscriber-DB is Customer-DB.
Name: Edit CustomerActor: Advertising-manager.Trigger: The manager needs to edit an advertiser in the database.
Basic course of events:See: “Edit Subscriber” Customer is Subscriberand Subscriber-DB is Customer-DB.
174
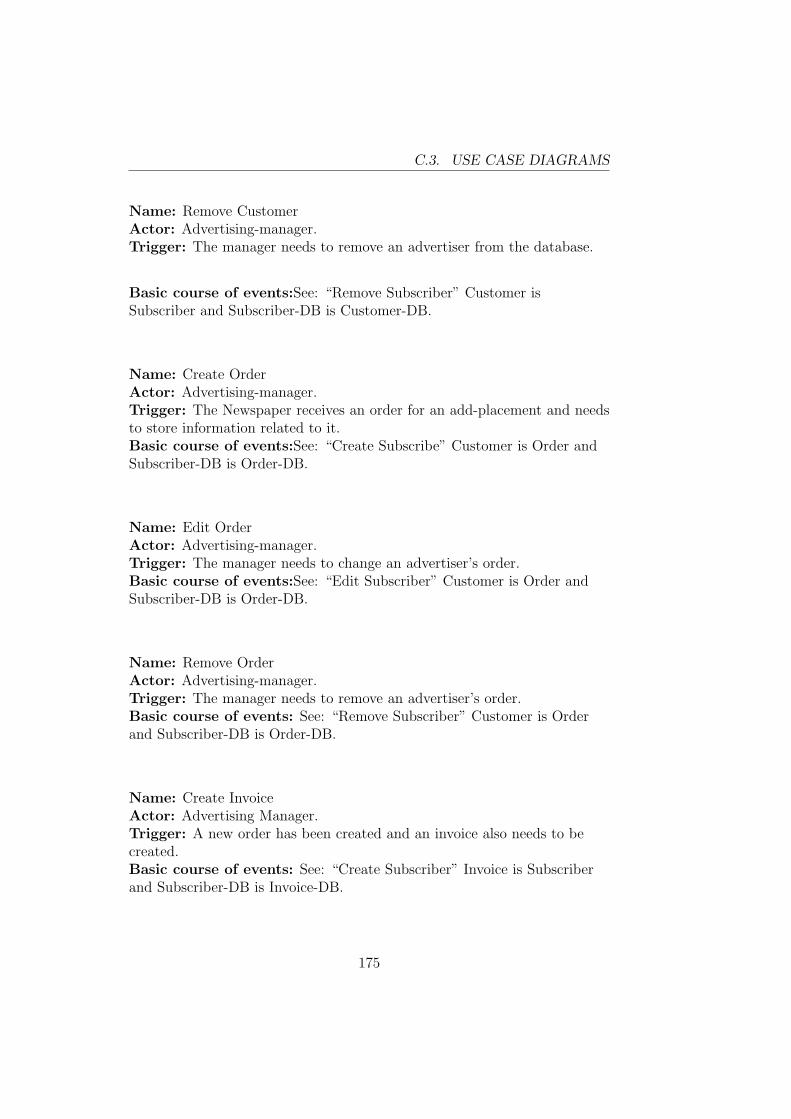
C.3. USE CASE DIAGRAMS
Name: Remove CustomerActor: Advertising-manager.Trigger: The manager needs to remove an advertiser from the database.
Basic course of events:See: “Remove Subscriber” Customer isSubscriber and Subscriber-DB is Customer-DB.
Name: Create OrderActor: Advertising-manager.Trigger: The Newspaper receives an order for an add-placement and needsto store information related to it.Basic course of events:See: “Create Subscribe” Customer is Order andSubscriber-DB is Order-DB.
Name: Edit OrderActor: Advertising-manager.Trigger: The manager needs to change an advertiser’s order.Basic course of events:See: “Edit Subscriber” Customer is Order andSubscriber-DB is Order-DB.
Name: Remove OrderActor: Advertising-manager.Trigger: The manager needs to remove an advertiser’s order.Basic course of events: See: “Remove Subscriber” Customer is Orderand Subscriber-DB is Order-DB.
Name: Create InvoiceActor: Advertising Manager.Trigger: A new order has been created and an invoice also needs to becreated.Basic course of events: See: “Create Subscriber” Invoice is Subscriberand Subscriber-DB is Invoice-DB.
175

APPENDIX C. THE CASE
Name: Edit InvoiceActor: Advertising Manager.Trigger: An order has been edit and an invoice also needs to be edit.Basic course of events: See: “Edit Subscriber” Invoice is Subscriber andSubscriber-DB is Invoice-DB.
Name: Remove InvoiceActor: Advertising Manager.Trigger: An order has been removed and an invoice also needs to beremoved.Basic course of events: See:“Remove Subscriber” Invoice is Subscriber and Subscriber-DB is Invoice-DB.
Name: Generate subscriber invoices.Actor: Administration SystemTrigger: Subscribers needs to be billed.Basic course of events:
1. The system notices that it’s time to generate invoices.
2. The system gets the subscribers (See “Get subscribers”)
3. The system generates the invoices (See “’Generate invoices”)
Variations:
Name: Get subscribersActor: Administration SystemTrigger: The system needs a list of the subscribers to create the invoices.Basic course of events:
1. The system get the subscribers from the Subscriber-database.
Variations:
Name: Generate invoices.Actor: Administration System
176

C.3. USE CASE DIAGRAMS
Trigger: The has the subscriber information and needs to create invoicesto bill them.Basic course of events:
1. Create an invoice for each subscriber and store it in theInvoice-database.
Variations:
Transport-logistics System
Figure C.9: Use Case Diagram - Transport logistics system.
Name: Get drop-off route Actor: Driver Trigger: The paper is ready fordistribution and drivers need drop-off routes. Basic course of events:
1. Driver identifies himself.
2. The system prints an drop-off route for the driver.
Variations:
Name: Calculate Drop-off routes.Actor: Logistics System
177

APPENDIX C. THE CASE
Trigger: The printing is finished and distribution needs drop-off routes.Basic course of events:
1. The system calculates the best drop-off routes.
Variations:
Name: Get subscriber data.Actor: Logistics System.Trigger: The system needs relevant data from the subscriber database tocreate an effective drop-off plan.Basic course of events:
1. The system connects to the subscriber database and gets the neededinformation.
Variations:
178

Bibliography
[1] P. Kruchten : The Rational Unified Process - An Introduction, Thirdedition (2003), ISBN 0-321-1-19770-4.
[2] J. Børretzen, T. St̊alhane, T. Lauritsen, and P.T Myhrer : Safety activ-ities during early software project phases, Department of Computer andInformation Science, Norwegian University of Science and Technology.
[3] R. Fredriksen : Use of the Rational Unified Process for development ofsafety related computer systems.
[4] L.R Thorsen : Extreme Programming in safety-related systems.
[5] D.S. Herrmann : Software Safety and Reliability - Techniques, Ap-proaches, and Standards of Key Industrial Sectors, ISBN 0769502997.
[6] M. Rausand : Riskoanalyse - veiledning til NS 5814, ISBN 82-519-0970-8(In norwegian).
[7] J.M. Myerson : Enterprise Systems Integration, ISBN 0-8493-1347-3.
[8] A. Targowski : Electronic Enterprise: Strategy and Architecture, Chapter7, ISBN: 1-931777-78-0.
[9] C. Giacomo, E. Reggio, M. Iori, A. Salvarani : Describing and ExtendingClasses with XMI: An Industrial Experience.
[10] N. Levenson : Safeware : System Safety and Computers, ISBN0201119722
[11] R. King : Risk Management, p15, ISBN 0948672722.
[12] A. Jolly : Managing Business Risk (2nd Edition), ISBN 0749440813.
[13] K. Doughty : Business Continuity Planning : Protecting Your Organi-zation’s Life., ISBN 0849309077.
179

BIBLIOGRAPHY
[14] B. Brykczynski and B. Small : Securing Your Organizations InformationAssets, The Journal of Defense Software Engineering.
[15] F. den Braber, T. Dimitrakos, B.A Gran, K. Stølen and J.Ø. Aagedal :The CORAS methodology: model-based risk management using UML andUP.
[16] A. Bencomo : Extending the RUP, Part 1: Process Modeling - RationalEdge Ezine.
[17] P. Higuera Yacov, Y. Haimes : Software Risk Management (TechnicalReport CMU/SEI-96-TR-012 ESC-TR-96-012).
[18] AS/NZS 4360:1999 (Risk management standard).
[19] L. Groth : Future Organizational Design : The Scope for the IT-basedEnterprise, ISBN 0471988936.
[20] T. Lauritsen : BUCS seminar about HAZOP and UML, Slides, Presen-tation 09/02-04.
[21] P.L. Clemens : Fault Tree Analysis, Tutorial, www.sverdrup.com, 4thEdition.
[22] T. St̊alhane : ”BUCS - Utfordringer og valg av fokus” (”BUCS - Chal-lenges and choice of focus”) - Slides, Presentation.
180