creating value. specialising in a commodity space
TRANSCRIPT

Annual Report 2020 - 2021
Creating value. Specialising in a
commodity space

For additional information log in towww.naperol.com
Contents
2 About National Peroxide
4 Message from the CEO
6 Performance Highlights
7 Our Core Competitiveness
8 Creating Value
10 Supporting Communities, Ensuring Sustainability
12 Board of Directors
13 Corporation Information
14 Management Discussion and Analysis
21 Directors’ Report and its Annexures
38 Report on Corporate Governance
56 Business Responsibility Report
64 Independent Auditors’ Report
74 Standalone Balance Sheet
75 Standalone Statement of Profit and Loss
76 Standalone Statement of Changes in Equity
77 Standalone Statement of Cash Flows
79 Notes to the Standalone Financial Statements
143 Independent Auditors’ Report
150 Consolidated Balance Sheet
151 Consolidated Statement of Profit and Loss
152 Consolidated Statement of Changes in Equity
153 Consolidated Statement of Cash Flows
155 Notes to the Consolidated Financial Statements
Corporate Overview2
Statutory Reports14
Financial Statements
Notice
63
226
Forward-looking statements
Some information in this report may contain forward-looking statements which include statements regarding Company’s expected financial position and results of operations, business plans and prospects etc. and are generally identified by forward-looking words such as “believe,” “plan,” “anticipate,” “continue,” “estimate,” “expect,” “may,” “will” or other similar words. Forward-looking statements are dependent on assumptions or basis underlying such statements. We have chosen these assumptions or basis in good faith, and we believe that they are reasonable in all material respects. However, we caution that actual results, performances or achievements could differ materially from those expressed or implied in such forward-looking statements. We undertake no obligation to update or revise any forwardlooking statement, whether as a result of new information, future events, or otherwise.
Standalone
Consolidated
To know more about us in digital mode, scan this QR code in your QR mobile application.
Value creation lays the foundation for a formidable business. It enables an organisation to lead with efficiency, garner greater productivity and fulfil cherished objectives. At National Peroxide Limited, we derive value as a specialist – manufacturing Hydrogen Peroxide for multiple applications.
Our success is pivoted in creating value for our business as well as those of our customers. With focus on delivering the finest quality and consistently upgrading our process backed by robust R&D efforts, we have created a pathway for excellence and value creation. Our unique capacities empower us to be creative, ideate novel methods and focus on distinctive change. It is the sum of these efforts that lend credibility to our uniqueness and empower us to create exceptional value – today and tomorrow.

About National PeroxideNational Peroxide Limited pioneered peroxygen chemicals in India and is the largest manufacturer of Hydrogen Peroxide in the country today.
Since its inception in 1954, the Company has established a firm market presence as a reliable Hydrogen Peroxide (H2O2) manufacturer. We have developed strong customer relationships, backed by our robust technological expertise, state-of-the-art manufacturing facilities and superior quality solutions.
Our integrated business model allows us to produce Hydrogen Peroxide, used for diverse applications in many downstream sectors. We serve several clients across the country, adding new clients from across the globe. Headquartered in Mumbai, India, our market presence are spread across different cities in India.
Manufacturing blueprint
Products
Downstream industries application
CapacityLocation
Certifications
Maharashtra
Kalyan
150,000 MTPA
ISO 9001:2015 ISO 50001:2018 (Quality Management System)
(Energy Management System)
ISO 14001:2015 (Environment Management System)
RC-14001:2015(Responsible Care 14001 Standards)
ISO 45001:2018 (Occupational Health and Safety Management System)
Use of Responsible Care Logo from Indian Chemical Council
Peracetic Acid
Hydrogen Gas
Hydrogen Peroxide
30,000 MTPA
5000 MTPA
500 MTPA
49,000 MTPA
95,000 MTPA
150,000 MTPA 2021
2014
2006
1995
1974
1954
Manufacturing Unit
Market Presence
Paper & Pulp
Textile
Metallurgy
Water & Effluent treatment
Sugar
Pharmaceuticals
Cosmetics
Chemical Synthesis
2 Annual Report 2020-21N a t i o n a l P e r o x i d e L i m i t e d
• Corporate Overview • Statutory Reports • Financial StatementsA b o u t N a t i o n a l P e r o x i d e 3

Message from the CEO
Dear Shareholders,
I sincerely hope you and your loved ones are staying safe and healthy. As COVID-19 pandemic impacted countless lives and created uncertainty amongst economies and businesses at large, I am pleased to report that NPL responded with agility and resilience to sustain growth and ensure business continuity. As Wadia Group’s flagship manufacturing company, and the largest manufacturer of hydrogen peroxide, we have always strived to create value, despite operating in a commodity business.
As a pioneer and largest manufacturer of Hydrogen Peroxide (H202) in the country, we boast a complete value chain of chemistry within H202 that includes hydrogen peroxide, compressed hydrogen gas as well as peracetic acid. Creating a niche market, we serve large companies operating across multiple downstream industries with our products, earlier imported in the country.
COVID-19 did pose challenges to our business in the first quarter of FY21,
centricity and implementing cost-controls across the product value-chain. Prudent financial management helped generate cash flow, resulting in an interest coverage ratio of 3.16 times.
Creating value
Over the years we continue to override the perception that we operate in a commodity-driven segment with minimum value creation. However, our value-accretive business model rests on key strengths that generate value for our stakeholders. First, our growing customer base with growing trust forms the foundation of our market share. Further, our recent foray into export market marks a new chapter of growth in our corporate journey and we are optimistic of expanding our international presence in the coming years.
Second, our operational excellence remains cornerstone of our business. Our process innovations, energy conservation methods and enhanced capacities allow us to achieve greater
as demand slowed and the supply chain were disrupted due to lockdown and minimal movement of people and goods. However, as the lockdown restrictions eased, demand picked up and we served our customers with agility and speed.
Notwithstanding the trailing impacts of the pandemic, we continued to make progressive investments in our already established R&D facility. It continues to deliver excellence, helping us expand our markets into new downstream sectors with sustained product innovation. It gives me great pleasure to report that during the fiscal we started our journey of export, emerging as the largest exporter from India for H202.
Performance Highlights
This year, we reported a consolidated revenue of H 21,500 lakhs, 12.43% higher than previous year. Our EBIDTA stood at H 4,244 lakhs and PAT for the year was at H 2,117 lakhs. Nonetheless, we sustained our profitability levels year-on-year driven by focused customer
economies of scale to deliver products with highest quality.
Third, measures taken to strengthen our balance sheet ensured that the key ratios stayed healthy. Our aim is to grow our earnings in line with recurring Free Cash Flows and reduce our long-term debt by year 2024.
Restructuring
Moreover, in our quest to create more value for our stakeholders, we are restructuring our organization by demerging our chemical business into NPL Chemicals Ltd., and merging our subsidiary company, Naperol Investments Ltd., engaged
We prioritized employee health and safety over business growth. People development has always been our key focus, and we continue to recruit and retain talented individuals across our company.
Rajiv Arora
Chief Executive Officer & Director
As a pioneer and largest manufacturer of Hydrogen Peroxide (H2O2) in the Country, we boast a complete value chain of chemistry within H2O2 that includes hydrogen peroxide, compressed hydrogen gas as well as peracetic acid.
in the business of making long term investments and corporate lending .
This restructuring is aimed at segregating different businesses with different risk and return profiles. It also allows investors to put their money in a company that best suits their investment strategies and risk profile. This strategy is expected to bolster our growth aspirations as well as create value for stakeholders.
NPL and future
The year marks an important in chapter in our legacy. While COVID-19 posed challenges, we mitigated the risks with proactive measures in
place. We prioritized employee health and safety over business growth. People development has always been our key focus, and we continue to recruit and retain talented individuals across our company. We implemented safety protocols at our plant and office in guidance with the government regulations.
We welcome the new year with lot of expectations. We thrive to reduce our operational costs so as to offer competitive pricing for our customers. Leveraging on our newly set-up R&D unit, we are also looking forward to widen our product applications across new downstream sectors.
I would like to thank the Board of Directors, Shareholders, Customers, and Employees for their continuous support and trust in our Company. I am very grateful to everyone who has contributed to this growth and I look forward to continuing with you on this exciting journey.
Rajiv AroraChief Executive Officer & Director
Annual Report 2020-21N a t i o n a l P e r o x i d e L i m i t e d4 • Corporate Overview • Statutory Reports • Financial Statements
M e s s a g e f r o m t h e C E O 5

Performance Highlights
Our Core Competitiveness
Revenue
Profit before tax
Networth
EBIDTA
Pioneers In-house R&D Quality
Capacity
Experience
Integrated business model
Gearing
Customer Relationship
Smart manufacturing
Certifications
Profit after tax
EPS
(H in lakhs)
(H in lakhs)
(H in lakhs)
(H in lakhs)
We are the pioneers in manufacturing Hydrogen Peroxide in India, a highly versatile chemical used for multiple downstream industries. The chemical was earlier imported due to its unavailability in India.
We have set up a sophisticated, FDA compliant R&D facility that empowers us to widen our product portfolio and cater to several new downstream industries, thereby increasing our potential for enhancing business profitability.
Hydrogen Peroxide produced at our facilities meet national and international quality standards. Moreover, our facilities are certified to abide by stringent regulatory norms. Our credibility is built on our reputation to deliver the finest quality product to customers in India and abroad.
We are the single largest manufacturer of Hydrogen Peroxide in India with a manufacturing capacity of 150,000 MTPA.
With over five decades of experience and market leadership, we are a preferred supplier to some of the leading companies in India.
Our operations and processes are completely integrated, driving economies of scale and sustaining product quality.
Our robust balance sheet and comfortable gearing ratio has allowed us to sustain our market leadership with timely capacity expansions, without any stress on our books.
In FY21, majority of our revenue was driven by customers with whom we are associated for several years. Our singular focus on manufacturing one product reassures our customers of timely supply, enabling them to source products at the most competitive price without compromising on the quality of the product.
Our state-of-the-art manufacturing unit allows us to produce and supply Hydrogen Peroxide in varied concentration levels, making it easily adaptable to Indian climatic conditions.
The trust of our customers and our consistent revenue visibility is reinforced by the quality, health and safety and environmental certifications acquired by National Peroxide.
(H in lakhs)
(in H)
22,725
1,179
58,842
3,079
2,081
36
20,859
2,899
48,645
2,642
1,736
30
42,061
23,526
61,509
22,894
15,303
266
2020-21
2020-21
2020-21
2020-21
2020-21
2020-21
2019-20
2019-20
2019-20
2019-20
2019-20
2019-20
2018-19
2018-19
2018-19
2018-19
2018-19
2018-19
6 Annual Report 2020-21N a t i o n a l P e r o x i d e L i m i t e d 7• Corporate Overview • Statutory Reports • Financial Statements
O u r C o r e C o m p e t i t i v e n e s s

Creating ValueSpecialising in commodity space.
Our business model is prudently designed to enhance value creation for our stakeholders. Being the single largest manufacturer of Hydrogen Peroxide, we are now unfolding a new chapter in our corporate journey with strategic endeavours that position us for accelerated growth in the long-term.
Strategic priority
1 43
2 5Focused Diversified customer profile
Operational Excellence
Value-driven Exponential growth
We work with companies of global repute, who seek the best overall price-value proposition and not just the lowest cost. Our expertise in single product manufacturing has deepened our capability to deliver excellent customer service with robust quality control methods. We shall continue to strive to focus on increasing customer satisfaction and enjoy very old relationship with customers on PAN India basis.
We are the Market Leader in Hydrogen Peroxide in India. We are now increasing our wallet share by driving revenues from exports and adding new customers in the domestic market. Our R&D team is closely working on adding new applications to our product portfolio and capitalising on emerging opportunities to increase the utilization of Hydrogen Peroxide.
To remain competitive, we aim to improve operational excellence across our manufacturing cycle. We have also entered into price-agreements to create a natural hedge against volatility of crude oil prices, a crucial ingredient affecting our operating costs. Other cost optimisation strategies and energy conservation methods help us to further drive growth without compromising our margins
Over the years, we have largely focused on improving manufacturing efficiencies and it has resulted in consistent value creation through our various cost saving initiatives which result in higher margins and value creation. We are the only Company to significantly invest in capacity expansion in the last twenty years, allowing us to improve efficiencies and meet domestic demand for Hydrogen Peroxide. We have progressively enhanced our customer outreach and product application to serve more customers in domestic and international markets.
We have constantly focused on building a strong foundation for growth. We have invested more than H 20,000 lakhs to more than double our capacity in the last 20 years. The new assets and capacity expansion have proportionately increased our throughput, assisting more revenue generation without any delay in commissioning. As we look forward to cater to new markets and customers, we are poised to outperform industry growth and enhance our profitability in the years to come.
C r e a t i n g V a l u eN a t i o n a l P e r o x i d e L i m i t e d• Corporate Overview • Statutory Reports • Financial Statements 9Annual Report 2020-218

Supporting Communities, Ensuring Sustainability
At NPL, we are consistently working to improve our operations and upgrade our facilities with a heartfelt consideration for enhancing the wellbeing of our people, the communities we operate in and the environment. Our approach to sustainability is defined by our CSR principles that are integrated with our business objectives.
Due to the COVID-19 pandemic, the healthcare sector was heavily burdened and we tried to help hospitals and healthcare centres with necessary support. We also had a keen focus on rural development projects and the creation of opportunities for education.
Promoting healthcare
Relief and aid related to COVID-19 pandemic
Supporting Education
Rural Development Projects
To combat the challenges posed by the COVID-19 pandemic, we have undertaken efforts to support healthcare institutions. We have initiated 2 projects in Mumbai and one in Coimbatore.
The COVID-19 crisis had a devastating impact on our economy and the people. Amidst tough times, healthcare workers emerged as true heroes, leading the fight against a
We believe education is the key to a healthy and self-sufficient society. To ensure economic and social well-being, we create opportunities for education of children from underprivileged families, allowing them to nurture their innate capabilities and become confident individuals capable of ushering change in society.
We aspire to improve the standard of living of people residing in rural areas. With an aim to bring positive change in society, we initiate several rural development projects.
Total CSR Amount spent for the Financial Year 2020-21
H280 lakhsOur CSR initiatives focus on:
(i) Promoting health care including preventive healthcare
(ii) Promoting education
(iii) Eradicating hunger, poverty, malnutrition
(iv) Sanitation
Mumbai
Upgradation of Neonatal & Pediatric Intensive Care Units
Improved Service Delivery and
Retrofitting Project for Medical Gas
works
H 70 lakhsAmount spent for the Project
H 47 lakhsAmount spent for the Project
Coimbatore
Mudi’s Hospital Project (preventive healthcare and sanitation)
H 51 lakhsAmount spent for the Project
Village Development Project
H 40 lakhsAmount spent for the Project
School repair and refurbishment project
H 35 lakhsAmount spent for the Project
deadly disease. We salute their effort and relentless dedication. To support relief work during the pandemic, we contributed to several projects.
Amount spent for Relief Project
H 37 lakhs
Session undertaken to train farmers at Krishi Vigyan Kendra, Kosbad Hill, Palghar (Maharashtra)
Session undertaken to demonstrate on ‘how to wrap a newborn child’ at Anganwadi Kendra School, Murbad (Maharashtra)
Ambulance Donation at Mudi's Hospital, Coimbatore (Tamil Nadu)
School repair and refurbishment at Anganwadi Kendra School, Murbad (Maharashtra)
10 Annual Report 2020-21N a t i o n a l P e r o x i d e L i m i t e d 11• Corporate Overview • Statutory Reports • Financial Statements
S u p p o r t i n g C o m m u n i t i e s , E n s u r i n g S u s t a i n a b i l i t y

Corporation Information LEADERSHIP TEAM
Rajiv Arora Chief Executive Officer
Conrad Fernandes Chief Financial Officer
Rajeev Pradhan Chief Information Officer
Gyan Shankar Awasthi Vice President - Sales
Subhayu Basu Human Resource, Head
Chandukumar Parmar Company Secretary
BANKER
Standard Chartered Bank
SOLICITORS AND ADVOCATES
M/s. Khaitan & Co.M/s. Crawford Bayley & Co.
AUDITORS
Satutory Auditors M/s. Price Waterhouse Chartered Accountants LLP
Internal AuditorsM/s. PKF Sridhar and Santhanam LLP
Cost Auditors M/s. D. C. Dave & Co.
Secretarial Auditors M/s. Parikh & Associates
REGISTERED OFFICE
Neville House, J. N. Heredia Marg,Ballard Estate, Mumbai-400001.Phone: 022-22678301
HEAD OFFICE
C-1, Wadia International Centre,Pandurang Budhkar Marg, Worli, Mumbai-400025.Phone: 022-66620000Website: www.naperol.com
FACTORY
N. R. C. Road, P. O. Atali,Via Mohone, Kalyan-421102,Dist. Thane, Maharashtra.Phone: 0251-2278000
REGISTRAR & SHARE TRANSFER AGENTS
Link Intime India Private Limited
Unit : National Peroxide Limited.C-101, 247 Park, L.B.S. Marg,Vikhroli (West), Mumbai-400083Phone: 022-4918 6270E-mail ID: [email protected]
Board of Directors
3
6
2
5
1
4
7Mr. Ness N. Wadia
Chairman / Non - Executive and Non - Independent Director
1
Mr. Rajesh Batra
Non - Executive and Independent Director
2
Mr. S. Ragothaman
Non - Executive and Independent Director
3
Dr. (Mrs.) Minnie Bodhanwala
Non - Executive and Non - Independent Director
4
Mr. Viraf Mehta
Non - Executive and Independent Director
5
Mrs. Harshbeena Zaveri
Non - Executive and Independent Director
6
Mr. Rajiv Arora
Chief Executive Officer & Director
7
The decisive leadership of our Board Members drives us to sustain progress year after year. We believe, good governance rests on prompt action and our leaders have played a pivotal role in consistently steering the Company towards greater glory, keeping our competitive spirit alive and driving us to accomplish objectives with agility.
12 Annual Report 2020-21N a t i o n a l P e r o x i d e L i m i t e d 13• Corporate Overview • Statutory Reports • Financial Statements
C o r p o r a t i o n I n f o r m a t i o n

14 Annual Report 2020-21 15• Corporate Overview • Statutory Reports • Financial StatementsM a n a g e m e n t D i s c u s s i o n a n d A n a l y s i s R e p o r tN a t i o n a l P e r o x i d e L i m i t e d
MANAGEMENT DISCUSSION AND ANALYSIS REPORT
Global Economy
The global economy in 2020 faced a huge setback due to spread of the virus and its impact worldwide. It is the year that experiences the worst recession since a decade where the world experienced global financial crisis, the period of ‘the Great Depression’. The economy underwent a contraction of -3.3% for the year 20201. In emerging markets and developing countries, cumulative per capita income losses over 2020–22 are forecasted to be equivalent to 20% of 2019 per capita GDP, whereas losses in advanced economies are likely to be comparatively less, at 11%. Approximately 95 million people are estimated to have fallen below the brink of acute poverty, compared to that of pre-pandemic estimates. Despite considerable efforts and policy supports, unemployment rates in both advanced and emerging market and developing economies have grown by around 1½ % points above pre-pandemic levels.
The first half of the year experienced lockdowns and stringent social distancing as critical measure of containment and recovery, allowing the health-care system to cope with the increased demand for its services while also affording researchers time to produce treatments and vaccines. To aid the crisis, governments at domestic levels have taken a number of fiscal measures, including initiatives to soften income losses, stimulate hiring, increase social assistance, guarantee credit, and inject ownership into businesses. The later part of the year witnessed slow but steady recovery in the economy, mostly in parts where lockdowns have been eased.
The advanced economies have been able to provide more direct expenditure and liquidity support in relation to GDP. The industrial production has restored to pre-pandemic levels through a V-shaped recovery curve after a brief and synchronized drop2. The release of repressed demand for durable goods in general and strong demand for products that facilitate working from home have been major elements driving the worldwide recovery since the second half of 2020. Although car industry accounts for the major driver in manufacturing sector, contributing to about 35% in
recovery, demand for certain items, including electronics, plastic, rubber, and textiles as primary materials for personal protective equipment contribute for around 10% of the manufacturing recovery. In relation to international trade, merchandise trade volumes have restored to pre-pandemic levels but cross-border service commerce still remains sluggish.
Outlook
In 2021, the global economy is expected to rise at 6%, subsequently slowing to 4.4% in 2022. Though the present situation is grim and uncertain, a road out of this health and economic distress is becoming clearer with time and experience. Multispeed recovery is underway in regions and across socio-economic classes, owing to significant variances in healthcare facilities, vaccine implementation and availability, economic policy assistance, and certain structural variables. Parallel to this, adaptability to pandemic life has allowed the global economy to thrive despite low overall mobility, resulting in a stronger-than-expected recovery in all areas. The near-term outlook for global manufacturing remains optimistic, as demonstrated by the global manufacturing purchasing managers’ index indications, which indicate that growth will continue, though at a slower rate. Among advanced economies, United States and among developing economies, China have done exceptionally well in respect to returning back to pre-covid GDP in 2020. Others are expected to recover by 2022-23.
Indian Economy
The financial year 2020-2021 witnessed an unparalleled economic turbulence with the outbreak of worldwide pandemic due to the coronavirus disease (COVID-19). All economic activities came to a grinding halt with the stringent countrywide lockdown from the mid of March’20. Followed by a period of subdued growth in 2019, the Indian economy that had begun to gain momentum in January 2020, experienced a dramatic drop of 23.9% in Q1: FY 2020-21 and 7.5 % in Q2: FY 2020-213. The real GDP is estimated to
122021/03/23/world-economic-outlook-april-202122021/03/23/world-economic-outlook-april-20213 https://www.indiabudget.gov.in/economicsurvey/doc/vol2chapter/echap01_vol2.pdf
soften by 7.7% this year as compared to a growth of 4.2% in 2019-20. This is the fourth contraction in GDP in the history since 1960-61.
The production hampered to a great extent and it resulted in a subsequent derail in supply-chain. The industry and service sectors became the worst hit, with an estimated decline of 9.6% and 8.8% during the year. Among all odds, only agriculture contributed to positive growth to the GDP. With 3.4% growth in 2020-21, it is expected to soften the impact of the pandemic. On the supply side, Gross Value Added growth is pegged at -7.2% in 2020-21 as against 3.9% in 2019-20. The stifled credit appetite and risk-aversiveness of public slugged down overall bank-credit in the FY 2020-21. In the contrary, Government consumption sustained the growth of GDP with its share increasing by 2% compared to that of the previous year and Net Exports seem to buffer the contraction in GDP, largely due to a sharper contraction in imports than in exports. India sees the current account surplus of 2% of GDP this year, ‘a historic high after 17 years’. India also remained a preferred investment destination in FY 2020-21 with FDI flooding in, despite the global asset shifts towards equities. Investors’ risk appetite returned as net FPI inflows hit an all-time monthly high of USD 9.8 billion in November 2020.
Outlook
Despite of the deep-rooted disruption in overall economy, the Country witnessed a perceptible V-shaped recovery. High frequency indicators such as E-way bills, GST Collection, rail freight and power consumption surpassed previous year levels4. The record-high monthly GST collections provided sufficient evidence for restarting of industrial and commercial activity. The plethora of reforms were enacted to guarantee that supply-side disruptions, which were unavoidable during the lockdown, were reduced in the medium to long term. With relaxations in lockdown phase, demand appetite of the nation seemed to regain confidence.
Economic mobility grew with a favourable monetary policy that ensured sufficient liquidity and prompt relief to debtors via temporary curtailments. Also, the positive value addition growth in most sectors in the second half provided for a fairly good indicator for the economy. This amounts to a 0.3% increase in the second half of 2020-21, compared to a 14.9% contraction in the first half. The impressive recovery
pattern of the Country has caught the eye of the globe. The Organization for Economic Co-operation and Development (OECD) has raised the projection for India’s economic growth rate by 4.7% points at 12.6% for 2021-22. The IMF also forecasts India to become the fastest growing economy in next two years. But the prevail of the pandemic and unexpected fluctuations in COVID waves can jeopardize the future of the nation, alongside, the future of the world.
Hydrogen Peroxide Industry Overview
Hydrogen Peroxide (H2O2) is a transparent, pale blue chemical molecule in its purest form. It is a well-documented component of living cells that can be found naturally in biological systems. Because of its low molecular weight, hydrogen peroxide is also a popular oxidizing agent. In terms of revenue and volume, the market for hydrogen peroxide is forecasted to grow at a CAGR of 2.87% and 4.09% respectively, over the projected period of 2019-20245. The increased demand from the textile industry, paper and pulp sectors as bleaching agents, as well as its increasing usage as a raw material for propylene oxide manufacturing, are major factors driving the market in India.
Besides the obvious, the Government of India has promoted the use of hydrogen peroxide due to its emission-free and environmentally friendly properties through a number of environmental laws and regulations. As a result, the use of this compound for water treatment and pollution control has increased significantly. Furthermore, with the outbreak of the COVID-19, hydrogen peroxide is being frequently used in sanitizers and other sanitary items as it is a virus-fighting agent. The market is likely to maintain its moderate growth throughout the forecast period as a result of these factors.
Outlook
With large-scale hydrogen peroxide consumption, Asia-Pacific is expected to hold a significant share of the market. The exports from India totaled at USD 981 thousand in 20206. Sales of “hydrogen peroxide, whether or not solidified with urea” from India went up by 63% compared to 2019. Qatar (29%), Nepal (12.2%), UAE (9.79%) remained as major export destinations for the year. The total of imports to India for $ 15.7 million in 2020. Sales to India have subdued by 33% in value terms compared to 2019.
4 https://pib.gov.in/PressReleasePage.aspx?PRID=16932325https://www.thecowboychannel.com/story/43459420/hydrogen-peroxide-market-trends-outlook-2021-industry-analysis-by-growth-segments-opportunity-and-challenges-future-scope-and-business-size-with6https://trendeconomy.com/data/h2/India/2847

16 Annual Report 2020-21 17• Corporate Overview • Statutory Reports • Financial StatementsM a n a g e m e n t D i s c u s s i o n a n d A n a l y s i s R e p o r tN a t i o n a l P e r o x i d e L i m i t e d
7 https://www.marketsandmarkets.com/Market-Reports/peracetic-acid-market-1111.html
Peracetic Acid Industry Overview
Peracetic acid is a functional product that is frequently used to treat wastewater as an environmentally favorable alternative to chlorine. It’s an excellent bleach and disinfectant substitute for chlorine. Due to its performance advantages over other biocides, peracetic acid is one of the most inventive advancements in the biocide sector. The global peracetic acid market is expected to increase at a CAGR of 7.6% from USD 813 million in 2020 to USD 1,685 million in 20307. With increasing demand from end-use industries, the global market is fast rising and is expected to continue to grow strongly in the future.
The prospects of this industry in Asia-Pacific are quite attractive. The key end-use sectors in this region are food, pharmaceuticals, pulp and paper, aquaculture and water treatment, all of which are rapidly expanding. Peracetic acid has been utilised in various industries since its inception, and it continues to be a significant market in the biocides business. It’s widely utilised in the food business, namely in the processing and packaging of juices, milk, tea and soft beverages. Because of the rising healthcare industry, peracetic acid is also employed in pharmaceutical, life sciences, hospitals, and other industries.
Compressed Hydrogen Gas Industry Overview
Compressed hydrogen is a type of storage in which hydrogen gas is held at high pressures to increase storage density. In industries and space programmes, compressed hydrogen in hydrogen tanks is employed as a propellant. The need to use hydrogen for on-board energy storage in zero-emission vehicles is driving the development of new storage systems that are better suited to this new application.
Industry Overview by End User Applications
a) Paper and Pulp Industry
For both mechanical and chemical pulp bleaching, hydrogen peroxide is an effective chemical which guarantees high levels of brightness. Hydrogen Peroxide is active in alkaline circumstances, which are common in the repulping of papers. It also aids in ink removal. Hydrogen Peroxide is a very effective and convenient chemical for paper and waste paper upgrading for these reasons. Leading pulp and paper producing countries include China, the United States, India, and others. Global pulp and paper output is steadily expanding at a modest rate. Paper manufacturing is increasing in Asia-Pacific, as demand for packaging has expanded as a result of eco-friendly products and rising newspaper and book sales due to growing population.
The Indian paper sector has also grown more promising with increased domestic demand. The Indian paper industry is predicted to increase as the population grows, literacy rates rise, and the manufacturing sector improves. The paper industry’s focus is currently changing toward more environmentally friendly goods and technologies.
Although COVID-19 has undeniably posed significant issues to the pulp and paper sector around the world, this pandemic also provided pulp and paper manufacturers with unprecedented opportunities in areas such as rising demand for personal hygiene paper, food packaging, corrugated packaging materials, medical specialty papers, and so on.
b) Textile Industry
This is one of the leading industries in the Country. The domestic textiles and clothing industry accounts for 2% of India’s GDP, 7% of industry output in value terms, and 12% of the Country’s export revenues. The textiles and apparel industry in India is the country’s second largest employer, employing 45 million people directly and another 60 million in affiliated businesses. In the textile industry, hydrogen peroxide bleaching in an alkaline media is utilized for pretreatments because it retains the intrinsic properties of the cellulose. Hydrogen peroxide has also been successfully employed in the cold bleaching of textile materials in both the organized and unorganized sectors. Even for synthetic fiber bleaching, the most common bleaching agent is Hydrogen Peroxide and it is used in both batch and continuous processes.
c) Sugar Industry
After Brazil, India is the world’s second largest producer of sugar and the world’s largest consumer. In about nine states of the Country, namely Punjab, Uttar Pradesh, Maharashtra, Andhra Pradesh, Bihar, Gujarat, Haryana, Karnataka, and Tamil Nadu, the sugar sector supports an estimated 12% of the rural population through direct and indirect employment. Various ancillary operations such as transportation, trade service of machinery, and supply of inputs produce employment. According to Indian Sugar Mills Association (ISMA), India’s sugar output is predicted to increase by 17.69% to 32 MT in 2020-21. The Indian cane sugar market is expected to grow at a CAGR of 4.3% during the forecast period (2020-2025).
The Indian cane sugar segment is further segmented into categories such as organic & conventional sugar, crystallized sugar & liquid syrup, bakery and confectionery, dairy, drinks, and other applications. Hydrogen peroxide is a superb reagent for producing bright, long-lasting sugar. It can also be used in the sugar sector for syrup bleaching. This creates a numerous economic advances and opportunities, as it generates sugar with exceptional brightness, good keeping quality, and lower Sulphur dioxide and sulphated ash levels.
d) Water and Waste Water Treatment Industry
India is the second-largest water consumer in the world. To serve its population, the country requires approximately 740 billion cubic meters of water every year. Furthermore, within the next 20-25 years, water demand is predicted to outstrip supply. As a result, the water and wastewater treatment industry has a lot of room for expansion. Companies must also address avenues to meet the rising demand for pure water to address the water security issues combined with greater public knowledge about water quality and health. Furthermore, the sector has a high need for worldwide, cutting-edge water treatment technology. The water sector is expected to grow to USD 130 billion in investment potential by 20308.
Because of the increased awareness of hygiene during the epidemic, water consumption became comparatively high. According to the UN report, water sanitation is currently a profitable business. They believe that the water and wastewater treatment business has a high return on investment. Better sanitation has a cost-benefit ratio of 5.5, whereas improved drinking water has a cost-benefit ratio of 2.0.
e) Metallurgy Industry
The growing need for infrastructure projects and their restoration has had a significant impact on India’s metallurgy industry. However, the industry provides raw materials to more than simply these two industries. Rather, as a material provider, it is deeply intertwined with a variety of sectors. India is strategically located for exporting to both developed and rising Asian markets.
Hydrogen Peroxide is a very attractive reagent used in metallurgy. It also has its uses in purification of uranium and treating and brightening a number of metals and alloys. Though the initial phase of 2020-2021 witnessed subdued
demand and supply in metal industry, with gradual ease in lockdowns, when industrial productions started recovering, the industry started gaining momentum.
f) Disinfectant Industry
The industry is currently gaining traction based on the rise in the utility of maintaining regularly touched surfaces sanitized, as a consequence of global pandemic. The industry has grown at par with growth in consumer awareness regarding importance of preserving health and hygiene in their surrounds and homes. Besides, with increase in healthcare associated infections (HAI) and rising safety and health standards in industries, new product launches are increasing the market for surface disinfectant in India. In FY 2020-21, the Indian Surface Disinfectant Market was worth USD 460.66 million, and it is expected to increase at a CAGR of 7.68% from 2020 to 20259.
Hydrogen peroxide solutions are presently used to sanitize public areas such as airports, roads, and train stations, among other things. Peroxide makers are assisting in the disinfection of physical surfaces by collaborating with numerous institutions and government organizations across India, such as municipal corporations, gram panchayats, and other agencies.
Company Overview
National Peroxide Limited (NPL) is a specialty chemical manufacturing company, established in 1956 by the Wadia Group, one of the oldest conglomerates of India and a major shareholder in the Company. The Company is a pioneer in the peroxygen chemicals which touches an individual’s life at multiple touchpoints and predominantly found in sanitizing formulations.
NPL is the largest producer of Hydrogen Peroxide in India with an installed capacity of 150,000 MTPA at its fully integrated manufacturing site at Kalyan, in Maharashtra. The facility manufactures a concentrated aqueous solution containing 50% Hydrogen Peroxide by weight, denoted as 50% w/w, as per the international standards using the auto-oxidation process.
Hydrogen Peroxide is widely used as antimicrobial chemical against a wide range of microorganisms, including bacteria, yeasts, fungi, viruses, and spores. It is used in both liquid and gas form for disinfection and sterilization. In the wake
8 https://www.maiervidorno.com/industry-expertise/water-and-waste-water-treatment9 https://www.prnewswire.com/news-releases/india-surface-disinfectant-market-competition-forecast--opportunities-fy2026-301209980.html

18 Annual Report 2020-21 19• Corporate Overview • Statutory Reports • Financial StatementsM a n a g e m e n t D i s c u s s i o n a n d A n a l y s i s R e p o r tN a t i o n a l P e r o x i d e L i m i t e d
of the coronavirus outbreak in early 2020, the Company manufactured and supplied the 3% Hydrogen Peroxide (H2O2) technical grade and an economical grade disinfectant, used for destroying essential components of germ cells, to various local administrative bodies across the Country.
Along with Hydrogen peroxide, the product portfolio of the Company also includes Compressed Hydrogen Gas and Peracetic acid thereby catering to the requirement of various downstream sectors such as food processing, textiles,
As per provisions of SEBI (Listing Obligations and Disclosure Requirements) Regulations, 2015, the Key Financial Ratios are given below:
paper and pulp, pharmaceuticals and sanitizer production. The Company has consistently maintained leadership in terms of market share in the domestic market.
Operational Highlights
Discussion on financial performance has been dealt with in the Directors’ Report, which forms part of this Annual Report.
Key Financial Ratios
Sr. No.
Key Financial Ratios FY 2020-21 FY 2019-20 Variance
1. Debtors Turnover Ratio (times) 7.64 6.07 Increased focus on sales collections.
2. Inventory Turnover Ratio (times) 6.13 4.00 Higher inventory of Raw Material in the previous year post expansion of the plant.
3. Interest Coverage Ratio (times) 3.16 2.33 Higher profitability in the current year.
4. Current Ratio (times) 1.03 0.87 Lower current liabilities due to reduction in capital creditors.
5. Net Debt Equity Ratio (times) 0.21 0.33 Due to commencement of installments of ECB Loan.
6. Adjusted Operating Profit Margin (%) 11.95% 6.61% Due to capitalisation of interest in previous year7. Adjusted Net Profit Margin (%) 9.16% 8.33% Higher profitability in the current year.8. Return on Net Worth (%) 3.87% 3.15% Higher profitability in the current year.
Outlook
Opportunities for the Company exist in large-scale utilization of hydrogen peroxide in the pulp and paper industry as a bleaching agent and in the food processing industry as a disinfectant. The adoption of greener technologies in the paper manufacturing process has further augmented the demand for hydrogen peroxide in India. Furthermore, the eco-friendly benefits of hydrogen peroxide extend its application for water treatment and pollution control applications, over other conventional chemicals.
Nevertheless, the need for frequent sanitising of surfaces for safety and hygiene purposes amidst the COVID-19 is highly likely to propel the demand for hydrogen peroxide in producing disinfectant liquids and sanitizers in the short and long term.
Further, the drive towards carbon footprint reduction from transportation sector is likely to result in higher uptake of compressed hydrogen gas in the medium to long term as companies are developing hydrogen powered vehicles.
Alternatively, on the supply front, the tendency towards commodity super cycles and geopolitical developments could influence the price pressure on natural gas which is a critical input material.
SWOT Analysis
Strength
• More than six decades of experience in manufacturing and supplying peroxygen chemicals to domestic market.
• Largest manufacturer of Hydrogen Peroxide in India which finds application as an eco-friendly disinfectant.
• Integrated manufacturing plant with state-of-the-art equipment’s and technology at Kalyan facility.
• Production capacity of 150,000 MTPA representing nearly half the overall manufacturing capacity of Hydrogen Peroxide in India with few producers.
• Part of more than two and half century old Indian conglomerate, Wadia Group.
• Strategically located near the western coast with access to major ports and gas pipeline infrastructure.
Opportunity
• High demand potential from downstream sectors - textiles, sanitizers and disinfectants, pulp and paper, pharmaceuticals and hospitals.
• Limited players in the domestic industry and increasing demand may lead to cost optimisation and economy of scale.
Threat
• Price volatility of natural gas which is used to produce Hydrogen, the key input material.
• Potential threat from new players in the industry.
• Shift in foreign trade policies of the Government.
Risks and Concerns
Risk Concern Mitigating Strategy
Macroeconomic Risk
Owing to the Indian economy’s integration with the global economy, possible negative spillover effect from geo political developments could hurt the business.
The Company’s Management keeps a strong vigil on key issues across the global economy and adopts contingency plans as and when situation arises.
Input Material Risk
Hydrogen, a key input material, is produced from natural gas. Given the Country’s dependency on import for natural gas requirements, any adverse event could create upward pressure on input cost.
The Company enters into strategic partnership with key suppliers to hedge for any untoward incidents.
Single Product Risk
With more than 98% of the revenue generated from a single product, Hydrogen peroxide, the risk could amplify with fluctuations in demand.
The Company constantly monitors demand and looks out for market diversification to reduce dependency on few sectors. Moreover, the Company intends to increase focus on other products in the portfolio to grow their market.
Large Scale Imports
Large scale imports from neighbouring and South East Asian countries due to surplus production and lowering of guard to protect domestic industry.
The anti-dumping duty has been imposed to protect the domestic sector from cheap imports due to supply demand mismatch. However, the Company actively monitors foreign trade policies to bring to the Government’s notice of any uncompetitive and unfavorable conditions.
Internal Controls
The Company has an Internal Control System, commensurate with the size, scale and complexity of its operations.
M/s. PKF Sridhar and Santhanam LLP, are the Internal Auditors of the Company. The reports and findings of the internal auditors and the internal control system are periodically reviewed by the Audit Committee. To maintain its objectivity and independence, the Internal Audit function reports to the Audit Committee of the Board.
The Internal Auditors monitor and evaluate the efficacy and adequacy of internal control systems in the Company, its compliance with operating systems, accounting procedures and policies of the Company. Based on the report of internal audit function, process owners undertake corrective action in their respective areas and thereby strengthen the controls. Significant audit observations and corrective actions thereon are presented to the Audit Committee of the Board.

20 Annual Report 2020-21 21• Corporate Overview • Statutory Reports • Financial StatementsD i r e c t o r s ’ R e p o r t a n d i t s A n n e x u r e sN a t i o n a l P e r o x i d e L i m i t e d
DIRECTORS’ REPORT TO THE MEMBERS OF NATIONAL PEROXIDE LIMITED
The Directors take pleasure in presenting their Sixty-Seventh Annual Report on the business and operations of the Company and the Audited Financial Statements for the year ended March 31, 2021.
1. FINANCIAL RESULTS(H in lakhs)
Particulars
Financial Year Ended
Standalone Consolidated
31-03-2021 31/03/2020 31-03-2021 31/03/2020
Total Income 22,725.31 20,859.97 22,778.77 20,918.11
Profit before tax and exceptional items 2,728.85 2,899.58 2,778.46 2,955.90
Exceptional Items 1,549.30 - 1,549.30 -
Profit before tax after exceptional items 1,179.55 2,899.58 1,229.16 2,955.90Tax (901.53) 1,162.96 (888.49) 1,164.34
Net Profit after Tax 2,081.08 1,736.62 2,117.65 1,791.56Dividend paid on Equity Shares (H 12.50 Per Share for FY 2019-20 and H 65 Per Share for FY 2018-19)
718.38 3,735.55 718.38 3,735.55
Dividend Distribution Tax - 768.03 - 768.03
2. DIVIDEND
Your Directors have recommended a dividend of H 12.50/- per equity share having face value of H 10/- each (i.e. 125%) for the Financial Year 2020-21, to be paid, if declared by the Members at the Annual General Meeting to be held on August 25, 2021.
3. TRANSFER TO RESERVES
During the year under review, no transfers were made to reserves.
4. STATE OF COMPANY’S AFFAIRS
The gross sales and other income for the year under review were H 22,725.31 lakhs as against H 20,859.97 lakhs for the previous year. The profit before tax was H 1,179.55 lakhs and the profit after tax was H 2,081.08 lakhs for the year under review as against H 2,899.58 lakhs and H 1,736.62 lakhs respectively, for the previous year. The Company achieved a capacity utilization of 65% of the installed capacity of Hydrogen Peroxide, as compared to 74% during the previous year, mainly on account of plant shutdown for two months and lower demand due to ongoing COVID-19 pandemic.
5. IMPACT OF COVID-19
The spread of COVID-19 disease has severely impacted economies, businesses and social set ups across the globe and in India. The number of new cases which had reached its lowest level in the first week of February 2021 has gone up dramatically in March 2021. Several restrictions had been imposed by various state governments and local bodies to control this strong second wave of the pandemic, but these were not as severe as the lockdown during the first wave.
Your Directors have carried out a detailed assessment of its liquidity position as at the Balance sheet date, and has concluded that there are no material adjustments required in the standalone financial statements.
Based on the Company's liquidity position as at March 31, 2021 and review of cash flow projections (after applying sensitivity analysis) over the next twelve months, your Directors’ believes that the Company will have sufficient liquidity to operate its businesses in the ordinary course. However, the impact assessment of COVID-19 pandemic is a continuing process given the uncertainties associated with its nature and duration. The Company will continue to monitor material changes to future economic conditions.
Human Resources
At NPL, we value our employees and consider them to be the most important component of our organization. We are proud to always maintain cordial relations with our employees at all levels. For the benefit of our employees and to promote a motivated work force, we regularly implement engagement programs.
We are always striving to provide our employees the best tools to better themselves and become the best they can be. The Company provides in-house and external technical & leadership training to different level of employees for upgrading their technical & leadership skills. Some of our esteemed employees have also attended technical programs conducted by the Indian Chemical Council. We value the safety of our employees and have given various safety awareness trainings to majority of our people to enhance their knowledge about plant safety. All of our employees, including contract employees and security staff, take part in these safety awareness trainings which are conducted regularly.
The employee strength on the permanent rolls of the Company was 126, as on March 31, 2021.
Resources and Liquidity
The Company finances its long term and working capital requirements by a combination of internal cash generations and sourcing credit lines placed at its disposal by its bankers.
Cautionary Statement
Statements in this Management Discussion and Analysis Report describing the Company’s objectives, projections, estimates, expectations, or predictions may be “forward-looking statements” within the meaning of applicable securities laws and regulations. Actual results could differ materially from those expressed or implied. Important factors that could make a difference to the Company’s operations include raw material availability and prices, cyclical demand and pricing in the Company’s principal markets, changes in Government regulations, tax regimes, US Dollar / Indian Rupee exchange rate, economic developments within India and the countries in which the Company conducts business and other incidental factors.
Mumbai, June 29, 2021

22 Annual Report 2020-21 23• Corporate Overview • Statutory Reports • Financial StatementsD i r e c t o r s ’ R e p o r t a n d i t s A n n e x u r e sN a t i o n a l P e r o x i d e L i m i t e d
6. COMPOSITE SCHEME OF ARRANGEMENT
The Board of Directors at its meeting held on March 9, 2021, has approved the draft Composite Scheme of Arrangement amongst the Company (‘NPL’) (‘the Transferee Company / Demerged Company’), Naperol Investments Limited (‘NIL’) (‘the Transferor Company’), NPL Chemicals Limited (‘NPCL’) (‘the Resulting Company’) and their respective Shareholders and Creditors under Sections 230-232 of the Companies Act, 2013 (‘the Scheme’). The Scheme, inter alia, provides for:
i. Demerger of chemical business of the Company (NPL) into the Resulting Company (NPCL) (as defined in the Scheme), on a going concern basis, and in consideration thereof, the Resulting Company shall issue its equity shares to equity shareholders of the Demerged Company in the same proportion as their holding and;
ii. Amalgamation of the Transferor Company (NIL) with the Transferee Company (NPL).
Rationale for the Scheme:
i. The Transferee / Demerged Company is engaged in business of manufacturing of and dealing in peroxygen chemicals and also owns certain strategic investments as well as engaged in the business of making long term investments and corporate lending directly and also through its wholly owned subsidiary viz., the Transferor Company.
ii. The nature and competition involved in each of the aforementioned businesses is distinct and it is capable of attracting a different set of investors, strategic partners, lenders and other stakeholders.
iii. Further for growth and expansion of the said chemical business and the investment and corporate lending business, differentiated strategy is required to be aligned to the industry specific risks, market dynamics and growth trajectory.
iv. With a view to reorganise the businesses of the Transferee / Demerged Company, it is proposed to bring the said chemical business of the Demerged / Transferee Company under the aegis of the Resulting Company and amalgamate the Transferor Company, engaged in the business of long term investment and corporate lending, with the Transferee Company.
This, inter-alia, would result in the following benefits:
a. unlocking the value of each of the businesses for the shareholders of the Transferee / Demerged Company, attracting investors and providing better flexibility in accessing capital;
b. segregating different businesses having different risk and return profiles, and providing investors with better flexibility to select investments which best suit their investment strategies and risk profile; and
c. enabling focused growth strategy for each of the businesses for exploiting opportunities specific to each business.
Your Directors consider the Scheme to be in the best interests of the Shareholders, Employees and the Creditors of each of the parties thereon.
Consideration for the Scheme:
Amalgamation / Merger
The Transferor Company (NIL) is a wholly owned subsidiary of the Transferee Company (NPL) and therefore for the amalgamation of the Transferor Company with the Transferee Company there shall be no issue of shares by the Transferor Company.
Demerger
Upon the Scheme becoming effective, the Resulting Company (NPCL) shall issue and allot, to each Member of the Demerged Company (NPL) whose names appear in the Register of Members of the Demerged Company as on the Record Date, as under:
“One fully paid-up equity share of H 10/- each (Rupees ten each) of the Resulting Company, for every One equity share of H 10/- each (Rupees ten each) held in the Demerged Company.”
Subject to necessary approvals, the equity shares allotted by the Resulting Company, pursuant to the Scheme, to Shareholders of the Demerged Company shall be listed on BSE Limited.
The Scheme, if approved, shall be effective from the Appointed Date and operative from the Effective Date (as defined in the Scheme) and the Scheme is subject to necessary statutory and regulatory approvals including approval of BSE Limited and Hon’ble National Company Law Tribunal (NCLT), Mumbai Bench.
The Company has filed the Scheme with BSE Limited, on March 27, 2021, for obtaining its observation / no-objection letter required towards filing of the Scheme with the NCLT and the same is awaited.
7. CHANGE(S) IN THE NATURE OF BUSINESS, IF ANY
There is no change in the nature of business carried on by the Company and its subsidiaries. The Company has not changed the class of business in which the Company has an interest.
8. MATERIAL CHANGES AND COMMITMENTS
There have been no material changes and commitments, affecting the financial position of the Company which have occurred between the end of the financial year of the Company to which the financial statements relate and the date of the report.
9. SAFETY & ENVIRONMENT
The Company continues to maintain a good safety and environmental record. There was no lost time injury during the Financial Year 2020-21 and as on March 31, 2021, it has worked for 1,887 days without Lost Time Injury.
10. INSURANCE
All the properties of the Company, including Buildings, Plant and Machinery, Stocks and Materials have been adequately insured. The Company also has a public liability insurance policy as per the Public Liability Insurance Act, 1991.
11. FIXED DEPOSITS
The Company does not accept fresh deposits at present, and as such, no amount on account of principal or interest on public deposits was outstanding as on the date of the balance sheet.
12. DETAILS OF SUBSIDIARIES, JOINT VENTURES, ASSOCIATE AND HOLDING COMPANY
During the year under review, NPL Chemicals Limited was incorporated as wholly owned subsidiary on July 29, 2020, as part of the draft Composite Scheme of Arrangement and accordingly, as on March 31, 2021, the Company has two subsidiaries namely, Naperol Investments Limited and NPL Chemicals Limited. There were no joint ventures and associate Company.
Nowrosjee Wadia and Sons Limited (NWS) holds 30.79% shares in the Company and is the holding company of Macrofil Investments Limited (Macrofil) which also holds 33.31% shares in the Company. Hence, NWS
holding through Macrofil and its other subsidiaries and associates stands at 55.30% shared which makes NWS the holding company of the Company.
13. PERFORMANCE AND FINANCIAL POSITION OF SUBSIDIARY COMPANIES
Naperol Investments Limited is registered as a Non-Banking Financial Company as provided by Section 45-IA of the Reserve Bank of India Act, 1934 and is engaged in the business of long-term investment. During the year under review, the company earned a profit after tax of H 37.29 lakhs as against H 54.94 lakhs in the previous year.
NPL Chemicals limited, was incorporated on July 29, 2020 as part of the draft Composite Scheme of Arrangement to carry on the business of manufacturing, distributing and selling of peroxygen chemicals and has not commenced operations.
Pursuant to Section 129(3) of the Companies Act, 2013, read with Rule 5 of the Companies (Accounts) Rules, 2014, the statement containing salient features of the financial statements of the subsidiary companies in Form AOC-1 forms part of the Consolidated Financial Statements. Pursuant to Section 136 of the Companies Act, 2013, the Company is exempted from attaching to its Annual Report, the Annual Reports of the subsidiary companies.
The Audited Financial Statements of the subsidiary companies are kept open for inspection by the Members at the Head Office of the Company. The Company shall provide a copy of the financial statements of its subsidiary companies to the Members upon their request. The statements are also available on the website of the Company at www.naperol.com.
14. CONSOLIDATED FINANCIAL STATEMENTS
The Company has prepared Consolidated Financial Statements (CFS) in accordance with the applicable Accounting Standards as prescribed under the Companies (Accounts) Rules, 2014 of the Companies Act, 2013.
The Consolidated Financial Results reflect the results of the Company and its subsidiaries. As required under Regulation 34 of the SEBI (Listing Obligations and Disclosure Requirements) Regulations, 2015, the Audited CFS together with the Independent Auditors’ Report thereon are annexed and form part of this Annual Report. The summarized Consolidated Financial Results are provided above at point no. 1 of this Report.

24 Annual Report 2020-21 25• Corporate Overview • Statutory Reports • Financial StatementsD i r e c t o r s ’ R e p o r t a n d i t s A n n e x u r e sN a t i o n a l P e r o x i d e L i m i t e d
15. DIVIDEND DISTRIBUTION POLICY
The Securities and Exchange Board of India (‘SEBI’) vide its amendments in SEBI (Listing Obligations and Disclosure Requirements) Regulations 2015, has extended the requirement of formulation of Dividend Distribution Policy to top 1000 listed entities based on Market Captalization. Accordingly, in compliance with the said requirement, the Company has formulated a Dividend Distribution Policy, and the same is available on the its website at http://naperol.com/BoardPolicies.
16. MANAGEMENT DISCUSSION AND ANALYSIS REPORT
Pursuant to Regulation 34 of the SEBI (Listing Obligations & Disclosure Requirements) Regulations, 2015, the Management Discussion and Analysis Report for the year under review, is presented in a separate section and forms part of this Annual Report.
17. CORPORATE GOVERNANCE
Your Company has taken adequate steps to ensure that all mandatory provisions of Corporate Governance in terms of Regulation 34 of the SEBI (Listing Obligations and Disclosure Requirements) Regulations, 2015 have been complied with.
A separate Report on Corporate Governance along with a Certificate from a Practicing Company Secretary, regarding compliance of the conditions of Corporate Governance, forms part of this Annual Report.
18. BUSINESS RESPONSIBILITY REPORT
A Business Responsibility Report pursuant to Regulation 34(2)(f) of the SEBI (Listing Obligations and Disclosure Requirements) Regulations, 2015, detailing the various initiatives taken by the Company on the environmental, social and governance perspective, in prescribed format forms part of this Annual Report.
19. CORPORATE SOCIAL RESPONSIBILITY
During the Financial Year ended March 31, 2021, the Company has spent H 280 lakhs (Rupees Two Hundred Eighty lakhs) towards its Corporate Social Responsibility (CSR) activities as per the provisions of the Companies Act, 2013. The CSR initiatives of the Company were under the thrust area of health & hygiene, rural development and education. The CSR Policy of the Company is available on the website of the Company at https://www.naperol.com/BoardPolicies
The Ministry of Corporate Affairs (MCA) vide its notification dated January 22, 2021, notified the Companies (Corporate Social Responsibility) Amendment Rules, 2021, which, inter-alia, provides for the revised format of annual report for publishing the CSR Activities undertaken during the Financial Year ended March 31, 2021.
A brief outline of the Company’s CSR policy statement and annual report on the CSR activities undertaken by the Company during the Financial Year ended March 31, 2021, in accordance with Section 135 of the Act and Companies (Corporate Social Responsibility Policy) Rules, 2014 is appended as ‘Annexure I’.
20. DETAILS OF BOARD MEETINGS
During the year, seven Board Meetings were held through video-conferencing mode due to the ongoing threat of COVID-19 pandemic as well as exemptions given by Ministry of Corporate Affairs and Securities & Exchange Board of India. The details of the meetings are provided in the Report on Corporate Governance, which forms part of this Annual Report.
21. BOARD COMMITTEES
As on March 31, 2021, the Board has six committees: Audit Committee, Nomination and Remuneration Committee, Corporate Social Responsibility Committee, Stakeholders’ Relationship Committee, Risk Management Committee and Strategy Advisory Committee.
During the year under review, the Board of Directors had constituted Risk Management Committee and Strategy Advisory Committee. The composition and terms of reference of all the Committees of the Board of Directors of the Company is in line with the provisions of the Companies Act, 2013 and SEBI (Listing Obligations and Disclosire Requirements) Regulations, 2015.
During the year, all the recommendations made by the Committees were approved by the Board. A detailed note on the Committees, its composition, number of Committee meetings held and attendance of the Committee Members at each meeting is provided in the Report on Corporate Governance.
22. ANNUAL RETURN
Pursuant to Section 92(3) and Section 134(3)(a) of the Companies Act, 2013, a copy of the Annual Return of the Company is uploaded on the website of the Company at www.naperol.com.
23. DIRECTORS’ RESPONSIBILITY STATEMENT
Pursuant to Section 134(5) of the Companies Act, 2013, the Board of Directors, to the best of their knowledge and ability, confirm that:
1. in the preparation of the annual accounts, the applicable accounting standards have been followed and that there are no material departures;
2. they have selected such accounting policies and applied them consistently and made judgements and estimates that are reasonable and prudent so as to give a true and fair view of the state of affairs of the Company as at the end of the financial year and of the profit of the Company for that period;
3. they have taken proper and sufficient care for the maintenance of adequate accounting records in accordance with the provisions of this Act for safeguarding the assets of the Company and for preventing and detecting fraud and other irregularities;
4. they have prepared the Annual Accounts on a ‘going concern’ basis;
5. they have laid down internal financial controls to be followed by the Company and that such internal controls are adequate and were operating effectively; and
6. they have devised proper systems to ensure compliance with the provisions of all applicable laws and that such systems were adequate and were operating effectively.
24. ADEQUACY OF INTERNAL FINANCIAL CONTROLS
Internal Audit plays a key role in providing an assurance to the Board of Directors with respect to the Company having adequate Internal Control Systems.
The Internal Control Systems provide, among other things, reasonable assurance of recording the transactions of its operations in all material respects and of providing protection against significant misuse or loss of Company’s assets. The details about the adequacy of Internal Financial Controls are provided in the Management Discussion and Analysis Report.
25. SHARE CAPITAL
The authorised share capital as on March 31, 2021 was H 2,500 lakhs. The paid-up share capital as on March 31,
2021 was H 574.70 lakhs. During the year under review, there has been no change in the authorised and paid-up share capital of the Company.
26. AUDITORS AND AUDIT REPORTS
Statutory Auditors
M/s. Price Waterhouse Chartered Accountants LLP (Firm Registration No. 012754N / N500016), had been appointed as the Statutory Auditors of the Company, from the conclusion of the Annual General Meeting (AGM) held on August 9, 2017, upto the conclusion of the AGM to be held in the financial year 2022-23, subject to ratification of their appointment at every AGM. However, pursuant to the Companies (Amendment) Act, 2017, which was notified on May 7, 2018, the provision related to ratification of appointment of auditors by Members at every AGM has been done away with.
There are no qualifications, reservations or adverse remarks made in the Statutory Auditors’ Report.
Cost Auditors
Pursuant to Section 148 of the Companies Act, 2013, read with the Companies (Audit and Auditors) Rules, 2014 and the Companies (Cost Records and Audit) Rules, 2014, the cost records of the Company are required to be audited. The Board of Directors, on the recommendation of the Audit Committee, appointed M/s. D. C. Dave & Co. Cost Accountants (Firm Registration No. 000611), to audit the cost records of the Company for the financial year ending March 31, 2022, on a remuneration of H 4,50,000/- plus applicable taxes and reimbursement of travelling and out-of-pocket expenses as incurred by them for the purpose of Audit. The remuneration payable to the Cost Auditor is required to be ratified by the Members at this AGM.
There are no qualifications, reservations or adverse remarks made in the Cost Auditors’ Report.
Secretarial Auditors
In terms of Section 204 of the Companies Act, 2013 and the Companies (Appointment and Remuneration of Managerial Personnel) Rules, 2014,
M/s. Parikh & Associates, Practicing Company Secretaries, have been appointed as Secretarial Auditors of the Company to carry out Secretarial Audit.
The Report of the Secretarial Auditors is appended as ‘Annexure II’.

26 Annual Report 2020-21 27• Corporate Overview • Statutory Reports • Financial StatementsD i r e c t o r s ’ R e p o r t a n d i t s A n n e x u r e sN a t i o n a l P e r o x i d e L i m i t e d
The Company has complied with Secretarial Standards issued by the Institute of Company Secretaries of India on Board and General Meetings.
There are no qualifications, reservations or adverse remarks made in the Secretarial Auditors’ Report.
27. RELATED PARTY TRANSACTIONS
All transactions entered into with Related Parties as defined under the Companies Act, 2013 and Regulation 23 of the SEBI (Listing Obligations and Disclosure Requirements) Regulations, 2015 during the financial year were in the ordinary course of business and on an arm’s length basis and do not attract the provisions of Section 188 of the Companies Act, 2013.
During the year, the Company had not entered into any contract / arrangement / transactions with related parties which could be considered as material.
The Company’s policy on dealing with Related Party Transactions as approved by the Board is available on the Company’s website at https://naperol.com/BoardPolicies.
The related party transactions are disclosed under Note No. 42 of the Notes to Standalone Financial Statements for the Financial Year 2020-21.
28. VIGIL MECHANISM / WHISTLE BLOWER POLICY
Pursuant to the provision of Section 177(10) of the Companies Act, 2013 and Regulation 22 of the SEBI (Listing Obligations and Disclosure Requirements) Regulations, 2015, as amended from time to time, the Company has established vigil mechanism through the Audit Committee for Directors and Employees to report genuine concerns about unethical behaviour, actual or suspected fraud or violation of the Company’s Code of Conduct. The vigil mechanism provides for adequate safeguards against victimisation of persons who use such mechanism and make provision for direct access to the Chairman of the Audit Committee in appropriate or exceptional cases.
The details of establishment of such mechanism is also available on the Company’s website at https://naperol.com/BoardPolicies.
29. RISK MANAGEMENT
The Company has in place a mechanism to inform the Board about the risk assessment and minimization procedures and undertakes periodical review of the same to ensure that the risk are indentified and
controlled by means of properly defined framework. In the opinion of the Board, there are no material risks, which may threaten the existence of the Company.However, some of the risks which may pose challenges are set out in the Management Discussion and Analysis Report which forms part of this Annual Report.
30. PREVENTION OF SEXUAL HARASSMENT OF WOMEN AT WORKPLACE
The Company has an Internal Complaints Committee for providing a redressal mechanism pertaining to sexual harassment of women employees at workplace. No complaints were received during the year under review.
31. REPORTING OF FRAUDS
There have been no instances of fraud reported by the Statutory Auditors under Section 143(12) of the Companies Act, 2013 and the Rules framed thereunder, to either the Company or the Central Government.
32. DIRECTORS AND KEY MANAGERIAL PERSONNEL
Retirement by Rotation
In accordance with the provisions of Section 152 of the Companies Act, 2013 and the Articles of Association of the Company, Mr. Ness N. Wadia, Director, retires by rotation at the ensuing Annual General Meeting (AGM) and being eligible, offers himself for re-appointment.
Necessary resolution for the re-appointment of Mr. Ness N. Wadia, Director, has been included in the Notice convening the AGM and requisite details have been provided in the explanatory statement to the Notice.
Independent Directors
The Independent Directors of the Company have given the certificate of independence to the Company stating that they meet the criteria of independence as required under Section 149(6) of the Companies Act, 2013 and SEBI (Listing Obligations and Disclosure Requirements) Regulations, 2015. They have registered their names in the Independent Director’s data-base as maintained by Indian Institute of Corporate Affairs (IICA).
None of the Directors of the Company are disqualified for being appointed as Directors as specified in Section 164(2) of the Companies Act, 2013 and Rule 14(1) of the Companies (Appointment and Qualification of Directors) Rules, 2014.
Key Managerial Personnel
In terms of the provisions of Section 2(51) and Section 203 of the Companies Act, 2013, the following are the Key Managerial Personnel of the Company:
- Mr. Rajiv Arora, Chief Executive Officer & Director
- Mr. Conrad Fernandes, Chief Financial Officer
- Mr. Chandukumar Parmar, Company Secretary & Compliance Officer
33. BOARD EVALUATION
Pursuant to the provisions of the Companies Act, 2013 and SEBI (Listing Obligations and Disclosure Requirements) Regulations, 2015, the Board has carried out annual performance evaluation of its own performance, the Directors individually and all Committees of the Board. The manner in which the evaluation has been carried out has been explained in the Corporate Governance Report.
34. NOMINATION AND REMUNERATION POLICY
The Board has adopted, on the recommendation of the Nomination & Remuneration Committee, a policy for selection and appointment of Directors, Senior Management and their remuneration. A brief detail of the policy is given in the Report on Corporate Governance and is also available on the Company’s website at https://naperol.com/BoardPolicies.
35. PARTICULARS OF EMPLOYEES
The information in terms of provisions of Section 197(12) of the Companies Act, 2013, read with Rule 5(1) of the Companies (Appointment and Remuneration of Managerial Personnel) Rules, 2014, which forms part of this Report, is appended as ‘Annexure III’.
However, as per the provisions of Section 136 of the Companies Act, 2013, the report and accounts are being sent to the Members and others entitled thereto, excluding the information on employees’ particulars as required under Rule 5(2) and 5(3) of the Companies (Appointment and Remuneration of Managerial Personnel) Rules, 2014, which is available for inspection by the Members at the Head Office of the Company
during business hours on working days of the Company upto the date of the ensuing Annual General Meeting.
If any Member is interested in obtaining a copy thereof, such Member may write to the Company Secretary in this regard.
36. PARTICULARS OF LOANS, GUARANTEES OR INVESTMENTS
Details of Loans, Guarantees and Investments covered under the provisions of Section 186 of the Companies Act, 2013, are given in Note No. 14 of the Notes to the Standalone Financial Statements.
37. SIGNIFICANT AND MATERIAL ORDERS PASSED BY THE REGULATORS OR COURTS OR TRIBUNALS
There have been no significant and material orders passed by the regulators, courts and tribunals impacting the going concern status and the Company’s operations in future.
38. CONSERVATION OF ENERGY, TECHNOLOGY ABSORPTION, FOREIGN EXCHANGE EARNINGS AND OUTGO
The information on conservation of energy, technology absorption and foreign exchange earnings and outgo stipulated under Section 134(3) of the Companies Act, 2013, read with Rule 8(3) of the Companies (Accounts) Rules, 2014, is appended as ‘Annexure IV’.
39. ACKNOWLEDGEMENTS
Your Directors would like to express their sincere appreciation to the Customers, Vendors, Bankers, Members, Central and State Governments and Regulatory Authorities for their continued co-operation and support. Your Directors also take this opportunity to acknowledge the dedicated efforts made by Employees for their contribution to the achievements of the Company.
On behalf of the Board of Directors
Ness N. WadiaChairman
DIN: 00036049Mumbai, June 29, 2021

28 Annual Report 2020-21 29• Corporate Overview • Statutory Reports • Financial StatementsD i r e c t o r s ’ R e p o r t a n d i t s A n n e x u r e sN a t i o n a l P e r o x i d e L i m i t e d
ANNEXURE I TO THE DIRECTORS’ REPORTANNUAL REPORT ON CORPORATE SOCIAL RESPONSIBILITY ACTIVITIES[As prescribed under Section 135 of the Companies Act, 2013 (‘the Act’) and Companies (Corporate Social Responsibility Policy) Rules, 2014]
1. A brief outline of the Company’s CSR policy:
The CSR initiatives of the Company aim towards (i) promoting health care including preventive healthcare (ii) promoting education (iii) eradicating hunger, poverty, malnutrition and (iv) sanitation.
The Company has framed a CSR Policy in compliance with the provisions of the Act, which is available on the Company’s website and the web-link for the same is https://naperol.com/BoardPolicies.php
2. Composition of the CSR Committee:
Sr. No.
Name of Director Designation / Nature of Directorship
Number of meetings of CSR Committee held during the year
Number of meetings of CSR Committee
attended during the year
1. Mr. Ness N. WadiaChairman (Non-Executive and Non-Independent Director)
1 1
2. Mr. Rajesh BatraMember (Independent Director)
1 1
3. Mr. Viraf MehtaMember (Independent Director)
1 1
3. Web-link where the Composition of CSR committee, CSR Policy and CSR projects approved by the Board are disclosed on the website of the Company: https://naperol.com/CSR
4. Details of Impact assessment of CSR projects carried out in pursuance of sub-rule (3) of Rule 8 of the Companies (Corporate Social responsibility Policy) Rules, 2014: Not Applicable
5. Details of the amount available for set off in pursuance of sub-rule (3) of Rule 7 of the Companies (Corporate Social Responsibility Policy) Rules, 2014 and amount required for set off for the financial year, if any: Not Applicable
6. Average net profit of the Company as per Section 135(5): H 13,660 lakhs
7. (a) Two percent of average net profit of the Company as per Section 135(5):
H 273 lakhs
(b) Surplus arising out of the CSR projects or programmes or activities of the previous financial years:
Not Applicable
(c) Amount required to be set off for the financial year, if any:
Not Applicable
(d) Total CSR obligation for the financial year (7a+7b-7c):
H 273 lakhs
8. (a) CSR amount spent or unspent for the financial year:
Total Amount Spent for the Financial
Year (in J)
Amount Unspent
Total Amount transferred to Unspent CSR Account as per Section 135(6)
Amount transferred to any fund specified under Schedule VII as per second proviso to Section 135(5) of the act
Amount Date of transferName of the
FundAmount Date of transfer
280 lakhs Nil NA NA Nil NA
(1) (2) (3) (4) (5) (6) (7) (8) (9) (10) (11)
Sr. No
Name of the Project
Item from the list of
activities in Schedule VII
to the Act
Local area (Yes/No)
Location of the project
Project duration
Amount allocated
for the project (in J)
Amount spent in the
current Financial
Year (in J)
Amount transferred to Unspent
CSR Account for the
project as per Section
135(6) (in J)
Mode of Implementation
- Direct (Yes / No)
Mode of Implementation
- Through Implementing Agency
State* District Name#
CSR Registration
number
1.
Upgradation of Neonatal & Pediatric Intensive
Care Units
Promotinghealth care
Yes MH Mumbai 2 years 70 lakhs 70 lakhs Nil No BJWHC CSR00000813
2.
Improved Service
Delivery and Retrofitting Project for
Medical Gas works
Promotinghealth care
Yes MH Mumbai 2 years 47 lakhs 47 lakhs Nil No NWMH CSR00000817
3.Village
Development Project
Rural development
projectsYes MH Thane 2 years 40 lakhs 40 lakhs Nil No SNWF CSR00000818
4.
School repair and
refurbishment project
Promoting education
Yes MH Thane 2 years 35 lakhs 35 lakhs Nil No SNWF CSR00000818
5.Mudi’s
Hospital Project
Promoting health care including
preventive health
care and sanitation
No TN Coimbatore 2 years 51 lakhs 51 lakhs Nil No SNWF CSR00000818
Total 243 lakhs 243 lakhs Nil
(b) Details of CSR amount spent against ongoing projects for the financial year:
*MH – Maharashtra; TN – Tamil Nadu
#BJWHC - Bai Jerbai Wadia Hospital for Children; NWMH - Nowrosjee Wadia Maternity Hospital; SNWF - Sir Ness Wadia Foundation

30 Annual Report 2020-21 31• Corporate Overview • Statutory Reports • Financial StatementsD i r e c t o r s ’ R e p o r t a n d i t s A n n e x u r e sN a t i o n a l P e r o x i d e L i m i t e d
Sr. No
Name of the Project
Item from the list of
activities in schedule VII
to the Act
Local area (Yes/ No)
Location of the project Amount
spent for the project
(in J)
Mode of implementation -
Direct (Yes/No)
Mode of implementation -
Through implementing agency
State* District NameCSR
registration number
1.
Relief and aid related
to COVID-19 pandemic
Disaster Management Yes MH Mumbai 37 lakhs Yes NA NA
Total 37 lakhs
(c) Details of CSR amount spent against other than ongoing projects for the financial year:
(d) Amount spent in Administrative Overheads: Nil
(e) Amount spent on Impact Assessment, if applicable: Not Applicable
(f) Total amount spent for the Financial Year (8b+8c+8d+8e): H 280 lakhs
(g) Excess amount for set off, if any:
Sr. No.
Particulars Amount (in J)
(i) Two percent of average net profit of the company as per Section 135(5) 273 lakhs
(ii) Total amount spent for the financial year 280 lakhs
(iii) Excess amount spent for the financial year [(ii)-(i)] 7 lakhs*
(iv) Surplus arising out of the CSR projects or programmes or activities of the previous financial years, if any
Nil
(v) Amount available for set off in succeeding financial years [(iii)-(iv)] Nil*
9. (a) Details of Unspent CSR amount for the preceding three financial years: Nil
(b) Details of CSR amount spent in the financial year for ongoing projects of the preceding financial year(s): Nil
10. In case of creation or acquisition of capital asset, furnish the details relating to the asset so created or acquired through CSR spent in the financial year: Nil
11. Specify the reason(s), if the Company has failed to spend two per cent of the average net profit as per Section 135(5): Not Applicable
For and on behalf of the Corporate Social Responsibility Committee of National Peroxide Limited
Ness N. WadiaChairman
CSR Committee DIN: 00036049
*The Company would not set off the excess amount of H 7 lakhs spent for the Financial Year 2020-21
For National Peroxide Limited
Rajiv AroraChief Executive Officer & DirectorDIN: 08730235
Mumbai, June 29, 2021
*MH – Maharashtra
SECRETARIAL AUDIT REPORT FOR THE FINANCIAL YEAR ENDED MARCH 31, 2021
To,The Members,National Peroxide Limited
We have conducted the secretarial audit of the compliance of applicable statutory provisions and the adherence to good corporate practices by National Peroxide Limited (hereinafter called ‘the Company’). Secretarial Audit was conducted in a manner that provided us a reasonable basis for evaluating the corporate conducts / statutory compliances and expressing our opinion thereon.
Based on our verification of the Company’s books, papers, minute books, forms and returns filed and other records maintained by the Company, the information to the extent provided by the Company, its officers, agents and authorised representatives during the conduct of secretarial audit, the explanations and clarifications given to us and the representations made by the Management and considering the relaxations granted by the Ministry of Corporate Affairs and the Securities and Exchange Board of India warranted due to the spread of the COVID-19 pandemic, we hereby report that in our opinion, the Company has during the audit period covering the financial year ended on March 31, 2021, generally complied with the statutory provisions listed hereunder and also that the Company has proper Board processes and compliance mechanism in place to the extent, in the manner and subject to the reporting made hereinafter:
We have examined the books, papers, minute books, forms and returns filed and other records made available to us and maintained by the Company for the financial year ended on March 31, 2021 according to the applicable provisions of:
(i) The Companies Act, 2013 (‘the Act’) and the rules made thereunder;
(ii) The Securities Contract (Regulation) Act, 1956 (‘SCRA’) and the rules made thereunder;
(iii) The Depositories Act, 1996 and the Regulations and Bye-laws framed thereunder;
(iv) Foreign Exchange Management Act, 1999 and the rules and regulations made thereunder to the extent of Foreign Direct Investment, Overseas Direct Investment and External Commercial Borrowings;
(v) The following Regulations and Guidelines prescribed under the Securities and Exchange Board of India Act, 1992 (‘SEBI Act’):
(a) The Securities and Exchange Board of India (Substantial Acquisition of Shares and Takeovers) Regulations, 2011;
(b) The Securities and Exchange Board of India (Prohibition of Insider Trading) Regulations, 2015;
(c) The Securities and Exchange Board of India (Issue of Capital and Disclosure Requirements) Regulations, 2018 and amendments from time to time; (Not applicable to the Company during the audit period)
(d) The Securities and Exchange Board of India (Share Based Employee Benefits) Regulations, 2014; (Not applicable to the Company during the audit period)
(e) The Securities and Exchange Board of India (Issue and Listing of Debt Securities) Regulations, 2008; (Not applicable to the Company during the audit period)
(f) The Securities and Exchange Board of India (Registrars to an Issue and Share Transfer Agents) Regulations, 1993 regarding the Companies Act and dealing with client;
(Not applicable to the Company during the audit period)
(g) The Securities and Exchange Board of India (Delisting of Equity Shares) Regulations, 2009;
(Not applicable to the Company during the audit period) and
ANNEXURE II TO THE DIRECTORS’ REPORT
[Pursuant to section 204 (1) of the Companies Act, 2013 and Rule No. 9 of the Companies (Appointment and Remuneration of Managerial Personnel) Rules, 2014]

32 Annual Report 2020-21 33• Corporate Overview • Statutory Reports • Financial StatementsD i r e c t o r s ’ R e p o r t a n d i t s A n n e x u r e sN a t i o n a l P e r o x i d e L i m i t e d
(h) The Securities and Exchange Board of India (Buyback of Securities) Regulations, 2018; (Not applicable to the Company during the audit period)
(vi) Other laws applicable specifically to the Company namely:-
a) The Manufacture Storage & Import of Hazardous Chemicals Rules, 1989, as amended;
b) The Hazardous & Other Waste (Management, Handling & Trans Boundary Movements) Rules, 2016;
c) The Indian Boilers Act, 1923;
d) Indian Boiler Regulations 1950 and amendments thereof;
e) Explosives Act, 1884 & Rules, 1981 & Static and Mobile Pressure Vessel (Unfired) Rules, 1981; and
f) Chemical Accidents (Emergency Planning, Preparedness and Response) Rules, 1996.
We have also examined compliance with the applicable clauses of the following which have been generally complied:
(i) Secretarial Standards issued by The Institute of Company Secretaries of India with respect to Board and General Meetings.
(ii) The Listing Agreement entered into by the Company with BSE Limited read with the SEBI (Listing Obligations and Disclosure Requirements) Regulations, 2015.
During the year, under review, the Company has generally complied with the provisions of the Act, Rules, Regulations, Guidelines, standards etc., as mentioned above.
We further report that:
The Board of Directors of the Company is duly constituted with proper balance of Executive Director, Non-Executive Directors and Independent Directors. The changes in the composition of the Board of Directors that took place during the period under review were carried out in compliance with the provisions of the Act.
Adequate notice was given to all Directors to schedule the Board Meetings, agenda and detailed notes on agenda were sent at least seven days in advance for meetings other than those held at shorter notice and a system exists for seeking and obtaining further information and clarifications on the agenda items before the meeting and for meaningful participation at the meeting.
Decisions at the Board Meetings were taken unanimously.
We further report that there are systems and processes in the Company commensurate with the size and operations of the Company to monitor and ensure compliance with applicable laws, rules, regulations and guidelines etc.
We further report that during the audit period, the Company had following event which had bearing on the Company’s affairs in pursuance of the above referred laws, rules, regulations, guidelines, standards etc.
1. The Board of Directors at its meeting held on March 9, 2021 had approved the draft composite Scheme of Arrangement amongst the Company (‘Transferee Company’ / ‘Demerged Company’); Naperol Investments Limited, subsidiary company (‘Transferor Company’) and NPL Chemicals Limited, subsidiary company (‘Resulting Company’).
For Parikh & AssociatesCompany Secretaries
Shalini BhatPartner
Place : Mumbai FCS No: 6484 CP No: 6994Date : June 29, 2021 UDIN: F006484C000537124
This Report is to be read with our letter of even date which is annexed as Annexure A and Forms an integral part of this report.
‘Annexure A’
To, The Members National Peroxide Limited
Our report of even date is to be read along with this letter.
1. Maintenance of secretarial record is the responsibility of the management of the Company. Our responsibility is to express an opinion on these secretarial records based on our audit.
2. We have followed the audit practices and process as were appropriate to obtain reasonable assurance about the correctness of the contents of the secretarial records. The verification was done on test basis to ensure that correct facts are reflected in secretarial records. We believe that the process and practices, we followed provide a reasonable basis for our opinion.
3. We have not verified the correctness and appropriateness of financial records and Books of Accounts of the Company.
4. Wherever required, we have obtained the Management Representation about the Compliance of laws, rules and regulations and happening of events etc.
5. The Compliance of the provisions of Corporate and other applicable laws, rules, regulations, standards is the responsibility of management. Our examination was limited to the verification of procedure on test basis.
6. The Secretarial Audit report is neither an assurance as to the future viability of the Company nor of the efficacy or effectiveness with which the management has conducted the affairs of the Company.
For Parikh & AssociatesCompany Secretaries
Shalini BhatPartner
Place : Mumbai FCS No: 6484 CP No: 6994Date : June 29, 2021 UDIN: F006484C000537124

34 Annual Report 2020-21 35• Corporate Overview • Statutory Reports • Financial StatementsD i r e c t o r s ’ R e p o r t a n d i t s A n n e x u r e sN a t i o n a l P e r o x i d e L i m i t e d
ANNEXURE III TO THE DIRECTORS’ REPORTDETAILS OF THE REMUNERATION OF DIRECTORS, KMPs AND EMPLOYEES[Pursuant to Section 197(12) of the Companies Act, 2013 read with Rule 5(1) of the Companies (Appointment and Remuneration of Managerial Personnel) Rules, 2014]
The percentage increase in remuneration of each Director, Chief Financial Officer and Company Secretary during the Financial Year 2020-21, ratio of the remuneration of each Director to the median remuneration of the employees of the Company for the Financial Year 2020-21 and the comparison of remuneration of each Key Managerial Personnel (KMP) against the performance of the Company are as under:
Sr. No.
Name of Director/KMP and Designation
Remuneration of Director /
KMP for the F.Y. 2020-21
(J in lakhs)
% increase in Remuneration
in the F.Y. 2020-21
Ratio of remuneration of
each Director / KMP to median
remuneration of employees
1. Mr. Ness N. Wadia, Chairman(Non-Executive and Non-Independent) 19.70 (73) 1.85:1
2. Mr. Rajesh Batra(Non-Executive and Independent) 18.77 (12) 1.77:1
3. Mr. S. Ragothaman(Non-Executive and Independent Director) 13.90 52 1.31:1
4. Dr. (Mrs.) Minnie Bodhanwala(Non-Executive and Non-Independent Director) 6.04 (34) 0.56:1
5. Mr. Viraf Mehta*(Non-Executive and Independent Director) 14.59 * 1.38:1
6. Mrs. Harshbeena Zaveri**(Non-Executive and Independent Director) 5.80 ** 0.54:1
7. Mr. N. P. Ghanekar#
(Non-Executive and Independent Director) 2.70 # #
8. Mr. Rajiv Arora##
Chief Executive Officer and Director 142.12 ## 13.40:1
9. Mr. Suresh Khurana^Chief Executive Officer and Director 44.01 ^ 4.15:1
10. Mr. Conrad Fernandes,Chief Financial Officer 67.84 - 6.40:1
11. Mr. Chandukumar Parmar, Company Secretary 11.25 - 1.06:1
Note:
* Mr. Viraf Mehta was appointed as a Non-Executive & Independent Director with effect from July 4, 2019. Details not given as he was Director only for part of the financial year 2019-20.
** Mrs. Harshbeena Zaveri was appointed as a Non-Executive & Independent Woman Director with effect from March 31, 2020. Details not given as she was Director only for part of the financial year 2019-20.
# Mr. N. P. Ghanekar was Non-Executive and Independent Director upto August 10, 2019. Details not given as he was Director only for part of the financial year 2019-20. Commission is related to financial year 2019-20 which was paid in FY 2020-21.
## Mr. Rajiv Arora was appointed as a Chief Executive Officer & Director with effect from June 4, 2020. Details not given as he was Director only for part of the Financial Year 2020-21.
^ Mr. Suresh Khurana was Chief Executive Officer & Director upto June 4, 2020. Details not given as he was Director only for part of the financial year 2020-21.
1. The ratio of the remuneration of each director to the median remuneration of the employees of the company for the financial year:
The median remuneration of employees of the Company during the financial year was H 10.60 lakhs and ratio of the remuneration of each Director to the median remuneration of the employees of the Company for the financial year is provided in the above table.
2. The percentage increase in the median remuneration of employees in the financial year:
In the financial year, there was an increase of 0.90% in the median remuneration of employees.
3. The number of permanent employees on the rolls of the Company:
There were 126 number of permanent employees on the rolls of the Company as on March 31, 2021.
4. Average percentile increase already made in the salaries of employees other than the managerial personnel in the last financial year and its comparison with the percentile increase in the managerial remuneration and justification thereof and point out if there are any exceptional circumstances for increase in the managerial remuneration:
Average percentage increase in the salaries of employees other than Managerial Personnel in FY 2020-2021 on comparable basis was 2.9% over previous year on account of Dearness Allowance increase, whereas there was no change in Managerial Remuneration due to cost conservation measures taken by the company on account of COVID -19.
5. Affirmation that the remuneration is as per the remuneration policy of the Company:
It is hereby affirmed that the remuneration paid is as per the Remuneration Policy of the Company.
On Behalf of the Board of Directors
Ness N. WadiaChairman
DIN: 00036049Mumbai, June 29, 2021

36 Annual Report 2020-21 37• Corporate Overview • Statutory Reports • Financial StatementsD i r e c t o r s ’ R e p o r t a n d i t s A n n e x u r e sN a t i o n a l P e r o x i d e L i m i t e d
ANNEXURE IV TO THE DIRECTORS’ REPORTCONSERVATION OF ENERGY, TECHNOLOGY ABSORPTION, FOREIGN EXCHANGE EARNINGS AND OUTGO [Pursuant to Section 134(3)(m) of the Companies Act, 2013, read with Rule 8(3) of the Companies (Accounts) Rules, 2014]
The details of conservation of energy, technology absorption, foreign exchange earnings and outgo are as follows:
A. Conservation of Energy:
(a) The steps taken or impact on conservation of energy:
Several measures for conservation of energy were undertaken during the year. Some of the key measures are highlighted as under:
2020-21 2019-20
1. Electricitya. Purchased: Units (KWH) 3,60,60,337 2,58,95,800 Total Amount (H in lakhs) 2,939.02 2,220.89 Rate / Unit (H / KWH) 8.15 8.58b. Own Generation: (i) Through diesel generator Units (KWH) 13,074 74,680 Units / litre of diesel oil (KWH) 3.44 3.32 Cost of diesel / Unit (H / KWH) 19.95 18.92 (ii) Through steam turbine / generator (KWH) 3,55,221 Nil
2. Coal Not Applicable3. Fuel
a. Furnace Oil Quantity (MT) 0.00 9.771 Total amount (H in lakhs) 0.00 2.88 Average rate (H / MT) 0.00 29,437.47b. Natural Gas Quantity (MMBTU) 26,810 24,230 Total amount (H in lakhs) 182.01 219.53 Average rate (H / MMBTU) 678.90 906.03
4. Other / Internal Generation Not Applicable
• Replaced old window Split air conditioner units with new energy efficient machines.
• Replaced old 23/45/60 watts lights /lamps with 9/18 watts for plant and peripheral lightings.
• Installed energy efficient LED light fittings in the office area and plant peripheral area.
These measures, along with the measures taken during the past few years, have resulted in significant reduction in energy consumption.
Total energy consumption & energy consumption per unit of production:
A. POWER AND FUEL CONSUMPTION
B. CONSUMPTION PER UNIT OF PRODUCTION
(H in lakhs)
Particulars 2020-21 2019-20
Foreign exchange earned 680.20 19.62Foreign exchange used 140.45 1,989.09
(b) The steps taken by the Company for utilising alternate sources of energy:
The Company continue to evaluate alternate source of energy including solar based power. Under present condition, they are economically not viable.
(c) The capital investment on energy conservation equipment:
No significant capital investment was incurred during the year on various energy conservation measures.
B. TECHNOLOGY ABSORPTION:
(a) Efforts made towards technology absorption:
• Engineering, Process Design and installation commissioning of equipments for expansion of Hydrogen Gas (H2) and Hydrogen Peroxide Plant.
• The Hydrogen plant capacity trials were conducted to ascertain the plant installed capacity.
• Installation of Volute Dewatering unit and Spin Flash Dryer (SFD) for drying of Effluent Treatment Plant (ETP) sludge.
• Installation of Steam turbine for use of High-pressure export steam from H2 plant.
• Installation and commissioning of Wastewater Recovery unit for Zero Liquid Discharge.
• Operating the boiler with Economiser for optimum usage of fuel.
(b) Benefits derived like product improvement, cost reduction, product development or import substitution:
• Stable operation of the Plant at high capacity with trained manpower.
• Established requirements to debottleneck Hydrogen plant capacity at low capital cost.
• With drying of ETP effluent reduced cost of Sludge disposal.
• The Steam turbine is generating power from High pressure export steam and reduced power cost.
• Compliance of MPCB consent conditions for scale up plant capacity and water recycling resulting in freshwater conservation and Zero Liquid Discharge.
• Better economy, reduction in emission and clean operation.
(c) In case of imported technology (imported during the last three years reckoned from the beginning of the financial year):
• The details of technology imported: Not Aplicable
• The year of import: Not Aplicable
• Whether the technology been fully absorbed: Not Aplicable
• If not fully absorbed, areas where absorption has not taken place, and the reasons thereof: Not Aplicable
(d) The expenditure incurred on Research and Development:
• Capital expenditure : H 22.07 lakhs
• Recurring expenditure : Nil
• Total expenses : Nil
• Total as % of turnover : Nil
C. FOREIGN EXCHANGE EARNING AND OUTGO:
The foreign exchange earned in terms of actual inflows and the foreign outgo in terms of actual outflows, during the year, are as follows:
* The consumption for fuel is calculated on the basis of annual production. The equivalent fuel oil specific consumption on gross calorific value basis for 2019-20 and 2020-21 works out to 9.74 and 10.61 of Fuel Oil Kgs/MT respectively.
2020-21 2019-20
1. Electricity (KWH / MT) 404.75 386.462. Fuel
a. Furnace Oil (Kgs / MT) 0.00 0.16b. Natural Gas (MMBTU / MT)* 0.31 0.39

38 Annual Report 2020-21 39• Corporate Overview • Statutory Reports • Financial StatementsR e p o r t o n C o r p o r a t e G o v e r n a n c eN a t i o n a l P e r o x i d e L i m i t e d
REPORT ON CORPORATE GOVERNANCE
The Company’s Report on Corporate Governance pursuant to Regulation 34 read with Schedule V of the SEBI (Listing Obligations and Disclosure Requirements) Regulations 2015, (hereinafter referred to as ‘Listing Regulations’) for the year ended March 31, 2021, is given below:
1. Company’s Philosophy on Code of Governance
Your Company is committed to bring about good corporate governance practices. The Company’s policy on Corporate Governance is to make it a way of life by, inter-alia, adopting the standard Corporate Governance practices through continual improvement of internal systems and satisfaction of customers and members. It strongly believes in attaining transparency, accountability and equity, in all its operations, and in its interactions with stakeholders including members, customers, vendors, employees, government and lenders.
2. Board of Directors: (a) Composition of the Board:
The Board is headed by Mr. Ness N. Wadia, Non-Executive Chairman and is comprised of eminent persons with considerable professional experience in varied fields.
The Board of Directors of the Company has an optimum combination of Executive and Non-Executive Directors with two Women Directors, one of them being Independent. As on March 31, 2021, the Board of Directors of the Company comprises of seven Directors, out of which two are Non-Executive Directors, four are Independent Directors and one is Executive Director. None of the Directors of the Company are related to each other.
The composition of the Board of Directors meets the requirement of Regulation 17 of the Listing Regulations as detailed in the table at item 2(c) below.
(b) Board Meetings:
During the year under review, seven Board Meetings were held. The dates on which the meetings were held are: June 4, 2020; July 14, 2020; August 25, 2020; October 21, 2020; February 3, 2021, March 9, 2021 and March 16, 2021.
(c) Membership, Attendance and Other Directorships:
Sr.No.
Name of DirectorDirector
Identification Number
Category@ Designation
Number of Board Meetings attended
Whether attendedlast AGM
No of Other Directorships
held#
No. of Chairmanship /Membership in other Board Committees ^
Chairman Member
1 Mr. Ness N. Wadia 00036049 NE & NID Chairman 6 Yes 4 - 5
2Dr. (Mrs.) Minnie Bodhanwala
00422067 NE & NID Director 7 Yes 4 1 5
3 Mr. Rajesh Batra 00020764 NE & ID Director 7 Yes 6 1 4
4 Mr. S. Ragothaman 00042395 NE & ID Director 7 Yes 2 4
5 Mr. Viraf Mehta 00352598 NE & ID Director 7 Yes 1 - 2
6 Mrs. Harshbeena Zaveri 00003948 NE & ID Director 7 Yes 2 - 4
7 Mr. Rajiv Arora * 08730235 EDCEO &
Director6 Yes 1 - 1
8 Mr. Suresh Khurana * 06677496 EDCEO &
Director1 N.A. - - -
@ I: Independent; NE: Non-Executive ; NI: Non-Independent; CEO: Chief Executive Officer;
# Excludes Directorship in foreign companies, private companies and companies governed by Section 8 of the Companies Act, 2013;
^ Chairmanship / Membership includes Audit Committee and Stakeholders’ Relationship Committee of Indian Public Limited Companies;
* Mr. Rajiv Arora was appointed as the Chief Executive Officer & Director w.e.f. June 4, 2020 and Mr. Suresh Khurana ceased to be the Chief Executive Officer & Director w.e.f. the conclusion of the Board Meeting held on June 4, 2020.
Name of the Director Directorships of Listed Companies Category of Directorship
Mr. Ness N. Wadia
The Bombay Burmah Trading Corporation, Limited
Managing Director
The Bombay Dyeing and Manufacturing Company Limited Non-Executive and Non-Independent DirectorBritannia Industries Limited
Mr. Rajesh BatraCravatex Limited Executive DirectorThe Bombay Burmah Trading Corporation, Limited
Non-Executive and Independent Director
Mr. S. RagothamanThe Bombay Dyeing and Manufacturing Company Limited Non-Executive and Independent DirectorXPRO India Limited
Dr. (Mrs.) Minnie Bodhanwala
The Bombay Burmah Trading Corporation, Limited
Non-Executive and Non Independent DirectorThe Bombay Dyeing and Manufacturing Company LimitedAxel Polymers Limited
Mr. Viraf Mehta Nil Nil
Mrs. Harshbeena ZaveriNRB Bearings Limited Executive DirectorSNL Bearings Limited Non-Executive and Non Independent Director
Mr. Rajiv Arora Nil Nil
Sr. No.
List of core skills / expertise / competence
Mr.
Nes
s N
. Wad
ia
Mr.
Raj
esh
Batr
a
Mr.
S. R
agot
ham
an
Dr.
(Mrs
.) M
inni
e Bo
dhan
wal
a
Mr.
Vir
af M
ehta
Mrs
. Har
shbe
ena
Zave
ri
Mr.
Raj
iv A
rora
1
Leadership of large organizationsExperience of leading operations of large organizations with deep understanding of complex business processes, regulatory and governance environment, risk management and ability to visualize and manage change.
- -
2
Visioning and Strategic planningExpertise in developing and implementing strategies for sustainable and profitable growth of the Company.
3
Industry insights and InnovationInsights of Industry behaviour and experience in understanding trends of Industry preferences and innovation management.
- - -
The names of other listed companies in which the Directors hold Directorships as on March 31, 2021 are as under:
(d) Matrix highlighting core skills / expertise / competencies of the Board of Directors
The Board of Directors have identified the following skills required for the Company and the availability of such skills with the Board.

40 Annual Report 2020-21 41• Corporate Overview • Statutory Reports • Financial StatementsR e p o r t o n C o r p o r a t e G o v e r n a n c eN a t i o n a l P e r o x i d e L i m i t e d
Sr. No.
List of core skills / expertise / competence
Mr.
Nes
s N
. Wad
ia
Mr.
Raj
esh
Batr
a
Mr.
S. R
agot
ham
an
Dr.
(Mrs
.) M
inni
e Bo
dhan
wal
a
Mr.
Vir
af M
ehta
Mrs
. Har
shbe
ena
Zave
ri
Mr.
Raj
iv A
rora
4
Financial Management and AccountingExpertise in understanding and management of complex financial functions and processes of large organisations, deep knowledge of accounting, finance and treasury for financial health of the Corporation.
5
Knowledge and expertise of Trade and Economic PoliciesPossessing knowledge and expertise of various trade and economic policies, ability to analyse their impact on the business of the Corporation and devise revised strategies.
-
6
Governance and Regulatory requirementsUnderstanding of the changing legal and regulatory landscape of the Country from time to time. Knowledge and experience in regulatory and governance requirements and ability to identify key risks affecting the governance of the Company.
3. Board Committees:
The Board has constituted the following Committees of the Directors:
(a) Audit Committee:
The Audit Committee is constituted as per the provisions of Section 177 of the Companies Act, 2013, (the Act) read with Regulation 18 of the Listing Regulations. The Audit Committee currently comprises of three members, all being Independent Directors. The members of the Audit Committee have wide exposure and knowledge in areas of finance and accounting.
The meetings of the Audit Committee are also attended by the Executive Director, the Chief Financial Officer, the Statutory Auditors, the Internal Auditors and the Cost Auditors as invitees. The Company Secretary acts as the Secretary to the Audit Committee.
The Board has adopted an Audit Committee Charter, for its functioning. All the items listed in Section 177
of the Act and Regulation 18(3), read with Part C of Schedule II of the Listing Regulations are covered in its terms of reference.
The role of the Audit Committee flows directly from the Board of Directors overview function on corporate governance, which holds the Management accountable to the Board and the Board accountable to the stakeholders.
The term of reference of the Audit Committee broadly includes acting as a catalyst, in helping the organization achieve its objectives. The Audit Committee’s primary role is to review the Company’s financial statements, internal financial reporting process, internal financial controls, the audit process, adequacy, reliability and effectiveness of the internal control systems and risk management process, vigil mechanism, related party transactions, monitoring process for compliance with laws and regulations and the code of conduct. The Audit Committee also reviews various reports and presentations and the responses thereto by the Management.
Composition and Attendance:
During the year under review, the Committee met eight times, i.e. on June 4, 2020; June 25, 2020, July 14, 2020; August 25, 2020; October 21, 2020, February 2, 2021, March 9, 2021 and March 30, 2021. The attendance of each Committee member is given below:
Sr.No.
Name of the Director Designation Category*No. of Meetings
Attended
1 Mr. S. Ragothaman Chairman NE & ID 82 Mr. Rajesh Batra Member NE & ID 83 Mr. Viraf Mehta Member NE & ID 8
Sr. No.
Name of the Director Designation Category*No. of Meetings
Attended
1 Mr. Rajesh Batra Chairman NE & ID 33 Mr. Viraf Mehta Member NE & ID 32 Mr. Ness N. Wadia Member NE & NID 3
* NE: Non-Executive; ID: Independent Director
* NE: Non-Executive; NI: Non-Independent Director; ID: Independent Director
Internal Audit and Control:
M/s. PKF Sridhar and Santhanam LLP, Internal Auditors of the Company conducted the Internal Audit. The reports and findings of the Internal Auditors and the internal control system are periodically reviewed by the Audit Committee.
(b) Nomination and Remuneration Committee:
The Nomination and Remuneration Committee currently comprises of three members with majority being Independent Directors. The composition of the Committee is in compliance with the requirement of Section 178 of the Companies Act, 2013 and Regulation 19 of the Listing Regulations.
Composition and Attendance:
During the year under review, the Committee met three times i.e. on July 13, 2020; October 21, 2020 and March 16, 2021. The attendance of each Committee member is given below:
The remuneration policy of the Company is performance driven and structured to motivate the employees, recognize their merits and achievements and promote excellence in their performance. The broad terms of reference of the Nomination and Remuneration Committee include:
i. Setup and Composition of the Board, its Committees and the leadership team of the Company comprising of Key Managerial Personnel (KMP) and Executive Team.
ii. Evaluation of performance of the Board, its Committees and individual Directors.
iii. Remuneration for Directors, KMPs and Executive Team.
vi. Oversight of the familiarisation programme of Directors.
v. Oversight of the HR Philisophy, HR and People strategy and key HR practices.

42 Annual Report 2020-21 43• Corporate Overview • Statutory Reports • Financial StatementsR e p o r t o n C o r p o r a t e G o v e r n a n c eN a t i o n a l P e r o x i d e L i m i t e d
Remuneration Policy:
The remuneration payable to the Executive Director is considered and approved by the Board as per the recommendation of Nomination and Remuneration Committee and is also governed by the agreement executed between him and the Company. The Board has approved the agreement for appointment of the Executive Director and the Members have approved the same at the Annual General Meeting held for FY 2019-20. The criteria adopted by the Committee to determine the remuneration of the Executive Director is the performance of the Company and the industry benchmarks. The remuneration structure comprises salary, incentive allowance, commission linked to
(H in lakhs)
Name of the Director Salary Benefits* Commission TotalTotal no. of shares held
Mr. Rajiv Arora (w.e.f June 4, 2020) 132.72 9.41 - 142.13 NilMr. Suresh Khurana (upto June 4, 2020) 40.91 3.10 - 44.01 Nil
(H in lakhs)
Name of the Director Commission* Sitting Fees TotalTotal no. of shares held
Mr. Ness N. Wadia 14.50 5.20 19.70 4,600Dr. (Mrs.) Minnie Bodhanwala 1.84 4.20 6.04 NilMr. Rajesh Batra 5.42 13.35 18.77 NilMr. S. Ragothaman 2.90 11.00 13.90 NilMr. Viraf Mehta 1.84 12.95 14.59 NilMrs. Harshbeena Zaveri# Nil 5.80 5.80 NilMr. N. P. Ghanekar^ 2.70 Nil 2.70 NilTotal 29.20 52.50 - 4,600
* Includes Company’s contribution to Provident and Superannuation Funds, amounting to H 12,50,262/-.
B. Details of payments made to Non-Executive Directors during the Financial Year 2020-21 and their Shareholding in the Company, as on March 31, 2021:
* Commission is related to FY 2019-20 which was paid in FY 2020-21. # Mrs. Harshbeena Zaveri was appointed as a Non-Executive & Independent Director with effect from March 31, 2020 and hence was not
eligible for the commission. ^ Mr. N. P. Ghanekar was Non-Executive & Independent Director upto August 10, 2019.
profits, perquisites and allowance, contribution to provident fund and superannuation fund.
The Non-Executive Directors do not draw any remuneration from the Company. The Non-Executive Directors are paid sitting fees for their commitment towards attending the meetings of the Board / Committees and commission on the basis of their performance, as may be recommended by the Nomination and Remuneration Committee and approved by the Board from time to time. The commission payable to them is distributed broadly on the basis of their attendance; contributions at Board / Committee Meetings and Chairmanship of Committees of the Board.
A. Details of remuneration paid to the Executive Director during the Finacial Year 2020-21 and his shareholding in the Company:
Apart from the above, there are no other pecuniary relationships of or transactions by the Non-Executive Directors with the Company.
During the Financial Year 2020-21, a provision of H 27.30 lakhs is made in the books of accounts, for payment of commission to Non-Executive Directors, under Section 197 and 198 of the Companies Act, 2013. The individual amounts will be shown in the year of payment.
Presently, the Company does not have a scheme for grant of stock options either to the Directors or to the Employees.
Details of Service Contract, Notice Period, etc., of all the Directors for the Financial Year ended March 31, 2021:
Directors Contract Period (Tenure)Service
ContractNotice Period & Severance Fees
Executive Director (Mr. Rajiv Arora)
5 years w.e.f June 4, 2020 Yes
Six months’ notice or Six months’ salary, in lieu thereof
Non-Executive and Non- Independent Director
None. The Non-Executive Directors, liable to retire by rotation, get re-appointed as per the provisions of Articles of Association of the Company and the Companies Act, 2013
No None
Non–Executive and Independent Director
None. The Non-Executive and Independent Directors are appointed for an initial term of 5 years and a second term of 3/5 years as required
No None
(c) Stakeholders’ Relationship Committee:
The Stakeholders’ Relationship Committee, which comprises of three members, has been constituted to monitor and review investors’ grievances.
The Committee’s constitution and terms of reference are in compliance with the provisions of Section 178(5) of the Companies Act, 2013 and Regulation 20 of the Listing Regulations.
Terms of Reference:
The broad terms of reference of the Committee include:
i. To resolve the grievances of the security holders of the Company including complaints related to transfer /transmission of shares, non-receipt of annual report, non-receipt of declared dividends / interest / refund order / redemption of debt securities, issue of new / duplicate certificates etc.
ii. To review the measures taken for effective exercise of voting rights by security holders.
iii. To review adherence to the service standards adopted by the Company in respect of various services being rendered by the Registrar & Share Transfer Agent.
iv. To review the various measures / initiatives taken by the Company inter-alia for reducing the quantum of unclaimed dividends, ensuring timely receipt of dividend warrant / annual report / statutory notices by the security holders of the Company and recommend measures to further enhance the service standards for the benefit of the security holders of the Company.

44 Annual Report 2020-21 45• Corporate Overview • Statutory Reports • Financial StatementsR e p o r t o n C o r p o r a t e G o v e r n a n c eN a t i o n a l P e r o x i d e L i m i t e d
Composition and Attendance:
The Committee met once during the year i.e. on July 13, 2020. The attendance of each Committee member is given below:
Sr. No.
Name of the Director Designation Category*No. of Meetings
Attended
1 Mr. Rajesh Batra Chairman NE & ID 12 Mr. Viraf Mehta Member NE & ID 13 Mr. Rajiv Arora Member ED 1
Sr. No.
Name of the Director Designation Category*No. of Meetings
Attended
1 Mr. Ness N. Wadia Chairman NE & NID 12 Mr. Rajesh Batra Member NE & ID 13 Mr. Viraf Mehta Member NE & ID 1
* NE: Non-Executive; ID: Independent Director; ED: Executive Director.
* NE: Non-Executive; NID: Non-Independent Director; ID: Independent Director.
Name and Designation of Compliance Officer:
Mr. Chandukumar Parmar is the Company Secretary and Compliance Officer of the Company.
Shareholders’ Complaints:
No. of shareholders’ complaints received during the year : Nil
No. of complaints not solved to the satisfaction of shareholders : Nil
No. of pending complaints : Nil
(d) Corporate Social Responsibility (CSR) Committee:
The CSR Committee comprises of three members. The Committee’s constitution and terms of reference are in compliance with the provisions of Section 135 of the Companies Act, 2013.
Terms of Reference:
The broad terms of reference of the Committee include:
i Review the existing CSR Policy from time to time and the activities to be undertaken by the Company towards CSR activities.
ii Recommend the project / programme to be undertaken, amount of expenditure to be incurred, roles and responsibilities of various stakeholders, etc. in respect of CSR activities.
iii Monitoring implementation of the projects /programmes undertaken, or the end use of the amount spent by the Company towards CSR activities.
Composition and Attendance:
The Committee met only once during the year i.e. on March 16, 2021. The attendance of each Committee member is given below:
e) Risk Management Committee:
The Risk Management Committee was constituted on October 21, 2020 which comprises of three members of the Board of Directors. The Committee has been set up with an objective to guide the management in monitoring and addressing key risks.
Terms of Reference:
The broad terms of reference of the Committee include:
i To discuss with senior management, the Company’s Enterprise Risk Management (‘ERM’) and provide oversight as may be needed.
Sr. No.
Name of the Director Designation Category*No. of Meetings
Attended
1 Mr. S. Ragothaman Chairman NE & ID 22 Mr. Rajesh Batra Member NE & ID 23 Mr. Rajiv Arora Member ED 2
ii Being apprised of significant risk exposures of the Company and whether Management is responding appropriately to them.
iii To ensure that the Company is taking appropriate measures to achieve prudent balance between risk and reward in both ongoing and new business activities.
iv To review the Company’s portfolio of risks and consider it against the Company’s Risk Appetite.
Composition and Attendance:
The Committee met twice during the year i.e. on November 19, 2020 and January 27, 2021. The attendance of each Committee member is given below:
f) Strategy Advisory Committee:
The Strategy Advisory Committee was constituted comprising four members of the Board of Directors. The Commitee has been setup with the objective of reviewing options and possibilities for exponential business growth and wealth creation.
Terms of Reference:
The broad terms of reference of the Committee include:
i Review periodically and make recommendations to the Board regarding:
- the Company’s overall strategy and three-year strategic plan,
- the Committee would assess mergers and acquisitions opportunities in line with the overall Company’s strategy, and
- make recommendations with regard to strategic initiatives including expansion in existing lines of business or exit from
existing lines and entry into new lines of business, joint ventures, acquisitions, investments, dispositions of business and assets and business expansions.
ii Guide Management to prioritize the strategic options available based on a deep study of the areas of opportunities (for domestic and export markets) by focusing on the areas of potential competency and help create a new product development and R&D strategy to achieve the plan.
iii Assist Management with identifying key issues, options and external developments impacting the Company’s strategy. Meet with Management periodically to monitor the Company’s progress against its strategic goals.
iv Creating a sustainable competitive advantage through a long-term strategy which will enable the Company to grow exponentially and profitably.
* NE: Non-Executive; ID: Independent Director; ED: Executive Director.

46 Annual Report 2020-21 47• Corporate Overview • Statutory Reports • Financial StatementsR e p o r t o n C o r p o r a t e G o v e r n a n c eN a t i o n a l P e r o x i d e L i m i t e d
Composition and Attendance:
The Committee met once during the year i.e. on November 18, 2020. The attendance of each Committee member is given below:
Sr. No.
Name of the Director Designation Category*No. of Meetings
Attended
1 Mrs. Harshbeena Zaveri Chairperson NE & ID 12 Mr. Viraf Mehta Member NE & ID 13 Mr. Ness N. Wadia^ Member NE & NID NA4 Mr. Rajiv Arora Member ED 1
4. Independent Directors’ Meeting:
The Independent Directors met twice during the year i.e. on March 9, 2021 and March 16, 2021, inter-alia, to discuss the following:
• Draft Composite Scheme of Arrangement amongst the Company, Naperol Investments Limited and NPL Chemicals Limited and their respective Shareholders and Creditors under Section 230-232 of the Companies Act, 2013.
• Evaluation of the performance of the Board as a whole.
• Evaluation of performance of the Non-Independent, Non-Executive Directors and the Board Chairman.
• To assess the quality, quantity, and timelines of flow of information between the Company Management and the Board that is necessary for the Board to perform its duties effectively and reasonably.
All the Independent Directors were present at the Meeting.
In the opinion of the Board, the Independent Director’s fulfil the Conditions specified in SEBI Listing Regulations, 2015 and all are independent of the Management.
During the year under review, none of the Independent Director has resigned.
Familiarization Programme for Independent Directors:
The Board Members are provided with necessary documents / brochures and reports to enable them to familiarize themselves with the Company’s procedures and practices. Periodic presentations are made at the Board and Board Committee Meetings, on business and performance updates of the Company, business strategy and risks involved.
Updates on relevant statutory changes and landmark judicial pronouncements encompassing important laws are regularly circulated to the Directors.
The details of such familiarization programmes for Independent Directors are posted on the website of the Company at https://naperol.com/BoardPolicies.
Performance Evaluation:
Pursuant to the provisions of the Companies Act, 2013 and the Corporate Governance requirements as prescribed by the Listing Regulations (as may be applicable), the Board of Directors (‘Board’) has carried out an annual evaluation of its own performance, and that of its Committees and individual Directors.
The performance of the Board and individual Directors was evaluated by the Board seeking inputs from all the Directors. The performance of the Committees was evaluated by the Board seeking inputs from the Committee Members. The Nomination and Remuneration Committee reviewed the performance of the individual Directors. A separate meeting of the Independent Directors was also held to review the performance of Non-Independent Directors; performance of the Board as a whole and performance of the Chairman of the Company, taking into account the views of Executive Director and Non-Executive Directors. This was followed by a Board Meeting that discussed the performance of the Board, its Committees and individual Directors.
The criteria for performance evaluation of the Board included aspects like Board composition and structure; effectiveness of Board processes, information and functioning etc. The criteria for performance evaluation of Committees of the Board included aspects like
* NE: Non-Executive; NID: Non-Independent Director; ID: Independent Director
^ Mr. Ness N. wadia was appointed as a Member of the Committee on February 3, 2021
5. General Body Meetings:
a) Details of last three Annual General Meetings are as under:
Year Day, Date and Time Location
No. of Special
Resolutions set out at the AGM
Business Transacted
2018-19Thursday,
August 2, 2018 at 4.00 p.m.
Sunville Banquet & Conference Rooms, 9, Dr. Annie Besant Road, Near Worli
Flyover, Worli, Mumbai-400018
Nil Nil
2019-20Tuesday,
August 6, 2019 at 4.00 p.m.
Sunville Banquet & Conference Rooms,
9 Dr. Annie Besant Road, Near Worli Flyover,
Worli, Mumbai-400018
Two
Re-appointment of Mr. Rajesh Batra and Mr. S. Ragothaman as Independent Directors of the Company
2020-21
Tuesday,August 25, 2020
at 3.30 p.m. through Video Conferencing / Other Audio Visual Means (VC / OAVM)
facility
Registered Office: Neville House, J. N.
Heredia Marg, Ballard Estate. Mumbai-400001
Two
Appointment of Rajiv Arora as the Whole Time Director of the Company to be designated as the Chief Executive Officer & Director (with effect from June 4, 2020) and Approval for ratification of excess remuneration to Mr. Suresh Khurana, Chief Executive Officer (upto June 4, 2020)
b) Whether Special Resolutions were passed through postal ballot last year and details of voting pattern: Nil
c) Person who conducted the postal ballot exercise: Not Applicable
d) Whether any Special Resolution is proposed to be passed through postal ballot this year (2021-22): During the current year, if Special Resolutions are proposed to be passed through postal ballot, those will be taken up at the appropriate time.
e) Procedure for Postal Ballot: The procedure for conducting the postal ballot exercise would be as per Section 110 of the Companies Act, 2013, read with the Companies (Management and Administration) Rules, 2014, as amended from time to time.
6. Other Disclosures:
(a) Related Party Transactions
All transactions entered into with Related Parties as defined under the Companies Act, 2013 and Regulation 23 of the Listing Regulations during the Financial Year were in the ordinary course of business and on an arm’s length pricing basis and do not attract the provisions of Section 188 of the Companies Act, 2013. There were no transactions with related parties during the Financial Year which were in conflict with the interest of the Company. Suitable disclosure as required by the Indian Accounting Standards (Ind-AS) has been made in the notes to the Financial Statements.
composition of Committees, effectiveness of Committee Meetings etc. The criteria for performance evaluation of the individual Directors included aspects on contribution to the Board and Committee Meetings like preparedness on the issues to be discussed, meaningful and constructive contribution and inputs in meetings etc. In addition, the Chairman was also evaluated on the key aspects of his role.

48 Annual Report 2020-21 49• Corporate Overview • Statutory Reports • Financial StatementsR e p o r t o n C o r p o r a t e G o v e r n a n c eN a t i o n a l P e r o x i d e L i m i t e d
As required under Regulation 23(1) of the Listing Regulations, the Company has formulated a Policy on Related Party Transactions, which has been posted on the Company’s website at https://naperol.com/BoardPolicies.
(b) Disclosure of Accounting Treatment
In the preparation of financial statements, the Company has followed the Indian Accounting Standards (Ind-AS) issued by the Institute of Chartered Accountants of India to the extent applicable and notified under the Companies Act, 2013.
(c) Risk Management
A detailed review of business risks and the Company’s plan to mitigate them is presented to the Board. The Company has been taking steps to mitigate foreseeable business risks. Business risk evaluation and management is an ongoing and continuous process within the Company and regularly updated to the Board.
The Company has formulated a Risk Assessment & Management Policy, establishing the philosophy of the Company towards risk identification, analysis and prioritization of risks, development of risk mitigation plans which is reported to the Board periodically.
(d) Code of Conduct
The Board of Directors has adopted the Code of Ethics and Business Principles for the Non-Executive Directors as also for the employees including Executive Director and other Members of Senior Management. The said Code has been communicated to all the Directors and Members of the Senior Management. The Code has also been posted on the Company’s website at www.naperol.com.
(e) Vigil Mechanism / Whistle Blower Policy
The Company believes in the conduct of the affairs of its constituents in a fair and transparent manner by adoption of highest standards of professionalism, honesty, integrity and ethical behavior. Towards this end, the Company has implemented a Whistle Blower Policy, with a view to provide a mechanism for Employees and Directors of the Company to approach the Ethics Counsellor or the Chairman
of the Audit Committee of the Company to report instances of violations of laws, rules and regulations, unethical behavior, actual or suspected, fraud or violation of the Company’s Code of Conduct.
The vigil mechanism also provides adequate safeguards against victimization of persons who use such mechanisms and also to ensure direct access to the Ethics Counsellor or the Chairman of the Audit Committee in appropriate or exceptional cases. During the year under review, no person has been denied access to the Audit Committee.
The Company has posted the Whistle Blower Policy on Company’s website at https://naperol.com/BoardPolicies.
(f) Prevention of Insider Trading Code:
The Company has adopted a Code of Conduct to regulate, monitor and report trading by Designated Persons and Code of Practices and Procedures for Fair Disclosures of Unpublished Price Sensitive Information (‘Code’) in terms of SEBI (Prohibition of Insider Trading) Regulations, 2015, as amended.
The Company has posted the Code on its website at https://naperol.com/BoardPolicies.
The Code is applicable to Directors, Employees, Designated Persons and other Connected Persons of the Company.
(g) Instances of Non-Compliance by the Company, Penalties, Strictures Imposed on the Company:
There are no instances of non-compliance by the Company, penalties, strictures imposed on the Company by Stock Exchange or SEBI or any statutory authority, on any matter related to capital markets, during the last three years.
(h) Recommendations of the Committees:
During the year under review, the Board has accepted all the recommendations of the Committees.
(i) Policy for Prevention of Sexual Harassment in the Company:
The Company values the dignity of individuals and strives to provide a safe and respectable work environment to all its Employees. The Company is committed to providing an environment, which
is free of discrimination, intimidation and abuse. Pursuant to the Sexual Harassment of Women at Workplace (Prohibition, Prevention and Redressal) Act, 2013 and rules made thereunder, the Company has a Policy for prevention of Sexual Harassment in the Company. All employees (permanent, contractual, temporary and trainees) are covered under this policy.
Further, the Company has set up an Internal Complaints Committee for providing a redressal mechanism pertaining to sexual harassment of the employees at workplace.
Your Directors further state the following pursuant to the Sexual Harassment of Women at Workplace (Prohibition, Prevention and Redressal) Act, 2013:
i. Number of complaints filed during the financial year: Nil
ii. Number of complaints disposed off during the financial year: N.A.
iii. Number of complaints pending as on end of the financial year: Nil
(j) Total fees paid by the Company and its subsidiaries to its Statutory Auditors:
During the year under review, total fee of H 60.55 lakhs has been paid by the Company and its subsidiaries to the Statutory Auditor and all entities in the network firm / network entity of which the Statutory Auditor is part on the consolidated basis.
(k) Policy for determining the material subsidiaries:
The policy for determining the material subsidiaries can be accessed from the Company’s website at https://naperol.com/BoardPolicies.
7. CEO / CFO Certification
Mr. Rajiv Arora, Chief Executive Officer & Director and Mr. Conrad Fernandes, Chief Financial Officer, have
certified to the Board in accordance with Regulation 17(8) of the Listing Regulations, pertaining to CEO / CFO certification for the financial year ended March 31, 2021.
8. Means of Communication:
Annual Reports, Notice of the Meetings and other communications to the Members are sent through e-mail, post or courier. However, in view of the ongoing COVID-19 pandemic, Ministry of Corporate Affairs (‘MCA’) has vide its Circular dated January 13 , 2021 and SEBI vide its Circular dated January 15, 2021 have permited the Companies to send Annual Reports only by e-mail to all the Members of the Company. Therefore, the Notice of Sixty-Seventh AGM of the Company and Annual Report for the financial year 2020-21 is being sent to the Members at their registered e-mail address in accordance with MCA and SEBI Circulars.
(a) Quarterly Results:
The quarterly, half yearly and yearly financial results are published as per the requirement of the Listing Regulations.
(b) Newspapers wherein results normally published:
Business Standard (English) and Mumbai Lakshadeep (Marathi, the regional language).
(c) Any Website, where displayed: www.naperol.com and www.bseindia.com
(d) Whether Website also displays official news releases: No
(e) Whether presentations made to institutional investors or to analysts: No
(f) Management Discussion & Analysis Report: The Management Discussion & Analysis Report forms part of this Annual Report.

50 Annual Report 2020-21 51• Corporate Overview • Statutory Reports • Financial StatementsR e p o r t o n C o r p o r a t e G o v e r n a n c eN a t i o n a l P e r o x i d e L i m i t e d
(a) Annual General Meeting : Wednesday, August 25, 2021 at 3:30 p.m. through Video Conference / Other Audio Video Means
(b) Financial Year : The financial year is from April 1 to March 31. Tentative Schedule Results for quarter ending June 30, 2021 : By August 14, 2021 Results for quarter ending September 30, 2021 : By November 14, 2021 Results for quarter ending December 31, 2021 : By February 14, 2022 Results for year ending March 31, 2022 : By May 30, 2022 AGM for year ending March 31, 2022 : By August, 2022
(c) Date of Book Closure : Thursday, August 19, 2021 to Wednesday, August 25, 2021 (both days inclusive)
(d) Dividend Payment Date : On or after Wednesday, September 1, 2021 (e) Listing on Stock Exchange : The Company’s shares are listed on BSE Ltd. The Company
has paid applicable listing fees for Financial Year 2020-21.(f) Stock Code Demat Code : 500298 Demat ISIN Number for NSDL & CDSL : INE585A01020 Scrip ID (on the BSE website- www.bseindia.com) : NATPEROX Corporate Identification Number : L24299MH1954PLC009254
9. General Shareholder Information:
(g) Stock Market Data (for face value of J 10/- per share):
Month High (J) Low (J) No. of Shares No. of Trades Net Turnover (J)
April 2020 2,132 1,120 2,95,661 29,497 52,74,33,370May 2020 1,950 1,662 1,27,605 14,567 23,29,17,136June 2020 2,370 1,791 4,02,373 38,682 87,14,95,632July 2020 2,205 1,731 1,75,919 19,299 34,99,60,394August 2020 2,340 1,724 5,20,011 23,331 1,09,79,64,830September 2020 2,270 1,935 96,409 10,000 20,39,66,460October 2020 2,200 1,855 87,849 8,869 17,57,18,577November 2020 2,014 1,860 90,370 9,523 17,51,19,576December 2020 2,145 1,880 1,08,653 12,125 21,84,50,598January 2021 2,186 1,890 1,36,716 14,990 28,01,13,619February 2021 2,085 1,825 1,08,579 11,885 21,09,12,555March 2021 2,250 1,828 3,33,922 29,573 69,50,02,847
Data based on BSE website: https://www.bseindia.com/markets/equity/EQReports/StockPrcHistori.aspx?expandable= 7&scripcode=500298&flag=sp&Submit=G
Group of shares No. of shareholders No. of shares held %age to total shares
1 to 50 13,702 209,387 3.6451 to 100 1,781 148,817 2.59101 to 250 2,381 361,830 6.30251 to 500 470 180,320 3.14501 to 1,000 213 156,167 2.721,001 to 5,000 136 279,632 4.865,001 to 10,000 21 142,490 2.4810,001 and above 15 42,68,357 74.27 Total 18,719 57,47,000 100.00
(h) Stock Performance:
Data based on BSE website: https://www.bseindia.com/Indices/IndexArchiveData.html
(i) Registrar and Transfer Agents:
Pursuant to order dated July 16, 2020, the Regional Director has approved the merger of Sharex Dynamic (India) Private Limited (‘Sharex’) with Link Intime India Private Limited. Accordingly, Sharex has now ceased to exist as a separate entity and hereafter post merger is known as Link Intime India Private Limited. The details of the same are as given below:
Link Intime India Private Limited
C-101, 247 Park, L.B.S. Marg, Vikhroli (West), Mumbai-400083. Tel: 022-4918 6270; e-mail ID: [email protected]
(j) Share Transfer System:
In terms of Regulation 40(9) of the Listing Regulations, 2015, securities can be transferred only in dematerialized form with effect from April 1, 2019, except in case of request received for transmission or transposition of securities. Further, SEBI had fixed March 31, 2021 as the cut-off date for re-lodgement of transfer deeds and the shares that are re-lodged for transfer shall be issued only in demat mode. Members holding shares in physical form are requested to convert their holdings to dematerialized form. Transfers of equity shares in electronic form are effected through the depositories with no involvement of the Company.
(k) (i) Distribution of Shareholding as on March 31, 2021:
2,500 55000
2,00050000
1,500
NAT
ION
AL
PER
OX
IDE
LIM
ITED
(NPL
)
BSE
SEN
SEX
45000
40000
1,00035000
500Apr/20 May/20 Jun/20 Jul/20 Aug/20 Sep/20 Oct/20 Nov/20 Dec/20 Jan/21 Feb/21 Mar/21
30000
NPL Sensex
Share Price Performance (April, 2020 To March, 2021)

52 Annual Report 2020-21 53• Corporate Overview • Statutory Reports • Financial StatementsR e p o r t o n C o r p o r a t e G o v e r n a n c eN a t i o n a l P e r o x i d e L i m i t e d
(ii) Category of Shareholders as on March 31, 2021:
Category No. of shares held % age to total shares
Indian Promoters 40,06,409 69.71Foreign Promoters 60,250 1.05Banks 575 0.01Mutual Funds - -Foreign Portfolio Investors - -Corporate Bodies 1,63,175 2.84Indian Public 13,78,400 23.99Alternate Investment Funds 1,357 0.02Non-Banking Financial Company registered with RBI 232 0.00NRI / OCB 36,136 0.63Clearing Members 12,764 0.22Investor Education Protection Fund (IEPF) 24,283 0.42Hindu Undivided Family (HUF) 63,419 1.10Total 57,47,000 100.00
(l) Dematerialization of Shares and Liquidity:
98.97% of the outstanding Equity Shares have been dematerialised upto March 31, 2021. Trading in Equity Shares of the Company is permitted only in dematerialised form. The trading / liquidity details are given at item 9(g) above.
(m) Share Capital Audit:
As stipulated by SEBI, a qualified practicing Company Secretary carries out the Share Capital Audit to reconcile the total admitted capital with National Securities Depository Limited (NSDL) and Central Depository Services (India) Limited (CDSL) and shares held in physical form as per the register of members vis-à-vis the total issued and listed capital. This audit is carried out every quarter. The report is submitted to BSE Ltd., and is also placed before the Board of Directors.
(n) Outstanding GDRs / ADRs / Warrants or any Convertible Instruments, conversion date and likely impact on Equity: None
(o) Investor Education and Protection Fund: In terms of Section 124(5) of the Companies Act, 2013 read with the Rules made thereunder, the Company has credited during the year ended March 31, 2021, a sum of H 7,64,670/- (Rupees Seven lakh sixty four thousand six hundred seventy) being unclaimed
dividend, to the Investor Education and Protection Fund (IEPF). The Company has, during the year, transferred 1,775 Equity shares of the Company to IEPF Authority pursuant to Section 124(6) of the Companies Act, 2013 read with the Rules made thereunder.
(p) Plant Location: NRC Road, P.O. Mohone, Village Vadavali, Kalyan - 421102, Maharashtra, India.
(q) List of credit ratings obtained during the year: India Ratings has given the credit rating of ‘IND A+’ / Stable for debt instrument / facilities of the Company.
(r) Address for Correspondence:
For Shares held in Physical Form:
Link Intime India Private LimitedC-101, 247 Park, L.B.S. Marg, Vikhroli (West), Mumbai-400083.Tel: 022 49186270; E-mail ID: [email protected]
For Shares held in Demat Form:
To the Depository Participant
Pursuant to the provisions of the Listing Regulations, the Company has designated an e-mail ID exclusively for the purpose of registering complaints by investors. The e-mail address for the same is [email protected].
10. Non-compliance of any requirement of Corporate Governance Report
The Company has complied with the requirements as mentioned in Schedule V, Para C, sub-paras (2) to (10) of the Listing Regulations.
11. Compliance with Securities and Exchange Board of India (Listing Obligations and Disclosure Requirements) Regulations, 2015
The Company has complied with all the requirements as specified in the Regulation 17 to 27 and clauses (b) to (i) of sub-regulation (2) of Regulation 46 of the Listing Regulations.
12. Discretionary Requirements (Non-mandatory):
(a) Office of the Chairman of the Board:
The expenses incurred by the Chairman’s Office in respect of Company’s business is borne by the Company.
(b) Shareholder Rights:
The Company’s quarterly and half-yearly results are submitted to the Stock Exchange and published in the newspapers and are also posted on the Company’s website and therefore not sent to the shareholders.
Adoption of other non–mandatory requirements under Regulation 34 of the Listing Regulations is being reviewed by the Board from time to time.
13. Certificate from Company Secretary in Practice
The Company has obtained a certificate from M/s. Parikh & Associates, Company Secretaries, required under SEBI (Listing Obligations and Disclosure Requirements) Regulations, 2015 confirming that none of the Directors on Board of the Company have been debarred or disqualified from being appointed or continuing as directors of companies by SEBI / Ministry of Corporate Affairs or any such statutory authority, which forms part of this Report.
DECLARATION
As required under Regulation 26(3) of the SEBI (Listing Obligations and Disclosure Requirements) Regulations, 2015, this is to confirm that all the Members of the Board and the Senior Management have affirmed compliance with the Code of Conduct for the year ended March 31, 2021.
For National Peroxide Limited
Rajiv AroraChief Executive Officer & Director
DIN: 08730235Mumbai, June 29, 2021
Mumbai, June 29, 2021
For any query on Annual Report / Dividend / Investors’ Assistance:
The Company Secretary,National Peroxide Ltd., C-1, Wadia International Centre, Pandurang Budhkar Marg, Worli, Mumbai-400025. Tel: 022-66620000; Fax: 022-66193421 E-mail: [email protected]

54 Annual Report 2020-21 55• Corporate Overview • Statutory Reports • Financial StatementsR e p o r t o n C o r p o r a t e G o v e r n a n c eN a t i o n a l P e r o x i d e L i m i t e d
CERTIFICATE BY COMPANY SECRETARY IN PRACTICE[Pursuant to Schedule V Para-C Sub clause 10(i) of the Securities and Exchange Board
of India (Listing Obligations and Disclosure Requirements) Regulations, 2015]
To,
The Members of
National Peroxide Limited
Neville House, J. N. Heredia Marg,
Ballard Estate, Mumbai-400001
For Parikh & Associates
Practising Company Secretaries
Shalini Bhat
FCS No: 6484 CP No: 6994
UDIN: F006484C000537245
We have examined the relevant registers, records, forms, returns and disclosures received from the Directors of National Peroxide Limited having CIN L24299MH1954PLC009254 and having registered office at Neville House, J. N. Heredia Marg, Ballard Estate, Mumbai-400001 (hereinafter referred to as ‘the Company’), produced before us by the Company for the purpose of issuing this Certificate, in accordance with Regulation 34(3) read with Schedule V Para-C Sub clause 10(i) of the Securities and Exchange Board of India (Listing Obligations and Disclosure Requirements) Regulations, 2015.
In our opinion and to the best of our information and according to the verifications [including Directors Identification Number (DIN) status at the portal www.mca.gov.in] as considered necessary and explanations furnished to us by the Company & its officers, We hereby certify that none of the Directors on the Board of the Company as stated below for the Financial Year ending on March 31, 2021 have been debarred or disqualified from being appointed or continuing as Directors of companies by the Securities and Exchange Board of India, Ministry of Corporate Affairs, or any such other Statutory Authority.
Sr. No. Name of Director DIN Date of Appointment in Company*
1. Ness Nusli Wadia 00036049 18/03/1997
2. Rajesh Batra 00020764 30/12/2005
3. Ragothaman Rao Sethumadhava 00042395 29/08/2013
4. Minnie Aarasp Bodhanwala 00422067 01/10/2015
5. Viraf Rustom Mehta 00352598 04/07/2019
6. Harshbeena Zaveri 00003948 31/03/2020
7. Rajiv Arora 08730235 04/06/2020
* the date of appointment is as per the MCA Portal.
Ensuring the eligibility of for the appointment / continuity of every Director on the Board is the responsibility of the management of the Company. Our responsibility is to express an opinion on these based on our verification. This certificate is neither an assurance as to the future viability of the Company nor of the efficiency or effectiveness with which the management has conducted the affairs of the Company.
Mumbai, June 29, 2021
CERTIFICATE ON CORPORATE GOVERNANCE
We have examined the compliance of conditions of Corporate Governance by National Peroxide Limited (‘the Company’), for the financial year ended on 31st March, 2021, as stipulated in regulations 17 to 27 and clauses (b) to (i) of regulation 46 (2) and para C and D of Schedule V of Securities and Exchange Board of India (Listing Obligation and Disclosure Requirementw s) Regulations, 2015 to the extent applicable.
The compliance with conditions of Corporate Governance is the responsibility of the management. Our examination was limited to the procedures and implementation thereof adopted by the Company for ensuring the compliance of the conditions of the Corporate Governance. It is neither an audit nor an expression of opinion on the financial statements of the Company.
In our opinion and to the best of our information and according to the explanations given to us and the representations made by the management, the Company has complied with the conditions of Corporate Governance as stipulated in the above-mentioned SEBI Listing Regulations.
We further state that such compliance is neither an assurance as to the future viability of the Company nor the efficiency or effectiveness with which the management has conducted the affairs of the Company.
For Nilesh Shah & Associates Company Secretaries
(Nilesh Shah)Partner (FCS - 4554)
C.P.No: 2631Peer Review No. 698/2020
Place: Mumbai
Date: June 29, 2021
UDIN: F004554C000542608
To the Members of
National Peroxide Limited
Mumbai

56 Annual Report 2020-21 57• Corporate Overview • Statutory Reports • Financial StatementsB u s i n e s s R e s p o n s i b i l i t y R e p o r tN a t i o n a l P e r o x i d e L i m i t e d
BUSINESS RESPONSIBILITY REPORT[under Regulation 34(2)(f) of the SEBI (LODR) Regulations, 2015]
SECTION A: GENERAL INFORMATION ABOUT THE COMPANY
1. Corporate Identification Number (CIN) of the Company L24299MH1954PLC009254
2. Name of the Company National Peroxide Limited
3. Registered AddressNeville House, J. N. Heredia Marg, Ballard Estate, Mumbai-400001
4. Website www.naperol.com5. Email Address [email protected]. Financial Year reported April 1, 2020 to March 31, 2021
7. Sector(s) that the Company is engaged inHydrogen Peroxide – NIC Code 20297Hydrogen Gas – NIC Code 20111Peracetic Acid – NIC Code 20299
8.List three key products / services that the Company manufactures / provides
The Company manufactures the following products:- Hydrogen Peroxide- Hydrogen Gas- Peracetic Acid
9.
Total number of locations where business activity is undertaken by the Company:(a) Number of International locations (provide details of
major 5);(b) Number of National locations
a) International location – None
b) National location – One
10.Markets served by the Company:Local / State / National / International
National & International
1. Paid up Capital (INR) H 574.70 lakhs2. Total Turnover (INR) H 22,725.31 lakhs3. Total Profit / (Loss) after taxes (INR) H 2,081.08 lakhs
4.Total spending on Corporate Social Responsibility (CSR) as percentage of profit after tax (%)
As per Section 135 of the Companies Act, 2013 read with the rules made thereunder, the Company was required to spend 2% of average net profit of last 3 financial years. Accordingly, the Company has spent H 280 lakhs on CSR activities for FY 2020-21.
5.List of activities in which expenditure in 4 above has been incurred
a) Promoting healthcare including preventive healthcare;b) Promoting education;c) Eradicating hunger, poverty and malnutrition; andd) Sanitation.
SECTION B: FINANCIAL DETAILS OF THE COMPANY
SECTION C: OTHER DETAILS
SECTION D: BUSINESS RESPONSIBILITY INFORMATION
1. Does the Company have subsidiary / subsidiaries Yes. The Company has two subsidiaries.
2.Do the subsidiary companies participate in the Business Responsibility initiatives of the parent Company? If yes, then indicate the number of such subsidiary companies
No. The subsidiary Companies conducts its own BR initiatives, as applicable.
3.
Do any other entity / entities (eg suppliers / distributors etc.) that the Company does business with participate in the Business Responsibility (BR) activities of the Company? If yes, then indicate the percentage of such entity / entities. [less than 30%, 30%-60%, more than 60%]
No. The Company does not mandate its suppliers and partners to participate in the Company’s BR initiatives. However, they are encouraged to do so.
1.(a) Details of Director / Directors responsible for Business
Responsibility
Mr. Rajiv AroraChief Executive Officer & DirectorDIN: 08730235
(b) Details of the Business Responsibility Head
Mr. Conrad FernandesChief Financial OfficerPhone: 022-66620000Email: [email protected]
2. Principle-wise (as per NVGs) BR Policy / Policies
The National Voluntary Guidelines (NVGs) on Social, Environmental and Economic Responsibilities of Business released by the Ministry of Corporate Affairs has adopted nine areas of Business Responsibility. These are:
P1 : Businesses should conduct and govern themselves with Ethics, Transparency and Accountability.
P2 : Businesses should provide goods and services that are safe and contribute to sustainability throughout their life cycle.
P3 : Businesses should promote the well-being of all employees.
P4 : Businesses should respect the interests of and be responsive towards all stakeholders, especially those who are disadvantaged, vulnerable and marginalized.
P5 : Businesses should respect and promote human rights.
P6 : Businesses should respect, protect and make efforts to restore the environment.
P7 : Businesses, when engaged in influencing public and regulatory policy, should do so in a responsible manner.
P8 : Businesses should support inclusive growth and equitable development.
P9 : Businesses should engage with and provide value to their customers and consumers in a responsible manner.

58 Annual Report 2020-21 59• Corporate Overview • Statutory Reports • Financial StatementsB u s i n e s s R e s p o n s i b i l i t y R e p o r tN a t i o n a l P e r o x i d e L i m i t e d
(a) Details of Compliances (Reply in Y/N)
Sr. No.
Questions P1 P2 P3 P4 P5 P6 P7 P8 P9
1. Do you have policies for Y Y Y Y Y Y Y Y Y
2. Has the policy being formulated in consultation with the relevant stakeholders? Yes
3. Does the policy conform to any National /International standards? If yes, specify?
The policies confirm to the National and International standards like ISO 9001, ISO 14001, OHSAS 45001, ISO 50001 and RC 14001
4.Has the policy being approved by the Board? If yes, has it been signed by MD / Owner / CEO / appropriate Board Director?
Policies mandated under the Companies Act, 2013 and SEBI (Listing Obligations and Disclosure Requirements) Regulations, 2015 are approved by the Board and other applicable policies are approved by the Managing Director / Chief Executive Officer or Functional Heads of the Company as appropriate.
5.
Does the Company have a specified committee of the Board / Director / Official to oversee the implementation of the policy?
The Company has Audit Committee, Stakeholders’ Relationship Committee, CSR Committee and adequate Internal control systems to oversee the implementation of policies.
6. Indicate the link for the policy to be viewed online?
The policies are posted on the Company’s website at www.naperol.com
7.Has the policy been formally communicated to all relevant internal and external stakeholders?
Yes, wherever appropriate.
8. Does the Company have in-house structure to implement the policy / policies. Yes
9.
Does the Company have a grievance redressal mechanism related to the policy / policies to address stakeholders’ grievances related to the policy / policies?
Yes, wherever appropriate.
10.Has the Company carried out independent audit / evaluation of the working of this policy by an internal or external agency?
Yes, wherever appropriate.
(b) If answer to the question at serial no. 1 against any principle is ‘No’, please explain why:- Not Applicable
3. Governance related to Business Responsibility (BR)
(a) Indicate the frequency with which the Board of Directors, Committee of the Board or CEO assess the BR performance of the Company. (Within 3 months, 3-6 months, Annually, More than 1 year):
Annually
(b) Does the Company publish a BR or a Sustainability Report? What is the hyperlink for viewing this report? How frequently is it published?
Yes, The Company publishes the Business Responsibility Report annually as part of the Annual
Report and the same is available on the website of the Company at www.naperol.com
SECTION E: PRINCIPLE-WISE PERFORMANCE
Principle 1: Businesses should conduct and govern themselves with Ethics, Transparency and Accountability.
1. Does the policy relating to ethics, bribery and corruption cover only the company? Yes / No. Does it extend to the Group / Joint Ventures / Suppliers / Contractors / NGOs / Others?
The Company has a Code of Conduct for its Directors and Employees that cover issues inter-alia related to ethics, workplace responsibilities and conflict of interest. It also covers all dealings with suppliers, customers and other business associates.
Further, the Company has adopted a Whistle Blower Policy to provide a mechanism for Employees and Directors of the Company to approach the Ethics Counsellor or Chairman of the Audit Committee of the Company for reporting unethical behaviour, actual or suspected fraud or violation of the Company’s Code of Conduct and SEBI Insider Trading Regulations.
The Company also has a policy in place for prevention of Sexual Harassment at Workplace which strives to provide a safe and respectable work environment and covers all the employees (permanent, contractual, temporary and trainees) of the Company.
2. How many stakeholder complaints have been received in the past financial year and what percentage was satisfactorily resolved by the management? If so, provide details thereof:
In the past financial year, the Company did not receive any complaint from any stakeholder under the Code of Conduct.
Principle 2: Businesses should provide goods and services that are safe and contribute to sustainability throughout their life cycle.
1. List up to 3 of your products or services whose design has incorporated social or environmental concerns, risks and / or opportunities:
As an environmentally conscious Company, National Peroxide continues to innovate and use efficient technologies to bring down its strain on environment.
For production of Hydrogen Peroxide, Hydrogen Gas and Peracetic Acid the Company has addressed environmental and safety concerns relating to hazard identification and risk assessment while implementing Environment Management System (ISO 14001:2015) and Occupational Health and Safety Management System (ISO 45001:2018).
2. For each such product, provide the following details in respect of resource use (energy, water, raw material etc.) per unit of product (optional):
Details of Conservation of Energy are given in Annexure-IV of the Directors’ Report forming part of this Annual Report.
3. Does the Company have procedures in place for sustainable sourcing (including transportation)?
The Company strives to integrate social, ethical and environmental factors across the entire supply chain.
4. Has the company taken any steps to procure goods and services from local & small producers, including communities surrounding their place of work?
The Company gives preference to Micro, Small and Medium Enterprises (MSME) for business opportunity and upliftment of lower middle class, wherever possible.
5. Does the company have a mechanism to recycle products and waste? If yes, what is the percentage of recycling of products and waste (separately as <5%, 5-10%, >10%). Also, provide details thereof:
The Company while pursuing energy efficiency programs in the factory also takes initiatives for recycling of wastes generated during production. The Company’s manufacturing facility is committed to zero discharge. Water from the effluent treatment plants is also recycled within the factory to maintain greenbelts / gardens / landscapes.
The Company is certified for Responsible Care Logo by Indian Chemical Council. As a Responsible Care Company various efforts have been taken for recycling of products and wastes in the plant, eg., recycling of treated effluent to cooling tower (30-35%), recycling of Palladium catalyst, recycling of wash / used acetone.
Principle 3: Businesses should promote the well-being of all employees
The Company ensures its development & growth by investing in the satisfaction and well-being of its employees. The Company takes its responsibility seriously to provide a safe working environment and recognizes that employees are more productive when they are healthy, feel good & work safely, & the Company’s wellness programs raise awareness of health issues by encouraging its employees to adopt a healthy lifestyle. The Company also tailors its safety programs to minimize hazards at workplace.
1. Total number of employees: 126
2. Total number of employees hired on temporary /contractual / casual basis: 5
3. Number of permanent women employees: 4
4. Number of permanent employees with disabilities: 1
5. Do you have an employee association that is recognized by management:
There is a registered and recognized trade union at the Company’s manufacturing location.

60 Annual Report 2020-21 61• Corporate Overview • Statutory Reports • Financial StatementsB u s i n e s s R e s p o n s i b i l i t y R e p o r tN a t i o n a l P e r o x i d e L i m i t e d
6. What percentage of your permanent employees is members of this recognized employee association: 50% of total employees.
7. Number of complaints relating to child labour, forced labour, involuntary labour, sexual harassment in the last financial year and pending, as on the end of the financial year: Nil
8. What percentage of your undermentioned employees were given safety & skill upgradation training in the last year?
As part of the Company’s training calendar regular trainings with respect to safety & skill upgradation are provided to its Permanent and Casual / Temporary / Contractual Employees. Total 109 training sessions were conducted during the year.
Principle 4: Businesses should respect the interests of and be responsive towards all stakeholders, especially those who are disadvantaged, vulnerable and marginalized.
1. Has the Company mapped its internal and external stakeholders?
Yes.
2. Out of the above, has the Company identified the disadvantaged, vulnerable & marginalized stakeholders:
The Company is committed towards proactively engaging with all the employees, business associates, customers and communities who may be disadvantaged, vulnerable and marginalized.
3. Are there any special initiatives taken by the Company to engage with the disadvantaged, vulnerable and marginalized stakeholders. If so, provide details thereof.
The Company and the Wadia Group as a whole, think beyond business and undertakes various initiatives to improve the lives of the lower socio-economic sections of the society and also through Wadia Group Children and Maternity Hospitals and Wadia Trusts which mostly caters to the lowest strata of the Society.
The details of the activities are given in Annexure-I (CSR Report) of the Directors’ Report forming part of this Annual Report.
Principle 5: Businesses should respect and promote human rights.
1. Does the policy of the Company on human rights cover only the Company or extend to the Group / Joint Ventures / Suppliers / Contractors / NGOs / Others?
The Code of Conduct extends not only to employees of the Company but also others who work with or represent the Company directly or indirectly. The Company’s Sexual Harassment Policy is applicable to all the employees including contractual and also covers trainees, consultants, contractors and vendors.
2. How many stakeholder complaints have been received in the past financial year and what percent was satisfactorily resolved by the management?
During the Financial Year 2020-21, the Company did not receive any complaint with respect to human rights violation.
Principle 6: Businesses should respect, protect and make efforts to restore the environment.
1. Does the policy related to Principle 6 cover only the company or extends to the Group / Joint Ventures /Suppliers / Contractors / NGOs / others:
The Company has an Environment, Health and Safety Policy that covers areas of compliance with statutory standards.
2. Does the company have strategies/ initiatives to address global environmental issues such as climate change, global warming, etc.?
Climate change, Global warming and environmental degradation pose unique challenges as well as opportunities for the Company. The Company is continuously implementing process improvements to reduce emissions and wastes.
3. Does the Company identify and assess potential environmental risks?
Sustainable development is at the core of the Company’s operations which is also outlined in the Environment, Health and Safety Practices. The Company follows sound environmental management practices at its manufacturing unit to assess and address potential environmental risks.
4. Does the company have any project related to Clean Development Mechanism? If so, provide details thereof. Also, if yes, whether any environmental compliance report is filed?
While the Company has so far not registered any project related to Clean Development Mechanism, it is continuously endeavouring to identify opportunities to contribute to in this regard.
5. Has the company undertaken any other initiatives on clean technology, energy efficiency, renewable energy, etc. If yes, please give hyperlink for web page etc.
The Company strives to adopt process improvement measures and invest in efficient technologies to reduce its impact on the environment. The details of initiatives taken for conservation of energy are given in Annexure-IV to the Directors’ Report and the same is available on the website of the Company at www.naperol.com.
6. Are the Emissions / Waste generated by the Company within the permissible limits given by CPCB / SPCB for the financial year being reported?
As per the Company’s monitoring and measurement, all applicable statutory requirements with respect to emissions / waste are complied with.
7. Number of show cause / legal notices received from CPCB / SPCB which are pending (i.e. not resolved to satisfaction) as on end of financial year.
Nil
Principle 7: Businesses, when engaged in influencing public and regulatory policy, should do so in a responsible manner.
1. Is your company a member of any trade and chamber or association? If yes, name only those major ones that your business deals with:
Yes, the Company is the Member of various trade and industrial associations like Indian Chemical Council (ICC), National Safety Council (NSC) and Federation of Indian Chambers of Commerce and Industry (FICCI).
2. Have you advocated / lobbied through above associations for the advancement or improvement of public good? Yes / No; if yes specify the broad areas:
The Company is represented in various associations and actively participates in various seminars, conferences and other forum on issues and policy matters that impact the interest of its stakeholders.
Principle 8: Businesses should support inclusive growth and equitable development.
1. Does the company have specified programmes / initiatives / projects in pursuit of the policy related to Principle 8? If yes, details thereof:
The Company contributes to CSR initiatives, the details of which are given in Annexure-I of the Directors’ Report forming part of this Annual Report.
2. Are the programmes / projects undertaken through in-house team / own foundation / external NGO /government structures / any other organization?
The Company’s CSR projects are implemented through Sir Ness Wadia Foundation, Bai Jerbai Wadia Hospital for Children and Nowrosjee Wadia Maternity Hospital.
3. Have you done any impact assessment of your initiative?
The Company assesses the impact of the CSR Projects and Programs undertaken, at its Board and CSR Committee meetings. An update on the CSR project and programs is placed at the Board and CSR Committee meetings for their review and assessment.
4. What is your company’s direct contribution to community development projects - Amount in INR and the details of the projects undertaken?
The Company has spent H 280 lakhs as part of its CSR initiatives for FY 2020-21. Details of the projects are provided in Annexure-I to the Directors’ Report forming part of this Annual Report.
5. Have you taken steps to ensure that this community development initiative is successfully adopted by the community?
The CSR projects and programs are undertaken after identifying the communities that require development. The Company also interacts with the stakeholders to ensure that its projects are being implemented effectively.
Principle 9: Businesses should engage with and provide value to their customers and consumers in a responsible manner.
1. What percentage of customer complaints / consumer cases are pending as on the end of financial year:
Nil. The Company has resolved all customer complaints received during the Financial Year 2020-21.

62 Annual Report 2020-21N a t i o n a l P e r o x i d e L i m i t e d
2. Does the company display product information on the product label, over and above what is mandated as per local laws?
Yes. Product information about the physical dimensions and chemical compositions is provided through the product labels / pack declaration and / or catalogues.
Further, the Company voluntarily engages customers through various fora such as meets, one to one interaction, and telephonic conversation to provide product information, over and above mandatory requirements.
3. Is there any case filed by any stakeholder against the company regarding unfair trade practices, irresponsible
advertising and / or anti-competitive behaviour during the last five years and pending as on end of financial year. If so, provide details thereof:
As on March 31, 2021, there are no cases pending under Competition Act.
4. Did your Company carry out any consumer survey / consumer satisfaction trends?
As a process, the Company collects customer feedback on regular basis. Reports of the same are shared with the stakeholders for necessary action to improve the products / services.
Mumbai, June 29, 2021 Standalone Financial
Statements

Independent Auditor’s Report
To the Members of National Peroxide Limited
Report on the audit of the Standalone financial statementsOpinion
1. We have audited the accompanying standalone financial statements of National Peroxide Limited (“the Company”), which comprise the balance sheet as at March 31, 2021 , and the statement of Profit and Loss (including Other Comprehensive Income), statement of changes in equity and statement of cash flows for the year then ended, and notes to the standalone financial statements, including a summary of significant accounting policies and other explanatory information.
2. In our opinion and to the best of our information and according to the explanations given to us, the aforesaid standalone financial statements give the information required by the Companies Act, 2013 (“the Act") in the manner so required and give a true and fair view in conformity with the accounting principles generally accepted in India, of the state of affairs of the Company as at March 31, 2021, of total comprehensive income (comprising of profit and other comprehensive income) , changes in equity and its cash flows for the year then ended.
Basis for opinion
3. We conducted our audit in accordance with the Standards on Auditing (SAs) specified under section 143(10) of the Act. Our responsibilities under those Standards are further described in the Auditor’s Responsibilities for the Audit of the Financial Statements section of our report. We are independent of the Company in accordance with the Code of Ethics issued by the Institute of Chartered Accountants of India together with the ethical requirements that are relevant to our audit of the financial statements under the provisions of the Act and the Rules thereunder, and we have fulfilled our other ethical responsibilities in accordance with these requirements and the Code of Ethics. We believe that the audit evidence we have obtained is sufficient and appropriate to provide a basis for our opinion.
Emphasis of Matter
4. We draw attention to Note 53 to the standalone financial statements, which describes the current environment, where several restrictions have been imposed by various state governments and local bodies to control the second wave of the Coronavirus (Covid-19) pandemic. Management has carried out a detailed assessment of the financial impact on the business operations of the Company and has concluded that there are no material adjustments required in the financial statements. However, a definitive assessment of the impact on the subsequent periods is highly dependent upon circumstances as they evolve. Our opinion is not modified in respect of this matter.
Key audit matters
5. Key audit matters are those matters that, in our professional judgment, were of most significance in our audit of the standalone financial statements of the current period. These matters were addressed in the context of our audit of the financial statements as a whole, and in forming our opinion thereon, and we do not provide a separate opinion on these matters.
Key audit matter How our audit addressed the key audit matter
Appropriateness of valuation of Property, Plant and Equipment (including Asset held for sale) (Refer note 50 and note 51 to the standalone financial statements):
During the previous year, the Company expanded its production capacity from 95 KTPA to 150 KTPA of its plant at Kalyan, Maharashtra which resulted in a capitalisation of H 21,544.68 lakhs.
In the current year, as the plant got fully operational and stabilized, the management undertook an exercise to review the plant and machinery which may no longer be usable; or may have to put to an alternate use; CWIP which was held for sale, for any further depletion in carrying value.
As a result of this exercise, assets with written down value of H 876.97 lakhs were determined to be redundant and were decommissioned and disposed off at a loss of H 653.93 lakhs; assets with written down value of H 218.32 lakhs are being evaluated for alternate use, resulting in writing them down to 5% of the gross book value, with a consequential loss of H 136.72 lakhs; re-assessment of fair value of CWIP disclosed as assets held for sale resulted in a write down of H 173.86 lakhs.
These losses/write downs of an amount of H 964.51 lakhs have been disclosed as Exceptional Items in the Statement of Profit and Loss.
Due to the significance of the amounts involved and judgement and estimates involved in determining usability and fair value the matter has been considered to be a Key Audit Matter.
Our procedures included the following:
• Obtained and examined the board approval for decommissioning of assets at site and sale of assets;
• Understanding and evaluating the controls and testing the operating effectiveness of the control related to identification of redundant assets and sale of the decommissioned assets and estimating the fair value of these assets;
• Obtained an understanding with the management in relation to the nature and use of the assets that are decommissioned at site;
• Evaluated the physical verification process performed by the management to identify these assets and examined the report for determining the assets decommissioned at site;
• Performed test of details on the assets sold i.e. examining the quotations, sales order approval and invoices;
• Evaluated the management assessment and performed test of details relating to the quotations received to determine fair value;
• Ensured adequacy of disclosures in the standalone financial statements.
Based on our procedures as mentioned above, we did not identify any inconsistency in the management assessment of carrying value of Property, Plant and Equipment (including asset held for sale).
Other Information
6. The Company’s Board of Directors is responsible for the other information. The other information comprises the information included in the annual report, but does not include the standalone financial statements and our auditor’s report thereon. The annual report is expected to be made available to us after the date of this auditor's report.
Our opinion on the financial statements does not cover the other information and we will not express any form of assurance conclusion thereon.
In connection with our audit of the standalone financial statements, our responsibility is to read the other information identified above when it becomes available and, in doing so, consider whether the other information is materially inconsistent with the financial statements or our knowledge obtained in the audit, or otherwise appears to be materially misstated.
64 Annual Report 2020-21 65• Corporate Overview • Statutory Reports • Financial StatementsI n d e p e n d e n t A u d i t o r ’ s R e p o r tN a t i o n a l P e r o x i d e L i m i t e d

When we read the annual report, if we conclude that there is a material misstatement therein, we are required to communicate the matter to those charged with governance and take appropriate action as applicable under the relevant laws and regulations.
Responsibilities of management and those charged with governance for the financial statements
7. The Company’s Board of Directors is responsible for the matters stated in section 134(5) of the Act with respect to the preparation of these standalone financial statements that give a true and fair view of the financial position, financial performance, changes in equity and cash flows of the Company in accordance with the accounting principles generally accepted in India, including the Accounting Standards specified under section 133 of the Act This responsibility also includes maintenance of adequate accounting records in accordance with the provisions of the Act for safeguarding of the assets of the Company and for preventing and detecting frauds and other irregularities; selection and application of appropriate accounting policies; making judgments and estimates that are reasonable and prudent; and design, implementation and maintenance of adequate internal financial controls, that were operating effectively for ensuring the accuracy and completeness of the accounting records, relevant to the preparation and presentation of the standalone financial statements that give a true and fair view and are free from material misstatement, whether due to fraud or error.
8. In preparing the standalone financial statements, management is responsible for assessing the Company’s ability to continue as a going concern, disclosing, as applicable, matters related to going concern and using the going concern basis of accounting unless management either intends to liquidate the Company or to cease operations, or has no realistic alternative but to do so. Those Board of Directors are also responsible for overseeing the Company’s financial reporting process.
Auditor’s responsibilities for the audit of the financial statements
9. Our objectives are to obtain reasonable assurance about whether the standalone financial statements as a whole are free from material misstatement, whether due to fraud or error, and to issue an auditor’s report that includes our opinion. Reasonable assurance is a high level of assurance, but is not a guarantee that an audit conducted in accordance with SAs will always detect a material misstatement when it exists. Misstatements can arise from fraud or error and are considered material if, individually or in the aggregate, they could reasonably be expected to influence the economic decisions of users taken on the basis of these financial statements.
10. As part of an audit in accordance with SAs, we exercise professional judgment and maintain professional scepticism throughout the audit. We also:
• Identify and assess the risks of material misstatement of the standalone financial statements, whether due to fraud or error, design and perform audit procedures responsive to those risks, and obtain audit evidence that is sufficient and appropriate to provide a basis for our opinion. The risk of not detecting a material misstatement resulting from fraud is higher than for one resulting from error, as fraud may involve collusion, forgery, intentional omissions, misrepresentations, or the override of internal control.
• Obtain an understanding of internal control relevant to the audit in order to design audit procedures that are appropriate in the circumstances Under Section 143(3)(i) of the Act, we are also responsible for expressing our opinion on whether the company has adequate internal financial controls with reference to financial statements in place and the operating effectiveness of such controls.
• Evaluate the appropriateness of accounting policies used and the reasonableness of accounting estimates and related disclosures made by management.
• Conclude on the appropriateness of management’s use of the going concern basis of accounting and, based on the audit evidence obtained, whether a material uncertainty exists related to events or conditions that may cast significant doubt on the Company’s ability to continue as a going concern. If we conclude that a material uncertainty exists, we are required to draw attention in our auditor’s report to the related disclosures in the financial statements or, if such disclosures are inadequate, to modify our opinion. Our conclusions are based on the audit evidence obtained up to the date of our auditor’s report. However, future events or conditions may cause the Company to cease to continue as a going concern.
• Evaluate the overall presentation, structure and content of the financial statements, including the disclosures, and whether the financial statements represent the underlying transactions and events in a manner that achieves fair presentation.
11. We communicate with those charged with governance regarding, among other matters, the planned scope and timing of the audit and significant audit findings, including any significant deficiencies in internal control that we identify during our audit.
12. We also provide those charged with governance with a statement that we have complied with relevant ethical requirements regarding independence, and to communicate with them all relationships and other matters that may reasonably be thought to bear on our independence, and where applicable, related safeguards.
13. From the matters communicated with those charged with governance, we determine those matters that were of most significance in the audit of the standalone financial statements of the current period and are therefore the key audit matters. We describe these matters in our auditor’s report unless law or regulation precludes public disclosure about the matter or when, in extremely rare circumstances, we determine that a matter should not be communicated in our report because the adverse consequences of doing so would reasonably be expected to outweigh the public interest benefits of such communication.
Report on other legal and regulatory requirements
14. As required by the Companies (Auditor’s Report) Order, 2016 (“the Order”), issued by the Central Government of India in terms of sub-section (11) of section 143 of the Act, we give in the Annexure B, a statement on the matters specified in paragraphs 3 and 4 of the Order, to the extent applicable.
15. As required by Section 143(3) of the Act, we report that:
(a) We have sought and obtained all the information and explanations which to the best of our knowledge and belief were necessary for the purposes of our audit.
(b) In our opinion, proper books of account as required by law have been kept by the Company so far as it appears from our examination of those books.
(c) The Balance Sheet, the Statement of Profit and Loss (including other comprehensive income), the Statement of Changes in Equity and Cash Flow Statement dealt with by this Report are in agreement with the books of account.
(d) In our opinion, the aforesaid standalone financial statements comply with the Accounting Standards specified under Section 133 of the Act.
(e) On the basis of the written representations received from the directors as on March 31, 2021 taken on record by the Board of Directors, none of the directors is disqualified as on March 31, 2021 from being appointed as a director in terms of Section 164 (2) of the Act.
66 Annual Report 2020-21 67• Corporate Overview • Statutory Reports • Financial StatementsI n d e p e n d e n t A u d i t o r ’ s R e p o r tN a t i o n a l P e r o x i d e L i m i t e d

(f) With respect to the adequacy of the internal financial controls with reference to financial statements of the Company and the operating effectiveness of such controls, refer to our separate Report in “Annexure A”.
(g) With respect to the other matters to be included in the Auditor’s Report in accordance with Rule 11 of the Companies (Audit and Auditors) Rules, 2014, in our opinion and to the best of our information and according to the explanations given to us:
i. The Company has disclosed the impact of pending litigations on its financial position in its financial statements - Refer Note 48 to the standalone financial statements;
ii. The Company has long-term contracts including derivative contracts as at March 31, 2021 for which there were no material foreseeable losses.
iii. There has been no delay in transferring amounts, required to be transferred, to the Investor Education and Protection Fund by the Company.
iv. The reporting on disclosures relating to Specified Bank Notes is not applicable to the Company for the year ended March 31, 2021.
16. The Company has paid/ provided for managerial remuneration in accordance with the requisite approvals mandated by the provisions of Section 197 read with Schedule V to the Act.
For Price Waterhouse Chartered Accountants LLPFirm Registration Number: 012754N/N500016
Asha Ramanathan PartnerMumbai Membership Number: 202660June 29, 2021 UDIN: 21202660AAAAAY8337
Annexure A to Independent Auditors’ ReportReferred to in paragraph 15(f) of the Independent Auditors’ Report of even date to the members of National Peroxide Limited on the standalone financial statements for the year ended March 31, 2021
Report on the Internal Financial Controls with reference to financial statements under Clause (i) of Sub-section 3 of Section 143 of the Act
1. We have audited the internal financial controls with reference to financial statements of National Peroxide Limited (“the Company”) as of March 31, 2021 in conjunction with our audit of the standalone financial statements of the Company for the year ended on that date.
Management’s Responsibility for Internal Financial Controls
2. The Company’s management is responsible for establishing and maintaining internal financial controls based on the internal control over financial reporting criteria established by the Company considering the essential components of internal control stated in the Guidance Note on Audit of Internal Financial Controls Over Financial Reporting issued by the Institute of Chartered Accountants of India (ICAI). These responsibilities include the design, implementation and maintenance of adequate internal financial controls that were operating effectively for ensuring the orderly and efficient conduct of its business, including adherence to company’s policies, the safeguarding of its assets, the prevention and detection of frauds and errors, the accuracy and completeness of the accounting records, and the timely preparation of reliable financial information, as required under the Act.
Auditors’ Responsibility
3. Our responsibility is to express an opinion on the Company's internal financial controls with reference to financial statements based on our audit. We conducted our audit in accordance with the Guidance Note on Audit of Internal Financial Controls Over Financial Reporting (the “Guidance Note”) and the Standards on Auditing prescribed under section 143(10) of the Act to the extent applicable to an audit of internal financial controls, both applicable to an audit of internal financial controls and both issued by the ICAI. Those Standards and the Guidance Note require that we comply with ethical requirements and plan and perform the audit to obtain reasonable assurance about whether adequate internal financial controls with reference to financial statements was established and maintained and if such controls operated effectively in all material respects.
4. Our audit involves performing procedures to obtain audit evidence about the adequacy of the internal financial controls system with reference to financial statements and their operating effectiveness. Our audit of internal financial controls with reference to financial statements included obtaining an understanding of internal financial controls with reference to financial statements, assessing the risk that a material weakness exists, and testing and evaluating the design and operating effectiveness of internal control based on the assessed risk. The procedures selected depend on the auditor’s judgement, including the assessment of the risks of material misstatement of the financial statements, whether due to fraud or error.
5. We believe that the audit evidence we have obtained is sufficient and appropriate to provide a basis for our audit opinion on the Company’s internal financial controls system with reference to financial statements.
68 Annual Report 2020-21 69• Corporate Overview • Statutory Reports • Financial StatementsI n d e p e n d e n t A u d i t o r ’ s R e p o r tN a t i o n a l P e r o x i d e L i m i t e d

Meaning of Internal Financial Controls with reference to financial statements
6. A company's internal financial controls with reference to financial statements is a process designed to provide reasonable assurance regarding the reliability of financial reporting and the preparation of financial statements for external purposes in accordance with generally accepted accounting principles. A company's internal financial controls with reference to financial statements includes those policies and procedures that (1) pertain to the maintenance of records that, in reasonable detail, accurately and fairly reflect the transactions and dispositions of the assets of the company; (2) provide reasonable assurance that transactions are recorded as necessary to permit preparation of financial statements in accordance with generally accepted accounting principles, and that receipts and expenditures of the company are being made only in accordance with authorisations of management and directors of the company; and (3) provide reasonable assurance regarding prevention or timely detection of unauthorised acquisition, use, or disposition of the company's assets that could have a material effect on the financial statements.
Inherent Limitations of Internal Financial Controls with reference to financial statements
7. Because of the inherent limitations of internal financial controls with reference to financial statements, including the possibility of collusion or improper management override of controls, material misstatements due to error or fraud may occur and not be detected. Also, projections of any evaluation of the internal financial controls with reference to financial statements to future periods are subject to the risk that the internal financial control controls with reference to financial statements may become inadequate because of changes in conditions, or that the degree of compliance with the policies or procedures may deteriorate.
Opinion
8. In our opinion, the Company has, in all material respects, an adequate internal financial controls system with reference to financial statements and such internal financial controls with reference to financial statements were operating effectively as at March 31, 2021, based on the internal control over financial reporting criteria established by the Company considering the essential components of internal control stated in the Guidance Note on Audit of Internal Financial Controls Over Financial Reporting issued by the Institute of Chartered Accountants of India. Also refer paragraph 4 of the main audit report.
For Price Waterhouse Chartered Accountants LLPFirm Registration Number: 012754N/N500016
Asha Ramanathan PartnerMumbai Membership Number: 202660June 29, 2021 UDIN: 21202660AAAAAY8337
Annexure B to Independent Auditors’ ReportReferred to in paragraph 14 of the Independent Auditors’ Report of even date to the members of National Peroxide Limited on the standalone financial statements as of and for the year ended March 31, 2021
i. (a) The Company is maintaining proper records showing full particulars, including quantitative details and situation, of fixed assets.
(b) The Property, Plant and Equipments are physically verified by the Management according to a phased programme designed to cover all the items over a period of two years which, in our opinion, is reasonable having regard to the size of the Company and the nature of its assets. Pursuant to the programme, a portion of the fixed assets has been physically verified by the Management during the year and no material discrepancies have been noticed on such verification.
(c) The title deeds of immovable properties, as disclosed in Note 4 on Property, Plant and Equipment’s to the financial statements, are held in the name of the Company.
ii. The physical verification of inventory has been conducted at reasonable intervals by the Management during the year. The discrepancies noticed on physical verification of inventory as compared to book records were not material
iii. The Company has granted unsecured loans to one company covered in the register maintained under Section 189 of the Act. There are no firms /LLPs/ other parties covered in the register maintained under Section 189 of the Act.
(a) In respect of the aforesaid loans, the terms and conditions under which such loans were granted are not prejudicial to the Company’s interest.
(b) In respect of the aforesaid loans, the schedule of repayment of principal and payment of interest has been stipulated, and the party is repaying the principal amounts, as stipulated, and is also regular in payment of interest as applicable.
(c) In respect of the aforesaid loans, there is no amount which is overdue for more than ninety days.
iv. The Company has not granted any loans to the parties covered under Section 185 of the Companies Act, 2013. In our opinion and according to the information and explanations given to us, the Company has complied with the provisions of Section 186 of the Companies Act, 2013 in respect of the loans and investments made, and guarantees and security provided by it.
v. The Company has not accepted any deposits from the public within the meaning of Sections 73, 74, 75 and 76 of the Act and the Rules framed there under to the extent notified.
vi. Pursuant to the rules made by the Central Government of India, the Company is required to maintain cost records as specified under Section 148(1) of the Act in respect of its products.
We have broadly reviewed the same, and are of the opinion that, prima facie, the prescribed accounts and records have been made and maintained. We have not, however, made a detailed examination of the records with a view to determine whether they are accurate or complete.
vii. (a) According to the information and explanations given to us and the records of the Company examined by us, in our opinion, the Company is generally regular in depositing undisputed statutory dues in respect of in respect of income tax, profession tax and provident fund, though there has been a slight delay in a few cases, and is regular in depositing undisputed statutory dues, including employees’ state insurance, duty of customs, cess, goods and service tax and other material statutory dues, as applicable, with the appropriate authorities. Also refer note 48 to the financial statements regarding management's assessment on certain matters relating to provident fund.
70 Annual Report 2020-21 71• Corporate Overview • Statutory Reports • Financial StatementsI n d e p e n d e n t A u d i t o r ’ s R e p o r tN a t i o n a l P e r o x i d e L i m i t e d

(b) According to the information and explanations given to us and the records of the Company examined by us, there are no dues of Goods and service-tax, duty of customs, duty of excise, which have not been deposited on account of any dispute. The particulars of dues of income tax, sales tax and value added tax as at March 31, 2021 which have not been deposited on account of a dispute, are as follows:
Name of the statute Nature of duesAmount
(J In lakhs)Period to which the
amount relatesForum where the dispute is pending
Maharashtra Value Added Tax Act, 2002
Value Added Tax 7.80 FY 2005-06 Joint Commissioner of Sales Tax (Appeal)
Maharashtra Value Added Tax Act, 2002
Value Added Tax 479.39* FY 2006-07 Deputy Commissioner of Sales Tax (Appeal)
Central Sales Tax Act, 1956
Sales Tax 38.90 FY 2012-13 Joint Commissioner of Sales Tax
Central Sales Tax Act, 1956
Sales Tax 1,656.58** FY 2006-07 Joint Commissioner of Sales Tax (Appeal)
Income Tax Act, 1961 Income Tax 4.58 AY 2013-14 Assistant Commissioner of Income Tax, Mumbai
Income Tax Act, 1961 Income Tax 101.59 AY 2015-16 Assistant Commissioner of Income Tax, Mumbai
Income Tax Act, 1961 Income Tax 16.58 AY 2016-17 Assistant Commissioner of Income Tax, Mumbai
Income Tax Act, 1961 Income Tax 1079.47 AY 2018-19 Commissioner of Income Tax Appeals, Mumbai
* net of H 8.33 lakhs paid as deposit
** net of H 59.32 lakhs paid as deposit
viii. According to the records of the Company examined by us and the information and explanation given to us, the Company has not defaulted in repayment of loans or borrowings to any bank as at the balance sheet date. Further, the Company neither has any loans or borrowings from any financial institution or Government, nor has it issued any debentures as at the balance sheet date.
ix. The Company has not raised any moneys by way of initial public offer and further public offer (including debt instruments). In our opinion, and according to the information and explanations given to us, the moneys raised by way of term loans have been applied, on an overall basis, for the purposes for which they were obtained.
x. During the course of our examination of the books and records of the Company, carried out in accordance with the generally accepted auditing practices in India, and according to the information and explanations given to us, we have neither come across any instance of material fraud by the Company or on the Company by its officers or employees, noticed or reported during the year, nor have we been informed of any such case by the Management.
xi. The Company has paid/ provided for managerial remuneration in accordance with the requisite approvals mandated by the provisions of Section 197 read with Schedule V to the Act. Also refer paragraph 16 of Independent Auditor’s Report.
xii. As the Company is not a Nidhi Company and the Nidhi Rules, 2014 are not applicable to it, the provisions of Clause 3(xii) of the Order are not applicable to the Company.
xiii. The Company has entered into transactions with related parties in compliance with the provisions of Sections 177 and 188 of the Act. The details of such related party transactions have been disclosed in the standalone financial statements as required under Indian Accounting Standard (Ind AS) 24, Related Party Disclosures specified under Section 133 of the Act.
xiv. The Company has not made any preferential allotment or private placement of shares or fully or partly convertible debentures during the year under review. Accordingly, the provisions of Clause 3(xiv) of the Order are not applicable to the Company.
xv. The Company has not entered into any non-cash transactions with its directors or persons connected with him, within the meaning of Section 192 of the Act. Accordingly, the provisions of Clause 3(xv) of the Order are not applicable to the Company.
xvi. The Company is not required to be registered under Section 45-IA of the Reserve Bank of India Act, 1934. Accordingly, the provisions of Clause 3(xvi) of the Order are not applicable to the Company.
For Price Waterhouse Chartered Accountants LLPFirm Registration Number: 012754N/N500016
Asha Ramanathan PartnerMumbai Membership Number: 202660June 29, 2021 UDIN: 21202660AAAAAY8337
72 Annual Report 2020-21 73• Corporate Overview • Statutory Reports • Financial StatementsI n d e p e n d e n t A u d i t o r ’ s R e p o r tN a t i o n a l P e r o x i d e L i m i t e d

The above Balance Sheet should be read in conjunction with the accompanying notes.
As per our report of even dateFor Price Waterhouse Chartered Accountants LLP For and on behalf of the Board of Directors ofICAI Firm registration number: 012754N/N500016 National Peroxide Limited
Asha Ramanathan Rajiv Arora Ness N. Wadia Rajesh Batra Partner Chief Executive Officer & Director Chairman Director Membership No 202660 DIN: 08730235 DIN: 00036049 DIN: 00020764
Conrad Fernandes S. Ragothaman Viraf Mehta Chief Financial Officer Director Director DIN: 00042395 DIN: 00352598
Chandukumar Parmar Minnie Bodhanwala Harshbeena Zaveri Company Secretary Director Director DIN: 00422067 DIN: 00003948 Place: Mumbai Date: June 29, 2021
Balance Sheet as at March 31, 2021(All amounts are in Indian Rupees lakhs, unless otherwise stated)
NoteAs at
March 31, 2021 As at
March 31, 2020
ASSETSNon-current assetsProperty, plant and equipment 4 34,148.13 37,154.03Capital work-in-progress 4 252.73 – Intangible assets 5 65.08 85.02 Financial assets – Investments 6 26,774.25 17,656.41 – Loans 7 43.16 21.40 Income tax assets (net) 8 606.43 313.03 Other non current assets 9 130.36 382.35
62,020.14 55,612.24Current assets Inventories 10 1,695.11 2,440.22 Financial assets – Trade receivables 11 2,384.34 3,224.88 – Cash and cash equivalents 12 665.82 219.10 – Other bank balances 13 69.10 73.86 – Loans 14 11,026.85 11,034.07 – Other financial assets 15 – 898.27 Other current assets 16 391.56 344.28 Asset held for sale 17 201.51 378.46
16,434.29 18,613.14 Total assets 78,454.43 74,225.38EQUITY & LIABILITIESEQUITY Equity share capital 18 574.70 574.70 Other equity 19 58,266.96 48,070.71
58,841.66 48,645.41LIABILITIESNon-current liabilities Financial liabilities – Borrowings 20 – – – Other financial liabilities 21 137.47 3.79 Provisions 22 344.88 280.27 Deferred tax liabilities (net) 38 3,163.49 3,928.46
3,645.84 4,212.52Current liabilities Financial liabilities – Borrowings 23 933.33 467.93 – Trade payables 24 Dues to micro enterprises and small enterprises 304.37 15.98 Dues to others 1,697.54 1,850.83 – Other financial liabilities 25 12,515.26 18,542.99 Contract liabilities 106.08 46.91 Other current liabilities 26 295.98 110.12 Provisions 27 114.37 167.34 Income tax liabilities (net) 28 – 165.35
15,966.93 21,367.45 Total liabilities 19,612.77 25,579.97 Total equity and liabilities 78,454.43 74,225.38Basis of Preparation and Significant accounting policies 2
Statement of Profit and Loss for the year ended March 31, 2021 (All amounts are in Indian Rupees lakhs, unless otherwise stated)
NoteFor the year ended
March 31, 2021 For the year ended
March 31, 2020
Income Revenue from operations 29 21,447.35 19,064.87 Other income 30 1,277.96 1,795.10Total income 22,725.31 20,859.97 Expenses Cost of raw materials and packing materials consumed 31 7,578.36 6,487.74 Purchase of stock-in-trade – 90.19 Changes in inventories of finished goods 32 171.28 1,644.53 Power, fuel & Water 3,395.49 2,604.54 Employee benefit expenses 33 2,558.45 2,633.49 Finance costs 34 1,265.62 273.68 Depreciation and amortisation expense 35 1,749.96 1,122.83 Other expenses 36 3,277.30 3,103.39Total expenses 19,996.46 17,960.39Profit before exceptional items and tax 2,728.85 2,899.58 Exceptional Items 37 1,549.30 –Profit before tax 1,179.55 2,899.58Tax expense: 38 Current tax 121.97 530.09 Deferred tax (1,023.50) 632.87Total tax expense (901.53) 1,162.96Profit for the year 2,081.08 1,736.62Other comprehensive incomeItems that will not be reclassified to profit or loss Re-measurements of the net defined benefit obligations 57.06 5.97 Fair value changes of equity instruments at FVOCI 9,116.85 (10,262.92) Income tax relating to above items (269.66) (1.16)Items that will be reclassified to profit or loss Effective portion of gain / (losses) on cash flow hedge (73.50) 247.94 Income tax relating to above item 2.80 (86.64)Other comprehensive income for the year, net of tax 8,833.55 (10,096.81)Total comprehensive income for the year 10,914.63 (8,360.19)Earnings per equity share - Basic and diluted 39 36.21 30.22Basis of Preparation and Significant accounting policies 2
The above Statement of Profit and Loss should be read in conjunction with the accompanying notes.
As per our report of even dateFor Price Waterhouse Chartered Accountants LLP For and on behalf of the Board of Directors ofICAI Firm registration number: 012754N/N500016 National Peroxide Limited
Asha Ramanathan Rajiv Arora Ness N. Wadia Rajesh Batra Partner Chief Executive Officer & Director Chairman Director Membership No 202660 DIN: 08730235 DIN: 00036049 DIN: 00020764
Conrad Fernandes S. Ragothaman Viraf Mehta Chief Financial Officer Director Director DIN: 00042395 DIN: 00352598
Chandukumar Parmar Minnie Bodhanwala Harshbeena Zaveri Company Secretary Director Director DIN: 00422067 DIN: 00003948 Place: Mumbai Date: June 29, 2021
74 Annual Report 2020-21 75• Corporate Overview • Statutory Reports • Financial StatementsB a l a n c e S h e e t | S t a t e m e n t o f P r o f i t a n d L o s sN a t i o n a l P e r o x i d e L i m i t e d

Statement of Changes in Equity for the year ended March 31, 2021(All amounts are in Indian Rupees lakhs, unless otherwise stated)
The above Statement of Changes in Equity should be read in conjunction with the accompanying notes.
As per our report of even dateFor Price Waterhouse Chartered Accountants LLP For and on behalf of the Board of Directors ofICAI Firm registration number: 012754N/N500016 National Peroxide Limited
Asha Ramanathan Rajiv Arora Ness N. Wadia Rajesh Batra Partner Chief Executive Officer & Director Chairman Director Membership No 202660 DIN: 08730235 DIN: 00036049 DIN: 00020764
Conrad Fernandes S. Ragothaman Viraf Mehta Chief Financial Officer Director Director DIN: 00042395 DIN: 00352598
Chandukumar Parmar Minnie Bodhanwala Harshbeena Zaveri Company Secretary Director Director DIN: 00422067 DIN: 00003948 Place: Mumbai Date: June 29, 2021
ParticularsEquity share
capital (Note 18)
Reserves and Surplus Items of OCI
Total other
equityGeneral reserve
Retained earnings
FVOCI - Equity
Instrument
FVOCI - Cash flow
hedging reserve
Balance as at April 1, 2019 574.70 3,284.50 39,668.53 18,247.22 (265.77) 60,934.48Profit for the year – – 1,736.62 – – 1,736.62
Other comprehensive income (net of tax) – – 3.89 (10,262.00) 161.30 (10,096.81)
Total comprehensive income for the year – – 1,740.51 (10,262.00) 161.30 (8,360.19)Transactions with owners in their capacity as owners:Dividend paid – – (3,735.55) – – (3,735.55)
Dividend distribution tax – – (768.03) – – (768.03)
Balance as at March 31, 2020 574.70 3,284.50 36,905.46 7,985.22 (104.47) 48,070.71Profit for the year – – 2,081.08 – – 2,081.08
Other comprehensive income (net of tax) – – 42.70 8,861.55 (70.70) 8,833.55
Total comprehensive income for the year – – 2,123.78 8,861.55 (70.70) 10,914.63Transactions with owners in their capacity as owners:Dividend paid – – (718.38) – – (718.38)
Balance as at March 31, 2021 574.70 3,284.50 38,310.86 16,846.77 (175.17) 58,266.96Basis of Preparation and Significant accounting policies 2
Statement of Cash Flows for the year ended March 31, 2021(All amounts are in Indian Rupees lakhs, unless otherwise stated)
For the year ended March 31, 2021
For the year ended March 31, 2020
Cash flow from operating activitiesProfit before tax 1,179.55 2,899.58Adjustments for: Depreciation and amortization expense 1,749.96 1,122.83 Finance costs 1,265.62 273.68 Interest income (1,115.95) (1,653.62) Dividend income (30.78) (51.22) Loss on disposal of property, plant and equipment 654.77 0.03 Provision for impairment of property, plant and equipment 136.72 – Loss on account of reassessment of fair value of assets (CWIP) held for sale 173.86 – Loss on account of breakdown of machinery 367.22 – Fair value gain on investments (including gain on sale of investments) measured at FVTPL (35.00) (21.56) Loss allowances – 30.15 Gain on cancellation of lease contract – (0.18) Net exchange differences loss 0.03 8.95Operating cashflow before working capital changes 4,346.00 2,608.64Change in operating assets and liabilities Decrease in inventories 745.11 740.41 (Increase) / decrease in trade receivables 840.97 (195.65) (Increase) / decrease in non-current financial asset (21.76) 18.95 Decrease in current financial asset 7.22 10.80 (Increase) / decrease in other non-current assets 273.31 (0.24) (Increase) / decrease in other current assets (47.28) 407.08 (Increase) / decrease in assets held for sale 3.09 (378.46) Increase / (decrease) in trade payable 135.10 (547.63) Increase in provision 68.71 49.28 Increase / (decrease) in other current financial liabilities 67.05 (131.14) Increase / (decrease) in other liabilities 185.86 (11.38) Increase in contract liabilities 59.17 31.05Cash generated from operations 6,662.55 2,601.71Income taxes paid (net) (589.05) (1,044.17)Net cash inflow by operating activities 6,073.50 1,557.54Cash flow from investing activities Payment for property, plant and equipment (including capital work-in-progress and advances) (2,339.72) (9,749.93) Payment for software development cost – (104.96) Proceeds from sale of property, plant and equipment 223.04 0.08 Payment for purchase of investment (12,066.00) (25,309.60) Proceeds from sale of investment 12,100.00 16,571.09 Intercorporate deposits given to a related party (500.00) (650.00) Receipts of Intercorporate deposits given to a related party 500.00 3,500.00 Intercorporate deposits given to other companies (5,000.00) (26,500.00) Receipts of Intercorporate deposits given to other companies 5,000.00 36,500.00 Interest received 1,338.68 1,517.07 Dividend received 30.78 51.22 Movement in bank balances which are not considered as cash and cash equivalents 4.76 347.27Net cash outflow from investing activities (708.46) (3,827.76)
76 Annual Report 2020-21 77• Corporate Overview • Statutory Reports • Financial StatementsS t a t e m e n t o f C h a n g e s i n E q u i t y | S t a t e m e n t o f C a s h F l o w sN a t i o n a l P e r o x i d e L i m i t e d

Notes to the Financial Statements as of and for the year ended March 31, 2021 (All amounts are in Indian Rupees lakhs, unless otherwise stated)
For the year ended March 31, 2021
For the year ended March 31, 2020
Cash flow from financing activities Proceeds from long term borrowings – 7,785.38 Repayment of long term borrowings (3,395.26) – Proceeds from / (repayment of) short term borrowings 465.40 (532.07) Dividends paid to company shareholders (including DDT) (723.14) (4,492.73) Principal elements of lease payments (8.98) (11.58) Interest paid (1,256.34) (1,336.36)Net cash inflow / (outflow) from financing activities (4,918.32) 1,412.64Net increase/ (decrease) in cash and cash equivalents 446.72 (857.58)Cash and cash equivalents at the beginning of the year 219.10 1,076.68Cash and cash equivalents at the end of the year 665.82 219.10Cash and cash equivalents comprises of:Cash and bank balances (refer note 12) 665.82 219.10
665.82 219.10Non-Cash Investing activityAcquisition of right of use (ROU) assets – 23.05
Note:The above cash flow statement has been prepared under the ‘Indirect Method’ as set out in the Accounting Standard (Ind AS) 7- “Cash Flow Statements” as notified under Companies (Accounts) Rules, 2015.Basis of Preparation and Significant accounting policies 2
Statement of Cash Flows for the year ended March 31, 2021(All amounts are in Indian Rupees lakhs, unless otherwise stated)
The above Statement of Cash Flows should be read in conjunction with the accompanying notes.
As per our report of even dateFor Price Waterhouse Chartered Accountants LLP For and on behalf of the Board of Directors ofICAI Firm registration number: 012754N/N500016 National Peroxide Limited
Asha Ramanathan Rajiv Arora Ness N. Wadia Rajesh Batra Partner Chief Executive Officer & Director Chairman Director Membership No 202660 DIN: 08730235 DIN: 00036049 DIN: 00020764
Conrad Fernandes S. Ragothaman Viraf Mehta Chief Financial Officer Director Director DIN: 00042395 DIN: 00352598
Chandukumar Parmar Minnie Bodhanwala Harshbeena Zaveri Company Secretary Director Director DIN: 00422067 DIN: 00003948 Place: Mumbai Date: June 29, 2021
1) General information:
National Peroxide Limited (“NPL”, “Company”) is a public limited Company established in 1954 and is listed on BSE Limited, Mumbai. NPL a pioneer in India for peroxygen chemicals is the largest manufacturer of Hydrogen Peroxide in India, with an installed capacity of 150 KTPA on 50% w/w. basis. Company’s registered office is situated at Neville House, J. N. Heredia Marg, Ballard Estate, Mumbai - 400 001.
2) Significant accounting policies and critical estimates and judgements:
2.1 Basis of preparation, measurement and significant accounting policies
Theprincipalaccountingpoliciesappliedinthepreparationofthesefinancialstatementsaresetoutbelow.Thesepolicies have been consistently applied to all the years presented, unless otherwise stated.
(a) Basis of preparation
(i) Compliance with Ind AS
The financial statements comply in all material aspects with Indian Accounting Standards (Ind AS) notified under Section 133 of the Companies Act, 2013 (the Act) [Companies (Indian Accounting Standards) Rules, 2015] and other relevant provisions of the Act.
(ii) Historical cost convention
The financial statements have been prepared on historical cost basis, except for the following:
• Certain financial assets and financial liabilities are measured at fair value (including derivative instruments);
• Defined benefit plans – plan assets are measured at fair value;
• Assets held for sale – measured at fair value less cost to sell.
(iii) New and amended standards adopted by the Company
The Company has applied following standards and amendments for the first time for their annual reporting period commencing April 1, 2020:
• Definition of Material – amendments to Ind AS 1 and Ind AS 8
• Definition of a Business – amendments to Ind AS 103
• COVID-19 related concessions – amendments to Ind AS 116
• Interest Rate Benchmark Reform – amendments to Ind AS 109 and Ind AS 107
These amendments did not have any impact on the amounts recognised in prior years and are not expected to significantly affect the current or future years.
(iv) Current vis-à-vis non-current classification
The assets and liabilities reported in the balance sheet are classified on a “current / non-current basis”.
An asset is classified as current when it is expected to be realised or intended to be sold or consumed in normal operating cycle, held primarily for the purpose of trading, expected to be realised within twelve months after the reporting period, or cash or cash equivalent unless restricted from being exchanged or used to settle a liability for at least twelve months after the reporting period.
79• Corporate Overview • Statutory Reports • Financial StatementsN o t e s t o t h e F i n a n c i a l S t a t e m e n t s78 Annual Report 2020-21
N a t i o n a l P e r o x i d e L i m i t e d

Notes to the Financial Statements as of and for the year ended March 31, 2021 (All amounts are in Indian Rupees lakhs, unless otherwise stated)
Notes to the Financial Statements as of and for the year ended March 31, 2021 (All amounts are in Indian Rupees lakhs, unless otherwise stated)
A liability is classified as current when it is expected to be settled in normal operating cycle, it is held primarily for the purpose of trading, it is due to be settled within twelve months after the reporting period, or there is no unconditional right to defer the settlement of the liability for at least twelve months after the reporting period.
The Company has determined its operating cycle as twelve months for the purpose of current – non-current classification of assets and liabilities.
Deferred tax assets and liabilities, and all assets and liabilities which are not current are classified as non-current assets and liabilities.
The derivatives designated in hedging relationship and separated embedded derivatives are classified basis the hedged item and host contract respectively.
(b) Segment reporting:
Operating segments are reported in a manner consistent with the internal reporting provided to the Chief Operating Decision-Maker (CODM).
The Chief Executive Officer and Director of National Peroxide Limited has been identified as CODM and he is responsible for allocating resources, assess the financial performance of the company and make strategic decisions.
The Company has identified one reportable segment ‘manufacturing of peroxygens’ based on information reviewed by the CODM. Refer Note 41 for segment information presented
(c) Foreign currency translation:
(i) Functional and presentation currency
Items included in the financial statements of the Company are measured using the currency of the primary economic environment in which the Company operates (‘the functional currency’). The financial statements are presented in ‘Indian Rupees’ (INR), which is the Company’s functional and presentation currency.
(ii) Transactions and balances
Foreign currency transactions are translated into the functional currency using the exchange rates at the dates of the transactions. Foreign exchange gains and losses resulting from the settlement of such transactions and from the translation of monetary assets and liabilities denominated in foreign currencies at year end exchange rates are generally recognized in profit or loss. They are deferred in equity if they relate to qualifying cash flow hedges.
Non-monetary items that are measured at fair value in a foreign currency are translated using the exchange rates at the date when the fair value was determined. Translation differences on assets and liabilities carried at fair value are reported as part of the fair value gain or loss. For example, translation differences on non-monetary assets and liabilities such as equity instruments held at fair value through profit or loss are recognized in profit or loss as part of the fair value gain or loss and translation differences on non-monetary assets such as equity investments classified as FVOCI are recognized in other comprehensive income.
(d) Revenue recognition:
Revenue from sale of goods
Revenue is generated primarily from sale of peroxygens. Revenue is recognised at the point in time when the performance obligation is satisfied and control of the goods is transferred to the customer upon dispatch or delivery, in accordance with the terms of customer contracts. Revenue is recognised at an amount that the Company expects to receive from customers that is net of trade discounts, rebates and goods and service tax (GST).
A contract liability is the obligation to transfer goods to the customer for which the Company has received consideration from the customer. Contract liabilities are recognised as revenue when the Company performs under the contract.
(e) Income tax:
The income tax expense or credit for the period is the tax payable on the current period’s taxable income based on the applicable income tax rate for each jurisdiction adjusted by changes in deferred tax assets and liabilities attributable to temporary differences and to unused tax losses.
The current income tax charge is calculated on the basis of the tax laws enacted or substantively enacted at the end of the reporting period in the countries where the Company operates and generates taxable income. Management periodically evaluates positions taken in tax returns with respect to situations in which applicable tax regulation is subject to interpretation and considers whether it is probable that a taxation authority will accept an uncertain tax treatment. The Company measures its tax balances either based on the most likely amount or the expected value, depending on which method provides a better prediction of the resolution of the uncertainty.
Deferred income tax is provided in full, using the liability method, on temporary differences arising between the tax base of assets and liabilities and their carrying amounts in the financial statements. Deferred income tax is not accounted for if it arises from initial recognition of an asset or liability in a transaction other than a business combination that at the time of the transaction affects neither accounting profit nor taxable profit (tax loss). Deferred income tax is determined using tax rates (and laws) that have been enacted or substantially enacted by the end of the reporting period and are expected to apply when the related deferred income tax asset is realised or the deferred income tax liability is settled.
Deferred tax assets are recognised for all deductible temporary differences and unused tax losses only if it is probable that future taxable amounts will be available to utilise those temporary differences and losses.
Deferred tax assets and liabilities are offset when there is a legally enforceable right to offset current tax assets and liabilities and when the deferred tax balances relate to the same taxation authority. Current tax assets and tax liabilities are offset where the entity has a legally enforceable right to offset and intends either to settle on a net basis or to realise the asset and settle the liability simultaneously.
Current and deferred tax is recognised in Profit or Loss, except to the extent that it relates to items recognised in other comprehensive income or directly in equity. In this case, the tax is also recognized in other comprehensive income or directly in equity, respectively.
(f) Leases:
Effective from April 1, 2019, the Company has adopted Ind AS 116 “Leases” and accordingly accounted for leases as below:
80 Annual Report 2020-21 81• Corporate Overview • Statutory Reports • Financial StatementsN o t e s t o t h e F i n a n c i a l S t a t e m e n t sN a t i o n a l P e r o x i d e L i m i t e d

Notes to the Financial Statements as of and for the year ended March 31, 2021 (All amounts are in Indian Rupees lakhs, unless otherwise stated)
Notes to the Financial Statements as of and for the year ended March 31, 2021 (All amounts are in Indian Rupees lakhs, unless otherwise stated)
As a lessee
From April 1, 2019, leases are recognized as a right-of-use asset and corresponding liability at the date which the lease asset is available for use by the Company. Contracts may contain both lease and non-lease components. The Company allocates the consideration in the contract to the lease and non-lease components based on relative stand-alone prices.
Assets and liabilities arising from lease are initially measured on present value basis. Lease liabilities include the net present value of the following lease payments:
– Fixed payments (including in-substance fixed payments), less any lease incentives receivable – Variable lease payments that are based on an index or a rate, initially measured using the index or rate as at
the commencement date – Amounts expected to be payable by the Company under residual value guarantees – Exercise price of the purchase option if the Company is reasonably certain to exercise that option, and – Payments of penalties for terminating the lease, if the lease term reflects the Company exercising that
option.
Lease payments to be made under reasonably certain extension options are also included in the measurement of the liability. The lease payments are discounted using the interest rate implicit in the lease. If the rate cannot be readily determined, the lessee’s incremental borrowing rate is used, being the rate that the individual lessee would have to pay to borrow the funds necessary to obtain an asset of similar value to the right-of-use in a similar economic environment with similar terms, security and conditions.
Lease payments are allocated between principal and finance cost. The finance cost is charged to profit or loss over the lease period so as to produce a constant periodic rate of interest on the remaining balance of the liability for each period.
Variable lease payments that depend on any key variable/condition are recognized in profit or loss in the period in which the condition that triggers those payment occurs. The Company is exposed to potential future increases in variable lease payments based on index or rate, which are not included in the lease liability until they take effect. When adjustments to lease payments based on index or rate or rate take effect, the lease liability is reassessed and adjusted against the right-of-use asset.
Right-of-use assets are measured at cost comprising the following
– the amount of the initial measurement of lease liability
– any lease payments made at or before the commencement of date less any lease incentives received
– any initial direct costs, and
– restoration costs.
Right-of-use assets are generally depreciated over the shorter of the asset’s useful life and lease term on a straight-line basis. If the Company exercises the purchase option, the right-of-use asset is depreciated over the underlying asset’s useful life.
Short-term leases
The Company recognizes the lease payments associated with these leases as an expense on a straight-line basis over the lease term.
(g) Impairment of non-financial assets:
Assets are tested for impairment, wherever events or changes in circumstances indicate that the carrying amount may not be recoverable. An impairment loss is recognised for the amount by which the asset’s carrying amount exceeds its recoverable amount. The recoverable amount is the higher of an asset’s fair value less costs of disposal and value in use. For the purposes of assessing impairment, assets are grouped at the lowest levels for which there are separately identifiable cash inflows which are largely independent of the cash inflows from other assets or groups of assets (cash-generating units). Non-financial assets that suffered an impairment are reviewed for possible reversal of the impairment at the end of each reporting period.
(h) Cash and Cash Equivalents:
Cash and cash equivalents includes cash on hand, cheques on hand, deposits held at call with financial institutions, other short term, highly liquid investments with original maturities of three months or less that are readily convertible to known amounts of cash and which are subject to an insignificant risk of changes in value, and bank overdrafts. Bank overdrafts are shown within borrowings in current liabilities in the Balance sheet.
(i) Trade Receivables:
Trade receivables are amounts due from customers for goods sold in the ordinary course of business. Trade receivables are recognised initially at the amount of consideration that is unconditional unless they contain significant financing components, when they are recognised at fair value. The Company holds the trade receivables with the objective to collect the contractual cash flows and therefore measures them subsequently at amortised cost using the effective interest method, less loss allowance.
(j) Inventories:
Inventories are valued at lower of cost and net realisable value. In the case of raw materials, packing materials and stores and spares parts, cost is determined in accordance with the moving weighted average principle. Costs include the purchase price, non – refundable taxes and delivery and handling costs. Cost of finished goods includes all costs of purchases, direct materials, direct labour and appropriate proportion of variable and fixed overheads expenditure. Cost of inventories also include all other costs incurred in bringing the inventories to their present location and condition. The net realisable value is the estimated selling price in the ordinary course of business less the estimated costs of completion and estimated costs necessary to make the sale.
(k) Non-Current assets held for sale:
Non- current assets are classified as held for sale if their carrying amount will be recovered principally through a sale transaction rather than through continuing use and sale is considered highly probable. They are measured at lower of their carrying amount and fair value less costs to sell.
An impairment loss is recognized for any initial or subsequent write-down of the asset to fair value less costs to sell. A gain is recognized for subsequent increase in fair value less costs to sell of an asset, but not in excess of any cumulative impairment loss previously recognized. A gain or loss not previously recognized by the date of the sale of the non -current asset is recognized at the date of de-recognition.
Non-Current assets are not depreciated or amortized while they are classified as held for sale. Non-current assets classified as held for sale are presented separately from the other assets in the balance sheet.
82 Annual Report 2020-21 83• Corporate Overview • Statutory Reports • Financial StatementsN o t e s t o t h e F i n a n c i a l S t a t e m e n t sN a t i o n a l P e r o x i d e L i m i t e d

Notes to the Financial Statements as of and for the year ended March 31, 2021 (All amounts are in Indian Rupees lakhs, unless otherwise stated)
Notes to the Financial Statements as of and for the year ended March 31, 2021 (All amounts are in Indian Rupees lakhs, unless otherwise stated)
The liabilities of a disposal group classified as held for sale are presented separately from other liabilities in the balance sheet.
(l) Investments and other financial assets:
(i) Classification
The Company classifies its financial assets in the following measurement categories:
• those to be measured subsequently at fair value (either through Other Comprehensive Income or through profit or loss) and
• those measured at amortised cost.
The classification depends on the entity’s business model for managing the financial assets and the contractual terms of the cash flows.
For assets measured at fair value, gains and losses will either be recorded in profit or loss or other comprehensive income. For investments in equity instruments, this will depend on whether the Company has made an irrevocable election at the time of initial recognition to account for the equity investment at fair value through other comprehensive income.
(ii) Measurement
At initial recognition, the Company measures financial assets at its fair value plus, in the case of financial assets not at fair value through profit or loss, transaction costs that are directly attributable to the acquisition of the financial assets. Transaction costs of financial assets carried at fair value through profit or loss are expensed in the Statement of Profit or Loss.
Debt instruments
Subsequent measurement of debt instruments depends on the Company’s business model for managing the asset and the cash flow characteristics of the asset. There are three measurement categories into which the Company classifies its debt instruments:
• Amortised cost: Assets that are held for collection of contractual cash flows where those cash flows represent solely payments of principal and interest are measured at amortised cost. Interest income from these financial assets is included in finance income using the effective interest rate method. Any gain or loss arising on derecognition is recognised directly in profit or loss and presented in other gains/(losses). Impairment losses are presented as separate line item in the Statement of Profit and Loss.
• Fair value through other comprehensive income (FVOCI): Assets that are held for collection of contractual cash flows and for selling the financial assets, where the assets’ cash flows represent solely payments of principal and interest, are measured at FVOCI. Movements in the carrying amount are taken through OCI, except for the recognition of impairment gains or losses, interest income and foreign exchange gains and losses which are recognised in profit and loss. When the financial asset is derecognised, the cumulative gain or loss previously recognised in OCI is reclassified from equity to profit or loss and recognised in other gains/(losses). Interest income from these financial assets is included in other income using the effective interest rate method. Foreign exchange gains and losses are presented in other gains/(losses) and impairment expenses are presented as separate line item in Statement of Profit and Loss.
• Fair value through profit or loss: Assets that do not meet the criteria for amortised cost or FVOCI are measured at fair value through profit or loss. A gain or loss on a debt investment that is subsequently measured at fair value through profit or loss is recognised in profit or loss and presented net within other gains/(losses) in the period in which it arises. Interest income from these financial assets is included in other income.
Equity instruments
The Company subsequently measures all equity investments at fair value. The Company’s management has elected to present fair value gains and losses on equity investments in Other Comprehensive Income, there is no subsequent reclassification of fair value gains and losses to profit or loss following the derecognition of the investment. Dividends from such investments are recognised in the Statement of Profit and Loss as other income when the Company’s right to receive payments is established.
Changes in fair value of financial assets at fair value through profit or loss are recognized in other gain / (losses) in the Statement of Profit and Loss. Impairment losses (and reversal of impairment losses), if any on equity investments measured at FVOCI are not reported separately from other changes in fair value.
Investment in subsidiary is carried at cost less impairment loss, if any.
(iii) Derivatives and hedging activity
The Company enters into derivative financial instruments to manage its exposure to interest rate and foreign exchange rate risks such as cross currency interest rate swaps.
Derivatives are initially recognised at fair value on the date a derivative contract is entered into and are subsequently re-measured to their fair value at the end of each reporting period. The accounting for subsequent changes in fair value depends on whether the derivative is designated as a hedging instrument, and if so, the nature of the item being hedged, and the type of hedge relationship designated.
The Company designates derivatives as either (i) hedges of the fair value of recognised assets or liabilities (fair value changes) or (ii) hedges of a particular risk associated with the cash flows of recognised assets and liabilities (cash flow hedges). The Company has designated the cross-currency interest rate swap as a cash flow hedge for changes in both interest rate and foreign exchange rates.
At the inception of the hedge relationship, the Company documents the relationship between the hedging instrument and the hedged item, along with its risk management objectives and its strategy for undertaking various hedge transactions. Furthermore, at the inception of the hedge and on an ongoing basis, the Company documents whether the hedging instrument is highly effective in offsetting changes in fair values or cash flows of the hedged item attributable to the hedged risk.
The full fair value of a hedging derivative is classified as a non-current asset or liability when the remaining maturity of the hedged item is more than 12 months; it is classified as a current asset or liability when the remaining maturity of the hedged item is less than 12 months.
(a) Cash flow hedges that qualify for hedge accounting
The effective portion of changes in the fair value of derivatives that are designated and qualify as cash flow hedges is recognised in cash flow hedging reserve within equity. The gain or loss relating to the ineffective portion is recognised immediately in profit or loss, within other gains/(losses).
84 Annual Report 2020-21 85• Corporate Overview • Statutory Reports • Financial StatementsN o t e s t o t h e F i n a n c i a l S t a t e m e n t sN a t i o n a l P e r o x i d e L i m i t e d

Notes to the Financial Statements as of and for the year ended March 31, 2021 (All amounts are in Indian Rupees lakhs, unless otherwise stated)
Notes to the Financial Statements as of and for the year ended March 31, 2021 (All amounts are in Indian Rupees lakhs, unless otherwise stated)
Amounts previously recognised in other comprehensive income and accumulated in equity relating to effective portion as described above are reclassified to profit or loss in the periods when the hedged item affects profit or loss, in the same line as the recognised hedged item. However, when the hedged forecast transaction results in the recognition of a non-financial asset or a non-financial liability, such gains and losses are transferred from equity (but not as a reclassification adjustment) and are included in the initial measurement of the cost of the non-financial asset or non-financial liability.
Hedge accounting is discontinued when the hedging instrument expires or is sold, terminated, or exercised, or when it no longer qualifies for hedge accounting. Any gain or loss recognised in other comprehensive income and accumulated in equity at that time remains in equity and is recognised when the forecast transaction is ultimately recognised in profit or loss. When a forecast transaction is no longer expected to occur, the gain or loss accumulated in equity is reclassified immediately in profit or loss.
If the hedge ratio for risk management purposes is no longer optimal but the risk management objective remains unchanged and the hedge continues to qualify for hedge accounting, the hedge relationship will be rebalanced by adjusting either the volume of the hedging instrument or the volume of the hedged item so that the hedge ratio aligns with the ratio used for risk management purposes. Any hedge ineffectiveness is calculated and accounted for in profit or loss at the time of the hedge relationship rebalancing.
(b) Fair value hedges that qualify for hedge accounting
Changes in fair value of the designated portion of derivatives that qualify as fair value hedges are recognised in profit or loss immediately, together with any changes in the fair value of the hedged asset or liability that are attributable to the hedged risk.
The change in the fair value of the designated portion of hedging instrument and the change in the hedged item attributable to the hedged risk are recognised in profit or loss in the line item relating to the hedged item.
Hedge accounting is discontinued when the hedging instrument expires or is sold, terminated, or exercised, or when it no longer qualifies for hedge accounting. The fair value adjustment to the carrying amount of the hedged item arising from the hedged risk is amortised to profit or loss from that date.
(c) Embedded derivatives
Derivatives embedded in a host contract that is an asset within the scope of Ind AS 109 are not separated. Financial assets with embedded derivatives are considered in their entirety when determining whether their cash flows are solely payment of principal and interest.
Derivatives embedded in all other host contract are separated only if the economic characteristics and risks of the embedded derivative are not closely related to the economic characteristics and risks of the host and are measured at fair value through profit or loss. Embedded derivatives closely related to the host contracts are not separated.
(iv) Derivatives that are not designated as hedges
The Company enters certain derivative contracts to hedge risk which are not designated as hedges. Such contracts are accounted for at fair value through profit or loss and are included in other gains/(losses).
(v) Impairment of financial assets
The Company assesses on a forward-looking basis the expected credit losses associated with its assets carried at amortised cost. The impairment methodology applied depends on whether there has been a significant increase in credit risk.
For trade receivables only, the Company applies the simplified approach permitted by Ind AS 109- ‘Financial Instruments’, which requires expected lifetime losses to be recognised from initial recognition of the receivables.
(vi) Derecognition of financial assets
A financial asset is derecognised only when:
• The Company has transferred the rights to receive cash flows from the financial asset or
• retains the contractual rights to receive the cash flows of the financial asset but assumes a contractual obligation to pay the cash flows to one or more recipients.
Where the entity has transferred an asset, the Company evaluates whether it has transferred substantially all risks and rewards of ownership of the financial asset. In such cases, the financial asset is derecognised. Where the entity has not transferred substantially all risks and rewards of ownership of the financial asset, the financial asset is not derecognised.
Where the entity has neither transferred a financial asset nor retains substantially all risks and rewards of ownership of the financial asset, the financial asset is derecognised if the Company has not retained control of the financial asset. Where the Company retains control of the financial asset, the asset is continued to be recognised to the extent of continuing involvement in the financial asset.
(m) Income recognition:
Interest income
Interest income from debt instruments is recognised using the effective interest rate method. The effective interest rate is the rate that exactly discounts estimated future cash receipts through the expected life of the financial asset to the gross carrying amount of a financial asset. When calculating the effective interest rate, the Company estimates the expected cash flows by considering all the contractual terms of the financial instrument (for example prepayment, extension, call and similar options) but does not consider the expected credit losses.
Dividend
Dividends are received from financial assets at fair value through profit or loss and at FVOCI. Dividends are recognised in profit or loss only when the right to receive payment is established, it is probable that the economic benefits associated with the dividend will flow to the Company, and the amount of the dividend can be measured reliably.
(n) Offsetting Financial Instruments:
Financial assets and liabilities are offset and the net amount reported in the balance sheet when there is a legally enforceable right to offset the recognised amounts and there is an intention to settle on a net basis or realise the asset and settle the liability simultaneously. The legally enforceable right must not be contingent on future events
86 Annual Report 2020-21 87• Corporate Overview • Statutory Reports • Financial StatementsN o t e s t o t h e F i n a n c i a l S t a t e m e n t sN a t i o n a l P e r o x i d e L i m i t e d

Notes to the Financial Statements as of and for the year ended March 31, 2021 (All amounts are in Indian Rupees lakhs, unless otherwise stated)
Notes to the Financial Statements as of and for the year ended March 31, 2021 (All amounts are in Indian Rupees lakhs, unless otherwise stated)
and must be enforceable in the normal course of business and in the event of default, insolvency or bankruptcy of the Company or the counterparty.
(o) Property, plant and equipment:
Freehold land is carried at historical cost. All other items of property, plant and equipment are stated at historical cost less depreciation and impairment, if any. Historical cost includes expenditure that is directly attributable to the acquisition of the items.
Subsequent costs are included in the asset’s carrying amount or recognised as a separate asset, as appropriate, only when it is probable that future economic benefits associated with the item will flow to the Company and the cost of the item can be measured reliably. The carrying amount of any component accounted for as a separate asset is derecognised when replaced. All other repairs and maintenance are charged to profit or loss during the reporting period in which they are incurred.
Expenditure incurred on assets which are not ready for their intended use comprising direct cost, related incidental expenses and attributable borrowing cost are disclosed under Capital Work-in-Progress.
Transition to Ind AS
On transition to Ind AS, the Company has elected to continue with the carrying value of all of its property, plant and equipment recognised as at April 1, 2016 measured as per the previous GAAP and use that carrying value as the deemed cost of the property, plant and equipment.
Depreciation methods, estimated useful lives and residual value:
Depreciation is calculated using Straight Line Method (SLM) to allocate their cost, net of their residual values, over their estimated useful lives. The useful lives have been determined based on technical evaluation done by the management, which is in line with those specified by Schedule II to the Companies Act, 2013.
An asset’s carrying amount is written down immediately to its recoverable amount if the asset’s carrying amount is greater than its estimated recoverable amount.
Gains and losses on disposals are determined by comparing proceeds with carrying amount. These are included in profit or loss within other gains / (losses).
The estimated useful lives of the property, plant and equipment are as under:
Sr No
Class of assets Estimated useful life
a Freehold Building 10 - 60 years
b Furniture & Fixtures 10 years
c Plant & Machinery 8 - 25 years
d Office Equipment 5 years
e Computer 3 years
f Vehicle 6 years
(p) Intangible assets:
Intangible assets being computer software, are stated at acquisition cost, net of accumulated amortization and accumulated impairment losses, if any.
Amortization is recognised on a straight-line basis over their estimated useful lives. The estimated useful life and amortization method are reviewed at the end of each reporting period, with the effect of any changes in estimate being accounted for on a prospective basis.
Gains or losses arising from the retirement or disposal of an intangible asset are determined as the difference between the disposal proceeds and the carrying amount of the asset and are recognised as income or expense in the Statement of Profit and Loss.
Cost of software is amortised over a period of 3 years being the estimated useful life.
(q) Trade and other payables:
These amounts represent liabilities for goods and services provided to the Company prior to the end of financial year which are unpaid. Trade and other payables are presented as current liabilities unless the payment is not due within 12 months of reporting period. Trade and other payables are initially recognized at fair value and subsequently measured at amortised cost using the effective interest method.
(r) Borrowings:
Borrowings are initially recognised at fair value, net of transaction costs incurred. Borrowings are subsequently measured at amortised cost. Any difference between the proceeds (net of transaction costs) and the redemption amount is recognised in profit or loss over the period of borrowings using the effective interest method. Fees paid on the establishment of loan facilities are recognised as transaction costs of the loan to the extent that it is probable that some or all of the facility will be drawn down. In this case, the fee is deferred until the draw down occurs. To the extent there is no evidence that it is probable that some or all of the facility will be drawn down, the fee is capitalised as a prepayment for liquidity services and amortised over the period of the facility to which it relates.
Borrowings are removed from the Balance Sheet when the obligation specified in the contract is discharged, cancelled or expired. The difference between the carrying amount of a financial liability that has been extinguished or transferred to another party and the consideration paid, including any non-cash assets transferred or liabilities assumed, is recognised in profit or loss as other gains / (losses).
Borrowings are classified as current liabilities unless the Company has an unconditional right to defer settlement of the liability for at least 12 months after the reporting period. Where there is a breach of a material provision of a long-term loan arrangement on or before the end of the reporting period with the effect that the liability becomes payable on demand on the reporting date, the Company does not classify the liability as current, if the lender agreed, after the reporting period and before the approval of the financial statements for issue, not to demand payment as a consequence of the breach.
(s) Borrowing costs:
General and specific borrowing costs that are directly attributable to the acquisition, construction or production of a qualifying asset are capitalised during the period of time that is required to complete and prepare the asset for its intended use or sale. Qualifying assets are assets that necessarily take a substantial period of time to get ready for their intended use or sale.
Investment income earned on the temporary investment of specific borrowings pending their expenditure on qualifying assets is deducted from the borrowing costs eligible for capitalisation.
Other borrowing costs are expensed in the period in which they are incurred.
88 Annual Report 2020-21 89• Corporate Overview • Statutory Reports • Financial StatementsN o t e s t o t h e F i n a n c i a l S t a t e m e n t sN a t i o n a l P e r o x i d e L i m i t e d

Notes to the Financial Statements as of and for the year ended March 31, 2021 (All amounts are in Indian Rupees lakhs, unless otherwise stated)
Notes to the Financial Statements as of and for the year ended March 31, 2021 (All amounts are in Indian Rupees lakhs, unless otherwise stated)
(t) Provisions and Contingent Liabilities:
Provisions
Provisions are recognised when the Company has a present legal or constructive obligation as a result of past events; it is probable that an outflow of resources will be required to settle the obligation; and the amount has been reliably estimated.
Provisions are measured at the present value of management’s best estimate of the expenditure required to settle the present obligation at the end of the reporting period. The discount rate used to determine the present value is a pre-tax rate that reflects current market assessments of the time value of money and the risks specific to the liability. The increase in the provision due to the passage of time is recognised as interest expense.
Contingent liabilities
Contingent liabilities are disclosed when there is a possible obligation arising from past events, the existence of which will be confirmed only by the occurrence or non-occurrence of one or more uncertain future events not wholly within the control of the Company. A present obligation that arises from past events where it is either not probable that an outflow of resources will be required to settle or reliable estimate of the amount cannot be made, is termed as contingent liability.
(u) Employee benefits:
(i) Short-term obligations
Liabilities for wages and salaries, including non-monetary benefits that are expected to be settled wholly within 12 months after the end of the period in which the employees render the related service are recognised in respect of employees’ services up to the end of the reporting period and are measured at the amounts expected to be paid when the liabilities are settled. The liabilities are presented as current employee benefit obligations in the balance sheet.
(ii) Post employee obligations
The Company operates the following post-employment schemes:
– defined benefit plans such as gratuity, pension and provident fund contributions made to a trust in case of certain employees
– defined contribution plans such as provident fund and superannuation fund.
Pension and gratuity obligations
The liability or asset recognised in the balance sheet in respect of defined benefit pension and gratuity plans is the present value of the defined benefit obligation at the end of the reporting period less the fair value of plan assets. The defined benefit obligation is calculated annually by actuaries using the projected unit credit method.
The present value of the defined benefit obligation is determined by discounting the estimated future cash outflows by reference to market yields at the end of the reporting period on government bonds that have terms approximating to the terms of the related obligation.
The net interest cost is calculated by applying the discount rate to the net balance of the defined benefit obligation and the fair value of plan assets. This cost is included in employee benefit expense in the Statement of Profit and Loss.
Remeasurement gains and losses arising from experience adjustments and changes in actuarial assumptions are recognised in the period in which they occur, directly in Other Comprehensive Income. They are included in Retained Earnings in the Statement of Changes in Equity and in the Balance Sheet.
Changes in the present value of the defined benefit obligation resulting from plan amendments or curtailments are recognised immediately in profit or loss as past service cost.
Provident fund contributions made to a trust administered by the Company
In respect of certain employees, provident fund contributions are made to a trust administered by the Company. The interest rate payable to the members of the trust shall not be lower than the statutory rate of interest declared by the Central Government under the Employees Provident Funds and Miscellaneous Provisions Act, 1952 and shortfall, if any, shall be made good by the Company. The liability in respect of the shortfall of the interest earnings of the fund is determined based on actuarial valuation.
Defined contribution plans
The Company pays provident fund contributions to publicly administered provident funds as per local regulations and superannuation contributions to superannuation fund. The Company has no further payment obligations once the contributions have been paid. The contributions are accounted for as defined contribution plans and the contributions are recognised as employee benefit expense when they are due.
(iii) Other long-term employee benefit obligations
The liabilities for earned leave and sick leave are not expected to be settled wholly within 12 months after the end of the period in which the employees render the related service. They are therefore measured as the present value of expected future payments to be made in respect of services provided by employees up to the end of the reporting period using the projected unit credit method. The benefits are discounted using the market yields at the end of the reporting period that have terms approximating to the terms of the related obligation. Remeasurements as a result of experience adjustments and changes in actuarial assumptions are recognised in Statement of Profit or Loss.
The obligations are presented as current liabilities in the balance sheet if the entity does not have an unconditional right to defer settlement for at least twelve months after the reporting period, regardless of when the actual settlement is expected to occur.
(v) Contributed equity:
Equity shares are classified as equity.
Incremental costs directly attributable to the issue of new shares or options are shown in equity as a deduction, net of tax from the proceeds.
(w) Earnings per share:
Basic earnings per share
Basic earnings per share is calculated by dividing:
– the profit attributable to owners of the Company
– by the weighted average number of equity shares outstanding during the financial year.
90 Annual Report 2020-21 91• Corporate Overview • Statutory Reports • Financial StatementsN o t e s t o t h e F i n a n c i a l S t a t e m e n t sN a t i o n a l P e r o x i d e L i m i t e d

Notes to the Financial Statements as of and for the year ended March 31, 2021 (All amounts are in Indian Rupees lakhs, unless otherwise stated)
Notes to the Financial Statements as of and for the year ended March 31, 2021 (All amounts are in Indian Rupees lakhs, unless otherwise stated)
Diluted earnings per share
Diluted earnings per share adjusts the figures used in the determination of basic earnings per share to take into account:
– the after-income tax effect of interest and other financing costs associated with dilutive potential equity shares, and
– the weighted average number of additional equity shares that would have been outstanding assuming the conversion of all dilutive potential equity shares.
(x) Exceptional Item:
If the management believes that losses are material and is relevant to an understanding of the entity’s financial performance, it discloses the same as an exceptional item.
(y) Rounding of Amounts:
All amounts disclosed in financial statements and notes have been rounded off to the nearest lakhs as per the requirement of Schedule III, unless otherwise stated.
3) Critical accounting estimates and judgements:
The preparation of financial statements requires the use of accounting estimates, which, by definition, will seldom equal the actual results. Management also needs to exercise judgement in applying the Company’s accounting policies. This note provides an overview of the areas that involved a higher degree of judgement or complexity, and of items, which are more likely to be materially adjusted due to estimates and assumptions turning out to be different from those originally assessed.
• Estimation of useful life
Useful lives of property, plant and equipment are based on the management’s estimation. The useful lives as estimated are same as prescribed in Schedule II of the Companies Act, 2013.
The useful lives of company’s assets are determined by management at the time the asset is acquired/capitalized and reviewed annually for appropriateness. The lives are based on historical experience with similar assets as well as anticipation of future events, which may impact their life such as changes in technology.
• Estimation of defined benefit obligation
The present value of obligations under defined benefit plan is determined using actuarial valuations. An actuarial valuation involves making various assumptions that may differ from actual development in the future. These include the determination of the discount rate, future salary escalations, attrition rate and mortality rates etc. Due to the complexities involved in the valuation and its long-term nature, these obligations are highly sensitive to changes in these assumptions. All assumptions are reviewed at each reporting date. Refer note 43 for the details of the assumptions used in estimating the defined benefit obligation.
• Impairment of trade receivables
The impairment provisions for trade receivables are based on assumptions about risk of default and expected loss rates. The Company uses judgement in making these assumptions and selecting the inputs to the impairment calculation, based on Company’s past history, existing market conditions as well as forward looking estimates at the end of each reporting period.
• Fair value measurements and valuation processes
Some of the assets and liabilities are measured at fair value for financial reporting purposes. The Management determines the appropriate valuation techniques and inputs for the fair value measurements.
In estimating the fair value of an asset or a liability, the Company uses market-observable data to the extent it is available. Where Level 1 inputs are not available, fair value are determined on the basis of the third-party valuations. The models used to determine fair values including estimates/ judgements involved are validated and periodically reviewed by the management. Refer note 36
• Inventory obsolescence
The Company writes down inventories to net realisable value based on an estimate of the realisability of inventories. Write downs on inventories are recorded where events or changes in circumstances indicate that the balances may not realised. The identification of write-downs requires the use of estimates of net selling prices of the down-graded inventories. Where the expectation is different from the original estimate, such difference will impact the carrying value of inventories and write-downs of inventories in the periods in which such estimate has been changed.
92 Annual Report 2020-21 93• Corporate Overview • Statutory Reports • Financial StatementsN o t e s t o t h e F i n a n c i a l S t a t e m e n t sN a t i o n a l P e r o x i d e L i m i t e d

Notes to the Financial Statements as of and for the year ended March 31, 2021 (All amounts are in Indian Rupees lakhs, unless otherwise stated)
Not
es to
the
Fina
ncia
l Sta
tem
ents
as
of a
nd fo
r the
yea
r end
ed M
arch
31,
2021
(A
ll am
ount
s ar
e in
Indi
an R
upee
s la
khs,
unl
ess
othe
rwis
e st
ated
)
Part
icul
ars
Free
hold
la
ndFr
eeho
ld
Build
ing
Plan
t and
eq
uipm
ent
Furn
itur
e an
d fi
xtur
es
Off
ice
equi
pmen
tV
ehic
les
RO
U
Veh
icle
Tota
lCa
pita
l w
ork-
in-
prog
ress
Gros
s bl
ock
Bala
nce
as a
t Apr
il 1,
201
95.
8933
7.53
18,8
04.6
155
.38
58.1
238
.46
–19
,299
.99
7,54
0.39
Tran
siti
on im
pact
on
acco
unt o
f Ind
AS
116
––
––
––
23.0
523
.05
–A
ddit
ions
––
15.19
76.9
023
.28
––
115.
3714
,382
.75
Dis
posa
ls–
––
–(0
.15)
–(0
.76)
(0.9
1)–
Tran
sfer
–66
3.40
20,8
80.7
10.
57–
––
21,5
44.6
8(2
1,544
.68)
Less
: Tra
nsfe
r to
Ass
et h
eld
for s
ale
––
––
––
––
(378
.46)
Bala
nce
as a
t Mar
ch 3
1, 2
020
5.89
1,00
0.93
39,7
00.5
113
2.85
81.2
538
.46
22.2
940
,982
.18
–A
ddit
ions
––
23.5
20.
3015
.06
––
38.8
831
9.73
Ass
ets
wri
tten
off
(Ref
er N
ote
52)
––
(461
.39)
––
––
(461
.39)
–D
ispo
sals
(Ref
er N
ote
50)
––
(1,12
1.49)
–(1
4.10
)–
–(1
,135.
59)
–Tr
ansf
er–
–67
.00
––
––
67.0
0(6
7.00
)Ba
lanc
e as
at M
arch
31,
202
15.
891,
000.
9338
,208
.15
133.
1582
.21
38.4
622
.29
39,4
91.0
825
2.73
Acc
umul
ated
dep
reci
atio
nBa
lanc
e as
at A
pril
1, 2
019
–11
8.96
2,56
1.14
17.9
121
.24
6.05
–2,
725.
30–
Char
ge fo
r the
yea
r–
42.3
61,0
20.15
9.09
13.5
86.
6811
.03
1,102
.89
–D
ispo
sals
––
––
(0.0
4)–
–(0
.04)
–Ba
lanc
e as
at M
arch
31,
202
0–
161.
323,
581.
2927
.00
34.7
812
.73
11.0
33,
828.
15–
Char
ge fo
r the
yea
r–
33.9
51,6
51.9
313
.03
16.15
6.68
8.28
1,730
.02
–Im
pair
men
t los
s (R
efer
Not
e 50
)–
–13
6.72
––
––
136.
72–
Ass
ets
wri
tten
off
(Ref
er N
ote
52)
––
(94.
16)
––
––
(94.
16)
–D
ispo
sals
(Ref
er N
ote
50)
––
(244
.52)
–(1
3.26
)–
–(2
57.7
8)–
Bala
nce
as a
t Mar
ch 3
1, 2
021
–19
5.27
5,03
1.26
40.0
337
.67
19.4
119
.31
5,34
2.95
–
Net
car
ryin
g am
ount
as
on M
arch
31,
202
05.
8983
9.61
36,1
19.2
210
5.85
46.4
725
.73
11.2
637
,154
.03
–N
et c
arry
ing
amou
nt a
s on
Mar
ch 3
1, 2
021
5.89
805.
6633
,176
.89
93.1
244
.54
19.0
52.
9834
,148
.13
252.
73
4 Pr
oper
ty, p
lant
and
equ
ipm
ent
Not
e:i)
Ref
er n
ote
49(i)
for d
iscl
osur
e of
con
trac
tual
com
mit
men
ts.
ii)
Add
itio
ns to
Cap
ital
wor
k in
pro
gres
s du
ring
the
year
incl
udes
H N
il (M
arch
31,
2020
H1,0
86.8
8 la
khs)
bor
row
ing
cost
cap
ital
ised
in a
ccor
danc
e w
ith
Indi
an
Acc
ount
ing
Stan
dard
s (In
d A
S) 2
3 on
“Bor
row
ing
cost
s”.
iii)
For d
etai
ls o
f Pro
pert
y, p
lant
and
equ
ipm
ent w
hich
are
ple
dged
as
secu
rity
for b
orro
win
gs -
Ref
er N
ote
20 N
on-c
urre
nt b
orro
win
gs a
nd N
ote
25 O
ther
cur
rent
fi
nanc
ial l
iabi
litie
siv
) Pl
ant a
nd e
quip
men
t inc
lude
s co
mpu
ters
gro
ss b
lock
H 1
34.3
lakh
s (M
arch
31,
2020
H12
6.62
lakh
s), a
ccum
ulat
ed d
epre
ciat
ion
H 8
0.55
lakh
s (M
arch
31,
2020
H 6
0.18
lakh
s) a
nd w
ritt
en d
own
valu
e H 5
3.75
lakh
s (M
arch
31,
2020
H 6
6.44
lakh
s).
4.1 Leases (As lessee)
(i) Carrying value of right of use assets at the year end by class
ParticularsFor year ended March 31, 2021
For year ended March 31, 2020
Opening Balance 12.12 23.05
Deletions – (0.94)
Finance cost incurred 0.69 1.59
Payment of lease liabilities (8.98) (11.58)
Closing Balance 3.83 12.12
Particulars As at
March 31, 2021 As at
March 31, 2020
Less than one year 3.83 8.33
One to five years – 3.79
More than five years – –
Total 3.83 12.12
Particulars As at
March 31, 2021 As at
March 31, 2020
Current lease liability (Current maturities of lease liabilities) 3.83 8.33
Non-current lease liability (Non-current financial liabilities - Other financial liabilities)
– 3.79
Total 3.83 12.12
Particulars Vehicles Total
Balance as of April 1, 2019 23.05 23.05Deletions (0.76) (0.76)
Depreciation (11.03) (11.03)
Balance as of March 31, 2020 11.26 11.26Depreciation (8.28) (8.28)
Balance as of March 31, 2021 2.98 2.98
(ii) The following is the break-up of lease liablity as at reporting date
(iii) The following is the movement of lease liablity during year ended March 31, 2021
(iv) The table below provides details regarding the contractual maturities of lease liabilities as at reporting date on an undiscounted basis:
95• Corporate Overview • Statutory Reports • Financial StatementsN o t e s t o t h e F i n a n c i a l S t a t e m e n t s94 Annual Report 2020-21
N a t i o n a l P e r o x i d e L i m i t e d

Notes to the Financial Statements as of and for the year ended March 31, 2021 (All amounts are in Indian Rupees lakhs, unless otherwise stated)
Notes to the Financial Statements as of and for the year ended March 31, 2021 (All amounts are in Indian Rupees lakhs, unless otherwise stated)
Particulars For year ended March 31, 2021
For year ended March 31, 2020
Interest on lease liability Refer Note 34 0.69 1.59
Expense relating to short-term leases and low value assets Refer Note 36 61.14 23.67
Depreciation Refer Note 35 8.28 11.03
70.11 36.29
4.1 Leases (Contd..)
(v) Amount recognized in statement of profit and loss
(vi) Total cash outflow for leases for the year ended March 31, 2021 was H 8.98 lakhs (March 31, 2020 H 11.58 lakhs).
(vii) There are no variable lease payments included in the measurement of lease liability.
(viii) Extension and termination options: Extension and termination options are included in the lease contracts of the Company. These are used to maximise operational flexibility in terms of managing the assets of the Company. All the extension and termination options held are exercisable both by the Company and the respective lessor.
5 Other intangible assets
Particulars Computer
Software Total
Gross blockBalance as at April 1, 2019 – –Additions 104.96 104.96
Disposals – –
Balance as at March 31, 2020 104.96 104.96Additions – –
Disposals – –
Balance as at March 31, 2021 104.96 104.96Accumulated amortizationBalance as at April 1, 2019 – –Charge for the year 19.94 19.94
Disposals – –
Balance as at March 31, 2020 19.94 19.94Charge for the year 19.94 19.94
Disposals – –
Balance as at March 31, 2021 39.88 39.88
Net carrying amount as on March 31, 2020 85.02 85.02Net carrying amount as on March 31, 2021 65.08 65.08
6 Non-current investments
Particulars As at
March 31, 2021 As at
March 31, 2020
Investments in equity instruments (fully paid up)Unquoted InvestmentInvestments in subsidiaries at cost
25,500 (March 31, 2020: 25,500) equity share of Naperol Investments Limited of H 100 each
25.50 25.50
10,000 (March 31, 2020: NIL) equity share of NPL Chemicals Limited of H 10 each (Refer Note 54)
1.00 –
Quoted InvestmentOther Investments at FVOCI
1,489,700 (March 31, 2020: 1,489,700) equity shares of The Bombay Dyeing & Manufacturing Company Limited of H 2 each
1,045.77 682.28
2,306,584 (March 31, 2020: 2,306,584) equity shares of The Bombay Burmah Trading Corporation Limited of H 2 each
25,612.31 16,895.73
600 (March 31, 2020: 600) equity shares of Housing Development Finance Corporation Limited of H 2 each
14.99 9.80
5,000 (March 31, 2020: 5,000) equity shares of HDFC Bank Limited of H 1 each 74.68 43.10
26,774.25 17,656.41Aggregate amount of quoted investments and market value thereof 26,747.75 17,630.91
Aggregate amount of unquoted investments; and 26.50 25.50
Aggregate amount of impairment in value of investments. – –
26,774.25 17,656.41
7 Non-current financial assets - Loans
8 Income tax assets (net)
Particulars As at
March 31, 2021 As at
March 31, 2020
(Unsecured, considered good)
Security deposits 43.16 21.40
43.16 21.40
Particulars As at
March 31, 2021 As at
March 31, 2020
Advance taxes [Net of provision for taxation H 17,921.70 lakhs (March 31, 2020: H 17,273.94 lakhs)]
606.43 313.03
606.43 313.03
96 Annual Report 2020-21 97• Corporate Overview • Statutory Reports • Financial StatementsN o t e s t o t h e F i n a n c i a l S t a t e m e n t sN a t i o n a l P e r o x i d e L i m i t e d

Notes to the Financial Statements as of and for the year ended March 31, 2021 (All amounts are in Indian Rupees lakhs, unless otherwise stated)
Notes to the Financial Statements as of and for the year ended March 31, 2021 (All amounts are in Indian Rupees lakhs, unless otherwise stated)
9 Other non-current assets
10 Inventories
11 Trade receivables
12 Cash and cash equivalents
Particulars As at
March 31, 2021 As at
March 31, 2020
(Unsecured, considered good)Prepayments 30.05 36.39Capital advances 21.32 –Balances with government authorities* 143.24 410.21Less : Provision for sales tax* (64.25) (64.25)
130.36 382.35
Particulars As at
March 31, 2021 As at
March 31, 2020
Trade receivables from contract with customersUnsecured, considered good 2,452.64 3,293.18Less: Loss allowance (68.30) (68.30)
2,384.34 3,224.88
Particulars As at
March 31, 2021 As at
March 31, 2020
Cash in hand 1.16 1.23Cheques on hand 49.38 148.00Balances with banks in current accounts 563.68 19.64Term deposit with original maturity period of less than three months 51.60 50.23
665.82 219.10
Particulars As at
March 31, 2021 As at
March 31, 2020
Raw materials and packing materials 463.63 1,083.65Finished goods 405.94 577.22Stores and spares* 825.54 779.35
1,695.11 2,440.22
* During the earlier years, the Company had provided H 64.25 lakhs towards sales tax matters based on estimation for probable liabilities arising out of pending disputes / liabilities with indirect tax authorities.
* Write-down of inventories to net realisable value amounted to H 0.33 lakhs (March 31, 2020 H 28.89 lakhs). These were recognised as an expense during the year and included in ‘Other expenses - Consumption of stores and spares’ in Statement of Profit and Loss.
14 Current financial assets - Loans
15 Other financial assets
Particulars As at
March 31, 2021 As at
March 31, 2020
(Unsecured, considered good)
Security deposits 26.85 34.07
Inter corporate deposit to related parties (Refer Note 42) 1,000.00 1,000.00
Inter corporate deposit to other companies 10,000.00 10,000.00
11,026.85 11,034.07
Particulars As at
March 31, 2021 As at
March 31, 2020
(Unsecured, considered good)
(I) Derivatives designated as hedges
Cross currency interest rate swap (CCIRS) – 675.54
(II) Others
Interest accrued on deposits – 222.73
– 898.27
The Company has, during the year, given Intercorporate Deposits (ICDs) to certain parties covered under section 189 of the Companies Act, 2013, viz. Bombay Dyeing and Manufacturing Company Limited H 5,000 lakhs (Previous Year H 16,500 lakhs) and Go Airlines (India) Limited H NIL lakhs (Previous Year H 10,000 lakhs ). These ICDs are for general business purpose and carry an interest rate of 11.5% p.a (Previous Year 10% p.a.) and have tenure for less than a year.
During the year, the Intercorporate Deposits (ICDs) have been repaid, viz. Macrofil Investments Co. Ltd H NIL (Previous Year H 3,000 lakhs), Bombay Dyeing and Manufacturing Company Limited H 5,000 lakhs (Previous Year H 16,500 lakhs) and Go Airlines (India) Limited H NIL (Previous Year H 20,000 lakhs).
13 Other bank balances
Particulars As at
March 31, 2021 As at
March 31, 2020
Unclaimed dividend accounts 69.10 73.86
69.10 73.86
98 Annual Report 2020-21 99• Corporate Overview • Statutory Reports • Financial StatementsN o t e s t o t h e F i n a n c i a l S t a t e m e n t sN a t i o n a l P e r o x i d e L i m i t e d

Notes to the Financial Statements as of and for the year ended March 31, 2021 (All amounts are in Indian Rupees lakhs, unless otherwise stated)
Notes to the Financial Statements as of and for the year ended March 31, 2021 (All amounts are in Indian Rupees lakhs, unless otherwise stated)
18 Equity share capital
16 Other current assets
Particulars Number of shares Amount
As at April 1, 2019Balance at the beginning of the year 5,747,000 574.70
Movement during the year – –
Balance as at March 31, 2020 5,747,000 574.70Movement during the year – –
Balance as at March 31, 2021 5,747,000 574.70
Particulars As at
March 31, 2021 As at
March 31, 2020
Authorised capital25,000,000 (March 31, 2020: 25,000,000) equity shares of H 10 each 2,500.00 2,500.00
2,500.00 2,500.00Issued, subscribed and fully paid-up5,747,000 (March 31, 2020: 5,747,000) equity shares of H 10 each share capital 574.70 574.70
574.70 574.70
Particulars As at
March 31, 2021 As at
March 31, 2020
(Unsecured, considered good)Advances to suppliers 36.45 67.48Advances for expenses 27.44 18.77Advance to gratuity fund – 18.21Prepayments 34.64 39.15Balances with government authorities 293.03 200.67
391.56 344.28
Notes:
a) Reconciliation of the number of equity shares outstanding at the beginning and at the end of the reporting period:
Equity shares
17 Asset held for sale
Particulars As at
March 31, 2021 As at
March 31, 2020
Capital work in progress (Refer Note 51) 201.51 378.46
201.51 378.46 Name of the shareholderAs at March 31, 2021 As at March 31, 2020
Number of shares
% holdingNumber of
shares% holding
Equity shares
Nowrosjee Wadia and Sons Limited 1,769,125 30.78% 1,769,125 30.78%
Macrofil Investments Limited 1,918,109 33.38% 1,918,109 33.38%
c) Shareholders holding more than 5% of equity shares of the Company:
18 Equity share capital(Contd..)
d) Rights, preferences and restrictions attached to equity shares:
The Company has one class of equity share having a par value of H10 per share. Each shareholder is eligible for one vote per share held. The dividend proposed by the Board of Directors is subject to the approval of the shareholders in the ensuing annual general meeting, except in case of interim dividend.
In the event of liquidation of the Company, the equity shareholders are eligible to receive the remaining assets of the Company, after distribution of all preferential amounts, in proportion to their shareholdings.
19 Other Equity
Particulars As at
March 31, 2021 As at
March 31, 2020
General reserve 3,284.50 3,284.50
Retained earnings 38,310.86 36,905.46
FVOCI - Equity instruments 16,846.77 7,985.22
FVOCI - Cash flow hedging reserves (175.17) (104.47)
58,266.96 48,070.71
ParticularsAs at March 31, 2021 As at March 31, 2020
Number of shares
% Number of
shares %
Ben Nevis Investments Limited, British Virgin Island, ultimate holding company
51,500 0.90 51,500 0.90
Nowrosjee Wadia and Sons Limited, holding company
1,769,125 30.78 1,769,125 30.78
Macrofil Investments Limited, subsidiary of holding company
1,918,109 33.38 1,918,109 33.38
b) Shares held by the holding company, ultimate holding company and subsidiary of holding company:
100 Annual Report 2020-21 101• Corporate Overview • Statutory Reports • Financial StatementsN o t e s t o t h e F i n a n c i a l S t a t e m e n t sN a t i o n a l P e r o x i d e L i m i t e d

Notes to the Financial Statements as of and for the year ended March 31, 2021 (All amounts are in Indian Rupees lakhs, unless otherwise stated)
Notes to the Financial Statements as of and for the year ended March 31, 2021 (All amounts are in Indian Rupees lakhs, unless otherwise stated)
19 Other Equity (Contd..)
20 Non-current borrowings
Particulars As at
March 31, 2021 As at
March 31, 2020
SecuredTerm loan from Bank
Foreign Currency Loan (USD) 11,546.87 15,681.55
11,546.87 15,681.55Less: Current maturities of long term debt (Refer note 25) (11,536.06) (15,670.83)
Less: Interest accrued (Refer note 25) (10.81) (10.72)
– –
General reserve
The Company has transferred a portion of the net profit of the Company before declaring dividend to general reserve pursuant to the earlier provisions of Companies Act, 1956. Mandatory transfer to general reserve is not required under the Companies Act, 2013.
Retained earnings
Retained earnings are the profits that the Company has earned till date, less any transfers to general reserve, dividends or other distributions paid to shareholders. Further, it also includes the impact of remeasurements of the defined benefit obligations, net of tax.
FVOCI - Equity instrument
The Company has elected to recognise changes in the fair value of certain investments in equity securities in other comprehensive income. These changes are accumulated within the FVOCI equity investments reserves within equity. The Company transfers amounts from this reserve to retained earnings when the relevant equity securities are derecognised.
FVOCI - Cash flow hedging reserve
Cash flow hedge reserve is used to recognise the effective portion of gains or losses on derivatives that qualify as cash flow hedges. Amount are subsequently reclassified to profit and loss as appropriate.
A) Details of securities, repayment and interest of term loan
I) Term of foreign currency loans from banks
The loan is repayable in 16 equal quarterly instalments of US $ 1,312,500 beginning from June 6, 2020 and the last quarterly installment being payable on February 27, 2024. This loan has a variable interest rate of 3 months USD-LIBOR-BBA plus 1.25% per annum payable on quarterly basis. The loan has a Put and Call Option at the end of second year from the date of drawdown (i.e. March 6, 2019) and annually therafter.
Nature of security
Secured by a first specific charge on entire movable fixed assets including plant and machinery of the Company located in Kalyan, Maharashtra.
20 Non-current borrowings (Contd..)
B) Net debt reconciliation
Particulars As at
March 31, 2021 As at
March 31, 2020
Cash and cash equivalent 665.82 219.10
Non-current borrowings (including current maturities of long term borrowings and interest accrued on borrowings)
(11,546.87) (15,681.55)
Current borrowings (941.83) (467.93)
Lease liabilities (3.83) (12.12)
Total (11,826.71) (15,942.50)
ParticularsCash and cash
equivalentNon-current
borrowingsCurrent
borrowingsLease
liabilitiesNet debt
Net debt as at April 1, 2019 1,076.68 (6,988.02) (1,000.00) – (6,911.34)
Transition to Ind AS 116 – – – (23.05) (23.05)
Cash flow (857.58) (7,785.38) 532.07 12.52 (8,098.37)
Interest expenses – (1,305.99) (22.09) (1.59) (1,329.67)
Interest paid – 1,314.27 22.09 – 1,336.36
Exchange loss – (916.43) – – (916.43)
Net debt as at March 31, 2020 219.10 (15,681.55) (467.93) (12.12) (15,942.50)Net debt as at April 1, 2020 219.10 (15,681.55) (467.93) (12.12) (15,942.50)Cash flow 446.72 3,395.26 (465.40) 8.98 3,385.56
Interest expenses – (1,172.36) (92.57) (0.69) (1,265.62)
Interest paid – 1,172.27 84.07 – 1,256.34
Exchange gain – 739.51 – – 739.51
Net debt as at March 31, 2021 665.82 (11,546.87) (941.83) (3.83) (11,826.71)
Particulars As at
March 31, 2021 As at
March 31, 2020
Derivatives designated as hedges
Cross currency interest rate swap (CCIRS) 137.47 –
Others
Lease liabilities – 3.79
137.47 3.79
21 Other non-current financial liabilities
102 Annual Report 2020-21 103• Corporate Overview • Statutory Reports • Financial StatementsN o t e s t o t h e F i n a n c i a l S t a t e m e n t sN a t i o n a l P e r o x i d e L i m i t e d

Notes to the Financial Statements as of and for the year ended March 31, 2021 (All amounts are in Indian Rupees lakhs, unless otherwise stated)
Notes to the Financial Statements as of and for the year ended March 31, 2021 (All amounts are in Indian Rupees lakhs, unless otherwise stated)
Particulars As at
March 31, 2021 As at
March 31, 2020
For employee benefits (refer note 43)
Provident fund – 19.75 Leave encashment and compensated absence 272.98 184.86 Pension 71.90 75.66
344.88 280.27
Particulars As at
March 31, 2021 As at
March 31, 2020
SecuredTerm loan:From other partiesWorking capital term loan (refer note a below) 933.33 –Other loan:Bank overdraft (refer note b below) – 467.93
933.33 467.93
22 Non-current Provisions
23 Current borrowings
Terms of repayment
a. Working capital term loan from Standard Chartered Investments and Loans (India) Limited (SCIIL), an NBFC, H 933.33 lakhs (March 31. 2020 H Nil). This facility carries interest rate of 10.90%. The loan is repayable in 9 monthly installments of H 133.33 lakhs starting from February 15, 2021.
b. Secured overdraft facility from bank of H Nil (March 31, 2020 H 467.93 lakhs). This facility carried an interest rate of MCLR plus margin. During the previous year, the interest rate ranges from 10.85% - 10.90%.
Nature of security
a. Working capital term loan from SCIIL is secured by first pari passu charge on current assets.
b. Overdraft facility secured by:
– First pari-passu charge on current assets, both present and future.
– Second pari passu charge on entire movable fixed assets including plant and machinery of the Company located in Kalyan, Maharashtra.
Particulars As at
March 31, 2021 As at
March 31, 2020
Dues to micro and small enterprises (refer note 47) 304.37 15.98
Dues to others 1,697.54 1,850.83
2,001.91 1,866.81
24 Trade payables
25 Other current financial liabilities
26 Other current liabilities
28 Income tax liabilities (net)
27 Current provisions
Particulars As at
March 31, 2021 As at
March 31, 2020
Current maturities of long-term borrowings 11,536.06 15,670.83
Interest accrued but not due on borrowings 19.31 10.72
Derivatives not designated as hedges:
– Foreign exchange forward contracts 0.46 –
Deposit received from customers 7.05 2.80
Capital creditors* 411.96 2,371.76
Current maturities of lease liabilities 3.83 8.33
Unpaid dividend 69.10 73.86
Payable to employees 467.49 404.69
12,515.26 18,542.99
Particulars As at
March 31, 2021 As at
March 31, 2020
For employee benefits (refer note 43)
Gratuity – 50.33
Leave encashment and compensated absence 103.84 105.15
Provident fund – 3.25
Pension 10.53 8.61
114.37 167.34
Particulars As at
March 31, 2021 As at
March 31, 2020
Statutory dues (including provident fund, tax deducted at source and others) 295.98 110.12
295.98 110.12
Particulars As at
March 31, 2021 As at
March 31, 2020
Provision for tax [Net of advance tax H Nil (March 31, 2020: H 352.11 lakhs)] – 165.35
– 165.35
* Including dues to micro and small enterprises for H 2.09 lakhs (March 31, 2020 - H 1.37 lakhs). (refer note 47)
104 Annual Report 2020-21 105• Corporate Overview • Statutory Reports • Financial StatementsN o t e s t o t h e F i n a n c i a l S t a t e m e n t sN a t i o n a l P e r o x i d e L i m i t e d

Notes to the Financial Statements as of and for the year ended March 31, 2021 (All amounts are in Indian Rupees lakhs, unless otherwise stated)
Notes to the Financial Statements as of and for the year ended March 31, 2021 (All amounts are in Indian Rupees lakhs, unless otherwise stated)
29 Revenue from operations
ParticularsFor the year ended
March 31, 2021For the year ended
March 31, 2020
Revenue from contracts with customers Manufactured goods 21,418.35 18,957.51
Traded goods – 100.03
Other operating income Sale of scrap 29.00 7.33
Total 21,447.35 19,064.87
Disclosure pursuant to Ind AS 115 - Revenue from Contracts with Customers.
(A) Revenue streams
ParticularsFor the year ended
March 31, 2021For the year ended
March 31, 2020
Sales of Goods/Income from operation 21,418.35 19,057.54
Other operating revenues 29.00 7.33
Sale of goods / income from operations 21,447.35 19,064.87
ParticularsFor the year ended
March 31, 2021For the year ended
March 31, 2020
Opening balance for loss allowance 68.30 38.15
Changes in allowance for expected credit loss:
Add : Loss allowance assessed for the current year – 30.15
Closing balance for loss allowance 68.30 68.30
(B) There are no material unsatisfied performance obligations for the year ended March 31, 2021 and March 31, 2020. Further, entire revenue is recognised at the point in time when the performance obligation is satisfied and control of the goods is transferred to the customer.
(C) Disaggregation of revenue from contracts with customers
In the following table, revenue from contracts with customers is disaggregated by primary geographical market
ParticularsFor the year ended
March 31, 2021For the year ended
March 31, 2020
Domestic 20,684.13 19,038.11
Exports 734.22 19.43
Sale of goods / income from operations 21,418.35 19,057.54
(D) Movement in expected credit loss during the year:
30 Other income
ParticularsFor the year ended
March 31, 2021For the year ended
March 31, 2020
Interest income on financial assets at amortised cost
On Inter corporate deposit 1,106.45 1,612.64
On fixed deposits 1.47 9.19
Other interest income 8.03 31.79
Dividend income from equity investments designated at FVOCI (Refer below) 30.78 35.49
Dividend income from other investments measured at FVTPL – 15.73
Fair value gain on investments (including gain on sale of investments) measured at FVTPL
35.00 21.56
Net foreign exchange gain 3.36 27.27
Miscellaneous income 92.87 41.43
1,277.96 1,795.10
ParticularsFor the year ended
March 31, 2021For the year ended
March 31, 2020
Opening balance of raw materials and packing materials 1,083.65 231.50
Add: Purchases made during the year 6,958.34 7,339.89
Less: Closing balance of raw materials and packing materials 463.63 1,083.65
7,578.36 6,487.74
All dividends from equity investments designated at FVOCI relate to investments held at the end of the reporting period. There was no dividend income relating to investments derecognised during the reporting period.
31 Cost of raw materials and packing materials consumed
ParticularsFor the year ended
March 31, 2021For the year ended
March 31, 2020
Revenue as per contract price 22,408.31 19,535.68
Less: Refund Liabilities - Sales Returns / Credits / Reversals 127.46 66.73
Less: Discounts and Rebates 862.50 411.41
Total 21,418.35 19,057.54
(E) Reconciliation of net sale of goods
29 Revenue from operations (Contd..)
(F) The entire amount of contract liability as of March 31, 2021 of H 106.08 lakhs (March 31, 2020 of H 46.91 lakhs) has been recognised as revenue during the current year.
(G) There are no significant changes in contract liabilities during the year ended March 31, 2021.
106 Annual Report 2020-21 107• Corporate Overview • Statutory Reports • Financial StatementsN o t e s t o t h e F i n a n c i a l S t a t e m e n t sN a t i o n a l P e r o x i d e L i m i t e d

Notes to the Financial Statements as of and for the year ended March 31, 2021 (All amounts are in Indian Rupees lakhs, unless otherwise stated)
Notes to the Financial Statements as of and for the year ended March 31, 2021 (All amounts are in Indian Rupees lakhs, unless otherwise stated)
ParticularsFor the year ended
March 31, 2021For the year ended
March 31, 2020
Opening balance 577.22 2,221.75
Less: Closing balance 405.94 577.22
171.28 1,644.53
32 Changes in inventories of finished goods
ParticularsFor the year ended
March 31, 2021For the year ended
March 31, 2020
Salaries, wages and bonus 2,097.45 2,138.31
Contribution to provident fund and other funds (refer note 43) 138.21 148.86
Provident fund benefits (refer note 43) 4.51 5.83
Gratuity (refer note 43) 56.42 51.80
Pension benefits (refer note 43) 7.62 11.57
Workmen and staff welfare expenses 254.24 277.12
2,558.45 2,633.49
33 Employee benefit expenses
ParticularsFor the year ended
March 31, 2021For the year ended
March 31, 2020
Interest and finance charges on lease liabilities and financial liabilities not at fair value through profit or loss
362.69 593.52
Fair value changes on cross currency interest rate swap designated as cash flow hedges - transferred from OCI
887.26 728.63
Other interest expense 15.67 38.41
Less: Interest capitalised * – (1,086.88)
1,265.62 273.68
34 Finance costs
* The capitalisation rate used to determine the amount of borrowing cost to be capitalised is the actual interest rate applicable to the entity during the previous year which is 8.55%
ParticularsFor the year ended
March 31, 2021For the year ended
March 31, 2020
Consumption of stores and spares 263.84 362.65Legal and professional fees 597.34 369.24Payment to auditors* (refer details below) 60.55 35.88Rates and taxes 32.81 58.95Repairs and maintenance– plant & machinery 573.66 753.74– building 3.68 2.45Freight charges 408.57 359.16Insurance charges 212.47 212.54Director Sitting Fees 52.50 43.50Corporate social responsibility expense (refer note 40) 280.00 306.00Director commission (refer note below) 24.20 (72.65)Rental Charges 61.14 23.67Loss allowance – 30.15Miscellaneous expenses 706.54 618.11
3,277.30 3,103.39
36 Other expenses
ParticularsFor the year ended
March 31, 2021For the year ended
March 31, 2020
Statutory audit fees 23.00 21.00
Limited review audit fees 14.50 13.50
Others 23.00 –
Reimbursement of out of pocket expenses 0.05 1.38
60.55 35.88
Note : During the year, the Company has paid commission of H 29 lakhs (March 31, 2020 H 129.25 lakhs) to non-executive directors against the provision of H 32.10 lakhs in March 31, 2020 (March 31, 2019 H 234 lakhs) and the excess provision of H 3.10 lakhs (March 31, 2020 H 104.75 lakhs) is written back.
*Payment to auditors
ParticularsFor the year ended
March 31, 2021For the year ended
March 31, 2020
Depreciation on property, plant and equipment (refer note 4) 1,721.74 1,091.86
Depreciation on right of use assets (refer note 4) 8.28 11.03
Amortisation of intangible assets (refer note 5) 19.94 19.94
1,749.96 1,122.83
35 Depreciation and amortisation expense
108 Annual Report 2020-21 109• Corporate Overview • Statutory Reports • Financial StatementsN o t e s t o t h e F i n a n c i a l S t a t e m e n t sN a t i o n a l P e r o x i d e L i m i t e d

Notes to the Financial Statements as of and for the year ended March 31, 2021 (All amounts are in Indian Rupees lakhs, unless otherwise stated)
Notes to the Financial Statements as of and for the year ended March 31, 2021 (All amounts are in Indian Rupees lakhs, unless otherwise stated)
37 Exceptional Items
ParticularsFor the year ended
March 31, 2021For the year ended
March 31, 2020
Loss on account of decommissioning of assets (Refer Note 50) 790.65 –
Loss on account of reassessment of fair value of assets (CWIP) held for sale (Refer Note 17 and 51)
173.86 –
Loss on account of breakdown of machinery (Refer Note 52) 584.79 –
1,549.30 –
38 Income tax
The major components of income tax expense for the years ended March 31, 2021 and March 31, 2020 are:
(a) Income tax recognised in statement of profit and loss
ParticularsFor the year ended
March 31, 2021For the year ended
March 31, 2020
Income tax expense(i) Current tax expense 121.97 506.14
Adjustment in respect of current tax of previous years – 23.95
Total current tax expense 121.97 530.09(ii) Deferred tax expense Decrease (increase) in deferred tax assets 669.83 (649.36)
(Decrease) increase in deferred tax liabilities (1,693.33) 1,282.23
Total deferred tax expense (1,023.50) 632.87Total Income tax expense (901.53) 1,162.96
ParticularsFor the year ended
March 31, 2021For the year ended
March 31, 2020
Income tax expense(i) Current tax benefit expense Remeasurement of defined benefit obligation (8.33) (11.32)
Total current tax benefit (8.33) (11.32)(ii) Deferred tax expense Remeasurement of defined benefit obligation (6.03) 9.24
Financial asset measured at FVOCI (252.50) (85.72)
Total deferred tax expense (258.53) (76.48)Total Income tax expense (266.86) (87.80)
(b) Income tax recognised in other comprehensive income
(c) Reconciliation of effective tax rate:
ParticularsFor the year ended
March 31, 2021For the year ended
March 31, 2020
Profit before tax 1,179.55 2,899.58
Tax at the Indian applicable tax rate 25.17% (March 31, 2020: 29.12%) 296.87 844.36
Tax effect of amounts which are not deductible / (taxable) in calculating taxable income:
Expenses that are not deductible in determining taxable profit 107.64 115.45
Income exempt from income tax – (14.92)
Change in income tax rates (1,306.04) 194.12
Adjustments for current tax of previous years – 23.95
Income tax expense (901.53) 1,162.96
ParticularsAs at
March 31, 2021 As at
March 31, 2020
Deferred tax liabilities 3,371.39 4,809.42
Less: deferred tax assets 207.90 880.96
Deferred tax liability (net) 3,163.49 3,928.46
(d) Tax assets
(e) Movement in deferred tax liabilities
ParticularsAs at
March 31, 2021 As at
March 31, 2020
Opening balance 147.68 (355.08)
Add: Taxes paid 589.05 1,044.17
Less: Current tax payable for the year 130.30 541.41
Closing balance 606.43 147.68Current tax assets 606.43 313.03Current tax liabilities – 165.35
38 Income tax (Contd..)
110 Annual Report 2020-21 111• Corporate Overview • Statutory Reports • Financial StatementsN o t e s t o t h e F i n a n c i a l S t a t e m e n t sN a t i o n a l P e r o x i d e L i m i t e d

Notes to the Financial Statements as of and for the year ended March 31, 2021 (All amounts are in Indian Rupees lakhs, unless otherwise stated)
Notes to the Financial Statements as of and for the year ended March 31, 2021 (All amounts are in Indian Rupees lakhs, unless otherwise stated)
March 31, 2021As at
March 31, 2020 Recognised in
Profit and LossRecognised in
OCIAs at
March 31, 2021
Property, plant and equipment 4,809.42 (1,693.33) – 3,116.09
Financial asset measured at FVOCI – – 255.30 255.30
Total deferred tax liabilities 4,809.42 (1,693.33) 255.30 3,371.39Provision for post retirement benefits and other employee benefits
139.71 (18.05) (6.03) 115.63
Loss allowance 23.02 (5.83) – 17.19
Provision for sales tax 22.45 (6.28) – 16.17
Loss on cash flow hedging reserve 56.11 – 2.80 58.91
Business loss 122.21 (122.21) – –
MAT credit entitlement 517.46 (517.46) – –
Total deferred tax assets 880.96 (669.83) (3.23) 207.90Deferred tax liability (net) 3,928.46 (1,023.50) 258.53 3,163.49
Movement of deferred tax balances
38 Income tax (Contd..)
March 31, 2020As at
March 31, 2019 Recognised in
Profit and LossRecognised in
OCIAs at
March 31, 2020
Property, plant and equipment 3,526.28 1,283.14 – 4,809.42
Financial asset measured at FVTPL 0.91 (0.91) – –
Financial asset measured at FVOCI 0.92 – (0.92) –
Total deferred tax liabilities 3,528.11 1,282.23 (0.92) 4,809.42Provision for post retirement benefits and other employee benefits
130.47 – 9.24 139.71
Loss allowance 13.33 9.69 – 23.02
Provision for sales tax 22.45 – – 22.45
Loss on cash flow hedging reserve 142.75 – (86.64) 56.11
Business loss – 122.21 – 122.21
MAT credit entitlement – 517.46 – 517.46
Total deferred tax assets 309.00 649.36 (77.40) 880.96Deferred tax liability (net) 3,219.11 632.87 76.48 3,928.46
Deferred tax asset of H Nil (Previous Year: H 212.09 lakhs) on unused tax losses of H Nil (Previous Year: H 1,820.50 lakhs) in relation to fair valuation of equity shares has not been created as currently, the Company is uncertain to generate sufficient taxable capital gain in forseeable future.
ParticularsFor the year ended
March 31, 2021For the year ended
March 31, 2020
Basic and diluted earnings per shareProfit for the year (H in lakhs) 2,081.08 1,736.62
Weighted average number of shares 5,747,000 5,747,000
Basic and diluted earnings per share (H) 36.21 30.22
Face value per share (H) 10.00 10.00
ParticularsFor the year ended
March 31, 2021For the year ended
March 31, 2020
Gross amount required to spent during the year 273.00 306.00
Amount spent during the year 280.00 306.00
Excess Spent during the year 7.00 –
ParticularsFor the year ended
March 31, 2021For the year ended
March 31, 2020
(i) Contribution to Sir Ness Wadia Foundation 126.00 119.25
(ii) Contribution to Nowrosjee Wadia Maternity Hospital 47.00 69.00
(iii) Contribution to Bai Jerbai Wadia Hospital for Children 70.00 117.75
(iv) Contribution to Mumbai Police Foundation 27.00 –
(v) Contribution to Smile Foundation 10.00 –
280.00 306.00
39 Earning per share
40 Corporate social responsibility (“CSR”)
Expenditure on corporate social responsibility:
ParticularsFor the year ended
March 31, 2021For the year ended
March 31, 2020
(i) Construction / acquisition of any asset – –
(ii) On purpose other than (i) above 280.00 306.00
280.00 306.00
Amount spent during the year on:
112 Annual Report 2020-21 113• Corporate Overview • Statutory Reports • Financial StatementsN o t e s t o t h e F i n a n c i a l S t a t e m e n t sN a t i o n a l P e r o x i d e L i m i t e d

Notes to the Financial Statements as of and for the year ended March 31, 2021 (All amounts are in Indian Rupees lakhs, unless otherwise stated)
Notes to the Financial Statements as of and for the year ended March 31, 2021 (All amounts are in Indian Rupees lakhs, unless otherwise stated)
Revenue March 31, 2021 March 31, 2020
Within India 20,713.13 19,045.44
Outside India 734.22 19.43
Total Revenue 21,447.35 19,064.87
41 Segment information
The CEO & Director reviews the Company’s performance. Presently, the Company is engaged in only one segment viz ‘Manufacturing of peroxygens’ and as such there is no separate reportable segment as per Ind AS 108 ‘Operating Segments’.
Information about geographical areas
There are no non-current assets other than financial instruments outside India.
Information about major customers
Customers include private distribution entities. No single customer of the Company accounts for 10% or more of total revenue.
42 Related party disclosures
In accordance with Ind AS-24 “Related Party Disclosures” of the Companies (Accounts) Rules 2015, as amended time to time and the Companies Act, 2013, the names of related parties along with aggregate amount of transactions and year end balances with them are given as follows:
(i) Enterprises exercising control:
Ultimate holding entity - Ben Nevis Investments Limited (Refer note 18)
Parent entity - Nowrosjee Wadia and Sons Limited (Refer note 18)
(ii) Enterprises where control exists:
Subsidiary company- Naperol Investments Limited
Subsidiary company - NPL Chemicals Limited (w.e.f. July 29, 2020)
(iii) Key managerial personnel
Mr. Rajiv Arora, Chief Executive Officer & Director (w.e.f. June 4, 2020 )
Mr. Suresh Khurana, Chief Executive Officer and Director (upto June 4, 2020)
Non-executive directors
Mr. Ness N. Wadia - Chairman
Dr (Mrs.) Minnie Bodhanwala
Independent directors
Mr. Rajesh Batra
Mr. S. Ragothaman
Mr. Viraf Mehta
Mrs. Harshbeena Zaveri
(iv) Enterprises controlled by the parent entity and with whom transactions were carried out during the year
Wadia Techno-Engineering Services Limited
Macrofil Investments Limited
(v) Enterprises which is associate of parent entity and with whom transactions were carried out during the year
The Bombay Burmah Trading Corporation Limited
(vi) Employee benefits plans and with whom transactions were carried on during the year
National Peroxide Limited Employees’ Provident Fund
National Peroxide Limited Employees’ Gratuity Fund
The following transactions were carried out with related parties during the year in the ordinary course of business:
42 Related party disclosures (Contd..)
ParticularsFor the year ended
March 31, 2021For the year ended
March 31, 2020
Inter corporate deposit given
Wadia Techno-Engineering Services Limited 500.00 650.00
Repayment of Inter corporate deposit given
Wadia Techno-Engineering Services Limited 500.00 500.00
Macrofil Investments Ltd – 3,000.00
Investments made
The Bombay Burmah Trading Corporation Limited – 9,543.86
NPL Chemicals Limited 1.00 –
Interest income on intercorporate deposit
Wadia Techno-Engineering Services Limited 107.26 94.81
Macrofil Investments Limited – 123.77
Dividend income
The Bombay Burmah Trading Corporation Limited 27.68 12.52
Miscellaneous Income
The Bombay Burmah Trading Corporation Limited 22.00 –
Miscellaneous Expenses
Nowrosjee Wadia and Sons Limited 75.12 62.92
Reimbursement of expenses
Nowrosjee Wadia and Sons Limited 5.82 63.01
114 Annual Report 2020-21 115• Corporate Overview • Statutory Reports • Financial StatementsN o t e s t o t h e F i n a n c i a l S t a t e m e n t sN a t i o n a l P e r o x i d e L i m i t e d

Notes to the Financial Statements as of and for the year ended March 31, 2021 (All amounts are in Indian Rupees lakhs, unless otherwise stated)
Notes to the Financial Statements as of and for the year ended March 31, 2021 (All amounts are in Indian Rupees lakhs, unless otherwise stated)
42 Related party disclosures (Contd..)
ParticularsFor the year ended
March 31, 2021For the year ended
March 31, 2020
Recovery of expensesNaperol Investments Limited 8.93 –
NPL Chemicals Limited 0.05 –
Expenditure on CSRSir Ness Wadia Foundation 126.00 119.25
Nowrosjee Wadia Maternity Hospital 47.00 69.00
Bai Jerbai Wadia Hospital for Children 70.00 117.75
Compensation to key managerial personnelMr. Rajeev AroraShort term employee benefits 170.22 –
Post employment benefits** 9.41 –
Mr. Suresh KhuranaShort term employee benefits 46.45 209.01
Post employment benefits** 3.10 17.42
Total 229.18 226.43 ** As the liabilities for defined benefit plans are provided on actuarial basis for the Company the amounts pertaining to Key Managerial Personnel are not included.
Commission to Non-Executive Directors# 27.30 32.10# During the year, the Company has paid commission of H 29 lakhs (March 31, 2020 H 129.25 lakhs) to non-executive directors against the provision of H 32.10 lakhs in March 31, 2020 (March 31, 2019 H 234 lakhs) and the excess provision of H 3.10 lakhs (March 31, 2020 H 104.75 lakhs) is written back.
Director Sitting fees to Non-Executive Directors 52.50 43.50
Contribution to employee benefit plansNational Peroxide Limited Employees’ Provident Fund 4.51 5.83
National Peroxide Limited Employees’ Gratuity Fund 73.66 –
Balances outstanding at year end:
ParticularsFor the year ended
March 31, 2021For the year ended
March 31, 2020
Intercorporate deposits to related partyWadia Techno-Engineering Services Limited 1,000.00 1,000.00
Interest accrued but not due on depositsWadia Techno-Engineering Services Limited – 24.86
42 Related party disclosures (Contd..)
ParticularsFor the year ended
March 31, 2021For the year ended
March 31, 2020
InvestmentsNaperol Investments Limited 25.50 25.50
The Bombay Burmah Trading Corporation Limited 25,612.31 16,895.73
NPL Chemicals Limited 1.00 –
Other Current AssetsThe Bombay Burmah Trading Corporation Limited 25.96 –
Naperol Investments Limited 8.93 –
NPL Chemicals Limited 0.05 –
Trade PayablesNowrosjee Wadia and Sons Limited – 15.34
Contributions MadeNational Peroxide Limited Employees’ Provident Fund 629.91 605.04
National Peroxide Limited Employees’ Gratuity Fund 1,216.03 1,229.80
Payable to Key managerial personnelMr. Suresh Khurana 28.15 68.55
Mr. Rajiv Arora 45.15 –
Balances outstanding at year end: (Contd..)
43 Employee benefit obligations
The Company has classified various employee benefits as under:
(a) Leave Obligations
The leave obligations cover the Company’s liability for sick and privileged leave
Provision for leave encashmentAs at
March 31, 2021As at
March 31, 2020
Current 103.84 105.15
Non-current 272.98 184.86
(b) Defined Contribution Plan(i) Provident fund
(ii) Superannuation fund
The Company has recognised the following amounts in the Statement of Profit and Loss for the year:
(i) Contribution to provident fund 112.30 120.46
(ii) Contribution to superannuation fund 25.91 28.40
116 Annual Report 2020-21 117• Corporate Overview • Statutory Reports • Financial StatementsN o t e s t o t h e F i n a n c i a l S t a t e m e n t sN a t i o n a l P e r o x i d e L i m i t e d

Notes to the Financial Statements as of and for the year ended March 31, 2021 (All amounts are in Indian Rupees lakhs, unless otherwise stated)
Notes to the Financial Statements as of and for the year ended March 31, 2021 (All amounts are in Indian Rupees lakhs, unless otherwise stated)
As at March 31, 2021
As at March 31, 2020
Discount rate (per annum) 6.35% 6.10%
Salary escalation rate
-For management employees 8.00% 8.00%
-For other employees 8.00% 8.00%
Mortality rate Indian Assured Lives Mortality
(2012-14) Ult table
Indian Assured Lives Mortality
(2012-14) Ult table
43 Employee benefit obligations (Contd..) (c) Post employment obligations
Gratuity
The Company has a defined benefit plan, governed by the Payment of Gratuity Act, 1972. The plan entitles an employee, who has rendered at least five years of continuous service, to gratuity at the rate of fifteen days basic salary for every completed years of services or part thereof in excess of six months, based on the rate of basic salary last drawn by the employee concerned.
(i) Significant estimates: actuarial assumptions
Valuations in respect of gratuity have been carried out by an independent actuary, as at the Balance Sheet date
The estimates of salary escalation rate considered in actuarial valuation, takes into account inflation, seniority, promotion and other relevant factors including supply and demand in the employment market.
(ii) Gratuity Plan
The amounts recognised in the balance sheet and the movements in the net defined benefit obligation over the year are as follows:
ParticularsPresent value
of obligationFair value of
plan assetsNet amount
As at April 1, 2020 1,280.13 (1,229.80) 50.33
Current service cost 56.40 – 56.40
Interest expense / (income) 57.66 (57.64) 0.02
Total amount recognised in profit and loss 114.06 (57.64) 56.42Remeasurements Return on plan assets, excluding amount included in
interest expense / (income)– (13.73) (13.73)
(Gain) / loss from change in financial assumptions (10.24) – (10.24)
(Gain) / loss from change in demographic assumptions – – –
Experience (gains) / losses (9.12) – (9.12)
Total amount recognised in other comprehensive income (19.36) (13.73) (33.09)Employer contributions – (73.66) (73.66)
Benefits payments (158.81) 158.81 –
As at March 31, 2021 1,216.02 (1,216.02) –
ParticularsPresent value
of obligationFair value of
plan assetsNet amount
As at April 1, 2019 1,185.89 (1,154.96) 30.93Current service cost 53.26 – 53.26
Interest expense / (income) 72.31 (73.77) (1.46)
Total amount recognised in profit and loss 125.57 (73.77) 51.80Remeasurements Return on plan assets, excluding amount included in
interest expense / (income)– (49.50) (49.50)
(Gain) / loss from change in financial assumptions 64.97 – 64.97
(Gain) / loss from change in demographic assumptions – – –
Experience (gains) / losses (47.87) – (47.87)
Total amount recognised in other comprehensive income 17.10 (49.50) (32.40)Employer contributions – – –
Benefits payments (48.43) 48.43 –
As at March 31, 2020 1,280.13 (1,229.80) 50.33
The net liability disclosed above relates to funded plans are as follows:
As at March 31, 2021
As at March 31, 2020
Present value of funded obligations 1,216.02 1,280.13
Fair value of plan assets (1,216.02) (1,229.80)
Deficit of gratuity plan – 50.33Current portion – 50.33
Non-current portion – –
(iii) Sensitivity analysis
Significant estimates: Sensitivity of actuarial assumptions
The sensitivity of the provision for defined benefit obligation to changes in the weighted principal assumptions is:
Provision for leave encashment
Impact on defined benefit obligation
Change in assumption Increase in assumption Decrease in assumption
March 31, 2021
March 31, 2020
March 31, 2021
March 31, 2020
March 31, 2021
March 31, 2020
Discount rate 0.50% 0.50% -1.66% -1.73% 1.76% 1.82%
Salary escalation rate 0.50% 0.50% 1.68% 1.76% -1.60% -1.70%
43 Employee benefit obligations (Contd..)
118 Annual Report 2020-21 119• Corporate Overview • Statutory Reports • Financial StatementsN o t e s t o t h e F i n a n c i a l S t a t e m e n t sN a t i o n a l P e r o x i d e L i m i t e d

Notes to the Financial Statements as of and for the year ended March 31, 2021 (All amounts are in Indian Rupees lakhs, unless otherwise stated)
Notes to the Financial Statements as of and for the year ended March 31, 2021 (All amounts are in Indian Rupees lakhs, unless otherwise stated)
43 Employee benefit obligations (Contd..)
Particulars Present value of obligation
Investment risk: The present value of the defined benefit liability is calculated using a discount rate which is determined by reference to market yields at the end of the reporting period on government bonds.If the return on plan asset is below this rate, it will create a plan deficit. Currently, for the plan in india, it has a relatively balanced mix of investments in govenment securities, and other debt instruments.
Interest risk: A fall in the discount rate which is linked to the G. Sec. Rate will increase the present value of the liability requiring higher provision. A fall in the discount rate generally increase the mark to market value of the assets depending on the duration of asset.
Salary risk: The present value of the defined benefit liability is calculated by reference to the future salaries of plan participants. As such, an increase in salary of the plan participants will increase the plan’s liability.
The above sensitivity analysis are based on a change in an assumption while holding all other assumptions constant. In practice, this is unlikely to occur, and changes in some of the assumptions may be correlated. While calculating the sensitivity of the defined benefit obligation to significant actuarial assumptions the same method (present value of the defined benefit obligation calculated with the projected unit credit method at the end of the reporting period) has been applied as when calculating the defined benefit liability recognised in the balance sheet.
The methods and types of assumptions used in preparing the sensitivity analysis did not change compared to the prior period.
(iv) The above defined benefit gratuity plan was administrated 100% by a trust as at March 31, 2021 and March 31, 2020.
(v) Defined benefit liability and employer contributions
The Company will pay demand raised by the trust towards gratuity liability on time to time basis to eliminate the deficit in defined benefit plan.
The weighted average duration of the defined benefit obligation is 4.26 years (March 31, 2020 – 4.35 years).
(vi) Risk exposure
Aforesaid post-employment benefit plans typically expose the Company to acturial risks such as: Investment risk, interest rate risk, and salary risk.
(vii) Category of plan asset
As at March 31, 2021 As at March 31, 2020
Amount in % Amount in %
Government debt instruments 420.00 35% 325.08 26%
Other debt instruments 621.88 51% 554.29 45%
Insurer managed funds - - - -
Others 174.14 14% 350.44 28%
Total 1,216.02 100% 1,229.81 100%
(viii) Projectedcashflow
As at March 31, 2021
As at March 31, 2020
Less than a year 553.92 669.75
Between 1-2 years 84.32 29.48
Between 2-5 years 329.69 320.88
Between 5-9 years 245.94 343.18
10 years and above 366.93 330.51
43 Employee benefit obligations (Contd..)
Pension
The Company operates a defined benefit pension plan. The pension benefits payable to the employees are based on the employee’s service and last drawn salary at the time of leaving. The employees do not contribute towards this plan and the full cost of providing these benefits are met by the Company. The Company does not contribute annually to any trust or a fund towards the liability under the plan, this plan is unfunded.
(i) Significant estimates: actuarial assumptions
Valuations in respect of pension have been carried out by an independent actuary, as at the Balance Sheet date
Discount rate (per annum) 6.35% 6.10%
Salary escalation rate 8.00% 8.00%
Pension increase rate - -
Present value of obligation
As at April 1, 2020 84.27Current service cost 2.74
Interest expense / (income) 4.88
Total amount recognised in profit and loss 7.62Remeasurements (Gain) / loss from change in financial assumptions (1.06)
(Gain) / loss from change in demographic assumptions –
Experience (gains) / losses 0.09
Total amount recognised in other comprehensive income (0.97)Benefits payment (8.48)
As at March 31, 2021 82.43
(ii) Pension Plan
120 Annual Report 2020-21 121• Corporate Overview • Statutory Reports • Financial StatementsN o t e s t o t h e F i n a n c i a l S t a t e m e n t sN a t i o n a l P e r o x i d e L i m i t e d

Notes to the Financial Statements as of and for the year ended March 31, 2021 (All amounts are in Indian Rupees lakhs, unless otherwise stated)
Notes to the Financial Statements as of and for the year ended March 31, 2021 (All amounts are in Indian Rupees lakhs, unless otherwise stated)
43 Employee benefit obligations (Contd..)
Present value of obligation
As at April 1, 2019 77.94Current service cost 5.94
Interest expense / (income) 5.63
Total amount recognised in profit and loss 11.57Remeasurements (Gain) / loss from change in financial assumptions 6.28
(Gain) / loss from change in demographic assumptions –
Experience (gains) / losses (2.85)
Total amount recognised in other comprehensive income 3.43Benefits payment (8.67)
As at March 31, 2020 84.27
The net liability disclosed above relates to funded plans are as follows:
As at March 31, 2021
As at March 31, 2020
Present value of funded obligations 82.43 84.27
Deficit of pension plan 82.43 84.27Current portion 10.53 8.61
Non-current portion 71.90 75.66
Impact on defined benefit obligation
Change in assumptions Increase in assumptions Decrease in assumptions
March 31, 2021
March 31, 2020
March 31, 2021
March 31, 2020
March 31, 2021
March 31, 2020
Discount rate 0.50% 0.50% –2.48% –2.61% 2.62% 2.75%
(iii) Sensitivity analysis
The sensitivity of the provision for defined benefit obligation to changes in the weighted principal assumptions is:
The above sensitivity analysis is based on a change in an assumption while holding all other assumptions constant.In practice, this is unlikely to occur, and changes in some of the assumptions may be correlated. While calculating the sensitivity of the defined benefit obligation to significant actuarial assumptions the same method (present value of the defined benefit obligation calculated with the projected unit credit method at the end of the reporting period) has been applied as when calculating the defined benefit liability recognised in the balance sheet.
The methods and types of assumptions used in preparing the sensitivity analysis did not change compared to the prior period.
43 Employee benefit obligations (Contd..)
Particulars Present value of obligation
Investment risk: The present value of the defined benefit liability is calculated using a discount rate which is determined by reference to market yields at the end of the reporting period on government bonds.If the return on plan asset is below this rate, it will create a plan deficit. Currently, for the plan in india, it has a relatively balanced mix of investments in govenment securities, and other debt instruments.
Interest risk: A fall in the discount rate which is linked to the G. Sec. Rate will increase the present value of the liability requiring higher provision. A fall in the discount rate generally increase the mark to market value of the assets depending on the duration of asset.
Salary risk: The present value of the defined benefit liability is calculated by reference to the future salaries of plan participants. As such, an increase in salary of the plan participants will increase the plan’s liability.
(vi) Risk exposure
Aforesaid post-employment benefit plans typically expose the Company to acturial risks such as: Investment risk, interest rate risk, and salary risk.
Provision for leave encashmentAs at
March 31, 2021As at
March 31, 2020
Less than a year 10.53 8.61
Between 1-2 years 8.81 10.39
Between 2-5 years 29.29 27.58
Between 5-9 years 35.44 36.41
10 years and above 38.25 41.79
(v) Defined benefit liability and employer contributions
The weighted average duration of the defined benefit obligation is 5.10 years (March 31, 2020 – 5.36 years).
(vi) Projectedcashflow
Provident Fund
In respect of certain employees, provident fund contributions are made to a trust administered by the Company. The interest rate payable to the members of the trust shall not be lower than the statutory rate of interest declared by the Central Government under the Employees Provident Funds and Miscellaneous Provisions Act, 1952 and shortfall, if any, shall be made good by the Company. The liability in respect of the shortfall of interest earnings of the Fund is determined on the basis of an actuarial valuation.
Company measures its liability towards provident fund through actuarial valuation using ‘projected credit unit method’. In case of net assets, assets are recognised to the extent of liability only.
(i) Significant estimates: actuarial assumptions
Valuations in respect of provident fund have been carried out by an independent actuary, as at the Balance Sheet date
ParticularsAs at
March 31, 2021As at
March 31, 2020
Discount rate (per annum) 6.35% 6.10%
122 Annual Report 2020-21 123• Corporate Overview • Statutory Reports • Financial StatementsN o t e s t o t h e F i n a n c i a l S t a t e m e n t sN a t i o n a l P e r o x i d e L i m i t e d

Notes to the Financial Statements as of and for the year ended March 31, 2021 (All amounts are in Indian Rupees lakhs, unless otherwise stated)
Notes to the Financial Statements as of and for the year ended March 31, 2021 (All amounts are in Indian Rupees lakhs, unless otherwise stated)
43 Employee benefit obligations (Contd..)
ParticularsPresent value
of obligationFair value of
plan assetsNet amount
As at April 1, 2020 628.04 (605.04) 23.00Current service cost 4.51 – 4.51
Interest expense / (income) 37.22 (37.22) –
Interest on net defined benefit liability / assets 41.73 (37.22) 4.51RemeasurementsReturn on plan assets, excluding amount included in interest expense / (income)
– (22.87) (22.87)
(Gain) / loss from change in financial assumptions (9.01) – (9.01)
(Gain) / loss from change in demographic assumptions – – –
Experience (gains) / losses 8.88 – 8.88
Total amount recognised in other comprehensive income (0.13) (22.87) (23.00)Employer’s contributions – (4.51) (4.51)
Employee’s contributions 4.96 (4.96) –
Benefits payment (44.69) 44.69 –
As at March 31, 2021 629.91 (629.91) –
(ii) Provident fund plan
ParticularsPresent value
of obligationFair value of
plan assetsNet amount
As at April 1, 2019 612.71 (612.71) –Current service cost 5.83 – 5.83
Interest expense / (income) 44.51 (44.51) –
Interest on net defined benefit liability / assets 50.34 (44.51) 5.83Remeasurements Return on plan assets, excluding amount included in interest
expense / (income)– (9.00) (9.00)
(Gain) / loss from change in financial assumptions 23.00 – 23.00
(Gain) / loss from change in demographic assumptions – – –
Experience (gains) / losses 9.00 – 9.00
Total amount recognised in other comprehensive income 32.00 (9.00) 23.00Employer’s contributions – (5.83) (5.83)
Employee’s contributions 6.36 (6.36) –
Benefits payment (73.37) 73.37 –
As at March 31, 2020 628.04 (605.04) 23.00
The net liability disclosed above relates to funded plans are as follows:
As at March 31, 2021
As at March 31, 2020
Present value of funded obligations 629.91 628.04
Fair value of plan assets (629.91) (605.04)
Deficit of provident fund plan – 23.00Current portion – 3.25
Non-current portion – 19.75
Impact on defined benefit obligation
Change in assumptions Increase in assumptions Decrease in assumptions
March 31, 2021
March 31, 2020
March 31, 2021
March 31, 2020
March 31, 2021
March 31, 2020
Discount rate 0.50% 0.50% –0.87% –2.27% NIL 1.83%
(iii) Sensitivity analysis
The sensitivity of the provision for defined benefit obligation to changes in the weighted principal assumptions is
43 Employee benefit obligations (Contd..)
The above sensitivity analysis is based on a change in an assumption while holding all other assumptions constant. In practice, this is unlikely to occur, and changes in some of the assumptions may be correlated. While calculating the sensitivity of the defined benefit obligation to significant actuarial assumptions the same method (present value of the defined benefit obligation calculated with the projected unit credit method at the end of the reporting period) has been applied as when calculating the defined benefit liability recognised in the balance sheet.
The methods and types of assumptions used in preparing the sensitivity analysis did not change compared to the prior period.
(iv) The above defined benefit plan was administrated 100% by a trust as at March 31, 2021 and March 31, 2020
(v) Defined benefit liability and employer contributions
The Company will pay demand raised by the trust towards gratuity liability on time to time basis to eliminate the deficit in defined benefit plan.
The weighted average duration to payment is 8.92 years (March 31, 2020 – 9.53 years).
(vi) The plan liabilities are calculated using a discount rate set with reference to bond yields; if plan assets under perform this yield, this will create a deficit.
124 Annual Report 2020-21 125• Corporate Overview • Statutory Reports • Financial StatementsN o t e s t o t h e F i n a n c i a l S t a t e m e n t sN a t i o n a l P e r o x i d e L i m i t e d

Notes to the Financial Statements as of and for the year ended March 31, 2021 (All amounts are in Indian Rupees lakhs, unless otherwise stated)
Notes to the Financial Statements as of and for the year ended March 31, 2021 (All amounts are in Indian Rupees lakhs, unless otherwise stated)
43 Employee benefit obligations (Contd..)
(vii) Category of plan asset
As at March 31, 2021 As at March 31, 2020
Amount in % Amount in %
Government debt instruments 205.56 33% 145.64 24%
Other debt instruments 284.64 45% 255.68 42%
Entity’s own equity instruments - - 14.31 2%
Others 139.72 22% 189.41 31%
Total 629.92 100% 605.04 99%
44 Fair value measurements
(a) Financial instruments by category
ParticularsAs at March 31, 2021 As at March 31, 2020
FVTPL FVOCIAmortised
costFVTPL FVOCI
Amortised cost
Financial assetsInvestment
-Equity instruments# – 26,747.75 – – 17,630.91 –
Trade receivables – – 2,384.34 – – 3,224.88
Cash and cash equivalents – – 665.82 – – 219.10
Bank balances other than cash and cash equivalents
– – 69.10 – – 73.86
Security deposits – – 70.01 – – 55.47
Inter corporate deposits## – – 11,000.00 – – 11,222.73
Derivative designated as hedge - CCIRS – – – – 675.54 –
Total financial assets – 26,747.75 14,189.27 – 18,306.45 14,796.04Financial liabilitiesBorrowings (includes current maturities of borrowings and accrued interest)
– – 12,488.70 – – 16,149.48
Trade payable – – 2,001.91 – – 1,866.81
Other financial liabilities 0.46 – 959.43 – – 2,865.23
Derivative designated as hedge - CCIRS – 137.47 – – – –
Total financial liabilities 0.46 137.47 15,450.04 – – 20,881.52
# These are investment in equity securities which are not held for trading, and for which the Company has made an irrevocable election at initial recognition to recognise changes in fair value through other comprehensive income rather than profit or loss as these are strategic investments and the Company considered this to be more relevant.
## Inter corporate deposits include interest accrued till the year end, whereas the same has been classified under other financial assets in the financial statements.
(b) Fair value hierarchy
This section explains the judgements and estimates made in determining the fair values of the financial instruments that are (a) recognised and measured at fair value and (b) measured at amortised cost and for which fair values are disclosed in the financial statements. To provide an indication about the reliability of the inputs used in determining fair value, the Company has classified its financial instruments into the three levels prescribed under the accounting standard. An explanation of each level follows underneath the table.
Financial assets and liabilities measured at fair value - recurring fair value measurements as at March 31, 2021
Level 1 Level 2 Level 3 Total
Financial assetsInvestment in equity instruments (at FVOCI) 26,747.75 – – 26,747.75
Total financial assets 26,747.75 – – 26,747.75Financial liabilitiesDerivative designated as hedge - CCIRS – 137.47 – 137.47
Total financial liabilities – 137.47 – 137.47
Assets and liabilities which are measured at amortised cost for which fair values are disclosed as at March 31, 2021
Level 1 Level 2 Level 3 Total
Financial assetsSecurity deposits – – 43.16 43.16
Total financial assets – – 43.16 43.16Financial liabilitiesTotal financial liabilities – – – –
Financial assets and liabilities measured at fair value - recurring fair value measurements as at March 31, 2020
Level 1 Level 2 Level 3 Total
Financial assetsInvestment in equity instruments (at FVOCI) 17,630.91 – – 17,630.91
Derivative designated as hedge - CCIRS – 675.54 – 675.54
Total financial assets 17,630.91 675.54 – 18,306.45Financial liabilities – – – –
Total financial liabilities – – – –
Assets and liabilities which are measured at amortised cost for which fair values are disclosed as at March 31, 2020
Level 1 Level 2 Level 3 Total
Financial assetsSecurity deposits – – 21.40 21.40
Total financial assets – – 21.40 21.40Financial liabilitiesAmount payable towards lease liabilities – – 3.79 3.79
Total financial liabilities – – 3.79 3.79
44 Fair value measurements (Contd..)
126 Annual Report 2020-21 127• Corporate Overview • Statutory Reports • Financial StatementsN o t e s t o t h e F i n a n c i a l S t a t e m e n t sN a t i o n a l P e r o x i d e L i m i t e d

Notes to the Financial Statements as of and for the year ended March 31, 2021 (All amounts are in Indian Rupees lakhs, unless otherwise stated)
Notes to the Financial Statements as of and for the year ended March 31, 2021 (All amounts are in Indian Rupees lakhs, unless otherwise stated)
Note:
Level 1: Level 1 hierarchy includes financial instruments measured using quoted prices. The mutual funds are valued using the closing NAV.
Level 2: The fair value of financial instruments that are not traded in an active market is determined using valuation techniques which maximise the use of observable market data and rely as little as possible on entity-specific estimates. If all significant inputs required to fair value an instrument are observable, the instrument is included in level 2.
Level 3: If one or more of the significant inputs is not based on observable market data, the instrument is included in level 3.
There are no transfers between any levels during the year.
The Company does not have significant financial instrument at level 3 with unobservable input and hence no sensitivity analysis performed
(c) Valuation techniques used to determine fair value
Fair value of all equity instruments which are traded in the stock exchanges are valued using the closing price as at the reporting date. The mutual funds are valued using the closing net asset value.
The fair value of cross currency interest rate swaps is calculated as the present value of the estimated future cash flows based on observable yield curves and forward exchange rates as at the balance sheet date
The fair values for security deposits are calculated based on cash flows discounted using a current lending rate.
The fair values of non-current borrowings are based on discounted cash flows using a credit adjusted borrowing rate as at the reporting date.
(d) Fair value of financial assets and liabilities measured at amortised cost
As at March 31, 2021 As at March 31, 2020
Carrying amount
Fair valueCarrying
amountFair value
Financial assetsSecurity deposits 43.16 43.16 21.40 21.40
Total financial assets 43.16 43.16 21.40 21.40Financial LiabilitiesAmount payable towards lease liabilities – – 3.79 3.79
Total financial liabilities – – 3.79 3.79
The carrying amounts of cash and cash equivalents, other bank balances, trade receivables, inter corporate deposits including accrued interest, other financial assets, current financial liabilities- borrowings including accrued interest, trade payables and other current financial liabilities are considered to be the same as their fair values due to their short term nature.
44 Fair value measurements (Contd..)
Risk Exposure arising from Measurement Management
Credit Risk Cash and cash equivalents, trade receivables, financial assets measured at amortised cost.
Ageing analysis Credit limits, timely review, diversification of deposits
Liquidity Risk Borrowings and other liabilities Rolling cash flow forecasts
Availability of commited credit lines and borrowing facilities
Market risk – foreign exchange
Recognised financial liabilities not denominated in Indian rupee (INR)
Sensitivity analysis
Foreign currency borrowing - hedged - CCIRSOthers-limitedexposure, unhedged
Market risk- interest risk
Borrowing at variable rates Sensitivity analysis
Cross currency interest rate swaps
Market risk- price risk
Investment in equity instruments Sensitivity analysis
Strategic investment, diversification of portfolio
45 Financial risk management
The Company’s business activities expose it to a variety of financial risks, namely liquidity risk, market risks and credit risk. In order to minimise any adverse effects on the financial performance of the Company, derivative financial instruments, such as cross currency interest rate swap are entered to hedge certain foreign currency risk exposures and interest rate exposures. Derivatives are used exclusively for hedging purposes and not as trading or speculative instruments.
The Company has adopted a Risk Management Policy wherein all material risks faced by the Company are identified and assessed. The Risk Management framework defines the risk management approach of the Company and includes collective identification of risks impacting the Company’s business and documents their process of identification, mitigation and optimization of such risks.
Hedge accounting is applied to remove the accounting mismatch between the hedging instrument and the hedged item. The effective portion of the change in the fair value of the hedging instrument is deferred into the cash flow hedge reserve through OCI and will be recognised in profit or loss when the hedged item affects profit or loss. This will effectively result in recognising interest expense at a fixed interest rate for the hedged loans and foreign currency borrowing at the fixed foreign currency rate.
Covid 19 pandemic - Commencing from the second half of March 2020, Covid 19 pandemic had an impact on the Indian and International business environment. Assessment of impact of Covid 19 pandemic on various elements of the risk management framework has been dealt with in note 53 Impact of Covid -19 Pandemic.
(a) Credit risk
The Company is exposed to credit risk, which is the risk that counterparty will default on its contractual obligation resulting in a financial loss to the Company. Credit risk arises from cash and cash equivalents, financial assets carried at amortised cost as well as credit exposures to trade customers including outstanding receivables.
Credit risk management
Credit risk is the risk that a counterparty will not meet its obligations under a financial instrument or customer contract, leading to a financial loss.
The Company’s credit risk arises from accounts receivable balances. The Company has a credit risk policy in place to ensure that sales are made to customers only after an appropriate credit risk assessment and credit line allocation
128 Annual Report 2020-21 129• Corporate Overview • Statutory Reports • Financial StatementsN o t e s t o t h e F i n a n c i a l S t a t e m e n t sN a t i o n a l P e r o x i d e L i m i t e d

Notes to the Financial Statements as of and for the year ended March 31, 2021 (All amounts are in Indian Rupees lakhs, unless otherwise stated)
Notes to the Financial Statements as of and for the year ended March 31, 2021 (All amounts are in Indian Rupees lakhs, unless otherwise stated)
Reconciliation of loss allowance on trade receivables Amount
Loss allowance on April 01, 2019 38.15
Changes in loss allowance 30.15
Loss allowance on March 31, 2020 68.30Changes in loss allowance –
Loss allowance on March 31, 2021 68.30
process. Procedures are standardized within a customer credit risk policy and supported by the information technology system by limiting the credit exposure to each customer and allowing an average credit period of 30-60 days. The Company has adopted a policy of only dealing with creditworthy counterparties. Intercorporate deposits given are for not more than 12 months. The Company periodically assess the recoverability of intercorporate deposits.
The Company provides for life time allowance on trade receivable using simplified approach and on a case to case basis on specified customers. Specific debtors represents debtors facing bankruptcy cases, operation shutdown and other scenerio as determined by the management. Such debtors are categorised as specific debtors upon intimation/news. Such specific debtors has no nexus with the macro economy factor. The Company recognises expected credit loss on specified receivables as determined by the management.
For banks and financial institutions, only highly rated banks / institutions are accepted. Generally all policies surrounding credit risk have been managed at Company level.
(b) Liquidityrisk
Liquidity risk is the risk that the Company will fail in meeting its obligations to pay its financial liabilities. The Company’s approach to managing liquidity is to ensure that it will have sufficient funds to meet its liabilities when due.
Prudent liquidity risk management implies maintaining sufficient cash and marketable securities and the availability of funding through an adequate amount of committed credit facilities to meet obligations when due. In respect of its operations, the Company funds its activities primarily through cash generated in operations and working capital borrowings.
Management monitors the Company’s liquidity position and cash and cash equivalents on the basis of expected cash flows. Cash which is not needed in the operating activities of the Company is invested in marketable liquid funds.
Based on recent trends observed, profitability, cash generation, cash surpluses held by the Company and borrowing lines available, the Company does not envisage any material liquidity risks. Future outlook will depend on how the pandemic develops and the resultant impact on businesses. Refer note 53 Impact of Covid -19 Pandemic.
(i) Maturities of financial liabilities
The amounts disclosed below are the non derivative contractual undiscounted cash flows of financial liablilities and net settled derivative financial instruments undiscounted cash flows. Balances due within 12 months equal their carrying balances as the impact of discounting is not significant. For cross currency interest rate swap, the cash flows have been estimated using forward interest rates and forward exchange rates as at the end of the reporting period.
45 Financial risk management (Contd..)
March 31, 2021Less than 1
yearBetween 1 year
and 5 yearsMore than 5
yearsTotal
Non derivative financial liabilitiesBorrowings (includes current maturities of borrowings and accrued interest)#
12,488.70 – – 12,488.70
Trade payables 2,001.91 – – 2,001.91
Other financial liabilities 956.06 – – 956.06
Amount payable towards lease liabilities (Refer note 4) 3.83 – – 3.83
Total non derivative financial liabilities 15,450.50 – – 15,450.50Cross currency interest rates swap – 137.47 – 137.47
Total derivative liabilities – 137.47 – 137.47
45 Financial risk management (Contd..)
March 31, 2020Less than 1
yearBetween 1 year
and 5 yearsMore than 5
yearsTotal
Non derivative financial liabilitiesBorrowings (includes current maturities of borrowings and accrued interest)
16,702.61 – – 16,702.61
Trade payables 1,866.81 – – 1,866.81
Other financial liabilities 2,853.11 – – 2,853.11
Amount payable towards lease liabilities (Refer note 4) 8.33 3.79 – 12.12
Total non derivative financial liabilities 21,430.86 3.79 – 21,434.65Total derivative liabilities – – – –
# The foreign currency borrowing has a maturity period of 5 years. The loan has a Put and Call Option at the end of second year from the date of drawdown (i.e. March 6, 2019) and annually therafter. The Company has accordingly classified its borrowings of US $15.75 millions as current maturities of long term borrowing.
(ii) Undrawn borrowing facilities
The Company has following undrawn facilities:
ParticularsAs at
March 31, 2021As at
March 31, 2020
Bank Overdraft 1301.13 317.73
(c) Market risk
Market risk is the risk that the fair values of future cash flows of a financial instrument will fluctuate because of volatility of prices in the financial markets. Market risk can be further segregated as: a) Foreign currency risk, b) Interest rates risk and c) Other price risk.
Impact of Covid 19 pandemic- The pandemic can cause continuing volatility in the currency market and this risk would be mitigated through effective hedging policies. Further, the Company basis the recent trends believe that the probability of the non- occurrence of forecasted transactions is minimal. The Company also does not expect any material deterioration in both counterparty credit risk and own credit risk. Accordingly, the Company continues to believe that there is no impact on effectiveness of its hedges. Refer note 53 Impact of Covid -19 Pandemic.
130 Annual Report 2020-21 131• Corporate Overview • Statutory Reports • Financial StatementsN o t e s t o t h e F i n a n c i a l S t a t e m e n t sN a t i o n a l P e r o x i d e L i m i t e d

Notes to the Financial Statements as of and for the year ended March 31, 2021 (All amounts are in Indian Rupees lakhs, unless otherwise stated)
Notes to the Financial Statements as of and for the year ended March 31, 2021 (All amounts are in Indian Rupees lakhs, unless otherwise stated)
45 Financial risk management (Contd..)
(i) Foreign currency risk
Foreign currency risk is the risk that the fair value or future cash flows of a financial instrument will fluctuate because of changes in foreign exchange rates. Foreign exchange risks arise from recognized assets and liabilities, when they are denominated in a currency other than functional currency of the Company. The Company imports certain raw materials and spare parts used in manufacturing and therefore is exposed to foreign exchange risks arising from various currency exposures, primarily with respect to the US-dollar (“USD”). Company’s exposure to foreign currency risk due to operation is very limited and it always ensures that the such exposure is within the approved limit for which Company does not require to hedge through derivatives. However, for foreign currency variable interest rate denominated borrowings the companies risk management policy is to hedge 100% of the exposure using cross currency interest rate swaps. Under the Company’s policy, the critical term of the cross currency interest rate swaps must align the hedged item.
The Company’s unhedged foreign currency exposure at the end of the reporting period expressed in Rupees, are as follows:
As at March 31, 2021
As at March 31, 2020
Financial assetsTrade receivables (USD 0.98 lakhs ; as at March 31, 2020 USD Nil) 70.12 –
Net exposure to foreign currency risk (assets) 70.12 –Financial liabilitiesPayable (Capital creditors) - (USD Nil ; as at March 31, 2020 USD 0.24 lakhs) – 16.62
Contract liabilitiesAdvance from Customer - (USD 0.38 lakhs ; as at March 31, 2020 USD Nil) 27.43 –
Net exposure to foreign currency risk (liabilities) 27.43 16.62
Sensitivity
The sensitivity of profit or loss to changes in the exchange rates arises mainly from unhedged foreign currency denominated financial instruments.
Impact on profit before tax
Year ended March 31, 2021
Year ended March 31, 2020
Assets FX rate – increase by 5% on closing rate on reporting date* 3.51 –
FX rate– decrease by 5% on closing rate on reporting date * (3.51) –
Liabilities FX rate – increase by 5% on closing rate on reporting date* (1.37) (0.83)
FX rate– decrease by 5% on closing rate on reporting date * 1.37 0.83
* All other variables kept constant
The above amounts have been disclosed based on the accounting policy for exchange differences.
45 Financial risk management (Contd..)
(ii) Interest rate risks
The Company’s interest risk arises from long term borrowings with variable rates, which expose the Company to cash flow interest rate risk . The Company’s policy is to maintain most of its borrowing at fixed rates using floating to fixed interest rate swaps. The Company enters into long term borrowings at floating rates and swaps them into fixed rates that are lower than those available if the Company borrowed at fixed rates directly. As at March 31, 2021, the Company’s borrowing at variable rate was denominated in USD.
(a) Interest rate risk exposures
The exposure of the company’s borrowing to interest rate changes at the end of the reporting period are as follows:
As at March 31, 2021
As at March 31, 2020
Fixed rate borrowings (including accrued interest)# 11,546.87 15,681.55
Fixed rate borrowings (including accrued interest) 941.83 –
Floating rate borrowings – 467.93
Total 12,488.70 16,149.48
#This borrowing has been converted to fixed rate borrowings through cross currency interest swaps using floating to fixed interest rate swap.
(b) Sensitivity
The above floating rate borrowing represents an overdraft facility having an interest rate based on MCLR plus applicable margin. This borrowing was utilised toward the end of the year and accordingly the impact in finance cost is minimal. Accordingly, the sensitivity is having minimal impact.
(iii) Foreign currency and interest rate risks
The Company has taken cross currency interest rate swaps (CCIRS) for hedging its foreign currency and interest rate risks related to external commercial borrowings. This CCIRS contracts are composite contracts for both the foreign currency and interest rate risk and does the mark to market value is determined for both the risks together. The details of derivative financial instruments at the end of the reporting period expressed in Rupees, are as follows:
Particulars Currency As at March 31, 2021 As at March 31, 2020
Derivative liability designated as hedge - net settled
Amount in foreign Currency
(In lakhs)
Fair value (Gain) / Loss
(H in lakhs)
Amount in foreign Currency
(In lakhs)
Fair value (Gain) / Loss
(H in lakhs)
Cross currency interest rate swap USD 157.50 137.47 210.00 (675.54)
132 Annual Report 2020-21 133• Corporate Overview • Statutory Reports • Financial StatementsN o t e s t o t h e F i n a n c i a l S t a t e m e n t sN a t i o n a l P e r o x i d e L i m i t e d

Notes to the Financial Statements as of and for the year ended March 31, 2021 (All amounts are in Indian Rupees lakhs, unless otherwise stated)
Notes to the Financial Statements as of and for the year ended March 31, 2021 (All amounts are in Indian Rupees lakhs, unless otherwise stated)
45 Financial risk management (Contd..)
ParticularsYear ended
March 31, 2021Year ended
March 31, 2020
FX rate - increase by 5% on closing rate of reporting date* 565.93 51.72
FX rate - decrease by 5% on closing rate of reporting date* (626.73) (51.72)
Interest rates - increase by 50 bps on closing rate on reporting date*
81.05 720.95
Interest rates - decrease by 50 bps on closing rate on reporting date*
(81.05) (801.18)
Sensitivity
The sensitivity of other comprehensive income before tax due to foreign currency movement and interest rate movements is as below.
* All other variables kept constant
(iv) Other price risks
The Company is exposed to equity price risks arising from equity investments. These investments are subject to changes in the market price of securities. Equity investments are held for strategic purpose rather than for trading purposes. The Company does not actively trade in these investments.
Sensitivity
If equity prices had been 10% higher / lower, other comprehensive income before tax for the year ended March 31, 2021 would increase / decrease by H 2,675 lakhs (Year ended March 31, 2020: increase / decrease by H 1,763 lakhs) as a result of the changes in fair value of shares measured at FVOCI.
(a) Disclosure of effects of hedge accounting on financial position:
As at March 31, 2021
Type of hedge and risks
Nominal value
Carrying amount of
hedging instrument
Maturity dateHedge ratio*
Weighted average
strike price/rate
Changes in fair value
of hedging instrument
(loss)
Change in the value of hedged item used as the
basis for recognising
hedge effectiveness
Derivative liabilities designated as cash flow hedgeForeign exchange risk and interest rate risk
Cross currency interest rate swap
11,536.06 137.47 March 8, 2021 to February 27, 2024
1:1 “$1= H 72.45 7.70%”
(137.47) 137.47
45 Financial risk management (Contd..)
As at March 31, 2020
Type of hedge and risks
Nominal value
Carrying amount of
hedging instrument
Maturity dateHedge ratio*
Weighted average
strike price/rate
Changes in fair value
of hedging instrument
gain
Change in the value of hedged item used as the
basis for recognising
hedge effectiveness
Derivative assets designated as cash flow hedgeForeign exchange risk and interest rate risk
Cross currency interest rate swap
15,670.83 675.54 June 6, 2020 to March 6, 2021
1:1 “$1= H 70.54 8.55%”
675.54 (675.54)
The Company enters into hedge relationships where the critical terms of the hedging instrument match exactly with the terms of the hedged item. Therefore, the hedge ratio is 1:1.
(b) Disclosure of effects of hedge accounting on financial performance
As at March 31, 2021
Type of hedge
Change in the value of the hedging instrument
recognised in other comprehensive income
Hedge ineffectiveness recognised in profit or loss
Amount reclassified from cash flow
hedging reserve to profit or loss
Line item affected in statement of profit and
loss because of the reclassification
Cash flow hedgeCross currency interest rate swap
(813.01) – 739.51 Foreign exchange gain under other income of H 739.51 lakhs.
As at March 31, 2020
Type of hedge
Change in the value of the hedging instrument
recognised in other comprehensive income
Hedge ineffectiveness recognised in profit or loss
Amount reclassified from cash flow
hedging reserve to profit or loss
Line item affected in statement of profit and
loss because of the reclassification
Cash flow hedgeCross currency interest rate swap
1,168.89 – (920.95) Finance cost of H 22.75 lakhs and foreign exchange loss under other income of H (943.70) lakhs.
134 Annual Report 2020-21 135• Corporate Overview • Statutory Reports • Financial StatementsN o t e s t o t h e F i n a n c i a l S t a t e m e n t sN a t i o n a l P e r o x i d e L i m i t e d

Notes to the Financial Statements as of and for the year ended March 31, 2021 (All amounts are in Indian Rupees lakhs, unless otherwise stated)
Notes to the Financial Statements as of and for the year ended March 31, 2021 (All amounts are in Indian Rupees lakhs, unless otherwise stated)
45 Financial risk management (Contd..)
Derivative instruments Cross currency interest rate swap
Cash flow hedging reserve 2020-21 2019-20
Opening Balance 104.47 265.77Add: Changes in fair value of CCIRS 813.01 (1,168.89)
Less: Amounts reclassified to profit or loss (739.51) 920.95
Less: Deferred tax relating to above (net) (2.80) 86.64
Closing Balance 175.17 104.47
Movements in cash flow hedging reserve
Risk category
Hedge ineffectiveness
The Company’s hedging policy only allows for effective hedge relationships to be established.
Hedge effectiveness is determined at the inception of the hedge relationship, and through periodic prospective effectiveness assessments to ensure that an economic relationship exists between the hedged item and hedging instrument. The Company enters into hedge relationships where the critical terms of the hedging instrument match exactly with the terms of the hedged item, and so a qualitative assessment of effectiveness is performed. If changes in circumstances affect the terms of the hedged item such that the critical terms no longer match exactly with the critical terms of the hedging instrument, the Company uses the hypothetical derivative method to assess effectiveness.
The Company enters into cross currency interest rate swaps that have similar critical terms as the hedged item, such as reference rate, reset dates, repayment dates, maturities and notional amount as all critical terms matched during the year, the economic relationship was 100% effective. There was no ineffectiveness during the financial year ended March 31, 2021.
The Company is exposed to USD LIBOR within a fair value hedge accounting relationship, which is subject to interest rate benchmark reform.
The Company is exposed to USD LIBOR within a fair value hedge accounting relationship, which is subject to interest rate benchmark reform. The Company has identified where LIBOR exposures are within the business and is constantly reviewing the same, will have its transition plans in place as and when this is implemented.
Below are details of the hedging instruments and hedged items in scope of the Ind AS 109 amendments due to interest rate benchmark reform. The terms of the hedged items listed match those of the corresponding hedging instruments.
45 Financial risk management (Contd..)
Hedge type Instrument type Maturing in Nominal Hedged item
Cash Flow Hedge
Pay fixed rate interest at 7.70% and receive floating rate interest at LIBOR + 1.25%
2024 USD 15.75 Millions
Floating rate external commercial borrowing (ECB) of the same maturity and nominal of the swap
The Company will continue to apply the amendments to Ind AS 109 until the uncertainty arising from the interest rate benchmark reforms that the Company is exposed to ends. The Company has assumed that this uncertainty will not end until the Company’s contracts that reference LIBORs are amended to specify the date on which the interest rate benchmark will be replaced, the alternative benchmark rate and the relevant spread adjustment. This will, in part, be dependent on the introduction of fallback clauses which have yet to be added to the Company’s contracts and the negotiation with lenders.
46 Capital Management
(a) RiskManagement
The Company’s objectives when managing capital are to safeguard the Company’s ability to continue as a going concern in order to provide returns for shareholders and benefits for other stakeholders and to maintain an optimal capital structure to reduce the cost of capital. In order to maintain or adjust the capital structure, the Company may adjust the amount of dividends paid to shareholders, return capital to shareholders, issue new shares or sell assets to reduce debt.
Consistent with others in the industry, the Company monitors capital on the basis of the gearing ratio. Gearing ratio is determined as net debt (total borrowings and lease liabilities net of cash and cash equivalents) divided by total ‘equity’.
ParticularsAs at
March 31, 2021As at
March 31, 2020
Total debt 12,492.53 16,161.60
Less: Cash and cash equivalent (665.82) (219.10)
Net debt 11,826.71 15,942.50Total equity 58,841.66 48,645.41
Net debt to equity ratio 20.10% 32.77%
Loan covenants
The Company’s ECB agreement is subjected to covenant clauses, whereby the Company is required to meet certain key financial ratios. During the current year, the company complied with all the covenants as per the borrowing agreement except one covenant as stated below:
– the ratio of EBIT to total debt service at the end of each measurement period shall not be less than 1.25;
While the bank is contractually entitled to request for immediate repayment of the outstanding loan amount of US $ 15.75 Million, the bank had not requested early repayment of the loan as of the date when these financial statements were approved.
During the previous year, the Company undertook the expansion of its plant capacity from 95 KTPA to 150 KTPA, which required the plant to be shutdown for a period of 4 months. The company complied with all the covenants as per the borrowing agreement except two covenants stated below:
(i) the ratio of total borrowings to EBITDA at the end of each measurement period shall not be greater than 3 and;
(ii) the ratio of EBIT to total debt service at the end of each measurement period shall not be less than 1.25.
136 Annual Report 2020-21 137• Corporate Overview • Statutory Reports • Financial StatementsN o t e s t o t h e F i n a n c i a l S t a t e m e n t sN a t i o n a l P e r o x i d e L i m i t e d

Notes to the Financial Statements as of and for the year ended March 31, 2021 (All amounts are in Indian Rupees lakhs, unless otherwise stated)
Notes to the Financial Statements as of and for the year ended March 31, 2021 (All amounts are in Indian Rupees lakhs, unless otherwise stated)
46 Capital Management (Contd..)
(b) Dividends
As at March 31, 2021
As at March 31, 2020
(i) Equity shares 718.38 3,735.55
Final dividend for the year ended March 31, 2020 of H 12.50 (March 31, 2019 - H 65) per fully paid share
Dividend Distribution Tax (DDT) on final dividend – 768.03
(ii) Dividends not recognised at the end of the reporting period 718.38 718.38
For the year ended March 31, 2021, the directors have recommended a final dividend of H 12.50 per fully paid equity share (March 31, 2020 - H 12.50). This proposed dividend is subject to the approval of shareholders in the ensuing annual general meeting.
47 Micro and small enterprise
Disclosure in respect to Micro and Small Enterprises as per Micro, Small and Medium Enterprises Development Act, 2006 (‘MSMED’) Act, 2006 is as follows:
The information as required under Micro, Small and Medium Enterprises Development Act, 2006, has been determined to the extent such parties have been identified on the basis of information available with the Group and relied upon by the auditors. The principal amounts / interest payable amounts for delayed payments to such vendors as at Balance Sheet date during the current year and previous year mentioned below.
ParticularsAs at
March 31, 2021As at
March 31, 2020
The principal amount remaining unpaid to any supplier registered under the Micro, Small and Medium Enterprises Development Act, 2006 and remaining unpaid as at the year end
306.46 17.35
Principal amount paid to suppliers registered under the MSMED Act, beyond the appointed day during the year
345.96 107.13
Interest paid, other than under section 16 of MSMED Act, to suppliers registered under the MSMED Act, , beyond the appointed day during the year
– –
Interest paid, under section 16 of MSMED Act, to suppliers registered under the MSMED Act, beyond the appointed day during the year
Amount of interest accrued and remaining unpaid for the year 2.12 1.74
The amount of interest accrued and remaining unpaid at the end of each accounting year.
3.86 1.74
The amount of further interest due and payable even in the succeeding years, until such date when the interest dues as above are actually paid to the small enterprise, for the purpose of disallowance as a deductible expenditure under section 23.
3.86 1.74
In respect of the Assessment Year 2018-19, the Company has received a demand of income tax on March 17, 2021 amounting to H 1,079.47 lakhs on account of disllowances in respect of embezzlement of funds, disallowances under section 14A, section 43B and interest thereon.The Company has filed an appeal with the Commissioner of Income Tax (Appeals) on April 14, 2021.
(iii) Contingent liability relating to determination of provident fund liability, based on judgement from Hon’ble Supreme Court, is not determinable at present for the period prior to March 2019, due to uncertainty on the impact of the judgement in the absence of further clarification relating to applicability. The Company has paid provident fund to employees as applicable with effect from March 2019. The Company will continue to assess any further developments in this matter for their implications on financial statements, if any.
49 Capital and other commitments
Capital commitments
(i) Estimated amount of contracts remaining to be executed on capital account and not provided (net of advances) for H 237.73 lakhs (March 31, 2020: H 10.63 lakhs)
(ii) Other commitment:
The Company has entered into a long term agreement with GAIL (India) Limited (GAIL) for purchase of Natural Gas. The agreement is valid till December 31, 2025. As per the said agreement, the Company under ‘Take or Pay obligation’ clause has to make payment for a fixed quantity of gas on an annual basis, whether used or not. GAIL has the discretion to waive off the Take or Pay charges. A request for supply of Make Up gas can be made by the Company corresponding to Take or Pay deficiencies which are outstanding and for which the Company would pay to GAIL at the time of annual program.
(iii) For lease commitment, refer note 4.
50 Assets Decommissioned during the year
The Company commissioned its 150KTPA plant in February 2020. In the current year, as the plant got fully operational and stabilized, management undertook a review of all its older assets which may have become redundant and no longer usable in the production process and had to be decommissioned. As a result of this, assets with written down value amounting to H 876.97 lakhs were dismantled and disposed off at a loss of H 653.93 lakhs; assets with written down value amounting to H 218.32 lakhs were further written down to an estimated 5% of its gross block value resulting in a loss of H 136.72 lakhs. The aggregate loss of H 790.65 lakhs on account of decommissioning has been disclosed as an exceptional item in the Statement of Profit and Loss for the year ended March 31, 2021.
48 Contingent liability
Claims against the Company not acknowledged as debt
As at March 31, 2021
As at March 31, 2020
(i) Sales tax demand 38.90 38.90
(ii) Income tax demand 1,079.47 –
138 Annual Report 2020-21 139• Corporate Overview • Statutory Reports • Financial StatementsN o t e s t o t h e F i n a n c i a l S t a t e m e n t sN a t i o n a l P e r o x i d e L i m i t e d

Notes to the Financial Statements as of and for the year ended March 31, 2021 (All amounts are in Indian Rupees lakhs, unless otherwise stated)
Notes to the Financial Statements as of and for the year ended March 31, 2021 (All amounts are in Indian Rupees lakhs, unless otherwise stated)
51 Write down of Assets held for sale to reassessed realizable value
There were items (Pipes, Pipe fittings, Valves, Cables and other spares) in Capital Work in Progress (CWIP) which were no longer required and classified as ‘Asset held for sale’ in previous year. The Company took necessary steps to sell the assets despite lower demand due to COVID scenario. Accordingly, the Company continues to classify the assets as held for sale. The Company has made enquires and has received quotations from various parties, basis which, the fair value has been reassessed and a write down of H 173.86 lakhs has been accounted, which has been disclosed as an exceptional item in the Statement of Profit and Loss for the year ended March 31, 2021.
52 Temporary Plant shut down due to machinery breakdown
The Company’s plant located at Kalyan, Maharashtra, was temporarily shut down from March 27, 2021 due to machinery breakdown and have resumed operations from May 30, 2021 in a phased manner. The Company has incurred loss of various chemicals (i.e. catalyst and working solution), fixed assets (primary, secondary and tertiary filters) and inventory (hydrogen peroxide) of an aggregate amount of H 584.79 lakhs which has been disclosed as an exceptional item. The Company has initiated the procedures with respect to insurance claim in this regard.
53 Note on Impact of Covid-19
The spread of COVID-19 disease has severely impacted economies, businesses and social set ups across the globe and in India. The number of new cases which had reached its lowest level in the first week of February 2021 has gone up dramatically in March 2021. Several restrictions have been imposed by various state governments and local bodies to control this strong second wave of the pandemic, but these are not as severe as the lockdown during the first wave.
Management has carried out a detailed assessment of Its liquidity position for the next one year and of the recoverability and carrying values of Property, Plant and Equipment, Trade receivables, Inventory, Intercorporate deposits and Investments as at the balance sheet date, and has concluded that there are no material adjustments required in the standalone financial statements.
Based on the Company’s liquidity position as at March 31, 2021 and review of cash flow projections (after applying sensitivity analysis) over the next twelve months, the management believes the Company will have sufficient liquidity to operate its businesses in the ordinary course. However, the impact assessment of COVID-19 is a continuing process given the uncertainties associated with its nature and duration. The Company will continue to monitor material changes to future economic conditions.
The eventual outcome of the impact of the COVID-19 pandemic on the Company’s business may be different than estimated as on the date of approval of these standalone financial statements.
54 The Board of Directors of the Company at their meeting held on March 09, 2021, have, inter alia, approved the Composite Scheme of Arrangement (‘the Scheme””) under section 230 to 232 and other applicable provisions of the Companies Act, 2013 and the rules and regulations made there under.
The Scheme, inter alia, provides for demerger, transfer and vesting of the Demerged Undertaking (as defined under the scheme) from the Company into NPL Chemicals Limited, a wholly owned subsidiary (w.e.f. October 01, 2020) of the Company, on a going concern basis, and in consideration thereof, the NPL Chemicals Limited shall issue it’s equity shares to the equity shareholders of the Company in the same proportion of their existing holding in the Company and the existing share capital of the NPL Chemicals Limited held by the Company will be reduced. Further, Naperol Investments Limited (presently wholly owned subsidiary of NPL) will be merged into National Peroxide Limited.
Furthermore, subject to necessary approvals, the equity shares allotted by the NPL Chemicals Limited, pursuant to the Scheme, to shareholders of the Company shall be listed on BSE Limited. On March 27, 2021 the Company filed the Board approved Scheme with Bombay Stock Exchange. The Scheme as aforesaid is subject to necessary approvals by the stock exchanges, Securities and Exchange Board of India, shareholders, creditors, Jurisdictional Bench of National Company Law Tribunal (“”NCLT””) and such other statutory and regulatory approvals as may be required.
55 The financial statement were authorised for issue by the Board of Directors on June 29, 2021.
56 The figures for the previous year have been reclassified /regrouped wherever necessary for better understanding and comparability.
The above Statement of Profit and Loss should be read in conjunction with the accompanying notes.
As per our report of even dateFor Price Waterhouse Chartered Accountants LLP For and on behalf of the Board of Directors ofICAI Firm registration number: 012754N/N500016 National Peroxide Limited
Asha Ramanathan Rajiv Arora Ness N. Wadia Rajesh Batra Partner Chief Executive Officer & Director Chairman Director Membership No 202660 DIN: 08730235 DIN: 00036049 DIN: 00020764
Conrad Fernandes S. Ragothaman Viraf Mehta Chief Financial Officer Director Director DIN: 00042395 DIN: 00352598
Chandukumar Parmar Minnie Bodhanwala Harshbeena Zaveri Company Secretary Director Director DIN: 00422067 DIN: 00003948 Place: Mumbai Date: June 29, 2021
140 Annual Report 2020-21 141• Corporate Overview • Statutory Reports • Financial StatementsN o t e s t o t h e F i n a n c i a l S t a t e m e n t sN a t i o n a l P e r o x i d e L i m i t e d

Independent Auditor’s Report
To the Members of National Peroxide Limited
Report on the Audit of the Consolidated Financial Statements Opinion
1. We have audited the accompanying consolidated financial statements of National Peroxide Limited (hereinafter referred to as the ‘Holding Company”) and its subsidiaries (Holding Company and its subsidiaries together referred to as “the Group”), (refer note 2.1 [b] to the attached consolidated financial statements), which comprise the consolidated balance sheet as at March 31, 2021, and the consolidated Statement of profit and loss (including other comprehensive income), the consolidated statement of changes in equity and the consolidated cash flows Statement for the year then ended, and notes to the consolidated financial statements, including a summary of significant accounting policies and other explanatory information prepared based on the relevant records. (hereinafter referred to as “the consolidated financial statements”).
2. In our opinion and to the best of our information and according to the explanations given to us, the aforesaid consolidated financial statements give the information required by the Companies Act, 2013 (“the Act”) in the manner so required and give a true and fair view in conformity with the accounting principles generally accepted in India, of the consolidated state of affairs of the Group as at March 31, 2021, of consolidated total comprehensive income (comprising of profit and other comprehensive income), consolidated changes in equity and its consolidated cash flows for the year then ended.
Basis for Opinion
3. We conducted our audit in accordance with the Standards on Auditing (SAs) specified under section 143(10) of the Act. Our responsibilities under those Standards are further described in the Auditor’s Responsibilities for the Audit of the Consolidated Financial Statements section of our report. We are independent of the Group in accordance with the ethical requirements that are relevant to our audit of the consolidated financial statements in India in terms of the Code of Ethics issued by ICAI and the relevant provisions of the Act, and we have fulfilled our other ethical responsibilities in accordance with these requirements. We believe that the audit evidence we have obtained and the audit evidence obtained by the other auditors in terms of their reports referred to in sub-paragraph 15 of the Other Matter paragraph below, is sufficient and appropriate to provide a basis for our opinion.
Emphasis of Matter
4. We draw attention to Note 54 to the consolidated financial statements, which describes the current environment, where several restrictions have been imposed by various state governments and local bodies to control the second wave of the Coronavirus (Covid-19) pandemic. Management has carried out a detailed assessment of the financial impact on the business operations of the Company and has concluded that there are no material adjustments required in the consolidated financial statements. However, a definitive assessment of the impact on the subsequent periods is highly dependent upon circumstances as they evolve. Our opinion is not modified in respect of this matter.
5. Key audit matters are those matters that, in our professional judgment, were of most significance in our audit of the consolidated financial statements of the current period. The matters were addressed in the context of our audit of the consolidated financial statements as a whole, and in forming our opinion thereon, and we do not provide a separate opinion on these matters.
143• Corporate Overview • Statutory Reports • Financial StatementsI n d e p e n d e n t A u d i t o r ’ s R e p o r t
Consolidated Financial
Statements

Key audit matter How our audit addressed the key audit matter
Appropriateness of valuation of Property, Plant and Equipment (including Asset held for sale) (Refer note 51 and note 52 to the consolidated financial statements):
During the previous year, the Company expanded its production capacity from 95 KTPA to 150 KTPA of its plant at Kalyan, Maharashtra which resulted in a capitalisation of H 21,544.68 lakhs.
In the current year, as the plant got fully operational and stabilized, the management undertook an exercise to review the plant and machinery which may no longer be usable; or may have to put to an alternate use; CWIP which was held for sale, for any further depletion in carrying value.
As a result of this exercise, assets with written down value of H 876.97 lakhs were determined to be redundant and were decommissioned and disposed off at a loss of H 653.93 lakhs; assets with written down value of H 218.32 lakhs are being evaluated for alternate use, resulting in writing them down to 5% of the gross book value, with a consequential loss of H 136.72 lakhs; re-assessment of fair value of CWIP disclosed as assets held for sale resulted in a write down of H 173.86 lakhs.
These losses/write downs of an amount of H 964.51 lakhs have been disclosed as Exceptional Items in the Statement of Profit and Loss.
Due to the significance of the amounts involved and judgement and estimates involved in determining usability and fair value the matter has been considered to be a Key Audit Matter.
Our procedures included the following:
• Obtained and examined the board approval for decommissioning of assets at site and sale of assets;
• Understanding and evaluating the controls and testing the operating effectiveness of the control related to identification of redundant assets and sale of the decommissioned assets and estimating the fair value of these assets;
• Obtained an understanding with the management in relation to the nature and use of the assets that are decommissioned at site;
• Evaluated the physical verification process performed by the management to identify these assets and examined the report for determining the assets decommissioned at site;
• Performed test of details on the assets sold i.e. examining the quotations, sales order approval and invoices;
• Evaluated the management assessment and performed test of details relating to the quotations received to determine fair value;
• Ensured adequacy of disclosures in the standalone financial statements.
Based on our procedures as mentioned above, we did not identify any inconsistency in the management assessment of carrying value of Property, Plant and Equipment (including asset held for sale).
Other Information
6. The Holding Company’s Board of Directors is responsible for the other information. The other information comprises the information included in the annual report, but does not include the consolidated financial statements and our and other auditor’s report thereon. The annual report is expected to be made available to us after the date of this auditor’s report.
Our opinion on the consolidated financial statements does not cover the other information and we will not express any form of assurance conclusion thereon.
In connection with our audit of the consolidated financial statements, our responsibility is to read the other information identified above when it becomes available and, in doing so, consider whether the other information is materially inconsistent with the financial statements or our knowledge obtained in the audit, or otherwise appears to be materially misstated.
When we read the annual report, if we conclude that there is a material misstatement therein, we are required to communicate the matter to those charged with governance and take appropriate action as applicable under the relevant laws and regulations.
Responsibilities of Management and Those Charged with Governance for the Consolidated Financial Statements
7. The Holding Company’s Board of Directors is responsible for the preparation and presentation of these consolidated financial statements in term of the requirements of the Act that give a true and fair view of the consolidated financial position, consolidated financial performance and consolidated cash flows, and changes in equity of the Group in accordance with the accounting principles generally accepted in India, including the Accounting Standards specified under section 133 of the Act. The respective Board of Directors of the companies included in the Group are responsible for maintenance of adequate accounting records in accordance with the provisions of the Act for safeguarding the assets of the Group and for preventing and detecting frauds and other irregularities; selection and application of appropriate accounting policies; making judgments and estimates that are reasonable and prudent; and the design, implementation and maintenance of adequate internal financial controls, that were operating effectively for ensuring accuracy and completeness of the accounting records, relevant to the preparation and presentation of the financial statements that give a true and fair view and are free from material misstatement, whether due to fraud or error, which have been used for the purpose of preparation of the consolidated financial statements by the Directors of the Holding Company, as aforesaid.
8. In preparing the consolidated financial statements, the respective Board of Directors of the companies included in the Group are responsible for assessing the ability of the Group to continue as a going concern, disclosing, as applicable, matters related to going concern and using the going concern basis of accounting unless management either intends to liquidate the Group or to cease operations, or has no realistic alternative but to do so.
9. The respective Board of Directors of the companies included in the Group are responsible for overseeing the financial reporting process of the Group.
Auditor’s Responsibilities for the Audit of the Consolidated Financial Statements
10. Our objectives are to obtain reasonable assurance about whether the consolidated financial statements as a whole are free from material misstatement, whether due to fraud or error, and to issue an auditor’s report that includes our opinion. Reasonable assurance is a high level of assurance, but is not a guarantee that an audit conducted in accordance with SAs will always detect a material misstatement when it exists. Misstatements can arise from fraud or error and are considered material if, individually or in the aggregate, they could reasonably be expected to influence the economic decisions of users taken on the basis of these consolidated financial statements.
11. As part of an audit in accordance with SAs, we exercise professional judgment and maintain professional skepticism throughout the audit. We also:
• Identify and assess the risks of material misstatement of the consolidated financial statements, whether due to fraud or error, design and perform audit procedures responsive to those risks, and obtain audit evidence that is sufficient and appropriate to provide a basis for our opinion. The risk of not detecting a material misstatement resulting from fraud is higher than for one resulting from error, as fraud may involve collusion, forgery, intentional omissions, misrepresentations, or the override of internal control.
• Obtain an understanding of internal control relevant to the audit in order to design audit procedures that are appropriate in the circumstances. Under section 143(3)(i) of the Act, we are also responsible for expressing our opinion on whether the Holding company has adequate internal financial controls with reference to financial statements in place and the operating effectiveness of such controls.
• Evaluate the appropriateness of accounting policies used and the reasonableness of accounting estimates and related disclosures made by management.
• Conclude on the appropriateness of management’s use of the going concern basis of accounting and, based on the audit evidence obtained, whether a material uncertainty exists related to events or conditions that may cast significant doubt on the ability of the Group to continue as a going concern. If we conclude that a material uncertainty
144 Annual Report 2020-21 145• Corporate Overview • Statutory Reports • Financial StatementsI n d e p e n d e n t A u d i t o r ’ s R e p o r tN a t i o n a l P e r o x i d e L i m i t e d

exists, we are required to draw attention in our auditor’s report to the related disclosures in the consolidated financial statements or, if such disclosures are inadequate, to modify our opinion. Our conclusions are based on the audit evidence obtained up to the date of our auditor’s report. However, future events or conditions may cause the Group and its associates and jointly controlled entities to cease to continue as a going concern.
• Evaluate the overall presentation, structure and content of the consolidated financial statements, including the disclosures, and whether the consolidated financial statements represent the underlying transactions and events in a manner that achieves fair presentation.
• Obtain sufficient appropriate audit evidence regarding the financial information of the entities or business activities within the Group and its associates and jointly controlled entities to express an opinion on the consolidated financial statements. We are responsible for the direction, supervision and performance of the audit of the financial statements of such entities included in the consolidated financial statements of which we are the independent auditors. For the other entities included in the consolidated financial statements, which have been audited by other auditors, such other auditors remain responsible for the direction, supervision and performance of the audits carried out by them. We remain solely responsible for our audit opinion.
12. We communicate with those charged with governance of the Holding Company regarding, among other matters, the planned scope and timing of the audit and significant audit findings, including any significant deficiencies in internal control that we identify during our audit.
13. We also provide those charged with governance with a statement that we have complied with relevant ethical requirements regarding independence, and to communicate with them all relationships and other matters that may reasonably be thought to bear on our independence, and where applicable, related safeguards.
14. From the matters communicated with those charged with governance, we determine those matters that were of most significance in the audit of the consolidated financial statements of the current period and are therefore the key audit matters. We describe these matters in our auditor’s report unless law or regulation precludes public disclosure about the matter or when, in extremely rare circumstances, we determine that a matter should not be communicated in our report because the adverse consequences of doing so would reasonably be expected to outweigh the public interest benefits of such communication.
Other Matter
15. We did not audit the financial statements of two subsidiaries whose financial statements reflect total assets of H 47,889.62 lakhs and net assets of H 47,861.46 as at March 31, 2021, total revenue of H 53.46 lakhs, total comprehensive income (comprising of profit and other comprehensive income) of H 16,270.10 lakhs and net cash flows amounting to H 11.21 lakhs for the year ended on that date, as considered in the consolidated financial statements. These financial statements have been audited by other auditor whose reports have been furnished to us by the Management, and our opinion on the consolidated financial statements insofar as it relates to the amounts and disclosures included in respect of these subsidiaries and our report in terms of sub-section (3) of Section 143 of the Act including report on Other Information insofar as it relates to the aforesaid subsidiaries, is based solely on the reports of the other auditors.
Our opinion on the consolidated financial statements, and our report on Other Legal and Regulatory Requirements below, is not modified in respect of the above matters with respect to our reliance on the work done and the reports of the other auditors.
Report on Other Legal and Regulatory Requirements
16. As required by Section 143(3) of the Act, we report, to the extent applicable, that:
(a) We have sought and obtained all the information and explanations which to the best of our knowledge and belief were necessary for the purposes of our audit of the aforesaid consolidated financial statements.
(b) In our opinion, proper books of account as required by law relating to preparation of the aforesaid consolidated financial statements have been kept by the Holding Company and its subsidiaries included in the group so far as it appears from our examination of those books and records of the Holding Company and the reports of the other auditors.
(c) The Consolidated Balance Sheet, the Consolidated Statement of Profit and Loss (including other comprehensive income), Consolidated Statement of Changes in Equity and the Consolidated Cash Flow Statement dealt with by this Report are in agreement with the relevant books of account and records maintained by the Holding Company and its subsidiaries included in the group for the purpose of preparation of the consolidated financial statements.
(d) In our opinion, the aforesaid consolidated financial statements comply with the Accounting Standards specified under Section 133 of the Act.
(e) On the basis of the written representations received from the directors of the Holding Company as on March 31, 2021 taken on record by the Board of Directors of the Holding Company and the reports of the statutory auditors of its subsidiary companies incorporated in India, none of the directors of the Group companies is disqualified as on March 31, 2021 from being appointed as a director in terms of Section 164(2) of the Act.
(f) With respect to the adequacy of internal financial controls with reference to financial statements of the Group and the operating effectiveness of such controls, refer to our separate report in Annexure A.
(g) With respect to the other matters to be included in the Auditor’s Report in accordance with Rule 11 of the Companies (Audit and Auditor’s) Rules, 2014, in our opinion and to the best of our information and according to the explanations given to us:
i. The consolidated financial statements disclose the impact, if any, of pending litigations as at March 31, 2021 the consolidated financial position of the Group – Refer Note 49 to the consolidated financial statements.
ii. The Group had long-term contracts including derivative contracts March 31, 2021 for which there were no material foreseeable losses.
iii. There has been no delay in transferring amounts, required to be transferred, to the Investor Education and Protection Fund by the Holding Company During the year ended March 31, 2021, there were no amounts which were required to be transferred to the Investor Education and Protection Fund by the its subsidiary companies incorporated in India.
iv. The reporting on disclosures relating to Specified Bank Notes is not applicable to the Group for the year ended March 31, 2021.
17. The Company has paid/ provided for managerial remuneration in accordance with the requisite approvals mandated by the provisions of Section 197 read with Schedule V to the Act.
For Price Waterhouse Chartered Accountants LLPFirm Registration Number: 012754N/N500016
Asha RamanathanPartner
Mumbai Membership Number: 202660June 29, 2021 UDIN: 21202660AAAAAZ7578
146 Annual Report 2020-21 147• Corporate Overview • Statutory Reports • Financial StatementsI n d e p e n d e n t A u d i t o r ’ s R e p o r tN a t i o n a l P e r o x i d e L i m i t e d

Annexure A to Independent Auditors’ ReportReferred to in paragraph 16 (f) of the Independent Auditors’ Report of even date to the members of National Peroxide Limited on the consolidated financial statements for the year ended March 31, 2021
Report on the Internal Financial Controls with reference to financial statements under Clause (i) of Sub-section 3 of Section 143 of the Act
1. In conjunction with our audit of the consolidated financial statements of the Company as of and for the year ended March 31, 2021, we have audited the internal financial controls with reference to financial statements of National Peroxide Limited (hereinafter referred to as “the Holding Company”) and its subsidiary companies, which are companies incorporated in India, as of that date.
Management’s Responsibility for Internal Financial Controls
2. The respective Board of Directors of the Holding company and its subsidiary companies, to whom reporting under clause (i) of sub section 3 of Section 143 of the Act in respect of the adequacy of the internal financial controls with reference to financial statements is applicable, which are companies incorporated in India, are responsible for establishing and maintaining internal financial controls based on, internal control over financial reporting criteria established by the Company considering the essential components of internal control stated in the Guidance Note on Audit of Internal Financial Controls Over Financial Reporting issued by the Institute of Chartered Accountants of India (ICAI). These responsibilities include the design, implementation and maintenance of adequate internal financial controls that were operating effectively for ensuring the orderly and efficient conduct of its business, including adherence to the respective company’s policies, the safeguarding of its assets, the prevention and detection of frauds and errors, the accuracy and completeness of the accounting records, and the timely preparation of reliable financial information, as required under the Act.
Auditor’s Responsibility
3. Our responsibility is to express an opinion on the Company's internal financial controls with reference to financial statements based on our audit. We conducted our audit in accordance with the Guidance Note on Audit of Internal Financial Controls Over Financial Reporting (the “Guidance Note”) issued by the ICAI and the Standards on Auditing prescribed under section 143(10) of the Companies Act, 2013, to the extent applicable to an audit of internal financial controls, both applicable to an audit of internal financial controls and both issued by the ICAI. Those Standards and the Guidance Note require that we comply with ethical requirements and plan and perform the audit to obtain reasonable assurance about whether adequate internal financial controls with reference to financial statements was established and maintained and if such controls operated effectively in all material respects.
4. Our audit involves performing procedures to obtain audit evidence about the adequacy of the internal financial controls system with reference to financial statements and their operating effectiveness. Our audit of internal financial controls with reference to financial statements included obtaining an understanding of internal financial controls with reference to financial statements, assessing the risk that a material weakness exists, and testing and evaluating the design and operating effectiveness of internal control based on the assessed risk. The procedures selected depend on the auditor’s judgement, including the assessment of the risks of material misstatement of the financial statements, whether due to fraud or error.
5. We believe that the audit evidence we have obtained and the audit evidence obtained by the other auditors in terms of their reports referred to in the Other Matter paragraph below, is sufficient and appropriate to provide a basis for our audit opinion on the Company’s internal financial controls system with reference to financial statements.
Meaning of Internal Financial Controls with reference to financial statements
6. A company's internal financial control with reference to financial statements is a process designed to provide reasonable assurance regarding the reliability of financial reporting and the preparation of financial statements for external purposes in accordance with generally accepted accounting principles. A company's internal financial control with reference to financial statements includes those policies and procedures that (1) pertain to the maintenance of records that, in reasonable detail, accurately and fairly reflect the transactions and dispositions of the assets of the company; (2) provide reasonable assurance that transactions are recorded as necessary to permit preparation of financial statements in accordance with generally accepted accounting principles, and that receipts and expenditures of the company are being made only in accordance with authorisations of management and directors of the company; and (3) provide reasonable assurance regarding prevention or timely detection of unauthorised acquisition, use, or disposition of the company's assets that could have a material effect on the financial statements.
Inherent Limitations of Internal Financial Controls with reference to financial statements
7. Because of the inherent limitations of internal financial controls with reference to financial statements, including the possibility of collusion or improper management override of controls, material misstatements due to error or fraud may occur and not be detected. Also, projections of any evaluation of the internal financial controls with reference to financial statements to future periods are subject to the risk that the internal financial control with reference to financial statements may become inadequate because of changes in conditions, or that the degree of compliance with the policies or procedures may deteriorate.
Opinion
8. In our opinion, the Holding Company and its subsidiary company which are companies incorporated in India, have, in all material respects, an adequate internal financial controls system with reference to financial statements and such internal financial controls with reference to financial statements were operating effectively as at March 31, 2021, based on the internal control over financial reporting criteria established by the Company considering the essential components of internal control stated in the Guidance Note on Audit of Internal Financial Controls Over Financial Reporting issued by the Institute of Chartered Accountants of India. Also refer paragraph 4 of the main audit report.
Other Matter
9. Our aforesaid reports under Section 143(3)(i) of the Act on the adequacy and operating effectiveness of the internal financial controls with reference to financial statements insofar as it relates to the subsidiary companies, which are companies incorporated in India, is based on the corresponding reports of the auditors of such companies incorporated in India. Our opinion is not qualified in respect of this matter.
For Price Waterhouse Chartered Accountants LLPFirm Registration Number: 012754N/N500016
Asha RamanathanPartner
Mumbai Membership Number: 202660June 29, 2021 UDIN: 21202660AAAAAZ7578
148 Annual Report 2020-21 149• Corporate Overview • Statutory Reports • Financial StatementsI n d e p e n d e n t A u d i t o r ’ s R e p o r tN a t i o n a l P e r o x i d e L i m i t e d

NoteAs at
March 31, 2021 As at
March 31, 2020
ASSETSNon-current assets
Property, plant and equipment 4 34,148.13 37,154.03 Capital work-in-progress 4 252.73 - Intangible assets 5 65.08 85.02 Financial assets- Investments 6 74,601.72 49,239.86 - Loans 7 43.16 21.40 Income tax assets (net) 8 606.43 313.03 Other non current assets 9 130.36 382.35
1,09,847.61 87,195.69 Current assets
Inventories 10 1,695.11 2,440.22 Financial assets- Investments 11 21.41 - - Trade receivables 12 2,384.34 3,224.88 - Cash and cash equivalents 13 680.06 222.13 - Other bank balances 14 69.10 73.86 - Loans 15 11,026.85 11,034.07 - Other financial assets 16 - 898.27 Other current assets 17 382.58 344.28 Asset held for sale 18 201.51 378.46
16,460.96 18,616.17 Total assets 1,26,308.57 1,05,811.86
EQUITY & LIABILITIESEQUITY
Equity share capital 19 574.70 574.70 Other equity 20 1,06,101.92 79,635.57
1,06,676.62 80,210.27 LIABILITIESNon-current liabilities
Financial liabilities- Borrowings 21 - - - Other financial liabilities 22 137.47 3.79 Provisions 23 344.88 280.27 Deferred tax liabilities (net) 39 3,179.87 3,932.89
3,662.22 4,216.95 Current liabilities
Financial liabilities- Borrowings 24 933.33 467.93 - Trade payables 25 Dues to micro enterprises and small enterprises 304.37 15.98 Dues to others 1,699.52 1,851.53 - Other financial liabilities 26 12,515.26 18,542.99 Contract liabilities 106.08 46.91 Other current liabilities 27 296.53 110.14 Provisions 28 114.37 167.34 Income tax liabilities (net) 29 0.27 181.82
15,969.73 21,384.64 Total liabilities 19,631.95 25,601.59 Total equity and liabilities 1,26,308.57 1,05,811.86
Basis of Preparation and Significant accounting policies 2
Consolidated Balance Sheet as at March 31, 2021 (All amounts are in Indian Rupees lakhs, unless otherwise stated)
The above Consolidated Balance Sheet should be read in conjunction with the accompanying notes.
As per our report of even dateFor Price Waterhouse Chartered Accountants LLP For and on behalf of the Board of Directors ofICAI Firm registration number: 012754N/N500016 National Peroxide Limited
Asha Ramanathan Rajiv Arora Ness N. Wadia Rajesh Batra Partner Chief Executive Officer & Director Chairman Director Membership No 202660 DIN: 08730235 DIN: 00036049 DIN: 00020764
Conrad Fernandes S. Ragothaman Viraf Mehta Chief Financial Officer Director Director DIN: 00042395 DIN: 00352598
Chandukumar Parmar Minnie Bodhanwala Harshbeena Zaveri Company Secretary Director Director DIN: 00422067 DIN: 00003948 Place: Mumbai Date: June 29, 2021
NoteFor the year ended
March 31, 2021For the year ended
March 31, 2020
Income Revenue from contracts with customers 30 21,500.81 19,123.01 Other income 31 1,277.96 1,795.10
Total income 22,778.77 20,918.11 Expenses
Cost of raw materials and packing materials consumed 32 7,578.36 6,487.74 Purchase of stock-in-trade - 90.19 Changes in inventories of finished goods 33 171.28 1,644.53 Power, fuel & Water 3,395.49 2,604.54 Employee benefit expenses 34 2,558.45 2,633.49 Finance costs 35 1,265.62 273.68 Depreciation and amortisation expense 36 1,749.96 1,122.83 Other expenses 37 3,281.15 3,105.21
Total expenses 20,000.31 17,962.21 Profit before exceptional items and tax 2,778.46 2,955.90
Exceptional Items 38 1,549.30 - Profit before tax 1,229.16 2,955.90 Tax expense: 39
Current tax 134.94 546.39 Deferred tax (1,023.43) 617.95
Total tax expense (888.49) 1,164.34 Profit for the year 2,117.65 1,791.56 Other comprehensive incomeItems that will not be reclassified to profit or loss Re-measurements of the net defined benefit obligations 57.06 5.97 Fair value changes of equity instruments at FVOCI 25,362.26 (34,622.60) Income tax relating to above item (281.54) (0.91)Items that will be reclassified to profit or loss
Effective portion of gain / (losses) on cash flow hedge (73.50) 247.94 Income tax relating to above item 2.80 (86.64)
Other comprehensive income for the year, net of tax attributable to the owners of the Group
25,067.08 (34,456.24)
Total comprehensive income for the year net of tax attributable to the owners of the Group
27,184.73 (32,664.68)
Earnings per equity share- Basic and diluted 40 36.85 31.17
Basis of Preparation and Significant accounting policies 2
Consolidated Statement of Profit and Loss for the year ended March 31, 2021 (All amounts are in Indian Rupees lakhs, unless otherwise stated)
The above Consolidated Statement of Profit and Loss should be read in conjunction with the accompanying notes.
As per our report of even dateFor Price Waterhouse Chartered Accountants LLP For and on behalf of the Board of Directors ofICAI Firm registration number: 012754N/N500016 National Peroxide Limited
Asha Ramanathan Rajiv Arora Ness N. Wadia Rajesh Batra Partner Chief Executive Officer & Director Chairman Director Membership No 202660 DIN: 08730235 DIN: 00036049 DIN: 00020764
Conrad Fernandes S. Ragothaman Viraf Mehta Chief Financial Officer Director Director DIN: 00042395 DIN: 00352598
Chandukumar Parmar Minnie Bodhanwala Harshbeena Zaveri Company Secretary Director Director DIN: 00422067 DIN: 00003948 Place: Mumbai Date: June 29, 2021
150 Annual Report 2020-21 151• Corporate Overview • Statutory Reports • Financial StatementsC o n s o l i d a t e d B a l a n c e S h e e t | C o n s o l i d a t e d S t a t e m e n t o f P r o f i t a n d L o s sN a t i o n a l P e r o x i d e L i m i t e d

As per our report of even dateFor Price Waterhouse Chartered Accountants LLP For and on behalf of the Board of Directors ofICAI Firm registration number: 012754N/N500016 National Peroxide Limited
Asha Ramanathan Rajiv Arora Ness N. Wadia Rajesh Batra Partner Chief Executive Officer & Director Chairman Director Membership No 202660 DIN: 08730235 DIN: 00036049 DIN: 00020764
Conrad Fernandes S. Ragothaman Viraf Mehta Chief Financial Officer Director Director DIN: 00042395 DIN: 00352598
Chandukumar Parmar Minnie Bodhanwala Harshbeena Zaveri Company Secretary Director Director DIN: 00422067 DIN: 00003948 Place: Mumbai Date: June 29, 2021
Consolidated Statement of Changes in Equity for the year ended March 31, 2021(All amounts are in Indian Rupees lakhs, unless otherwise stated)
Equity share
capital (Note 19)
Reserves and Surplus Items of OCI
General reserve
Capital Redemption
Reserve
Special Under
Section 45IC of RBI
Act, 1934
Retained earnings
FVOCI - Equity
Instrument
FVOCI - Cash
flow heding reserve
Total other
equity
Balance as at April 1, 2019 574.70 3,372.29 0.02 154.29 40,103.54 73,439.46 (265.77) 1,16,803.83 Profit for the year - - - - 1,791.56 - - 1,791.56 Other comprehensive income (net of tax)
- - - - 3.89 (34,621.43) 161.30 (34,456.24)
Total comprehensive income for the year
- - - - 1,795.45 (34,621.43) 161.30 (32,664.68)
Transfer from retained earnings - 19.98 - 39.96 (59.94) - - - Transactions with owners in their capacity as owners: Dividend paid - - - - (3,735.55) - - (3,735.55)Dividend distribution tax - - - - (768.03) - - (768.03)Balance as at March 31, 2020 574.70 3,392.27 0.02 194.25 37,335.47 38,818.03 (104.47) 79,635.57 Profit for the year - - - - 2,117.65 - - 2,117.65 Other comprehensive income (net of tax)
- - - - 42.70 25,095.08 (70.70) 25,067.08
Total comprehensive income for the year
- - - - 2,160.35 25,095.08 (70.70) 27,184.73
Transfer from retained earnings - 5.05 - 10.08 (15.13) - - - Transactions with owners in their capacity as owners: Dividend paid - - - - (718.38) - - (718.38)Balance as at March 31, 2021 574.70 3,397.32 0.02 204.33 38,762.31 63,913.11 (175.17) 1,06,101.92 Basis of Preparation and Significant accounting policies 2
The above Consolidated Statement of Changes in Equity should be read in conjunction with the accompanying notes.
Consolidated Statement of Cash Flows for the year ended March 31, 2021(All amounts are in Indian Rupees lakhs, unless otherwise stated)
For the year ended March 31, 2021
For the year ended March 31, 2020
Cash flow from operating activities Profit before tax 1,229.16 2,955.90 Adjustments for:
Depreciation and amortization expense 1,749.96 1,122.83 Finance costs 1,265.62 273.68 Interest income (1,115.95) (1,653.62)Dividend income (30.78) (51.22)Loss on disposal of property, plant and equipment 654.77 0.03 Provision for impairment of property, plant and equipment 136.72 - Loss on account of reassessment of fair value of assets (CWIP) held for sale 173.86 - Loss on account of breakdown of machinery 367.22 - Fair value gain on investments (including gain on sale of investments) measured at FVTPL
(36.21) (24.28)
Loss Allowance - 30.15 Gain on cancellation of lease contract - (0.18)Exchange gain or loss 0.03 8.95
Operating cashflow before working capital changes 4,394.40 2,662.24 Change in operating assets and liabilities
Decrease in inventories 745.11 740.41 (Increase) / decrease in trade receivables 840.97 (195.65)(Increase) / decrease in non-current financial asset (21.76) 18.95 Decrease in current financial asset 7.22 10.80 (Increase) / decrease in other non-current assets 273.31 (0.24)(Increase) / decrease in other current assets (38.30) 407.08 (Increase) / decrease in assets held for sale 3.09 (378.46)Increase / (decrease) in trade payable 136.38 (547.91)Increase in provision 68.71 49.29 Increase / (decrease) in other current financial liabilities 67.05 (131.14)Increase / (decrease) in other liabilities 186.39 (11.36)Increase in contract liabilities 59.17 31.05
Cash generated from operations 6,721.74 2,655.06 Income taxes paid (net) (618.22) (1,044.17)Net cash inflow by operating activities 6,103.52 1,610.89 Cash flow from investing activities
Payment for property, plant and equipment (including capital work-in-progress and advances)
(2,339.72) (9,749.93)
Payment for software development cost - (104.96)Proceeds from sale of property, plant and equipment 223.04 0.08 Payments for purchase of investments (12,129.00) (26,668.63)Proceeds from sale of investments 12,144.19 17,877.49 Intercorporate deposits given to a related party (500.00) (650.00)Receipts of Intercorporate deposits given to a related party 500.00 3,500.00 Intercorporate deposits given to other companies (5,000.00) (26,500.00)Receipts of Intercorporate deposits given to other companies 5,000.00 36,500.00 Interest received 1,338.68 1,517.07 Dividend received 30.78 51.22 Movement in bank balances which are not considered as cash and cash equivalents 4.76 347.27
Net cash outflow from investing activities (727.27) (3,880.39)
152 Annual Report 2020-21 153• Corporate Overview • Statutory Reports • Financial StatementsC o n s o l i d a t e d S t a t e m e n t o f C h a n g e s i n E q u i t y | C o n s o l i d a t e d S t a t e m e n t o f C a s h F l o w sN a t i o n a l P e r o x i d e L i m i t e d

For the year ended March 31, 2021
For the year ended March 31, 2020
Cash flow from financing activities Proceeds from long term borrowings - 7,785.38 Repayment of long term borrowings (3,395.26) - Proceeds from / (repayment of) short term borrowings 465.40 (532.07)Dividends paid to company shareholders (including DDT) (723.14) (4,492.73)Principal elements of lease payments (8.98) (11.58)Interest paid (1,256.34) (1,336.36)
Net cash inflow / (outflow) from financing activities (4,918.32) 1,412.64 Net increase/ (decrease) in cash and cash equivalents 457.93 (856.86)Cash and cash equivalents at the beginning of the year 222.13 1,078.99 Cash and cash equivalents at the end of the year 680.06 222.13 Cash and cash equivalents comprises of: Cash and bank balances (refer note 13) 680.06 222.13 Non-Cash Investing activity Acquisition of right of use (ROU) assets - 23.05 Note:
The above cash flow statement has been prepared under the ‘Indirect Method’ as set out in the Accounting Standard (Ind AS) 7- “Cash Flow Statements” as notified under Companies (Accounts) Rules, 2015.Basis of Preparation and Significant accounting policies 2
Consolidated Statement of Cash Flows for the year ended March 31, 2021(All amounts are in Indian Rupees lakhs, unless otherwise stated)
The above Consolidated Cash flow should be read in conjunction with the accompanying notes.
As per our report of even dateFor Price Waterhouse Chartered Accountants LLP For and on behalf of the Board of Directors ofICAI Firm registration number: 012754N/N500016 National Peroxide Limited
Asha Ramanathan Rajiv Arora Ness N. Wadia Rajesh Batra Partner Chief Executive Officer & Director Chairman Director Membership No 202660 DIN: 08730235 DIN: 00036049 DIN: 00020764
Conrad Fernandes S. Ragothaman Viraf Mehta Chief Financial Officer Director Director DIN: 00042395 DIN: 00352598
Chandukumar Parmar Minnie Bodhanwala Harshbeena Zaveri Company Secretary Director Director DIN: 00422067 DIN: 00003948 Place: MumbaiDate: June 29, 2021
1) General information:
National Peroxide Limited (“NPL”, “Company”) and its subsidiary company comprise the Group. National Peroxide Limited is a public limited Company established in 1954 and is listed on BSE Limited, Mumbai. NPL a pioneer in India for peroxygen chemicals is the largest manufacturer of Hydrogen Peroxide in India, with an installed capacity of 150 KTPA on 50% w/w. basis. Company’s registered office is situated at Neville House, J. N. Heredia Marg, Ballard Estate, Mumbai - 400 001.
2) Significant accounting policies and critical estimates and judgments:
2.1 Basis of preparation, measurement and significant accounting policies
The principal accounting policies applied in the preparation of these consolidated financial statements are set out below. These policies have been consistently applied to all the years presented, unless otherwise stated. The financial statements are for the group consisting of National Peroxide Limited (the Company) and its subsidiary.
(a) Basis of preparation
(i) Compliance with Ind AS
The consolidated financial statements comply in all material aspects with Indian Accounting Standards (Ind AS) notified under Section 133 of the Companies Act, 2013 (the Act) [Companies (Indian Accounting Standards) Rules, 2015] and other relevant provisions of the Act.
(ii) Historical cost convention
The financial statements have been prepared on historical cost basis, except for the following:
• Certain financial assets and financial liabilities are measured at fair value (including derivative instruments);
• Defined benefit plans – plan assets are measured at fair value;
• Assets held for sale – measured at fair value less cost to sell.
(iii) New and amended standards adopted by the group
The Group has applied following standards and amendments for the first time for their annual reporting period commencing April 1, 2020:
• Definition of Material – amendments to Ind AS 1 and Ind AS 8
• Definition of a Business – amendments to Ind AS 103
• COVID-19 related concessions – amendments to Ind AS 116
• Interest Rate Benchmark Reform – amendments to Ind AS 109 and Ind AS 107
These amendments did not have any impact on the amounts recognised in prior periods and are not expected to significantly affect the current or future periods.
155• Corporate Overview • Statutory Reports • Financial StatementsN o t e s t o t h e C o n s o l i d a t e d F i n a n c i a l S t a t e m e n t s
Notes to the Consolidated Financial Statements as of and for the year ended March 31, 2021 (All amounts are in Indian Rupees lakhs, unless otherwise stated)
154 Annual Report 2020-21N a t i o n a l P e r o x i d e L i m i t e d

(iv) Current vis-à-vis non-current classification
The assets and liabilities reported in the balance sheet are classified on a “current / non-current basis”.
An asset is classified as current when it is expected to be realised or intended to be sold or consumed in normal operating cycle, held primarily for the purpose of trading, expected to be realised within twelve months after the reporting period, or cash or cash equivalent unless restricted from being exchanged or used to settle a liability for at least twelve months after the reporting period.
A liability is classified as current when it is expected to be settled in normal operating cycle, it is held primarily for the purpose of trading, it is due to be settled within twelve months after the reporting period, or there is no unconditional right to defer the settlement of the liability for at least twelve months after the reporting period.
The group has determined its operating cycle as twelve months for the purpose of current – non-current classification of assets and liabilities.
Deferred tax assets and liabilities, and all assets and liabilities which are not current are classified as non-current assets and liabilities.
The derivatives designated in hedging relationship and separated embedded derivatives are classified basis the hedged item and host contract respectively.
(b) Principles of consolidation
(i) Subsidiary is the entity over which the group has control. The group controls an entity when the group is exposed to, or has rights to, variable returns from its involvement with the entity and has the ability to affect those returns through its power to direct the relevant activities of the entity. Subsidiary is fully consolidated from the date on which control is transferred to the group. They are deconsolidated from the date that control ceases.
(ii) The group combines the financial statements of the parent and its subsidiary line by line adding together like items of assets, liabilities, equity, income and expenses. Intercompany transactions, balances and unrealised gains on transactions between group companies are eliminated. Unrealised losses are also eliminated unless the transaction provides evidence of an impairment of the transferred asset. Accounting policies of subsidiary have been changed where necessary to ensure consistency with the policies adopted by the group.
(iii) The financial statements of the subsidiary used in consolidation is drawn up to the same reporting date as that of the parent company i.e. year ended March 31, 2021.
(iv) Following Subsidiary has been considered in the preparation of consolidated financial statements:
Name of the Company Country of Incorporation % of Holding and voting power either directly or indirectly through subsidiary as at 31.03.2021
Naperol Investments Limited India 100% (March 31, 2021 100%)
NPL Chemicals Limited (Incorporated on July 29, 2020)
India 100%
(c) Segment reporting:
Operating segments are reported in a manner consistent with the internal reporting provided to the Chief Operating Decision-Maker (CODM).
The Chief Executive Officer and Director of National Peroxide Limited has been identified as CODM and he is responsible for allocating resources, assess the financial performance of the group and make strategic decisions.
The group has identified one reportable segment ‘manufacturing of peroxygens’ based on information reviewed by the CODM.
(d) Foreign currency translation:
(i) Functional and presentation currency
Items included in the financial statements of each of the group entities are measured using the currency of the primary economic environment in which the entity operates (‘the functional currency’). The consolidated financial statements are presented in ‘Indian Rupees’ (INR), which is the group’s functional and presentation currency.
(ii) Transactions and balances
Foreign currency transactions are translated into the functional currency using the exchange rates at the dates of the transactions. Foreign exchange gains and losses resulting from the settlement of such transactions and from the translation of monetary assets and liabilities denominated in foreign currencies at year end exchange rates are generally recognized in profit or loss. They are deferred in equity if they relate to qualifying cash flow hedges.
Non monetary items that are measured at fair value in a foreign currency are translated using the exchange rates at the date when the fair value was determined. Translation differences on assets and liabilities carried at fair value are reported as part of the fair value gain or loss. For example, translation differences on non monetary assets and liabilities such as equity instruments held at fair value through profit or loss are recognized in profit or loss as part of the fair value gain or loss and translation differences on nonmonetary assets such as equity investments classified as FVOCI are recognized in other comprehensive income.
(e) Revenue recognition and other income recognition:
Revenue from sale of goods
Revenue is generated primarily from sale of peroxygens. Revenue is recognised at the point in time when the performance obligation is satisfied and control of the goods is transferred to the customer upon dispatch or delivery, in accordance with the terms of customer contracts. Revenue is recognised at an amount that the group expects to receive from customers that is net of trade discounts, rebates and state value added tax, service tax and goods and service tax (GST).
A contract liability is the obligation to transfer goods to the customer for which the group has received consideration from the customer. Contract liabilities are recognised as revenue when the group performs under the contract.
Interest income
Interest income from debt instruments is recognised using the effective interest rate method. The effective interest rate is the rate that exactly discounts estimated future cash receipts through the expected life of the
156 Annual Report 2020-21 157• Corporate Overview • Statutory Reports • Financial StatementsN o t e s t o t h e C o n s o l i d a t e d F i n a n c i a l S t a t e m e n t sN a t i o n a l P e r o x i d e L i m i t e d
Notes to the Consolidated Financial Statements as of and for the year ended March 31, 2021 (All amounts are in Indian Rupees lakhs, unless otherwise stated)
Notes to the Consolidated Financial Statements as of and for the year ended March 31, 2021 (All amounts are in Indian Rupees lakhs, unless otherwise stated)

financial asset to the gross carrying amount of a financial asset. When calculating the effective interest rate, the group estimates the expected cash flows by considering all the contractual terms of the financial instrument (for example prepayment, extension, call and similar options) but does not consider the expected credit losses.
Dividends
Dividends are received from financial assets at fair value through profit or loss and at FVOCI. Dividends are recognised in profit or loss only when the right to receive payment is established, it is probable that the economic benefits associated with the dividend will flow to the group, and the amount of the dividend can be measured reliably.
(f) Income tax:
The income tax expense or credit for the period is the tax payable on the current period’s taxable income based on the applicable income tax rate for each jurisdiction adjusted by changes in deferred tax assets and liabilities attributable to temporary differences and to unused tax losses.
The current income tax charge is calculated on the basis of the tax laws enacted or substantively enacted at the end of the reporting period in the countries where the Company and its subsidiary operates and generates taxable income. Management periodically evaluates positions taken in tax returns with respect to situations in which applicable tax regulation is subject to interpretation.
Deferred income tax is provided in full, using the liability method, on temporary differences arising between the tax base of assets and liabilities and their carrying amounts in the consolidated financial statements. Deferred income tax is not accounted for if it arises from initial recognition of an asset or liability in a transaction other than a business combination that at the time of the transaction affects neither accounting profit nor taxable profit (tax loss). Deferred income tax is determined using tax rates (and laws) that have been enacted or substantially enacted by the end of the reporting period and are expected to apply when the related deferred income tax asset is realised or the deferred income tax liability is settled.
Deferred tax assets are recognised for all deductible temporary differences and unused tax losses only if it is probable that future taxable amounts will be available to utilise those temporary differences and losses.
Deferred tax liabilities are not recognised for temporary differences between the carrying amount and tax bases of investments in subsidiaries, where the group is able to control the timing of the reversal of the temporary differences and it is probable that the differences will not reverse in the foreseeable future.
Deferred tax assets are not recognised for temporary differences between the carrying amount and tax bases of investments in subsidiaries, where it is not probable that the differences will reverse in the foreseeable future and taxable profit will not be available against which the temporary difference can be utilised.
Deferred tax assets and liabilities are offset when there is a legally enforceable right to offset current tax assets and liabilities and when the deferred tax balances relate to the same taxation authority. Current tax assets and tax liabilities are offset where the entity has a legally enforceable right to offset and intends either to settle on a net basis or to realise the asset and settle the liability simultaneously.
Current and deferred tax is recognised in Profit or Loss, except to the extent that it relates to items recognised in other comprehensive income or directly in equity. In this case, the tax is also recognized in other comprehensive income or directly in equity, respectively.
(g) Leases:
Effective from April 1, 2019, the Group has adopted Ind AS 116 “Leases” and accordingly accounted for leases as below
As a lessee
From April 1, 2019, leases are recognized as a right-of-use asset and corresponding liability at the date which the lease asset is available for use by the Group. Contracts may contain both lease and non-lease components. The Group allocates the consideration in the contract to the lease and non-lease components based on relative stand-alone prices.
Assets and liabilities arising from lease are initially measured on present value basis. Lease liabilities include the net present value of the following lease payments:
- Fixed payments (including in-substance fixed payments), less any lease incentives receivable
- Variable lease payments that are based on an index or a rate, initially measured using the index or rate as at the commencement date
- Amounts expected to be payable by the Group under residual value guarantees
- Exercise price of the purchase option if the Group is reasonably certain to exercise that option, and
- payments of penalties for terminating the lease, if the lease term reflects the Group exercising that option.
Lease payments to be made under reasonably certain extension options are also included in the measurement of the liability. The lease payments are discounted using the interest rate implicit in the lease. If the rate cannot be readily determined, the lessee’s incremental borrowing rate is used, being the rate that the individual lessee would have to pay to borrow the funds necessary to obtain an asset of similar value to the right-of-use in a similar economic environment with similar terms, security and conditions.
Lease payments are allocated between principal and finance cost. The finance cost is charged to profit or loss over the lease period so as to produce a constant periodic rate of interest on the remaining balance of the liability for each peiod.
Variable lease payments that depend on any key variable/condition are recognized in profit or loss in the period in which the condition that triggers those payment occurs. The Group is exposed to potential future increases in variable lease payments based on index or rate, which are not included in the lease liability until they take effect. When adjustments to lease payments based on index or rate or rate take effect, the lease liability is reassessed and adjusted against the right-of-use asset
Right-of-use assets are measured at cost comprising the following
- the amount of the initial measurement of lease liability
- any lease payments made at or before the commencement of date less any lease incentives received
- any initial direct costs, and
- restoration costs.
Right-of-use assets are generally depreciated over the shorter of the asset’s useful life and lease term on a straight line basis. If the Group exercises the purchase option, the right-of-use asset is depreciated over the underlying asset’s useful life.
158 Annual Report 2020-21 159• Corporate Overview • Statutory Reports • Financial StatementsN o t e s t o t h e C o n s o l i d a t e d F i n a n c i a l S t a t e m e n t sN a t i o n a l P e r o x i d e L i m i t e d
Notes to the Consolidated Financial Statements as of and for the year ended March 31, 2021 (All amounts are in Indian Rupees lakhs, unless otherwise stated)
Notes to the Consolidated Financial Statements as of and for the year ended March 31, 2021 (All amounts are in Indian Rupees lakhs, unless otherwise stated)

Short-term leases
The Group recognizes the lease payments associated with these leases as an expense on a straight-line basis over the lease term.
(h) Impairment of non-financial assets:
Assets are tested for impairment, wherever events or changes in circumstances indicate that the carrying amount may not be recoverable. An impairment loss is recognised for the amount by which the asset’s carrying amount exceeds its recoverable amount. The recoverable amount is the higher of an asset’s fair value less costs of disposal and value in use. For the purposes of assessing impairment, assets are grouped at the lowest levels for which there are separately identifiable cash inflows which are largely independent of the cash inflows from other assets or groups of assets (cash-generating units). Non-financial assets that suffered an impairment are reviewed for possible reversal of the impairment at the end of each reporting period.
(i) Cash and Cash Equivalents:
Cash and cash equivalents includes cash on hand, cheques on hand, deposits held at call with financial institutions, other short term, highly liquid investments with original maturities of three months or less that are readily convertible to known amounts of cash and which are subject to an insignificant risk of changes in value, and bank overdrafts. Bank overdrafts are shown within borrowings in current liabilities in the Balance sheet.
(j) Trade Receivables:
Trade receivables are amounts due from customers for goods sold in the ordinary course of business. Trade receivables are recognised initially at the amount of consideration that is unconditional unless they contain significant financing components, when they are recognised at fair value. The group holds the trade receivables with the objective to collect the contractual cash flows and therefore measures them subsequently at amortised cost using the effective interest method, less loss allowance.
(k) Inventories:
Inventories are valued at lower of cost and net realisable value. In the case of raw materials, packing materials and stores and spares parts, cost is determined in accordance with the moving weighted average principle. Costs include the purchase price, non – refundable taxes and delivery and handling costs. Cost of finished goods includes all costs of purchases, direct materials, direct labour and appropriate proportion of variable and fixed overheads expenditure. Cost of inventories also include all other costs incurred in bringing the inventories to their present location and condition. The net realisable value is the estimated selling price in the ordinary course of business less the estimated costs of completion and estimated costs necessary to make the sale.
(l) Non current assets held for sale
Non- current assets are classified as held for sale if their carrying amount will be recovered principally through a sale transaction rather than through continuing use and sale is considered highly probable. They are measured at lower of their carrying amount and fair value less costs to sell.
An impairment loss is recognized for any initial or subsequent write-down of the asset to fair value less costs to sell. A gain is recognized for subsequent increase in fair value less costs to sell of an asset, but not in excess of any cumulative impairment loss previously recognized. A gain or loss not previously recognized by the date of the sale of the non -current asset is recognized at the date of de-recognition.
(m) Investments and other financial assets:
(i) Classification
The group classifies its financial assets in the following measurement categories:
• those to be measured subsequently at fair value (either through Other Comprehensive Income or through profit or loss) and
• those measured at amortised cost.
The classification depends on the entity’s business model for managing the financial assets and the contractual terms of the cash flows.
For assets measured at fair value, gains and losses will either be recorded in profit or loss or other comprehensive income. For investments in equity instruments, this will depend on whether the group has made an irrevocable election at the time of initial recognition to account for the equity investment at fair value through other comprehensive income.
(ii) Measurement
At initial recognition, the group measures financial assets at its fair value plus, in the case of financial assets not at fair value through profit or loss, transaction costs that are directly attributable to the acquisition of the financial assets. Transaction costs of financial assets carried at fair value through profit or loss are expensed in the Consolidated Statement of Profit or Loss.
Debt instruments
Subsequent measurement of debt instruments depends on the group’s business model for managing the asset and the cash flow characteristics of the asset. There are three measurement categories into which the group classifies its debt instruments:
• Amortised cost: Assets that are held for collection of contractual cash flows where those cash flows represent solely payments of principal and interest are measured at amortised cost. Interest income from these financial assets is included in finance income using the effective interest rate method. Any gain or loss arising on derecognition is recognised directly in profit or loss and presented in other gains/(losses). Impairment losses are presented as separate line item in the Consolidated Statement of Profit and Loss.
• Fair value through other comprehensive income (FVOCI): Assets that are held for collection of contractual cash flows and for selling the financial assets, where the assets’ cash flows represent solely payments of principal and interest, are measured at FVOCI. Movements in the carrying amount are taken through OCI, except for the recognition of impairment gains or losses, interest income and foreign exchange gains and losses which are recognised in profit and loss. When the financial asset is derecognised, the cumulative gain or loss previously recognised in OCI is reclassified from equity to profit or loss and recognised in other gains/(losses). Interest income from these financial assets is included in other income using the effective interest rate method. Foreign exchange gains and losses are presented in other gains/(losses) and impairment expenses are presented as separate line item in Consolidated Statement of Profit and Loss.
• Fair value through profit or loss: Assets that do not meet the criteria for amortised cost or FVOCI are measured at fair value through profit or loss. A gain or loss on a debt investment that is subsequently
160 Annual Report 2020-21 161• Corporate Overview • Statutory Reports • Financial StatementsN o t e s t o t h e C o n s o l i d a t e d F i n a n c i a l S t a t e m e n t sN a t i o n a l P e r o x i d e L i m i t e d
Notes to the Consolidated Financial Statements as of and for the year ended March 31, 2021 (All amounts are in Indian Rupees lakhs, unless otherwise stated)
Notes to the Consolidated Financial Statements as of and for the year ended March 31, 2021 (All amounts are in Indian Rupees lakhs, unless otherwise stated)

measured at fair value through profit or loss is recognised in profit or loss and presented net within other gains/(losses) in the period in which it arises. Interest income from these financial assets is included in other income.
Equity instruments
The group subsequently measures all equity investments at fair value. The group’s management has elected to present fair value gains and losses on equity investments in Other Comprehensive Income, there is no subsequent reclassification of fair value gains and losses to profit or loss following the derecognition of the investment. Dividends from such investments are recognised in the Consolidated Statement of Profit and Loss as other income when the group’s right to receive payments is established.
Changes in fair value of financial assets at fair value through profit or loss are recognized in other gain / (losses) in the Consolidated Statement of Profit and Loss. Impairment losses (and reversal of impairment losses), if any on equity investments measured at FVOCI are not reported separately from other changes in fair value.
(iii) Derivatives and hedging activity
The group enters into derivative financial instruments to manage its exposure to interest rate and foreign exchange rate risks such as cross currency interest rate swaps.
Derivatives are initially recognised at fair value on the date a derivative contract is entered into and are subsequently re-measured to their fair value at the end of each reporting period. The accounting for subsequent changes in fair value depends on whether the derivative is designated as a hedging instrument, and if so, the nature of the item being hedged and the type of hedge relationship designated.
The group designates derivatives as either (i) hedges of the fair value of recognised assets or liabilities (fair value changes) or (ii) hedges of a particular risk associated with the cash flows of recognised assets and liabilities (cash flow hedges). The group has designated the cross-currency interest rate swap as a cash flow hedge for changes in both interest rate and foreign exchange rates.
At the inception of the hedge relationship, the group documents the relationship between the hedging instrument and the hedged item, along with its risk management objectives and its strategy for undertaking various hedge transactions. Furthermore, at the inception of the hedge and on an ongoing basis, the group documents whether the hedging instrument is highly effective in offsetting changes in fair values or cash flows of the hedged item attributable to the hedged risk.
The full fair value of a hedging derivative is classified as a non-current asset or liability when the remaining maturity of the hedged item is more than 12 months; it is classified as a current asset or liability when the remaining maturity of the hedged item is less than 12 months.
(a) Cash flow hedges that qualify for hedge accounting
The effective portion of changes in the fair value of derivatives that are designated and qualify as cash flow hedges is recognised in cash flow hedging reserve within equity. The gain or loss relating to the ineffective portion is recognised immediately in profit or loss, within other gains/(losses).
Amounts previously recognised in other comprehensive income and accumulated in equity relating to effective portion as described above are reclassified to profit or loss in the periods when the hedged item affects profit or loss, in the same line as the recognised hedged item. However, when the hedged forecast transaction results in the recognition of a non-financial asset or a non-financial liability, such
gains and losses are transferred from equity (but not as a reclassification adjustment) and are included in the initial measurement of the cost of the non-financial asset or non-financial liability.
Hedge accounting is discontinued when the hedging instrument expires or is sold, terminated, or exercised, or when it no longer qualifies for hedge accounting. Any gain or loss recognised in other comprehensive income and accumulated in equity at that time remains in equity and is recognised when the forecast transaction is ultimately recognised in profit or loss. When a forecast transaction is no longer expected to occur, the gain or loss accumulated in equity is reclassified immediately in profit or loss.
If the hedge ratio for risk management purposes is no longer optimal but the risk management objective remains unchanged and the hedge continues to qualify for hedge accounting, the hedge relationship will be rebalanced by adjusting either the volume of the hedging instrument or the volume of the hedged item so that the hedge ratio aligns with the ratio used for risk management purposes. Any hedge ineffectiveness is calculated and accounted for in profit or loss at the time of the hedge relationship rebalancing.
(b) Fair value hedges that qualify for hedge accounting
Changes in fair value of the designated portion of derivatives that qualify as fair value hedges are recognised in profit or loss immediately, together with any changes in the fair value of the hedged asset or liability that are attributable to the hedged risk.
The change in the fair value of the designated portion of hedging instrument and the change in the hedged item attributable to the hedged risk are recognised in profit or loss in the line item relating to the hedged item.
Hedge accounting is discontinued when the hedging instrument expires or is sold, terminated, or exercised, or when it no longer qualifies for hedge accounting. The fair value adjustment to the carrying amount of the hedged item arising from the hedged risk is amortised to profit or loss from that date.
(c) Embedded derivatives
Derivatives embedded in a host contract that is an asset within the scope of Ind AS 109 are not separated. Financial assets with embedded derivatives are considered in their entirety when determining whether their cash flows are solely payment of principal and interest.
Derivatives embedded in all other host contract are separated only if the economic characteristics and risks of the embedded derivative are not closely related to the economic characteristics and risks of the host and are measured at fair value through profit or loss. Embedded derivatives closely related to the host contracts are not separated.
(d) Derivatives that are not designated as hedges
The Group enters into certain derivative contracts to hedge risk which are not designated as hedges. Such contracts are accounted for at fair value through profit or loss and are included in other gains/(losses).
162 Annual Report 2020-21 163• Corporate Overview • Statutory Reports • Financial StatementsN o t e s t o t h e C o n s o l i d a t e d F i n a n c i a l S t a t e m e n t sN a t i o n a l P e r o x i d e L i m i t e d
Notes to the Consolidated Financial Statements as of and for the year ended March 31, 2021 (All amounts are in Indian Rupees lakhs, unless otherwise stated)
Notes to the Consolidated Financial Statements as of and for the year ended March 31, 2021 (All amounts are in Indian Rupees lakhs, unless otherwise stated)

(iv) Impairment of financial assets
The group assesses on a forward looking basis the expected credit losses associated with its assets carried at amortised cost. The impairment methodology applied depends on whether there has been a significant increase in credit risk.
For trade receivables only, the group applies the simplified approach permitted by Ind AS 109- ‘Financial Instruments’, which requires expected lifetime losses to be recognised from initial recognition of the receivables.
(v) Derecognition of financial assets
A financial asset is derecognised only when:
• The group has transferred the rights to receive cash flows from the financial asset or
• retains the contractual rights to receive the cash flows of the financial asset, but assumes a contractual obligation to pay the cash flows to one or more recipients.
Where the entity has transferred an asset, the group evaluates whether it has transferred substantially all risks and rewards of ownership of the financial asset. In such cases, the financial asset is derecognised. Where the entity has not transferred substantially all risks and rewards of ownership of the financial asset, the financial asset is not derecognised.
Where the entity has neither transferred a financial asset nor retains substantially all risks and rewards of ownership of the financial asset, the financial asset is derecognised if the group has not retained control of the financial asset. Where the group retains control of the financial asset, the asset is continued to be recognised to the extent of continuing involvement in the financial asset.
(n) Offsetting Financial Instruments:
Financial assets and liabilities are offset and the net amount reported in the balance sheet when there is a legally enforceable right to offset the recognised amounts and there is an intention to settle on a net basis or realise the asset and settle the liability simultaneously. The legally enforceable right must not be contingent on future events and must be enforceable in the normal course of business and in the event of default, insolvency or bankruptcy of the group or the counterparty.
(o) Property, plant and equipment:
Freehold land is carried at historical cost. All other items of property, plant and equipment are stated at historical cost less depreciation and impairment, if any. Historical cost includes expenditure that is directly attributable to the acquisition of the items.
Subsequent costs are included in the asset’s carrying amount or recognised as a separate asset, as appropriate, only when it is probable that future economic benefits associated with the item will flow to the group and the cost of the item can be measured reliably. The carrying amount of any component accounted for as a separate asset is derecognised when replaced. All other repairs and maintenance are charged to profit or loss during the reporting period in which they are incurred.
Expenditure incurred on assets which are not ready for their intended use comprising direct cost, related incidental expenses and attributable borrowing cost are disclosed under Capital Work-in-Progress.
Transition to Ind AS:
On transition to Ind AS, the group has elected to continue with the carrying value of all of its property, plant and equipment recognised as at April 1, 2016 measured as per the previous GAAP and use that carrying value as deemed cost of the property, plant and equipment.
Depreciation methods, estimated useful lives and residual value:
Depreciation is calculated using Straight Line Method (SLM) to allocate their cost, net of their residual values, over their estimated useful lives. The useful lives have been determined based on technical evaluation done by the management which is in line with those specified by Schedule II to the Companies Act, 2013.
An asset’s carrying amount is written down immediately to its recoverable amount if the asset’s carrying amount is greater than its estimated recoverable amount.
Gains and losses on disposals are determined by comparing proceeds with carrying amount. These are included in profit or loss within other gains / (losses).
The estimated useful lives of the property, plant and equipment are as under:
Sr No
Class of assets Estimated useful life
a Freehold Building 10 - 60 years
b Furniture & Fixtures 10 years
c Plant & Machinery 8 - 25 years
d Office Equipment 5 years
e Computer 3 years
f Vehicle 6 years
(p) Intangible assets
Intangible assets being computer software, are stated at acquisition cost, net of accumulated amortization and accumulated impairment losses, if any.
Amortization is recognised on a straight-line basis over their estimated useful lives. The estimated useful life and amortization method are reviewed at the end of each reporting period, with the effect of any changes in estimate being accounted for on a prospective basis.
Gains or losses arising from the retirement or disposal of an intangible asset are determined as the difference between the disposal proceeds and the carrying amount of the asset and are recognised as income or expense in the Statement of Profit and Loss.
Cost of software is amortised over a period of 3 years being the estimated useful life
(q) Trade and other payables:
These amounts represent liabilities for goods and services provided to the group prior to the end of financial year which are unpaid. Trade and other payables are presented as current liabilities unless the payment is not due within 12 months of reporting period. Trade and other payables are initially recognized at fair value and subsequently measured at amortised cost using the effective interest method.
164 Annual Report 2020-21 165• Corporate Overview • Statutory Reports • Financial StatementsN o t e s t o t h e C o n s o l i d a t e d F i n a n c i a l S t a t e m e n t sN a t i o n a l P e r o x i d e L i m i t e d
Notes to the Consolidated Financial Statements as of and for the year ended March 31, 2021 (All amounts are in Indian Rupees lakhs, unless otherwise stated)
Notes to the Consolidated Financial Statements as of and for the year ended March 31, 2021 (All amounts are in Indian Rupees lakhs, unless otherwise stated)

(r) Borrowings:
Borrowings are initially recognised at fair value, net of transaction costs incurred. Borrowings are subsequently measured at amortised cost. Any difference between the proceeds (net of transaction costs) and the redemption amount is recognised in profit or loss over the period of borrowings using the effective interest method. Fees paid on the establishment of loan facilities are recognised as transaction costs of the loan to the extent that it is probable that some or all of the facility will be drawn down. In this case, the fee is deferred until the draw down occurs. To the extent there is no evidence that it is probable that some or all of the facility will be drawn down, the fee is capitalised as a prepayment for liquidity services and amortised over the period of the facility to which it relates.
Borrowings are removed from the Balance Sheet when the obligation specified in the contract is discharged, cancelled or expired. The difference between the carrying amount of a financial liability that has been extinguished or transferred to another party and the consideration paid, including any non-cash assets transferred or liabilities assumed, is recognised in profit or loss as other gains / (losses).
Borrowings are classified as current liabilities unless the group has an unconditional right to defer settlement of the liability for at least 12 months after the reporting period. Where there is a breach of a material provision of a long-term loan arrangement on or before the end of the reporting period with the effect that the liability becomes payable on demand on the reporting date, the group does not classify the liability as current, if the lender agreed, after the reporting period and before the approval of the financial statements for issue, not to demand payment as a consequence of the breach.
(s) Borrowing costs:
General and specific borrowing costs that are directly attributable to the acquisition, construction or production of a qualifying asset are capitalised during the period of time that is required to complete and prepare the asset for its intended use or sale. Qualifying assets are assets that necessarily take a substantial period of time to get ready for their intended use or sale.
Investment income earned on the temporary investment of specific borrowings pending their expenditure on qualifying assets is deducted from the borrowing costs eligible for capitalisation. Other borrowing costs are expensed in the period in which they are incurred.
(t) Provisions and Contingent Liabilities:
Provisions
Provisions are recognised when the group has a present legal or constructive obligation as a result of past events; it is probable that an outflow of resources will be required to settle the obligation; and the amount has been reliably estimated.
Provisions are measured at the present value of management’s best estimate of the expenditure required to settle the present obligation at the end of the reporting period. The discount rate used to determine the present value is a pre-tax rate that reflects current market assessments of the time value of money and the risks specific to the liability. The increase in the provision due to the passage of time is recognised as interest expense.
Contingent liabilities
Contingent liabilities are disclosed when there is a possible obligation arising from past events, the existence of which will be confirmed only by the occurrence or non-occurrence of one or more uncertain future events not wholly within the control of the group. A present obligation that arises from past events where it is either not
probable that an outflow of resources will be required to settle or reliable estimate of the amount cannot be made, is termed as contingent liability.
(u) Employee benefits:
(i) Short-term obligations
Liabilities for wages and salaries, including non-monetary benefits that are expected to be settled wholly within 12 months after the end of the period in which the employees render the related service are recognised in respect of employees’ services up to the end of the reporting period and are measured at the amounts expected to be paid when the liabilities are settled. The liabilities are presented as current employee benefit obligations in the balance sheet.
(ii) Post employee obligations
The group operates the following post-employment schemes:
- defined benefit plans such as gratuity, pension and provident fund contributions made to a trust in case of certain employees
- defined contribution plans such as provident fund and superannuation fund.
Pension and gratuity obligations
The liability or asset recognised in the balance sheet in respect of defined benefit pension and gratuity plans is the present value of the defined benefit obligation at the end of the reporting period less the fair value of plan assets. The defined benefit obligation is calculated annually by actuaries using the projected unit credit method.
The present value of the defined benefit obligation is determined by discounting the estimated future cash outflows by reference to market yields at the end of the reporting period on government bonds that have terms approximating to the terms of the related obligation.
The net interest cost is calculated by applying the discount rate to the net balance of the defined benefit obligation and the fair value of plan assets. This cost is included in employee benefit expense in the Statement of Profit and Loss.
Remeasurement gains and losses arising from experience adjustments and changes in actuarial assumptions are recognised in the period in which they occur, directly in Other Comprehensive Income. They are included in Retained Earnings in the Statement of Changes in Equity and in the Balance Sheet.
Changes in the present value of the defined benefit obligation resulting from plan amendments or curtailments are recognised immediately in profit or loss as past service cost.
Provident fund contributions made to a trust administered by the Group
In respect of certain employees, provident fund contributions are made to a trust administered by the group. The interest rate payable to the members of the trust shall not be lower than the statutory rate of interest declared by the Central Government under the Employees Provident Funds and Miscellaneous Provisions Act, 1952 and shortfall, if any, shall be made good by the group. The liability in respect of the shortfall of the interest earnings of the fund is determined on the basis of actuarial valuation.
166 Annual Report 2020-21 167• Corporate Overview • Statutory Reports • Financial StatementsN o t e s t o t h e C o n s o l i d a t e d F i n a n c i a l S t a t e m e n t sN a t i o n a l P e r o x i d e L i m i t e d
Notes to the Consolidated Financial Statements as of and for the year ended March 31, 2021 (All amounts are in Indian Rupees lakhs, unless otherwise stated)
Notes to the Consolidated Financial Statements as of and for the year ended March 31, 2021 (All amounts are in Indian Rupees lakhs, unless otherwise stated)
Defined contribution plans
The group pays provident fund contributions to publicly administered provident funds as per local regulations and superannuation contributions to superannuation fund. The group has no further payment obligations once the contributions have been paid. The contributions are accounted for as defined contribution plans and the contributions are recognised as employee benefit expense when they are due
(iii) Other long-term employee benefit obligations
The liabilities for earned leave and sick leave are not expected to be settled wholly within 12 months after the end of the period in which the employees render the related service. They are therefore measured as the present value of expected future payments to be made in respect of services provided by employees up to the end of the reporting period using the projected unit credit method. The benefits are discounted using the market yields at the end of the reporting period that have terms approximating to the terms of the related obligation. Remeasurements as a result of experience adjustments and changes in actuarial assumptions are recognised in Statement of Profit or Loss.
The obligations are presented as current liabilities in the balance sheet if the entity does not have an unconditional right to defer settlement for at least twelve months after the reporting period, regardless of when the actual settlement is expected to occur.
(v) Contributed equity:
Equity shares are classified as equity.
Incremental costs directly attributable to the issue of new shares or options are shown in equity as a deduction, net of tax from the proceeds.
(w) Earnings per share:
Basic earnings per share
Basic earnings per share is calculated by dividing:
- the profit attributable to owners of the group
- by the weighted average number of equity shares outstanding during the financial year.
Diluted earnings per share
Diluted earnings per share adjusts the figures used in the determination of basic earnings per share to take into account:
- the after income tax effect of interest and other financing costs associated with dilutive potential equity shares, and
- the weighted average number of additional equity shares that would have been outstanding assuming the conversion of all dilutive potential equity shares.
(x) Exceptional Item:
If the management believes that losses are material and is relevant to an understanding of the entity’s financial performance, it discloses the same as an exceptional item.
(y) Rounding of Amounts:
All amounts disclosed in financial statements and notes have been rounded off to the nearest lakhs as per the requirement of Schedule III, unless otherwise stated.
3) Critical accounting estimates and judgements:
The preparation of consolidated financial statements requires the use of accounting estimates, which, by definition, will seldom equal the actual results. Management also needs to exercise judgement in applying the Group’s accounting policies. This note provides an overview of the areas that involved a higher degree of judgement or complexity, and of items, which are more likely to be materially adjusted due to estimates and assumptions turning out to be different from those originally assessed.
• Estimation of useful life
Useful lives of property, plant and equipment are based on the management’s estimation. The useful lives as estimated are same as prescribed in Schedule II of the Companies Act, 2013.
The useful lives of group’s assets are determined by management at the time the asset is acquired/capitalized and reviewed annually for appropriateness. The lives are based on historical experience with similar assets as well as anticipation of future events, which may impact their life such as changes in technology.
• Estimation of defined benefit obligation
The present value of obligations under defined benefit plan is determined using actuarial valuations. An actuarial valuation involves making various assumptions that may differ from actual development in the future. These include the determination of the discount rate, future salary escalations, attrition rate and mortality rates etc. Due to the complexities involved in the valuation and its long term nature, these obligations are highly sensitive to changes in these assumptions. All assumptions are reviewed at each reporting date. Refer note 44 for the details of the assumptions used in estimating the defined benefit obligation.
• Impairment of trade receivables
The impairment provisions for trade receivables are based on assumptions about risk of default and expected loss rates. The Group uses judgement in making these assumptions and selecting the inputs to the impairment calculation, based on Group’s past history, existing market conditions as well as forward looking estimates at the end of each reporting period.
• Fair value measurements and valuation processes
Some of the assets and liabilities are measured at fair value for financial reporting purposes. The Management determines the appropriate valuation techniques and inputs for the fair value measurements.
In estimating the fair value of an asset or a liability, the Group uses market-observable data to the extent it is available. Where Level 1 inputs are not available, fair value are determined on the basis of third party valuations. The models used to determine fair values including estimates/ judgements involved are validated and periodically reviewed by the management. Refer note 45.
• Inventory obsolescence
The Group writes down inventories to net realisable value based on an estimate of the realisability of inventories. Write downs on inventories are recorded where events or changes in circumstances indicate that the balances may not realised. The identification of write-downs requires the use of estimates of net selling prices of the down-graded inventories. Where the expectation is different from the original estimate, such difference will impact the carrying value of inventories and write-downs of inventories in the periods in which such estimate has been changed.
168 Annual Report 2020-21 169• Corporate Overview • Statutory Reports • Financial StatementsN o t e s t o t h e C o n s o l i d a t e d F i n a n c i a l S t a t e m e n t sN a t i o n a l P e r o x i d e L i m i t e d
Notes to the Consolidated Financial Statements as of and for the year ended March 31, 2021 (All amounts are in Indian Rupees lakhs, unless otherwise stated)
Notes to the Consolidated Financial Statements as of and for the year ended March 31, 2021 (All amounts are in Indian Rupees lakhs, unless otherwise stated)

4 Pr
oper
ty, p
lant
and
equ
ipm
ent
Part
icul
ars
Fre
ehol
d la
nd
Fre
ehol
d Bu
ildin
g P
lant
and
eq
uipm
ent
Fur
nitu
re
and
fixtu
res
Offi
ce
equi
pmen
t V
ehic
les
RO
U
Veh
icle
T
otal
C
apit
al
wor
k-in
-pr
ogre
ss
Gros
s bl
ock
Bala
nce
as a
t Apr
il 1,
2019
5.8
9 3
37.5
3 1
8,80
4.61
5
5.38
5
8.12
3
8.46
-
19,
299.
99
7,5
40.3
9 Tr
ansi
tion
impa
ct o
n ac
coun
t of I
nd A
S 11
6 -
- -
- -
- 2
3.05
2
3.05
-
Add
ition
s -
- 15
.19
76.
90
23.
28
- -
115.
37
14,3
82.7
5 D
ispo
sals
- -
- -
(0.15
) -
(0.7
6) (0
.91)
- Tr
ansf
er -
663
.40
20,
880.
71
0.5
7 -
- -
21,5
44.6
8 (2
1,544
.68)
Less
: Tra
nsfe
r to
Ass
et h
eld
for s
ale
- -
- -
- -
- -
(378
.46)
Bala
nce
as a
t Mar
ch 3
1, 20
20 5
.89
1,0
00.9
3 3
9,70
0.51
1
32.8
5 8
1.25
3
8.46
2
2.29
4
0,98
2.18
-
Add
ition
s -
- 2
3.52
0
.30
15.0
6 -
- 3
8.88
3
19.7
3 A
sset
s w
ritt
en o
ff (R
efer
Not
e 53
) -
- (4
61.3
9) -
- -
- (4
61.3
9) -
Dis
posa
ls (R
efer
Not
e 51
) -
- (1
,121.4
9) -
(14.
10)
- -
(1,13
5.59
) -
Tran
sfer
- -
67.
00
- -
- -
67.
00
(67.
00)
Bala
nce
as a
t Mar
ch 3
1, 20
21 5
.89
1,0
00.9
3 3
8,20
8.15
1
33.1
5 8
2.21
3
8.46
2
2.29
3
9,49
1.08
2
52.7
3 A
ccum
ulat
ed d
epre
ciat
ion
Bala
nce
as a
t Apr
il 1,
2019
- 1
18.9
6 2
,561
.14
17.
91
21.
24
6.0
5 -
2,7
25.3
0 -
Char
ge fo
r the
yea
r -
42.
36
1,02
0.15
9
.09
13.5
8 6
.68
11.0
3 1,
102.
89
- D
ispo
sals
- -
- -
(0.0
4) -
- (0
.04)
- Ba
lanc
e as
at M
arch
31,
2020
- 1
61.3
2 3
,581
.29
27.
00
34.
78
12.
73
11.
03
3,8
28.1
5 -
Char
ge fo
r the
yea
r -
33.
95
1,65
1.93
13.0
3 16
.15
6.6
8 8
.28
1,73
0.02
-
Impa
irm
ent l
oss
(Ref
er N
ote
51)
- -
136.
72
- -
- -
136.
72
- A
sset
s w
ritt
en o
ff (R
efer
Not
e 53
) -
- (9
4.16
) -
- -
- (9
4.16
) -
Dis
posa
ls (R
efer
Not
e 51
) -
- (2
44.5
2) -
(13.
26)
- -
(257
.78)
- Ba
lanc
e as
at M
arch
31,
2021
- 1
95.2
7 5
,031
.26
40.
03
37.
67
19.
41
19.
31
5,3
42.9
5 -
Net
blo
ck a
s at
Mar
ch 3
1, 20
20 5
.89
839
.61
36,
119.
22
105
.85
46.
47
25.
73
11.
26
37,
154.
03
- N
et b
lock
as
at M
arch
31,
2021
5.8
9 8
05.6
6 3
3,17
6.89
9
3.12
4
4.54
1
9.05
2
.98
34,
148.
13
252
.73
Not
e:
i) R
efer
not
e 50
(i) fo
r dis
clos
ure
of c
ontr
actu
al c
omm
itm
ents
.
ii)
Add
itio
ns to
Cap
ital
wor
k in
pro
gres
s du
ring
the
year
incl
udes
H N
il (M
arch
31,
2020
H 1
,086
.88
lakh
s) b
orro
win
g co
st c
apit
alis
ed in
acc
orda
nce
wit
h In
dian
A
ccou
ntin
g St
anda
rds
(Ind
AS)
23
on “B
orro
win
g co
sts”
.
iii)
For d
etai
ls o
f Pro
pert
y, p
lant
and
equ
ipm
ent w
hich
are
ple
dged
as
secu
rity
for b
orro
win
gs -
Ref
er N
ote
21 N
on -
Curr
ent f
inan
cial
liab
iliti
es -
Borr
owin
gs a
nd
Not
e 26
Oth
er c
urre
nt fi
nanc
ial l
iabi
litie
s
iv)
Plan
t and
equ
ipm
ent i
nclu
des
com
pute
rs g
ross
blo
ck H
134.
3 la
khs
(Mar
ch 3
1, 20
20 H
126.
62 la
khs)
, acc
umul
ated
dep
reci
atio
n H 8
0.55
lakh
s (M
arch
31,
2020
H
60.18
lakh
s) a
nd w
ritt
en d
own
valu
e H 5
3.75
lakh
s (M
arch
31,
2020
H 6
6.44
lakh
s).
4.1 Leases
As Lessee
(i) Carrying value of right of use assets at the year end by class
ParticularsFor year ended March 31, 2021
For year ended March 31, 2020
Opening Balance 12.12 23.05
Deletions - (0.94)
Finance cost incurred 0.69 1.59
Payment of lease liabilities (8.98) (11.58)
Closing Balance 3.83 12.12
Particulars As at
March 31, 2021 As at
March 31, 2020
Less than one year 3.83 8.33
One to five years - 3.79
More than five years - -
Total 3.83 12.12
Particulars As at
March 31, 2021 As at
March 31, 2020
Current lease liability (Current maturities of lease liabilities) 3.83 8.33
Non-current lease liability (Non-current financial liabilities - Other financial liabilities)
- 3.79
Total 3.83 12.12
Particulars Vehicles Total
Balance as of April 1, 2019 23.05 23.05 Deletions (0.76) (0.76)
Depreciation (11.03) (11.03)
Balance as of March 31, 2020 11.26 11.26 Depreciation (8.28) (8.28)
Balance as of March 31, 2021 2.98 2.98
(ii) The following is the break-up of lease liablity as at reporting date
(iii) The following is the movement of lease liablity during year ended March 31, 2021
(iv) The table below provides details regarding the contractual maturities of lease liabilities as at reporting date on an undiscounted basis:
170 Annual Report 2020-21 171• Corporate Overview • Statutory Reports • Financial StatementsN o t e s t o t h e C o n s o l i d a t e d F i n a n c i a l S t a t e m e n t sN a t i o n a l P e r o x i d e L i m i t e d
Notes to the Consolidated Financial Statements as of and for the year ended March 31, 2021 (All amounts are in Indian Rupees lakhs, unless otherwise stated)
Not
es to
the
Cons
olid
ated
Fin
anci
al S
tate
men
ts a
s of
and
for t
he y
ear e
nded
Mar
ch 3
1, 20
21
(All
amou
nts
are
in In
dian
Rup
ees
lakh
s, u
nles
s ot
herw
ise
stat
ed)

Particulars For year ended March 31, 2021
For year ended March 31, 2020
Interest on lease liability Refer Note 35 0.69 1.59
Expense relating to short-term leases and low value assets Refer Note 37 61.14 23.67
Depreciation Refer Note 36 8.28 11.03
70.11 36.29
4.1 Leases (Contd..)
(v) Amount recognized in statement of profit and loss
(vi) Total cash outflow for leases for the year ended March 31, 2021 was H. 8.98 lakhs (March 31, 2020 H. 11.58 lakhs).
(vii) There are no variable lease payments included in the measurement of lease liability.
(viii) Extension and termination options: Extension and termination options are included in the lease contracts of the Group. These are used to maximise operational flexibility in terms of managing the assets of the Group. All the extension and termination options held are exercisable both by the Group and the respective lessor.
5 Other intangible assets
Particulars Computer
Software Total
Gross blockBalance as at April 1, 2019 - -
Additions 104.96 104.96
Disposals - -
Balance as at March 31, 2020 104.96 104.96 Additions - -
Disposals - -
Balance as at March 31, 2021 104.96 104.96 Accumulated amortizationBalance as at April 1, 2019 - -
Charge for the year 19.94 19.94
Disposals - -
Balance as at March 31, 2020 19.94 19.94 Charge for the year 19.94 19.94
Disposals - -
Balance as at March 31, 2021 39.88 39.88
Net carrying amount as on March 31, 2020 85.02 85.02 Net carrying amount as on March 31, 2021 65.08 65.08
6 Non-current investments
Particulars As at
March 31, 2021 As at
March 31, 2020
Investments in equity instruments (fully paid up)Quoted InvestmentOther Investments at FVOCI
1,895,900 (March 31, 2020: 1,895,900) equity shares of The Bombay Dyeing & Manufacturing Company Limited of H 2 each
1,330.92 868.32
6,585,117 (March 31, 2020: 6,585,117) equity shares of The Bombay Burmah Trading Corporation Limited of H 2 each
73,121.14 48,235.98
600 (March 31, 2020: 600) equity shares of Housing Development Finance Corporation Limited of H 2 each
14.99 9.80
5,000 (March 31, 2020: 5,000) equity shares of HDFC Bank Limited of H 1 each 74.68 43.10
18 (March 31, 2020: 18) equity share of Larsen Toubro Limited of H 2 each 0.26 0.15
3,000 (March 31, 2019: 3,000) equity share of Technojet Consultants Limited of H10 each
1.60 1.60
60 (March 31, 2020: 60) equity share of ABB Limited of H 2 each 0.85 0.56
12 (March 31, 2020: NIL) ABBPower Products and Systems India Limited (Demerged-ABB) H 2 each
0.16 -
56 (March 31, 2020: 56) equity share of Tata Chemicals Limited of H 10 each 0.42 0.13
63 (March 31, 2020: NIL) Tata Consumer Products Ltd. of H 1 each 0.40 -
50 (March 31, 2020: 50) equity share of Finolex Cables Limited of H 2 each 0.19 0.10
300 (March 31, 2020: 300) equity share of ACC Limited of H 10 each 5.71 2.91
132 (March 31, 2020: 132) equity share of Colgate Palmolive India Limited of H 1 each 2.06 1.65
233 (March 31, 2020: 233) equity share of Jaykay Enterprises Limited of H 1 each 0.09 0.01
46 (March 31, 2020: 46) equity share of J.K.Cement Limited of H 10 each 1.33 0.43
7 (March 31, 2020: 7) equity share of ORG Informatics Limited of H 10 each * - -
5,131 (March 31, 2020:5,131) equity shares of ICICI Bank limited of H 2 each 29.87 16.60
12 (March 31, 2020: 12) equity share of GE Power India Limited of H 10 each 0.03 0.05
1 (March 31, 2020: 1) equity share of UltraTech Cement Limited of H 10 each 0.07 0.03
Unquoted Investment - FVOCI1,000 (March 31, 2020: 1,000) equity share of B. R. T. Limited of H 100 each 16.95 15.60
Nil (March 31, 2020: 393) units of 0% Unsecured Fully Convertible Debentures of Nowrosjee Wadia and Sons Limited, of H 100 each"
- 42.84
74,601.72 49,239.86 Aggregate amount of quoted investments and market value thereof 74,584.77 49,181.42
Aggregate amount of unquoted investments; and 16.95 58.44
Aggregate amount of impairment in value of investments. - -
74,601.72 49,239.86
*Represents amount of shares which is below the rounding off norms adopted by the Group, hence shown as Nil in the above note.
172 Annual Report 2020-21 173• Corporate Overview • Statutory Reports • Financial StatementsN o t e s t o t h e C o n s o l i d a t e d F i n a n c i a l S t a t e m e n t sN a t i o n a l P e r o x i d e L i m i t e d
Notes to the Consolidated Financial Statements as of and for the year ended March 31, 2021 (All amounts are in Indian Rupees lakhs, unless otherwise stated)
Notes to the Consolidated Financial Statements as of and for the year ended March 31, 2021 (All amounts are in Indian Rupees lakhs, unless otherwise stated)

7 Non-current financial assets - Loans
8 Income tax assets (net)
9 Other non-current assets
10 Inventories
Particulars As at
March 31, 2021 As at
March 31, 2020
(Unsecured, considered good)
Prepayments 30.05 36.39
Capital advances 21.32 -
Balances with government authorities* 143.24 410.21
Less: Provision for sales tax* (64.25) (64.25)
130.36 382.35
Particulars As at
March 31, 2021 As at
March 31, 2020
Raw Materials 463.63 1,083.65
Finished Goods 405.94 577.22
Stores and spares* 825.54 779.35
1,695.11 2,440.22
Particulars As at
March 31, 2021 As at
March 31, 2020
(Unsecured, considered good)
Security deposits 43.16 21.40
43.16 21.40
Particulars As at
March 31, 2021 As at
March 31, 2020
Advance taxes [Net of provision for taxation H 17,921.97 lakhs (March 31, 2020: H 17,273.94 lakhs)]
606.43 313.03
606.43 313.03
*During the earlier years, the Group had provided H 64.25 lakhs towards sales tax matters based on estimation for probable liabilities arising out of pending disputes / liabilities with indirect tax authorities.
*Write-down of inventories to net realisable value amounted to H 0.33 lakhs (March 31, 2020 H 28.89 lakhs). These were recognised as an expense during the year and included in ‘Other expenses - Consumption of stores and spares’ in Statement of Profit and Loss.
11 Current financial assets - Investments
12 Trade receivables
13 Cash and cash equivalents
14 Other bank balances
Particulars As at
March 31, 2021 As at
March 31, 2020
Trade receivables from contract with customers
Unsecured, considered good 2,452.64 3,293.18
Less: Loss allowance (68.30) (68.30)
2,384.34 3,224.88
Particulars As at
March 31, 2021 As at
March 31, 2020
Cash in hand 1.38 1.45
Cheques on hand 49.38 148.00
Balances with banks in current accounts 577.70 22.45
Term deposit with original maturity period of less than three months 51.60 50.23
680.06 222.13
Particulars As at
March 31, 2021 As at
March 31, 2020
Unclaimed dividend accounts 69.10 73.86
69.10 73.86
Particulars As at
March 31, 2021 As at
March 31, 2020
Investments in Mutual Funds (Unquoted Investments-FVTPL)
700 (March 31, 20120 : Nil) units of HDFC Overnight Liquid fund- Direct Plan Growth of H 10 each
21.41 -
21.41 -
Aggregate amount of quoted investments and market value thereof - -
Aggregate amount of unquoted investments; and 21.41 -
Aggregate amount of impairment in value of investments. - -
21.41 -
174 Annual Report 2020-21 175• Corporate Overview • Statutory Reports • Financial StatementsN o t e s t o t h e C o n s o l i d a t e d F i n a n c i a l S t a t e m e n t sN a t i o n a l P e r o x i d e L i m i t e d
Notes to the Consolidated Financial Statements as of and for the year ended March 31, 2021 (All amounts are in Indian Rupees lakhs, unless otherwise stated)
Notes to the Consolidated Financial Statements as of and for the year ended March 31, 2021 (All amounts are in Indian Rupees lakhs, unless otherwise stated)

15 Current financial assets - Loans
16 Other financial assets
Particulars As at
March 31, 2021 As at
March 31, 2020
(Unsecured, considered good)
Security deposits 26.85 34.07
Inter corporate deposit to related parties (Refer Note 43) 1,000.00 1,000.00
Inter corporate deposit to other companies 10,000.00 10,000.00
11,026.85 11,034.07
Particulars As at
March 31, 2021 As at
March 31, 2020
(Unsecured, considered good)
(I) Derivatives designated as hedges Cross currency interest rate swap (CCIRS) - 675.54
(II) Others
Interest accrued on deposits - 222.73
- 898.27
The Group has, during the year, given Intercorporate Deposits (ICDs) to certain parties covered under section 189 of the Companies Act, 2013, viz. Bombay Dyeing and Manufacturing Company Limited H 5,000 lakhs (Previous Year H 16,500 lakhs) and Go Airlines (India) Limited H NIL lakhs (Previous Year H 10,000 lakhs ). These ICDs are for general business purpose and carry an interest rate of 11.5% p.a (Previous Year 10% p.a.) and have tenure for less than a year.
During the year, the Intercorporate Deposits (ICDs) have been repaid, viz. Macrofil Investments Co. Ltd H NIL (Previous Year H 3,000 lakhs), Bombay Dyeing and Manufacturing Company Limited H 5,000 lakhs (Previous Year H 16,500 lakhs) and Go Airlines (India) Limited H NIL (Previous Year H 20,000 lakhs).
17 Other current assets
Particulars As at
March 31, 2021 As at
March 31, 2020
(Unsecured, considered good)
Advances to suppliers 36.45 67.48
Advances for expenses 18.46 18.77
Advance to gratuity fund - 18.21
Prepayments 34.64 39.15
Balances with government authorities 293.03 200.67
382.58 344.28
19 Equity share capital
ParticularsAs at March 31, 2021 As at March 31, 2020
Number of shares
% Number of
shares %
Ben Nevis Investments Limited, British Virgin Island, ultimate holding company
51,500 0.90 51,500 0.90
Nowrosjee Wadia and Sons Limited, holding company
1,769,125 30.78 1,769,125 30.78
Macrofil Investments Limited, subsidiary of holding company
1,918,109 33.38 1,918,109 33.38
Particulars Number of shares Amount
As at April 1, 2019
Opening balance at the beginning of the year 5,747,000 574.70
Movement during the year - -
Balance as at March 31, 2020 5,747,000 574.70 Movement during the year - -
Balance as at March 31, 2021 5,747,000 574.70
Particulars As at
March 31, 2021 As at
March 31, 2020
Authorised capital25,000,000 (March 31, 2020: 25,000,000) equity shares of H 10 each 2,500.00 2,500.00
2,500.00 2,500.00 Issued, subscribed and fully paid-up5,747,000 (March 31, 2020: 5,747,000) equity shares of H 10 each 574.70 574.70
574.70 574.70
Notes:
a) Reconciliation of the number of equity shares outstanding at the beginning and at the end of the reporting period:
Equity shares
b) Shares held by the holding company, ultimate holding company and subsidiary of holding company:
18 Asset held for sale
Particulars As at
March 31, 2021 As at
March 31, 2020
Capital work in progress (Refer Note 52) 201.51 378.46
201.51 378.46
176 Annual Report 2020-21 177• Corporate Overview • Statutory Reports • Financial StatementsN o t e s t o t h e C o n s o l i d a t e d F i n a n c i a l S t a t e m e n t sN a t i o n a l P e r o x i d e L i m i t e d
Notes to the Consolidated Financial Statements as of and for the year ended March 31, 2021 (All amounts are in Indian Rupees lakhs, unless otherwise stated)
Notes to the Consolidated Financial Statements as of and for the year ended March 31, 2021 (All amounts are in Indian Rupees lakhs, unless otherwise stated)

Name of ShareholdersAs at March 31, 2021 As at March 31, 2020
Number of shares
% Number of
shares %
Equity shares
Nowrosjee Wadia and Sons Limited 1,769,125 30.78% 1,769,125 30.78%
Macrofil Investments Limited 1,918,109 33.38% 1,918,109 33.38%
c) Shareholders holding more than 5% of equity shares of the Company:
19 Equity share capital (Contd..)
d) Rights, preferences and restrictions attached to equity shares:
The Group has one class of equity share having a par value of H 10 per share. Each shareholder is eligible for one vote per share held. The dividend proposed by the Board of Directors is subject to the approval of the shareholders in the ensuing annual general meeting, except in case of interim dividend.
In the event of liquidation of the Group, the equity shareholders are eligible to receive the remaining assets of the Group, after distribution of all preferential amounts, in proportion to their shareholdings.
20 Other Equity
Particulars As at
March 31, 2021 As at
March 31, 2020
General reserve 3,397.32 3,392.27
Capital redemption reserve 0.02 0.02
Special Under section 45IC of RBI Act, 1934 204.33 194.25
Retained earnings 38,762.31 37,335.47
FVOCI - Equity instruments 63,913.11 38,818.03
FVOCI - Cash flow hedging reserves (175.17) (104.47)
1,06,101.92 79,635.57
General reserve
The Group has transferred a portion of the net profit of the Group before declaring dividend to general reserve pursuant to the earlier provisions of Companies Act, 1956. Mandatory transfer to general reserve is not required under the Companies Act, 2013.
Capital redemption reserve
As per the provisions of Companies Act, Capital redemption reserve is created out of the general reserve for the amount of share capital reduction/ buyback in earlier years.
Special reserve under section 45IC of RBI Act, 1934
Under section 45 (IC) of Reserve Bank of India Act, 1934, every NBFC shall create a reserve fund and transfer therein a sum based on the provisions of the said Act.
20 Other Equity (Contd..)
21 Non - Current financial liabilities - Borrowings
Particulars As at
March 31, 2021 As at
March 31, 2020
SecuredTerm loan from Bank
Foreign Currency Loan (USD) 11,546.87 15,681.55
11,546.87 15,681.55 Less: Current maturities of long term debt (Refer note 26) (11,536.06) (15,670.83)
Less: Interest accrued (Refer note 26) (10.81) (10.72)
- -
Retained earnings
Retained earnings are the profits that the Group has earned till date, less any transfers to general reserve, dividends or other distributions paid to shareholders. Further, it also includes the impact of remeasurements of the defined benefit obligations, net of tax.
FVOCI - Equity instrument
The Group has elected to recognise changes in the fair value of certain investments in equity securities in other comprehensive income. These changes are accumulated within the FVOCI equity investments reserves within equity. The Group transfers amounts from this reserve to retained earnings when the relevant equity securities are derecognised.
FVOCI - Cash flow hedging reserve
Cash flow hedge reserve is used to recognise the effective portion of gains or losses on derivatives that qualify as cash flow hedges. Amount are subsequently reclassified to profit and loss as appropriate.
A) Details of securities, repayment and interest of term loan
I) Term of foreign currency loans from banks
The loan is repayable in 16 equal quarterly instalments of US $ 1,312,500 beginning from June 6, 2020 and the last quarterly installment being payable on February 27, 2024. This loan has a variable interest rate of 3 months USD-LIBOR-BBA plus 1.25% per annum payable on quarterly basis. The loan has a Put and Call Option at the end of second year from the date of drawdown (i.e. March 6, 2019) and annually therafter.
Nature of security
Secured by a first specific charge on entire movable fixed assets including plant and machinery of the Group located in Kalyan, Maharashtra.
178 Annual Report 2020-21 179• Corporate Overview • Statutory Reports • Financial StatementsN o t e s t o t h e C o n s o l i d a t e d F i n a n c i a l S t a t e m e n t sN a t i o n a l P e r o x i d e L i m i t e d
Notes to the Consolidated Financial Statements as of and for the year ended March 31, 2021 (All amounts are in Indian Rupees lakhs, unless otherwise stated)
Notes to the Consolidated Financial Statements as of and for the year ended March 31, 2021 (All amounts are in Indian Rupees lakhs, unless otherwise stated)

21 Non - Current financial liabilities - Borrowings (Contd..)
B) Net debt reconciliation
Particulars As at
March 31, 2021 As at
March 31, 2020
Cash and cash equivalent 680.06 222.13
Non-current borrowings (including current maturities of long term borrowings and interest accrued on borrowings)
(11,546.87) (15,681.55)
Current borrowings (941.83) (467.93)
Lease liabilities (3.83) (12.12)
Total (11,812.47) (15,939.47)
ParticularsCash and cash
equivalentNon-current
borrowings Current
borrowings Lease
liabilities Net debt
Net debt as at April 1, 2019 1,078.99 (6,988.02) (1,000.00) - (6,909.03)Transition to Ind AS 116 - - - (23.05) (23.05)
Cash flow (856.86) (7,785.38) 532.07 12.52 (8,097.65)
Interest expenses - (1,305.99) (22.09) (1.59) (1,329.67)
Interest paid - 1,314.27 22.09 - 1,336.36
Exchange loss - (916.43) - - (916.43)
Net debt as at March 31, 2020 222.13 (15,681.55) (467.93) (12.12) (15,939.47)Net debt as at April 1, 2020 222.13 (15,681.55) (467.93) (12.12) (15,939.47)Cash flow 457.93 3,395.26 (465.40) 8.98 3,396.77
Interest expenses - (1,172.36) (92.57) (0.69) (1,265.62)
Interest paid - 1,172.27 84.07 - 1,256.34
Exchange gain - 739.51 - - 739.51
Net debt as at March 31, 2021 680.06 (11,546.87) (941.83) (3.83) (11,812.47)
Particulars As at
March 31, 2021 As at
March 31, 2020
Derivatives designated as hedges
Cross currency interest rate swap (CCIRS) 137.47 -
Others
Lease liabilities - 3.79
137.47 3.79
22 Other non-current financial liabilities
Particulars As at
March 31, 2021 As at
March 31, 2020
For employee benefits (refer note 44)
Provident fund - 19.75
Leave encashment and compensated absence 272.98 184.86
Pension 71.90 75.66
344.88 280.27
Particulars As at
March 31, 2021 As at
March 31, 2020
Secured
Term loan:
From other parties
Working capital term loan (refer note a below) 933.33 -
Other loan:
Bank overdraft (refer note b below) - 467.93
933.33 467.93
23 Non-current Provisions
24 Current borrowings
Terms of repayment
a. Working capital term loan from Standard Chartered Investments and Loans (India) Limited (SCIIL), an NBFC, H 933.33 lakhs (March 31. 2020 H Nil). This facility carries interest rate of 10.90%. The loan is repayable in 9 monthly installments of H 133.33 lakhs starting from February 15, 2021.
b. Secured overdraft facility from bank of H Nil (March 31, 2020 H 467.93 lakhs). This facility carried an interest rate of MCLR plus margin. During the previous year, the interest rate ranges from 10.85% - 10.90%.
Nature of security
a. Working capital term loan from SCIIL is secured by first pari passu charge on current assets.
b. Overdraft facility secured by:
- First pari-passu charge on current assets, both present and future.
- Second pari passu charge on entire movable fixed assets including plant and machinery of the Group located in Kalyan, Maharashtra.
180 Annual Report 2020-21 181• Corporate Overview • Statutory Reports • Financial StatementsN o t e s t o t h e C o n s o l i d a t e d F i n a n c i a l S t a t e m e n t sN a t i o n a l P e r o x i d e L i m i t e d
Notes to the Consolidated Financial Statements as of and for the year ended March 31, 2021 (All amounts are in Indian Rupees lakhs, unless otherwise stated)
Notes to the Consolidated Financial Statements as of and for the year ended March 31, 2021 (All amounts are in Indian Rupees lakhs, unless otherwise stated)

Particulars As at
March 31, 2021 As at
March 31, 2020
Dues to micro and small enterprises (refer note 48) 304.37 15.98
Dues to others 1,699.52 1,851.53
2,003.89 1,867.51
25 Trade payables
26 Other current financial liabilities
27 Other current liabilities
Particulars As at
March 31, 2021 As at
March 31, 2020
Current maturities of long-term borrowings 11,536.06 15,670.83
Interest accrued but not due on borrowings 19.31 10.72
Derivatives not designated as hedges:
- Foreign exchange forward contracts 0.46 -
Deposit received from customers 7.05 2.80
Capital creditors* 411.96 2,371.76
Current maturities of lease liabilities 3.83 8.33
Unpaid dividend 69.10 73.86
Payable to employees 467.49 404.69
12,515.26 18,542.99
Particulars As at
March 31, 2021 As at
March 31, 2020
Statutory dues (including provident fund, tax deducted at source and others) 296.53 110.14
296.53 110.14
*including dues to micro and small enterprises for H 2.09 lakhs (March 31, 2020 - H 1.37 lakhs) (refer note 48)
29 Income tax liabilities (net)
30 Revenue from operations
28 Current provisions
ParticularsFor the year ended
March 31, 2021For the year ended
March 31, 2020
Revenue from contracts with customers Manufactured goods 21,418.35 18,957.51
Traded goods - 100.03
Revenue from investing operations Dividend Income from investment measured at FVTPL 52.25 55.42
Fair value gain on investments (including gain on sale of investments) measured at FVTPL
1.21 2.72
Other operating income Sale of scrap 29.00 7.33
Total 21,500.81 19,123.01
Particulars As at
March 31, 2021 As at
March 31, 2020
For employee benefits (refer note 44)
Gratuity - 50.33
Leave encashment and compensated absence 103.84 105.15
Provident fund - 3.25
Pension 10.53 8.61
114.37 167.34
Particulars As at
March 31, 2021 As at
March 31, 2020
Provision for tax [Net of advance tax H Nil (March 31, 2020: H 322.94 lakhs)] 0.27 181.82
0.27 181.82
Disclosure pursuant to Ind AS 115 - Revenue from Contracts with Customers. (A) Revenue streams
ParticularsFor the year ended
March 31, 2021For the year ended
March 31, 2020
Sales of Goods/Income from operation 21,418.35 19,057.54
Revenue from investing operations 53.46 58.14
Other operating revenues 29.00 7.33
Sale of goods / income from operations 21,500.81 19,123.01
182 Annual Report 2020-21 183• Corporate Overview • Statutory Reports • Financial StatementsN o t e s t o t h e C o n s o l i d a t e d F i n a n c i a l S t a t e m e n t sN a t i o n a l P e r o x i d e L i m i t e d
Notes to the Consolidated Financial Statements as of and for the year ended March 31, 2021 (All amounts are in Indian Rupees lakhs, unless otherwise stated)
Notes to the Consolidated Financial Statements as of and for the year ended March 31, 2021 (All amounts are in Indian Rupees lakhs, unless otherwise stated)

30 Revenue from operations (Contd..)
ParticularsFor the year ended
March 31, 2021For the year ended
March 31, 2020
Domestic 20,684.13 19,038.11
Exports 734.22 19.43
Sale of goods / income from operations 21,418.35 19,057.54
ParticularsFor the year ended
March 31, 2021For the year ended
March 31, 2020
Revenue as per contract price 22,408.31 19,535.68
Less: Refund Liabilities - Sales Returns / Credits / Reversals 127.46 66.73
Less: Discounts & Rebates 862.50 411.41
Total 21,418.35 19,057.54
(B) There are no material unsatisfied performance obligations for the year ended March 31, 2021 and March 31, 2020. Further, entire revenue is recognised at the point in time when the performance obligation is satisfied and control of the goods is transferred to the customer.
(C) Disaggregation of revenue from contracts with customers
In the following table, revenue from contracts with customers is disaggregated by primary geographical market
(E) Reconciliation of net sale of goods
(F) The entire amount of contract liability as of March 31, 2020 of H 46.91 lakhs (March 31, 2019 of H 15.86 lakhs) has been recognised as revenue during the current year.
(G) There are no significant changes in contract liabilities during the year ended March 31, 2021.
(D) Movement in expected credit loss during the year:
ParticularsFor the year ended
March 31, 2021For the year ended
March 31, 2020
Opening balance for loss allowance 68.30 38.15
Changes in allowance for expected credit loss:
Add : Loss allowance assessed for the current year - 30.15
Closing balance for loss allowance 68.30 68.30
31 Other income
ParticularsFor the year ended
March 31, 2021For the year ended
March 31, 2020
Interest income on financial assets at amortised cost On Inter corporate deposit 1,106.45 1,612.64 On fixed deposits 1.47 9.19 Other interest income 8.03 31.79 Dividend income from equity investments designated at FVOCI (Refer below) 30.78 35.49 Dividend income from other investments measured at FVTPL - 15.73 Fair value gain on investments (including gain on sale of investments) measured at FVTPL
35.00 21.56
Net foreign exchange gain 3.36 27.27 Miscellaneous income 92.87 41.43
1,277.96 1,795.10
ParticularsFor the year ended
March 31, 2021For the year ended
March 31, 2020
Salaries, wages and bonus 2,097.45 2,138.31 Contribution to provident fund and other funds (refer note 44) 138.21 148.86 Provident fund benefits (refer note 44) 4.51 5.83 Gratuity (refer note 44) 56.42 51.80 Pension benefits (refer note 44) 7.62 11.57 Workmen and staff welfare expenses 254.24 277.12
2,558.45 2,633.49
ParticularsFor the year ended
March 31, 2021For the year ended
March 31, 2020
Opening balance of raw materials and packing materials 1,083.65 231.50 Add: Purchases made during the year 6,958.34 7,339.89 Less: Closing balance of raw materials and packing materials 463.63 1,083.65
7,578.36 6,487.74
All dividends from equity investments designated at FVOCI relate to investments held at the end of the reporting period. There was no dividend income relating to investments derecognised during the reporting period.
32 Cost of raw materials and packing materials consumed
34 Employee benefit expenses
ParticularsFor the year ended
March 31, 2021For the year ended
March 31, 2020
Opening balance 577.22 2,221.75 Less: Closing balance 405.94 577.22
171.28 1,644.53
33 Changes in inventories of finished goods
184 Annual Report 2020-21 185• Corporate Overview • Statutory Reports • Financial StatementsN o t e s t o t h e C o n s o l i d a t e d F i n a n c i a l S t a t e m e n t sN a t i o n a l P e r o x i d e L i m i t e d
Notes to the Consolidated Financial Statements as of and for the year ended March 31, 2021 (All amounts are in Indian Rupees lakhs, unless otherwise stated)
Notes to the Consolidated Financial Statements as of and for the year ended March 31, 2021 (All amounts are in Indian Rupees lakhs, unless otherwise stated)

ParticularsFor the year ended
March 31, 2021For the year ended
March 31, 2020
Interest and finance charges on lease liabilities and financial liabilities not at fair value through profit or loss
362.69 593.52
Fair value changes on cross currency interest rate swap designated as cash flow hedges - transferred from OCI
887.26 728.63
Other interest expense 15.67 38.41
Less: Interest capitalised * - (1,086.88)
1,265.62 273.68
ParticularsFor the year ended
March 31, 2021For the year ended
March 31, 2020
Depreciation on property, plant and equipment (refer note 4) 1,721.74 1,091.86
Depreciation on right of use assets (refer note 4) 8.28 11.03
Amortisation of intangible assets (refer note 5) 19.94 19.94
1,749.96 1,122.83
ParticularsFor the year ended
March 31, 2021For the year ended
March 31, 2020
Consumption of stores and spares 263.84 362.65
Legal and professional fees 599.51 370.85
Payment to auditors* 60.55 35.88
Rates and taxes 32.81 58.95
Repairs and maintenance
- plant & machinery 573.66 753.74
- building 3.68 2.45
Freight charges 408.57 359.16
Insurance charges 212.47 212.54
Director Sitting Fees 52.50 43.50
Corporate social responsibility expense (refer note 41) 280.00 306.00
Director commission (refer note below) 24.20 (72.65)
35 Finance costs
36 Depreciation and amortisation
37 Other expenses
*The capitalisation rate used to determine the amount of borrowing cost to be capitalised is the actual interest rate applicable to the entity during the previous year which is 8.55%
37 Other expenses (Contd..)
38 Exceptional Items
ParticularsFor the year ended
March 31, 2021For the year ended
March 31, 2020
Rental charges 61.14 23.67
Loss allowance - 30.15
Miscellaneous expenses 708.22 618.32
3,281.15 3,105.21
ParticularsFor the year ended
March 31, 2021For the year ended
March 31, 2020
Loss on account of decommissioning of assets (Refer Note 51) 790.65 -
Loss on account of reassessment of fair value of assets (CWIP) held for sale (Refer Note 18 and 52)
173.86 -
Loss on account of breakdown of machinery (Refer Note 53) 584.79 -
1,549.30 -
ParticularsFor the year ended
March 31, 2021For the year ended
March 31, 2020
Statutory audit fees 23.00 21.00
Limited review audit fee 14.50 13.50
Others 23.00 -
Reimbursement of out of pocket expenses 0.05 1.38
60.55 35.88
Note : During the year, the Group has paid commission of H 29 lakhs (March 31, 2020 H 129.25 lakhs) to non-executive directors against the provision of H 32.10 lakhs in March 31, 2020 (March 31, 2019 H 234 lakhs) and the excess provision of H 3.10 lakhs (March 31, 2020 H 104.75 lakhs) is written back.
*Payment to auditors
186 Annual Report 2020-21 187• Corporate Overview • Statutory Reports • Financial StatementsN o t e s t o t h e C o n s o l i d a t e d F i n a n c i a l S t a t e m e n t sN a t i o n a l P e r o x i d e L i m i t e d
Notes to the Consolidated Financial Statements as of and for the year ended March 31, 2021 (All amounts are in Indian Rupees lakhs, unless otherwise stated)
Notes to the Consolidated Financial Statements as of and for the year ended March 31, 2021 (All amounts are in Indian Rupees lakhs, unless otherwise stated)

39 Income tax expense
The major components of income tax expense for the years ended March 31, 2021 and March 31, 2020 are:
(a) Income tax recognised in statement of profit and loss
ParticularsFor the year ended
March 31, 2021For the year ended
March 31, 2020
Income tax expense:(i) Current tax expense 134.94 522.44
Adjustment in respect of current tax of previous years - 23.95
Total current tax expense 134.94 546.39 (ii) Deferred tax expense Decrease (increase) in deferred tax assets 669.84 (649.36)
(Decrease) increase in deferred tax liabilities (1,693.27) 1,267.31
Total deferred tax expense (1,023.43) 617.95 Total Income tax expense (888.49) 1,164.34
ParticularsFor the year ended
March 31, 2021For the year ended
March 31, 2020
Income tax expense(i) Current tax benefit (expense) Remeasurement of defined benefit obligation (8.33) (11.32)
Total current tax benefit (8.33) (11.32)(ii) Deferred tax (expense) Remeasurement of defined benefit obligation (6.04) 9.24
Financial asset measured at FVOCI (264.37) (85.47)
Total deferred tax (expense) (270.41) (76.23) (278.74) (87.55)
(b) Income tax recognised in other comprehensive income
(c) Reconciliation of effective tax rate:
ParticularsFor the year ended
March 31, 2021For the year ended
March 31, 2020
Profit before tax 1,229.16 2,955.90
Tax at the Indian applicable tax rate 25.17% (March 31, 2020: 29.12%) 309.35 860.76
Tax effect of amounts which are not deductible / (taxable) in calculating taxable income:
Expenses that are not deductible in determining taxable profit 107.93 115.45
Income exempt from income tax - (28.41)
39 Income tax expense (Contd..)
(c) Reconciliation of effective tax rate: (Contd..)
ParticularsFor the year ended
March 31, 2021For the year ended
March 31, 2020
Change in income tax rates (1,306.04) 191.49
Adjustment for prior period 0.08 23.95
Others 0.19 1.10
Income tax expense (888.49) 1,164.34
ParticularsAs at
March 31, 2021 As at
March 31, 2020
Deferred tax liabilities 3,387.75 4,813.85
Less: deferred tax assets 207.88 880.96
Deferred tax liability (net) 3,179.87 3,932.89
(d) Tax assets
(e) Movement in deferred tax liabilities
ParticularsAs at
March 31, 2021 As at
March 31, 2020
Opening balance 131.21 (355.25)
Add: Taxes paid 618.22 1,044.17
Less: Current tax payable for the year 143.27 557.71
Closing balance 606.16 131.21 Current tax assets 606.43 313.03 Current tax liabilities (0.27) (181.82)
March 31, 2021As at
March 31, 2020 Recognised in
Profit and LossRecognised in
OCIAs at
March 31, 2021
Property, plant and equipment 4,809.42 (1,693.34) - 3,116.08
Financial asset measured at FVTPL - 0.07 - 0.07
Financial asset measured at FVOCI 4.43 - 267.17 271.60
Total deferred tax liabilities 4,813.85 (1,693.27) 267.17 3,387.75
Movement of deferred tax balances
188 Annual Report 2020-21 189• Corporate Overview • Statutory Reports • Financial StatementsN o t e s t o t h e C o n s o l i d a t e d F i n a n c i a l S t a t e m e n t sN a t i o n a l P e r o x i d e L i m i t e d
Notes to the Consolidated Financial Statements as of and for the year ended March 31, 2021 (All amounts are in Indian Rupees lakhs, unless otherwise stated)
Notes to the Consolidated Financial Statements as of and for the year ended March 31, 2021 (All amounts are in Indian Rupees lakhs, unless otherwise stated)

March 31, 2021As at
March 31, 2020 Recognised in
Profit and LossRecognised in
OCIAs at
March 31, 2021
Provision for post retirement benefits and other employee benefits
139.71 (18.05) (6.04) 115.62
Loss allowance 23.01 (5.83) - 17.18
Provision for sales tax 22.45 (6.28) - 16.17
Loss on cash flow hedging reserve 56.11 - 2.80 58.91
Business loss 122.22 (122.22) - -
MAT credit 517.46 (517.46) - -
Total deferred tax assets 880.96 (669.84) (3.24) 207.88 Deferred tax liability (net) 3,932.89 (1,023.43) 270.41 3,179.87
Movement of deferred tax balances (Contd..)
39 Income tax expense (Contd..)
(e) Movement in deferred tax liabilities (Contd..)
March 31, 2021As at
March 31, 2019 Recognised in
Profit and LossRecognised in
OCIAs at
March 31, 2020
Property, plant and equipment 3,526.28 1,283.14 - 4,809.42
Financial asset measured at FVTPL 15.83 (15.83) - -
Financial asset measured at FVOCI 5.60 - (1.17) 4.43
Total deferred tax liabilities 3,547.71 1,267.31 (1.17) 4,813.85 Provision for post retirement benefits and other employee benefits
130.47 - 9.24 139.71
Loss allowance 13.33 9.68 - 23.01
Provision for sales tax 22.45 - - 22.45
Loss on cash flow hedging reserve 142.75 - (86.64) 56.11
Business loss - 122.22 - 122.22
MAT credit - 517.46 - 517.46
Total deferred tax assets 309.00 649.36 (77.40) 880.96 Deferred tax liability (net) 3,238.71 617.95 76.23 3,932.89
Deferred tax asset of H Nil (Previous Year: H 212.09 lakhs) on unused tax losses of H Nil (Previous Year: H 1,820.50 lakhs) in relation to fair valuation of equity shares has not been created as currently, the Group is uncertain to generate sufficient taxable capital gain in forseeable future.
ParticularsFor the year ended
March 31, 2021For the year ended
March 31, 2020
Basic and diluted earnings per shareProfit for the year (Rs in lakhs) 2,117.65 1,791.56
Weighted average number of equity shares 57,47,000 57,47,000
Basic and diluted earnings per share (Rs) 36.85 31.17
Face value per share (Rs) 10.00 10.00
ParticularsFor the year ended
March 31, 2021For the year ended
March 31, 2020
Gross amount required to spent during the year as per section 135 of the Act 273.00 305.85
Amount spent during the year 280.00 306.00
Excess spent during the year 7.00 0.15
ParticularsFor the year ended
March 31, 2021For the year ended
March 31, 2020
(i) Contribution to Sir Ness Wadia Foundation 126.00 119.25
(ii) Contribution to Nowrosjee Wadia Maternity Hospital 47.00 69.00
(iii) Contribution to Bai Jerbai Wadia Hospital for Children 70.00 117.75
(iv) Contribution to Mumbai Police Foundation 27.00 -
(v) Contribution to Smile Foundation 10.00 -
280.00 306.00
39 Income tax expense (Contd..)
40 Earnings per share
41 Corporate social responsibility (“CSR”)
(f) Unrecognised temporary differences
Temporary differences relating to investments in subsidiary for which tax liablities have not been recognised on Undistributed earnings.
The Subsidiary of the Group has undistributed earnings of H 565.01 lakhs (March 31, 2020: H 537.79 lakhs) which, if paid out as dividends, would be subject to tax in the hand of recipient. An assessable temporary difference exists, but no deferred tax liability has been recognised as parent entity is able to control the timing of distribution from the subsidiary. The subsidiary is not expected to distribute this profit in the forseeable future.
Expenditure on corporate social responsibility:
190 Annual Report 2020-21 191• Corporate Overview • Statutory Reports • Financial StatementsN o t e s t o t h e C o n s o l i d a t e d F i n a n c i a l S t a t e m e n t sN a t i o n a l P e r o x i d e L i m i t e d
Notes to the Consolidated Financial Statements as of and for the year ended March 31, 2021 (All amounts are in Indian Rupees lakhs, unless otherwise stated)
Notes to the Consolidated Financial Statements as of and for the year ended March 31, 2021 (All amounts are in Indian Rupees lakhs, unless otherwise stated)

ParticularsFor the year ended
March 31, 2021For the year ended
March 31, 2020
(i) Construction / acquisition of any asset - -
(ii) On purpose other than (i) above 280.00 306.00
280.00 306.00
Particulars March 31, 2021 March 31, 2020
Within India 20,684.13 19,038.11
Outside India 734.22 19.43
Total Revenue 21,418.35 19,057.54
Amount spent during the year on:
41 Corporate social responsibility (“CSR”) (Contd..)
42 Segment information
The CEO & Director reviews the Group’s performance. Presently, the Group is engaged in only one segment viz ‘Manufacturing of peroxygens’ and as such there is no separate reportable segment as per Ind AS 108 ‘Operating Segments’.
Information about geographical areas*
There are no non-current assets other than financial instruments outside India.
Further revenue from investing activities is within India
*relates to revenue from contract with customers
Information about major customers
Customers include private distribution entities. No single customer of the Group accounts for 10% or more of total revenue.
43 Related party disclosures
In accordance with Ind AS-24 “Related Party Disclosures” of the Companies (Accounts) Rules 2015, as amended time to time and the Companies Act, 2013, the names of related parties along with aggregate amount of transactions and year end balances with them are given as follows:
(i) Enterprises exercising control:
Ultimate holding entity - Ben Nevis Investments Limited (Refer note 19)
Parent entity - Nowrosjee Wadia and Sons Limited (Refer note 19)
(ii) Key managerial personnel
Mr. Rajiv Arora Chief Executive Officer & Director (w.e.f. June 4, 2020 )
Mr. Suresh Khurana Chief Executive Officer and Director (upto June 4, 2020)
Non-executive Directors
Mr. Ness N. Wadia - Chairman
Dr (Mrs.) Minnie Bodhanwala
Independent Directors
Mr. Rajesh Batra
Mr. S. Ragothaman
Mr. Viraf Mehta
Mrs. Harshbeena Zaveri
(iii) Enterprises controlled by the parent entity and with whom transactions were carried out during the year
Wadia Techno-Engineering Services Limited
Macrofil Investments Limited
B.R.T Limited
(iv) Enterprises which is associate of parent entity and with whom transactions were carried out during the year.
The Bombay Burmah Trading Corporation Limited
(v) Employee benefits plans and with whom transactions were carried out during the year
National Peroxide Limited Employees’ Provident Fund
National Peroxide Limited Employees’ Gratuity Fund
43 Related party disclosures (Contd..)
192 Annual Report 2020-21 193• Corporate Overview • Statutory Reports • Financial StatementsN o t e s t o t h e C o n s o l i d a t e d F i n a n c i a l S t a t e m e n t sN a t i o n a l P e r o x i d e L i m i t e d
Notes to the Consolidated Financial Statements as of and for the year ended March 31, 2021 (All amounts are in Indian Rupees lakhs, unless otherwise stated)
Notes to the Consolidated Financial Statements as of and for the year ended March 31, 2021 (All amounts are in Indian Rupees lakhs, unless otherwise stated)

43 Related party disclosures (Contd..)
The following transactions were carried out with related parties during the year in the ordinary course of business:
ParticularsFor the year ended
March 31, 2021For the year ended
March 31, 2020
Inter corporate deposit given
Wadia Techno-Engineering Services Limited 500.00 650.00
Repayment of Inter corporate deposit given
Wadia Techno-Engineering Services Limited 500.00 500.00
Macrofil Investments Ltd - 3,000.00
Investments made
The Bombay Burmah Trading Corporation Limited - 10,195.75
Interest income on intercorporate deposit
Wadia Techno-Engineering Services Limited 107.26 94.81
Macrofil Investments Limited - 123.77
Dividend income
The Bombay Burmah Trading Corporation Limited 79.02 54.61
Miscellaneous Income
The Bombay Burmah Trading Corporation Limited 22.00 -
Miscellaneous Expenses
Nowrosjee Wadia and Sons Limited 75.12 62.92
Reimbursement of expenses
Nowrosjee Wadia and Sons Limited 5.82 63.01
Compensation to key managerial personnel
Mr. Rajiv Arora
Short term employee benefits 170.22 -
Post employment benefits** 9.41 -
Mr. Suresh Khurana
Short term employee benefits 46.45 209.01
Post employment benefits** 3.10 17.42
Total 229.18 226.43
** As the liabilities for defined benefit plans are provided on actuarial basis for the Group the amounts pertaining to Key Managerial Personnel are not included.
Commission to Non-Executive Directors# 27.30 32.10
#During the year, the Group has paid commission of H 29 lakhs (March 31, 2020 H 129.25 lakhs) to non-executive directors against the provision of H 32.10 lakhs in March 31, 2020 (March 31, 2019 H 234 lakhs) and the excess provision of H 3.10 lakhs (March 31, 2020 H 104.75 lakhs) is written back.
43 Related party disclosures (Contd..)
The following transactions were carried out with related parties during the year in the ordinary course of business: (Contd..)
Balances outstanding at year end:
ParticularsFor the year ended
March 31, 2021For the year ended
March 31, 2020
Director Sitting fees to Non-Executive Directors 52.50 43.50
Contribution to employee benefit plans
National Peroxide Limited Employees' Provident Fund 4.51 5.83
National Peroxide Limited Employees' Gratuity Fund 73.66 -
ParticularsAs at
March 31, 2021As at
March 31, 2021
Intercorporate deposits to related party
Wadia Techno-Engineering Services Limited 1,000.00 1,000.00
Interest accrued but not due on deposits
Wadia Techno-Engineering Services Limited - 24.86
Investments
The Bombay Burmah Trading Corporation Limited 73,121.14 48,235.98
B.R.T. Limited 16.95 15.60
Other Current Assets
The Bombay Burmah Trading Corporation Limited 25.96 -
Trade Payables
Nowrosjee Wadia and Sons Limited - 15.34
Contributions Made
National Peroxide Limited Employees' Provident Fund 629.91 605.04
National Peroxide Limited Employees' Gratuity Fund 1,216.03 1,229.80
Payable to Key managerial personnel
Mr. Suresh Khurana 28.15 68.55
Mr. Rajiv Arora 45.15 -
194 Annual Report 2020-21 195• Corporate Overview • Statutory Reports • Financial StatementsN o t e s t o t h e C o n s o l i d a t e d F i n a n c i a l S t a t e m e n t sN a t i o n a l P e r o x i d e L i m i t e d
Notes to the Consolidated Financial Statements as of and for the year ended March 31, 2021 (All amounts are in Indian Rupees lakhs, unless otherwise stated)
Notes to the Consolidated Financial Statements as of and for the year ended March 31, 2021 (All amounts are in Indian Rupees lakhs, unless otherwise stated)

44 Employee benefit obligations
The Group has classified various employee benefits as under:
(a) Leave Obligations
The leave obligations cover the Group’s liability for sick and privileged leave
Provision for leave encashmentAs at
March 31, 2021As at
March 31, 2021
Current 103.84 105.15
Non-current 272.98 184.86
(b) Defined Contribution Plan (i) Provident fund
(ii) Superannuation fund
The Group has recognised the following amounts in the Statement of Profit and Loss for the year:
(i) Contribution to provident fund 112.30 120.46
(ii) Contribution to superannuation fund 25.91 28.40
(c) Post employment obligations
Provision for leave encashmentAs at
March 31, 2021As at
March 31, 2021
Discount rate (per annum) 6.35% 6.10%
Salary escalation rate
-For management employees 8.00% 8.00%
-For other employees 8.00% 8.00%
Mortality rate Indian Assured Lives Mortality
(2012-14) Ult table
Indian Assured Lives Mortality
(2012-14) Ult table
Gratuity
The Group has a defined benefit plan, governed by the Payment of Gratuity Act, 1972. The plan entitles an employee, who has rendered at least five years of continuous service, to gratuity at the rate of fifteen days basic salary for every completed years of services or part thereof in excess of six months, based on the rate of basic salary last drawn by the employee concerned.
(i) Significant estimates: actuarial assumptions
Valuations in respect of gratuity have been carried out by an independent actuary, as at the Balance Sheet date
The estimates of salary escalation rate considered in actuarial valuation, takes into account inflation, seniority, promotion and other relevant factors including supply and demand in the employment market.
ParticularsPresent value of
obligationFair value of plan
assetsNet amount
As at April 1, 2020 1,280.13 (1,229.80) 50.33 Current service cost 56.40 - 56.40
Interest expense / (income) 57.66 (57.64) 0.02
Total amount recognised in profit and loss 114.06 (57.64) 56.42 Remeasurements
Return on plan assets, excluding amount included in interest expense / (income)
- (13.73) (13.73)
(Gain) / loss from change in financial assumptions (10.24) - (10.24)
(Gain) / loss from change in demographic assumptions - - -
Experience (gains) / losses (9.12) - (9.12)
Total amount recognised in other comprehensive income (19.36) (13.73) (33.09)Employer contributions - (73.66) (73.66)
Benefits payments (158.81) 158.81 -
As at March 31, 2021 1,216.02 (1,216.02) -
(ii) Gratuity Plan
The amounts recognised in the balance sheet and the movements in the net defined benefit obligation over the year are as follows:
44 Employee benefit obligations (Contd..)
ParticularsPresent value of
obligationFair value of plan
assetsNet amount
As at April 1, 2019 1,185.89 (1,154.96) 30.93 Current service cost 53.26 - 53.26
Interest expense / (income) 72.31 (73.77) (1.46)
Total amount recognised in profit and loss 125.57 (73.77) 51.80 Remeasurements
Return on plan assets, excluding amount included in interest expense / (income)
- (49.50) (49.50)
(Gain) / loss from change in financial assumptions 64.97 - 64.97
(Gain) / loss from change in demographic assumptions
- - -
Experience (gains) / losses (47.87) - (47.87)
Total amount recognised in other comprehensive income 17.10 (49.50) (32.40)Employer contributions - - -
Benefits payments (48.43) 48.43 -
As at March 31, 2020 1,280.13 (1,229.80) 50.33
196 Annual Report 2020-21 197• Corporate Overview • Statutory Reports • Financial StatementsN o t e s t o t h e C o n s o l i d a t e d F i n a n c i a l S t a t e m e n t sN a t i o n a l P e r o x i d e L i m i t e d
Notes to the Consolidated Financial Statements as of and for the year ended March 31, 2021 (All amounts are in Indian Rupees lakhs, unless otherwise stated)
Notes to the Consolidated Financial Statements as of and for the year ended March 31, 2021 (All amounts are in Indian Rupees lakhs, unless otherwise stated)

The net liability disclosed above relates to funded plans are as follows:
44 Employee benefit obligations (Contd..)
ParticularsChange in assumption
Impact on defined benefit obligation
Increase in assumption Decrease in assumption
March 31, 2021
March 31, 2020
March 31, 2021
March 31, 2020
March 31, 2021
March 31, 2020
Discount rate 0.50% 0.50% -1.66% -1.73% 1.76% 1.82%
Salary escalation rate 0.50% 0.50% 1.68% 1.76% -1.60% -1.70%
ParticularsAs at
March 31, 2021As at
March 31, 2020
Present value of funded obligations 1,216.02 1,280.13
Fair value of plan assets (1,216.02) (1,229.80)
Deficit of gratuity plan - 50.33
Current portion - 50.33
Non-current portion - -
(iii) Sensitivity analysis
Significant estimates: Sensitivity of actuarial assumptions
The sensitivity of the provision for defined benefit obligation to changes in the weighted principal assumptions is:
The above sensitivity analysis are based on a change in an assumption while holding all other assumptions constant. In practice, this is unlikely to occur, and changes in some of the assumptions may be correlated. While calculating the sensitivity of the defined benefit obligation to significant actuarial assumptions the same method (present value of the defined benefit obligation calculated with the projected unit credit method at the end of the reporting period) has been applied as when calculating the defined benefit liability recognised in the balance sheet.
The methods and types of assumptions used in preparing the sensitivity analysis did not change compared to the prior period.
(iv) The above defined benefit gratuity plan was administrated 100% by a trust as at March 31, 2021 and March 31, 2020.
(v) Defined benefit liability and employer contributions
The Group will pay demand raised by the trust towards gratuity liability on time to time basis to eliminate the deficit in defined benefit plan.
The weighted average duration of the defined benefit obligation is 4.26 years (March 31, 2020 – 4.35 years).
44 Employee benefit obligations (Contd..)
ParticularsAs at
March 31, 2021As at
March 31, 2020
Less than a year 553.92 669.75
Between 1-2 years 84.32 29.48
Between 2-5 years 329.69 320.88
Between 5-9 years 245.94 343.18
10 years and above 366.93 330.51
ParticularsAs at March 31, 2021 As at March 31, 2020
Amount in % Amount in %
Government debt instruments 420.00 35% 325.08 26%
Other debt instruments 621.88 51% 554.29 45%
Insurer managed funds - - - -
Others 174.14 14% 350.44 28%
Total 1,216.02 100% 1,229.81 100%
(vi) Risk exposure
Aforesaid post-employment benefit plans typically expose the Group to acturial risks such as: Investment risk, interest rate risk, and salary risk.
Investment risk: The present value of the defined benefit liability is calculated using a discount rate which is determined by reference to market yields at the end of the reporting period on government bonds.If the return on plan asset is below this rate, it will create a plan deficit. Currently, for the plan in india, it has a relatively balanced mix of investments in govenment securities, and other debt instruments.
Interest risk: A fall in the discount rate which is linked to the G. Sec. Rate will increase the present value of the liability requiring higher provision. A fall in the discount rate generally increase the mark to market value of the assets depending on the duration of asset.
Salary risk: The present value of the defined benefit liability is calculated by reference to the future salaries of plan participants. As such, an increase in salary of the plan participants will increase the plan’s liability.
(vii) Category of plan asset
(viii) Projected cash flow
Pension
The Group operates a defined benefit pension plan. The pension benefits payable to the employees are based on the employee’s service and last drawn salary at the time of leaving. The employees do not contribute towards this plan and the full cost of providing these benefits are met by the Group. The Group does not contribute annually to any trust or a fund towards the liability under the plan, this plan is unfunded.
198 Annual Report 2020-21 199• Corporate Overview • Statutory Reports • Financial StatementsN o t e s t o t h e C o n s o l i d a t e d F i n a n c i a l S t a t e m e n t sN a t i o n a l P e r o x i d e L i m i t e d
Notes to the Consolidated Financial Statements as of and for the year ended March 31, 2021 (All amounts are in Indian Rupees lakhs, unless otherwise stated)
Notes to the Consolidated Financial Statements as of and for the year ended March 31, 2021 (All amounts are in Indian Rupees lakhs, unless otherwise stated)

44 Employee benefit obligations (Contd..)
(viii) Projected cash flow
Pension
(i) Significant estimates: actuarial assumptions
ParticularsPresent value of
obligation
As at April 1, 2019 77.94 Current service cost 5.94
Interest expense / (income) 5.63
Total amount recognised in profit and loss 11.57
ParticularsPresent value of
obligation
As at April 1, 2020 84.27 Current service cost 2.74
Interest expense / (income) 4.88
Total amount recognised in profit and loss 7.62 Remeasurements
(Gain) / loss from change in financial assumptions (1.06)
(Gain) / loss from change in demographic assumptions -
Experience (gains) / losses 0.09
Total amount recognised in other comprehensive income (0.97)Benefits payment (8.48)
As at March 31, 2021 82.43
ParticularsAs at
March 31, 2021As at
March 31, 2020
Valuations in respect of pension have been carried out by an independent actuary, as at the Balance Sheet date
Discount rate (per annum) 6.35% 6.10%
Salary escalation rate 8.00% 8.00%
Pension increase rate - -
(ii) Pension Plan
44 Employee benefit obligations (Contd..)
(viii) Projected cash flow
Pension
(ii) Pension Plan (Contd..)
ParticularsAs at
March 31, 2021As at
March 31, 2020
Present value of funded obligations 82.43 84.27
Deficit of pension plan 82.43 84.27 Current portion 10.53 8.61
Non-current portion 71.90 75.66
ParticularsPresent value of
obligation
Remeasurements(Gain) / loss from change in financial assumptions 6.28
(Gain) / loss from change in demographic assumptions -
Experience (gains) / losses (2.85)
Total amount recognised in other comprehensive income 3.43 Benefits payment (8.67)
As at March 31, 2020 84.27
The net liability disclosed above relates to funded plans are as follows:
(iii) Sensitivity analysis
The sensitivity of the provision for defined benefit obligation to changes in the weighted principal assumptions is:
ParticularsChange in assumption
Impact on defined benefit obligation
Increase in assumption Decrease in assumption
March 31, 2021
March 31, 2020
March 31, 2021
March 31, 2020
March 31, 2021
March 31, 2020
Discount rate 0.50% 0.50% -2.48% -2.61% 2.62% 2.75%
The above sensitivity analysis is based on a change in an assumption while holding all other assumptions constant.In practice, this is unlikely to occur, and changes in some of the assumptions may be correlated. While calculating the sensitivity of the defined benefit obligation to significant actuarial assumptions the same method (present value of the defined benefit obligation calculated with the projected unit credit method at the end of the reporting period) has been applied as when calculating the defined benefit liability recognised in the balance sheet.
The methods and types of assumptions used in preparing the sensitivity analysis did not change compared to the prior period.
200 Annual Report 2020-21 201• Corporate Overview • Statutory Reports • Financial StatementsN o t e s t o t h e C o n s o l i d a t e d F i n a n c i a l S t a t e m e n t sN a t i o n a l P e r o x i d e L i m i t e d
Notes to the Consolidated Financial Statements as of and for the year ended March 31, 2021 (All amounts are in Indian Rupees lakhs, unless otherwise stated)
Notes to the Consolidated Financial Statements as of and for the year ended March 31, 2021 (All amounts are in Indian Rupees lakhs, unless otherwise stated)

44 Employee benefit obligations (Contd..)
(vi) Risk exposure
Aforesaid post-employment benefit plans typically expose the Group to acturial risks such as: Investment risk, interest rate risk, and salary risk.
Investment risk: The present value of the defined benefit liability is calculated using a discount rate which is determined by reference to market yields at the end of the reporting period on government bonds.If the return on plan asset is below this rate, it will create a plan deficit. Currently, for the plan in india, it has a relatively balanced mix of investments in govenment securities, and other debt instruments.
Interest risk: A fall in the discount rate which is linked to the G. Sec. Rate will increase the present value of the liability requiring higher provision. A fall in the discount rate generally increase the mark to market value of the assets depending on the duration of asset.
Salary risk: The present value of the defined benefit liability is calculated by reference to the future salaries of plan participants. As such, an increase in salary of the plan participants will increase the plan’s liability.
(v) Defined benefit liability and employer contributions
The weighted average duration of the defined benefit obligation is 5.10 years (March 31, 2020 – 5.36 years).
(vi) Projected cash flow
ParticularsAs at
March 31, 2021As at
March 31, 2020
Less than a year 10.53 8.61
Between 1-2 years 8.81 10.39
Between 2-5 years 29.29 27.58
Between 5-9 years 35.44 36.41
10 years and above 38.25 41.79
Provident Fund
In respect of certain employees, provident fund contributions are made to a trust administered by the Group. The interest rate payable to the members of the trust shall not be lower than the statutory rate of interest declared by the Central Government under the Employees Provident Funds and Miscellaneous Provisions Act, 1952 and shortfall, if any, shall be made good by the Group. The liability in respect of the shortfall of interest earnings of the Fund is determined on the basis of an actuarial valuation.
Group measures its liability towards provident fund through actuarial valuation using ‘projected credit unit method’. In case of net assets, assets are recognised to the extent of liability only.”
44 Employee benefit obligations (Contd..)
Provident Fund (Contd..)
ParticularsPresent value of
obligationFair value of plan
assetsNet amount
As at April 1, 2019 612.71 (612.71) - Current service cost 5.83 - 5.83
Interest expense / (income) 44.51 (44.51) -
Interest on net defined benefit liability / assets 50.34 (44.51) 5.83 Remeasurements
Return on plan assets, excluding amount included in interest expense / (income)
- (9.00) (9.00)
(Gain) / loss from change in financial assumptions
23.00 - 23.00
(Gain) / loss from change in demographic assumptions
- - -
Experience (gains) / losses 9.00 - 9.00
Total amount recognised in other comprehensive income
32.00 (9.00) 23.00
Employer’s contributions - (5.83) (5.83)
Employee’s contributions 6.36 (6.36) -
Benefits payment (73.37) 73.37 -
As at March 31, 2020 628.04 (605.04) 23.00
(i) Significant estimates: actuarial assumptions
Valuations in respect of provident fund have been carried out by an independent actuary, as at the Balance Sheet date
ParticularsAs at
March 31, 2021As at
March 31, 2020
Discount rate (per annum) 6.35% 6.10%
(ii) Provident fund plan
202 Annual Report 2020-21 203• Corporate Overview • Statutory Reports • Financial StatementsN o t e s t o t h e C o n s o l i d a t e d F i n a n c i a l S t a t e m e n t sN a t i o n a l P e r o x i d e L i m i t e d
Notes to the Consolidated Financial Statements as of and for the year ended March 31, 2021 (All amounts are in Indian Rupees lakhs, unless otherwise stated)
Notes to the Consolidated Financial Statements as of and for the year ended March 31, 2021 (All amounts are in Indian Rupees lakhs, unless otherwise stated)

ParticularsPresent value of
obligationFair value of plan
assetsNet amount
As at April 1, 2020 628.04 (605.04) 23.00 Current service cost 4.51 - 4.51
Interest expense / (income) 37.22 (37.22) -
Interest on net defined benefit liability / assets 41.73 (37.22) 4.51 Remeasurements
Return on plan assets, excluding amount included in interest expense / (income)
- (22.87) (22.87)
(Gain) / loss from change in financial assumptions (9.01) - (9.01)
(Gain) / loss from change in demographic assumptions
- - -
Experience (gains) / losses 8.88 - 8.88
Total amount recognised in other comprehensive income
(0.13) (22.87) (23.00)
Employer’s contributions - (4.51) (4.51)
Employee’s contributions 4.96 (4.96) -
Benefits payment (44.69) 44.69 -
As at March 31, 2021 629.91 (629.91) -
44 Employee benefit obligations (Contd..)
Provident Fund (Contd..)
(ii) Provident fund plan (Contd..)
The net liability disclosed above relates to funded plans are as follows:
ParticularsAs at
March 31, 2021As at
March 31, 2020
Present value of funded obligations 629.91 628.04
Fair value of plan assets (629.91) (605.04)
Deficit of provident fund plan - 23.00 Current portion - 3.25
Non-current portion - 19.75
44 Employee benefit obligations (Contd..)
Provident Fund (Contd..)
(iii) Sensitivity analysis
The sensitivity of the provision for defined benefit obligation to changes in the weighted principal assumptions is
ParticularsChange in assumption
Impact on defined benefit obligation
Increase in assumption Decrease in assumption
March 31, 2021
March 31, 2020
March 31, 2021
March 31, 2020
March 31, 2021
March 31, 2020
Discount rate 0.50% 0.50% -0.87% -2.27% NIL 1.83%
The above sensitivity analysis is based on a change in an assumption while holding all other assumptions constant. In practice, this is unlikely to occur, and changes in some of the assumptions may be correlated. While calculating the sensitivity of the defined benefit obligation to significant actuarial assumptions the same method (present value of the defined benefit obligation calculated with the projected unit credit method at the end of the reporting period) has been applied as when calculating the defined benefit liability recognised in the balance sheet
The methods and types of assumptions used in preparing the sensitivity analysis did not change compared to the prior period.
(iv) The above defined benefit plan was administrated 100% by a trust as at March 31, 2021 and March 31, 2020
(v) Defined benefit liability and employer contributions
The Group will pay demand raised by the trust towards gratuity liability on time to time basis to eliminate the deficit in defined benefit plan.
The weighted average duration to payment is 8.92 years (March 31, 2020 – 9.53 years).
(vi) The plan liabilities are calculated using a discount rate set with reference to bond yields; if plan assets under perform this yield, this will create a deficit.
(vii) Categoryofplanasset
ParticularsAs at March 31, 2021 As at March 31, 2020
Amount in % Amount in %
Government debt instruments 205.56 33% 145.64 24%
Other debt instruments 284.64 45% 255.68 42%
Entity's own equity instruments - 0% 14.31 2%
Others 139.72 22% 189.41 31%
Total 629.91 100% 605.04 100%
204 Annual Report 2020-21 205• Corporate Overview • Statutory Reports • Financial StatementsN o t e s t o t h e C o n s o l i d a t e d F i n a n c i a l S t a t e m e n t sN a t i o n a l P e r o x i d e L i m i t e d
Notes to the Consolidated Financial Statements as of and for the year ended March 31, 2021 (All amounts are in Indian Rupees lakhs, unless otherwise stated)
Notes to the Consolidated Financial Statements as of and for the year ended March 31, 2021 (All amounts are in Indian Rupees lakhs, unless otherwise stated)

45 Fair value measurements
(a) Financial instruments by category
ParticularsAs at March 31, 2021 As at March 31, 2020
FVTPL FVOCIAmortised
costFVTPL FVOCI
Amortised cost
Financial assetsInvestment
- Equity instruments# - 74,601.72 - - 49,197.02 -
- Mutual funds 21.41 - - - - -
Convertible Instrument - - - 42.84 -
Trade receivables - - 2,384.34 - - 3,224.88
Cash and cash equivalents - - 680.06 - - 222.13
Bank balances other than cash and cash equivalents
- - 69.10 - - 73.86
Security deposits - - 70.01 - - 55.47
Inter corporate deposits## - - 11,000.00 - - 11,222.73
Derivative designated as hedge - CCIRS
- - - - 675.54 -
Total financial assets 21.41 74,601.72 14,203.51 - 49,915.40 14,799.07 Financial liabilitiesBorrowings (includes current maturities of borrowings and accrued interest)
- - 12,488.70 - - 16,149.48
Trade payable - - 2,003.89 - - 1,867.51
Other financial liabilities 0.46 - 959.43 - - 2,865.23
Derivative designated as hedge - CCIRS
- 137.47 - - - -
Total financial liabilities 0.46 137.47 15,452.02 - - 20,882.22
# These are investment in equity securities which are not held for trading, and for which the Group has made an irrevocable election at initial recognition to recognise changes in fair value through other comprehensive income rather than profit or loss as these are strategic investments and the Group considered this to be more relevant.
## Inter corporate deposits include interest accrued till the year end, whereas the same has been classified under other financial assets in the financial statements.
45 Fair value measurements (Contd..)
Financial assets and liabilities measured at fair value - recurring fair value measurements as at March 31, 2021
Level 1 Level 2 Level 3 Total
Financial assets
Investment in equity instruments (at FVOCI)
74,584.77 - 16.95 74,601.72
Total financial assets 74,584.77 - 16.95 74,601.72
Financial liabilities
Derivative designated as hedge - CCIRS
- 137.47 - 137.47
Total financial liabilities - 137.47 - 137.47
Assets and liabilities which are measured at amortised cost for which fair values are disclosed as at March 31, 2021
Level 1 Level 2 Level 3 Total
Financial assetsSecurity deposits - - 43.16 43.16
Total financial assets - - 43.16 43.16 Financial liabilities - - - -
Total financial liabilities - - - -
(b) Fair value hierarchy
This section explains the judgements and estimates made in determining the fair values of the financial instruments that are (a) recognised and measured at fair value and (b) measured at amortised cost and for which fair values are disclosed in the financial statements. To provide an indication about the reliability of the inputs used in determining fair value, the Group has classified its financial instruments into the three levels prescribed under the accounting standard. An explanation of each level follows underneath the table.
206 Annual Report 2020-21 207• Corporate Overview • Statutory Reports • Financial StatementsN o t e s t o t h e C o n s o l i d a t e d F i n a n c i a l S t a t e m e n t sN a t i o n a l P e r o x i d e L i m i t e d
Notes to the Consolidated Financial Statements as of and for the year ended March 31, 2021 (All amounts are in Indian Rupees lakhs, unless otherwise stated)
Notes to the Consolidated Financial Statements as of and for the year ended March 31, 2021 (All amounts are in Indian Rupees lakhs, unless otherwise stated)

Financial assets and liabilities measured at fair value - recurring fair value measurements as at March 31, 2020
Level 1 Level 2 Level 3 Total
Financial assetsInvestment in equity instruments (at FVOCI)
49,181.42 - 15.60 49,197.02
Investments in convertible instruments (at FVOCI)
- - 42.84 42.84
Derivative designated as hedge - CCIRS - 675.54 - 675.54
Total financial assets 49,181.42 675.54 58.44 49,915.40 Financial liabilities - - - -
Total financial liabilities - - - -
Financial assets and liabilities measured at fair value - recurring fair value measurements as at March 31, 2020
Level 1 Level 2 Level 3 Total
Financial assetsSecurity deposits - - 21.40 21.40
Total financial assets - - 21.40 21.40 Financial liabilitiesAmount payable towards lease liabilities - - 3.79 3.79
Total financial liabilities - - 3.79 3.79
45 Fair value measurements (Contd..)
(b) Fair value hierarchy (Contd..)
Note:
Level 1: Level 1 hierarchy includes financial instruments measured using quoted prices. The mutual funds are valued using the closing NAV.
Level 2: The fair value of financial instruments that are not traded in an active market is determined using valuation techniques which maximise the use of observable market data and rely as little as possible on entity-specific estimates. If all significant inputs required to fair value an instrument are observable, the instrument is included in level 2.
Level 3: If one or more of the significant inputs is not based on observable market data, the instrument is included in level 3.
There are no transfers between any levels during the year.
The Group does not have significant financial instrument at level 3 with unobservable input and hence no sensitivity analysis performed
45 Fair value measurements (Contd..)
(c) Valuation techniques used to determine fair value
Fair value of all equity instruments which are traded in the stock exchanges are valued using the closing price as at the reporting date. The mutual funds are valued using the closing net asset value.
The fair value of cross currency interest rate swaps is calculated as the present value of the estimated future cash flows based on observable yield curves and forward exchange rates as at the balance sheet date
The fair values for security deposits are calculated based on cash flows discounted using a current lending rate.
The fair values of non-current borrowings are based on discounted cash flows using a credit adjusted borrowing rate as at the reporting date.
(d) Fair value of financial assets and liabilities measured at amortised cost
As at March 31, 2021 As at March 31, 2020
Carrying amount Fair value Carrying amount Fair value
Financial assetsSecurity deposits 43.16 43.16 21.40 21.40
Total financial assets 43.16 43.16 21.40 21.40Financial LiabilitiesAmount payable towards lease liabilities
- - 3.79 3.79
Total financial liabilities - - 3.79 3.79
The carrying amounts of cash and cash equivalents, other bank balances, trade receivables, inter corporate deposits including accrued interest, other financial assets, current financial liabilities- borrowings including accrued interest, trade payables and other current financial liabilities are considered to be the same as their fair values due to their short term nature.
208 Annual Report 2020-21 209• Corporate Overview • Statutory Reports • Financial StatementsN o t e s t o t h e C o n s o l i d a t e d F i n a n c i a l S t a t e m e n t sN a t i o n a l P e r o x i d e L i m i t e d
Notes to the Consolidated Financial Statements as of and for the year ended March 31, 2021 (All amounts are in Indian Rupees lakhs, unless otherwise stated)
Notes to the Consolidated Financial Statements as of and for the year ended March 31, 2021 (All amounts are in Indian Rupees lakhs, unless otherwise stated)

Risk Exposure arising from Measurement Management
Credit Risk Cash and cash equivalents, trade receivables, financial assets measured at amortised cost
Ageing analysis Credit limits, timely review, diversification of deposits
Liquidity Risk Borrowings and other liabilities
Rolling cash flow forecasts Availability of committed credit lines and borrowing facilities
Market risk – foreign exchange
Recognised financial liabilities not denominated in Indian rupee (INR)
Sensitivity analysis Foreign currency borrowing - hedged - CCIRS Others - limited exposure, unhedged
Market risk- interest risk Borrowing at variable rates Sensitivity analysis Cross currency interest rate swaps
Market risk- price risk Investment in equity instruments
Sensitivity analysis Strategic investment, diversification of portfolio
46 Financial risk management
The Group’s business activities expose it to a variety of financial risks, namely liquidity risk, market risks and credit risk. In order to minimise any adverse effects on the financial performance of the Group, derivative financial instruments, such as cross currency interest rate swap are entered to hedge certain foreign currency risk exposures and interest rate exposures. Derivatives are used exclusively for hedging purposes and not as trading or speculative instruments.
The Group has adopted a Risk Management Policy wherein all material risks faced by the Group are identified and assessed. The Risk Management framework defines the risk management approach of the Group and includes collective identification of risks impacting the Group’s business and documents their process of identification, mitigation and optimization of such risks.
Hedge accounting is applied to remove the accounting mismatch between the hedging instrument and the hedged item. The effective portion of the change in the fair value of the hedging instrument is deferred into the cash flow hedge reserve through OCI and will be recognised in profit or loss when the hedged item affects profit or loss. This will effectively result in recognising interest expense at a fixed interest rate for the hedged loans and foreign currency borrowing at the fixed foreign currency rate.
Covid 19 pandemic - Commencing from the second half of March 2020, Covid 19 pandemic had an impact on the Indian and International business environment. Assessment of impact of Covid 19 pandemic on various elements of the risk management framework has been dealt with in note 54 Impact of Covid -19 Pandemic.
(a) Credit risk
The Group is exposed to credit risk, which is the risk that counterparty will default on its contractual obligation resulting in a financial loss to the Group. Credit risk arises from cash and cash equivalents, financial assets carried at amortised cost as well as credit exposures to trade customers including outstanding receivables.
Credit risk management
Credit risk is the risk that a counterparty will not meet its obligations under a financial instrument or customer contract, leading to a financial loss.
The Group’s credit risk arises from accounts receivable balances. The Group has a credit risk policy in place to ensure that sales are made to customers only after an appropriate credit risk assessment and credit line allocation process. Procedures are standardized within a customer credit risk policy and supported by the information technology system by limiting the credit exposure to each customer and allowing an average credit period of 30-60 days. The Group has adopted a policy of only dealing with creditworthy counterparties. Intercorporate deposits given are for not more than 12 months. The Group periodically assess the recoverability of intercorporate deposits.
The group provides for life time allowance on trade receivable using simplified approach and on a case to case basis on specified customers. Specific debtors represents debtors facing bankruptcy cases, operation shutdown and other scenerio as determined by the management. Such debtors are categorised as specific debtors upon intimation/news. Such specific debtors has no nexus with the macro economy factor. The Group recognises expected credit loss on specified receivables as determined by the management.
46 Financial risk management (Contd..)
Reconciliation of loss allowance on trade receivables Amount
Loss allowance on April 01, 2019 38.15 Changes in loss allowance 30.15
Loss allowance on March 31, 2020 68.30 Changes in loss allowance -
Loss allowance on March 31, 2021 68.30
For banks and financial institutions, only highly rated banks / institutions are accepted. Generally all policies surrounding credit risk have been managed at Group level.
(b) Liquidity risk
Liquidity risk is the risk that the Group will fail in meeting its obligations to pay its financial liabilities. The Group’s approach to managing liquidity is to ensure that it will have sufficient funds to meet its liabilities when due.
Prudent liquidity risk management implies maintaining sufficient cash and marketable securities and the availability of funding through an adequate amount of committed credit facilities to meet obligations when due. In respect of its operations, the Group funds its activities primarily through cash generated in operations and working capital borrowings.
Management monitors the Group’s liquidity position and cash and cash equivalents on the basis of expected cash flows. Cash which is not needed in the operating activities of the Group is invested in marketable liquid funds.
Based on recent trends observed, profitability, cash generation, cash surpluses held by the group and borrowing lines available, the group does not envisage any material liquidity risks. Future outlook will depend on how the pandemic develops and the resultant impact on businesses. Refer note 54 Impact of Covid -19 Pandemic.
210 Annual Report 2020-21 211• Corporate Overview • Statutory Reports • Financial StatementsN o t e s t o t h e C o n s o l i d a t e d F i n a n c i a l S t a t e m e n t sN a t i o n a l P e r o x i d e L i m i t e d
Notes to the Consolidated Financial Statements as of and for the year ended March 31, 2021 (All amounts are in Indian Rupees lakhs, unless otherwise stated)
Notes to the Consolidated Financial Statements as of and for the year ended March 31, 2021 (All amounts are in Indian Rupees lakhs, unless otherwise stated)

(i) Maturities of financial liabilities
The amounts disclosed below are the non derivative contractual undiscounted cash flows of financial liablilities and net settled derivative financial instruments undiscounted cash flows. Balances due within 12 months equal their carrying balances as the impact of discounting is not significant. For cross currency interest rate swap, the cash flows have been estimated using forward interest rates and forward exchange rates as at the end of the reporting period.
46 Financial risk management (Contd..)
March 31, 2021 Less than 1 yearBetween 1 year
and 5 yearsMore than 5
years Total
Non derivative financial liabilitiesBorrowings (includes current maturities of borrowings and accrued interest)#
12,488.70 - - 12,488.70
Trade payables 2,003.89 - - 2,003.89
Other financial liabilities 956.06 - - 956.06
Amount payable towards lease liabilities (Refer note 4)
3.83 - - 3.83
Total non derivative financial liabilities
15,452.48 - - 15,452.48
Derivative (net settled)Cross currency interest rates swap - 137.47 - 137.47
Total derivative liabilities - 137.47 - 137.47
#The foreign currency borrowing has a maturity period of 5 years. The loan has a Put and Call Option at the end of second year from the date of drawdown (i.e. March 6, 2019) and annually therafter. The group has accordingly classified its borrowings of US $15.75 millions as current maturities of long term borrowing.
March 31, 2020 Less than 1 yearBetween 1 year
and 5 yearsMore than 5
years Total
Non derivative financial liabilitiesBorrowings (includes current maturities of borrowings and accrued interest)
16,702.61 - - 16,702.61
Trade payables 1,867.51 - - 1,867.51
Other financial liabilities 2,853.11 - 2,853.11
Amount payable towards lease liabilities (Refer note 4)
8.33 3.79 12.12
Total non derivative financial liabilities
21,431.56 3.79 - 21,435.35
Total derivative liabilities - - - -
46 Financial risk management (Contd..)
(ii) Undrawn borrowing facilities
ParticularsAs at
March 31, 2021As at
March 31, 2020
Bank Overdraft 1,897.99 317.73
(c) Market risk
Market risk is the risk that the fair values of future cash flows of a financial instrument will fluctuate because of volatility of prices in the financial markets. Market risk can be further segregated as: a) Foreign currency risk, b) Interest rates risk and c) Other price risk.
Impact of Covid 19 pandemic- The pandemic can cause continuing volatility in the currency market and this risk would be mitigated through effective hedging policies. Further, the group basis the recent trends believe that the probability of the non- occurrence of forecasted transactions is minimal. The group also does not expect any material deterioration in both counterparty credit risk and own credit risk. Accordingly, the group continues to believe that there is no impact on effectiveness of its hedges. Refer note 54 Impact of Covid -19 Pandemic.
(i) Foreign currency risk
Foreign currency risk is the risk that the fair value or future cash flows of a financial instrument will fluctuate because of changes in foreign exchange rates. Foreign exchange risks arise from recognized assets and liabilities, when they are denominated in a currency other than functional currency of the Group. The Group imports certain raw materials and spare parts used in manufacturing and therefore is exposed to foreign exchange risks arising from various currency exposures, primarily with respect to the US-dollar (“USD”). Group’s exposure to foreign currency risk due to operation is very limited and it always ensures that the such exposure is within the approved limit for which Group does not require to hedge through derivatives. However, for foreign currency variable interest rate denominated borrowings the group’s risk management policy is to hedge 100% of the exposure using cross currency interest rate swaps. Under the Group’s policy, the critical term of the cross currency interest rate swaps must align the hedged item.
The Group’s unhedged foreign currency exposure at the end of the reporting period expressed in Rupees, are as follows:
ParticularsAs at
March 31, 2021As at
March 31, 2020
Financial assetsTrade receivables (USD 98000 ; as at March 31, 2020 USD Nil) 70.12 -
Net exposure to foreign currency risk (assets) 70.12 - Financial liabilitiesPayable (Capital creditors) - (USD Nil ; as at March 31, 2020 USD 24000) - 16.62
Contract liabilities 27.43 -
Advance from Customer - (USD 38000 ; as at March 31, 2020 USD Nil)
Net exposure to foreign currency risk (liabilities) 27.43 16.62
212 Annual Report 2020-21 213• Corporate Overview • Statutory Reports • Financial StatementsN o t e s t o t h e C o n s o l i d a t e d F i n a n c i a l S t a t e m e n t sN a t i o n a l P e r o x i d e L i m i t e d
Notes to the Consolidated Financial Statements as of and for the year ended March 31, 2021 (All amounts are in Indian Rupees lakhs, unless otherwise stated)
Notes to the Consolidated Financial Statements as of and for the year ended March 31, 2021 (All amounts are in Indian Rupees lakhs, unless otherwise stated)

46 Financial risk management (Contd..)
(c) Market risk (Contd..)
(i) Foreign currency risk (Contd..)
Sensitivity
The sensitivity of profit or loss to changes in the exchange rates arises mainly from unhedged foreign currency denominated financial instruments.
ParticularsAs at
March 31, 2021As at
March 31, 2020
Fixed rate borrowings (including accrued interest)# 11,546.87 15,681.55
Fixed rate borrowings (including accrued interest) 941.83 -
Floating rate borrowings - 467.93
12,488.70 16,149.48
ParticularsImpact on profit before tax
Year ended March 31, 2021
Year ended March 31, 2020
AssetsFX rate – increase by 5% on closing rate on reporting date* 3.51 -
FX rate– decrease by 5% on closing rate on reporting date * (3.51) -
LiabilitiesFX rate – increase by 5% on closing rate on reporting date* (1.37) (0.83)
FX rate– decrease by 5% on closing rate on reporting date * 1.37 0.83
*All other variables constant
The above amounts have been disclosed based on the accounting policy for exchange differences.
(ii) Interest rate risks
The Group’s interest risk arises from long term borrowings with variable rates, which expose the Group to cash flow interest rate risk . The Group’s policy is to maintain most of its borrowing at fixed rates using floating to fixed interest rate swaps. The Group enters into long term borrowings at floating rates and swaps them into fixed rates that are lower than those available if the Group borrowed at fixed rates directly. As at March 31, 2021, the Group’s borrowing at variable rate was denominated in USD.
(a) Interest rate risk exposures
The exposure of the Group’s borrowing to interest rate changes at the end of the reporting period are as follows:
#This borrowing has been converted to fixed rate borrowings through cross currency interest swaps using floating to fixed interest rate swap.
46 Financial risk management (Contd..)
Particulars
Currency
As at March 31, 2021 As at March 31, 2020
Derivative liability designated as hedge - net settled
Amount in foreign Currency
( In lakhs)
Fair value (Gain) / Loss
(Rupees in lakhs)
Amount in foreign Currency
( In lakhs)
Fair value (Gain) / Loss
(Rupees in lakhs)
Cross currency interest rate swap
USD 157.50 137.47 210.00 (675.54)
Particulars As at March 31, 2021 As at March 31, 2020
FX rate - increase by 5% on closing rate of reporting date*
565.93 51.72
FX rate - decrease by 5% on closing rate of reporting date*
(626.73) (51.72)
Interest rates - increase by 50 bps on closing rate on reporting date*
81.05 720.95
Interest rates - decrease by 50 bps on closing rate on reporting date*
(81.05) (801.18)
(c) Market risk (Contd..)
(ii) Interest rate risks (Contd..)
(b) Sensitivity
The above floating rate borrowing represents an overdraft facility having an interest rate based on MCLR plus applicable margin. This borrowing was utilised toward the end of the year and accordingly the impact in finance cost is minimal. Accordingly, the sensitivity is having minimal impact.
(iii) Foreign currency and interest rate risks
The Group has taken cross currency interest rate swaps (CCIRS) for hedging its foreign currency and interest rate risks related to external commercial borrowings. This CCIRS contracts are composite contracts for both the foreign currency and interest rate risk and does the mark to market value is determined for both the risks together. The details of derivative financial instruments at the end of the reporting period expressed in Rupees, are as follows:
Sensitivity
The sensitivity of other comprehensive income before tax due to foreign currency movement and interest rate movements is as below.
*All other variables constant
(iv) Other price risks
The Group is exposed to equity price risks arising from equity investments. These investments are subject to changes in the market price of securities. Equity investments are held for strategic purpose rather than for trading purposes. The Group does not actively trade in these investments.
214 Annual Report 2020-21 215• Corporate Overview • Statutory Reports • Financial StatementsN o t e s t o t h e C o n s o l i d a t e d F i n a n c i a l S t a t e m e n t sN a t i o n a l P e r o x i d e L i m i t e d
Notes to the Consolidated Financial Statements as of and for the year ended March 31, 2021 (All amounts are in Indian Rupees lakhs, unless otherwise stated)
Notes to the Consolidated Financial Statements as of and for the year ended March 31, 2021 (All amounts are in Indian Rupees lakhs, unless otherwise stated)

46 Financial risk management (Contd..)
(c) Market risk (Contd..)
(iv) Other price risks (Contd..)
Sensitivity
If equity prices had been 10% higher / lower, other comprehensive income before tax for the year ended March 31, 2021 would increase / decrease by H 7,460 lakhs (Year ended March 31, 2020: increase / decrease by H 4,920 lakhs) as a result of the changes in fair value of shares measured at FVOCI.
(a) Disclosure of effects of hedge accounting on financial position:
As at March 31, 2020
Type of hedge and risks
Nominal value
Carrying amount of
hedging instrument
Maturity dateHedge ratio*
Weighted average
strike price/rate
Changes in fair value
of hedging instrument
(loss)
Change in the value of
hedged item used as the
basis for recognising
hedge effectiveness
Derivative assets designated as cash flow hedgeForeign exchange risk and interest rate riskCross currency interest rate swap
11,536.06 137.47 March 8, 2021 to February 27, 2024
1:1 $1= H 72.45 7.70%
(137.47) 137.47
Type of hedge and risks
Nominal value
Carrying amount of
hedging instrument
Maturity dateHedge ratio*
Weighted average
strike price/rate
Changes in fair value
of hedging instrument
(loss)
Change in the value of
hedged item used as the
basis for recognising
hedge effectiveness
Derivative liabilities designated as cash flow hedgeForeign exchange risk and interest rate riskCross currency interest rate swap
15,670.83 675.54 June 6, 2020 to March 6, 2021
1:1 $1= H 70.54 8.55%
675.54 (675.54)
As at March 31, 2019
The Group enters into hedge relationships where the critical terms of the hedging instrument match exactly with the terms of the hedged item. Therefore, the hedge ratio is 1:1.
46 Financial risk management (Contd..)
(c) Market risk (Contd..)
Type of hedge
Change in the value of the
hedging instrument recognised in other
comprehensive income
Hedge ineffectiveness
recognised in profit or loss
Amount reclassified from cash flow
hedging reserve to profit or loss
Line item affected in statement of profit and loss because of the
reclassification
Cash flow hedgeCross currency interest rate swap
1,168.89 - (920.95) Finance cost of H 23.83 lakhs and foreign exchange
gain under other income of
H 61.00 lakhs
(iv) Other price risks (Contd..)
Sensitivity (Contd..)
(b) Disclosure of effects of hedge accounting on financial performance
As at March 31, 2021
Type of hedge
Change in the value of the hedging instrument recognised
in other comprehensive
income
Hedge ineffectiveness
recognised in profit or loss
Amount reclassified
from cash flow hedging reserve to profit or loss
Line item affected in
statement of profit and loss because of the
reclassification
Cash flow hedgeCross currency interest rate swap (813.01) - 739.51 Foreign
exchange gain under other
income of H 739.51 lakhs.
As at March 31, 2020
216 Annual Report 2020-21 217• Corporate Overview • Statutory Reports • Financial StatementsN o t e s t o t h e C o n s o l i d a t e d F i n a n c i a l S t a t e m e n t sN a t i o n a l P e r o x i d e L i m i t e d
Notes to the Consolidated Financial Statements as of and for the year ended March 31, 2021 (All amounts are in Indian Rupees lakhs, unless otherwise stated)
Notes to the Consolidated Financial Statements as of and for the year ended March 31, 2021 (All amounts are in Indian Rupees lakhs, unless otherwise stated)

46 Financial risk management (Contd..)
(c) Market risk (Contd..)
(iv) Other price risks (Contd..)
Sensitivity (Contd..)
(b) Disclosure of effects of hedge accounting on financial performance (Contd..)
Movements in cash flow hedging reserve
Risk category
Derivative instruments Cross currency interest rate swap
2019-21 2019-20
Cash flow hedging reserve
Opening Balance 104.47 265.77 Add: Changes in fair value of CCIRS 813.01 (1,168.89)
Less: Amounts reclassified to profit or loss (739.51) 920.95
Less: Deferred tax relating to above (net) (2.80) 86.64
Closing Balance 175.17 104.47
Hedge ineffectiveness
The Group’s hedging policy only allows for effective hedge relationships to be established.
Hedge effectiveness is determined at the inception of the hedge relationship, and through periodic prospective effectiveness assessments to ensure that an economic relationship exists between the hedged item and hedging instrument. The Group enters into hedge relationships where the critical terms of the hedging instrument match exactly with the terms of the hedged item, and so a qualitative assessment of effectiveness is performed. If changes in circumstances affect the terms of the hedged item such that the critical terms no longer match exactly with the critical terms of the hedging instrument, the Group uses the hypothetical derivative method to assess effectiveness.
The Group enters into cross currency interest rate swaps that have similar critical terms as the hedged item, such as reference rate, reset dates, repayment dates, maturities and notional amount as all critical terms matched during the year, the economic relationship was 100% effective. There was no ineffectiveness during the financial year ended March 31, 2021.
The Group is exposed to USD LIBOR within a fair value hedge accounting relationship, which is subject to interest rate benchmark reform. The Group has identified where LIBOR exposures are within the business and is constantly reviewing the same, will have its transition plans in place as and when this is implemented.
46 Financial risk management (Contd..)
(c) Market risk (Contd..)
(iv) Other price risks (Contd..)
Sensitivity (Contd..)
Hedge type Instrument type Maturing in Nominal Hedged item
Cash Flow Hedge Pay fixed rate interest at 7.70% and receive floating rate interest at LIBOR + 1.25%
2024 USD 15.75 Millions Floating rate external commercial borrowing (ECB) of the same maturity and nominal of the swap
Below are details of the hedging instruments and hedged items in scope of the Ind AS 109 amendments due to interest rate benchmark reform. The terms of the hedged items listed match those of the corresponding hedging instruments.
The Group will continue to apply the amendments to Ind AS 109 until the uncertainty arising from the interest rate benchmark reforms that the Group is exposed to ends. The Group has assumed that this uncertainty will not end until the Group’s contracts that reference LIBORs are amended to specify the date on which the interest rate benchmark will be replaced, the alternative benchmark rate and the relevant spread adjustment. This will, in part, be dependent on the introduction of fallback clauses which have yet to be added to the Group’s contracts and the negotiation with lenders.
47 Capital Management
(a) Risk Management
The Group’s objectives when managing capital are to safeguard the Group’s ability to continue as a going concern in order to provide returns for shareholders and benefits for other stakeholders and to maintain an optimal capital structure to reduce the cost of capital. In order to maintain or adjust the capital structure, the Group may adjust the amount of dividends paid to shareholders, return capital to shareholders, issue new shares or sell assets to reduce debt.
Consistent with others in the industry, the Group monitors capital on the basis of the gearing ratio. Gearing ratio is determined as net debt (total borrowings and lease liability net of cash and cash equivalents) divided by total ‘equity’.
ParticularsAs at
March 31, 2021 As at
March 31, 2020
Total debt 12,492.53 16,161.60
Less: Cash and cash equivalent (680.06) (222.13)
Net debt 11,812.47 15,939.47 Total equity 1,06,676.62 80,210.27
Net debt to equity ratio 11.07% 19.87%
218 Annual Report 2020-21 219• Corporate Overview • Statutory Reports • Financial StatementsN o t e s t o t h e C o n s o l i d a t e d F i n a n c i a l S t a t e m e n t sN a t i o n a l P e r o x i d e L i m i t e d
Notes to the Consolidated Financial Statements as of and for the year ended March 31, 2021 (All amounts are in Indian Rupees lakhs, unless otherwise stated)
Notes to the Consolidated Financial Statements as of and for the year ended March 31, 2021 (All amounts are in Indian Rupees lakhs, unless otherwise stated)

Loan covenants
The Group’s ECB agreement is subjected to covenant clauses, whereby the Group is required to meet certain key financial ratios. During the current year, the Group complied with all the covenants as per the borrowing agreement except one covenant as stated below:
- the ratio of EBIT to total debt service at the end of each measurement period shall not be less than 1.25;
While the bank is contractually entitled to request for immediate repayment of the outstanding loan amount of US $ 15.75 Million, the bank had not requested early repayment of the loan as of the date when these financial statements were approved.
During the previous year, the Group undertook the expansion of its plant capacity from 95 KTPA to 150 KTPA, which required the plant to be shutdown for a period of 4 months. The Group complied with all the covenants as per the borrowing agreement except two covenants stated below:
(i) the ratio of total borrowings to EBITDA at the end of each measurement period shall not be greater than 3 and;
(ii) the ratio of EBIT to total debt service at the end of each measurement period shall not be less than 1.25.
(b) Dividends
ParticularsAs at
March 31, 2021 As at
March 31, 2020
(i) Equity shares 718.38 3,735.55
Final dividend for the year ended March 31, 2020 of H 12.50 (March 31, 2019 - H 65) per fully paid share
Dividend Distribution Tax (DDT) on final dividend - 768.03
(ii) Dividends not recognised at the end of the reporting period 718.38 718.38
For the year ended March 31, 2021, the directors have recommended a final dividend of H 12.50 per fully paid equity share (March 31, 2020 - H 12.50). This proposed dividend is subject to the approval of shareholders in the ensuing annual general meeting.
47 Capital Management (Contd..)
(a) Risk Management (Contd..)
ParticularsAs at
March 31, 2021As at
March 31, 2020
The principal amount remaining unpaid to any supplier registered under the Micro, Small and Medium Enterprises Development Act, 2006 and remaining unpaid as at the year end
306.46 17.35
Principal amount paid to suppliers registered under the MSMED Act, beyond the appointed day during the year
345.96 107.13
Interest paid, other than under section 16 of MSMED Act, to suppliers registered under the MSMED Act, , beyond the appointed day during the year
- -
Interest paid, under section 16 of MSMED Act, to suppliers registered under the MSMED Act, beyond the appointed day during the year
Amount of interest accrued and remaining unpaid for the year 2.12 1.74
The amount of interest accrued and remaining unpaid at the end of each accounting year.
3.86 1.74
The amount of further interest due and payable even in the succeeding years, until such date when the interest dues as above are actually paid to the small enterprise, for the purpose of disallowance as a deductible expenditure under section 23.
3.86 1.74
48 Micro and small enterprise
Disclosure in respect to Micro and Small Enterprises as per Micro, Small and Medium Enterprises Development Act, 2006 (‘MSMED’) Act, 2006 is as follows:
The information as required under Micro, Small and Medium Enterprises Development Act, 2006, has been determined to the extent such parties have been identified on the basis of information available with the Group and relied upon by the auditors. The principal amounts / interest payable amounts for delayed payments to such vendors as at Balance Sheet date during the current year and previous year mentioned below.
49 Contingent liability
Claims against the Group not acknowledged as debtAs at
March 31, 2021As at
March 31, 2020
(i) Sales tax demand 38.90 38.90
(ii) Income tax demand 1,079.47 -
In respect of the Assessment Year 2018-19, the Group has received a demand of income tax on March 17, 2021 amounting to H 1,079.47 lakhs on account of dis-allowances in respect of embezzlement of funds, disallowances under section 14A and section 43B and interest thereon.The Group has filed an appeal with the Commissioner of Income Tax (Appeals) on April 14, 2021.
220 Annual Report 2020-21 221• Corporate Overview • Statutory Reports • Financial StatementsN o t e s t o t h e C o n s o l i d a t e d F i n a n c i a l S t a t e m e n t sN a t i o n a l P e r o x i d e L i m i t e d
Notes to the Consolidated Financial Statements as of and for the year ended March 31, 2021 (All amounts are in Indian Rupees lakhs, unless otherwise stated)
Notes to the Consolidated Financial Statements as of and for the year ended March 31, 2021 (All amounts are in Indian Rupees lakhs, unless otherwise stated)

49 Contingent liability (Contd..)
(iii) Contingent liability relating to determination of provident fund liability, based on judgement from Hon’ble Supreme Court, is not determinable at present for the period prior to March 2019, due to uncertainty on the impact of the judgement in the absence of further clarification relating to applicability. The Group has paid provident fund to employees as applicable with effect from March 2019. The Group will continue to assess any further developments in this matter for their implications on financial statements, if any.
50 Capital and other commitments
Capital commitments
(i) Estimated amount of contracts remaining to be executed on capital account and not provided (net of advances) for H 237.73 lakhs (March 31, 2020: H 10.63 lakhs)
(ii) Other commitments
The Group has entered into a long term agreement with GAIL (India) Limited (GAIL) for purchase of Natural Gas. The agreement is valid till December 31, 2025. As per the said agreement, the Group under ‘Take or Pay obligation’ clause has to make payment for a fixed quantity of gas on an annual basis, whether used or not. GAIL has the discretion to waive off the Take or Pay charges. A request for supply of Make Up gas can be made by the Group corresponding to Take or Pay deficiencies which are outstanding and for which the Group would pay to GAIL at the time of annual program.
(iii) For lease commitment, refer note 4.
51 Assets Decommissioned during the year
The Group commissioned its 150KTPA plant in February 2020. In the current year, as the plant got fully operational and stabilized, management undertook a review of all its older assets which may have become redundant and no longer usable in the production process and had to be decommissioned. As a result of this, assets with written down value amounting to H 876.97 lakhs were dismantled and disposed off at a loss of H 653.93 lakhs; assets with written down value amounting to H 218.32 lakhs were further written down to an estimated 5% of its gross block value resulting in a loss of H 136.72 lakhs. The aggregate loss of H 790.65 lakhs on account of decommissioning has been disclosed as an exceptional item in the Statement of Profit and Loss for the year ended March 31, 2021.
52 Write down of Assets held for sale to reassessed realizable value
There were items (Pipes, Pipe fittings, Valves, Cables and other spares) in Capital Work in Progress (CWIP) which were no longer required and classified as ‘Asset held for sale’ in previous year. The Group took necessary steps to sell the assets despite lower demand due to COVID scenario. Accordingly, the Group continues to classify the assets as held for sale. The Group has made enquires and has received quotations from various parties, basis which, the fair value has been reassessed and a write down of H 173.86 lakhs has been accounted, which has been disclosed as an exceptional item in the Statement of Profit and Loss for the year ended March 31, 2021.
53 Temporary Plant shut down due to machinery breakdown
The Group’s plant located at Kalyan, Maharashtra, was temporarily shut down from March 27, 2021 due to machinery breakdown and have resumed operations from May 30, 2021 in a phased manner. The Group has incurred loss of various chemicals (i.e. catalyst and working solution), fixed assets (primary, secondary and tertiary filters) and inventory (hydrogen peroxide) of an aggregate amount of H 584.79 lakhs which has been disclosed as an exceptional item. The Group has initiated the procedures with respect to insurance claim in this regard.
Name of the entity
Net assets (total assets minus total liabilities)
Share of profit or (loss)Share in other
comprehensive incomeShare in total
comprehensive income
As % of consolidated
net assets
Amount (H in lakhs)
As % of consolidated profit or loss
Amount (H in lakhs)
As % of consolidated
other comprehensive
income
Amount (H in lakhs)
As % of consolidated
total comprehensive
income
Amount (H in lakhs)
Parent
National Peroxide Limited
March 31, 2021 55.16% 58,841.66 98.27% 2,081.08 35.24% 8,833.55 40.15% 10,914.63
March 31, 2020 60.65% 48,645.41 96.93% 1,736.62 29.30% (10,096.81) 25.59% (8,360.19)
Subsidiaries
Naperol Investments Limited
March 31, 2021 44.84% 47,835.68 1.76% 37.29 64.76% 16,233.53 59.85% 16,270.82
March 31, 2020 39.35% 31,564.86 3.07% 54.94 70.70% (24,359.44) 74.41% (24,304.50)
NPL Chemicals Limited
March 31, 2021 0.00% (0.72) 0.00% (0.72) 0.00% - 0.00% (0.72)
March 31, 2020 - - - - - - - -
March 31, 2021 (Total) 100.00% 1,06,676.62 100.03% 2,117.65 100.00% 25,067.08 100.00% 27,184.73
March 31, 2020 (Total) 100.00% 80,210.27 100.00% 1,791.56 100.00% (34,456.25) 100.00% (32,664.69)
54 Note on Impact of Covid-19
The spread of COVID-19 disease has severely impacted economies, businesses and social set ups across the globe and in India. The number of new cases which had reached its lowest level in the first week of February 2021 has gone up dramatically in March 2021. Several restrictions have been imposed by various state governments and local bodies to control this strong second wave of the pandemic, but these are not as severe as the lockdown during the first wave.
Management has carried out a detailed assessment of Its liquidity position for the next one year and of the recoverability and carrying values of Property, Plant and Equipment, Trade receivables, Inventory, Intercorporate deposits and Investments as at the balance sheet date, and has concluded that there are no material adjustments required in the standalone financial statements.
Based on the Group’s liquidity position as at March 31, 2021 and review of cash flow projections (after applying sensitivity analysis) over the next twelve months, the management believes the Group will have sufficient liquidity to operate its businesses in the ordinary course. However, the impact assessment of COVID-19 is a continuing process given the uncertainties associated with its nature and duration. The Group will continue to monitor material changes to future economic conditions.
The eventual outcome of the impact of the COVID-19 pandemic on the Group’s business may be different than estimated as on the date of approval of these Consolidated financial statements.
55 Additional information required by Schedule III
222 Annual Report 2020-21 223• Corporate Overview • Statutory Reports • Financial StatementsN o t e s t o t h e C o n s o l i d a t e d F i n a n c i a l S t a t e m e n t sN a t i o n a l P e r o x i d e L i m i t e d
Notes to the Consolidated Financial Statements as of and for the year ended March 31, 2021 (All amounts are in Indian Rupees lakhs, unless otherwise stated)
Notes to the Consolidated Financial Statements as of and for the year ended March 31, 2021 (All amounts are in Indian Rupees lakhs, unless otherwise stated)
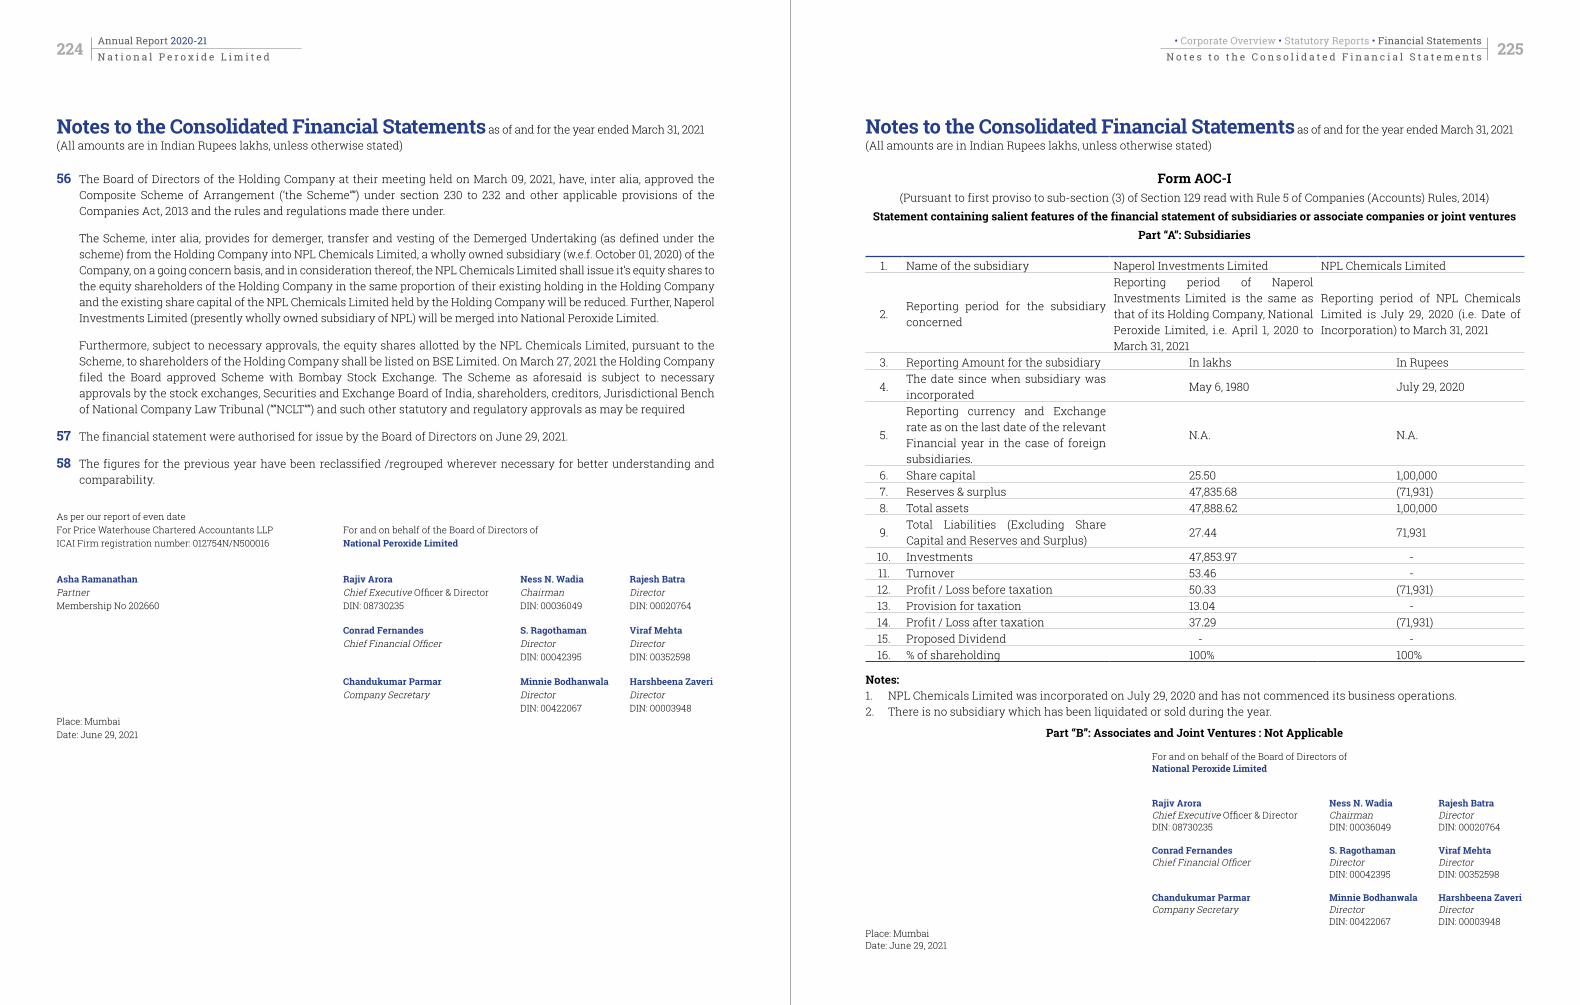
As per our report of even dateFor Price Waterhouse Chartered Accountants LLP For and on behalf of the Board of Directors ofICAI Firm registration number: 012754N/N500016 National Peroxide Limited
Asha Ramanathan Rajiv Arora Ness N. Wadia Rajesh Batra Partner Chief Executive Officer & Director Chairman Director Membership No 202660 DIN: 08730235 DIN: 00036049 DIN: 00020764
Conrad Fernandes S. Ragothaman Viraf Mehta Chief Financial Officer Director Director DIN: 00042395 DIN: 00352598
Chandukumar Parmar Minnie Bodhanwala Harshbeena Zaveri Company Secretary Director Director DIN: 00422067 DIN: 00003948 Place: Mumbai Date: June 29, 2021
56 The Board of Directors of the Holding Company at their meeting held on March 09, 2021, have, inter alia, approved the Composite Scheme of Arrangement (‘the Scheme””) under section 230 to 232 and other applicable provisions of the Companies Act, 2013 and the rules and regulations made there under.
The Scheme, inter alia, provides for demerger, transfer and vesting of the Demerged Undertaking (as defined under the scheme) from the Holding Company into NPL Chemicals Limited, a wholly owned subsidiary (w.e.f. October 01, 2020) of the Company, on a going concern basis, and in consideration thereof, the NPL Chemicals Limited shall issue it’s equity shares to the equity shareholders of the Holding Company in the same proportion of their existing holding in the Holding Company and the existing share capital of the NPL Chemicals Limited held by the Holding Company will be reduced. Further, Naperol Investments Limited (presently wholly owned subsidiary of NPL) will be merged into National Peroxide Limited.
Furthermore, subject to necessary approvals, the equity shares allotted by the NPL Chemicals Limited, pursuant to the Scheme, to shareholders of the Holding Company shall be listed on BSE Limited. On March 27, 2021 the Holding Company filed the Board approved Scheme with Bombay Stock Exchange. The Scheme as aforesaid is subject to necessary approvals by the stock exchanges, Securities and Exchange Board of India, shareholders, creditors, Jurisdictional Bench of National Company Law Tribunal (“”NCLT””) and such other statutory and regulatory approvals as may be required
57 The financial statement were authorised for issue by the Board of Directors on June 29, 2021.
58 The figures for the previous year have been reclassified /regrouped wherever necessary for better understanding and comparability.
Form AOC-I(Pursuant to first proviso to sub-section (3) of Section 129 read with Rule 5 of Companies (Accounts) Rules, 2014)
Statement containing salient features of the financial statement of subsidiaries or associate companies or joint venturesPart “A”: Subsidiaries
1. Name of the subsidiary Naperol Investments Limited NPL Chemicals Limited
2.Reporting period for the subsidiary concerned
Reporting period of Naperol Investments Limited is the same as that of its Holding Company, National Peroxide Limited, i.e. April 1, 2020 to March 31, 2021
Reporting period of NPL Chemicals Limited is July 29, 2020 (i.e. Date of Incorporation) to March 31, 2021
3. Reporting Amount for the subsidiary In lakhs In Rupees
4.The date since when subsidiary was incorporated
May 6, 1980 July 29, 2020
5.
Reporting currency and Exchange rate as on the last date of the relevant Financial year in the case of foreign subsidiaries.
N.A. N.A.
6. Share capital 25.50 1,00,0007. Reserves & surplus 47,835.68 (71,931)8. Total assets 47,888.62 1,00,000
9.Total Liabilities (Excluding Share Capital and Reserves and Surplus)
27.44 71,931
10. Investments 47,853.97 -11. Turnover 53.46 -12. Profit / Loss before taxation 50.33 (71,931)13. Provision for taxation 13.04 -14. Profit / Loss after taxation 37.29 (71,931)15. Proposed Dividend - -16. % of shareholding 100% 100%
Notes: 1. NPL Chemicals Limited was incorporated on July 29, 2020 and has not commenced its business operations.2. There is no subsidiary which has been liquidated or sold during the year.
Part “B”: Associates and Joint Ventures : Not Applicable
For and on behalf of the Board of Directors of National Peroxide Limited
Rajiv Arora Ness N. Wadia Rajesh Batra Chief Executive Officer & Director Chairman Director DIN: 08730235 DIN: 00036049 DIN: 00020764
Conrad Fernandes S. Ragothaman Viraf Mehta Chief Financial Officer Director Director DIN: 00042395 DIN: 00352598
Chandukumar Parmar Minnie Bodhanwala Harshbeena Zaveri Company Secretary Director Director DIN: 00422067 DIN: 00003948 Place: MumbaiDate: June 29, 2021
224 Annual Report 2020-21 225• Corporate Overview • Statutory Reports • Financial StatementsN o t e s t o t h e C o n s o l i d a t e d F i n a n c i a l S t a t e m e n t sN a t i o n a l P e r o x i d e L i m i t e d
Notes to the Consolidated Financial Statements as of and for the year ended March 31, 2021 (All amounts are in Indian Rupees lakhs, unless otherwise stated)
Notes to the Consolidated Financial Statements as of and for the year ended March 31, 2021 (All amounts are in Indian Rupees lakhs, unless otherwise stated)

226 Annual Report 2020-21 227• Corporate Overview • Statutory Reports • Financial StatementsN o t i c eN a t i o n a l P e r o x i d e L i m i t e d
NOTICE is hereby given that the Sixty-Seventh Annual General Meeting (‘AGM’) of the Members of NATIONAL PEROXIDE LIMITED will be held on Wednesday, August 25, 2021 at 3:30 p.m. (IST), through Video Conferencing (‘VC’) / Other Audio Visual Means (‘OAVM’) facility to transact the following businesses. The venue of this AGM shall be deemed to be the Registered Office of the Company at Neville House, J. N. Heredia Marg, Ballard Estate, Mumbai-400001:
Ordinary Business:
1. To receive, consider and adopt:
a) the Audited Standalone Financial Statements of the Company for the financial year ended March 31, 2021, together with the Reports of the Board of Directors and Auditors thereon; and
b) the Audited Consolidated Financial Statements of the Company for the financial year ended March 31, 2021, together with the Report of the Auditors thereon.
2. To declare a Dividend on Equity Shares for the financial year ended March 31, 2021.
3. To appoint a Director in place of Mr. Ness N. Wadia (DIN: 00036049), who retires by rotation and being eligible, offers himself for re-appointment.
Special Business:
4. To ratify the remuneration payable to Cost Auditors of the Company for the financial year ending March 31, 2022 and if thought fit, to pass the following resolution as an Ordinary Resolution:
“RESOLVED THAT pursuant to the provisions of Section 148 and other applicable provisions, if any, of the Companies Act, 2013 read with the Companies
(Audit and Auditors) Rules, 2014 and Companies (Cost Records and Audit) Rules, 2014 (including any statutory modification(s) or re-enactment(s) thereof, for the time being in force), M/s. D. C. Dave & Co., Cost Accountants (Firm Registration No. 000611), Cost Auditors appointed by the Board of Directors of the Company at its meeting held on June 29, 2021, to conduct the audit of the cost records of organic and inorganic chemicals and industrial gases of the Company for the financial year ending March 31, 2022, be paid remuneration of H 4,50,000/- plus applicable taxes and reimbursement of travelling and out-of-pocket expenses incurred by them for the purpose of Audit, and the same be and is hereby ratified.”
“RESOLVED FURTHER THAT any one of the Director, Chief Financial Officer and Company Secretary of the Company, be and are hereby severally authorized to do all necessary acts, deeds, matters and things as may be considered necessary and desirable to give effect to this Resolution.”
By Order of the Board of DirectorsFor National Peroxide Limited
Chandukumar ParmarCompany Secretary
ACS: 50299Mumbai, June 29, 2021
NOTES:
1. In view of the ongoing COVID-19 pandemic, the Ministry of Corporate Affairs (‘MCA’) vide its Circular dated May 5, 2020 read with Circulars dated April 8, 2020, April 13, 2020 and January 13, 2021 (collectively referred to as ‘MCA Circulars’) and SEBI vide its Circular No.
NOTICECIN: L24299MH1954PLC009254
Registered Office: Neville House, J. N. Heredia Marg, Ballard Estate, Mumbai-400001.Head Office: C-1, Wadia International Centre, Pandurang Budhkar Marg, Worli, Mumbai-400025.
Email: [email protected]; Website: www.naperol.com; Phone: 022-66620000
SEBI/HO/CFD/CMD1/CIR/P/2020/79 and SEBI/HO/CFD/CMD2/ CIR/P/2021/11 dated May 12, 2020 and January 15, 2021 respectively (collectively referred to as ‘SEBI Circulars’), have permitted the holding of the Annual General Meeting (‘AGM’) through Video Conference / Other Audio Visual Means (‘VC / OAVM’), without the physical presence of the Members at a common venue.
In Compliance with the provisions of the Companies Act, 2013 (‘the Act’), SEBI (Listing Obligations and Disclosure Requirements) Regulations, 2015, (‘Listing Regulations’) read with the Circulars issued by MCA and SEBI, the Sixty-Seventh AGM of the Company shall be conducted through VC / OAVM on Wednesday, August 25, 2021 at 3.30 p.m. (IST). National Securities Depositories Limited (‘NSDL’) will be providing facility for remote e-Voting, participation in the AGM through VC / OAVM and e-Voting during the AGM.
2. A member entitled to attend and vote at the AGM is entitled to appoint a proxy to attend and vote on his / her behalf and the proxy need not be a Member of the Company. Since, this AGM is being held through VC / OAVM, physical attendance of Members has been dispensed with. Accordingly, the facility for appointment of proxies by the Members will not be available for the AGM and hence the Proxy Form and Attendance Slip, including Route Map, are not annexed to this Notice.
3. An Explanatory Statement pursuant to Section 102 of the Companies Act, 2013, which sets out details relating to Special Business at the meeting, is annexed thereto.
4. Institutional / Corporate Shareholders (i.e. other than individuals, HUF, NRI etc.) are required to send a scanned copy (PDF / JPG Format) of its Board or governing body Resolution / Authorization etc., authorizing its representative to attend the AGM through VC / OAVM and vote on its behalf. The said Resolution / Authorization should be e-mailed to the Company at [email protected] and to Link Intime India Private Limited, Registrar and Share Transfer Agents, at [email protected] with a copy marked to [email protected].
5. The Register of Members and the Share Transfer Books of the Company will remain closed from Thursday, August 19, 2021 to Wednesday, August 25, 2021 (both days inclusive) for the purpose of determining eligibility of members entitled to dividend.
6. The dividend of H 12.50/- per equity share having face value of H 10/- each (i.e., 125%), as recommended by the Board of Directors, if approved by the Members at this AGM, shall be paid on or after Wednesday, September 1, 2021, to those Members whose names appear in the Register of Members of the Company as on the Book Closure Date.
7. Members are requested to notify immediately any change of address:
i. to their Depository Participants in respect of their demat accounts; and
ii. to the Company’s Registrar and Share Transfer Agents, Link Intime India Private Limited, at C-101, 247 Park, L.B.S. Marg, Vikhroli (West), Mumbai 400083 (email ID: [email protected]; Tel: 022 49186270) in respect of their physical share folios, if any, quoting their folio numbers.
8. The National Automated Clearing House (NACH) facility should mandatorily be used by companies for the distribution of dividend to its Members. In order to avail the facility of NACH, Members holding shares in physical form are requested to provide bank account details to the Company or its Registrar and Share Transfer Agents.
Members holding shares in electronic form are hereby informed that bank particulars registered against their respective depository accounts will be used by the Company for payment of dividend. The Company or its Registrar and Share Transfer Agents cannot act on any request received directly from the Members holding shares in electronic form for any change of bank particulars or bank mandates. Such changes are to be advised only to the Depository Participants of the Members.
9. Pursuant to the provisions of Section 124(5) of the Companies Act, 2013, dividends for the financial year ended March 31, 2014 and thereafter, which remain unpaid or unclaimed for a period of seven years from the respective dates of transfer to the unpaid dividend account of the Company are due for transfer to the Investor Education & Protection Fund (‘IEPF’) on the dates given in the table below:
Financial YearDate of
Declaration of Dividend
Due Date for Transfer to IEPF*
2013-14 11.08.2014 11.09.20212014-15 11.08.2015 13.09.20222015-16 11.08.2016 11.09.20232016-17 09.08.2017 11.09.20242017-18 02.08.2018 02.09.20252018-19 06.08.2019 06.09.2026 2019-20 25.08.2020 25.09.2027
* Indicative dates; actual dates may vary.

228 Annual Report 2020-21 229• Corporate Overview • Statutory Reports • Financial StatementsN o t i c eN a t i o n a l P e r o x i d e L i m i t e d
Members who have so far not encashed the Dividend Warrants for the above years are advised to submit their claim to Link Intime India Private Limited, Registrar and Share Transfer Agents at the address given in note no. 7(ii), quoting their Folio numbers / DP ID & Client ID.
Pursuant to the provisions of Section 124(6) of the Companies Act, 2013 read with the Investor Education and Protection Fund (‘IEPF’) Authority (Accounting, Audit, Transfer and Refund) Rules, 2016 (‘Rules’), as amended from time to time, the Company is required to transfer all shares in respect of which dividend has not been paid or claimed for a period of seven consecutive years to the Demat Account of the IEPF Authority.
In compliance with the said Rules, the Company has communicated to the concerned shareholders whose shares are liable to be transferred / credited to the Demat Account of the IEPF Authority. The Company has also uploaded on its website at www.naperol.com under Investor Relations, the details of such shareholders whose shares are to be transferred / credited to the Demat Account of the IEPF Authority.
Shareholders may note that both, the unclaimed dividend amount transferred to IEPF and the shares transferred to the Demat Account of the IEPF Authority including all benefits accruing on such shares, if any, can be claimed back by the shareholders from the IEPF Authority, after following the procedure prescribed in the Rules.
10. Members holding shares in physical form may avail themselves of the facility of nomination in terms of Section 72 of the Companies Act, 2013 by nominating in the prescribed form a person to whom their shares in the Company shall vest in the event of their death. The prescribed form can be obtained from the Company’s Registrar and Share Transfer Agents.
11. Pursuant to Section 101 of the Companies Act, 2013 read with the Companies (Management and Administration) Rules, 2014 and Section 136 of the Companies Act, 2013 read with the Companies (Accounts) Rules, 2014, the Company can serve notice of general meeting and financial statements through electronic mode to those Members who have registered their e-mail address with the depository or the Company. The Members, who hold shares in dematerialized form, are requested to register / update their e-mail address with the depository. The members holding shares in physical form may also opt to receive notices / financial statements by registering their e-mail address with
the Company’s Registrar and Share Transfer Agents at [email protected].
12. Pursuant to Finance Act, 2020, dividend income will be taxable in the hands of shareholders w.e.f. April 1, 2020 and the Company is required to deduct tax at source from dividend paid to Shareholders at the prescribed rates. The Shareholders are requested to update their PAN with the Company or its Registrar and Share Transfer Agents (in case of shares held in physical mode) and depositories (in case of shares held in demat mode).
13. SEBI has mandated the submission of PAN by every participant in securities market. Members holding shares in electronic form are, therefore, requested to submit the PAN to their Depository Participants with whom they are maintaining their Demat Accounts. Members holding shares in physical form can submit their self-attested copy of PAN card to the Company.
14. The details required under Regulation 36(3) of the Listing Regulations and Secretarial Standard on General Meetings (SS-2) issued by the Institute of Company Secretaries of India, in respect of the Director seeking re-appointment at this AGM forms part of the Notice.
DISPATCH OF ANNUAL REPORT THROUGH EMAIL AND REGISTRATION OF EMAIL IDs:
15. In compliance with the Circulars issued by MCA and SEBI, Notice of the AGM along with the Annual Report for financial year 2020-21 is being sent only through electronic mode to those Members whose email addresses are registered with the Company / Depository Participants (DP). Members may note that the Notice and Annual Report for financial year 2020-21 is also available on the Company’s website at www.naperol.com, website of the Stock Exchange i.e. BSE Limited at www.bseindia.com and on the website of National Securities Depository Limited (NSDL) at www.evoting.nsdl.com.
16. Members holding shares in physical mode can register / update their email address by sending a duly signed request letter including their name and folio no. to Link Intime India Private Limited, Company’s Registrar and Share Transfer Agents at C-101, 247 Park, L.B.S. Marg, Vikhroli (West), Mumbai–400083 (email ID: [email protected]; Tel: 022-49186270). Members holding shares in dematerialised mode are requested to register / update their email addresses with the relevant Depository Participants.
17. Members seeking any information with regard to any matter to be placed at the Annual General Meeting, are requested to write to the Company at [email protected].
PROCEDURE FOR ATTENDING AGM THROUGH VC / OAVM:
18. Members will be provided with a facility to attend the AGM through VC / OAVM through the NSDL e-Voting system. Members may access by following the steps mentioned below for ‘Procedure for Remote e-Voting and e-Voting during AGM’ for Access to NSDL e-Voting system. After successful login, you can see link of ‘VC /OAVM link’ placed under ‘Join General meeting’ menu against company name. You are requested to click on VC / OAVM link placed under Join General Meeting menu. The link for VC / OAVM will be available in Shareholder / Member login where the EVEN of Company will be displayed. Please note that the members who do not have the User ID and Password for e-Voting or have forgotten the User ID and Password may retrieve the same by following the remote e-Voting instructions mentioned in the notice to avoid last minute rush.
19. Members are requested to join the Meeting through Laptops for better experience and will be required to allow camera and use internet with a good speed to avoid any disturbance during the meeting. Please note that participants connecting from Mobile Devices or Tablets or through Laptop connected via mobile hotspot may experience audio / video loss due to fluctuation in their respective network. It is therefore recommended to use stable Wi-Fi or LAN connection to mitigate any kind of glitches.
20. Members may note that the VC / OAVM facility, provided by NSDL, allows participation of at least 1,000 Members on a first-come-first-served basis. Members who need assistance before or during the AGM, can contact NSDL on [email protected] / 1800 1020 990 /1800 224 430 or contact Mr. Amit Vishal, Assistant Vice President, NSDL or Ms. Pallavi Mhatre, Manager, NSDL, at [email protected].
PROCEDURE TO RAISE QUESTIONS / SEEK CLARIFICATIONS WITH RESPECT TO ANNUAL REPORT:
21. As the AGM is being conducted through VC / OAVM, Members are encouraged to express their views in advance mentioning their name, DP ID and Client ID / Folio No., e-mail ID, Mobile Number to
[email protected] to enable smooth conduct of proceedings at the AGM. Questions / Queries received by the Company on or before Wednesday, August 18, 2021, on the aforementioned e-mail ID shall be considered and responded to during the AGM.
22. Members who would like to register themselves as Speakers may send their request from their registered email address mentioning their name, DP ID and Client ID / Folio No., PAN, Mobile Number to [email protected] on or before Wednesday, August 18, 2021. Those Members who have registered themselves as Speakers will only be allowed to express their views / ask questions during the AGM. Speakers are requested to submit their questions at the time of registration, to enable the Company to respond appropriately.
23. The Company reserves the right to restrict the number of questions and number of speakers, as appropriate, to ensure the smooth conduct of the AGM.
PROCEDURE FOR REMOTE E-VOTING AND E-VOTING DURING AGM:
24. In compliance with provisions of Section 108 of the Companies Act, 2013 read with the Rule 20 of the Companies (Management and Administration) Rules, 2014, (including any statutory modification(s) or re-enactment(s) thereof, for the time being in force); Regulation 44 of SEBI Listing Regulations, 2015, and Secretarial Standard on General Meetings (SS-2) issued by the Institute of Company Secretaries of India, the Company is pleased to provide Members with a facility to exercise their right to vote by electronic means for the business to be transacted at the AGM.
25. Members whose name appears in the Register of Members or in the Register of Beneficial Owners maintained by the depositories as on the cut-off date i.e., Wednesday, August 18, 2021, shall only be entitled to attend and vote at the AGM. A person who is not a Member as on the cut-off date should treat this Notice of AGM for information purpose only.
26. In case of joint holders attending the Meeting, the Member whose name appears as the first holder in order of names as per Register of Members will be entitled to vote.
27. The remote e-voting period commences on Sunday, August 22, 2021 at 9:00 a.m. (IST) and ends on Tuesday, August 24, 2021 at 5:00 p.m. (IST). During this period,

230 Annual Report 2020-21 231• Corporate Overview • Statutory Reports • Financial StatementsN o t i c eN a t i o n a l P e r o x i d e L i m i t e d
Members of the Company, holding shares either in physical form or in dematerialized form, as on the cut-off date i.e., Wednesday, August 18, 2021, may cast their vote by remote e-voting. The remote e-voting module shall be disabled by NSDL for voting thereafter. Once the vote on a resolution is cast by the Members, the Member shall not be allowed to change it subsequently. In addition, the facility for voting through electronic
28. The details of the process and manner for remote e-voting / e-voting and joining the AGM are explained herein below:
Step 1: Access to NSDL e-voting system
Step 2: Cast your vote electronically and join the AGM on NSDL e-voting system.
Details on Step 1 are mentioned below:
I. Login method for e-voting and joining the AGM for individual shareholders holding securities in demat mode
In terms of SEBI Circular dated December 9, 2020, on e-voting facility provided by Listed Companies, Individual Shareholders holding securities in demat mode are allowed to vote through their Demat Accounts maintained with Depositories and Depository Participants. Shareholders are advised to update their mobile number and e-mail address in their demat accounts in order to access the e-Voting facility.
Type of Shareholders Login Method
Individual Shareholders holding securities in demat mode with NSDL
a. If you are already registered for NSDL IDeAS facility, please visit the e-Services website of NSDL: https://eservices.nsdl.com/. Once the home page of e-services is launched, click on the ‘Beneficial Owner’ icon under ‘Login’ which is available under ‘IDeAS’ section. Please enter your User ID and Password. After successful authentication, you will be able to see e-voting services. Click on ‘Access to e-Voting’ under e-Voting services and you will be able to see e-Voting page. Click on options available against the Company’s name or e-Voting service provider - NSDL and you will be re-directed to NSDL e-Voting website for casting your vote during the remote e-voting period or joining the AGM and voting during the Meeting.
b. If the user is not registered for IDeAS e-Services, option to register is available at https://eservices.nsdl.com/. Select ‘Register Online for IDeAS’ on the Portal or click at https://eservices.nsdl.com/SecureWeb/IdeasDirectReg.jsp
c. Visit the e-Voting website of NSDL. Open web browser by typing the URL: https://www.evoting.nsdl.com/. Once the home page of e-Voting system is launched, click on the icon ‘Login’ which is available under ‘Shareholder / Member’ section. A new screen will open. You will have to enter your User ID (i.e. your 16 digit demat account number held with NSDL), Password / OTP and a verification code as shown on the screen. After successful authentication, you will be redirected to NSDL Depository site wherein you can see e-Voting page. Click on options available against the Company’s name or e-Voting service provider - NSDL and you will be redirected to e-Voting website of NSDL for casting your vote during the remote e-Voting period or joining the AGM and voting during the meeting.
Type of Shareholders Login Method
Individual Shareholders holding securities in demat mode with CDSL.
a. Existing users who have opted for Easi / Easiest, they can login through their User ID and Password. Option will be made available to reach e-Voting page without any further authentication. The URL for users to login to Easi / Easiest are https://web.cdslindia.com/myeasi/home/login or www.cdslindia.com and then click on New System Myeasi.
b. After successful login of Easi / Easiest, the user will also be able to see the e-voting Menu. The menu will have links of e-Voting service provider i.e. NSDL. Click on NSDL to cast your vote.
c. If the user is not registered for Easi / Easiest, option to register is available at https://web.cdslindia.com/myeasi/Registration/EasiRegistration
d. Alternatively, the user can directly access e-Voting page by providing demat Account Number and PAN from a link at www.cdslindia.com home page. The system will authenticate the user by sending OTP on registered mobile no. & e-mail address as recorded in the demat account. After successful authentication, user will be provided links for the respective e-Voting service provider i.e. NSDL where the e-Voting is in progress.
Individual Shareholders (holding securities in demat mode) login through their Depository Participants
You can also login using the login credentials of your demat account through your Depository Participant registered with NSDL/CDSL for e-Voting facility. Once you login, you will be able to see e-Voting option. Once you click on e-voting option, you will be redirected to NSDL/CDSL Depository site after successful authentication, wherein you can see e-Voting feature. Click on options available against the Company’s name or e-Voting service provider-NSDL and you will be redirected to e-Voting website of NSDL for casting your vote during the remote e-Voting period or joining the AGM and voting during the meeting.
Important note: Members who are unable to retrieve User ID / Password are advised to use Forget User ID and Forget Password option available at abovementioned website.
Helpdesk for Individual Shareholders holding securities in demat mode for any technical issues related to login through Depository i.e. NSDL and CDSL
Login type Helpdesk details
Individual Shareholders holding securities in demat mode with NSDL
Members facing any technical issue in login can contact NSDL helpdesk by sending a request at [email protected] or call at toll free no.: 1800 1020 990 and 1800 224 430.
Individual Shareholders holding securities in demat mode with CDSL
Members facing any technical issue in login can contact CDSL helpdesk by sending a request at [email protected] or contact at 022-23058738 or 022-23058542/43.
II. Login method for e-voting and joining the AGM for Shareholders other than Individual shareholders holding securities in demat mode and Shareholders holding in physical mode.
How to Log-in to NSDL e-voting website?
a. Visit the e-Voting website of NSDL. Open web browser by typing the following URL: https://www.evoting.nsdl.com/.
b. Once the home page of e-Voting system is launched, click on the icon “Login” which is available under ‘Shareholder / Member’ section.
voting system shall also be made available during the AGM. Members attending the AGM who have not cast their vote by remote e-voting shall be eligible to cast their vote through e-voting during the AGM. Members who have voted through remote e-voting shall be eligible to attend the AGM; however, they shall not be eligible to vote at the AGM.
232 Annual Report 2020-21 233• Corporate Overview • Statutory Reports • Financial StatementsN o t i c eN a t i o n a l P e r o x i d e L i m i t e d
c. A new screen will open. You will have to enter your User ID, your Password / OTP and a Verification Code as shown on the screen.
Alternatively, if you are registered for NSDL eservices i.e. IDeAS, you can log-in at https://eservices.nsdl.com/ with your existing IDeAS login. Once you log-in to NSDL eservices after using your log-in credentials, click on e-Voting and you can proceed to Step 2 i.e. Cast your vote electronically.
d. Your User ID details are given below :
Manner of holding shares i.e. Demat (NSDL or CDSL)
or Physical
Your User ID is
i) For Members who hold shares in demat account with NSDL.
8 Character DP ID followed by 8 Digit Client IDFor example: if your DP ID is IN300*** and Client ID is 12******, then your user ID is IN300***12******.
ii) For Members who hold shares in demat account with CDSL.
16 Digit Beneficiary IDFor example: if your Beneficiary ID is 1 2 * * * * * * * * * * * * * * , then your user ID is 12**************
iii) For Members holding shares in Physical Form.
EVEN Number followed by Folio Number registered with the CompanyFor example: if EVEN is 101456 and Folio number is 001***, then user ID is 101456001***
e. Your password details are given below:
i) If you are already registered for e-Voting, then you can use your existing password to login and cast your vote.
ii) If you are using NSDL e-Voting system for the first time, you will need to retrieve the ‘initial password’ which was communicated to you by NSDL. Once you retrieve your ‘initial password’, you need to enter the same and the system will force you to change your password.
iii) How to retrieve your ‘initial password’?
If your e-mail ID is registered in your demat account or with the Company, your ‘initial password’ is communicated to you on your e-mail ID. Trace the email sent to you from NSDL from your mailbox. Open the e-mail and open the attachment i.e., a pdf file. The password to open the .pdf file is your eight digit Client ID for NSDL account, last eight digits of Client ID for CDSL account or Folio No. for shares held in physical form. The .pdf file contains your ‘User ID’ and your ‘initial password’.
In case you have not registered your e-mail address with the Company / Depository, please follow instructions mentioned under the section ‘Dispatch of Annual Report through e-mail and Registration of e-mail IDs’ in this Notice.
f. If you are unable to retrieve or have not received the ‘initial password’ or have forgotten your password:
Click on ‘Forgot User Details Password?’ (If you are holding shares in your demat account with NSDL or CDSL) option available on www.evoting.nsdl.com.
‘Physical User Reset Password?’ (If you are holding shares in physical mode) option available on www.evoting.nsdl.com.
If you are still unable to get the password by aforesaid two options, you can send a request at [email protected] mentioning your demat account number / Folio No., your PAN, your name and your registered address.
Members can also use the one-time password (OTP) based login for casting the votes on the e-voting system of NSDL.
g. After entering your password, click on agree to ‘Terms and Conditions’ by selecting on the check box.
h. Now, you will have to click on ‘Login’ button.
i. After you click on the ‘Login’ button, Home page of e-Voting will open.
Details on Step 2 are mentioned below:
a. After successful login at Step 1, you will be able to see ‘EVEN’ of all the Companies in which you are holding shares and whose voting cycle and General Meeting is in active status.
b. Select ‘EVEN’ of Company i.e. 116471 for which you wish to cast your vote during remote e-Voting period and during the AGM. For joining the AGM, you need to click on ‘VC / OAVM’ link placed under ‘Join General Meeting’.
c. Now you are ready for e-Voting as the voting page opens.
d. Cast your vote by selecting appropriate options i.e., assent or dissent, verify / modify the number of shares for which you wish to cast your vote and click on ‘Submit’ and also ‘Confirm’ when prompted.
e. Upon confirmation, the message ‘Vote cast successfully’ will be displayed.
f. You can also take the printout of the votes cast by you by clicking on the print option on the confirmation page.
g. Once you confirm your vote on the resolution, you will not be allowed to modify your vote.
PROCEDURE FOR E-VOTING ON THE DAY OF THE AGM:
i. Only those members who will be present in the AGM through VC / OAVM facility and have not cast their vote on the Resolutions by remote e-voting prior to the AGM shall be entitled to cast their vote through the e-voting system at the AGM.
ii. The procedure for e-voting on the day of the AGM is the same as the instructions mentioned above for remote e-voting.
GENERAL INFORMATION FOR MEMBERS
29. It is strongly recommended not to share your password with any other person and take utmost care to keep your password confidential. Login to the e-Voting website will be disabled upon five unsuccessful attempts to key in the correct password. In such an event, you will need to go through the ‘Forgot User Details / Password?’
or ‘Physical User Reset Password?’ option available on https://www.evoting.nsdl.com/ to reset the password.
30. In case of any queries relating to e-Voting, you may refer to the FAQs for Shareholders and e-Voting user manual for Shareholders available at the download section of www.evoting.nsdl.com or call on toll free no.: 1800 1020 990 / 1800 224 430 or send a request to Mr. Amit Vishal, Assistant Vice President, NSDL or Ms. Pallavi Mhatre, Manager, NSDL, at [email protected].
31. Any person holding shares in physical form and non-individual shareholders who acquires shares of the Company and becomes member of the Company after the notice is send through e-mail and holding shares as of the cut-off date i.e., Wednesday, August 18, 2021, may obtain the login ID and password by sending a request at [email protected] or the Company at [email protected] or Company’s Registrar and Share Transfer Agents at [email protected]. However, if you are already registered with NSDL for remote e-voting, then you can use your existing user ID and password for casting your vote. If you forgot your password, you can reset your password by using ‘Forgot User Details/Password’ or ‘Physical User Reset Password’ option available on www.evoting.nsdl.com or call on toll free no. 1800 1020 990 and 1800 22 44 30.
32. In case of Individual Shareholders holding securities in demat mode who acquires shares of the Company and becomes a Member of the Company after sending of the Notice and holding shares as of the cut-off date i.e., Wednesday, August 18, 2021 may follow steps mentioned in the Notice of the AGM under ‘Procedure for Remote e-Voting and e-Voting during AGM’.
33. Mr. Nilesh Shah (Membership No. F-4554) and failing him Mr. Mahesh Darji (Membership No. F-7175) and failing him Ms. Hetal Shah (Membership No. F-8964) of M/s. Nilesh Shah & Associates, Practicing Company Secretaries, who have been appointed as Scrutinizer to scrutinize the remote e-Voting process and e-Voting during the AGM in a fair and transparent manner.
34. The results declared along with the Scrutinizer’s Report shall be placed on the Company’s website at www.naperol.com and on NSDL’s website at https://www.evoting.nsdl.com. The Company shall also submit the results to BSE Limited and the same be placed on its website at www.bseindia.com.
35. Subject to receipt of requisite number of votes, the Resolutions shall be deemed to have been passed on the date of the AGM i.e. on Wednesday, August 25, 2021.

234 Annual Report 2020-21 235• Corporate Overview • Statutory Reports • Financial StatementsN o t i c eN a t i o n a l P e r o x i d e L i m i t e d
EXPLANATORY STATEMENT IN RESPECT OF THE SPECIAL BUSINESS PURSUANT TO SECTION 102 OF THE COMPANIES ACT, 2013
ITEM NO. 4
The Board of Directors, on the recommendation of the Audit Committee, approved the appointment of M/s. D. C. Dave & Co., Cost Accountants, (Firm Registration No. 000611) as Cost Auditors to conduct the audit of the cost records of organic and inorganic chemicals and industrial gases of the Company at a remuneration of H 4,50,000/- (Rupees Four lakhs Fifty Thousand only) plus applicable taxes and reimbursement of travelling and out-of-pocket expenses incurred by them for the financial year ending March 31, 2022.
In terms of the provisions of Section 148 of the Companies Act, 2013 read with the Companies (Audit and Auditors) Rules, 2014 and Companies (Cost Records and Audit Rules), 2014 (including any statutory modification(s) or re-enactment(s) thereof, for the time being in force), the remuneration payable to the Cost Auditor, as recommended by the Audit Committee and approved by the Board of Directors, has to be ratified by the Members of the Company.
M/s. D. C. Dave & Co., Cost Accountants, Mumbai have confirmed that they are eligible to be appointed as
ANNEXURE I TO THE NOTICE
ANNEXURE II TO THE NOTICE
Cost Auditors of the Company and hold a valid certificate of practice under Section 6(1) of the Cost and Works Accountants Act, 1959.
Accordingly, consent of the Members is sought for passing an Ordinary Resolution for ratification of the remuneration payable to the Cost Auditors for the financial year ending March 31, 2022.
None of the Directors and Key Managerial Personnel(s) of the Company or their relatives are concerned or interested, financially or otherwise, in the resolution, set out at Item No. 4 of this Notice.
The Board of Directors commends the Ordinary Resolution set out at Item No. 4 of the accompanying Notice for approval of the Members.
By Order of the Board of DirectorsFor National Peroxide Limited
Chandukumar ParmarCompany Secretary
ACS: 50299Mumbai, June 29, 2021
Brief Resume of Director proposed to be re-appointed
Mr. Ness N. Wadia
Mr. Ness N. Wadia (50) is currently the Chairman of the Company and was inducted as a Non-Executive Director in March 1997. He currently serves as Managing Director of The Bombay Burmah Trading Corporation, Ltd., and Director on Boards of Wadia Group companies including The Bombay Dyeing and Manufacturing Company Ltd., Go Airlines (India) Ltd. and Britannia Industries Ltd.
As Trustee of Sir Ness Wadia Foundation and Britannia Nutrition Foundation, he drives the Group’s efforts in bridging the socio-economic gap that exists in the society and carrying forward the foundation’s commitment towards addressing the intergenerational cycle of malnutrition and improving the health and nutritional well-being of children, adolescents and expectant / new mothers.
Mr. Wadia is Secretary of Modern Education Society, Pune, whose objective is to establish and run educational institutions, encourage, promote, advance and impart literacy, education and training in various streams.
PROCEDURE FOR INSPECTION OF DOCUMENTS:
36. During the AGM, the Register of Directors and Key Managerial Personnel and their shareholding maintained under Section 170 of the Act and the Register of Contracts or Arrangements in which Directors are interested under Section 189 of the Act shall be available for inspection electronically upon login at NSDL e-voting system at https://www.evoting.nsdl.com/.
37. To prevent fraudulent transactions, members are advised to exercise due diligence and notify any change in information to Registrar and Share Transfer Agents or Company as soon as possible. Members are also advised not to leave their Demat Account(s) dormant for long. Periodic statement of holdings should be obtained from the concerned Depository Participant(s) and holdings should be verified.
38. Members who hold shares under more than one folio in name(s) in the same order, are requested to send the relative Share Certificate(s) to the Company’s Registrar and Share Transfer Agents for consolidating the holdings into one account. The Share Certificate(s) will be returned after consolidation.
OTHER INFORMATION:
39. Members holding shares in dematerialised form may please note that, while opening a account with Depository Participant(s) they may have given their bank account details, which will be printed on their dividend warrants.
However, if Members want to change / correct the bank account details, they should send the same immediately to the Depository Participant(s) concerned. Members are also requested to give the MICR code of their bank to their Depository Participant(s). The Company will
not entertain any direct request from Members for cancellation / change in the bank account details furnished by Depository Participant(s) to the Company.
40. All documents, transfers, dematerialization requests and other communications in relation thereto shall be addressed directly to the Company’s Registrar and Share Transfer Agent, Link Intime India Private Limited, at C-101, 247 Park, L.B.S. Marg, Vikhroli (West), Mumbai–400083 (email ID- [email protected]; Tel: 022-49186270).
41. Pursuant to provisions of the Listing Regulations, the Company is maintaining an e-mail ID- [email protected] exclusively for quick redressal of Members’ / Investors’ grievances.
42. Pursuant to the provisions of Regulation 40 of the Listing Regulations, securities can be transferred only in dematerialised form with effect from April 1, 2019. Members are requested to convert their physical holdings into demat form to avoid any possibility of loss, mutilation etc., of physical share certificate(s). Any shareholder who is desirous of dematerializing their securities may write to Company Secretary at [email protected] or to the Registrar and Share Transfer Agents.
By Order of the Board of DirectorsFor National Peroxide Limited
Chandukumar ParmarCompany Secretary
ACS: 50299Mumbai, June 29, 2021

237• Corporate Overview • Statutory Reports • Financial StatementsI n f o r m a t i o n a t a G l a n c e236 Annual Report 2020-21
N a t i o n a l P e r o x i d e L i m i t e d
He is also overseeing the family’s tradition of providing housing to the needy through Wadia Baugs which are managed under the aegis of Nowrosjee Nusserwanjee Wadia Trust and the Rustomji Nowrosjee Wadia Trust.
As a Board Member of Wadia Hospitals, he has played an important role in bringing a positive transformation at Wadia Hospitals. As a result of its relentless pursuit of excellence, Wadia Hospitals now hosts the world’s largest and 155-bedded NICU in Asia; the Pediatric hospital with 450 beds, caters to more than 30 super-specialty services, thus providing comprehensive treatment to children under one roof.
Mr. Wadia is also a Board Member of School for Social Entrepreneurs India, whose mission is to address inequalities and social exclusion by supporting social entrepreneurs from all backgrounds to transform their talent into real social outcomes.
Mr. Wadia did his Master’s degree in Science (M.Sc.) of Engineering Management from the University of Warwick with a thesis titled “Leading to Success in India”.
He is also a co-owner of Punjab Kings and St Lucia Zouks - prominent cricket teams in the Indian Premier League and Caribbean Premier League, respectively.
Mr. Wadia is not related to any of the other Directors. Mr. Wadia is a Promoter of the Company and holds 4,600 shares of the Company.
Date of first appointment on the Board: March 18, 1997.
Number of Board Meetings attended during the year: Six
Other Directorships: The Bombay Burmah Trading Corporation, Ltd. (Managing Director); The Bombay Dyeing & Manufacturing Company Ltd.; Go Airlines (India) Ltd.; Britannia Industries Ltd.; Virtual Education Network Pvt. Ltd.; K.P.H. Dream Cricket Pvt. Ltd.;
Go Investments & Trading Pvt. Ltd.; Nitapo Holdings Private Ltd.; Leila Lands SB, Malaysia; Island Landscape & Nursery Pte. Ltd.; Island Horti-Tech Holdings Pte. Ltd.; Strategic Foods Intl. Co. (LLC); School for Social Entrepreneurs India; Nammyoho Daan Foundation and Patricia Keelan Foundation.
Other Committee Membership: Stakeholders’ Relationship Committee, Risk Management Committee, Corporate Social Responsibility (CSR) Committee of The Bombay Burmah Trading Corporation Ltd.; Audit Committee, CSR Committee (Chairman) of The Bombay Dyeing & Mfg. Co. Ltd.; Audit Committee, Stakeholders’ Relationship Committee, CSR Committee of Go Airlines (India) Ltd.; Audit Committee, CSR Committee (Chairman), Finance Committee, Strategy & Innovation Steering Committee, Bonus Debentures Committee of Britannia Industries Ltd.
By Order of the Board of DirectorsFor National Peroxide Limited
Chandukumar ParmarCompany Secretary
ACS: 50299
Mumbai, June 29, 2021
Registered Office:Neville House, J. N. Heredia Marg,Ballard Estate, Mumbai-400001.CIN: L24299MH1954PLC009254
Head Office:C-1, Wadia International Centre, Pandurang Budhkar Marg,Worli, Mumbai-400025. Phone: 022-66620000Email ID: [email protected]: www.naperol.com
INFORMATION AT A GLANCE
Particulars Details
Date of AGM Wednesday, August 25, 2021
Time of AGM 3:30 p.m. (IST)
Venue Video Conference (‘VC’) / Other Audio Visual Means (‘OAVM’)
Weblink for Members to participate in the AGM through Video Conference
https://www.evoting.nsdl.com
Service Provider for VC / OAVM Platform and remote e-Voting National Securities Depository Limited
Name and contact details of Service Provider for assistance on remote e-Voting / e-Voting and AGM
National Securities Depository Limited4th Floor, ‘A’ Wing, Trade World, Kamala Mills Compound, Senapati Bapat Marg, Lower Parel, Mumbai - 400 013.
Mr. Amit VishalAssistant Vice President
Ms. Pallavi MhatreManager
Phone: 1800 1020 990 / 1800 224 430
Email ID: [email protected]
Cut-off date for e-Voting Wednesday, August 18, 2021
Remote e-Voting date and start time Sunday, August 22, 2021 at 9:00 a.m. (IST)
Remote e-Voting date and end time Tuesday, August 24, 2021 at 5:00 p.m. (IST)
EVEN 116471
Weblink for Members to initiate remote e-Voting https://www.evoting.nsdl.com/
Dividend H 12.50/- per equity share having face value of H 10/- each (i.e., 125%) subject to approval of Members at this AGM
Record Date for Dividend Wednesday, August 18, 2021
Name and contact details of Registrar and Share Transfer Agents
Link Intime India Private LimitedC-101, 247 Park, L.B.S. Marg, Vikhroli (West), Mumbai-400083Phone: 022-49186270Email ID: [email protected]: www. https://linkintime.co.in/
Name and contact details of Company Secretary
Mr. Chandukumar ParmarNational Peroxide LimitedC-1, Wadia International Centre, Pandurang Budhkar Marg, Worli, Mumbai-400025.Phone: 022-66620000Email ID: [email protected] Website: www.naperol.com

Notes Notes

Notes

Registered Office:
Neville House,J. N. Heredia Marg, Ballard Estate, Mumbai-400001.
www.wadiagroup.com
The Group has scaled great heights in innovation and entrepreneurship, inspired by the centuries-old legacy of goodwill and trust. The British Coat of Arms, granted to Nowrosjee Wadia, symbolises this legacy and the Wadia Group’s commitment to advancement and innovation.
The crest is a representation of the Group, its philosophy, beliefs and businesses. The crest and base of the shield represent the family origins in the shipbuilding industry during the 1700s. The middle and upper parts of the shield depict the Group’s interests in cotton growing and its links with England in the form of the Lancastrian rose. The hand holding the hammer atop the shield signifies industriousness, together with workmanship and skill.
The sun that surrounds the hand stands for global recognition and merit.
The motto, IN DEO FIDE ET PERSEVERANTIA means ‘Trust in God and Perseverance’.
www.naperol.com