creating web & mobile apps
TRANSCRIPT

12 DEWI MAGAZIN NO. 32, FEBRUARY 2008
Harvest Time in the Mountains
V. Riedel, F. Durante; DEWI Wilhelmshaven
ENGLISH
1. Introduction
Some years ago I went on a hiking tour in Scotland, in thearea around the Beinn Nibheis, which is the highest peak onthe British Isles (1344m). On one day, a rapid change in theweather forced us to seek shelter and to pitch our tent justinside a mountain pass. The pass turned into a nozzle, chan-nelling the storm gusts to our campsite. Only the bouldersthat we rolled on the tent did hold it in place but the wholesituation really scared us.
It is well known that wind can accelerate on hilltops, that itis channelled at bottlenecks and that on the downwind sidethere are areas that the wind does not fully reach.Mountains often feature excellent wind conditions that onecan also harvest with wind turbines [3],[4]. But projectdevelopment in mountainous areas is riddled with difficul-ties, one of them being the challenge to determine theexpected energy yield and the load relevant site conditions.This issue is addressed in this project where differentsophisticated computer model calculations were comparedto each other and to measured data within a Round RobinTest.
Basing on the description of the test methods in the first
part of this article [1], we summarise important aspects ofthe test results. Looking at the comprehensiveness of theanalyses conducted and keeping well in mind the importantrequirement to equally consider all participants, this sum-mary can not substitute your study of the complete finalreport [2] but should encourage you to read it. We select-ed only the most important assessments from the reportwhich form a small part of all assessments conducted in theproject.
The participants’ results are tagged with abbreviations,which are summarised in Tab. 1. Note that the participantsare listed in alphabetic order. There is an additional symbol"SPL", which is a "virtual participant" who neglects any hor-izontal or vertical variation in the wind conditions, thus rep-resenting the unchanged reference mast data. Additionally,we sometimes refer to a tag "MES", which tags the meas-ured data at the target masts.
2. Disclaimer
The following results refer to one single site with three metmasts installed, they refer to the models in the version andconfiguration used in the test and they refer to a specificmodel operator/team. In no circumstances can these
Round Robin Numerical Flow Simulation in WindEnergy, Part 2


14 DEWI MAGAZIN NO. 32, FEBRUARY 2008
results be considered as a general statement about thequality of the services provided by each company, nor canthese results be considered as a general quality assessmentof the computer models used. In particular, if a third partyflow model is used by a participant, the results cannot beconsidered as a statement of quality of the third partymodel. The reasons are as follows:
1. Flow models in general have many parameters to setand simulation design decisions have to be made,depending on the site under consideration and depend-ing on the experience of the model operator. It is notclear if the model operator during the Round Robin Testwill be the same than during normal business modeloperation.
2. Wind farm sites are very different, especially regardingorographic complexity. The results that refer to this siteare not transferable to any other site and are valid onlyfor this specific site.
3. Measurement uncertainties specified below refer to thestandard uncertainty, assuming a normal distributederror. Although less likely, the actual deviation betweenmeasurement value and real value can be higher thanthe standard error.
3. Farm Energy Yield
As one of the most important results of the tests, Fig. 1shows the results of the participants for the energy yield ofa hypothetical example wind farm. Results regarding six dif-ferent turbine types of the 1.5MW/2MW class were aver-aged. This averaging is meaningful because the results forthe different wind turbines differ only slightly from eachother. The wind farm is made up of 16 turbines, arrangedon a square grid with 500m distance. The "Jensen" farmmodel with standard options is used for the farm efficiencycalculation.
Energy yields were calculated on the basis of the measureddata from the two target masts and on the basis of thewind conditions that the participants submitted for the tar-
get masts. Within the hypothetical farm, the ambient windconditions are assumed to be horizontally homogenousand equal to the measured or calculated wind conditions atone of the target masts.
One may subdivide the participants’ results into two groups:
One group shows a similar result for both target masts,although the results are different for different participantswithin that group. MET, REP, RTV, UNJ and the "virtual par-ticipant" SPL may be assigned to this group.
The other participants show distinctly different results forthe two target masts, therefore they may be assigned tothe second group. There is no tendency visible that wouldindicate that one of the target masts is "easier to predict"than the other. GEO and LAM may form a subgroup ingroup 2, because their results are much similar to eachother.
The smallest relative errors can be found at ANM (mast 1)and UNK (mast 2).
The results of RTV differ significantly from the othersbecause RTV is the only one who significantly overesti-mates energy yields for both masts. The absolute value ofthis overestimation is however in the range of the otherresults. Therefore one cannot conclude that the results ofRTV are "worse" than the others. Only the sign is different.
Looking at the comparably flat landscape, there are unex-pected large relative errors observed for many participantsand there is a general tendency towards an underestima-tion of the energy yields (with the exception of RTV). It isnoticeable that the results of MET and UNJ are very similar,although they used completely different models.
4. Speed-up Factors
So-called speed-up factors enable us to investigate how themodels under consideration reflect wind direction depend-ent changes in wind speed between a pair of met masts.
Participants Symbol Model
Anemos Gesellschaft für Umweltmeteorologie mbH ANM MM5 + Metras
GEO NET Umweltconsulting GmbH GEO FITNAH
Lahmeyer International GmbH LAM KLIMM_32
Meteodyn (France) MET Meteodyn WT 2.0
REpower Systems AG REP WindSim 4.7.0
TÜV NORD SysTec GmbH & Co. KG
Competence Center Dynamische Systeme DS EssenRTV Austral2000 / TALDIA
Kyushu University and Itochu Techno Solutions Corp. (Japan) UNJ LOCALS(NWP) +
RIAM COMPACT(LES)
Fachhochschule Kiel, FB Maschinenwesen UNK FLUENT 5
Tab. 1: Symbols used to tag the participants.

DEWI MAGAZIN NO. 32, FEBRUARY 2008 15
The first pair is constituted by target mast 1 and the refer-ence mast, target mast 2 and the reference mast form thesecond pair. By considering the speed-up factors, oneabstracts away from the measured absolute values of windspeed and focuses on the relative changes of wind speedbetween two masts. Looking at the relative proximity of themasts one can be sure that these relative changes arecaused by local roughness and orography. One part of thedifferences emanates from the difference in measurementheight between the reference mast (43m) and the targetmasts (80m each). The speed-up factors derived from theparticipants’ results and from the measured data are shownin Fig. 2 (target mast 1) and Fig. 3 (target mast 2).
The following observations can be made:
1. In general, there is only little coincidence betweenmeasured and calculated factors, with punctual excep-tions.
2. The results of RTV differ significantly from the others, asobserved for the energy yield already, in that RTV doeshardly predict any directional change of the speed-upfactors, which does not correspond to what is actuallymeasured.
3. For the wind direction sector [7.5°,22.5°[ there are obvi-ous outliners visible in the form of local peaks of thefactors. In the case of MET this concerns both masts, inthe case of UNK a peak is only present at mast 1. Afterdiscussion with the participants it became clear thatthese peaks are not modelling problems but difficultieswith the special data processing in 15 degree winddirection sectors, which was required for the test.However, DEWI was forced to analyse and present theresults as they were submitted. It was not possible togive feedback to these two participants beforeclosing the test, because this would require todivide any "strange" results in those which may beartefacts and those which may be not. Also otherparticipants show smaller "peaks" or outlinershere and there. Obviously those other participantswould then also claim the right to correct theirresults but there is no way to decide in which caseto inform the participant and in which case not.This is one of the reasons why we decided to pre-cede the main test with the "dummy run" [1] inwhich the participants had the opportunity tobecome comfortable with the test procedure andhad time to possibly adapt their interfaces. Foreveryday complex terrain CFD work one can con-clude that a visual inspection of the speed-up fac-tors provides at least a basic quality check of thesimulation results, because "peaks" in these fac-tors may well be caused by simulation problems,but they are not in this case.
4. For all participants, with the exception of RTV, thefactors correspond well to the measured ones forsouth-south-west wind directions at target mast 2.The smallest deviation from the measured factorscan be found for UNK, ANM and MET.
5. Reasonable congruence with the measured speed-up factors can be observed for ANM (target mast 1)and slightly less exact for UNK and LAM (target
mast 2). In the case of ANM and UNK this is reflected bythe good results regarding the farm energy yield (Fig. 1).
6. There is a comparably large deviation between thespeed-up factors derived from the submitted results ofGEO and the measurement. The same is true for ANMat target mast 2, with the exception of the south-south-west wind direction range.
The directional variation of the speed-up factors, derivedfrom the participants’ results, does, with a few exceptions,differ in many cases qualitatively from the measured fac-tors. Apparently there are significant direction dependentflow effects modelled for which there is no evidence atleast in the measured data. The discrepancies detailed areindeed alarming. Due to the necessary approximate charac-ter of the flow models and unavoidable measurementuncertainties one can of course not demand that the mod-els fit the measurement perfectly. But nevertheless one candemand that the models consider at least the most domi-nant flow effects on site. It is expected that these modelledeffects, when compared to the measurements, deviate forexample by a shift in wind direction or by the generalstrength or directional extent of the effect. However noneof the models can completely satisfy such demands forboth masts and all wind directions. Some models do so, butonly for one mast at a time and some wind directionranges.
5. Mean Wind Speed
The role of mean wind speed in the context of energy yieldassessment is often overestimated because on the onehand energy yield is linked to wind speed by the highly non-linear power curves of the turbines and on the other hand

16 DEWI MAGAZIN NO. 32, FEBRUARY 2008
40.0
30.0
20.0
10.0
0.0
10.0
20.0
30.0
Me
an P
erc
en
tage
Err
or
in F
arm
En
erg
y Y
ield
Target Mast 1 2.1 25.0 27.7 14.7 28.7 15.7 36.3 11.4 15.8
Target Mast 2 20.6 6.4 9.0 12.4 26.8 20.0 32.6 9.8 1.3
ANM GEO LAM MET REP RTV SPL UNJ UNK
0.8
0.9
1
1.1
1.2
1.3
1.4
1.5
1.6
1.7
0 30 60 90 120 150 180 210 240 270 300 330 360
Wind Direction Sector Centre [deg]
Spe
ed
up
Fac
tor:
Tar
get
Mas
t 1
/ R
efe
ren
ce M
ast[
]
Measured ANM GEO
LAM MET RTV
UNJ UNK Identity
0.8
0.9
1
1.1
1.2
1.3
1.4
1.5
1.6
1.7
0 30 60 90 120 150 180 210 240 270 300 330 360
Wind Direction Sector Centre [deg]
Spe
ed
up
Fac
tor:
Tar
get
Mas
t 2
/ R
efe
ren
ce M
ast
[]
Measured ANM GEO
LAM MET RTV
UNJ UNK Identity
Fig. 1: Comparison of farm energyyield results.
Fig. 2: Speed-up factors for targetmast 1 versus the referencemast.
Fig. 3: Speed-up factors for targetmast 2 versus the referencemast.

DEWI MAGAZIN NO. 32, FEBRUARY 2008 17
the wind speed distribution function is in general a Weibulldistribution of which the skewness, represented indirectlyby the Weibull shape factor, plays an important role. Clearlyit is not enough to accurately predict the mean wind speedbut one has to predict the whole statistics of wind speed.Nevertheless, mean wind speed serves as a general siteclassification indicator, therefore it is looked at also in somedetail.
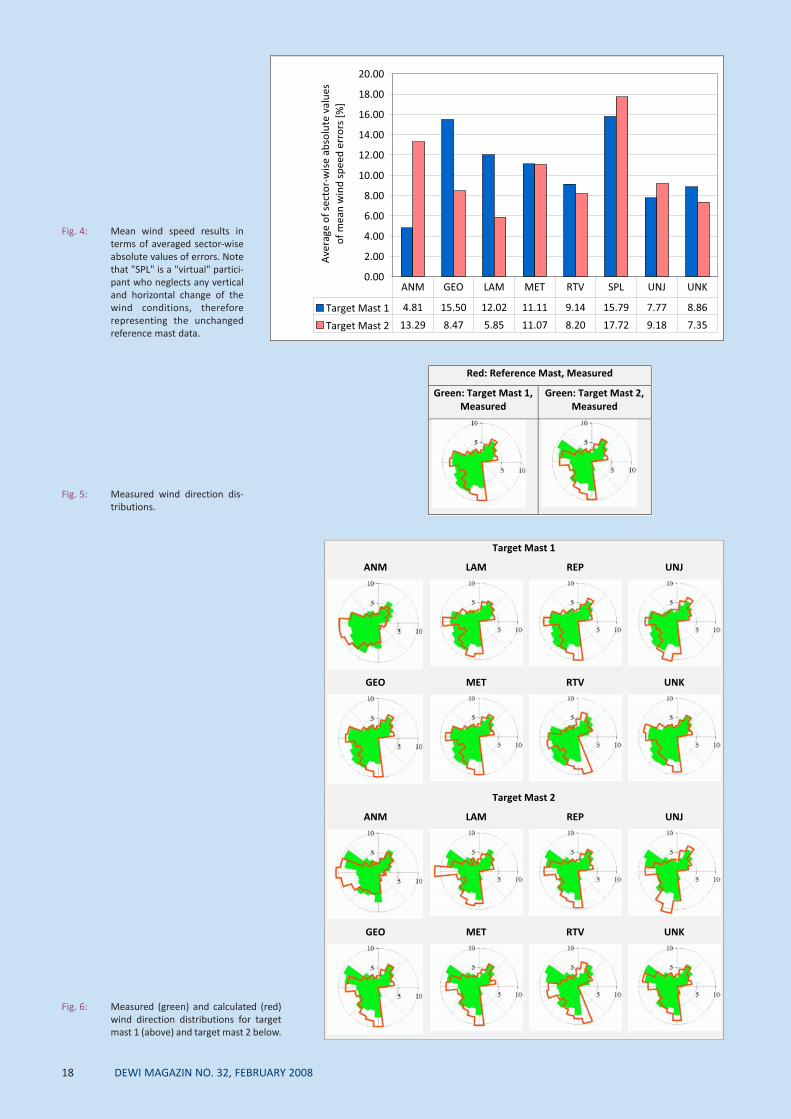
Care must be taken if one only looks at the ability of themodels to predict overall, direction independent meanwind speed, because large errors for different directionscancel each other out if they have opposite signs. In thiscase the accuracy of the overall mean wind speed has nomeaning in terms of model performance any more.Therefore we focus on the sector-by-sector differencesbetween measured and calculated mean wind speed, ofwhich the absolute value is calculated and averaged for all15 degree wind direction sectors. Note that the wind direc-tion sectors are defined using the reference mast winddirection. The sector-wise concurrent measured data at thetarget masts is compared to the target mast data that theparticipants calculated on the basis of the sector-wise dataat the reference masts. In this way one avoids mixing errorscoming from incorrect wind direction and wind speed cal-culations. Fig. 4 shows the respective results for all partici-pants, including the "virtual" participant SPL.
The following general observations can be made:
1. Looking at the fact that RTV predicts hardly any changeof the mast-to-mast speed-up functions (see Fig. 2 andFig. 3), it is surprising to see that RTV performs not sig-nificantly worse than any of the others. This is an indi-cation that pronounced directional variations of thespeed-up factors, predicted by the others, might lack asolid foundation and therefore not necessarily lead tobetter results in terms of the sector-wise mean windspeeds.
2. All participants improve the initial information given,i.e. they perform better than SPL.
3. UNK performed much better for target mast 2 than fortarget mast 1 in terms of the farm energy yield, which isnot confirmed for the sector-wise wind speed results,thus indicating that the good performance for the farmyield at target mast 2 might by an effect of the cancella-tion of errors of different signs for different directions.The same is not true for ANM. In this case the differencein the model performance regarding target mast 1 and2 is confirmed by the mean wind speed results.
4. There is only insignificant difference between the sec-tor-wise wind speed results of RTV, UNJ and UNK. Thismay be considered as one of the most interesting andimportant observations in the test, because these threeparticipants used completely different models of verydifferent complexity, where the model complexityincreases strongly from RTV (mass consistent model) toUNK (RANS model) and again increases from UNK toUNJ (large eddy model). How must this be explained?Taking these results seriously, one might conclude thatthe more complex and demanding models may not beworth the effort at all. With just one site, as in this case,
this conclusion is of course premature. But it tells usthat still complex terrain wind conditions might hold asecret which none of the models is yet able to revealand that the refinement of the calculation methodsmight not follow the most promising track, which is stillto be found.
6. Wind Direction
Probably the most striking example on how different thesubmissions of the participants are is represented by thewind direction distributions (see Fig. 6). For a quantitativeevaluation of this difference in terms of the chi-squaredmeasure see the main report [2].
Fig. 5 shows the measured wind direction distribution atthe reference mast (red) versus the measured distributionsat the two target masts (green). The distributions at thethree masts are distinctly different, where most of thechange takes place for the range 180 degree to 360 degree.
Regarding the participants submissions, the following canbe observed:
1. The peak of the wind direction distribution at the refer-ence mast for west wind is turned clockwise at targetmast 2. This turn of the wind direction is only reason-ably reproduced by UNK, although not to its full extent.
2. Participant RTV applies an overall, anti-clockwise turn-ing of the wind direction between the reference mastand each target mast, thus rotating the whole reference
18 DEWI MAGAZIN NO. 32, FEBRUARY 2008
0.00
2.00
4.00
6.00
8.00
10.00
12.00
14.00
16.00
18.00
20.00
Ave
rage
of
sect
or
wis
e a
bso
lute
val
ue
s
of
me
an w
ind
sp
ee
d e
rro
rs [
%]
Target Mast 1 4.81 15.50 12.02 11.11 9.14 15.79 7.77 8.86
Target Mast 2 13.29 8.47 5.85 11.07 8.20 17.72 9.18 7.35
ANM GEO LAM MET RTV SPL UNJ UNK
Fig. 4: Mean wind speed results interms of averaged sector-wiseabsolute values of errors. Notethat "SPL" is a "virtual" partici-pant who neglects any verticaland horizontal change of thewind conditions, thereforerepresenting the unchangedreference mast data.
Red: Reference Mast, Measured
Green: Target Mast 1,Measured
Green: Target Mast 2,Measured
Target Mast 1
ANM LAM REP UNJ
GEO MET RTV UNK
Target Mast 2
ANM LAM REP UNJ
GEO MET RTV UNK
Fig. 6: Measured (green) and calculated (red)wind direction distributions for targetmast 1 (above) and target mast 2 below.
Fig. 5: Measured wind direction dis-tributions.

Your responsibilities:. Project review before implementation
(site inspection, technology, building permission, business plan). Project monitoring during implementation
(planning, cost and quality control). Project evaluation after completion
(turbine inspection, commissioning). Project verification during operation
(operation data, review of O&M procedures, performance verification)
Our requirements:. Degree in engineering or business administration. Several years of experience in at least one of the following
areas: civil engineering, electrical engineering, project management, business administration
. Ability to speak and write English fluently with good negotiatingskills, other languages are an advantage
. Ability to work in a team, flexibility
Keyword: Due Diligence Project Manager
DEWI GmbH - Deutsches Windenergie-Institut is an expanding international consulting and research company. Withbranches in Germany, France, Spain and Brazil, both national and international clients appreciate DEWI GmbH as a part-ner for services in the areas of micrositing, measurements of wind turbines, grid integration, due diligence as well asresearch and studies. We are offering the following positions, starting date as soon as possible:
DUE DILIGENCE PROJECT MANAGER RESEARCH STAFFOur present research activities are focussing on offshore meteorology, wind turbine design parameters, new methods ofwind measurement and power curve measurement as well as investigations into the environmental impact of wind turbines.
Your responsibilities:. Conducting research projects on your own initiative. Data analysis, interpretation and quality control of the
parameters recorded. Communication with the universities and other project
partners involved. Organisation and realisation of measurement campaigns
Our requirements:. Degree in science. Previous experience in the field of statistical methods. Programming knowledge and experience with data bases. Good command of spoken and written English. Above average commitment and ability to work on your own
responsibility. Ability to work in a team, flexibility
Keyword: Research
If you are interested in one of these versatile and challenging positions in a dynamically growing company of the wind energy sector, pleasesend your application with full CV and desired salary, indicating the respective keyword, to:
DEWI GmbH - Deutsches Windenergie-Institut, Ebertstrasse 96, 26382 Wilhelmshaven, GermanyE-Mail: [email protected]
MICROSITING SPECIALIST
Your responsibilities:. Conducting energy yield assessments of wind farms in Germany
and abroad on your own initiative. Involvement in comprehensive project reviews. Analysis of operation data. Preparation of offers. Project coordination with clients. Collaboration in research projects
Your profile:. Degree in engineering, physics or meteorology. Ability to work independently and effectively as well as being an
excellent team player. Pleasant manners and good communication skills in dealing with
clients. Good command of spoken and written English, other languages
are an advantage. Willingness to travel in Germany and abroad. Professional experience in the wind energy business, preferably
in energy yield assessments and in the application and development of CFD models, is an advantage
Keyword: Micrositing
DEWI CHINA - REPRESENTATIVE
Your responsibilities:. Setting up a DEWI representation in Beijing/China. Acquisition and client support in Asia. Preparation of quotations. Final negotiations with clients. Interface with technical departments at DEWI headquarters in
Germany
Your profile:. Degree in engineering or business administration. Several years of experience in sales and/or project management. Several years of experience in the field of wind energy. Pleasant manners and good communication skills in
dealing with clients. Good command of spoken and written Chinese and English. Ability to work on own initiative and under considerable
pressure. Willingness to travel
Keyword: DEWI China

20 DEWI MAGAZIN NO. 32, FEBRUARY 2008
mast distribution by -15 degree. This is an issue of thesector-wise data post-processing in 15 degree sectors(see comment of this participant).
3. GEO does not apply any wind direction correction butassumes no systematic change of wind directionbetween any of the masts, therefore GEO predicts thereference mast direction distribution also for both tar-get masts. Although this gives better results than someof the other participants, who apparently applied incor-rect wind direction changes, the measured distributionsshow that even for this comparably simple terrain theassumption of uniform flow direction (horizontally andvertically) is too simple.
4. There is a pronounced change in the distributionbetween the reference mast and target mast 1, wherethe main wind direction changes from south to south-west. ANM, LAM and UNJ are the only participants whomodel that. The maximum of the predicted distributionis turned clockwise too much for ANM, whereas for theothers the turning is not strong enough.
In general, it is surprising, how difficult it is to accuratelymodel the wind direction effects. Therefore care should betaken when interpreting wind direction distributions calcu-lated by a flow model.
7. Weibull Shape Factor
If one changes position and measurement height in com-plex terrain, the wind conditions will vary and this shows upin the probability distribution of the wind data, which maybe represented in many cases by a Weibull distribution. TheWeibull distribution is associated with two parameters, theWeibull scale factor and the Weibull shape factor.
The mathematical form of the Weibull distribution functionis invariant against transformations of wind speed in theform , where α and β are real numbers. Givenany two Weibull distribution functions, represented bytheir scale and shape parameters, it is possible to deter-
mine α and β of a transfer function that transforms windspeed values from having one distribution to the other one.
In general, the statistics of wind speed measured at differ-ent heights above ground do not only differ by a scaling fac-tor α, but also by an exponent β slightly different from 1.This reflects that with increasing height the wind in gener-al becomes more steady/less turbulent, which shows up inan increased shape factor. This is also observed to a smalldegree for the measurement data (see columns "MES" and"SPL" in Fig. 7).
The change of the shape factor with height is difficult tomodel with certain microscale CFD-models, because theseusually apply only a wind direction dependent factor α.Determination of β with a steady-state microscale CFDmodel would at least require to perform several simula-tions for the same wind direction but different windspeeds, which increases heavily the computational effort.
The following observations can be made regarding theWeibull shape factor (see Fig. 7):
1. Measured data at the two target masts indicate thatthere is hardly any difference in the shape factorbetween the target masts. There is a slight increase inthe shape factor between the reference mast and bothtarget masts.
2. LAM is the only participant who calculates an increaseof the shape factor from the reference mast to the tar-get masts, although he slightly overestimates thateffect. A second group of participants (REP, MET, UNJand RTV) leave the shape factor of the reference mastessentially unchanged or even lower it slightly. The thirdgroup of participants (GEO, UNK and ANM) calculatethat the shape factor decreases significantly towardsthe target masts. ANM has an intermediate positionbetween groups 2 and 3 because a significant decreaseis only calculated for target mast 1 but not for targetmast 2.
βαvv→
1.5
1.6
1.7
1.8
1.9
2.0
GEO UNK ANM REP MET UNJ RTV SPL MES LAM
Participants, including MES (measured) and SPL (Ref. Mast Data)
We
ibu
ll sh
ape
Fac
tor,
WA
SP m
eth
od
[]
Target Mast 1
Target Mast 2
Fig. 7: Weibull shape factors. Notethat "MES" tags the measureddata and "SPL" tags theunmodified reference mastdata. The participants' IDs onthe x-axis are arranged so thata meaningful chart can beshown. The order does notsuggest any quality measure ofthe results.

As a result, one may state that at least the calculations ofGEO and UNK show some deficits regarding the calculatedshape factor of the Weibull distribution. LAM is the onlyparticipant who is able to model the increase of the shapefactor with height in this case. For ANM, the comparablylarge difference between the calculated shape factors forthe two target masts is difficult to explain from a point ofview of pure modelling. But the general data processingapproach of ANM seems to differ from the others, asdetailed further in the report [2].
8. Conclusions
It has been difficult to give meaningful interpretation to theresults of the Round Robin test.
To begin with some more general observations, one muststate that there are such large differences between the dif-ferent submissions, both qualitatively and quantitatively,that the participating models do not form a homogenousset. This is not surprising when looking at the modeldescriptions [2], but we did not expect that the differencesare that large.
Not only the differences between the submissions are largebut the same is true for the differences between the sub-missions and the measured data at the target masts, interms of wind speed, energy yield, wind direction andWeibull shape factor. Given the comparably simple terrain,we had expected results closer to what is measured.Presumably, a significant part of the deviation is due to themodelling of the change of the wind conditions with height
above ground. There is a general trend, with the exceptionof RTV, to underestimate the wind conditions for the targetmasts, which can possibly be traced to a too conservativemodelling of the upper surface layer turbulent exchangeprocesses. Regarding the microscale CFD models this is notsurprising, because the used turbulence models are knownto have increased systematic deficits for larger separationsfrom the ground, where they tend to overestimate the tur-bulent length scale, thus underestimating the wind shear. Anumber of modifications to the k-ε turbulence model existin literature, which aim at curing this deficit. But there isstill a lack of a general agreement on which modification touse in practice.
Sector-wise analysis of the submissions reveals deficits ofmany models in capturing important, dominating floweffects at the site. In some cases the results appear as if thecalculations were made for a completely different site.
We consider the present test as very valuable due to thefollowing reasons:
1. It was not easy to establish the test procedure, but final-ly there is a well defined, sustainable structure, that canserve as a template for further, similar tests.
2. A certain level of discussion about the models has beenreached, which provides a good base for further collab-oration (see outlook).
3. The subjective impression of the model results suggeststhat still there is plenty of room for new ideas andmethods in the field of flow simulation in wind energy.
Certification> Type Certification> Component Certification> Site Specific Certification> Certification during Development
Services On- /Offshore> Type Approval> Turbulence Analysis> Periodic Inspections> Personnel Safety> Expertises for Authorities and Insurances> Damage Analyses and Damage Expertises> Risk Analyses
Services Offshore> Assessment of Construction and Foundation> Evaluation of Design Concepts> Offshore Staff Training
DEWI-OCC Test Site
Offshore and Certification Centre
DEWI-OCC Offshore and Certification Centre GmbHAm Seedeich 9 // D - 27472 CuxhavenTel. ++49[0] 4721- 5088 -0 // Fax ++49[0] 4721- 5088 [email protected] // www.dewi-occ.de

22 DEWI MAGAZIN NO. 32, FEBRUARY 2008
9. Outlook
There was a final public meeting with the participants andsponsors at which these results were presented and dis-cussed. DEWI suggested to work on the implementation ofa board named SIMNET, with a mission similar to MEASNETbut for flow modelling. General appreciation was given forthis plan and further action is going to take place in thisdirection.
One must at least partly break the commercially justifiedwalls that exist around the models and their operation andclear the way for open technical discussion across compa-nies operating the models, combined with an independent,evenhanded comparison of model results. Of course noneof the companies is obliged to publish business secrets, butfor a reproducible, reliable flow simulation one must notkeep the model details secret. A necessary prerequisite forthe further establishment of flow modelling in wind energyis that one leaves the "black box" model. In the context ofa possible accredited service "flow modelling" it will not bepossible to keep secret which equations are solved by themodel on what mesh with which boundary conditions, butonly how these equations are solved might be kept secretand as such may form, together with sophisticated inter-faces, a base for competitive advantage of single compa-nies. Currently, the equations solved by the models, includ-ing the parameterisation, are not always fully clear, in somecases no information is available at all.
While the flow model cores are in general associated withlong-term development efforts, the pre- and post-process-ing toolchains are developed more rapidly, to followincreasing demands of clients and to accommodate theever-growing number of data formats. Important elementsof this toolchain are distributed project and file manage-ment, the processing of elevation and roughness data, thehandling of wind turbine technical specifications, and final-ly the combination of simulated 3D wind information withmeasured wind data. One should not underestimate thesignificance and the high demands that these elements of
the CFD toolchain pose. Meanwhile there are a number ofwell-tested external libraries available from which develop-ers can greatly profit if development time is in short supply.For all CFD pre- and post-processing including map workbut excluding wind data processing, the VTK library [5] is anexcellent base for own developments. This library is open-source but allows also to link with commercial applications.Valuable features of this library are the pipeline architec-ture combined with its large algorithm repository and thescripting language interface. In our opinion, It could bepromising to derive some wind energy specific classes, tomake these available to the public and in this way to extendthe library for wind energy flow simulation purposes.
Finally, we detailed that the flow modelling methodsapplied in the test must not necessarily be the ones whichare best adapted to the problem. There are also othermethods which were not applied and which are less com-mon. These are for example the Lattice Boltzmann meth-ods and mesh-free methods like the smoothed particlemethods. But the turbulence modelling problem remainsdifficult for all methods.
10. Acknowledgements
This research was sponsored by the Bundesministerium fürUmwelt, Naturschutz und Reaktorsicherheit (FederalMinistry for the Environment, Nature Conservation andNuclear Safety) to an extent of 50% of the project costs.The remaining portion of the costs were provided by thesponsoring companies Bremer Landesbank, Commerzbank,Deutsche Immobilien Leasing GmbH, GE Energy, HSHNordbank, Nord/LB, Ostwind Verw. Ges., WPD BeteiligungsGmbH, DEWI GmbH and by the fees of the participants inthe test.
11. Comments
All participants had the possibility to write own commentson the Round Robin test and to publish them along withthis article. They were provided with successive draft ver-
Fig. 8: Map of turbulence intensities at 30m above theground. Figure provided by participant MET.

DEWI MAGAZIN NO. 32, FEBRUARY 2008 23
sions of this article including available comments such thatthey were able to make reference to what DEWI or otherswrote. The comments that reached us are shown below.Not all of the participants provided a comment. It is impor-tant to note that participants who did not provide a com-ment may have a number of different reasons for it andtherefore a missing comment from a participant does nei-ther mean he agrees or disagrees to everything pointed outhere nor can any other specific meaning be attached to theabsence of a comment.
11.1 Comments on the Round Robin Numerical FlowSimulation
Aurélien Chantelot, Meteodyn (France)
The Round Robin Flow Simulation is clearly reflecting theneed for the wind industry to improve wind flow modelingin complex terrain. The test has demonstrated discrepan-cies between the models and measurements. One of thereasons is that a standard procedure was applied in which,for a fair comparison between the different models, not allthe usually available on-site data were included. Forinstance, directional shear information were not providedas input of the test. This is a crucial information that can beuseful in meteodyn WT to calibrate the mean thermal strat-ification for each direction of the flow (Fig. 9). Instead ofthis "calibration" of the site's thermal condition, a classicalneutral condition was applied in order to keep a conserva-tive approach.
To accurately assess the wind flow, and the models, onecould have enabled the different models to have takenadvantage of all their specific approaches. That may havebeen more meaningful even that would have created unfaircomparisons between the models. We have to bear in mindthat the aim of these investigations is to reduce the uncer-tainties on the wind flow modeling and not to compare themodels themselves.
Concerning the results from the meteodyn WT model; theunderestimation of wind speed on both met masts (around13% over energy) can be explained by the conservativeassumption of the near neutral ABL that has been under-taken. As the real shear might have been higher than theone corresponding to the neutral boundary condition thathas been used, the vertical extrapolation of the flow hasbeen underestimated. From 43 m to 80 m a 5 % underesti-mation on wind speed is credible regarding this assump-tion. The fact that the error is quite the same between thetwo masts may point out a good horizontal extrapolation ofthe wind flow.
As explained in the Round Robin report, some of the direc-tional speed-up factors' errors must have been produced bythe methodology itself. Indeed, the directional results fromthe model never show speed-up factors higher than 1.3whatever the direction is.
Finally, Meteodyn encourage the creation of the SIMNETboard and expect to conduct further investigation of thewind flow calculation. On the Round Robin project, onlywind speed modeling was investigated, but we stronglybelieve that other characteristics of the wind are also ofcrucial interest like turbulence (Fig. 8), up-flow angle, andextreme wind speed. We understand that since not all themodels can provide these results, none of these character-istics were part of the Round Robin test. Nevertheless, webelieve that the SIMNET board can be a great platform tofocus on all these aspects of modeling.
11.2 Comments on the Round Robin Numerical FlowSimulation
B. Hillmer, DeWind GmbH and A.P. Schaffarczyk, UAS Kiel
General information on the simulations conducted1. We performed 4 non-transient calculations with inflow
from north, east, south and west. Then a correlationmatrix was deduced from the met mast towards the
Fig. 9: ABL characteristics followingthe thermal stratification inMeteodyn WT. Figure provid-ed by participant MET.

24 DEWI MAGAZIN NO. 32, FEBRUARY 2008
two reference points. Higher moments of the wind dis-tribution were also included.
2. Our domain was hexahedral with an extent of 18,900 min North-South direction, 8,900 m in East-West direc-tion and from 476 m to 5,000 m vertically. The corre-sponding mesh was structured with 189 x 89 x 33 = 555k cells. The differencing scheme was of 2nd order. Fig. 10shows the surface grid.
3. Our model was a full 3D, stationary RANS model imple-mented in FLUENT 5.7. We used the k-ε model for tur-bulence with standard coefficient.
4. Boundary-conditions: The bottom was modelled as awall with velocities fixed to zero. The first cell was cho-sen to agree with an averaged homogenous roughnessheight of z0 = 0.15 m. One face was modelled as 'veloc-ity-inlet' meaning a logarithmic velocity profile wasenforced. In addition, an exponentially decreasing stat-ic pressure was modelled and air was treated as idealgas with a reference temperature of 300 K. All otherborders were set to 'pressure outlet', meaning that gra-dients of all field-variables were set to zero. The upperface was treated as 'symmetry' boundary, meaning thatno flow normal to that face was allowed.
5. The hardware used was a LINUX-PC with 2GHz Intel-CPU.
6. An inhomogenous roughness was not taken intoaccount, because special data-interfaces had to codedwhich was not done.
7. Atmospheric stability was not taken into account bytreating air as an ideal gas.
Further remarks1. DEWI should give a honest limit for their measurement
accuracy. An uncertainty in the order of 2% seems to bereasonable. This would give more confidence in what agood simulation should be able to do.
2. At the Bremen meeting SUZLON proposed a less-simple(LSPL) model for comparison purposes instead of theSPL-model of DEWI. According to that definition anaveraged roughness height should be used to estimatethe wind at the targets at the correct altitude
3. To our opinion the most critical issue is to use an appro-priate turbulence model.
4. We quote the PhD work of Stangroom [6].5. The use of the 'Lattice Boltzmann Model' seems to us as
over-sophisticated. Instead we propose to use LES orDES. A case study was presented at the '2nd torque con-ference' [7].
6. At the Bremen-meeting our feeling was that the resultswere regarded as failed in total. To us this is rather dis-appointing.
Fig. 10: Surface grid. Figure providedby participant UNK.
domain1 domain2 domain3 domain4
model:LOCALS
domain:600km x 600km
mesh size:20km
model:LOCALS
domain:210km x 210km
mesh size:3.5km
model:mass consistent
domain:24km x 24km
mesh size:400m
model:RIAM COMPACT
domain:16.5km x 10km
mesh size:20m – 200m
0 5 km
500
1000
0
m
Tab. 2: Domains used for each nestingstep by participant UNJ.

DEWI MAGAZIN NO. 32, FEBRUARY 2008 25
11.3 Comments on the Round Robin Numerical FlowSimulation
Dr.H.O.Wulf, TÜV NORD SysTec GmbH & Co. KGCompetence Center Dynamische Systeme - DS Essen
PrefaceIn 2006 - 2007 the TÜV Nord Company (formerly RWTÜV)participated in a round robin numerical flow simulation inwind energy initiated by DEWI. In the final report of thisflow simulation contest the simulation model used by TÜVNord was described rather incomplete so that a moreadvanced description of the model seems to be desirable.
Furthermore, some aspects of the results of this modeldocumented in the final report will become clearer from amore detailed model description.
Description of the simulation modelThe simulation model TALDIA used for the wind field fore-cast cases presented in the round robin contest is part ofthe AUSTAL2000 package. AUSTAL2000 is the official pollu-tion forecast reference model within the framework of theTA Luft 2002.
The wind field simulation model TALDIA is based on a diag-nostic method. This means that the simulation programdoes not solve the full set of flow differential equations fora good approximation of the wind field over the terrain buttries to construct a divergence free wind field on the basisof a reference measurement. This reference measurementwas delivered by DEWI in the form of time series for thetest cases.
The model uses terrain following structured grids whichoptionally can be nested by finer grids. It has a rather widerange in the dimensions of the overall calculation grid sizesfrom some 100 meters to some 10 km. In the official ver-sion of TALDIA the number of grid cells is limited to300x300. Because the source code is freely available theprogram was modified for a maximum of 1,000x1,000 cells.In the Test 1 a uniform grid of 593x540 cells with a step size
of 30 m was applied. This was the finest grid possible for aWinXP PC with an amount of 3.5 GB RAM. With a Linuxmachine and sufficient more RAM perhaps a step size of 20m or 15 m could have been achieved. The vertical (non uni-form) step sizes were chosen in such a way that the mid cellplanes in the Arakawa-C-grid were coincident with thedesired evaluation planes at 40 m, 60 m and 80 m.Therefore only 2 dimensional interpolations were neces-sary. The interpolation was done by a rather expensivebicubic spline method.
The TALDIA program can handle UTM coordinates directly,so any transformation was not necessary. The roughnessdistribution over the terrain however had to be trans-formed into the AUSTAL2000 notation.
Detailed documentations as well as the underlying theoret-ical bases and the C source codes of the components ofAUSTAL2000 can be obtained from [8]. The pre and postprocessing programs for the round robin contests howeverwere prepared here internally and are not yet documented.
Comments on the results On page 30 of the final report it is mentioned that "a cer-tain number of participants have performed steady statecalculations with fixed boundary conditions only for a sin-gle wind speed". Exactly this was the approach used here tothe prediction of the wind at the monitor points. For every15 degree sector a wind field was calculated assuming awind speed of 9 m/s at the reference point (the measuremast). From the resulting wind speeds interpolated on themonitor points together with the statistical properties ofthe measured time series the statistical properties of thewind field at the monitor points were calculated. Possiblybetter results could have been achieved, if these calcula-tions were performed for 3 wind speeds, a low , a mediumand a high one.
On page 33 it is stated that "For instance a low RDM at 40m and a high RDM at 80 m can be a signal for a too highwind shear, that, in turn, can be the effect of a too highatmospheric stability and/or too high roughness length. Itcan be argued that this was the case for participant RTV". In

26 DEWI MAGAZIN NO. 32, FEBRUARY 2008
fact, it is a serious disadvantage of the program TALDIA thatit can only handle an average roughness and not a rough-ness distribution. The program reads a file with a roughnessdistribution but internally calculates a roughness averagedover the whole area. This is a heritage from the predeces-sor model of the TA Luft 1986, which was a simple Gaussianplume model. On the other hand, it is also possible that theroughness data provided by DEWI were not exactly trans-formed into the ones needed by TALDIA. This could haveinduced a too high uniform roughness and therefore a toohigh wind shear. Because all calculations were performed atneutral stability it is to be assumed that the roughness isthe reason for the high wind shear. The source code of TAL-DIA however is freely available. So it should be possible tocheck whether the program could be improved in the inter-nal handling of the roughness.
On page 52 it is mentioned that "Results of RTV complete-ly differ from all the other results… It seems that RTV didmainly model an average vertical wind speed increase anddid by far not enough take into account site specific small-er scale wind flow effects". It could be a general weaknessof the diagnostic against the prognostic calculation methodthat small scale flow effects over terrain are not resolved.We plan to analyze this question by detailed comparisonsbetween calculations with a prognostic model and TALDIA.
On page 86, 88 it is remarked that the sector-wise resultsare displaced by 15°. This is simply a programming error (aloop index error) in the post processing program which pro-duced the output files.
11.4 Comments on the Round Robin Numerical FlowSimulation
Participant UNJ (Japan)Hikaru MATSUMIYA, Hikaruwind.lab,
Daisuke MATSUSHITA, Kyushu University,Tetsuro TAKAGI, Itochu Techno-Solutions Corp.,Hisashi FUKUDA, Itochu Techno-Solutions Corp.
We calculated the flow field by using the weather modelLOCALS for large area and a LES model RIAM-COMPACT forthe target locations around the observation points.
LOCALS [9] is a type of numerical weather prediction modeldeveloped by Itochu Techno-Solutions Corp. (CTC), and hasdata assimilation option that combines diverse observeddata.
RIAM-COMPACT is a commercial CFD tool that can simulateairflow over complex terrain using a large-eddy simulationtechnique [10].
The procedure is shown in the following, and the domainsused for each nesting steps are shown in Tab. 2. (Steps 1-2:LOCALS, Step 4:RIAM-COMPACT)
1. First, we calculated 500 x 600 x 8 km with 20 km hori-zontal mesh using NCEP / NCAR reanalysis data as initialinput.
2. Second, we calculated 210 x 210 x 8 km with 3.5 kmmesh with data assimilation technique. Minimum gridheight is 20m.
3. Using mass conservation model with 400 m mesh, wecalculated the time series wind velocity (u, v, w) at theposition of reference mast, and the wind velocity distri-butions for height at data connecting points shown as16 blank circles corresponding to 16 directions in thefigure of domain4.
4. We calculated flow field for 16 directions. Distancesfrom center of grid concentration are 2km, 1km and1km for upstream, downstream, sides respectively.Minimum mesh size is 20m for horizontal and is 2m forvertical. We set the received initial condition at thepoint shown figure and we used only fine elevation data
5. Using the time series of wind velocity (u, v, w) at theposition of reference mast calculated in Step3 and theresults in Step4, we calculated the mean wind speeds at40, 60 and 80m height and for a directional wind statis-tics for target masts.
The present nesting approach combining two CFD toolscould have given finer results than employing a simple tool,however we found we need some more skillful techniques.
Literature
(in the main article)[1] Durante, F.; Riedel, V.; Bunse, U.; Busche, P.; Mellinghoff, H.; Mönnich, K.; Schorer, T: Round Robin Numerical Flow Simulation in Wind Energy, Part
1: Description of Test, DEWI Magazin No. 31, August 2007. (available at www.dewi.de/dewi/fileadmin/pdf/publications/Magazin_31/05.pdf)[2] Durante, F.; Riedel, V.; Bunse, U.; Busche, P.; Mellinghoff, H.; Mönnich, K.; Schorer, T.: Round Robin Numerical Flow Simulation in Wind Energy Final
Report, DEWI GmbH - Deutsches Windenergie-Institut, Wilhelmshaven, Germany, 2007-05-24. (available at www.dewi.de, including two addenda)[3] www.tauernwind.org[4] www.meteotest.ch/cost727/index.html[5] www.vtk.org
(in comments from participant UNK)[6] Stangroom: "CFD Modelling of Wind Flow", The University of Nottingham, 2004. (available at
http://etheses.nottingham.ac.uk/archive/00000112/01/Stangroom.pdf)[7] Bechmann, A. et al: Hybrid RANS/LES Method for High Reynolds Numbers, Applied to Atmospheric Flow over Complex Terrain, J. Phys.: Conf. Ser.
75, 2007. (available at www.iop.org/EJ/article/1742-6596/75/1/012054/jpconf7_75_012054.pdf)(in comments from participant RTV)
[8] www.austal2000.de(in comments from participant UNJ)
[9] Ryoichi TANIKAWA, Development of the Wind Simulation Model by LOCALS and Examination of Some Studies, Journal of Japan Society of FluidMechanics, Vol.22, No.5, 2003, pp405-415. (in Japanese).
[10] Takanori UCHIDA, and Yuji OHYA, Large-eddy simulation of turbulent airflow over complex terrain, Journal of Wind Engineering and IndustrialAerodynamics, Vol.91, Issues.1-2, 2003, pp219-229.