credit card fraud detection using machine learning with
TRANSCRIPT

HAL Id: tel-02951477https://tel.archives-ouvertes.fr/tel-02951477
Submitted on 28 Sep 2020
HAL is a multi-disciplinary open accessarchive for the deposit and dissemination of sci-entific research documents, whether they are pub-lished or not. The documents may come fromteaching and research institutions in France orabroad, or from public or private research centers.
L’archive ouverte pluridisciplinaire HAL, estdestinée au dépôt et à la diffusion de documentsscientifiques de niveau recherche, publiés ou non,émanant des établissements d’enseignement et derecherche français ou étrangers, des laboratoirespublics ou privés.
Credit card fraud detection using machine learning withintegration of contextual knowledge
Yvan Lucas
To cite this version:Yvan Lucas. Credit card fraud detection using machine learning with integration of contextual knowl-edge. Artificial Intelligence [cs.AI]. Université de Lyon; Universität Passau (Deutscheland), 2019.English. �NNT : 2019LYSEI110�. �tel-02951477�

(LOGO ETABLISSEMENTPARTENAIRE)
N°d’ordre NNT :2019LYSEI110
Doctoral thesis of the University of Lyondone within :
l’Institut National des Sciences Appliquées de Lyonin cotutelle with :
University of Passau, Fakultät für Informatik und Mathematik
Ecole Doctorale N° EDA 512 INFOMATHS
PhD specialty :Computer Science
Submitted in december 12th 2019, by :Yvan, François, Marcel LUCAS
Credit Card Fraud Detection usingMachine Learning with Integration of
Contextual Knowledge
Before the jury composed of :
Prof. Dr. Chantal Soulé-Dupuy (University of Toulouse 1 Capitole)Prof. Dr. Eric Gaussier (University Grenoble Alps)Prof. Dr. Mathias Lux (Alpen-Adria Universität)Dr. Gabriele Gianini (University of Milan)Prof. Dr. Sylvie Calabretto (INSA Lyon)Prof. Dr. Michael Granitzer (Universität Passau)Dr. Pierre-Edouard Portier (INSA Lyon)Dr. Léa Laporte (INSA Lyon)
Cette thèse est accessible à l'adresse : http://theses.insa-lyon.fr/publication/2019LYSEI110/these.pdf © [Y. Lucas], [2019], INSA de Lyon, tous droits réservés

Département FEDORA – INSA Lyon - Ecoles Doctorales – Quinquennal 2016-2020
SIGLE ECOLE DOCTORALE NOM ET COORDONNEES DU RESPONSABLE
CHIMIE CHIMIE DE LYON
http://www.edchimie-lyon.fr Sec. : Renée EL MELHEM Bât. Blaise PASCAL, 3e étage [email protected] INSA : R. GOURDON
M. Stéphane DANIELEInstitut de recherches sur la catalyse et l’environnement de LyonIRCELYON-UMR 5256Équipe CDFA2 Avenue Albert EINSTEIN69 626 Villeurbanne [email protected]
E.E.A. ÉLECTRONIQUE, ÉLECTROTECHNIQUE, AUTOMATIQUE
http://edeea.ec-lyon.fr Sec. : M.C. HAVGOUDOUKIAN [email protected]
M. Gérard SCORLETTIÉcole Centrale de Lyon36 Avenue Guy DE COLLONGUE69 134 ÉcullyTél : 04.72.18.60.97 Fax [email protected]
E2M2 ÉVOLUTION, ÉCOSYSTÈME, MICROBIOLOGIE, MODÉLISATION
http://e2m2.universite-lyon.fr Sec. : Sylvie ROBERJOT Bât. Atrium, UCB Lyon 1 Tél : 04.72.44.83.62 INSA : H. CHARLES [email protected]
M. Philippe NORMANDUMR 5557 Lab. d’Ecologie MicrobienneUniversité Claude Bernard Lyon 1Bâtiment Mendel43, boulevard du 11 Novembre 191869 622 Villeurbanne [email protected]
EDISS INTERDISCIPLINAIRE SCIENCES-SANTÉ
http://www.ediss-lyon.fr Sec. : Sylvie ROBERJOT Bât. Atrium, UCB Lyon 1 Tél : 04.72.44.83.62 INSA : M. LAGARDE [email protected]
Mme Emmanuelle CANET-SOULAS INSERM U1060, CarMeN lab, Univ. Lyon 1 Bâtiment IMBL 11 Avenue Jean CAPELLE INSA de Lyon 69 621 Villeurbanne Tél : 04.72.68.49.09 Fax : 04.72.68.49.16 [email protected]
INFOMATHS INFORMATIQUE ET MATHÉMATIQUES
http://edinfomaths.universite-lyon.fr Sec. : Renée EL MELHEM Bât. Blaise PASCAL, 3e étage Tél : 04.72.43.80.46 [email protected]
M. Luca ZAMBONIBât. Braconnier43 Boulevard du 11 novembre 191869 622 Villeurbanne CEDEXTél : [email protected]
Matériaux
MATÉRIAUX DE LYON
http://ed34.universite-lyon.fr Sec. : Stéphanie CAUVIN Tél : 04.72.43.71.70 Bât. Direction [email protected]
M. Jean-Yves BUFFIÈREINSA de LyonMATEIS - Bât. Saint-Exupéry7 Avenue Jean CAPELLE69 621 Villeurbanne CEDEXTél : 04.72.43.71.70 Fax : [email protected]
MEGA MÉCANIQUE, ÉNERGÉTIQUE, GÉNIE CIVIL, ACOUSTIQUE
http://edmega.universite-lyon.fr Sec. : Stéphanie CAUVIN Tél : 04.72.43.71.70 Bât. Direction [email protected]
M. Jocelyn BONJOURINSA de LyonLaboratoire CETHILBâtiment Sadi-Carnot9, rue de la Physique69 621 Villeurbanne [email protected]
ScSo ScSo*
http://ed483.univ-lyon2.fr Sec. : Véronique GUICHARD INSA : J.Y. TOUSSAINT Tél : 04.78.69.72.76 [email protected]
M. Christian MONTESUniversité Lyon 286 Rue Pasteur69 365 Lyon CEDEX [email protected]
*ScSo : Histoire, Géographie, Aménagement, Urbanisme, Archéologie, Science politique, Sociologie, Anthropologie Cette thèse est accessible à l'adresse : http://theses.insa-lyon.fr/publication/2019LYSEI110/these.pdf © [Y. Lucas], [2019], INSA de Lyon, tous droits réservés

Cette thèse est accessible à l'adresse : http://theses.insa-lyon.fr/publication/2019LYSEI110/these.pdf © [Y. Lucas], [2019], INSA de Lyon, tous droits réservés
Abstract
In the last years, credit and debit cards usage has significantly increased. Howevera non negligible part of the credit card transactions are fraudulent and billions ofeuros are stolen every year throughout the world. In Belgium alone, the volumeof credit card transactions reached 16 billion euros in 2017 with 140 million eurosof illegitimate transactions.
Credit card fraud detection present several characteristics that makes it achallenging task. First, the feature set describing a credit card transaction usu-ally ignores detailed sequential information which was proven to be very relevantfor the detection of credit card fraudulent transactions. Second, purchase be-haviours and fraudster strategies may change over time, making a learnt frauddetection decision function irrelevant if not updated. This phenomenon nameddataset shift (change in the distribution p(x, y)) may hinder fraud detectionsystems to obtain good performances. We conducted an exploratory analysis inorder to quantify the day by day dataset shift and identified calendar related timeperiods that show different properties. Third, credit card transactions data sufferfrom a strong imbalance regarding the class labels which needs to be consideredeither from the classifier perspective or from the data perspective (less than 1%of the transactions are fraudulent transactions).
Solutions for integrating sequential information in the feature set exist in theliterature. The predominant one consists in creating a set of features which aredescriptive statistics obtained by aggregating the sequences of transactions of thecard-holders (sum of amount, count of transactions, etc..). We used this methodas a benchmark feature engineering method for credit card fraud detection. How-ever, this feature engineering strategies raised several research questions. First ofall, we assumed that these descriptive statistics cannot fully describe the sequen-tial properties of fraud and genuine patterns and that modelling the sequencesof transactions could be beneficial for fraud detection. Moreover the creationof these aggregated features is guided by expert knowledge whereas sequencesmodelling could be automated thanks to the class labels available for past trans-actions. Finally, the aggregated features are point estimates that may be comple-
iv
Cette thèse est accessible à l'adresse : http://theses.insa-lyon.fr/publication/2019LYSEI110/these.pdf © [Y. Lucas], [2019], INSA de Lyon, tous droits réservés

mented by a multi-perspective univariate description of the transaction context(especially from the point of view of the seller).
We proposed a multi-perspective HMM-based automated feature engineer-ing strategy in order to incorporate a broad spectrum of sequential informationin the transactions feature sets. In fact, we model the genuine and fraudulentbehaviours of the merchants and the card-holders according to two univariatefeatures: the timing and the amount of the transactions. Moreover, the HMM-based features are created in a supervised way and therefore lower the need ofexpert knowledge for the creation of the fraud detection system. In the end, ourmultiple perspectives HMM-based approach offers automated feature engineeringto model temporal correlations so as to complement and possibly supplement theuse of transaction aggregation strategies in order to improve the effectiveness ofthe classification task.
Experiments conducted on a large real world credit card transaction dataset(46 million transactions from belgium card-holders between March and May 2015)have shown that the proposed HMM-based feature engineering allows for an in-crease in the detection of fraudulent transactions when combined with the stateof the art expert based feature engineering strategy for credit card fraud detection.
To conclude, this work leads to a better understanding of what can be con-sidered contextual knowledge for a credit card fraud detection task and how toinclude it in the classification task in order to get an increase in fraud detection.The method proposed can be extended to any supervised task with sequentialdatasets.
v
Cette thèse est accessible à l'adresse : http://theses.insa-lyon.fr/publication/2019LYSEI110/these.pdf © [Y. Lucas], [2019], INSA de Lyon, tous droits réservés

Résumé
Au cours des dernières années, l’utilisation des cartes de crédit et de débit a con-sidérablement augmenté. toutefois une partie non négligeable des transactionspar carte de crédit sont frauduleuses et des milliards d’euros sont volés chaqueannée dans le monde entier. Rien qu’en Belgique, le volume de transactions parcarte de crédit ont atteint 16 milliards d’euros en 2017, dont 140 millions d’euros.transactions illégitimes.
La détection de fraude par carte de crédit présente plusieurs caractéristiquesqui en font une tâche difficile. Tout d’abord, les attributs décrivant une trans-action ignorent les informations séquentielles qui se sont avérées très pertinentespour la détection des fraudes à la carte de crédit. Deuxièmement, les comporte-ments d’achat et les stratégies de fraude peuvent changer au fil du temps, ren-dant une fonction de décision apprise par un classifieur non pertinente si celui-cin’est pas mis à jour. Ce phénomène appelé dataset shift (changement dans ladistribution de probabilité p(x, y)) peut empêcher les systèmes de détection defraude de conserver une bonne performance. Nous avons effectué une analyseexploratoire afin de quantifier le dataset shift jour par jour et avons identifé despériodes calendaires qui ont des propriétés différentes au sein du jeu de données.Troisièmement, les données sur les transactions par carte de crédit souffrent d’unfort déséquilibre en ce qui concerne les effectifs des classes (moins de 1% destransactions sont frauduleuses). Ce déséquilibre doit être pris en compte, soitpar le classifieur, soit au niveau du prétraitement des données.
Des solutions pour intégrer des informations séquentielles au sein des attributstransactionnels existent dans la littérature. La stratégie principale consiste àcréer un ensemble d’attributs qui sont des statistiques descriptives obtenues enagrégeant les séquences de transactions des titulaires de carte (somme du mon-tant, nombre de transactions, etc.). Nous avons utilisé cette méthode commeméthode de référence pour la détection des fraudes à la carte de crédit. Cepen-dant, cette stratégie de prétraitement des données a soulevé plusieurs questionsde recherche. Tout d’abord, nous avons supposé que ces statistiques descriptivesne pouvaient pas décrire complètement les propriétés séquentielles des motifs
vi
Cette thèse est accessible à l'adresse : http://theses.insa-lyon.fr/publication/2019LYSEI110/these.pdf © [Y. Lucas], [2019], INSA de Lyon, tous droits réservés

temporels frauduleux et non frauduleux et que la modélisation des séquences detransactions pouvait être bénéfique pour la détection de la fraude. De plus, lacréation de ces attributs agrégés est guidée par des connaissances expertes, tan-dis que la modélisation de séquences pourrait être automatisée grâce aux labelsde classe disponibles pour les transactions passées. Enfin, ces attributs agrégéessont des estimations ponctuelles pouvant être complétées par une descriptionmulti-perspective du contexte de la transaction (en particulier du point de vuedu vendeur).
Nous avons proposé une stratégie pour la création d’attributs basés sur desmodèles de Markov cachés (HMM) caractérisant la transaction par différentspoints de vue. Cette stratégie permet d’intégrer un large spectre d’informationsséquentielles dans les attributs des transactions. En fait, nous modélisons lescomportements authentiques et frauduleux des commerçants et des détenteursde cartes selon deux caractéristiques univariées: la date et le montant des trans-actions. De plus, les attributs basées sur les HMM sont créées de manière su-pervisée, réduisant ainsi le besoin de connaissances expertes pour la création dusystème de détection de fraude. En fin de compte, notre approche à perspectivesmultiples basée sur des HMM permet un prétraitement automatisé des donnéespour modéliser les corrélations temporelles afin de compléter et éventuellementremplacer les stratégies d’agrégation de transactions pour améliorer l’efficacité dela détection.
Des expériences menées sur un vaste ensemble de données de transactions decartes de crédit issu du monde réel (46 millions de transactions effectuées pardes porteurs de carte belges entre mars et mai 2015) ont montré que la stratégieproposée pour le prétraitement des données basé sur les HMM permet de détecterdavantage de transactions frauduleuses quand elle est combinée à la stratégie deprétraitement des données de référence basées sur des connaissance expertes pourla détection de fraude à la carte de crédit.
En conclusion, ces travaux permettent de mieux comprendre ce que l’on peutconsidérer comme une connaissance contextuelle dans le cadre d’une tâche dedétection de fraude à la carte de crédit et comment l’inclure dans la tâche declassification afin d’améliorer la détection de fraude. La méthode proposée peutêtre étendue à toute tâche supervisée comportant des jeux de données séquen-tiels.
vii
Cette thèse est accessible à l'adresse : http://theses.insa-lyon.fr/publication/2019LYSEI110/these.pdf © [Y. Lucas], [2019], INSA de Lyon, tous droits réservés

Zusammenfassung
In den letzten Jahren hat die Verwendung von Kreditkarten und Debitkartenbeträchtlich zugenommen. Bei einem nicht unerheblichen Teil aller Kreditkar-tentransaktionen handelt es sich um betrügerische Transaktionen und weltweitwerden jedes Jahr Milliardenbeträge gestohlen. Alleine in Belgien erreichte dasGesamtvolumen der Kreditkartentransaktionen im Jahr 2017 16 Milliarden Euro;wovon 140 Millionen auf betrügerische Transaktionen entfallen.
Die Erkennung von Betrug in Kreditkartenzahlungen weist mehrere Beson-derheiten auf, wodurch spezielle Herausforderungen entstehen. Zum einen en-thält die Merkmalsmenge, die zur Beschreibung einzelner Kreditkartentransak-tionen verwendet wird, keine detaillierte Sequenzinformation, die sich jedochfür die Erkennung als höchst relevant herausgestellt hat. Zum anderen kön-nen sich sowohl legitimes Kaufverhalten als auch Betrugsstrategien mit der Zeitändern wodurch eine Entscheidungsfunktion irrelevant werden kann, sofern sienicht aktualisiert wurde. Dieses Phänomen, bekannt als "data set shift" (eineÄnderung der Verteilung p(x, y)), beeinträchtigt die Erkennungsleistung von Be-trugserkennungsystemen. Wir haben eine explorative Analyse durchgeführt umden täglichen data set shift zu quantifizieren und dabei kalendarische Zeiträumeidentifiziert, die unterschiedliche Besonderheiten aufweisen. Da Datensätze mitKreditkartentransaktionen im Hinblick auf die Klassenannotationen ein starkesUngleichgewicht aufweisen, muss dieses Ungleichgewicht entweder auf der Ebenedes Klassifikators oder auf der Ebene der Daten berücksichtigt werden (wenigerals 1% der Transaktionen sind von betrügerischer Natur).
Für die Integration von Sequenzinformation in die Merkmalsmenge existierenin der Literatur bereits Lösungen. Die vorherrschende Lösung besteht darin,durch das Aggregieren von Transaktionssequenzen von Karteninhabern, deskrip-tive Statistiken zu erzeugen (Summe der Geldbeträge, Anzahl an Transaktio-nen, etc.). Diese Methode zur Merkmalserzugung bildet insofern die Grund-lage unser Arbeit als sich daraus mehrere Forschungsfragen ergeben. Zunächststellen wir fest, dass diese deskriptiven Statistiken die Sequenzeigenschaften in be-trügerischen oder legitimen Mustern nicht vollständig abbilden können und dass
viii
Cette thèse est accessible à l'adresse : http://theses.insa-lyon.fr/publication/2019LYSEI110/these.pdf © [Y. Lucas], [2019], INSA de Lyon, tous droits réservés

eine Modellierung von Transaktionssequenzen vorteilhaft für die Betrugserken-nung wäre. Außerdem erfordert die Erzeugung solcher aggregierter MerkmaleExpertenwissen wohingegen Sequenzmodellierung dank der vorhandenen Klasse-nannotationen automatisiert werden könnte. Aggregierte Merkmale sind Punk-tschätzungen, die mit univariaten Beschreibungen des Transaktionskontextes ausunterschiedlichen Perspektiven ergänzt werden könnten (insbesondere aus derPerspektive des Händlers).
Wir schlagen eine multi-perspektivische HMM-basierte und automatisierteStrategie zur Merkmalserzeugung vor um ein breites Spektrum an Sequenzin-formation in die Merkmalsmenge zu integrieren. Wir modellieren die legitimenund die betrügerischen Verhaltensweisen von Händlern und Karteninhabern aufGrundlage zweier univariater Merkmale: Die Zeitstempel und die Geldbeträgevon Transaktionen. Die HMM-basierten Merkmale werden zudem unter demParadigma des überwachten Lernens erzeugt wodurch der Bedarf an Experten-wissen bei der Entwicklung eines Betrugserkennungssystems sinkt. Schlussendlicherzeugt unser HMM-basierter Ansatz zeitliche Korrelationsmerkmale automa-tisiert wodurch Aggregationsstrategien ergänzt oder möglicherweise ersetzt wer-den können und die Effektivität der Klassifikation verbessert werden kann.
Experimente auf einem großen und realistischen Datensatz (46 MillionenTransaktionen aufgezeichnet zwischen März und May 2015 von Karteninhab-ern aus Belgien) haben gezeigt, dass die HMM-basierte Merkmalserzeugung dieErkennung betrügerischer Transaktionen verbessert sofern die HMM Merkmalemit state-of-the-art Expertenmerkmalen kombiniert werden.
Diese Arbeit führt zu einem besseren Verständnis davon was als kontextuellesWissen in der Erkennung von Kreditkartenbetrug betrachtet werden kann undwie solches Wissen in die Klassifikation integriert werden kann um die Erken-nung zu verbessern. Unsere Methode kann auf andere annotierte Sequenzdatenübertragen werden.
ix
Cette thèse est accessible à l'adresse : http://theses.insa-lyon.fr/publication/2019LYSEI110/these.pdf © [Y. Lucas], [2019], INSA de Lyon, tous droits réservés

Acknowledgements
First, I would like to express my sincere gratitude to my supervisors: Dr. Pierre-Edouard Portier, Dr. Léa Laporte, Prof. Michael Granitzer and Prof. SylvieCalabretto for the continuous support throughout my PhD study, for their pa-tience, motivation, and immense knowledge. Their guidance helped me in all thetime of research and writing of this thesis. Having 4 supervisors was challenging:you have to consider and test all the various directions proposed, but it was alsovery valuable in several ways: you learn from different persons and discover dif-ferent working and researching patterns. I could not have imagined having bettersupervisors and mentors for my PhD study.
Besides my advisors, I would like to thank Prof. Harald Kosch, Prof. LionelBrunie, Dr. Nadia Bennani, Dr. Gabriele Gianini and all the people that makeIRIXYS (formerly MDPS) live and be an insightful and friendly community.Without them, this french-german PhD wouldn’t exist, neither the friendshipsthat were born in this context.
Speaking of friendships, I would like to thank all the friends that I met duringthe thesis and especially my 4 year office mate, project mate and in fine PhD mate,Johannes Jurgovsky, with whom we could share difficulties, joys, discoveries anda lot of beers (a good meeting point between Bavaria and Brittany). I hope andam confident that some of these friendships will last whatever the years or thedistance.
My sincere thanks also go to the people from Worldline and especially Dr.Olivier Caelen, Dr. Liyun He-Guelton and Dr. Frederic Oblé, who provided methe opportunity to work within a company, with real data and stakes.
Lastly, I would like to thank my family for all their love and encouragement.For my parents who raised me with a love of science and believed in me whateverthe challenge I chose. For the presence of my brother Marin and my sister Katellwho also challenged themselves for their studies and first work experiences. Andmost of all for my loving, supportive, encouraging, and patient Lisa. Thankyou for your faithful support during all the stages of the PhD, thank you for thesacrifices you did in order to follow me in Passau for a year. These years wouldn’thave been the same without you and I am very happy to have met you. Thankyou.
x
Cette thèse est accessible à l'adresse : http://theses.insa-lyon.fr/publication/2019LYSEI110/these.pdf © [Y. Lucas], [2019], INSA de Lyon, tous droits réservés

Scientific environment
The research reported in this dissertation has been done at the Chair of DataScience of the University of Passau (Germany) and at the research group for Dis-tributed Systems, Information Retrieval and Mobility (DRIM of the Laboratoryof Computer Science for Image and Information Systems (LIRIS) at INSA Lyon(France).
This research has received support from Worldline in the form of an industrialresearch project including Worldline, the University of Passau, INSA Lyon andthe University of Milano.
As a cotutelle between INSA Lyon and University of Passau, this researchhas also received financial support from the Franco-German university
xi
Cette thèse est accessible à l'adresse : http://theses.insa-lyon.fr/publication/2019LYSEI110/these.pdf © [Y. Lucas], [2019], INSA de Lyon, tous droits réservés

Cette thèse est accessible à l'adresse : http://theses.insa-lyon.fr/publication/2019LYSEI110/these.pdf © [Y. Lucas], [2019], INSA de Lyon, tous droits réservés

Science sans consciencen’est que ruine de l’âme.
Rabelais
Cette thèse est accessible à l'adresse : http://theses.insa-lyon.fr/publication/2019LYSEI110/these.pdf © [Y. Lucas], [2019], INSA de Lyon, tous droits réservés
Contents
Abstract iv
Résumé vi
Zusammenfassung viii
Acknowledgements x
Scientific environment xi
1 Introduction 11.1 Credit card fraud in Europe . . . . . . . . . . . . . . . . . . . . . . 11.2 Credit card fraud types . . . . . . . . . . . . . . . . . . . . . . . . 31.3 Fraud detection in practice . . . . . . . . . . . . . . . . . . . . . . 6
1.3.1 Real time and near real time fraud detection systems . . . . 61.3.2 Rules based detection and rules management . . . . . . . . 7
1.4 Publications and outline . . . . . . . . . . . . . . . . . . . . . . . . 91.4.1 Publications . . . . . . . . . . . . . . . . . . . . . . . . . . . 91.4.2 Outline . . . . . . . . . . . . . . . . . . . . . . . . . . . . . 10
2 Problem statement & research questions 112.1 Machine learning formalization for credit card fraud detection . . . 12
2.1.1 Machine learning notations & Fraud detection particularities 122.1.2 Bias-Variance tradeoff and ensemble based methods . . . . 152.1.3 Random forest and boosting trees . . . . . . . . . . . . . . 17
2.2 Evaluation of the performance of machine learning classifiers . . . 202.2.1 Confusion matrix based evaluation . . . . . . . . . . . . . . 202.2.2 Parametric evaluation . . . . . . . . . . . . . . . . . . . . . 22
2.3 Fraud detection research questions and contributions . . . . . . . . 232.3.1 Fraud detection research questions . . . . . . . . . . . . . . 232.3.2 Contributions . . . . . . . . . . . . . . . . . . . . . . . . . . 25
xiv
Cette thèse est accessible à l'adresse : http://theses.insa-lyon.fr/publication/2019LYSEI110/these.pdf © [Y. Lucas], [2019], INSA de Lyon, tous droits réservés
3 Related Work 273.1 Learning to classify unbalanced datasets . . . . . . . . . . . . . . . 27
3.1.1 Sampling methods . . . . . . . . . . . . . . . . . . . . . . . 283.1.2 Cost based method . . . . . . . . . . . . . . . . . . . . . . . 293.1.3 Model based methods . . . . . . . . . . . . . . . . . . . . . 30
3.2 Feature engineering for credit card fraud detection . . . . . . . . . 313.2.1 Feature encoding and feature selection . . . . . . . . . . . . 323.2.2 Feature creation for credit card fraud detection . . . . . . . 34
3.3 Sequence modeling for anomaly detection . . . . . . . . . . . . . . 373.3.1 Sequence modelling . . . . . . . . . . . . . . . . . . . . . . 373.3.2 Sequence modelling for sequential anomaly detection . . . . 41
3.4 Dataset shift detection and adaptation . . . . . . . . . . . . . . . . 433.4.1 Different types of dataset shift . . . . . . . . . . . . . . . . 443.4.2 Detecting dataset shift . . . . . . . . . . . . . . . . . . . . . 443.4.3 Strategies in presence of dataset shift . . . . . . . . . . . . 45
4 Dataset exploration 494.1 Important features and correlated features . . . . . . . . . . . . . . 50
4.1.1 Transactional features . . . . . . . . . . . . . . . . . . . . . 504.1.2 Feature importances and classifiers comparison . . . . . . . 534.1.3 Comparison of sampling strategy to reduce class imbalance 574.1.4 Sequential dataset . . . . . . . . . . . . . . . . . . . . . . . 59
4.2 Covariate shift quantification for credit card fraud detection . . . . 614.2.1 Building a distance matrix between days . . . . . . . . . . . 624.2.2 Agglomerative clustering using the distance matrix between
days . . . . . . . . . . . . . . . . . . . . . . . . . . . . . . . 654.2.3 Incorporation of dataset shift knowledge . . . . . . . . . . . 674.2.4 Conclusion . . . . . . . . . . . . . . . . . . . . . . . . . . . 69
4.3 Summary . . . . . . . . . . . . . . . . . . . . . . . . . . . . . . . . 69
5 Multiple perspectives feature engineering 715.1 Baseline: transaction aggregation strategy . . . . . . . . . . . . . . 72
5.1.1 Construction of features based on transaction aggregationstrategy . . . . . . . . . . . . . . . . . . . . . . . . . . . . . 72
5.1.2 Transaction aggregation strategy improves fraud detection . 735.1.3 Limitations of transaction aggregation strategy . . . . . . . 78
5.2 Multiple perspectives hidden Markov model based feature engi-neering . . . . . . . . . . . . . . . . . . . . . . . . . . . . . . . . . . 795.2.1 Modelling the sequences of transactions . . . . . . . . . . . 795.2.2 Hidden Markov models basic principles . . . . . . . . . . . 805.2.3 Leverage the train set labels for automated feature creation 87
5.3 Summary . . . . . . . . . . . . . . . . . . . . . . . . . . . . . . . . 90
xv
Cette thèse est accessible à l'adresse : http://theses.insa-lyon.fr/publication/2019LYSEI110/these.pdf © [Y. Lucas], [2019], INSA de Lyon, tous droits réservés

6 Experiments 936.1 Experimental Setup . . . . . . . . . . . . . . . . . . . . . . . . . . 93
6.1.1 Feature engineering and dataset partitioning . . . . . . . . 936.2 Results . . . . . . . . . . . . . . . . . . . . . . . . . . . . . . . . . . 94
6.2.1 Improvement in fraud detection when using HMM-basedfeatures . . . . . . . . . . . . . . . . . . . . . . . . . . . . . 94
6.2.2 Robustness to hyperparameters changes . . . . . . . . . . . 1056.3 Handling the missing value limitations . . . . . . . . . . . . . . . . 1066.4 Summary . . . . . . . . . . . . . . . . . . . . . . . . . . . . . . . . 108
7 Perspectives and conclusions 1097.1 Perspectives . . . . . . . . . . . . . . . . . . . . . . . . . . . . . . . 109
7.1.1 Frequential decomposition for transactions clustering . . . . 1097.1.2 Interpretation of classifier decision . . . . . . . . . . . . . . 110
7.2 Conclusions . . . . . . . . . . . . . . . . . . . . . . . . . . . . . . . 111
xvi
Cette thèse est accessible à l'adresse : http://theses.insa-lyon.fr/publication/2019LYSEI110/these.pdf © [Y. Lucas], [2019], INSA de Lyon, tous droits réservés

Cette thèse est accessible à l'adresse : http://theses.insa-lyon.fr/publication/2019LYSEI110/these.pdf © [Y. Lucas], [2019], INSA de Lyon, tous droits réservés

List of Figures
1.1 Repartition of different countries among the belgian face-to-facetransactions between march and may 2015 . . . . . . . . . . . . . . 2
1.2 Card number generator . . . . . . . . . . . . . . . . . . . . . . . . 51.3 Cardblocker PIN reader terminal topper . . . . . . . . . . . . . . . 51.4 Real time and near real time fraud detection systems [Pozzolo, 2015] 71.5 Tradeoff between fraud probability and transaction amount (from
[Baesens et al., 2015]) . . . . . . . . . . . . . . . . . . . . . . . . . 8
2.1 Bipartite graph of the transactions. . . . . . . . . . . . . . . . . . . 142.2 history and subsequence of transactions . . . . . . . . . . . . . . . 152.3 overfitting vs underfitting. . . . . . . . . . . . . . . . . . . . . . . . 172.4 Toy example of decision tree [Hoare, 2019] . . . . . . . . . . . . . . 182.5 ROC curve (left) and precision-recall (right) curve evaluations for
e-commerce fraud detection . . . . . . . . . . . . . . . . . . . . . . 23
3.1 Sampling strategy for unbalanced classification. . . . . . . . . . . . 303.2 Time of the transaction modeled with the uniform distribution or
the Von-Mises distribution. . . . . . . . . . . . . . . . . . . . . . . 373.3 Hidden Markov model architecture. (from [Lucas et al., 2019a]) . . 383.4 Graphical model architectures. . . . . . . . . . . . . . . . . . . . . 403.5 Stacking networks time-wise for backpropagation through time . . 403.6 Hellinger distance: mesure of distributional divergence between
two probability distributions P and Q . . . . . . . . . . . . . . . . 473.7 Aggregating ground truth examples with investigators feedbacks
([Pozzolo, 2015]) . . . . . . . . . . . . . . . . . . . . . . . . . . . . 47
4.1 Correlation matrix for the e-commerce transactions . . . . . . . . . 524.2 Correlation matrix for the face-to-face transactions . . . . . . . . . 524.3 Feature importance of a random forest classifier for face-to-face
transactions . . . . . . . . . . . . . . . . . . . . . . . . . . . . . . . 544.4 Feature importance of a random forest classifier for e-commerce
transactions . . . . . . . . . . . . . . . . . . . . . . . . . . . . . . . 55
xviii
Cette thèse est accessible à l'adresse : http://theses.insa-lyon.fr/publication/2019LYSEI110/these.pdf © [Y. Lucas], [2019], INSA de Lyon, tous droits réservés

4.5 Fraud detection performance over days for different degree of un-dersampling. . . . . . . . . . . . . . . . . . . . . . . . . . . . . . . 58
4.6 Fraud detection performance over days for SMOTE (in blue) andundersampling 80/20 (in red). . . . . . . . . . . . . . . . . . . . . . 59
4.7 Categorical correlation between the time feature and the class offace-to-face transactions . . . . . . . . . . . . . . . . . . . . . . . . 60
4.8 Time elapsed between first and last fraudulent transaction for eachfraudulent accounts . . . . . . . . . . . . . . . . . . . . . . . . . . . 61
4.9 Zoomed distance matrix (covariate shift) for the face-to-face trans-actions. . . . . . . . . . . . . . . . . . . . . . . . . . . . . . . . . . 63
4.10 Diminution of the average inter-cluster distance with the increaseof the number of clusters . . . . . . . . . . . . . . . . . . . . . . . . 66
5.1 Modelling limitations of transaction aggregation strategy . . . . . . 785.2 Hidden Markov model architecture (from [Lucas et al., 2019a]). . . 815.3 Practical example of HMM . . . . . . . . . . . . . . . . . . . . . . 825.4 Enriching transaction data with HMM-based features calculated
from multiple perspectives (CH=Card-holder, TM=Terminal) . . . 89
6.1 Precision-recall curves for e-commerce transactions with randomforest classifiers. . . . . . . . . . . . . . . . . . . . . . . . . . . . . 96
6.2 ROC curves for e-commerce transactions with random forest clas-sifiers. . . . . . . . . . . . . . . . . . . . . . . . . . . . . . . . . . . 96
6.3 Precision-recall curves for face-to-face transactions with randomforest classifiers. . . . . . . . . . . . . . . . . . . . . . . . . . . . . 97
6.4 ROC curves for face-to-face transactions with random forest clas-sifiers. . . . . . . . . . . . . . . . . . . . . . . . . . . . . . . . . . . 97
6.5 Precision-recall curves for e-commerce transactions with logisticregression. . . . . . . . . . . . . . . . . . . . . . . . . . . . . . . . . 99
6.6 ROC curves for e-commerce transactions with logistic regression. 996.7 Precision-recall curves for face-to-face transactions with logistic
regression. . . . . . . . . . . . . . . . . . . . . . . . . . . . . . . . . 1006.8 ROC curves for face-to-face transactions with logistic regression. . 1006.9 Precision-recall curves for e-commerce transactions with Adaboost
classifiers. . . . . . . . . . . . . . . . . . . . . . . . . . . . . . . . . 1026.10 ROC curves for e-commerce transactions with Adaboost classifiers. 1026.11 Precision-recall curves for face-to-face transactions with Adaboost
classifiers. . . . . . . . . . . . . . . . . . . . . . . . . . . . . . . . . 1036.12 ROC curves for face-to-face transactions with Adaboost classifiers. 103
xix
Cette thèse est accessible à l'adresse : http://theses.insa-lyon.fr/publication/2019LYSEI110/these.pdf © [Y. Lucas], [2019], INSA de Lyon, tous droits réservés

List of Tables
2.1 Class representations in the data-set . . . . . . . . . . . . . . . . . 142.2 Confusion matrix . . . . . . . . . . . . . . . . . . . . . . . . . . . . 21
3.1 90/10 imbalance confusion matrix . . . . . . . . . . . . . . . . . . 30
4.1 Refined feature set . . . . . . . . . . . . . . . . . . . . . . . . . . . 564.2 Random forest grid search . . . . . . . . . . . . . . . . . . . . . . 564.3 Adaboost grid search . . . . . . . . . . . . . . . . . . . . . . . . . . 564.4 Dataset splitting . . . . . . . . . . . . . . . . . . . . . . . . . . . . 564.5 Comparison of prediction efficiency for ’raw’ and ’refined’ feature
sets . . . . . . . . . . . . . . . . . . . . . . . . . . . . . . . . . . . . 574.6 Agglomerative clustering of the days using the distance matrix
obtained by classifying each day against every other day . . . . . . 674.7 AUC variations with the addition of the covariate shift feature for
different testing periods . . . . . . . . . . . . . . . . . . . . . . . . 684.8 Random forest hyperparameters . . . . . . . . . . . . . . . . . . . 68
5.1 Refined feature set . . . . . . . . . . . . . . . . . . . . . . . . . . . 735.2 Aggregated features centered on the card-holders . . . . . . . . . . 735.3 Random forest grid search . . . . . . . . . . . . . . . . . . . . . . 745.4 Logistic regression grid search . . . . . . . . . . . . . . . . . . . . . 745.5 Adaboost grid search . . . . . . . . . . . . . . . . . . . . . . . . . . 745.6 Addition of "aggCH" features to a random forest classifier . . . . . 745.7 Addition of "aggCH" features to a logistic regression classifier . . . 755.8 Addition of "aggCH" features to an Adaboost classifier . . . . . . . 755.9 Aggregated features centered on the terminals . . . . . . . . . . . . 765.10 Addition of "aggTM" features to a random forest classifier . . . . . 765.11 Addition of "aggTM" features to a logistic regression classifier . . . 775.12 Addition of "aggTM" features to an Adaboost classifier . . . . . . . 775.13 Set of 8 HMM-based features describing 8 combinations of per-
spectives . . . . . . . . . . . . . . . . . . . . . . . . . . . . . . . . 90
6.1 Aggregated features centered on the card holders and the terminal 94
xx
Cette thèse est accessible à l'adresse : http://theses.insa-lyon.fr/publication/2019LYSEI110/these.pdf © [Y. Lucas], [2019], INSA de Lyon, tous droits réservés

6.2 Dataset splitting . . . . . . . . . . . . . . . . . . . . . . . . . . . . 946.3 Random forest grid search . . . . . . . . . . . . . . . . . . . . . . 986.4 Logistic regression grid search . . . . . . . . . . . . . . . . . . . . 1016.5 Adaboost grid search . . . . . . . . . . . . . . . . . . . . . . . . . 1046.6 PR-AUCs for E-commerce HMM hyperparameters (raw = 0.203±
0.005) . . . . . . . . . . . . . . . . . . . . . . . . . . . . . . . . . . 1056.7 PR-AUCs for Face-to-face HMM hyperparameters (raw = 0.089±
0.011) . . . . . . . . . . . . . . . . . . . . . . . . . . . . . . . . . . 1066.8 Number of transactions in the test set with different history con-
straints (History >= 3 means that all the transactions have atleast 2 transactions in the past for the card-holder and for theterminal: we can build sequences of 3 transactions for both per-spectives) . . . . . . . . . . . . . . . . . . . . . . . . . . . . . . . . 106
6.9 Fraud detection on the whole test set with different missing valuesstrategies . . . . . . . . . . . . . . . . . . . . . . . . . . . . . . . . 108
xxi
Cette thèse est accessible à l'adresse : http://theses.insa-lyon.fr/publication/2019LYSEI110/these.pdf © [Y. Lucas], [2019], INSA de Lyon, tous droits réservés

Chapter 1
Introduction
1.1 Credit card fraud in Europe
In 2011, 700 millions payment cards have been issued in the EU. The volume ofnon-cash transaction for that year exceeded 3000 billion euros. The implemen-tation of EMV1 (chip-embedded cards) for face-to-face transactions and strongidentification of customers via 3D secure2 for e-commerce transactions increasedsignificantly the security of european payments.
However, even after the implementation of EMV and 3D-SECURE security,a non negligible number of credit card transactions remains illegitimate: theamount of european credit card fraud reaches 1.5 billion euros yearly. In orderto complement the decrease in credit card fraud obtained with the inclusion ofauthentication methods, experts agree that data driven fraud detection systemsare the future of credit card fraud detection [Ali et al., 2019].
According to [Europol, 2012]3, international organised crime groups domi-nate the criminal market of credit card fraud and affect non-cash payments on aglobal level. Doing fraudulent card payment is not risky and provide high profitto these organised crime groups. These incomes are afterwards invested in orderto develop further fraudulent strategies, to finance other criminal activities or tostart legal businesses (money laundering).
Experts reported that the international and highly-organized nature of crim-inal networks creates the need for international police cooperation. However, the
1EMV (Europay, MasterCard, Visa) : a standard for payment cards based on chip technology.23D secure: double identification of the card-holder via a PIN sent by SMS3EUROPOL: European agency for criminality repression and collaboration between police
forces
1
Cette thèse est accessible à l'adresse : http://theses.insa-lyon.fr/publication/2019LYSEI110/these.pdf © [Y. Lucas], [2019], INSA de Lyon, tous droits réservés

USA BEL IDN PHL IND DOM ZAF LKA FRA THA KOR BWA ZWE GTM RUS ESP ZMB CUW PER NLDTERM_COUNTRY
0.0
0.1
0.2
0.3
0.4
0.5
0.6
0.7
P(T
ER
M_C
OU
NTR
Y)
and P
(TER
M_C
OU
NTR
Y |
FR
AU
D)
75
09
01
36
79
9
19
87
4
26
16
4
12
81
2
63
46
8
98
00
72
71
3
16
32
8
19
29
10
43
42
25
34
47
5
81
83
32
24
69
53
40
17
85
4
59
12
70
P(TERM_COUNTRY), P(FRAUD | TERM_COUNTRY) and P(TERM_COUNTRY | FRAUD)
P(TERM_COUNTRY)
P(FRAUD | TERM_COUNTRY)
P(TERM_COUNTRY | FRAUD)
0.00
0.01
0.02
0.03
0.04
0.05
0.06
P(F
RA
UD
| T
ER
M_C
OU
NTR
Y)
73
1 19
0
13
8 13
2
50
49 3
9
39
Figure 1.1: Repartition of different countries among the belgian face-to-face transactionsbetween march and may 2015 ((Blue bars refers to the repartition of the different countriesamong fraudulent transactions (scale on the left side). USA is by far the most representedcountry among fraudulent countries)
legal constraints and limitations for law enforcement authorities in order to fightcredit card fraud makes it a very attractive business for organized crime groups.EUROPOL [Europol, 2012] indicated that the same criminals are still active af-ter many years and return after a few months to the business. Despite this, if aglobal operation involving the cooperation of the police forces of several states isconducted, it has a big impact on the security of credit card transactions in theEU. For example, in June 2011, a operation named ’Night Clone 11’ led to thearrestation of 70 suspects in EU and overseas. This operation initiated by theItalian Police with the cooperation of Bulgaria, US Secret Services and other EUMember States and coordinated in the operational center of EUROPOL causeda break in illegal activities for many other organized crime groups for severalmonths.
Figure 1.1 shows the repartition of the feature TERM-COUNTRY (referingto the country of origin of the merchant) for belgian face-to-face transactions in2015. The blue bars refer to the repartition of this feature categories among thefraudulent transactions only whereas the black bars refer to the repartition ofthis feature categories among all transactions. Their scale is on the left. We canobserve on figure 1.1 that surprisingly, the majority (60%) of fraudulent face-to-face transactions affecting the European Union cardholders takes place overseas.This is mostly due to the fact that EMV standards are not adopted worldwideas a global solution against the counterfeiting of payment cards. Indeed, sincethe introduction of the EMV technology in 2008, the losses caused by domesticfraudulent transactions drastically decreased in the EU. However at the same time
2
Cette thèse est accessible à l'adresse : http://theses.insa-lyon.fr/publication/2019LYSEI110/these.pdf © [Y. Lucas], [2019], INSA de Lyon, tous droits réservés

the level of illegal transactions overseas has seen a big increase. Consequently,since 2011, almost all fraudulent transactions happen overseas. The countriesthat are the most important in terms of the number of fraudulent transactionsare:
• United States,
• Dominican Republic,
• Colombia,
• Russian Federation,
• Brazil,
• Mexico.
In the end, data-driven methods may find and leverage patterns in credit cardfraudster behaviours like the aforementioned merchant country pattern. Thesedata-driven methods would complement existing authentication solutions likeEMV authentication for face-to-face transactions or 3D-SECURE authenticationfor e-commerce transactions.
1.2 Credit card fraud types
Credit card frauds are categorized in various ways in the literature. [Delamaireet al., 2009] proposes to differenciate the fraud with respect to the fraudstersstrategies. They split them into application frauds and behavioral frauds. Inapplication frauds the fraudsters apply for a credit card with a false ID whereasin behavioral frauds the fraudsters find a way to obtain the cardholder’s creden-tial in order to use a pre-existing credit card. [Ghosh and Reilly, 1994] split thefraudulent transactions into six categories with respect to the fraudulent process:frauds from lost or stolen cards, frauds from counterfeit cards, online frauds,bankruptcy frauds, merchant frauds and frauds from cards that got stolen duringthe expedition process. [Patidar et al., 2011] split the fraudulent transactionsin three categories: card related frauds, merchant related frauds and Internetfrauds. [Laleh and Azgomi, 2009] go further in this direction and propose toonly split fraud into face-to-face (card present) fraud and e-commerce (card notpresent) fraud. Their argument for this strict and simple classification is that theoverlap between categories may weakens fraud detection approaches.
As described by credit card fraud detection experts, in the industry the fraud-ulent scenarios are split in 5 different types:
3
Cette thèse est accessible à l'adresse : http://theses.insa-lyon.fr/publication/2019LYSEI110/these.pdf © [Y. Lucas], [2019], INSA de Lyon, tous droits réservés
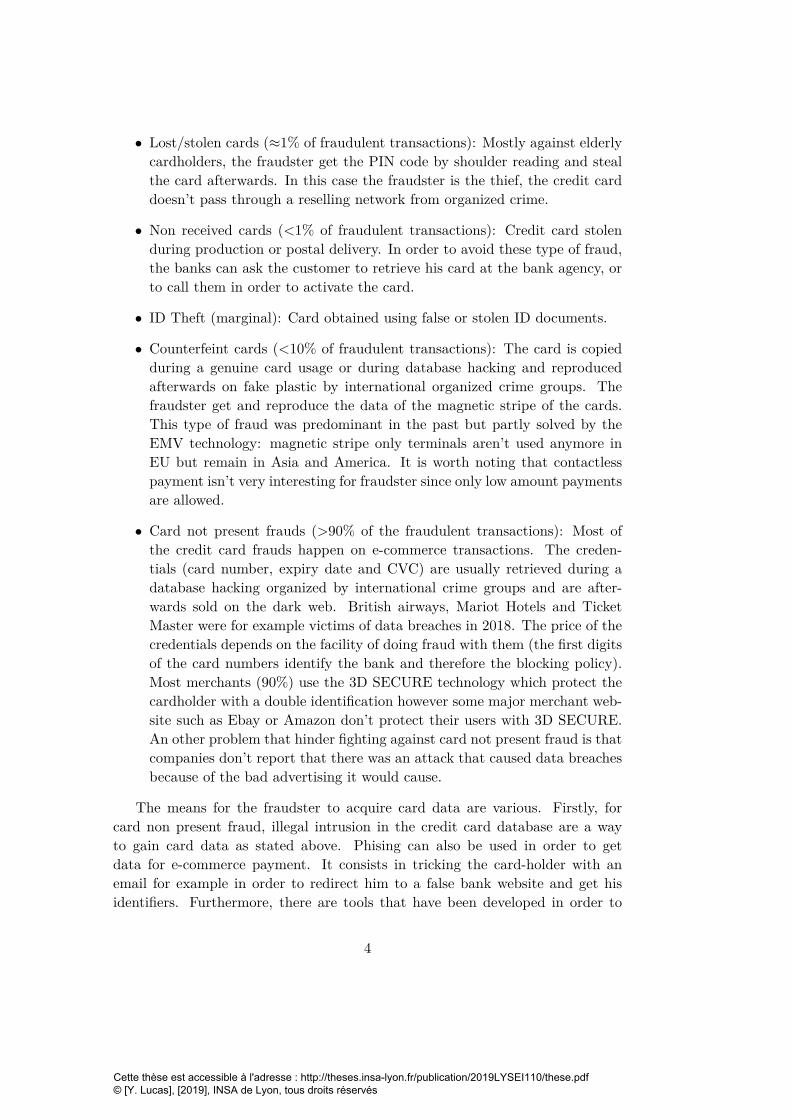
• Lost/stolen cards (≈1% of fraudulent transactions): Mostly against elderlycardholders, the fraudster get the PIN code by shoulder reading and stealthe card afterwards. In this case the fraudster is the thief, the credit carddoesn’t pass through a reselling network from organized crime.
• Non received cards (<1% of fraudulent transactions): Credit card stolenduring production or postal delivery. In order to avoid these type of fraud,the banks can ask the customer to retrieve his card at the bank agency, orto call them in order to activate the card.
• ID Theft (marginal): Card obtained using false or stolen ID documents.
• Counterfeint cards (<10% of fraudulent transactions): The card is copiedduring a genuine card usage or during database hacking and reproducedafterwards on fake plastic by international organized crime groups. Thefraudster get and reproduce the data of the magnetic stripe of the cards.This type of fraud was predominant in the past but partly solved by theEMV technology: magnetic stripe only terminals aren’t used anymore inEU but remain in Asia and America. It is worth noting that contactlesspayment isn’t very interesting for fraudster since only low amount paymentsare allowed.
• Card not present frauds (>90% of the fraudulent transactions): Most ofthe credit card frauds happen on e-commerce transactions. The creden-tials (card number, expiry date and CVC) are usually retrieved during adatabase hacking organized by international crime groups and are after-wards sold on the dark web. British airways, Mariot Hotels and TicketMaster were for example victims of data breaches in 2018. The price of thecredentials depends on the facility of doing fraud with them (the first digitsof the card numbers identify the bank and therefore the blocking policy).Most merchants (90%) use the 3D SECURE technology which protect thecardholder with a double identification however some major merchant web-site such as Ebay or Amazon don’t protect their users with 3D SECURE.An other problem that hinder fighting against card not present fraud is thatcompanies don’t report that there was an attack that caused data breachesbecause of the bad advertising it would cause.
The means for the fraudster to acquire card data are various. Firstly, forcard non present fraud, illegal intrusion in the credit card database are a wayto gain card data as stated above. Phising can also be used in order to getdata for e-commerce payment. It consists in tricking the card-holder with anemail for example in order to redirect him to a false bank website and get hisidentifiers. Furthermore, there are tools that have been developed in order to
4
Cette thèse est accessible à l'adresse : http://theses.insa-lyon.fr/publication/2019LYSEI110/these.pdf © [Y. Lucas], [2019], INSA de Lyon, tous droits réservés

generate card numbers (see figure 1.2 for an example of these tools). Thesenumbers are then used for "credit master attack", which consists in brute forceattacking the merchant website with lots of possible cards (the expiry date andCVC can not be inferred and need to be brute forced too).
Figure 1.2: Card number generator
For card present frauds, fraudsters may use a sleight of hand in order to swapcredit cards or a device to block the credit card in the ATM after having read thePIN by "shoulder surfing". An other way can be skimming or shimming creditcard by recording magnetic stripe data for later reproduction or more recentlyattach a false card reader device on top of the terminal (see figure 1.3).
Figure 1.3: Cardblocker PIN reader terminal topper
The different fraudulent transactions types aforementioned could hinder theability of a data driven system to model the various behaviours leading to a fraud.
5
Cette thèse est accessible à l'adresse : http://theses.insa-lyon.fr/publication/2019LYSEI110/these.pdf © [Y. Lucas], [2019], INSA de Lyon, tous droits réservés
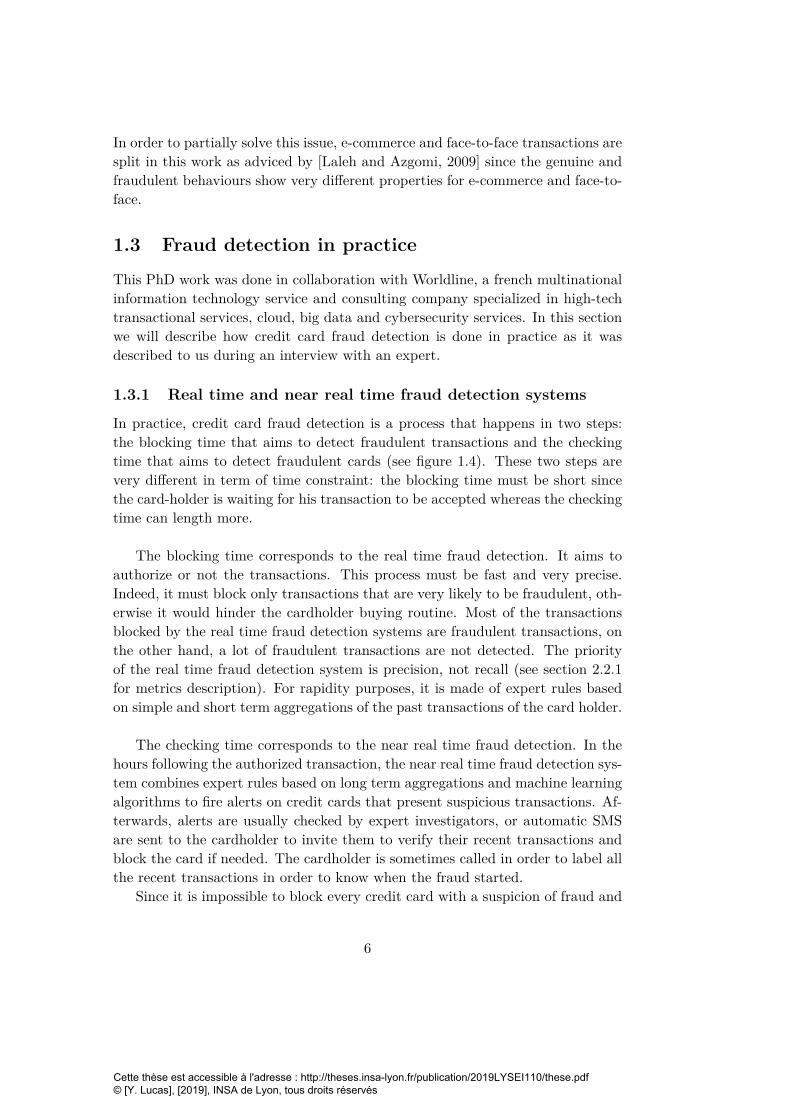
In order to partially solve this issue, e-commerce and face-to-face transactions aresplit in this work as adviced by [Laleh and Azgomi, 2009] since the genuine andfraudulent behaviours show very different properties for e-commerce and face-to-face.
1.3 Fraud detection in practice
This PhD work was done in collaboration with Worldline, a french multinationalinformation technology service and consulting company specialized in high-techtransactional services, cloud, big data and cybersecurity services. In this sectionwe will describe how credit card fraud detection is done in practice as it wasdescribed to us during an interview with an expert.
1.3.1 Real time and near real time fraud detection systems
In practice, credit card fraud detection is a process that happens in two steps:the blocking time that aims to detect fraudulent transactions and the checkingtime that aims to detect fraudulent cards (see figure 1.4). These two steps arevery different in term of time constraint: the blocking time must be short sincethe card-holder is waiting for his transaction to be accepted whereas the checkingtime can length more.
The blocking time corresponds to the real time fraud detection. It aims toauthorize or not the transactions. This process must be fast and very precise.Indeed, it must block only transactions that are very likely to be fraudulent, oth-erwise it would hinder the cardholder buying routine. Most of the transactionsblocked by the real time fraud detection systems are fraudulent transactions, onthe other hand, a lot of fraudulent transactions are not detected. The priorityof the real time fraud detection system is precision, not recall (see section 2.2.1for metrics description). For rapidity purposes, it is made of expert rules basedon simple and short term aggregations of the past transactions of the card holder.
The checking time corresponds to the near real time fraud detection. In thehours following the authorized transaction, the near real time fraud detection sys-tem combines expert rules based on long term aggregations and machine learningalgorithms to fire alerts on credit cards that present suspicious transactions. Af-terwards, alerts are usually checked by expert investigators, or automatic SMSare sent to the cardholder to invite them to verify their recent transactions andblock the card if needed. The cardholder is sometimes called in order to label allthe recent transactions in order to know when the fraud started.
Since it is impossible to block every credit card with a suspicion of fraud and
6
Cette thèse est accessible à l'adresse : http://theses.insa-lyon.fr/publication/2019LYSEI110/these.pdf © [Y. Lucas], [2019], INSA de Lyon, tous droits réservés

Figure 1.4: Real time and near real time fraud detection systems [Pozzolo, 2015]
very costly for experts to investigate every alert raised by fraud detection system.[Baesens et al., 2015] highlighted the fact that investigating alerts raised by frauddetection systems is costly. They showed that a tradeoff strategy can be usedbetween the probability of the alert to be a fraud (How sure the classifier is thatthe alert is a fraud) and the amount of money that can be saved by preventingthis fraud (see figure 1.5)). Depending on the uncertainty of the fraud detectionsystem that a transaction is fraudulent and the amount of the transaction, theexperts can automatically decide to investigate or not.
1.3.2 Rules based detection and rules management
After alerts are processed by the fraud case management team, the feedback ofthe investigators is used in order to update the rules and the systems.
There are two different types of rules:
• filter rules: Automatically decline transactions based on the transactioncharacteristics. This helps to raise alerts for known fraudulent patterns. Forexample: reject transactions with amount superior to 300e in the countrycode 392 (japan) with merchant name containing "AEON", with mercantcategory different from 6011 and with card number different from XXX andYYY (2 cards excluded from the rule).
• history based rules: An aggregation function is calculated and the ruledecision is based on a threshold on the value of the aggregation.
7
Cette thèse est accessible à l'adresse : http://theses.insa-lyon.fr/publication/2019LYSEI110/these.pdf © [Y. Lucas], [2019], INSA de Lyon, tous droits réservés

Figure 1.5: Tradeoff between fraud probability and transaction amount (from [Baesens et al.,2015])
At the end of the month, several reports of the efficiency of the rules areproduced. The main report aims to tell, for each rule: the number of false pos-itives, true positives and the monetary savings from the rule. Among the rulescontained in the fraud detection systems, some may become out of date and upto date again afterwards. New expert rules are created by fraud investigators andcalling agents: They monitor a lot of different fraudulent transactions each daysand recognize common patterns between fraud scenarios. These similarities areincluded in the expert rules in order to raise alerts.
When a fraudulent transaction is detected and investigated, the previoustransactions of the cardholder are carefully labelled with respect to the timeelapsed between until the detected fraudulent transaction. But there is a greyzone with potentially a mix of genuine and fraudulent transactions.:
Conclusion In the end, double identification through 3D-SECURE for e-commercetransactions or EMV PIN technology for face-to-face transactions strongly in-creased the security of credit card transactions. Moreover, the combination ofreal time expert rules (automatic transactions blocks), near real time expert rules(manual cards blocks) and data driven alerts allow for an appreciated preventionand detection of fraudulent transactions.
However, fraudulent transactions still represent a significant loss for customersand bank companies that have to refund them. Moreover, fraudulent strategiesare constantly changing in order to get around fraud detection systems. Be-sides, the double authentication processes aforementioned are not implementedin several major countries and web vendors, creating the need for improved frauddetection systems.
8
Cette thèse est accessible à l'adresse : http://theses.insa-lyon.fr/publication/2019LYSEI110/these.pdf © [Y. Lucas], [2019], INSA de Lyon, tous droits réservés

According to industrial partners, advanced data analytics and data drivenmethods are very promising for fraud detection and would lead to savings fromthe company along with a more trustful experience for their customers.
1.4 Publications and outline
1.4.1 Publications
Data driven credit card fraud detection presents several characteristics that makesit a difficult task. They will be described more in depth in section 2.3. Briefly:
• Fraud detection’s main characteristic is that there is a strong imbalancebetween the classes: the fraudulent events are less represented than thegenuine ones.
• Fraudsters may adapt their strategies over time. Besides buying behaviourmay change seasonally. Therefore, a credit card fraud detection system maybecome out of date if no action is taken.
• Even if credit card transactions may present some conditional dependences,credit card transactions usually ignore detailed sequential information. Fea-ture engineering is a crucial issue for increasing fraud detection system’sperformances.
Throughout this thesis, we attempt to answer these research questions. Theanswers we proposed were opportunities for scientific publications.
The main contribution of the thesis, the multiple perspective HMM-based fea-ture engineering framework, introduced in section 2.3.2 and described in chapters5 and 6 was published in:
• Multiple perspectives HMM-based feature engineering for credit card frauddetection, 34th ACM/SIGAPP Symposium on Applied Computing (SAC2019).[Lucas et al., 2019a]
• Towards automated feature engineering for credit card fraud detection usingmulti-perspective HMMs, Future Generations Computer Systems SpecialIssue on: Data Exploration in the Web 3.0 Age.[Lucas et al., 2019b]
• Additionaly, the source code of the proposed framework can be found athttps://gitlab.com/Yvan_Lucas/hmm-ccfd .
Additionally, a study of the calendar based covariate shift observed in thecredit card transaction dataset was performed. It is described in the section 4.2of this work and has been presented in:
9
Cette thèse est accessible à l'adresse : http://theses.insa-lyon.fr/publication/2019LYSEI110/these.pdf © [Y. Lucas], [2019], INSA de Lyon, tous droits réservés
• Dataset shift quantification for credit card fraud detection, IEEE Artificialintelligence and knowledge engineering (AIKE 2019). [Lucas et al., 2019c]
1.4.2 Outline
This work is articulated as following: after having introduced the stakes of creditcard fraud detection and the properties of this task in chapter 1, we will describemore formally the problem of credit card fraud detection and highlight the re-search questions it raises in chapter 2. Afterwards, we will present in chapter 3the state of the art approaches for handling the special difficulties of credit cardfraud detection (namely: dataset shift, sequence modelling, class imbalance andfeature engineering). In chapter 4, we will highlight the particularities of thecredit card transactions dataset used throughout this work and conduct an ex-ploratory analysis in order to quantify the dataset shift in it. In chapter 5 we willpresent the multiple perspective HMM-based feature engineering strategy whichis the backbone of this work. The increase in fraud detection obtained with theproposed HMM-based features will be shown in chapter 6.
10
Cette thèse est accessible à l'adresse : http://theses.insa-lyon.fr/publication/2019LYSEI110/these.pdf © [Y. Lucas], [2019], INSA de Lyon, tous droits réservés

Chapter 2
Problem statement & researchquestions
We introduced in the previous chapter the real world stakes that motivated creditcard fraud detection. Moreover, some informations about fraud taxonomy andhow it is leveraged in practice have been presented. More precisely, the creditcard fraud detection happens in two times: at the time of the transaction thereis a real-time fraud detection system that detects obvious frauds, and afterwards,histories of transactions are evaluated in order to raise alerts on suspicious creditcard centered buying behaviours.
In this chapter, we start with a formalization of the problem of credit cardfraud detection as a machine learning task along with an introduction of the en-semble models used throughout this thesis: the random forest classifier and theboosting trees classifier. We also briefly illustrate the strengths of ensemble-basedmethods.
Then we introduce two ways of evaluating machine learning classifiers: theconfusion-matrix based evaluation and the parametric evaluation, and argue thechoice of parametric evaluation for credit card fraud detection.
We finish this chapter by describing the questions that make credit card frauddetection a challenging research task.
11
Cette thèse est accessible à l'adresse : http://theses.insa-lyon.fr/publication/2019LYSEI110/these.pdf © [Y. Lucas], [2019], INSA de Lyon, tous droits réservés

2.1 Machine learning formalization for credit card frauddetection
2.1.1 Machine learning notations & Fraud detection particular-ities
Fraud detection formalization
Throughout this work, we will refer to x as the set of features describing an ex-ample (the set of attributes describing a transaction for our particular problem).Each feature xk of the feature set can be categorical, ordinal or numerical.
A categorical feature takes values in a discrete non-ordered ensemble of cat-egories {c1, .., cn}. For the credit card fraud detection application, a categoricalfeature can be for example: the country of the merchant involved in the transac-tion.
An ordinal feature takes values in a discrete ordered ensemble of categories{c1, ..., cn} with ci < cj if i < j (i, j ∈ {1, ...,n}2). For the credit card frauddetection application, an ordinal feature can be for example: the credit limit ofthe card-holder that made the transaction: it has a fixed number of categoriescorresponding to the usual values of credit limit but these categories can be or-dered.
A numerical feature takes continuous values. The application domain of anumerical feature can be bordered or non bordered: its values can be limited toan interval or not. For the credit card fraud detection application, a numericalfeature can be for example: the amount of the considered transaction.
y will refer to the target variable: a feature for which we aim to know thevalue conditioned on the set of features x. y can be categorical or continuous. Forour particular problem the target variable will most often be the ground truthfor the fraudulent nature of the transaction: Is it a fraudulent transaction or not?
Machine learning algorithms aim to model the dependencies between the fea-ture set x and the target variable y. More precisely, discriminant algorithmsaim to model the conditional distribution of probability p(y|x) whereas genera-tive algorithms aim to model the joint distribution of probability p(x, y). In thecase of a categorical target variable, the discriminant model is called a classifier,whereas in the case of a continuous target variable, the discriminant model iscalled a regressor.
Machine learning consists in two main phases:
12
Cette thèse est accessible à l'adresse : http://theses.insa-lyon.fr/publication/2019LYSEI110/these.pdf © [Y. Lucas], [2019], INSA de Lyon, tous droits réservés
• During the training phase, the model is trained in order to be able tomake a prediction for a particular task. The particular task is definedby a set of training examples representing the function that the modelaims to approximate. These training examples are usually preprocessedbefore being given to the model in order to make sure that the modelfits his decision function using appropriate information from the data. Atthe end of the training phase, the model parameters are adjusted in orderto reflect the most the relationship between the set of features x and thetarget variable y observed in the training set of examples. An additionalstep called validation step can be performed in order to adjust the modelhyperparameters1
• The testing phase aims to leverage the knowledge acquired by the modelduring the training phase. The trained model is evaluated on a set ofexamples distinct from the set of examples used for training.
Dataset
Throughout this work, we study a confidential dataset containing all the creditcard transactions issued by belgian credit cards between 01.03.2015 and 31.05.2015.
As mentioned before, credit card transactions can be separated in two verydifferent clusters:
face-to-face The face-to-face transactions are transactions for which the card-holder is located at the shop. Thanks to the EMV technology aforemen-tioned, we observe in the dataset that the authentication of the card-holderis made with a PIN code 92% of the time. However in 7% of the face-to-facetransactions, the authentication is made with a signature. The proportionof fraudulent transactions is 20 times higher with signature authentica-tion than with PIN authentication. Besides, we observe that 82% of thefraudulent face-to-face transactions are comprised within the 8% non EMVtransactions. Furthermore, face-to-face transactions are restricted in time:very few face-to-face transactions are issued between 12 p.m. and 7 a.m.
e-commerce The e-commerce transactions are remote transactions for whichthe card-holder is not necessarily located at the shop. We observe that 22%of the belgian e-commerce transactions during spring 2015 have triggereda 3D-SECURE authentication. 3D-SECURE authentication consists in as-serting the identity of the card-holder by double checking it, usually via acode sent by SMS. There are 32 times more e-commerce fraudulent trans-actions without 3D-SECURE authentication than with 3D-SECURE au-
1Hyperparameters are fixed parameters usually ruling model architecture. Contrary to theparameters, the hyperparameters are not modified during the training of the model.
13
Cette thèse est accessible à l'adresse : http://theses.insa-lyon.fr/publication/2019LYSEI110/these.pdf © [Y. Lucas], [2019], INSA de Lyon, tous droits réservés

Table 2.1: Class representations in the data-set
Fraud Non-Fraud Total
Face-to-Face 10.815 25.824.400 25.835.215
E-commerce 73.687 21.524.624 21.598.311
Figure 2.1: Bipartite graph of the transactions.
thentication. Furthermore, a significantly bigger proportion of e-commercetransactions is issued at night compared to face-to-face transactions: around10% of the e-commerce transactions are issued between 12 p.m. and 7 a.m.whereas only 3% of face-to-face transactions are done within the same pe-riod of time. The buying schedule is more spread for e-commerce transac-tions
There is a significant difference in fraud ratio between e-commerce and face-to-face transactions. We observe in the Belgian credit card transactions datasetthat there are 4 fraudulent transactions for 10.000 face-to-face transactions and3 fraudulent transactions for 1000 e-commerce transactions (see table 2.1). Theclass imbalance is 17 times stronger for the face-to-face transactions than for thee-commerce transactions
E-commerce and face-to-face transactions are very different paradigms andtherefore are studied separately in this work, moreover classifier efficiencies aremeasured on the two types of transactions.
Terminal/Card-holder sequence
Credit card transactions are an interaction between two nodes of different types:a card-holder node and a merchant node. Transactions can be seen as edgeslinking merchant and card-holder in a bipartite graph (see figure 2.1).
Moreover, the time of the transaction is recorded. The transactions can beordered with respect to the time scale. Therefore, transactions of a given card-
14
Cette thèse est accessible à l'adresse : http://theses.insa-lyon.fr/publication/2019LYSEI110/these.pdf © [Y. Lucas], [2019], INSA de Lyon, tous droits réservés

Figure 2.2: history and subsequence of transactions
holder or merchant can be gathered and assembled together in sequences.
Since we stated earlier that e-commerce and face-to-face transactions are verydifferent paradigms, we made the hypothesis that e-commerce and face-to-facetransactions are not related within a sequence: each card-holder have a face-to-face sequence of transactions and an e-commerce sequence of transactions.
In this work, we name card-holder (resp. merchant) history the sequencecontaining all the previous transactions of a card-holder (resp. merchant). Thecard-holder history Hchi
(t) comprises all the transactions of the card-holder hap-pening before the current transaction (e.g. the transaction currently waiting fordecision in the fraud detection system).
Furthermore, we name card-holder (resp. merchant) subsequence a sequencecontaining a subset of transactions happening before the actual transaction (seefigure 2.2. The transactions in the subset of transactions are happening justbefore the current transaction. The number of transaction in the subsequenceis either chosen arbitrarly or depends on the number of transactions that havehappened in a given amount of time.
The sequential view can be leveraged for a better knowledge of the contextof a transaction: the properties of this transaction can be related to the previoustransactions of the sequence.
2.1.2 Bias-Variance tradeoff and ensemble based methods
It is mentioned in the previous sections that the credit card fraud detection clas-sifier aims to estimate the posterior probability p(y|x) (with y the target variableand x the attributes of the transaction).
Since the posterior probability is continuous, this probability estimation prob-lem can be seen as a regression problem that aims to find a function f̂ that ap-proximates the underlying function f such as y = f(x) + ε (with ε a centered
15
Cette thèse est accessible à l'adresse : http://theses.insa-lyon.fr/publication/2019LYSEI110/these.pdf © [Y. Lucas], [2019], INSA de Lyon, tous droits réservés

gaussian noise of variance σ2). This formulation will ease the demonstration. Forevaluation purpose, we want this function f̂ to minimize the mean squared erroramong the test examples:
MSE = E[(y− f̂(x))2]
= (E[f̂(x)]− f(x))2 + E[f̂(x)2]−E[f̂(x)]2
= (Bias[f̂(x)])2 + V ar[f̂(x)] + σ2
• The bias is the difference between the model prediction f̂(x) and the correctoutput of the underlying function f(x) which we are trying to predict.Simple models usually have high bias since they don’t fit a lot to the trainingdata due to less parameters. They usually have similarly high error ontraining and test data.
• The variance is the variability of the model prediction f̂(x) for differenttraining sets. A model with high variance pays a lot of attention to thetraining data and will change a lot his prediction when trained on a differenttraining set. Therefore, models with high variance usually perform well ontraining data but have high error rates on testing data.
• The term σ2 is the irreducible error coming from the gaussian noise of theworld ε.
Typically, complex models have high variance and a low bias while simplemodels have low variance and a high bias. This is because complex models canapproximate more the target function (low bias), but are highly affected by thevariability of the training set (leading to high variance). The opposite occurswith simple models.
The bias variance tradeoff is a key machine learning problem. Users want theirmodels to be able to identify particular patterns in their data without learningunnecessary and irrelevant relationship between the attributes x and the labelsy of the training data. A model that doesn’t identify particular patterns in thetraining data is said to be underfitting. On the other hand, a model that learnsunnecessary and irrelevant patterns of the training data is said to be overfitting(see figure 2.3).
[Bauer and Kohavi, 1999] have found that ensembles of model perform of-ten better than a single model. They stated that combining models (and theirvariances) can lead to a smaller variance overall than single models. Bagging[Breiman, 1996] is the most famous ensemble based methods.
16
Cette thèse est accessible à l'adresse : http://theses.insa-lyon.fr/publication/2019LYSEI110/these.pdf © [Y. Lucas], [2019], INSA de Lyon, tous droits réservés

Figure 2.3: overfitting vs underfitting.
Bagging consists in building several estimators f̂ on different boostrap samplesof the training data. These estimators predictions are then combined. [Breiman,1996] showed that combining unbiased classifiers with bagging can lead to a nearlyoptimal one thanks to the reduced variance term.
2.1.3 Random forest and boosting trees
Random forest and boosting trees are two ensemble based approaches that arebased on decision tree classifiers. They showed good results for credit card frauddetection and are used at several occasions throughout this work.
Decision tree classifier
Decision trees are a flowchart structure that consists in a succession of internalnodes each containing a rule and branches representing the outcome of the rule(see figure 2.4).
As shown in figure 2.4, one of the asset of decision trees is that it is a modelthat is very easy to interpret: it is possible to have an understanding of the clas-sifier decision by observing the splitting decisions and their outcomes.
The main metric used in order to find the best rule at a given node is Giniimpurity. Gini impurity for a set of element with N classes is calculated as follow(with pi the ratio of element of class i in the set of elements):
Gini =∑
i = 1Npi ∗ (1− pi)
It measures how often a random element would be incorrectly labeled if it wasrandomly labeled according to the distribution of labels in the set of element. Thebest split at a given node is obtained by finding the rule that gives the highestGini impurity decrease through this node.
There existed several iterations of trees implementations:
17
Cette thèse est accessible à l'adresse : http://theses.insa-lyon.fr/publication/2019LYSEI110/these.pdf © [Y. Lucas], [2019], INSA de Lyon, tous droits réservés

Figure 2.4: Toy example of decision tree [Hoare, 2019]
ID3 ID3 (Iterative Dichotomiser 3) creates a tree by finding for each node thecategorical feature that will provide the largest information gain for thecategorical target variable. Trees are grown to their maximum size andthen a pruning step is usually applied to improve the ability of the tree togeneralise to unseen data.
C4.5 C4.5 is the successor to ID3. The categorical feature restriction of ID3is solved by dynamically defining a discrete variable based on numericalvariables that partitions the continuous attribute value into a discrete setof intervals. C4.5 converts the trees with the ID3 algorithm into sets ofrules. The accuracy of each rule is then evaluated to determine the orderin which they should be applied: the more accurate rules are applied first(at the beginning of the tree). Pruning is done by removing a rule if theaccuracy of the parent rule is higher without the child rule.
CART CART (Classification and Regression Trees) is very similar to C4.5, themain difference with C4.5 is that it supports numerical target variables(regression).
Decision trees main issue is that they are very subject to overfitting [Kingsfordand Salzberg, 2008]. This is due to the data being repeatedly split into smallersubsets. Overfitting may be mitigated by pruning and early-stopping.
18
Cette thèse est accessible à l'adresse : http://theses.insa-lyon.fr/publication/2019LYSEI110/these.pdf © [Y. Lucas], [2019], INSA de Lyon, tous droits réservés

Random forest classifier
Random forest [Breiman, 2001] is a well established algorithm based on bagging.It consists in an ensemble of CART decision trees trained on different views ofthe training data.
The particularity of random forest is that each tree is trained using a ran-dom subset of features. Therefore, each tree reflects a particular decision processbased on a subsample of the available information. Moreover, the trees are trainedby default on different slices of the dataset thanks to bootstrap sampling2. Inthe end, the trees are very different and the ensemble based model doesn’t overfit.
The main parameters of the random forest classifier are:
• The number of features randomly chosen in order to build each tree. Anoften recommended default value is the square-root of the total number offeatures.
• The depth of the trees. Contrary to a decision tree classifier, a tree ofmaximum depth doesn’t lead to overfitting since the predictions of verydifferent trees are aggregated together thanks to the ensemble based archi-tecture. However, tree pruning diminish the computation time needed fortraining and testing.
• The number of trees built. Usually, an higher number of trees leads to abetter prediction by the random forest model.
The prediction of a random forest classifier is obtained by averaging all theindividual trees predictions for regression tasks or by majority voting for classi-fication tasks.
Random forest classifiers present an interesting property named ’feature im-portance’ that enables users to understand qualitatively the decision of the clas-sifier. This property is leveraged in section 4.1.2.
The robustness to variance along with the simplicity of interpretation of ran-dom forest decision makes it a model of predilection for various applicationsincluding credit card fraud detection. Moreover, the fact that the trees are builtindependently from each other allows parallelization of random forest trainingand testing steps.
2Bootstrapping is a type of resampling where large numbers of smaller samples of the samesize are repeatedly drawn, with replacement, from a single original sample.
19
Cette thèse est accessible à l'adresse : http://theses.insa-lyon.fr/publication/2019LYSEI110/these.pdf © [Y. Lucas], [2019], INSA de Lyon, tous droits réservés

Adaboost and Gradient boosting methods
Boosting is an other ensemble based method that consists in iteratively com-pensate the misclassification of the ensemble classifier by adding new classifiers(decision tree throughout this work) to it.
There are two approaches for compensating the misclassification of the algo-rithm: Adaboost and gradient boosting.
• Adaboost changes the samples distribution at each iteration. It increasesthe weights of the misclassified examples and decreases the weights of thecorrectly predicted examples. Therefore, the weak learner trained at a giveniteration focuses especially on the difficult examples at this iteration. Afterbeing trained, the weak learner is added to the ensemble classifier accordingto his performance: its weight in the decision process depends on how goodit is by itself.
• Gradient boosting doesn’t change the samples distribution. Instead, eachnew weak learner aims to learn the remaining error of the ensemble classifier.At each iteration i, the target variable of the weak learner y? is equal toy− predi−1 with y the ground truth label of each example and predi−1 thevalue of y guessed by the ensemble classifier at the iteration i− 1. Eachweak learner aims to compensate the gap between the prediction of theensemble classifier and the ground truth y.
Boosting approaches are prone to overfitting since they aim to iterativelyreduce the error of the model on the training set to 0[Quinlan, 1996]. Therefore,tree pruning and early stopping criterion are needed for preventing overfitting.
2.2 Evaluation of the performance of machine learn-ing classifiers
2.2.1 Confusion matrix based evaluation
Traditional ways of evaluating machine learning classifiers use the confusion ma-trix describing the difference between the ground truth of the dataset and themodel prediction (see table 2.2). A perfect model would have all the positiveexample predicted positive and all the negative example predicted negative: FNand FP would be equal to 0.
Using the confusion matrix, one can compute a variety of metrics in order tocompare classifiers performances:
20
Cette thèse est accessible à l'adresse : http://theses.insa-lyon.fr/publication/2019LYSEI110/these.pdf © [Y. Lucas], [2019], INSA de Lyon, tous droits réservés
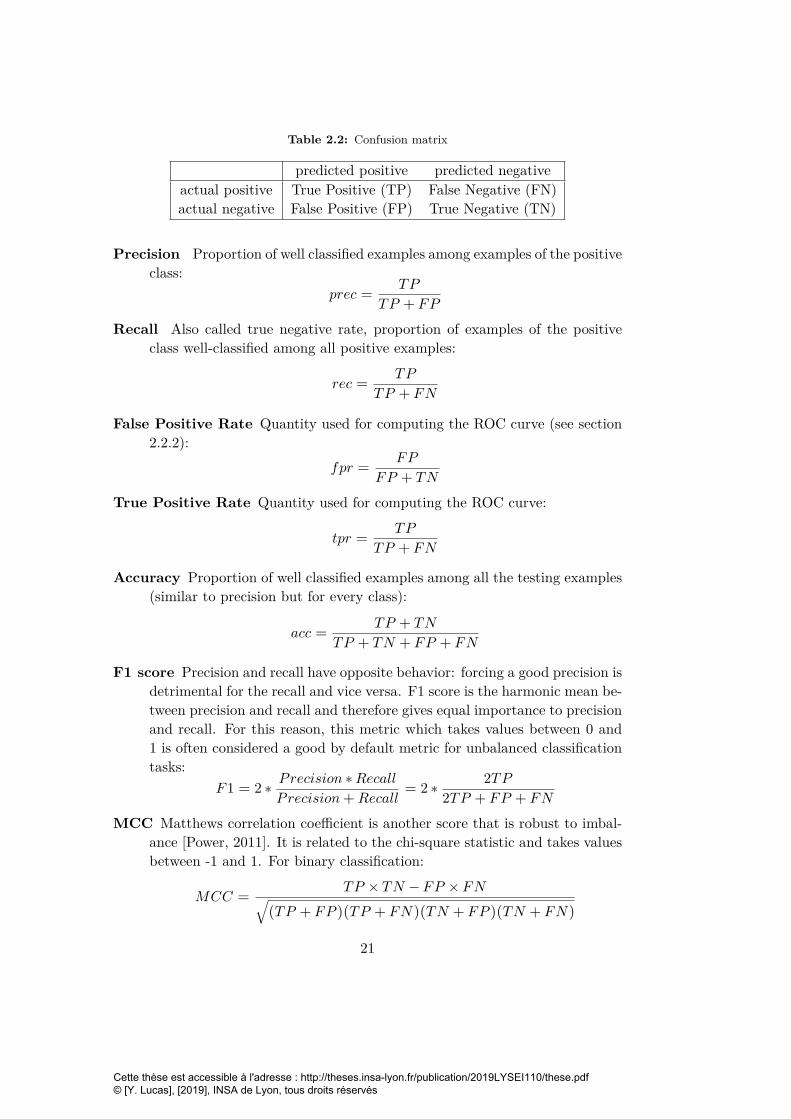
Table 2.2: Confusion matrix
predicted positive predicted negativeactual positive True Positive (TP) False Negative (FN)actual negative False Positive (FP) True Negative (TN)
Precision Proportion of well classified examples among examples of the positiveclass:
prec =TP
TP + FP
Recall Also called true negative rate, proportion of examples of the positiveclass well-classified among all positive examples:
rec =TP
TP + FN
False Positive Rate Quantity used for computing the ROC curve (see section2.2.2):
fpr =FP
FP + TN
True Positive Rate Quantity used for computing the ROC curve:
tpr =TP
TP + FN
Accuracy Proportion of well classified examples among all the testing examples(similar to precision but for every class):
acc =TP + TN
TP + TN + FP + FN
F1 score Precision and recall have opposite behavior: forcing a good precision isdetrimental for the recall and vice versa. F1 score is the harmonic mean be-tween precision and recall and therefore gives equal importance to precisionand recall. For this reason, this metric which takes values between 0 and1 is often considered a good by default metric for unbalanced classificationtasks:
F1 = 2 ∗ Precision ∗RecallPrecision+Recall
= 2 ∗ 2TP2TP + FP + FN
MCC Matthews correlation coefficient is another score that is robust to imbal-ance [Power, 2011]. It is related to the chi-square statistic and takes valuesbetween -1 and 1. For binary classification:
MCC =TP × TN − FP × FN√
(TP + FP )(TP + FN)(TN + FP )(TN + FN)
21
Cette thèse est accessible à l'adresse : http://theses.insa-lyon.fr/publication/2019LYSEI110/these.pdf © [Y. Lucas], [2019], INSA de Lyon, tous droits réservés
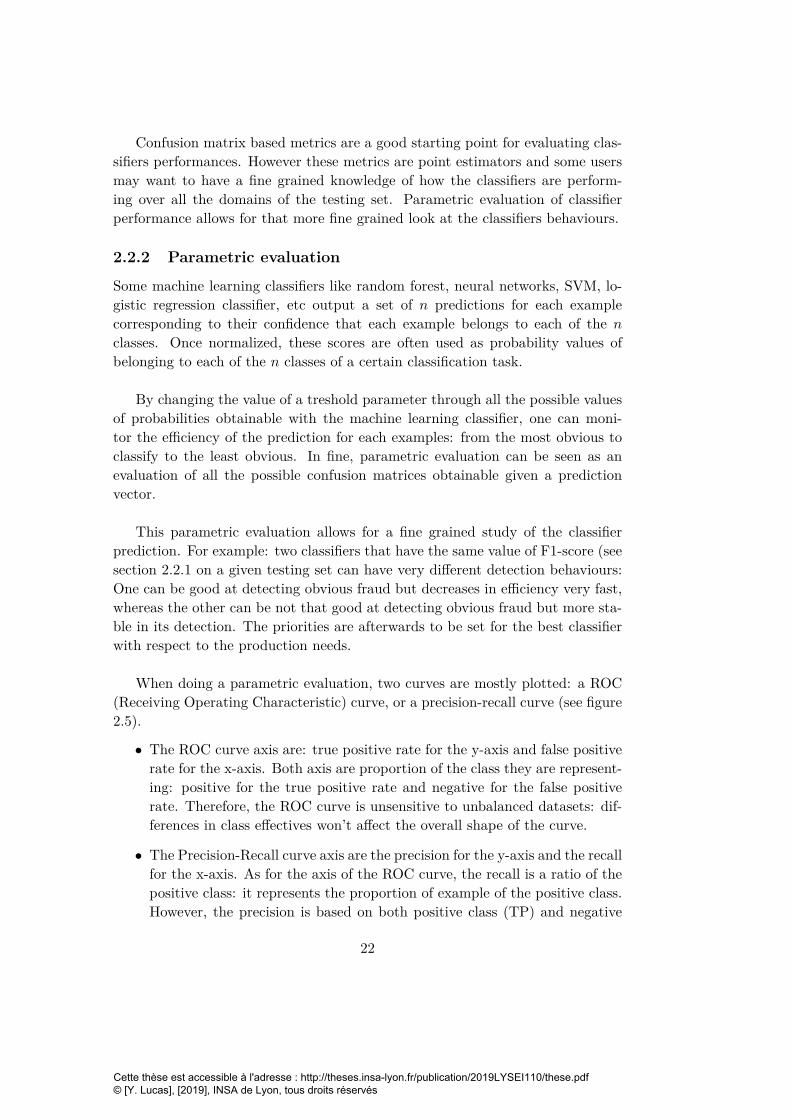
Confusion matrix based metrics are a good starting point for evaluating clas-sifiers performances. However these metrics are point estimators and some usersmay want to have a fine grained knowledge of how the classifiers are perform-ing over all the domains of the testing set. Parametric evaluation of classifierperformance allows for that more fine grained look at the classifiers behaviours.
2.2.2 Parametric evaluation
Some machine learning classifiers like random forest, neural networks, SVM, lo-gistic regression classifier, etc output a set of n predictions for each examplecorresponding to their confidence that each example belongs to each of the nclasses. Once normalized, these scores are often used as probability values ofbelonging to each of the n classes of a certain classification task.
By changing the value of a treshold parameter through all the possible valuesof probabilities obtainable with the machine learning classifier, one can moni-tor the efficiency of the prediction for each examples: from the most obvious toclassify to the least obvious. In fine, parametric evaluation can be seen as anevaluation of all the possible confusion matrices obtainable given a predictionvector.
This parametric evaluation allows for a fine grained study of the classifierprediction. For example: two classifiers that have the same value of F1-score (seesection 2.2.1 on a given testing set can have very different detection behaviours:One can be good at detecting obvious fraud but decreases in efficiency very fast,whereas the other can be not that good at detecting obvious fraud but more sta-ble in its detection. The priorities are afterwards to be set for the best classifierwith respect to the production needs.
When doing a parametric evaluation, two curves are mostly plotted: a ROC(Receiving Operating Characteristic) curve, or a precision-recall curve (see figure2.5).
• The ROC curve axis are: true positive rate for the y-axis and false positiverate for the x-axis. Both axis are proportion of the class they are represent-ing: positive for the true positive rate and negative for the false positiverate. Therefore, the ROC curve is unsensitive to unbalanced datasets: dif-ferences in class effectives won’t affect the overall shape of the curve.
• The Precision-Recall curve axis are the precision for the y-axis and the recallfor the x-axis. As for the axis of the ROC curve, the recall is a ratio of thepositive class: it represents the proportion of example of the positive class.However, the precision is based on both positive class (TP) and negative
22
Cette thèse est accessible à l'adresse : http://theses.insa-lyon.fr/publication/2019LYSEI110/these.pdf © [Y. Lucas], [2019], INSA de Lyon, tous droits réservés

Figure 2.5: ROC curve (left) and precision-recall (right) curve evaluations for e-commercefraud detection
class (FP) effectives. Therefore, a strong class imbalance (such as creditcard fraud detection imbalance) would affect the precision values since theclassification is harder. The precision recall curve is more punitive thanROC curve and consequently more challenging to improve: in a context ofclass imbalance, the pecision value is closer to 0 and therefore the precisionrecall curve decreases. Besides, we experienced that the precision recallcurve is easier to read for industrial partners.
The parametric curves are not scores by themselves. In order to extract ametric from this type of curve for predictions comparison, the area under thecurve is calculated: ∫ tmax
treshold=tmin
f(x)dx
According to domain application needs, the area under a portion of the curvecan also be calculated. For example, for credit card fraud detection evaluation,the need to calculate the AUC for values of recall below 0.2 was discussed sincethe experts can only investigate a limited number of alerts.
2.3 Fraud detection research questions and contribu-tions
2.3.1 Fraud detection research questions
Credit card fraud detection is a crucial asset for ensuring customer trust andsaving money by preventing fraudulent loss. Moreover, credit card fraud detectionpresents several characteristics that make it a challenging task and an interestingresearch question.
23
Cette thèse est accessible à l'adresse : http://theses.insa-lyon.fr/publication/2019LYSEI110/these.pdf © [Y. Lucas], [2019], INSA de Lyon, tous droits réservés

Skewed class distributions Most transactions are legitimate and only a verysmall fraction of the transaction has been issued by fraudster. In spring 2015 inBelgium, the observed fraction of fraudulent transaction is 0.04% for the face-to-face (card present) transactions and 0.34% for the e-commerce (card not present)transactions (see paragraph 2.1.1). Some algorithms such as Support VectorMachines for example suffer a lot from class imbalance and can be completelyunable to learn the minoity class specific patterns ([Wu and Chang, 2003], [Yanet al., 2003]). Solutions have been presented in the literature in order to eitheradapt the algorithms (cost based methods for example) to imbalancy or solve theimbalancy in the data (sampling based methods).
Dataset shift Fraudsters tactics evolve over time. Some fraud strategies be-come out of date because of the constant cat and mouse play between fraudstersand experts, and new technologies show weaknesses that can be exploited byfraudster. Moreover, cardholders behaviours change over seasons. A given con-sumer may use his credit card at different merchants in winter than in summer,or buy different things to these merchants. Also, the purchasing behaviour haschanged over years due to inflation and economic fluctuations and what fraudexpert knew about the cardholders habits may not hold anymore. The combi-nation of the three aforementioned factors: respectively the concept drift (whenp(y|x) changes), the seasonal covariate shift (when p(x) changes) and the abso-lute covariate shift (when p(x) changes) makes typical algorithms become outof date or irrelevant. The dataset on which these algorithms are tested doesn’tcorrespond to the dataset they were trained on. These weaknesses create theneed for algorithms that are designed in order to be updated regularly or waysto detect when an algorithm shows decreasing efficiency for the task it has beentrained for and needs to be updated. Online learning schemes are very useful inorder to prevent concept drift and covariate shift to affect the fraud detectionsystems.
Feature engineering Credit card transactions are represented as vectors ofcontinuous, categorical and binary features that characterize the card-holder, thetransaction and the terminal. The card-holder is characterized by a unique card-holder ID, its age, its gender, etc. The transaction is characterized by variableslike the date-time, the amount and other confidential features. The terminalis characterized by a unique terminal-ID, a merchant category code, a country.However, most learning algorithms can’t handle categorical feature without a pre-processing step in order to transform them into numerical features ([Kotsiantis,2007]). Additionnaly, specific feature engineering strategies for credit card detec-tion exist. These strategies either aim to make the features more significant forthe classifier or to create additional features in order to enrich transaction data.
24
Cette thèse est accessible à l'adresse : http://theses.insa-lyon.fr/publication/2019LYSEI110/these.pdf © [Y. Lucas], [2019], INSA de Lyon, tous droits réservés

Sequence modeling A major issue of typical credit card transaction datasetis that the feature set describing a credit card transaction usually ignores detailedsequential information. Therefore, the predictive models only use raw transac-tional features, such as time, amount, merchant category, etc. [Bolton and Hand,2001] showed the necessity to use features describing the history of the trans-action. Indeed, credit card transactions of the same cardholder (or the sameterminal) can be grouped together and compared to each other as highlighted insection 2.1.1.
Interpretability Aside from the aforementioned research questions, interpretabil-ity of the machine learning algorithms decision is a crucial concern for industrialswho are the targeted users of applied data science research work such as creditcard fraud detection. Research has been done in order to understand better onwhich heuristics model decisions are based ([Pastor and Baralis, 2019] for exam-ple). However some models remain black boxes.
2.3.2 Contributions
Solutions for integrating sequential information in the feature set exist in theliterature. The predominant one consists in creating a set of features whichare descriptive statistics obtained by aggregating the sequences of transactionsof the card-holders (sum of amount, count of transactions, etc..) (see section 5.1).
We used this method as a benchmark feature engineering method for creditcard fraud detection. However, this feature engineering strategy raised severalresearch questions. First of all, we assumed that these descriptive statistics can’tfully describe the sequential properties of fraud and genuine patterns and thatmodelling the sequences of transactions could be beneficial for fraud detection.Moreover the creation of these aggregated features is guided by expert knowledgewhereas sequences modelling could be automated thanks to the class labels avail-able for past transactions. Finally, the aggregated features are point estimatesthat may be complemented by a multi-perspective description of the transactioncontext (especially from the point of view of the seller).
The main focus of this work was to propose a multi-perspective HMM-basedautomated feature engineering strategy in order to incorporate a broad spectrumof sequential information in the transaction feature set. In fact, we model thegenuine and fraudulent behaviours of the merchants and the card-holders accord-ing to two univariate features: the timing and the amount of the transactions.Moreover, the HMM-based features are created in a supervised way and thereforelower the need of expert knowledge for the creation of the fraud detection system.
25
Cette thèse est accessible à l'adresse : http://theses.insa-lyon.fr/publication/2019LYSEI110/these.pdf © [Y. Lucas], [2019], INSA de Lyon, tous droits réservés

Our multi perspectives HMM-based approach partially answers some of theaforementioned research questions. First, we studied how to model sequences inorder to create new features. We compared solutions and chose the hidden markovmodel (HMM) described in section 5.2. Furthermore, we chose to use machinelearning algorithms whose decisions is reachable and partly interpretable: ran-dom forests allow the user to know on which features the prediction relies themost. Hidden Markov models also contains very few parameters. It enables acompression of the behaviours observed along with an easier understanding ofwhich behaviours are modelled.
Experiments conducted on a large real world credit card transaction dataset(46 million transactions from belgium card-holders between March and May 2015)have shown that the proposed HMM-based feature engineering allows for an in-crease in the detection of fraudulent transactions when combined with the stateof the art expert based feature engineering strategy for credit card fraud detec-tion. The proposed HMM-based feature engineering strategy shouldn’t replacethe transaction aggregation strategy since the best detection is achieved whencombining these feature engineering strategies.
26
Cette thèse est accessible à l'adresse : http://theses.insa-lyon.fr/publication/2019LYSEI110/these.pdf © [Y. Lucas], [2019], INSA de Lyon, tous droits réservés

Chapter 3
Related Work
In this chapter we will detail the state of the art in the fields of credit cardfraud detection and sequential anomaly detection. We will also describe thesolutions proposed to several problems inherent to credit card fraud detection.More precisely we will show how the research questions introduced in chapter 2are answered in the litterature.
• The approaches to answer skewed class distribution are split between databased strategies which aim to reduce class imbalance and model basedstrategies that aim to make the machine learning algorithm robust to classimbalance. They are presented in section 3.1.
• Different feature engineering, feature selection and feature creation not nec-essarily specific to credit card fraud detection are presented in section 3.2.
• Solutions for sequence modelling in the context of anomaly detection arepresented in section 3.3. However hidden Markov model aren’t describedthoroughly in this section since they are detailed in depth in chapter 5.
• The related work chapter ends with a description of dataset shift alongwith the approaches that exist in order to characterize it. Afterwards,several strategies to increase the robustness of machine learning classifiersto dataset shift are presented.
3.1 Learning to classify unbalanced datasets
Typical fraud detection tasks present a strong imbalance in the representations ofthe classes: there is usually a majority genuine class that outweighs the minorityfraudulent class [Ali et al., 2019].
27
Cette thèse est accessible à l'adresse : http://theses.insa-lyon.fr/publication/2019LYSEI110/these.pdf © [Y. Lucas], [2019], INSA de Lyon, tous droits réservés

Most learning algorithms are not adapted to a strong imbalance in the repre-sentations of classes in the dataset. Therefore, learning from unbalanced datasetis a challenging research question that needs to be considered([Batista et al.,2000]). [Weiss and Provost, 2001] and [Estabrooks et al., 2004] observed that anunbalanced dataset leads to a decrease in the performance of standard learning al-gorithms such as SVM or random forest. In fact, class imbalance have been shownto produce a negative effect on the performance of a wide variety of classifiers([Chawla, 2005]). [Japkowicz and Stephen, 2002] have shown that skewed classdistributions affects negatively the performance of decision trees and neural net-works. [Visa and Ralescu, 2005] drew the same conclusion for neural networks.[Kubat and Matwin, 1997], [Mani and Zhang, 2003] and [Batista et al., 2004]showed the weakness of k Nearest Neighbors algorithms to imbalanced datasets.[Yan et al., 2003] and [Wu and Chang, 2003] showed that SVM were also weakto skewed class distributions. Overall, most of the classifiers suffer from classimbalance, some more than others.
The strategies used to tackle this issue operate at two different levels: someaim to solve the imbalance of the dataset beforehand whereas others want toadapt the learning algorithm to make it robust to an unbalanced classificationtask ([Chawla et al., 2004], [Pozzolo, 2015]).
The data level strategies are called like that since they happen during thepreprocessing time, before any learning algorithm is applied. They consist inrebalancing the dataset in order to compensate the structural imbalance. Thealgorithmic level strategies involve methods where the algorithms are designedespecially to deal with an unbalanced task and methods where the classificationcosts of the algorithm are adapted in order to reflect the priorities of the unbal-anced classification task. The latter are called cost sensitive classifiers ([Elkan,2001]).
The sampling based solutions to handle imbalance will be described in section3.1.1. The model based methods will be briefly highlighted in section 3.1.3
3.1.1 Sampling methods
Sampling methods consist in reducing the class imbalance by changing the classeffectives in the dataset. In this section we will first present two naive methodsthat reduce class imbalance in the dataset by adjusting class ratios: undersam-pling and oversampling. Afterwards we will introduce the Synthetic MinorityOversampling Technique strategy (SMOTE) that aims to create new examples ofthe minority class [Chawla et al., 2002]. The different strategies are illustratedin figure 3.1.
28
Cette thèse est accessible à l'adresse : http://theses.insa-lyon.fr/publication/2019LYSEI110/these.pdf © [Y. Lucas], [2019], INSA de Lyon, tous droits réservés

Undersampling consists in rebalancing dataset by taking less examples fromthe majority class in order to match the effectives of the minority class ([Drum-mond and Holte, 2003]). The assumption made with undersampling is that themajority class contains redundant information that can be removed. The mainissue with undersampling is that, when the imbalance is too pronounced, toomany examples from the majority class need to be taken away. This may causea decrease in the performance of the algorithm due to a lack of data. It is worthmentioning that undersampling speeds up the learning phase, which makes it aninteresting choice when in presence of an unbalanced dataset.
Oversampling consists in rebalancing the dataset by repeating random ex-amples of the minority class ([Drummond and Holte, 2003]). The main issue ofoversampling is that repeating some examples doesn’t add information and maylead to an overfitting of the learning algorithms. Besides, oversampling increasesthe learning time since it makes the train-set artificially bigger.
In 2002, [Chawla et al., 2002] introduce SMOTE, a strategy to reduce classimbalance by creating new examples in the neighbourhood of the minority class.The creation of new minority class example is done by averaging neighboringexamples of the minority class. For categorical features, the averaging consistsin a majority voting for the category: the category mostly represented in theneighbourhood becomes the category of the corresponding categorical feature ofthe newly created example. They show an increase in the performance of classifierwhen using this rebalancing strategy. However SMOTE does not consider thelabel of neighboring examples when creating examples from the minority class.This can lead to an overlap between minority and majority classes. ADASYN[He et al., 2008] and Borderline-SMOTE [Han et al., 2005] tackle this issue bytaking into account only neighboring examples from the minority class.
3.1.2 Cost based method
The metrics obtained using the confusion matrix (see section 2.2.1) usually givesthe same weights to the true positive, false positive, true negative and false nega-tive. However, in presence of class imbalance, this can cause issue. For example,in the case where the negative class is representing 10% of the dataset and thepositive class 90% of the dataset, the confusion matrix of a very bad classifierwhich says that every example is positive without having any insight on the pat-terns representing the positive and negative classes would be the one shown intable 3.1. The corresponding accuracy would be: ACC = 90+0
90+10+0+0 = 0.9. Be-cause of the class imbalance, this very bad classifier is measured to predict thegood class 90% of the times even if it doesn’t contain valuable information.
29
Cette thèse est accessible à l'adresse : http://theses.insa-lyon.fr/publication/2019LYSEI110/these.pdf © [Y. Lucas], [2019], INSA de Lyon, tous droits réservés

Figure 3.1: Sampling strategy for unbalanced classification. (The + symbols refer to themajority class whereas the − symbols refer to the minority class. The symbols colored in red arenewly created symbols by the oversampling strategy or by the SMOTE strategy([Chawla et al.,2002]))
Table 3.1: 90/10 imbalance confusion matrix
predicted positive predicted negativeactual positive 90 0actual negative 10 0
In order to solve this issue, the misclassification costs of the false positives(FP) and false negatives (FN) can be used in order to replace the value of thefalse negatives and false positives in the confusion matrix with respect to theideal ratio of majority/minority examples. The majority
minority ratio would be equal tofalsenegativecostfalsepositivecost [Zadrozny et al., 2003]. The adjusted confusion matrices obtainedwhen testing models will therefore reflect correctly the importance of misclassi-fying a positive and a negative example.
3.1.3 Model based methods
We introduced in section 2.1.2 ensemble based methods since they are commonmethods for the credit card fraud detection application domain. Some solutionswere published in order to strenghten ensemble based methods when in presenceclass imbalance. EasyEnsemble ([Liu et al., 2009]), UnderBagging ([Wang et al.,2009]) and SMOTEboost ([Chawla et al., 2003]) are ensemble based method thatare adapted by design to skewed class distributions. SMOTEboost ([Chawlaet al., 2003]) combines boosting with SMOTE in order to provide balanceddatasets to each boosting weak learner. Similarly, EasyEnsemble ([Liu et al.,
30
Cette thèse est accessible à l'adresse : http://theses.insa-lyon.fr/publication/2019LYSEI110/these.pdf © [Y. Lucas], [2019], INSA de Lyon, tous droits réservés
2009]) use undersampling in order to create different balanced datasets for theboosting learners. In UnderBagging ([Wang et al., 2009]) undersampled datasetsare used to train several learners whose predictions are aggretated with bagging.
An other leverage for dealing with class imbalance is to adapt the metricsused to evaluate the models and the costs used to train some of them in order tocounterbalance class imbalance. Indeed, some real world imbalanced classifica-tion tasks such as credit card fraud detection give more importance to correctlyidentify the element of the minority class than those of the majority class. In thecase of cost sensitive learners, the misclassification cost can be adapted in order toreflect this priority. [Shirazi and Vasconcelos, 2010] present cost sensitive SVMs.[Kukar and Kononenko, 1998] introduced earlier the possibility of cost adaptationfor neural networks. Adapting the misclassification cost for imbalanced problemhas also been studied for boosting methods ([Sun et al., 2007], [Fan et al., 1999]).
In the end, there is a variety of methods to deal with class imbalance. Insection 4, different sampling methods are compared in order to find which one isthe more appropriate for our unbalanced credit card fraud detection problem.
3.2 Feature engineering for credit card fraud detec-tion
As stated in chapter 2, transactions are represented by vectors of continuous,categorical and binary features that characterize the card-holder, the transactionand the terminal. The card-holder is characterized by a unique card-holder ID,its age, its gender, etc. The transaction is characterized by variables like thedate-time, the amount and other confidential features. The terminal is charac-terized by a unique terminal-ID, a merchant category code, a country.
However, most learning algorithms can’t handle categorical features withouta preprocessing step in order to transform them into numerical features ([Kot-siantis, 2007]). In section 3.2.1 we will discuss the different solutions that wereconsidered in order to encode the categorical features. We will also present somepapers that describe feature selection methods and explain which features wechose to use for our credit card fraud detection task.
Also, credit card fraud detection can be improved by providing additionalinformation to the classifier. For example, the information usually containedin the features of the credit card transactions doesn’t reflect the history of thetransactions. In section 3.2.2 we will describe some state of the art solutionsin order to enhance the information contained in the credit card transaction by
31
Cette thèse est accessible à l'adresse : http://theses.insa-lyon.fr/publication/2019LYSEI110/these.pdf © [Y. Lucas], [2019], INSA de Lyon, tous droits réservés

creating new features.
3.2.1 Feature encoding and feature selection
Feature encoding
Several options are presented for encoding categorical features in the literature.The two most common options are label encoding and one-hot encoding ([Kot-siantis, 2007].
Label encoding is an encoding strategy where the categorical feature with ncategories is transformed into a numerical feature taking n different numericalvalues. The asset of label encoding is that it is light memory wise since youdon’t increase the shape of the dataset matrices. However, with label encodingthe categories become ordered after their transformation into numbers. This cancause issues for some classifiers like SVMs, neural networks or logistic regressionclassifiers that aim to calculate a distance between examples. On the other handtree based classifiers aren’t affected by the order of the categories due to labelencoding since their classification process consists in splitting the dataset (seesection 2.1.3).
One hot encoding is an encoding strategy where the categorical feature withn categories is transformed into n− 1 binary features describing the values ofthe categorical feature. This method is appropriate for distance based classifierssince it doesn’t order the categories: all of them are equidistant whereas withlabel encoding there are some categories that would be falsely considered closerthan others.
An other elegant solution that maintains an appropriate distance measurebetween categories of a categorical features is class embeddings. Moreover, it issignificantly less memory intensive than one-hot encoding. It consists in mappingthe different categories of a feature to a k dimensional space (with k � ncategories)and to adjust the mapping with a gradient descent process. [Guo and Berkhahn,2016] used embeddings as a way to encode categorical features in a supervisedway. The embeddings maps are equivalent to an extra layer of neurons on top ofthe pre one-hot encoded feature set. They are adapted to the classification taskthanks to a gradient descent process. Recently [Russac et al., 2018] (in collabo-ration with the chair of data science of the university of Passau) used Word2Vecembeddings in order to replace one-hot encoding for a distance based classifier(logistic regression) in a credit card fraud detection task.
[Carcillo et al., 2018] and [Pozzolo, 2015] showed that frequency encoding can
32
Cette thèse est accessible à l'adresse : http://theses.insa-lyon.fr/publication/2019LYSEI110/these.pdf © [Y. Lucas], [2019], INSA de Lyon, tous droits réservés

be useful in the case of an imbalanced classification task like credit card frauddetection. With frequency encoding, the value of the category is replaced by theratio MinorityClass
MajorityClass (the percentage of fraud in this category for our application).
Feature selection
Typical credit card transactions have a big number of attributes Some of the at-tributes like the city of the card-holder may be not meaningful for the classifiersor lead to overfitting issues because they present too many categories or are toosparse. Also, some features may contain the same information twice (for examplethe ZIP code contains the value of the county) or can be highly correlated likethe age of the card-holder and the mean amount of its transactions for example.
In this context, feature selection can be useful in order to purify the featureset, decrease the duplicates in informations and keep only relevant informationfor the machine learning task. Moreover, having a smaller number of featuresand less correlated features containing duplicate information thanks to featureselection would lead to a better understanding of the classifiers decision. Besides,feature selection may increase the speed of classifiers (smaller feature set anddatasets) and their performances (less overfitting) ([Bhattacharyya et al., 2011]).
[Noghani and Moattar, 2015] proposed an iterative approach for feature se-lection in a credit card fraud detection application. They add one by one thefeatures that improve the most the performance of a random forest classifier.
Leopold Fossi and Gabriele Gianini used the Shapley value [Shapley, 1953] inorder to do feature selection for credit card fraud detection [Fossi and Gianini,2019]. Shapley value reflects the contribution of a player to the team: a goodplayer may not add too much for a team because his strengths are already broughtby an other player whereas a not so good player may fulfill the needs of a teamand benefit more to it.
Feature selection may become mandatory when the data is enriched with alot of new informative features. [Fawcett and Provost, 1997] proposed to describethe evolution of relevant credit card fraud detection features for different hours ofthe day. They stated afterwards the need of a feature selection process in orderto decrease the total number of features.
Missing values strategies
Missing values is an oftentimes met issue in machine learning task [Kotsiantis,2007]. Some datasets may contain missing values, either because some informa-
33
Cette thèse est accessible à l'adresse : http://theses.insa-lyon.fr/publication/2019LYSEI110/these.pdf © [Y. Lucas], [2019], INSA de Lyon, tous droits réservés

tion wasn’t provided or because the values are structurally missing: for exampleinformations about internet browser used for the purchase may be available ine-commerce credit card transactions dataset but are missing for face-to-face trans-actions.
As stated by [Acuna and Rodriguez, 2004] there are 3 main approaches tosolve missing value issue:
• The most straightforward way to handle missing values is to delete them.One can choose to delete the rows containing the missing values if thesearen’t a too large part of the dataset. Besides, it is also possible to chooseto delete the features concerned if they are too sparse. It becomes a featureselection problem (see paragraph 3.2.1).
• One can also keep the rows containing missing values and fill the missingvalues with replacement values like the mean, the median, or a defaultcategorie (-9999 for a card-holder age for example). [Troyanskaya et al.,2001] compared these approaches in the context of DNA microarrays.
• Finally, a more costly and elegant solution can be to infer the missing valueof the using a model. [Hyunsoo et al., 2005] used k-nearest neighbors formissing value imputation for a genomics application. [Oba et al., 2003]chose to use bayesian principal component analysis for missing value im-putation also in a DNA microarrays dataset. [Stekhoven and Buhlmann,2011] proposed MissForest: a random forest approach for missing valueimputation that leverages the random feature choice for trees in order toestimate out-of-bag errors tree wise. Imputations methods are relative tothe particular problem: in presence of a highly categorical dataset, the usermay want to use tree based classifiers for missing value imputation, whereasprincipal component analysis is less computationally expensive and totallyreasonable for a numerical dataset.
In the end missing values is a very current issue in machine learning and thesolutions proposed to handle them are simple and efficient.
3.2.2 Feature creation for credit card fraud detection
[Bolton and Hand, 2002] highlighted the fact that even if the transactions containa lot of attributes, there is a need for creating new attributes in order to describebetter the transactions. They showed for example that a first time credit carduser may not have the same buying behaviour as a long time credit card user andadviced to create features to bring historical knowledge to the classifiers.
34
Cette thèse est accessible à l'adresse : http://theses.insa-lyon.fr/publication/2019LYSEI110/these.pdf © [Y. Lucas], [2019], INSA de Lyon, tous droits réservés

History based features
Several strategies have been explored in order to introduce history based infor-mation to the feature set.
Traditionally, the feature engineering for credit card fraud detection uses thefundamentals of RFM (Recency - Frequency - Monetary). Recency can be char-acterized by the time-delta feature reflecting the time elapsed between two con-secutive transactions, the Frequency can be characterized by the number of trans-actions in a period of time, and the Monetary aspect describes the amount spentby the card-holder. This RFM fundamentals are described in [Blattberg et al.,2008] and used as state of the art by [Vlasselaer et al., 2015], [de Fortuny et al.,2014].
[Fu et al., 2016] introduced a new feature called trading entropy that aimsto quantify: "How surprising is the recent amount of money spent for this card-holder with this type of merchant". The proportion of the i-th merchant type inthe last k transactions is pi:
pi =TotalAmountForMerchantTypei
TotalAmountOfLastKTransactions(3.1)
The feature proposed by [Fu et al., 2016] is the variation of entropy with theaddition of the incoming transactions to the amount history of the consideredcard-holder:
TradingEntropyT =K−1∑i=0
pi ∗ log(pi)−K∑i=1
pi ∗ log(pi) (3.2)
Earlier, [Bolton and Hand, 2001] adviced similarly to refer to the past trans-actions of the card-holder for outlier detection. Indeed, break point analysis aimsto quantify how much a global outlier raised is a real outlier for the consideredcard-holder.
[Whitrow et al., 2008] proposed a transaction aggregation strategy to cre-ate descriptive features containing information about the past behaviour of thecard-holder over a certain period of time. They showed a 28% increase in thedetection of fraudulent transactions by using these aggregated features with arandom forest as the learning algorithm.
The aggregations are calculated for a transaction based on the card-holderpreceding transactions. Given the incoming transaction xi, the previous transac-tions of the card-holder are selected with respect to particular features. The setof transactions Si selected is for example the transactions done with merchants
35
Cette thèse est accessible à l'adresse : http://theses.insa-lyon.fr/publication/2019LYSEI110/these.pdf © [Y. Lucas], [2019], INSA de Lyon, tous droits réservés
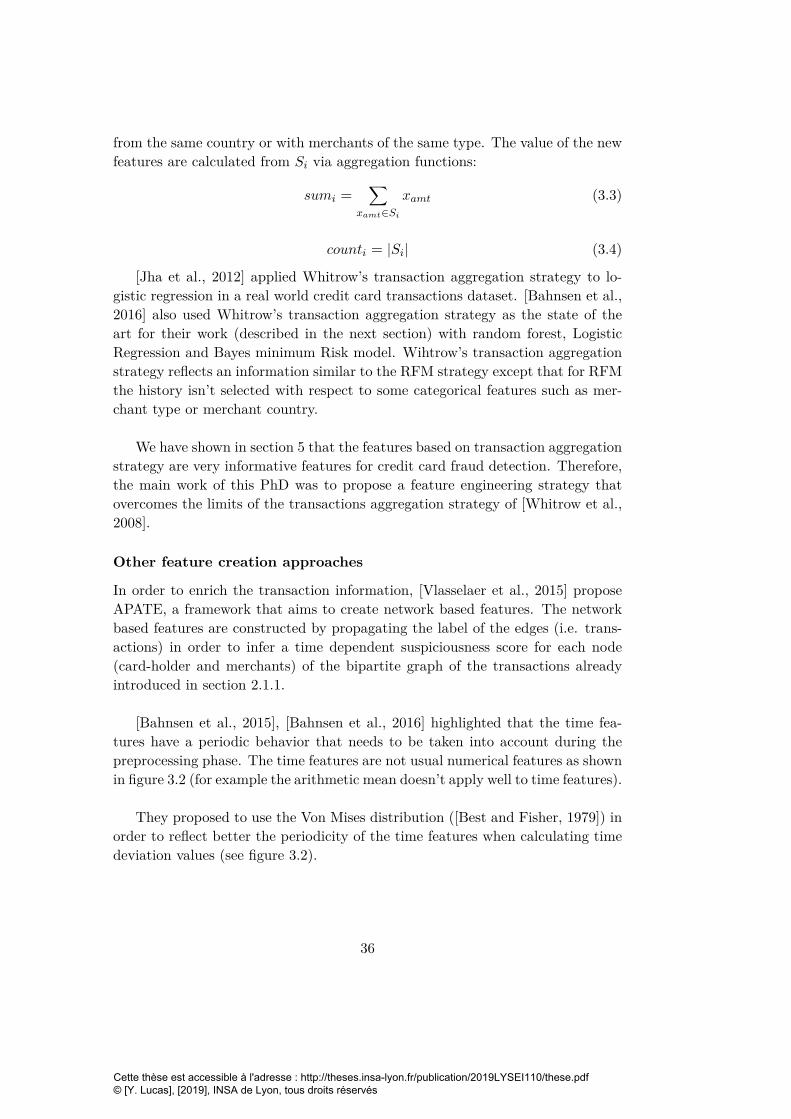
from the same country or with merchants of the same type. The value of the newfeatures are calculated from Si via aggregation functions:
sumi =∑
xamt∈Si
xamt (3.3)
counti = |Si| (3.4)
[Jha et al., 2012] applied Whitrow’s transaction aggregation strategy to lo-gistic regression in a real world credit card transactions dataset. [Bahnsen et al.,2016] also used Whitrow’s transaction aggregation strategy as the state of theart for their work (described in the next section) with random forest, LogisticRegression and Bayes minimum Risk model. Wihtrow’s transaction aggregationstrategy reflects an information similar to the RFM strategy except that for RFMthe history isn’t selected with respect to some categorical features such as mer-chant type or merchant country.
We have shown in section 5 that the features based on transaction aggregationstrategy are very informative features for credit card fraud detection. Therefore,the main work of this PhD was to propose a feature engineering strategy thatovercomes the limits of the transactions aggregation strategy of [Whitrow et al.,2008].
Other feature creation approaches
In order to enrich the transaction information, [Vlasselaer et al., 2015] proposeAPATE, a framework that aims to create network based features. The networkbased features are constructed by propagating the label of the edges (i.e. trans-actions) in order to infer a time dependent suspiciousness score for each node(card-holder and merchants) of the bipartite graph of the transactions alreadyintroduced in section 2.1.1.
[Bahnsen et al., 2015], [Bahnsen et al., 2016] highlighted that the time fea-tures have a periodic behavior that needs to be taken into account during thepreprocessing phase. The time features are not usual numerical features as shownin figure 3.2 (for example the arithmetic mean doesn’t apply well to time features).
They proposed to use the Von Mises distribution ([Best and Fisher, 1979]) inorder to reflect better the periodicity of the time features when calculating timedeviation values (see figure 3.2).
36
Cette thèse est accessible à l'adresse : http://theses.insa-lyon.fr/publication/2019LYSEI110/these.pdf © [Y. Lucas], [2019], INSA de Lyon, tous droits réservés

Uniform distribution Von Mises distribution
Figure 3.2: Time of the transaction on a 24h clock modeled with the uniform distribution(left) or the Von-Mises distribution (right). (from [Bahnsen et al., 2016])
3.3 Sequence modeling for anomaly detection
Sequence modelling is a major machine learning research question. In this sec-tion we will split the field with respect to two main approaches: the generativeapproach that aims to learn the joint distribution of the events in a sequencesand the discriminative approach that aims to find the labels of the events in asequence.
Afterwards, we will highlight how these approaches are integrated in anomalydetection tasks.
3.3.1 Sequence modelling
Graphical models
Hidden Markov models are generative models especially built for sequence mod-elling. They are briefly introduced here and described more in depth in section5.2.2
They comprise two matrices (see figure 3.3):
• The transition matrix describes the succession of the hidden states. Itreflects a multinomial distribution from all hidden states at time t to allhidden states at time t+ 1. The hidden states obey to the Markov property.Indeed, the hidden state at the time t+ 1 only depends on the hidden stateat the time t: There is no memory in the distribution of successive hidden
37
Cette thèse est accessible à l'adresse : http://theses.insa-lyon.fr/publication/2019LYSEI110/these.pdf © [Y. Lucas], [2019], INSA de Lyon, tous droits réservés

Figure 3.3: Hidden Markov model architecture. (from [Lucas et al., 2019a])
states, only conditional probability given the immediate previous hiddenstate. Formally, it means that conditional distributions between hiddenstates t in a sequence of size n can be simplified as following:
p(tk|tk−1, tk−2, .., t1,wk−1,wk−2,w1) = p(tk|tk−1) k ∈ {1, ..,n}
• The emission matrix describes the conditional distribution of the observedvariable wi given the hidden states ti. The probability distribution changeswith respect to the observed variable properties. For example it can beconsidered multinomial for categorical observed variables or gaussian forcontinuous observed variables.
The transition and emission conditional probability matrices of the hiddenMarkov models are usually initialized with a random value and optimized by aniterative Expectation-Maximisation algorithm known as the Baum-Welch algo-rithm ([Baum, 1972] [Rabiner and Juang, 1991]). Similarly to a training process,this optimisation process will adapt the transition and emission matrices in orderto reflect the distribution of a set of observed (training) sequences. EM optimiza-tion of a model with latent (hidden) parameters consists in:
expectation Finding the latent states distributions that correspond the mostto the sequences of observed data. This is usually done with the help of theViterbi algorithm which recursively leverages the Markov property in orderto simplify the calculations of the conditional probabilities (also referred toas forward-backward algorithm [Viterbi, 1967]).
maximisation Maximising the correspondence between the latent distributioninferred during the expectation step and the parameters of the transitionand emission matrices by adjusting the parameters.
The expectation and maximisation steps are repeated until convergence of thegraphical model to the observed data. The convergence can be monitored via theevolution of the likelihood that the set of observed sequences have been generated
38
Cette thèse est accessible à l'adresse : http://theses.insa-lyon.fr/publication/2019LYSEI110/these.pdf © [Y. Lucas], [2019], INSA de Lyon, tous droits réservés

by the model. This likelihood increases over the iterations until it reaches a ceil-ing when the hyper parameters ruling the architecture of the generative modeldon’t allow it to fit more to the set of observed sequences.
Even if HMMs are an elegant graph-based model, they present one drawback:their structure often doesn’t reflect the true process producing the observed data.This problem comes mostly from the Markov property: any relationship betweentwo non consecutive hidden states (y1 and y4 in figure 3.4 for example) mustbe communicated through the intermediate hidden states. A first-order Markovmodel like HMM (where p(yt) only depends on yt−1) is less able to capture theselonger term relationships.
Several architectures have been tried in order to overcome the modelling weak-nesses of HMMs: maximum entropy markov models ([McCallum et al., 2000]),input-output HMMs ([Bengio and Frasconi, 1995]), and conditional random fields([Lafferty et al., 2001]) (see figure 3.4). However, as represented by the directionsof the arrows in figure 3.4, all of these architectures are discriminant models thatrepresent the conditional distribution p(y|x) rather than p(x, y). Discriminantmodels are usually more efficient than generative model since the conditionaldistribution p(y|x) is simpler than the joint distribution p(x, y): the joint dis-tribution p(x, y) contains the conditional distribution 1. On the other hand, thejoint distribution also contains the information of the data distribution x. Onemay want to choose HMM especially for their ability to model all the data dis-tribution p(x, y) and not only the conditional distribution of the target variablep(y|x).
Recurrent neural network approaches
Recurrent neural networks (RNNs) are a class of artificial neural networks whereconnections between nodes form a directed graph along a temporal sequence.These connections allow to model temporal dynamic behaviors.
Recurrent neural networks can be considered as an hidden state based modelwhere the inner layers reproduce the hidden state based architectures. Further-more, the connectivity between consecutive hidden states (or nodes) also followsthe Markov property (p(yt) only depends on yt−1). RNNs are discriminant mod-els that aims to predict the label of an event given a past sequence of events.They are detailed extensively in [Graves, 2012].
According to [Bengio et al., 1994] Recurrent network is a powerful model1since p(x, y) = p(y|x) ∗ p(x)
39
Cette thèse est accessible à l'adresse : http://theses.insa-lyon.fr/publication/2019LYSEI110/these.pdf © [Y. Lucas], [2019], INSA de Lyon, tous droits réservés

Figure 3.4: Graphical model architectures. ((a) HMM, (b) maximum entropy markov model,(c) input-output HMM, (d) conditional random field) (from [Dietterich, 2002])
Figure 3.5: Stacking networks time-wise for backpropagation through time
that presents difficulties for training. In order to train a RNN, Backpropagationthrough time is often used (BPTT), however it causes vanishing and explodinggradient problem because BPTT consists in representing the network as a deepmulti layer network that stacks the initial RNN as many time as there are timesteps (see figure 3.5). The virtual network on which backpropagation is applied([Rumelhart et al., 1986]) becomes very deep.
[Mikolov et al., 2011] showed that one solution to exploding gradient can beto clip the elements of the gradient that exceed a fixed threshold.
[Hochreiter and Schmidhuber, 1997] highlighted that it is possible to overcomethe vanishing and exploding gradient problem with the introduction of memorycells. The network structure that includes memory cells is called Long Short-Term Memory Network [Bayer, 2015]. The LSTM were shown to be able to learnlong term dependencies in sequences with good success for sequential tasks suchas speech recognition ([Graves and Jaitly, 2014]
40
Cette thèse est accessible à l'adresse : http://theses.insa-lyon.fr/publication/2019LYSEI110/these.pdf © [Y. Lucas], [2019], INSA de Lyon, tous droits réservés

[Jurgovsky et al., 2018] compared LSTMs to tree based classifiers for a creditcard fraud detection task. They showed an increase in the detection of fraudulenttransactions by using sequential classifiers (even over the feature aggregationstrategy proposed by [Whitrow et al., 2008] for face-to-face transactions).
3.3.2 Sequence modelling for sequential anomaly detection
Sequential anomaly detection aims to raise an anomaly score for events, subse-quence of events or whole sequence with respect to a genuine distribution.
For sequential tasks, multiple definitions of anomalies exist that need to behandled differently ([Chandola et al., 2012]):
• An event of a sequence may be anomalous. For example, when a transactionis fraudulent within the sequence of transactions of a given card-holder.
• A subsequence may be anomalous. For example, if there is a delay betweenthe credit card theft and its reporting, the transactions issued with thecredit card are not made by the card-holder but by the fraudster and mustbe identified as anomalous.
• A sequence may be anomalous with respect to a set of non anomaloussequences. For example, a sentence in french will be anomalous in a set ofenglish sentences. Or given a database of protein sequences, some sequencesmay be anomalous.
One simple way to raise an anomaly score is counting the likelihood of theevent or fixed length window of events in the genuine set of events.
Li =#subsequence(i)#subsequences (3.5)
[Forrest et al., 1999] proposed the t-STIDE technique (treshold based sequencetime delay embedding) in order to raise anomaly scores for sequences. It consistsin computing the ratio of sliding windows that have a likelihood (see equation 3.5)below a certain treshold λ. The anomaly score of the test sequence is proportionalto the number of anomalous windows in the test sequence. The correspondingformula is:
ASq =|i : L(wi) < λ, 1 ≤ i ≤ t|
t(3.6)
This kind of window based counting can also be used as anomaly signal tocalculate a 2nd order anomaly score. For example, [Hofmeyr et al., 1998] proposedto compute the average of the strength of the anomaly signal over a set of windows
41
Cette thèse est accessible à l'adresse : http://theses.insa-lyon.fr/publication/2019LYSEI110/these.pdf © [Y. Lucas], [2019], INSA de Lyon, tous droits réservés

that cover the considered event or subsequence.
A(Sq) =1N
N∑i=1
A(wi) (3.7)
In addition to counting methods for calculating anomaly scores, machinelearning based models can also be used in order to raise these anomaly scores.
Hidden Markov models (HMMs) are the most used model in the field ofanomaly detection for discrete sequences according to [Chandola et al., 2012].[Gornitz et al., 2015] used HMMs in order to raise anomaly score for findinggenes in the genome of prokaryotes. [Rashid et al., 2016] used HMMs in orderto model genuine behaviour for the task of detecting malicious insiders in thesequence of logs.
[Srivastava et al., 2008] used multinomial HMMs in the context of credit cardfraud detection. They modelled the sequence of amount of users as a categoricalfeature with 3 values: "low amount" for the transactions with amounts less than50 e, "mid amount" for transactions with amounts between 50 and 200 e and"big amount" for transactions with amounts bigger than 200 e. The anomalyscore raised is the inverse of the likelihood of the recent amounts to have beengenerated by an HMM trained on a set of genuine sequences. They generated acredit card transactions dataset in order to assess the qualities of their strategies.[Dhok, 2012] used a similar approach for a real world credit card transactiondataset, and [Robinson and Aria, 2018] extended that with success for a prepaidcredit card fraud detection task.
[Dorj et al., 2013] also used HMMs in an anomaly detection task in electronicsystems, but they modelled an abnormal sequence in addition to a genuine se-quence. This is interesting since assessing the abnormality of outliers detecteddecreases the number of false positive. You not only raise outliers, but you alsoconfirm that these outliers belong to the abnormal class.
HMMs for sequential anomaly detection have mostly been used in order toraise an anomaly score using the likelihood of the sequence to have been generatedby the HMM. However, recurrent neural network (RNN) approaches and moreprecisely long short term memory networks were more varied. Similarly to theprecited HMM approaches, LSTM were used in order to raise anomaly scores by[Bontemps et al., 2016] for an intrusion detection task. The anomaly scores of awindow of events is the distance between this window of events and the windowof events that would have been generated by the LSTM for the correspondinguser. Since LSTM are discriminative models, a custom distance has been created
42
Cette thèse est accessible à l'adresse : http://theses.insa-lyon.fr/publication/2019LYSEI110/these.pdf © [Y. Lucas], [2019], INSA de Lyon, tous droits réservés
by the authors for this generative task. [Malhotra et al., 2015] modelled thegenuine distribution of sequence based dataset with LSTM in order to afterwardsraise an anomaly score for electrocardiograms, space shuttle valve time series andpower demand datasets. Alternatively, [Ergen et al., 2017] used LSTM to extendvarious length sequences in order to obtain sequences of equal length for raisingan anomaly score afterwards with the help of One Class SVM.
3.4 Dataset shift detection and adaptation
Many machine learning tasks make the assumpion that the random variables inthe data are i.i.d. (independent and identically distributed) among the train andthe test sets. That property ensures that the decision function learned by theclassifier on the train set is valid on the testing set. However in some case thei.i.d. hypothesis isn’t valid: there are changes in the data distribution betweenthe training and testing set. These changes of the data distribution can decreasedrastically the performances of the classifiers ([Pozzolo et al., 2014], [Abdallahet al., 2016], [Alaiz-Rodriguez and Japkowicz, 2008]) and need to be taken intoaccount.
The term "dataset shift" is used in order to include the phenomenons wherethe i.i.d. hypothesis isn’t valid. It is defined by [Moreno-Torres et al., 2012] as"cases where the joint distribution of inputs and outputs differs between trainingand test stage"
The two most frequent causes of dataset shift are non stationary environ-ments and sample selection bias. Sample selection bias refers to the fact thatthe training data is gathered differently from the data of the testing set. Forexample, data for a driving behaviour modelling task can be collected with thehelp of students that play a driving simulator game. This can cause a sampleselection bias because the context of acquisition of the training set (artificial driv-ing simulator) is different from the real life application (real life road safety task).
Non stationary environments can make the distribution of the data change.For example in the case of the bird sound recognition challenge of LIFECLEF[LifeCLEF, 2018], the dataset spans from January to June 2017: seasons mayaffect the patterns observed and the class distribution (i.e. bird species observed).Similarly, spatial changes may affect learning task.
43
Cette thèse est accessible à l'adresse : http://theses.insa-lyon.fr/publication/2019LYSEI110/these.pdf © [Y. Lucas], [2019], INSA de Lyon, tous droits réservés

3.4.1 Different types of dataset shift
Dataset shift is a broad word that refers to a change in the joint distribution ofthe target variable and the input features p(x, y). However, since p(x, y) =
p(y|x) ∗ p(x), the causes of the change in the joint distribution can be differ-ent. Several shifting phenomenon can be identified ([Moreno-Torres et al., 2012],[Storkey, 2009], [Gao et al., 2007], [Shimodaira, 2000]):
• Covariate shift is the type of shift that appears most often in the litera-ture. It was formerly called population drift. It refers to the phenomenonwhen the conditional distribution of the classes with respect to the trainingdata doesn’t change from the train set to the test set, but the distributionof the data do. For example in the credit card fraud detection settings,the phenomenon where the buying behaviors change over seasons but thefraudulent strategies don’t can be seen as covariate shift. It is formallydefined as:
ptrain(y|x) = ptest(y|x) and ptrain(x) 6= ptest(x) (3.8)
• Prior probability shift is an other subtype of dataset shift. It is also some-times called shifting priors. Prior probability shift refers to a change in theclass distributions: for example when the proportion of fraudulent transac-tions in the training set is way smaller than for the testing set. It may causea surrepresentation or an underrepresentation of one class in the predictionof machine learning classifiers. It is formally defined as:
ptrain(y|x) = ptest(y|x) and ptrain(y) 6= ptest(y) (3.9)
• Concept shift or more often concept drift refers to the phenomenon wherethe conditional distribution of the target classes with respect to the inputvariables changes. For example when fraudster adapt their strategies andthe classifier is not able to detect fraud efficiently anymore. It is formallydefined as:
ptrain(y|x) 6= ptest(y|x) and ptrain(x) = ptest(x) (3.10)
3.4.2 Detecting dataset shift
Most of the studies passively detect dataset shift when a decrease in classifiersperformance on the test set is witnessed([Pozzolo, 2015], [Gomes et al., 2017],...).In order to prevent the decrease of classifier performance, some teams aimed toestimate more realistically the expected performance of classifiers in presence ofdataset shift. For example, [Webb and Ting, 2005] pointed out the weaknessesof the ROC evaluation in presence of prior probability shift. Earlier, [Kelly et al.,
44
Cette thèse est accessible à l'adresse : http://theses.insa-lyon.fr/publication/2019LYSEI110/these.pdf © [Y. Lucas], [2019], INSA de Lyon, tous droits réservés

1999] stated that the weaknesses of classifiers in presence of covariate shift andprior probability shift can be highlighted with the decrease of classifiers perfor-mance for their loan risk prediction task. Additionaly, [Sugiyama et al., 2007]discussed the issues appearing when classifer performance expectation is set us-ing a cross validation hyperparameter optimization: cross validation expectationscan’t be trusted if the distribution changes between train and test set. They pro-posed a cost based approach by comparing the data distribution p(x) in the trainand test set and weighting more the data points of the train set that are similarto those of the test set for the cross validation optimization. If the data point istypical of the train and test distribution, then it is weighted more for the evalu-ation of the model.
[Karax et al., 2019] provided interesting results where they showed how to de-scribe in advance the concept shift in two dataset (Airlines and Sea 2) by lookingdirectly at the changes in the decision function through the changes of featureimportance in an adaptive random forest classifier (described in next paragraph)[Gomes et al., 2017]. They could therefore predict the direction of the datasetshift and the resulting change in the conditional distribution p(y|x). Earlier,[Lane and Brodley, 1998] tried to quantify the direction of drift on a continuousone dimensional axis by looking at which examples get misclassified when con-cept drift happens. An optimisation of the treshold value of their classifier wasmanaged in the decision process of their user identification for computer secu-rity task. Similarly, [Wang et al., 2003] wanted to precisely characterize conceptshift by comparing the class prediction between two classifiers trained before andafter a concept shift (old training data vs recent training data). The examplesthat present a conflict for class prediction can then be studied in order to under-stand which changes happen between the conditional distributions pold(y|x) andpnew(y|x)
3.4.3 Strategies in presence of dataset shift
Data based methods Dataset shift of various types may affect classifiers per-formance. [Alaiz-Rodriguez and Japkowicz, 2008] made the hypothesis that sim-ple classifiers are more robust to population drift (covariate shift) than complexclassifiers. They conclude the opposite: neural networks with 10 neurons in onehidden layer and C4.5 decision tree are more robust than linear regression andneural networks with 1 hidden neuron as hidden layer on an artificial medicaldataset stating the prognosis of patients infected with the flu.
Others authors preferred kernel approaches in order to handle dataset shift.2https://moa.cms.waikato.ac.nz/datasets/
45
Cette thèse est accessible à l'adresse : http://theses.insa-lyon.fr/publication/2019LYSEI110/these.pdf © [Y. Lucas], [2019], INSA de Lyon, tous droits réservés

[Gretton et al., 2009] used reproducing kernel hilbert spaces (RKHS) in orderto weight instances in the training set so that the averages of the training setfeatures correspond to those of the test set features. This kernel mean matchingapproach is mostly used in the context of covariate shift since it allows to makethe distribution of the data in the train and test set more similar. [Bickel et al.,2007] leveraged this kernel mean matching approach for data streams. They de-rived the kernel mean matching approach in order to integrate it in the logisticregression classifier used and to update it over time. They highlighted the diffi-culties of this integration for more complex classifiers. In addition to kernel meanmatching, [Klinkenberg, 2003] propose to train SVMs with an adaptive time win-dow in order to prevent covariate shift.
Similarly to the kernel mean matching approach, [Moreno-Torres et al., 2013]proposed a method in order to achieve transfer learning between different cancerdiagnosis datasets. They used genetic programming in order to create a regressorthat transforms the features of one dataset to the features of an other dataset inorder to be able to apply a pretrained classifier without adapting it.
Classifier based methods An other way to prevent concept drift is to updateregularly the models in order to adapt them to the dataset shift.
At first, sliding windows based approaches have been explored. The idea isthat by retraining them regularly using fresh data, the classifiers will stay up todate with dataset shift events. [Widmer and Kubat, 1996] used a sliding windowstrategy for their FLORA4 framework: they trained regularly new classifiers onrecent and trusted data but stored the bad performing ones for hypotheticallater usage. [Lichtenwalter and Chawla, 2009] also leveraged the sliding windowstrategy for imbalanced data streams with concept drift: they re-trained regularlyC4,5 decision trees classifiers in order to prevent covariate shift. Moreover, theyadapted the information gain calculation used when building the C4,5 trees (seesection 2.1.3) by incorporating the Hellinger distance in order to increase therobustness of the C4,5 trees to class imbalance and to prior probability shift. TheHellinger distance is a symmetric and non-negative measure of similarity betweentwo probability distributions. The equation 3.6 corresponds to the Hellingerdistance between two discrete probability distributions with equal effectives P =
(p1, ..., pk) and Q = (q1, ..., qk).[Pozzolo, 2015] proposed a sliding window method for data streams with de-
layed information on the same credit card transactions dataset used in this thesis(see figure 3.7). Since the ground truth for the class of credit card transactionsis delayed by a week in average, the label of the most recent transaction isn’tknown. They proposed to aggregate the predictions of a classifier on the old
46
Cette thèse est accessible à l'adresse : http://theses.insa-lyon.fr/publication/2019LYSEI110/these.pdf © [Y. Lucas], [2019], INSA de Lyon, tous droits réservés

dH(P ,Q) =√∑i∈V
(√P )−
√Q)2 (3.11)
Figure 3.6: Hellinger distance: mesure of distributional divergence between two probabilitydistributions P and Q
Figure 3.7: Aggregating ground truth examples with investigators feedbacks ([Pozzolo, 2015])
ground truth example with the predictions of a classifier trained on the feedbacksof the investigators on alerts raised previously by the fraud detection system.They showed that aggregating predictions provided better fraud detection thanpooling all the examples of the ground truth and investigators feedback together.
Instead of preventing dataset shift by constantly re-training the classifiers,one may want to retrain them only if they prove to be lackluster. [Kolter andMaloof, 2003] proposed to train again the classifiers when their performance drop.In order to prevent missclassification for data streams, [Hoens et al., 2011] usedHellinger distance on all the features of the dataset in order to detect early a co-variate shift and which features are affected by it. They would therefore be ableto know which trees of a random forest classifier will be affected by the datasetshift and need to be re-trained.
More recently, authors in [Gomes et al., 2017], [Barddal and Enembreck, 2019]proposed an autonomous architecture for random forest classifier introducing avariant to Hoeffding Adaptive Tree in order to include a drift detector insidedecision nodes to monitor the internal error rates of the tree, thus, continuouslyselecting features and building its predictive model over time. The HoeffdingAdaptive Trees (also called Very Fast Decision Trees) leverage the observationthat using only a subset of examples in order to build a decision tree is sufficient toobtain good prediction [Bifet and Gavalda, 2009]. This computationally efficientand memory efficient tree architecture is therefore an asset in dataset shift contextwhere models or parts of the models have to be retrained regularly.
47
Cette thèse est accessible à l'adresse : http://theses.insa-lyon.fr/publication/2019LYSEI110/these.pdf © [Y. Lucas], [2019], INSA de Lyon, tous droits réservés

Cette thèse est accessible à l'adresse : http://theses.insa-lyon.fr/publication/2019LYSEI110/these.pdf © [Y. Lucas], [2019], INSA de Lyon, tous droits réservés
Chapter 4
Dataset exploration
This work has been the opportunity to study a real world credit card transac-tions dataset containing all the transactions issued by belgian credit cards be-tween March and May 2015. Having access to this proprietary dataset is an assetin several ways: the evaluations done mirror the difficulties of credit card frauddetection observed by experts, the fraudulent patterns of the dataset reflect thefraudsters strategies identified, etc.
We introduced the challenges of credit card fraud detection, from both prac-tice and research point of views, and the solutions of the litterature to tacklethese challenges in respectively chapters 1, 2 and 3. The following chapter willbe the occasion to describe this belgian credit card transaction dataset:
• First, we study features correlations and features importances in the contextof a credit card fraud detection task for a feature selection process. Thegoal of this feature selection process is to have faster computations withoutlosing too much performances.
• Second, we introduce a method in order to quantify the temporal covariateshift in the dataset. Using this method, we show that the covariate shiftwithin the face-to-face transactions strictly follows calendar-based patterns.We tried to incorporate this contextual knowledge within a credit cardfraud detection task in a genuine way. This incorporation haven’t lead toa significant increase of credit card fraud detection. This work has beenpublished in [Lucas et al., 2019c].
49
Cette thèse est accessible à l'adresse : http://theses.insa-lyon.fr/publication/2019LYSEI110/these.pdf © [Y. Lucas], [2019], INSA de Lyon, tous droits réservés

4.1 Important features and correlated features
4.1.1 Transactional features
Features description
Throughout this work, we explore a dataset containing all the transactions is-sued by belgian credit card during between March and May 2015. The creditcard transactions contain 29 features. These features describe the card-holder,the merchant and the transaction that connects them in the bipartite graph oftransactions. For confidentiality reasons, we can not list all the transactions at-tributes of the proprietary dataset, but we list the most important ones for thisthesis.
The card-holder attributes are describing the card-holder or the card:
newPanID: A categorical ID identifying the card-holder. There are 3.5 millionsdifferent card-holder IDs.
AGE: This numerical feature refers to the age of the card-holder.
GENDER: This categorical feature refers to the gender of the card-holder.
CARD-EXPIRY: This ordinal feature is refering to the month of expirationof the credit card.
PROVINCE-CODE, DISTRICT-CODE, INS-CODE, ZIP, CITY: Thesecategorical features refer to the residence of the card-holder with variousdegree of precision.
CITY ⊂ ZIP ⊂ INSCODE ⊂ DISTRICTCODE ⊂ PROV INCECODE
COUNTRY: This categorical feature refers to the country of the card-holder.Unsurprisingly, more than 95% of the transactions are made by card-holderswho claim to be belgian.
The merchant attributes are:
TERM-MIDUID: A categorical ID identifying the merchant. There are 300000 merchants ID in the dataset.
TERM-MCC: This categorical feature refers to the merchant category code.
TERM-COUNTRY: This categorical feature refers to the country of the mer-chant. We observe that 60% of the fraudulent transactions are done withterminals from USA or great britain.
50
Cette thèse est accessible à l'adresse : http://theses.insa-lyon.fr/publication/2019LYSEI110/these.pdf © [Y. Lucas], [2019], INSA de Lyon, tous droits réservés

Finally, the transactions attributes are:
TX-AMOUNT: This numerical feature refers to the amount of the transac-tion. We observed that fraudulent transactions amounts have higher stan-dard deviation than genuine transactions amounts. However genuine andfraudulent transactions have a similar average amount (around 40e)
TX-DATETIME: This feature refers to the time of the transaction. Additionalfeature can be extracted from the time of the transaction like the hour ofthe day, the day of the week or the time elapsed between two consecutivetransactions (referred as ’time-delta’ in this work)
TX-ECOM: This binary feature tells if the transaction is a face-to-face or e-commerce transaction.
TX-3D-SECURE: This binary feature tells if the e-commerce transaction trig-gered a 3D-SECURE authentication process. It is equal to FALSE for allface-to-face transactions
TX-EMV: This binary feature tells if the face-to-face transaction triggered aPIN authentication. It is equal to FALSE for all e-commerce transactions.
CARD-AUTHENTICATION: This categorical feature refers to the authen-tication process triggered for the transaction.
TX-CARD-ENTRY-MODE: This categorical feature describes the interac-tion between the credit card and the terminal in a face-to-face transaction.
TX-FRAUD: This binary feature tells if the transaction is a fraudulent trans-action. There are 4 fraudulent transactions for 10.000 face-to-face transac-tions and 3 fraudulent transactions for 1000 e-commerce transactions (seetable 2.1).
Features correlation
Among the 29 features of the dataset, we can imagine that some features maycontain the dupicate informations. For example, the 5 features describing theresidence of the card-holder should be highly correlated.
We plotted the Pearson’s correlation for each pair of features (see figures 4.1and 4.2). The Pearson’s correlation between two features x and y is equal to:
ρx,y =cov(x, y)σxσy
51
Cette thèse est accessible à l'adresse : http://theses.insa-lyon.fr/publication/2019LYSEI110/these.pdf © [Y. Lucas], [2019], INSA de Lyon, tous droits réservés

with σx and σy the standard deviations of x and y and cov(x, y) the covarianceof x and y1. It takes values between -1 and 1 where 1 is total positive linearcorrelation, -1 is total negative linear correlation and 0 is no linear correlation.
Figure 4.1: Correlation matrix for the e-commerce transactions
Figure 4.2: Correlation matrix for the face-to-face transactions
1cov(x, y) = E[(x−E(x)) ∗ (y−E(y))]
52
Cette thèse est accessible à l'adresse : http://theses.insa-lyon.fr/publication/2019LYSEI110/these.pdf © [Y. Lucas], [2019], INSA de Lyon, tous droits réservés

We can observe in the correlation matrices (see figures 4.1 and 4.2) that:
• Indeed, features related to the residence of the card-holder are correlatedwith each other.
• CARD-ENTRY-MODE and TX-ECOM-IND are highly correlated witheach other. Indeed, these features describe respectively the face-to-faceand the e-commerce transactions and contain a default value for respec-tively e-commerce and face-to-face transactions.
• TERM-COUNTRY and TX-INTL are unsurprisingly correlated: since mostof the card-holders live in belgium, when TERM-COUNTRY isn’t belgium,then TX-INTL has good chance to be equal to TRUE.
• CARD-AUTHENTICATION, CARD-ENTRY-MODE, TX-ECOM-IND, TX-EMV and TX-3D-SECURE all describe the authentication process used bythe card-holder either in e-commerce or face-to-face context and are there-fore correlated with each other.
We observed in this correlation study that some group of features containsimilar informations. These correlations may be leveraged in a feature selectionprocess.
4.1.2 Feature importances and classifiers comparison
Feature importances for tree based classifiers
Information about the importance of each features for the classification can beobtained from classifiers. These feature importances can be calculated in severalways:
Mean decrease in accuracy: Also called permutation importance, this mea-sure is classifier agnostic. It consists in randomly permutting the values ofa feature and measuring the decrease in accuracy before and after randompermutation of the feature values.
Mean decrease in impurity: Also called Gini importance, this measure is spe-cific to tree-based classifiers. For a given node, it is defined as the total de-crease in Gini impurity weighted by the probability of reaching that node,which is approximated by the proportion of samples reaching that nodeaveraged over all trees of the ensemble. At each split in each tree, the im-provement in the split-criterion is attributed to the splitting variable and isaccumulated over all the split of all the trees in the forest. The Gini impu-rity is the probability of incorrectly classifying an element of the dataset if
53
Cette thèse est accessible à l'adresse : http://theses.insa-lyon.fr/publication/2019LYSEI110/these.pdf © [Y. Lucas], [2019], INSA de Lyon, tous droits réservés

it were randomly labeled according to the class distribution in the dataset.It is calculated as:
Gini =n∑i=1
classp(i) ∗ (1− p(i))
In this work we used the Gini importance as it is the one calculated in thescikit-learn library. We calculated the feature importance of a random forestclassifier for the task of detecting fraudulent e-commerce and face-to-face trans-actions (see figures 4.3 and 4.4). The hyperparameters of the random forests arethe default ones: 5 features per tree, 100 trees and no tree pruning.
Figure 4.3: Feature importance of a random forest classifier for face-to-face transactions
• The first observation to make is that the amount of the transaction is akey feature for fraud detection. It is the most important feature for bothface-to-face and e-commerce fraud detection.
• The second most important group of features is the card-holder identifierssuch as newPanID, AGE, residence based features (CITY, INSCODE,...)and CARD-EXPIRY. This observation is valid for e-commerce and face-to-face transactions.
• The features describing the transaction properties (TX-LOCAL-CURRENCY,TX-EMV, CARD-TRAVEL-KEY,..) are shown to have smaller impor-tance.
54
Cette thèse est accessible à l'adresse : http://theses.insa-lyon.fr/publication/2019LYSEI110/these.pdf © [Y. Lucas], [2019], INSA de Lyon, tous droits réservés

Figure 4.4: Feature importance of a random forest classifier for e-commerce transactions
Overall, there is a big discrepancy in feature importance among the featuresof the belgian credit card transactions dataset. In the next section, we will tryto leverage this discrepancy for feature selection.
Classifiers & feature sets comparison
The transactions of the belgian credit card transactions dataset contain a varietyof attributes. A big number of features slows down classifiers: The complexity ofrandom forest or gradient boosting training for example is linear with the numberof features.
Moreover, we observed in the previous sections that some features are corre-lated with each other: the information of these features is partly reproduced andcontained in several features.
We assumed that a smaller feature set would increase the training speedwithout hindering too much the classifiation efficiency. In order to test that, weconstructed a smaller feature set without weaker features or features containingduplicate information.
The feature set containing all the feature is referred to as the "raw" feature set.Additionnaly, we created a "refined" smaller feature set. The features containedin the "refined" feature set are presented in table 4.1.
We compared the computation times and the detection efficiencies with the
55
Cette thèse est accessible à l'adresse : http://theses.insa-lyon.fr/publication/2019LYSEI110/these.pdf © [Y. Lucas], [2019], INSA de Lyon, tous droits réservés

Card holder Transaction Terminalage, gender, broker,card-expiry, city
authentication, card en-try mode, time, amount,e-commerce type, PINcheck
merchant country, mer-chant category
Table 4.1: Refined feature set
"raw" feature set and with the "refined" feature set for e-commerce and face-to-face fraud detection using two classifiers: Adaboost and random forest. Theexperiments were done using the aforementioned Spring 2015 belgian credit cardtransactions dataset.
The hyperparameters ranges for Adaboost and random forest grid searchesare presented in table 4.2 and 4.3.
n-trees n-features min-samples-leaf max depth{300} {1, 7, 13} {1, 20, 40} {4,None}
Table 4.2: Random forest grid searchtree numbers learning rate tolerance for stopping max tree depth{100, 400} {0.1, 1, 100} {10, 100} {1, 4}
Table 4.3: Adaboost grid search
The training, testing and evaluation set were split temporally as shown intable 4.4. The reasoning behind the gap of one week was that in the real worldfraud detection systems, human investigators have to manually verify the alertsgenerated by the classifiers. Since this process takes time, the ground truth isdelayed by about one week.
Start Date End DateTraining Set 01.03.2015 26.04.2015Validation Set 27.04.2015 30.04.2015Week gap 01.05.2015 07.05.2015Testing Set 08.05.2015 31.05.2015
Table 4.4: Dataset splitting
We observe on table 4.5 that refining the feature set allows for a faster trainingtime at the cost of prediction efficiency. More precisely, the classifier efficiencymeasured with the ROC-AUC decreases to a maximum of 9% but this diminutionof detection is accompanied by a diminution of computation time of up to 55%.
56
Cette thèse est accessible à l'adresse : http://theses.insa-lyon.fr/publication/2019LYSEI110/these.pdf © [Y. Lucas], [2019], INSA de Lyon, tous droits réservés

e-commerce face-to-faceROC-AUC computation
timeROC-AUC computation
timerandom forest raw 0.79 2367s 0.85 2530s
refined 0.72 1739s 0.79 1811sAdaboost raw 0.80 11660s 0.88 13228s
refined 0.74 5178s 0.84 6027s
Table 4.5: Comparison of prediction efficiency for ’raw’ and ’refined’ feature sets
Throughout this work, for faster computation time, we used the refined featureset as base feature set.
4.1.3 Comparison of sampling strategy to reduce class imbalance
Evaluation of sampling methods for our application
We tried differents sampling methods and parameters in order to determine whichwas most adapted for our credit card fraud detection task. For practical reasonssince it increases the learning time and the risk of overfitting, we chose to not tryoversampling.
We compared the value of pk100 for different strategies or parameters forthe detection of fraudulent transactions in 15 consecutive testing days using arandom forest algorithm. Pk100 (precision at 100) is a business metric used inproduction that counts the number of fraud in the first 100 alerts raised by thelearning algorithm.
We started by trying different minority/majority class ratios for undersam-pling. The reasoning was that with the particularly big class imbalance presentin our application, rebalancing the classes to 50/50 with undersampling woulddelete too much examples from the majority class and therefore decrease signifi-cantly the amount of information in the remaining majority class examples.
Throughout this section, the classifiers used in order to evaluate the reper-cussions of the sampling methods are random forest classifiers with the followingparameters:
• n-trees=300
• n-features per tree=7
• depth = maximum depth
57
Cette thèse est accessible à l'adresse : http://theses.insa-lyon.fr/publication/2019LYSEI110/these.pdf © [Y. Lucas], [2019], INSA de Lyon, tous droits réservés

We observed in figure 4.5 that when we decreased too much the class imbal-ance the average performance over days of the classifier decreased: We assumedthat the number of majority class examples became too small to provide enoughinformation for the learning algorithm to generalize the majority class distribu-tion.
Figure 4.5: Fraud detection performance over days for different degree of undersampling. (Thenumbers 80/20, 75/25, 66/33 and 50/50 refers to the class ratio after undersampling.)
Afterwards, we tried the SMOTE strategy ([Chawla et al., 2002], highlightedin figure 3.1) and observed in figure 4.6 that the predictions with the SMOTEstrategy (in blue) were comparable, if not below, the predictions with a basic80/20 undersampling strategy (in red). SMOTE is an elegant strategy in orderto deal with an unbalanced dataset, although for our application it seemed to notbe the best solution and to not be worth the effort.
Finally, in most of the experiments presented in this PhD thesis, the rebal-ancing technique chosen is undersampling with a final ratio of 90/10 for themajority/minority effectives. We wanted to decrease the class imbalance in thedataset without taking away too many majority class examples.
58
Cette thèse est accessible à l'adresse : http://theses.insa-lyon.fr/publication/2019LYSEI110/these.pdf © [Y. Lucas], [2019], INSA de Lyon, tous droits réservés

Figure 4.6: Fraud detection performance over days for SMOTE (in blue) and undersampling80/20 (in red).
4.1.4 Sequential dataset
Transaction sequences
Credit card transactions datasets are sequentials datasets. The credit card trans-actions can be grouped by the card used for the transaction or by the seller of aparticular transaction. Therefore the sequence of transactions from card-holdersor terminals can be studied with the hope to find patterns characterizing a gen-uine or a fraudulent behaviour.
We could observe on the feature importance graph (see figures 4.4 and 4.3)that the features identifying the seller (TERM-MIDUID) are very relevant forcredit card fraud detection. Modelling the sequences of transactions from thebuyer and the seller is an asset for credit card fraud detection.
Moreover, the timing of the transactions is very important for detecting fraud-ulent transactions. Unsurprisingly, we observe on figure 4.7 2 that the face-to-facetransactions occuring between 11 p.m. and 6 a.m. account for around 5% of thetransactions (the shop are supposed to be closed) and for more than 40% of thefraudulent transactions.
2black bars on the figure (scale on the left) refer to the percentage of transactions in thiscategory, blue bars on the figures (scale on the left too) refer to the percentage of fraudulenttransactions in this category, red bars on the figures (scale on the right) refers to the ratio offraudulent transactions for each category, each hour in this figure.
59
Cette thèse est accessible à l'adresse : http://theses.insa-lyon.fr/publication/2019LYSEI110/these.pdf © [Y. Lucas], [2019], INSA de Lyon, tous droits réservés

0 1 2 3 4 5 6 7 8 9 10 11 12 13 14 15 16 17 18 19 20 21 22 23hour
0.00
0.01
0.02
0.03
0.04
0.05
0.06
0.07
0.08
0.09
P(h
our)
and P
(hour
| FR
AU
D)
112360
114590
P(hour), P(FRAUD | hour) and P(hour | FRAUD)
P(hour)
P(FRAUD | hour)
P(hour | FRAUD)
0.000
0.001
0.002
0.003
0.004
0.005
0.006
0.007
P(F
RA
UD
| h
our)
301
299
268
335
390
326
254
402
433
494
Figure 4.7: Categorical correlation between the time feature and the class of face-to-facetransactions
Sequential patterns
By studying the lengths of the sequences in the dataset we could show that the 3.5millions card-holder sequences average 13.5 transactions per sequence with sig-nificant variations: the longest sequences almost reach 104 transactions. Amongthese card holder sequences, 12853 contains the 84502 fraudulent transactions ofthe dataset.
Figure 4.8 shows an histogram of the time elapsed between the first and thelast fraudulent transactions of the card holder sequences that contain at least afraud. We observe on the most left bar that around 3200 card holders have afraudulent sequence duration of 0s: these are card holder with only 1 fraudulenttransaction in their sequences of transactions, the first fraudulent transaction isalso the last. By cumulating bar effectives, we also observe that more than 90%of the fraudulent sequences last 28 hours or less (100 000s). The majority of thefraudulent sequences contain fraudulent transactions appearing within one day.
60
Cette thèse est accessible à l'adresse : http://theses.insa-lyon.fr/publication/2019LYSEI110/these.pdf © [Y. Lucas], [2019], INSA de Lyon, tous droits réservés

0 1 10 100(≈0.03h)
1000(≈0.28h)
10000(≈2.78h)
100000(≈27.78h)
1000000(≈11.57d)
3000000(≈34.72d)
Time Span [s]
0
500
1000
1500
2000
2500
3000
3500
4000
4500
Num
ber
of
fraudule
nt
Acc
ounts
Total Time between First and Last Fraud
Figure 4.8: Time elapsed between first and last fraudulent transaction for each fraudulentaccounts
The sequential aspect of credit card transactions dataset is crucial from bothbuyers and sellers perspectives for efficient credit card fraud detection. Seeing thecredit card transaction dataset as a sequential dataset and identifiying previouslyobserved patterns is a strong asset for credit card fraud detection.
4.2 Covariate shift quantification for credit card frauddetection
We proposed a covariate shift (change in p(x, y)) detection protocol that we usedin order to characterize the covariate shift in our credit card transactions dataset.
Briefly we aim to build a distance matrix between subparts of the dataset(days in our case) by trying to predict them against each other. For example, inorder to raise a similarity value for a pair of days of our dataset, we evaluate theperformance (with Matthews correlation coefficient) of a random forest classifierfor detecting from which of the days the testing transaction comes from. If theperformance of the random forest classifier is good that means that the transac-tions from the two days are easy to differenciate, these two days present differentbuying behaviours. One the other hand if the classifier is bad, that means thatthe two days present similar transactions. The distance matrix obtain after hav-ing compared each pair of day can then be used for clustering the part of thedataset that present a similar buying behaviour.
In this section, we present a method to quantify the day-by-day covariateshift within the face-to-face credit card transactions dataset. In practice, we aim
61
Cette thèse est accessible à l'adresse : http://theses.insa-lyon.fr/publication/2019LYSEI110/these.pdf © [Y. Lucas], [2019], INSA de Lyon, tous droits réservés

to differenciate the days of the dataset by trying to guess the origin day of eachtransaction and measuring the efficiency of the classification. The more efficientthe classification, the more different the buying behaviour between two days, andvice versa. Therefore, we obtained a distance matrix characterizing the covariateshift.
4.2.1 Building a distance matrix between days
We aimed to use a distance matrix in order to quantify the possible covariateshift happening over the 92 days of the dataset.
For this purpose we built and evaluated learners that try to tell from whichday of the considered pair of days each transaction belongs. If the learner achievedto detect the day of the testing set transactions, it means that the transactionsfrom each of the two days considered were easy to differentiate. We assumed thatthese two days are following two different probability distributions: there was acovariate shift between these two days. On the other hand, if the two days werehard to differenciate, this means that their transactions are similar: there was nocovariate shift between these days.
For each pair of days, a random forest classifier was trained using 20000 trans-actions from each day (40000 in total) in order to detect the day of each trans-action. Afterwards, this random forest classifier was asked to classify a test setcontaining 5000 transactions from each day (10000 in total). We chose to importthe same number of transactions from each days even if some days contain moretransactions than others (approximately between 300 000 and 800 000 per day intotal) instead of importing a number of transactions proportional to the numberof transactions within the considered day. Therefore the model prediction isn’taffected by the class effectives but only by the buying behaviours within each day.
The classification was evaluated using the Matthews correlation coefficient(MCC). As mentioned in section 2.2, the Matthews correlation coefficient is aconfusion matrix based metric that can take values between -1 and 1. A valueof MCC close to 1 means that the classifier is good at differenciating the pair ofdays considered, the days are easy to differenciate since there is a covariate shiftbetween them. A value of MCC close to 0 means that the classifier isn’t able todifferenciate the transactions of the pair of days considered. In this particularclassification task, it would not make sense that the classifier have a value ofMCC close to -1. It would mean that the classifier is predicting the oppositebetween training and testing set.
62
Cette thèse est accessible à l'adresse : http://theses.insa-lyon.fr/publication/2019LYSEI110/these.pdf © [Y. Lucas], [2019], INSA de Lyon, tous droits réservés

MCC =TP × TN − FP × FN√
(TP + FP )(TP + FN)(TN + FP )(TN + FN)
In the end, this MCC value was used in order to train and evaluate 92 ∗ 91/2classifiers in order to build a 92x92 distance matrix characterizing the covariateshift between the 92 days of the dataset. Figure 4.9 shows a zoomed view of thedistance matrix centered on the covariate shift within the days from 01.03.2015 to03.04.2015. The full view of the distance matrix on the whole dataset timespanis included on the next page.
Figure 4.9: Zoomed distance matrix (covariate shift) for the face-to-face transactions. (centilebased coloration: green ⇔ similar days (MCC≈0), red ⇔ dataset shift (MCC≈1)).
63
Cette thèse est accessible à l'adresse : http://theses.insa-lyon.fr/publication/2019LYSEI110/these.pdf © [Y. Lucas], [2019], INSA de Lyon, tous droits réservés

100
time (day)
time (day)
01.03.2015
01.03.2015
31.05.2015
31.05.2015
Cette thèse est accessible à l'adresse : http://theses.insa-lyon.fr/publication/2019LYSEI110/these.pdf © [Y. Lucas], [2019], INSA de Lyon, tous droits réservés

4.2.2 Agglomerative clustering using the distance matrix be-tween days
Regularities can be observed in the covariate shift (see figure 4.9 in appendix).With genuine visual identification, 4 clusters of days that are similar to each otherand dissimilar to other days can be spotted. We could correlate these clusterswith calendar event (Dataset of belgian transactions):
• Working days: During these days, people are working and merchants aremostly open.
• Saturdays: During these days, people are not working and merchants aremostly open.
• Sundays: During these days, people are not working and merchants aremostly closed. We observe that some religious holidays (catholic) seem toshare the same dataset shift (1st may: labor Day, 14th may: Ascent and25th may: Pentecost).
• School holidays: During these days, people are working and the mer-chants are mostly open but the children are not at school. Some parentstake holidays to look after their children or travel with them.
This clustering is based on a qualitative observation of the distance matrixbetween days (figure 4.9 in appendix) and may be biased: the patterns visuallyidentified may have been inferred because we had preconceptions about the typeof days in the dataset. Therefore, we performed a hierarchical clustering on thedistance matrix.
The dendrogram created with agglomerative clustering can be cut at differentlevels. These levels correspond to different number of clusters. In figure 4.10 weobserve that the drop of the average intercluster distance sharply decreases after5 clusters. This information would guide the decision towards a 5 clusters daymodeling. However, since 4 cluster isn’t completely irrelevant (big interclusterdistance decrease between 3 and 4 cluster), and since we observed with the previ-ous qualitative clustering that 4 clusters match well the calendar particularities,we chose to differentiate the days in 4 clusters using hierarchical clustering (seefigure 4.6).
65
Cette thèse est accessible à l'adresse : http://theses.insa-lyon.fr/publication/2019LYSEI110/these.pdf © [Y. Lucas], [2019], INSA de Lyon, tous droits réservés

0 20 40 60 80number of clusters
0.2
0.3
0.4
0.5
0.6
0.7
0.8
0.9
inte
rclu
ster
dist
ance
Figure 4.10: Diminution of the average inter-cluster distance with the increase of the numberof clusters
The output of the hierarchical clustering is shown in table 4.6. The 4 clustersmatched almost perfectly the calendar-based clusters previously identified.
0: Week days (working days)
1: Sundays and work holidays (Ascent, monday Pentecost and Labor day): shopsare closed
2: Saturdays and most of the Fridays : days of the end of the week where shopsare open
3: Week days of eastern school holidays
• Surprisingly, 9 Fridays out of the 12 non holiday Fridays are clustered withSaturdays (cluster 2). We expected initially the Fridays to be clusteredwith the rest of the working days (cluster 0)
• Among the 42 days identified as working days of the middle of the week(cluster 0), 95% follow the pre-identified pattern: 2 of them are Fridayswhich are supposed to be in the cluster 2. Moreover, 2 working days adja-cent to holidays where shops are closed (cluster 1) are clustered with Fridaysand Saturdays (2) instead of working days ( 0)
31st may: Labor day414th may: Ascent525th may: Pentecost
66
Cette thèse est accessible à l'adresse : http://theses.insa-lyon.fr/publication/2019LYSEI110/these.pdf © [Y. Lucas], [2019], INSA de Lyon, tous droits réservés

Week MON TUE WED THU FRI SAT SUN9 110 0 0 0 0 0 2 111 0 0 0 0 2 2 112 0 0 0 0 2 2 113 0 0 0 0 2 2 114 0 0 0 0 2 2 115 1 3 3 3 3 2 116 3 3 3 3 2 2 117 0 0 0 0 0 2 118 0 0 0 2 1 3 2 119 0 0 0 0 2 2 120 0 0 2 14 2 2 121 0 0 0 0 2 2 122 15 0 0 0 2 2 1
Table 4.6: Agglomerative clustering of the days using the distance matrix obtained by classi-fying each day against every other day
• Among the 18 days identified as holidays (cluster 1), 17 are effectivelyholidays. Unexpectedly, the first Monday of spring holidays (week 15) isclustered with holidays.
• The days of the eastern school holidays pre-identified pattern are success-fully clustered together by the hierarchical clustering algorithm in the clus-ter 3.
In the end we observed that clustering the days of the dataset using the covari-ate shift distance matrix, be it visually or with hierarchical clustering, outputssimilar results. Indeed, the clustering patterns discovered match almost perfectlythe event identified in the belgian calendar.
4.2.3 Incorporation of dataset shift knowledge
In order to leverage the knowledge of the covariate shift between days, we incor-porate it as a new categorical feature with one modality for each identified cluster.
We repeated 5 times an experimental protocol where the face-to-face trans-actions from 7 consecutive days were used as a train set and the face-to-facetransactions from 7 consecutive days with a gap of 7 days after the train setwere used as a test set. We evaluated the addition of the dataset shift featureby computing the Precision-Recall AUC and the ROC AUC for random forest
67
Cette thèse est accessible à l'adresse : http://theses.insa-lyon.fr/publication/2019LYSEI110/these.pdf © [Y. Lucas], [2019], INSA de Lyon, tous droits réservés

PR AUC ROC AUCtest set without with without with
16/03-22/03 (week 12) 0.190 0.175 0.964 0.96123/03-29/03 (week 13) 0.288 0.303 0.969 0.97330/03-05/04 (week 14) 0.131 0.142 0.939 0.94506/04-12/04 (week 15) 0.256 0.273 0.914 0.92713/04-19/04 (week 16) 0.131 0.126 0.946 0.940
average 0.199 0.204 0.946 0.949
Table 4.7: AUC variations with the addition of the covariate shift feature for different testingperiods
classifiers with and without the dataset shift feature.
We chose to separate the time period corresponding to the training and val-idation set and the time period corresponding to the testing set with a gap of 7days.
The random forest hyperparameters are described in table 4.8. The samehyperparameters were used for the construction of the distance matrix betweendays.
n-trees n-features min-samples-leaf100 sqrt 10
Table 4.8: Random forest hyperparameters
We observed in table 4.7 that adding the covariate shift information as a newfeature for the classification increased the precision-recall AUC by 2.5%. TheROC AUC was also slightly increased. However the increase observed is weakand not consistent over weeks. Besides, we don’t seem to observe any correlationbetween the calendar events and the increase/decrease observed: It is not clearthat for example, testing set belonging to the eastern holidays (week 15 and 16)are less sensitive to the addition of covariate shift information as a new feature.
Moreover, this improvement may partly have been a consequence of the weakfeature set used and may have disappeared when using stronger feature engineer-ing strategies such as feature aggregation [Bahnsen et al., 2016][Whitrow et al.,2008] or sequence modelling with hidden Markov Models [Lucas et al., 2019a] orrecurrent neural networks [Jurgovsky et al., 2018].
68
Cette thèse est accessible à l'adresse : http://theses.insa-lyon.fr/publication/2019LYSEI110/these.pdf © [Y. Lucas], [2019], INSA de Lyon, tous droits réservés

4.2.4 Conclusion
In this section we proposed a strategy to quantify the covariate shift in a temporaldataset. This strategy consists in classifying the transactions of each day againstevery other days: if the classification is efficient then the days are different andthere is a covariate shift between them. On the other hand, if the classificationis not efficient, the days are similar. This strategy allows us to build a distancematrix characterizing the covariate shift between days.
Afterwards, we used an agglomerative clustering algorithm on the distancematrix between days. We showed that in the case of the belgian face-to-face creditcard transactions the dataset shift matches almost exactly the calendar events.We identify 4 types of days in the credit card transactions dataset: ’workingdays’, ’saturdays’, ’sundays’ and ’school holiday’.
Using a random forest classifier, we showed that integrating the informationof the type of the day previously identified increases the Precision-Recall AUCby a small percentage (2.5%).
4.3 Summary
In this chapter, we started by studying the attributes of credit cards transactionswith leverages such as covariance matrix and random forest feature importancevectors. Using these studies, we could create a refined feature set that would leadto faster computation time and memory efficiency at the cost of a bit of frauddetection efficiency. The refined feature set is shown in table 4.1.
We also tried different solutions for reducing class imbalance: SMOTE andundersampling along with different values of target class ratio. We chose to avoidoversampling because it increases computation time along with overfitting risks.We settled on undersampling the majority class up to a target class ratio of 90:10after having observed that decreasing too much the class imbalance leads to thedeletion of too many examples in the dataset.
We finished this chapter by presenting a study of the covariate shift withinthe face-to-face transactions. We could identify covariate shift patterns matchingcalendar events. We tried to integrate this covariate shift knowledge in the creditcard fraud detection process and observed a slight increase in precision-recallAUC.
69
Cette thèse est accessible à l'adresse : http://theses.insa-lyon.fr/publication/2019LYSEI110/these.pdf © [Y. Lucas], [2019], INSA de Lyon, tous droits réservés

Cette thèse est accessible à l'adresse : http://theses.insa-lyon.fr/publication/2019LYSEI110/these.pdf © [Y. Lucas], [2019], INSA de Lyon, tous droits réservés

Chapter 5
Multiple perspectives featureengineering
Throughout the previous chapters, we stated the importance of the feature engi-neering leverage for credit card fraud detection. Many feature engineering strate-gies have been imagined in the literature as described in section 3.2. The trans-action aggregation strategy introduced by [Whitrow et al., 2008] is the mostadopted approach in the field.
Moreover, we became aware that sequential patterns are ubiquitous in creditcard fraud detection. Genuine behaviours are ruled by temporal patterns (seesection 4.2 and fraudulent strategies are identified through sequential patterns(see section 4.1.4).
In this chapter, we want to leverage the sequential patterns discovered throughthe creation of features. Therefore, we present an approach to model a sequenceof credit card transactions from three different perspectives, namely:
(i) The sequence contains or doesn’t contain a fraudulent transaction.
(ii) The sequence is obtained by fixing the card-holder or the payment terminal.
(iii) It is a sequence of spent amount or of elapsed time between the current andprevious transactions.
Combinations of the three binary perspectives give eight sets of sequencesfrom the (training) set of transactions. Each one of these sequences is modelledwith a hidden Markov model (HMM). Each HMM associates a likelihood to atransaction given its sequence of previous transactions. These likelihoods areused as additional features in a random forest classifier for fraud detection.
71
Cette thèse est accessible à l'adresse : http://theses.insa-lyon.fr/publication/2019LYSEI110/these.pdf © [Y. Lucas], [2019], INSA de Lyon, tous droits réservés

This multiple perspectives HMM-based approach enables an automatic fea-ture engineering in order to model the sequential properties of the dataset withrespect to the classification task. This approach allows for a 9.3% increase in theprecision-recall AUC on the e-commerce transactions and a 18.1% increase onthe face-to-face transactions compared to the state of the art feature engineeringstrategy for credit card fraud detection.
5.1 Baseline: transaction aggregation strategy
As stated in section 3, one of the difficulty of credit card fraud detection is the factthat the feature set describing a credit card transaction usually ignores detailedsequential information. Typical models only use raw transactional features, suchas time, amount, merchant category, etc.
Consequently, [Whitrow et al., 2008] create descriptive statistics as featuresin order to include historical knowledge. These descriptive features can be forexample the number of transactions or the total amount spent by the card-holderin the past 24 hours for a given merchant category or country. [Bahnsen et al.,2016] considered [Whitrow et al., 2008] strategy to epitomized the state of theart feature engineering technique for credit card fraud detection.
5.1.1 Construction of features based on transaction aggregationstrategy
The state of the art feature engineering technique for credit card fraud detectioncreates descriptive features using the history of the card-holder [Whitrow et al.,2008], [Bahnsen et al., 2016].
In order to enrich a transaction with statistics constructed with transactionaggregation strategy, 3 objects are needed:
A sequence of previous transactions: It can be the sequence of previoustransactions from the buyer or the seller. The literature contains mostlyfeature based on the buyers sequences, however we could show that the sellerperspective is very relevant for credit card fraud detection. This sequenceof transaction will be filtered and used for the calculation of statistics.
A filter: This filter aims to consider only the relevant past transactions for theconstruction of the descriptive statistic. It usually contains a time limit,for example only considering past transactions from the last 24 hours, fromthe last week or the last month. It may also contain a combination of oneor several categorical features: For example, in order for the transactions
72
Cette thèse est accessible à l'adresse : http://theses.insa-lyon.fr/publication/2019LYSEI110/these.pdf © [Y. Lucas], [2019], INSA de Lyon, tous droits réservés

to be considered, they must have been done in the same country and/orwith the same type of merchant and/or same type of authentication, etc.
An operation: In order to extract information from the filtered sequence oftransactions, an aggregation operation has to be performed. This operationcan use information from the features of the transactions. It can be forexample the number of transactions in the sequence, the total amount spentin the sequence, the standard deviation of a chosen feature in the sequence,etc.
5.1.2 Transaction aggregation strategy improves fraud detection
Naive use of transaction aggregation strategy (aggCH)
We implemented the transactions aggregation strategy in order to verify the in-crease in detection claimed in [Whitrow et al., 2008] and [Bahnsen et al., 2016].
In addition to the 13 refined features of the credit card transaction dataset(see section 4.1.2 for the construction of the refined feature set), we calculated thevalue of 4 features based on the transaction aggregation strategy applied to thecard-holder. These 4 features based on the card-holder history will be referredto as the state of the art feature engineering in later studies.
Card holder Transaction Terminalage, gender, broker,card-expiry, city
authentication, card en-try mode, time, amount,e-commerce type, PINcheck
merchant country, mer-chant category
Table 5.1: Refined feature set
Feature SignificationAGGCH1 # transactions issued by user in 24h.AGGCH2 Amount spent by user in 24h.AGGCH3 # transactions in the country in 24h.AGGCH4 Amount spent in the country in 24h.
Table 5.2: Aggregated features centered on the card-holders
We tested the addition of these features for the face-to-face transactions andfor the e-commerce transactions. We measured the precision-recall AUCs andROC AUCs before and after inclusion of those aggregated features. We call
73
Cette thèse est accessible à l'adresse : http://theses.insa-lyon.fr/publication/2019LYSEI110/these.pdf © [Y. Lucas], [2019], INSA de Lyon, tous droits réservés

aggCH the set of features based on transaction aggregation strategy on the card-holder sequences.
We considered 3 types of classifier to study the increase in detection whenusing transaction aggregation strategy: random forest classifier, logistic regres-sion classifier and Adaboost classifier. We reproduced each prediction 3 times inorder to monitor the variation of AUCs among the runs. The hyperparametersranges chosen for the grid search optimization of the classifiers is presented intables 5.3, 5.4 and 5.5.
n-trees n-features min-samples-leaf max depth{300} {1, 7, 13} {1, 20, 40} {4,None}
Table 5.3: Random forest grid searchC parameter penalty tolerance for stopping{1, 10, 100} {l1, l2} {10, 100}
Table 5.4: Logistic regression grid searchtree numbers learning rate tolerance for stopping max tree depth{100, 400} {0.1, 1, 100} {10, 100} {1, 4}
Table 5.5: Adaboost grid search
The training, testing and evaluation set were split temporally as shown intable 4.4.
The consequences of the incorporation of transaction aggregation strategybased features on classifiers prediction were evaluated using the Precision-RecallAUC and ROC AUC metrics described in section 2.2.
Experiments
precision-recall AUC ROC AUCwithout aggCH with aggCH without aggCH with aggCH
e-commerce 0.212 ± 0.0009 0.343 ± 0.001 0.935 ± 0.00003 0.950 ± 0.0001face-to-face 0.082 ± 0.001 0.144 ± 0.001 0.950 ± 0.0005 0.964 ± 0.00005
Table 5.6: Addition of "aggCH" features to a random forest classifier
74
Cette thèse est accessible à l'adresse : http://theses.insa-lyon.fr/publication/2019LYSEI110/these.pdf © [Y. Lucas], [2019], INSA de Lyon, tous droits réservés
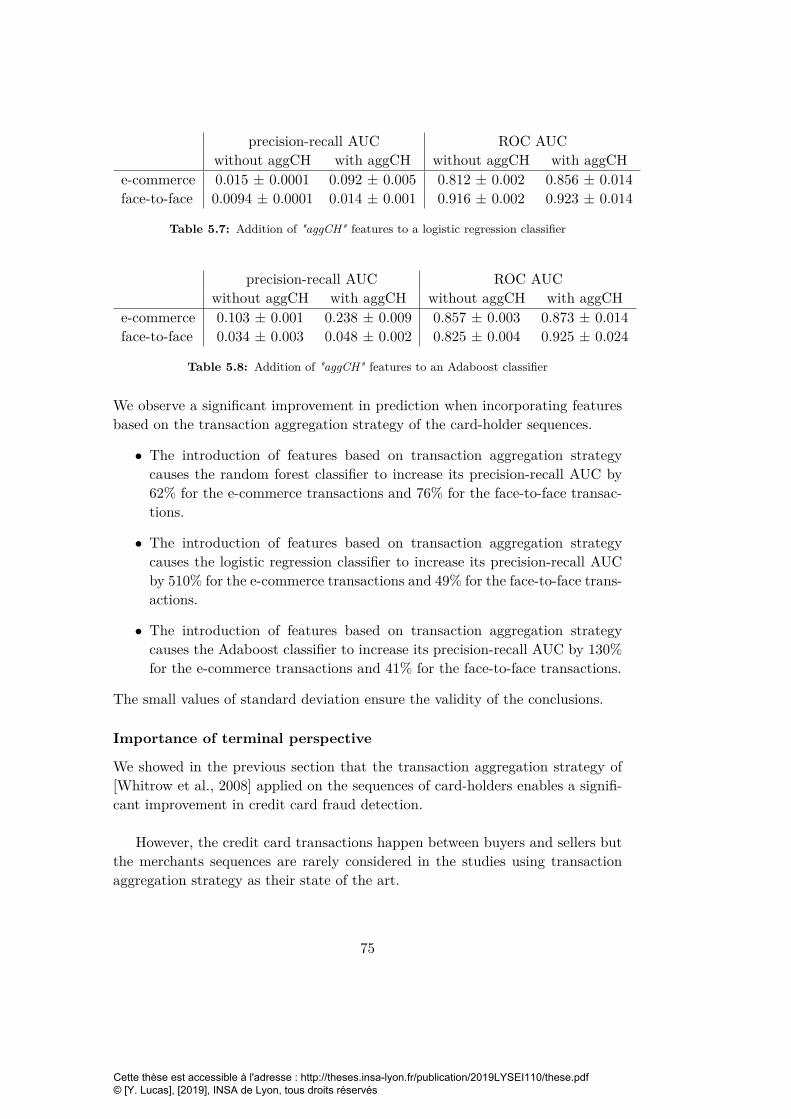
precision-recall AUC ROC AUCwithout aggCH with aggCH without aggCH with aggCH
e-commerce 0.015 ± 0.0001 0.092 ± 0.005 0.812 ± 0.002 0.856 ± 0.014face-to-face 0.0094 ± 0.0001 0.014 ± 0.001 0.916 ± 0.002 0.923 ± 0.014
Table 5.7: Addition of "aggCH" features to a logistic regression classifier
precision-recall AUC ROC AUCwithout aggCH with aggCH without aggCH with aggCH
e-commerce 0.103 ± 0.001 0.238 ± 0.009 0.857 ± 0.003 0.873 ± 0.014face-to-face 0.034 ± 0.003 0.048 ± 0.002 0.825 ± 0.004 0.925 ± 0.024
Table 5.8: Addition of "aggCH" features to an Adaboost classifier
We observe a significant improvement in prediction when incorporating featuresbased on the transaction aggregation strategy of the card-holder sequences.
• The introduction of features based on transaction aggregation strategycauses the random forest classifier to increase its precision-recall AUC by62% for the e-commerce transactions and 76% for the face-to-face transac-tions.
• The introduction of features based on transaction aggregation strategycauses the logistic regression classifier to increase its precision-recall AUCby 510% for the e-commerce transactions and 49% for the face-to-face trans-actions.
• The introduction of features based on transaction aggregation strategycauses the Adaboost classifier to increase its precision-recall AUC by 130%for the e-commerce transactions and 41% for the face-to-face transactions.
The small values of standard deviation ensure the validity of the conclusions.
Importance of terminal perspective
We showed in the previous section that the transaction aggregation strategy of[Whitrow et al., 2008] applied on the sequences of card-holders enables a signifi-cant improvement in credit card fraud detection.
However, the credit card transactions happen between buyers and sellers butthe merchants sequences are rarely considered in the studies using transactionaggregation strategy as their state of the art.
75
Cette thèse est accessible à l'adresse : http://theses.insa-lyon.fr/publication/2019LYSEI110/these.pdf © [Y. Lucas], [2019], INSA de Lyon, tous droits réservés

Since modelling the terminal perspective is an important part of our workwe wanted to try to build features based on transaction aggregation strategy onthe sequences of the merchants and assess their relevance for credit card frauddetection. This would ensure a fair comparison with state of the art techniqueswhen we would add the proposed HMM-based features modelling the merchantssequences to the feature set.
Feature SignificationAGGTM1 # transactions in terminal in 24h.AGGTM2 Amount spent in terminal in 24h.AGGTM3 # transactions with this card type in 24h.AGGTM4 Amount spent with this card type in 24h.
Table 5.9: Aggregated features centered on the terminals
We tested the addition of the terminal based aggregated features over the rawfeatures and the card-holder based aggregated features for the face-to-face trans-actions and for the e-commerce transactions. We measured the precision-recallAUCs and ROC AUCs before and after inclusion of those aggregated features.We call aggTM the set of features based on transaction aggregation strategy onthe terminal sequences.
We considered 3 types of classifier to study the increase in detection whenadding the perspective of the merchants described with transaction aggregationstrategy: random forest classifier, logistic regression classifier and Adaboost clas-sifier. We reproduced each prediction 3 times in order to consider the variationof AUCs among the runs.
The models hyperparameters, evaluation metrics and dataset splitting areidentical to those used in the previous section 5.1.2.
Experiments
precision-recall AUC ROC AUCwithout aggTM with aggTM without aggTM with aggTM
e-commerce 0.343 ± 0.001 0.383 ± 0.002 0.950 ± 0.0001 0.957 ± 0.0002face-to-face 0.144 ± 0.001 0.167 ± 0.001 0.964 ± 0.00005 0.967 ± 0.0004
Table 5.10: Addition of "aggTM" features to a random forest classifier
76
Cette thèse est accessible à l'adresse : http://theses.insa-lyon.fr/publication/2019LYSEI110/these.pdf © [Y. Lucas], [2019], INSA de Lyon, tous droits réservés

precision-recall AUC ROC AUCwithout aggTM with aggTM without aggTM with aggTM
e-commerce 0.092 ± 0.005 0.096 ± 0.004 0.856 ± 0.014 0.867 ± 0.010face-to-face 0.014 ± 0.001 0.0161 ± 0.0003 0.923 ± 0.014 0.933 ± 0.004
Table 5.11: Addition of "aggTM" features to a logistic regression classifier
precision-recall AUC ROC AUCwithout aggTM with aggTM without aggTM with aggTM
e-commerce 0.238 ± 0.009 0.263 ± 0.004 0.873 ± 0.014 0.907 ± 0.006face-to-face 0.048 ± 0.002 0.053 ± 0.003 0.925 ± 0.024 0.83 ± 0.001
Table 5.12: Addition of "aggTM" features to an Adaboost classifier
• The addition of features describing the merchants sequences with transac-tion aggregation strategy to the raw features plus the card-holder based ag-gregated features causes the random forest classifier to increase its precision-recall AUC by 12% for the e-commerce transactions and 16% for the face-to-face transactions.
• The addition of features describing the merchants sequences with transac-tion aggregation strategy to the raw features plus the card-holder basedaggregated features causes the logistic regression classifier to increase itsprecision-recall AUC by 4% for the e-commerce transactions and 15% forthe face-to-face transactions.
• The addition of features describing the merchants sequences with transac-tion aggregation strategy to the raw features plus the card-holder basedaggregated features causes the Adaboost classifier to increase its precision-recall AUC by 11% for the e-commerce transactions and 10% for the face-to-face transactions.
For each classifier except logistic regression classifier, the small relative values ofstandard deviation ensure the validity of the conclusions.
We observe an improvement in prediction when incorporating transactionaggregation strategy features based on terminals sequences in addition to fea-tures based on the card-holders sequences. It is encouraging since consideringmerchants perspective is one of the particularity of this work. Indeed, it is notconsidered in the majority of the credit card studies we read.
77
Cette thèse est accessible à l'adresse : http://theses.insa-lyon.fr/publication/2019LYSEI110/these.pdf © [Y. Lucas], [2019], INSA de Lyon, tous droits réservés

Figure 5.1: Modelling limitations of transaction aggregation strategy
5.1.3 Limitations of transaction aggregation strategy
We identified several weaknesses in the construction of features based on trans-action aggregation strategy that motivated our work:
First, Aggregated features provide a descriptive statistic over a set of transac-tions. Such statistics do not consider fine-grained temporal dependenciesbetween the transactions of a sequence. For example, Two card-holdersmay have very different buying behaviours: steady transactions amountsor oscillating transactions amounts, however the features created by thetransactions aggregation strategy wont reveal these differences: the twocard-holder will have the same value of mean amount and transaction fre-quencies (see figure 5.1). Moreover we observed common fraud patternswhich start with low amount transactions for testing the card, followedby high amount transaction to empty the account: sequential informationshould be relevant for credit card fraud detection. Therefore we proposeto use a generative graphical model for sequence modelling. The choice ofhidden Markov model for our sequence modelling problem is discussed insection 5.2.1.
Second, Aggregated features are usually calculated over transactions occuringin a fixed time window (e.g. 24 h). Transaction of very different cardholders do not follow such a time pattern in general. However, the numberof transactions made during such a time period can vary a lot for differentcard-holders. Fixed size aggregated statistics can’t account for that fact.
Third, These features consider only the history of the card-holder and do notexploit information of fraudulent transactions for feature engineering. How-ever, a sequence of transactions happening at a fixed terminal can alsocontain valuable patterns for fraud detection.
78
Cette thèse est accessible à l'adresse : http://theses.insa-lyon.fr/publication/2019LYSEI110/these.pdf © [Y. Lucas], [2019], INSA de Lyon, tous droits réservés
Fourth, The choice of the descriptive feature created using the transaction ag-gregation strategy ([Whitrow et al., 2008], [Bahnsen et al., 2016]) is guidedby expert knowledge. We would like not to be dependent to expert knowl-edge and we think that doing feature engineering in a supervised way (withthe knowledge of the label of transactions in the training set) can be a wayto create relevant features without the need of expert knowledge.
5.2 Multiple perspectives hidden Markov model basedfeature engineering
5.2.1 Modelling the sequences of transactions
As we have discussed before, feature aggregation strategies improve results butignore sequence information. We want to model the sequences of transactionsinstead of creating descriptive features. However, we have seen in section 3.3that several solutions to model sequences exist. This brings us to the question:Which model to choose for including sequential information?
Why hidden Markov models?
We choose to model transactions sequences using HMMs for several reasons.
• First, HMM were already used with success for credit card fraud detec-tion in [Srivastava et al., 2008]. The authors proposed to raise anomalyscores based on sequences of amount spent by the card-holder (’big amount’,’medium amount’, ’small amount’). They created an artificial credit cardtransaction dataset in order to show the benefits of their approach. Otherauthors like [Dhok, 2012] also used HMM for credit card fraud detection.
• Second, hidden Markov models are generative models, i.e. they model thejoint probability p(x, y). We aim to exactly model that probability and notthe conditional distribution p(y|x) which is estimated by discriminant clas-sifiers like LSTM or CRF. In our case, the classification is done afterwardsby a random forest, logistic regression or Adaboost classifier.
• Third, hidden Markov models are very simple models. A HMM containing 7hidden states and a gaussian emission distribution has 49+ 14 = 63 param-eters whereas neural networks models can have thousands of parameters.This reduced number of parameters allows for a compression of the mod-elled behaviours. The observed behaviour is generalized into an abstractedlatent behaviour. Moreover, the reduced number of parameters enables aneasier interpretation of the behaviour modeled by the HMMs. For exam-ple, by looking at the probability to remain in the current hidden state,
79
Cette thèse est accessible à l'adresse : http://theses.insa-lyon.fr/publication/2019LYSEI110/these.pdf © [Y. Lucas], [2019], INSA de Lyon, tous droits réservés
we could observe that the genuine buying behaviours showed sequences ofsteady amount of transactions whereas the fraudulent buying behaviourswere more volatile.
Markov property in a credit card transaction environment
As introduced in section 3.3, the term Markov property refers to the memorylessproperty of a stochastic process like the one described by hidden Markov mod-els (see figure 5.2). In other words, the conditional probability distribution offuture states of the process depends only upon the present state, not on the se-quence of events that preceded it. Formally, it allows simplification of conditionalprobabilities:
p(tk|tk−1, tk−2, .., t1,wk−1,wk−2,w1) = p(tk|tk−1) k ∈ {1, ..,n}
In the case of credit card transaction sequences, the Markov assumption isquestionable. On one hand some buying behaviours where the card-holder visitsshops one after the other within a predefined itinerary would respect the Markovassumption. On the other hand some credit card transactions have longer termdependencies like for example the weekly supermarket visits for a family.
Moreover, other authors such as [Srivastava et al., 2008], [Dhok, 2012], [Robin-son and Aria, 2018] considered the Markov assumption valid for credit card frauddetection. Therefore, we assumed that the Markov assumption holds for ourcredit card fraud detection task.
5.2.2 Hidden Markov models basic principles
Hidden Markov models main hypothesis is that behind the observed distribution,there is a simpler latent model that rules the sequential distribution. There-fore, sequence modelling with hidden Markov model comprises two processes.The stochastic hidden states evolution at each time step is not observed. In-stead, observed variable values are generated at each time step depending on thecurrent value of the corresponding hidden state thanks to an emission process.Hypothetically, the complexity of the observed distribution comes partly fromadditive Gaussian noise corrupting both the hidden states evolution process andthe emission process.
80
Cette thèse est accessible à l'adresse : http://theses.insa-lyon.fr/publication/2019LYSEI110/these.pdf © [Y. Lucas], [2019], INSA de Lyon, tous droits réservés

Figure 5.2: Hidden Markov model architecture (from [Lucas et al., 2019a]).
We can observe in the trellis diagram1 (see figure 5.2) describing the HMMthat they comprises two types of random variables:
• ti ∈ {1, 2, ..,m} are discrete random variables : the hidden states or latentstates.
• wi are the observed variables. The conditional distribution of the observedvariable with respect to the hidden states depends on the observed variablenature.
Hidden Markov models allow for a compression of the observed sequence inorder to generalize the observed behaviour into an abstracted latent behaviour.It is comprised of two processes represented by matrices:
• The transition matrix T (i, j) describes the transition probabilities: T (i, j) =p(tk+1 = j|tk = i), i, j ∈ {1, ..,m}2. It rules the succession of the hiddenstates. Each row i of the transition matrix is a multinomial distribution ofthe next state given that the current state is i. The hidden states obey tothe Markov property.
• The emission matrix describes the conditional distribution of the observedvariables given the current hidden state. Emission probabilities distributioncan be arbitrary. They can be discrete finite (multinomial distribution), orinfinite (Poisson distribution), continuous (gaussian distribution, lognormaldistribution) and even multidimensional. The emission matrix describes theemission probabilities: Ei(w) = p(wk = w|tk = i), i ∈ {1, ...,m}, w ∈ Wfor the discrete case2.
The joint probability of the sequences of wi and ti described by the trellisdiagram is:
p(w1, ...,wn, t1, ..., tn) = p(t1) ∗ p(w1|t1)n∏k=2
p(tk|tk−1) ∗ p(wk|tk)
1temporal visualisation of a graphical model2or Ei(w) = p(w|tk = i), i ∈ {1, ..., m}, w ∈ W for the continuous case (w has a density
distribution).
81
Cette thèse est accessible à l'adresse : http://theses.insa-lyon.fr/publication/2019LYSEI110/these.pdf © [Y. Lucas], [2019], INSA de Lyon, tous droits réservés

In the end, the parameters of an HMM are the transition matrix (T (tk−1, tk)and the emission matrix Etk(wk) described above, plus the initial distribution ofthe hidden states π = p(t1 = i), i ∈ 1, ...,m.
Using these parameters, the joint probability of wi and ti becomes:
p(w1, ..,wn, t1, .., tn) = π ∗Et1(w1)n∏k=2
T (tk−1, tk) ∗Etk(wk)
Practical exemple of data modelling using an HMM A practical exampleof HMM is presented in figure 5.3. In this example, ti ∈ {−1; 1} and wi ∈ R.The transition matrix is: (
0.9 0.10.1 0.9
)The observed variables wi are distributed around the ti. The emission distri-
bution follows an uniform distribution around the :
wi = ti ∗ (0.5 +Xi), Xi → U([0; 1]), i ∈ {1, ..,n}
.At each point of time i ∈ {1, .., 100}, an hidden state value ti (in blue) is cal-
culated with the transition matrix. For each hidden state ti, a noisy observationwi (in red) is made depending on this hidden state.
-2
-1
0
1
2
0 25 50 75 100
t_i w_i
Figure 5.3: Practical example of HMM
82
Cette thèse est accessible à l'adresse : http://theses.insa-lyon.fr/publication/2019LYSEI110/these.pdf © [Y. Lucas], [2019], INSA de Lyon, tous droits réservés

Training hidden Markov models: Expectation Maximisation algorithm
Given a set of sequences of observed variable, the parameters of an hidden Markovmodel can be adjusted to reflect the distribution observed in these sequences ofobserved variable. The algorithm used in order to "fit" the hidden Markov modelto a set of sequences is the Expectation-Maximisation algorithm.
We described earlier the hidden Markov model by θ = (T ,E,π). Givena set of observed sequences W . The iterative Expectation-Maximisation algo-rithm known as the Baum-Welch algorithm finds a local maximum for θ∗ =
argmaxθp(W ) (i.e. the HMM parameters θ that maximise the probability of theobserved sequence).
Qualitatively, EM optimization of a model with latent (hidden) parametersconsists in for randomly initialized parameters:
Expectation: Find the latent states distributions that correspond the most tothe sequences of observed data. This is usually done with the help ofthe forward backward algorithm which leverage the Markov property inorder to simplify the calculations of the conditional probabilities to observea sequence of event given the parameters of the transition and emissionmatrices (also referred to as forward-backward algorithm [Viterbi, 1967]).
Maximisation: Maximise the correspondence between the latent distributioninferred during the expectation step and the parameters of the transitionand emission matrices by adjusting the parameters.
The expectation and maximization steps are repeated until convergence of thegraphical model to the observed data. The convergence can be monitored byobserving the increase of the value of the likelihood that the set of observed se-quences has been generated by the model. This likelihood increases over the iter-ations until it reaches a ceiling when the hyperparameters ruling the architectureof the generative model don’t allow it to fit more to the set of observed sequences.
Knowing the probability of state frequencies and the probabilities to obtainthe observed variables, the maximisation step is quite straightforward. However,a naive calculation of the probability for each observed sequence to have beengenerated by the current iteration of the HMM is very costly O((mn) with m thenumber of hidden states and n the size of each sequence). The forward-backwardalgorithm simplifies a lot this calculation with a recursion trick detailed below.The complexity of the expectation step becomes O(n ∗m2) with the forward-backward algorithm.
83
Cette thèse est accessible à l'adresse : http://theses.insa-lyon.fr/publication/2019LYSEI110/these.pdf © [Y. Lucas], [2019], INSA de Lyon, tous droits réservés

The forward-backward algorithm of the expectation step assumes that theparameters of the HMM (θ = (T ,E, pi)) are known. The goal of the forwardbackward algorithm is to compute p(tk,w) ∀k ∈ {1, ..,n} with w = {w1, ..,wn}a sequence of observed events. We will note wi:j = (wi, ..,wj) a subsequence ofevents. Therefore, w = w1:n.
The forward-backward algorithm leverages the Markov property in order tosimplify the calculation of conditional probability. The simplification is done us-ing the d-separation. Basically, two variables of a graphical model are d-separatedconditioned on a third variable if they are independant conditioned on the thirdvariable. In the case of hidden Markov model, since the distribution of hiddenstates follow the Markov property, two distant hidden states are independantconditioned on the knowledge of an intermediate hidden state. Knowing an in-termediate hidden state, the two distant hidden states are d-separated. The in-formation of the distant hidden state is irrelevant for inferring distributions sincethe intermediate hidden state already contains the information of the distant hid-den state. This independance property allows for simple conditional distributionsin hidden Markov models.
By definition:
p(tk,w) = p(wk+1:n|tk,w1:k) ∗ p(tk,w1:k), ∀k ∈ {1, ..,n}
. However with d-separation, wk+1:n is independant from t1:k−1 and w1:k condi-tioned on tk. Therefore,
p(tk,w) = p(wk+1:n|tk) ∗ p(tk,w1:k), ∀k ∈ {1, ..,n}
. The forward path aims to calculate p(tk,w1:k), ∀k ∈ {1, ..,n} whereas thebackward path aims to calculate p(wk+1:n|tk), ∀k ∈ {1, ..,n}.
Forward path Given a sequence w1:n, the goal of the forward path is to com-pute:
p(tk,w1:k) = p(tk,w1,w2, ...,wk), ∀k ∈ {1, ..,n}
αk(tk) = p(tk,w1:k)
=m∑
zk−1=1p(tk, tk−1,w1:k)
=m∑
zk−1=1p(wk|tk, tk−1,w1:k−1) ∗ p(tk|tk−1,w1:k−1) ∗ p(tk−1,w1:k−1)
84
Cette thèse est accessible à l'adresse : http://theses.insa-lyon.fr/publication/2019LYSEI110/these.pdf © [Y. Lucas], [2019], INSA de Lyon, tous droits réservés

w1:k−1 and tk−1 independant from wk conditioned on tk (d-separation):
αk(tk) =m∑
zk−1=1)p(wk|tk ∗ p(tk|tk−1) ∗ p(tk−1,w1:k−1)
=m∑
zk−1=1Ek(wk) ∗ Tk,k−1 ∗ αk−1(tk−1)
Finally we showed (with Ek(w) and Tk,k−1 the emission and transition ma-trices):
αk(tk) =m∑
zk−1=1Ek(w) ∗ Tk,k−1 ∗ αk−1(tk−1)
Besides, we know that:
α1(t1) = p(t1,w1) = p(t1) ∗ p(w1|t1) = π ∗E1(w)
We can therefore apply the recursion to all the succession of events in theobserved sequence in order to get p(tk,w1:k), ∀k ∈ {1, ..,n}.
Backward path Given a sequence w1:n, the goal of the backward path is tocompute:
p(wk+1:n|tk), ∀k ∈ {1, ..,n− 1}
βk(tk) = p(wk+1:n|tk)
=n∑
zk+1=1p(wk+2:n|tk+1, tk,wk+1) ∗ p(wk+1|tk+1, tk) ∗ p(tk+1|tk)
wk+2:n independant from tk and wk+1 conditioned on tk+1 (d-separation):
βk(tk) =n∑
zk+1=1p(wk+2:n|tk+1) ∗ p(wk+1|tk+1) ∗ p(tk+1|tk)
=n∑
zk+1=1βk+1(tk+1) ∗Ek+1(wk+1) ∗ Tk+1,k
85
Cette thèse est accessible à l'adresse : http://theses.insa-lyon.fr/publication/2019LYSEI110/these.pdf © [Y. Lucas], [2019], INSA de Lyon, tous droits réservés

Finally we showed (with Ek+1(wk+1) and Tk+1,k the emission and transitionmatrices):
βk(tk) =n∑
zk+1=1βk+1(tk+1) ∗Ek+1(wk+1) ∗ Tk+1,k
Besides, we know that:βn(tn) = 1
We can therefore apply the recursion to all the succession of events in theobserved sequence in order to get p(wk+1:n|tk), ∀k ∈ {1, ..,n− 1}.
Viterbi algorithm for finding the most likely sequence of hidden states
The Viterbi algorithm aims to calculate the most likely sequence of hidden statesfor a sequence of observed variables w1:n given a HMM model (θ = (T ,E,π)).In a mathematical way, it aims to compute:
t∗ = arg maxt1:n
p(t1:n|w1:n)
For simpler calculation, it computes arg maxt1:n p(t1:n,w1:n) since
arg maxt1:n
p(t1:n|w1:n) = arg maxt1:n
p(t1:n,w1:n)
. Indeed, p(t1:n|w1:n) ∝ p(t1:n,w1:n) for a given sequence of observed variablew1:n since p(t1:n,w1:n) = p(t1:n|w1:n) ∗ p(w1:n).
As for the forward-backward algorithm, the goal is to establish a recursionbetween successive states.
µk(tk) = maxt1:k−1
p(t1:k,w1:k)
= maxt1:k−1
p(wk|tk) ∗ p(tk|tk−1) ∗ p(t1:k−1,w1:k−1)
= maxt1:k−1
p(wk|tk) ∗ p(tk|tk−1) ∗ maxt1:k−2
p(t1:k−1,w1:k−1)
= maxt1:k−1
Ek(wk) ∗ Tk ∗ µk−1(tk−1)
With µ1(t1) = p(t1,w1) = p(t1) ∗ p(w1|t1) (initial distribution * emissionmatrix).
In order to get the argmax out of the max calculation obtainable for each k ∈{1, ..,n} with the recursion presented, the user must keep track of the sequenceof t maximizing the joint probability p(t1:k,w1:k) at each step of the recursion.
86
Cette thèse est accessible à l'adresse : http://theses.insa-lyon.fr/publication/2019LYSEI110/these.pdf © [Y. Lucas], [2019], INSA de Lyon, tous droits réservés

5.2.3 Leverage the train set labels for automated feature creation
Amount and timing for modelling fraudulent and genuine behaviours
We stated earlier that experts could identify different types of fraudulent be-haviours using clustering algorithm. These behaviours are based on the timingand the amount of transactions:
Cluster 1: Short sequences (2-4 transactions) of low amount transactions (lessthan 10 e).
Cluster 2: Burst (high number of transactions at the same merchant in a shortamount of time) of medium amount transactions (10 - 100 e).
Cluster 3: Short sequences (3-5 transactions) of high amount transactions (morethan 100 e).
Moreover, the timing of the transaction are used for transactions labellingwhen a fraud is detected. Previous transactions of the last 10 minutes are la-belled by default as fraudulent, the transactions from the last day are situated inthe grey zone and transactions occuring before the day of the fraudulent trans-actions detected are considered as genuine transactions.
Furthermore, the observation of the feature importance vectors of the randomforests lead to the conclusion that the amount of the transaction is a predominantfeature for credit card fraud detection.
Modelling the buying behaviours with respect to the amount and timing fea-tures could be interesting for fraud detection.
Model fraudulent and genuine behaviours
Credit card fraud detection is often considered as an anomaly detection taskwhere one aims to spot abnormal behaviours which are supposed to be fraudu-lent behaviours. However, fraudsters aim to mimic genuine behaviours in orderto remain undetected. Therefore the anomaly detection task is becoming harder.Moreover, we highlighted in section 5.2.3 that interviewed experts have been ableto identify clusters of fraudster strategies.
The proposed feature engineering techniques aims to leverage the knowledgeof the labels of the transactions of the training set in order to model genuineand fraudulent behaviour using hidden Markov models. Modelling the genuinebehaviours is a classic anomaly detection scheme where the likelihood of a new
87
Cette thèse est accessible à l'adresse : http://theses.insa-lyon.fr/publication/2019LYSEI110/these.pdf © [Y. Lucas], [2019], INSA de Lyon, tous droits réservés

sequence of transactions is measured against historical honest sequences of trans-actions ([Chandola et al., 2012]).
The sequences used in order to model fraudulent behaviours are sequencesof transactions of the training set with at least one fraudulent transaction. Therationale is that to have a risk of fraud, it is not enough for a new sequence to befar from usual transaction behavior but it is also expected for it to be relativelyclose to a risky behavior.
In the end, when assessing the fraudulence of a sequence of transaction, theclassifier model would be able to know the distance between this sequence andthe genuine behaviours and the distance between this sequence and the fraudu-lent behaviours. Double checking the distance between the observed sequence oftransaction and the previously learned behaviours should decrease the number offalse positive. As stated by [Pozzolo et al., 2017], this is a crucial issue since theinvestigators can only verify a limited number of alerts each day.
Multiple perspectives hidden Markov model based feature engineering
In addition to the descriptive aggregated features created by [Whitrow et al.,2008], we propose to create eight new HMM-based features. They quantify thesimilarity between the history of a transaction and eight distributions learnedpreviously on set of sequences selected in a supervised way in order to modeldifferent perspectives.
In particular, we select three perspectives for modelling a sequence of trans-actions (see figure 5.4). A sequence (i) can be made only of genuine historicaltransactions or can include at least one fraudulent transaction in the history, (ii)can come from a fixed card-holder or from a fixed terminal, and (iii) can consistof amount values or of time-delta values (i.e. the difference in time between thecurrent transaction and the previous one). We optimized the parameters of eightHMMs using all eight possible combinations (i-iii).
The three perspectives, namely genuine/fraudulent, card-holder/merchantand amount/time-delta, have been chosen based on the following assumptions:
• First, the features made with only genuine historical transactions shouldmodel the common behavior of card holders. The other four features aremade with sequences of transactions with at least one fraudulent transactionand will model risky behaviours.
• The second perspective allows the model to take the point of view of thecard-holder and the merchant which are the two actors involved in the credit
88
Cette thèse est accessible à l'adresse : http://theses.insa-lyon.fr/publication/2019LYSEI110/these.pdf © [Y. Lucas], [2019], INSA de Lyon, tous droits réservés

card transactions.
• The last perspective takes into account two important features for creditcard fraud detection: the amount of a transaction and the elapsed timebetween two transactions. These features are strong indicators for frauddetection.
CH TM amt label
1 A 47€ 0
2 A 75€ 1
1 B 56e 0
2 B 15€ 1
2 C 25€ 0
Raw transactions dataset Sequences datasets
CH TM amt label
1 A 47€ 0
1 B 56€ 0
2 A 75€ 1
2 B 15€ 1
2 C 25€ 0
CH TM amt label
1 A 47€ 0
2 A 75€ 1
1 B 56€ 0
2 B 15€ 1
CH sequences
TM sequences
CH TM amt label
1 A 47€ 0
1 B 56€ 0
2 A 75€ 1
2 B 15€ 1
2 C 25€ 0
Genuine CH sequences
Fraudulent CH sequences
CH TM amt label
1 A 47€ 0
2 A 75€ 1
1 B 56€ 0
2 B 15€ 1
Fraudulent TM sequences
Supervised sequences sets
2 C 25€ 0
2 C 25€ 0
Genuine TM sequences
Figure 5.4: Enriching transaction data with HMM-based features calculated from multipleperspectives (CH=Card-holder, TM=Terminal)
In order to make the HMM model the genuineness and fraudulence of the cardholders and the terminals, we create 4 training set (see figure 5.4) containing:
• sequences of transactions from genuine credit cards (without fraudulenttransactions in their history).
• sequences of transactions from compromised credit cards (with at leastone fraudulent transaction)
• sequences of transactions from genuine terminals (without fraudulenttransactions in their history)
• sequences of transactions from compromised terminals (with at leastone fraudulent transaction)
We then extract from these sequences of transactions the symbols that will bethe observed variable for the HMMs. In our experiments, the observed variablecan be either:
89
Cette thèse est accessible à l'adresse : http://theses.insa-lyon.fr/publication/2019LYSEI110/these.pdf © [Y. Lucas], [2019], INSA de Lyon, tous droits réservés

• the amount of a transaction.
• the amount of time elapsed between two consecutive transactions of a card-holder (time-delta).
At the end, we obtain 8 trained HMMs modeling 4 types of behaviour (gen-uine terminal behaviour, fraudulent terminal behaviour, genuine card-holder be-haviour and fraudulent card-holder behaviour) for both observed variables (amountand time-delta).
Algorithm 1 Online: calculate likelihood of sequences of observed eventsfor txi in all transactions dofor perspectivej in perspectives combinations do[txi, txi−1, txi−2] usersequencei,jHMMj HMM (usertype, signaltype, sequencetype)AnomalyScore log(p([txi, txi−1, txi−2]|HMMj))
end forend for
The HMM-based features described in this thesis (table 5.13) are the likeli-hoods that a sequence made of the current transaction and the two previous onesfrom this terminal/card holder is generated by each of these models.
As shown in algorithm 1, their calculation for each row (transaction) of thedataset involve fetching the HMM corresponding to each combination of perspec-tive 3 in order to calculate the likelihoods that the sequence of three transactionshave been generated by each HMM.
User Feature Genuine Fraudulent
Card Holder Amount HMM-cag HMM-cafTdelta HMM-ctg HMM-ctf
Terminal Amount HMM-tag HMM-tafTdelta HMM-ttg HMM-ttf
Table 5.13: Set of 8 HMM-based features describing 8 combinations of perspectives
5.3 Summary
We propose an HMM-based feature engineering strategy that allows us to inte-grate sequential knowledge in the transactions in the form of HMM-based fea-tures. These HMM-based features enable a non sequential classifier (random
3The HMM properties in the algorithm 1 are: usertype: merchant/card-holder, signaltype:amount/timing, sequencetype: genuine/fraudulent
90
Cette thèse est accessible à l'adresse : http://theses.insa-lyon.fr/publication/2019LYSEI110/these.pdf © [Y. Lucas], [2019], INSA de Lyon, tous droits réservés

forest) to use sequential information for the classification.
The multiple perspective property of our HMM-based feature engineeringstrategy gives us the possibility to incorporate a broad spectrum of sequentialinformation. In fact, we model the genuine and fraudulent behaviours of themerchants and the card-holders according to two features: the timing and theamount of the transactions. Moreover, the HMM-based features are created in asupervised way and therefore lower the need of expert knowledge for the creationof the fraud detection system.
91
Cette thèse est accessible à l'adresse : http://theses.insa-lyon.fr/publication/2019LYSEI110/these.pdf © [Y. Lucas], [2019], INSA de Lyon, tous droits réservés

Cette thèse est accessible à l'adresse : http://theses.insa-lyon.fr/publication/2019LYSEI110/these.pdf © [Y. Lucas], [2019], INSA de Lyon, tous droits réservés

Chapter 6
Experiments
In our work we proposed to generate history-based features using hidden Markovmodels. They quantify the similarity between an observed sequence and the se-quences of past fraudulent or genuine transactions observed for the cardholdersor the terminals.
In order to quantify how much the addition of multiple perspectives HMM-based features help the detection, we use the belgian credit card transactionsdataset introduced in section 2.1.1.
The experimental protocol is described in section 6.1. In section 6.2.1 wepresent the increase in detection when adding HMM-based features using differentclassifiers (random forest classifier, Adaboost and logistic regression classifier).Insection 6.2.2, we study hyperparameters influence: how much the window sizeand the number of hidden states affect the detection. Finally, in section 6.3 wecompare different solutions to tackle the issue of structural missing values.
To ensure reproducibility, a source code for calculating and evaluating the pro-posed HMM-based features can be found at https://gitlab.com/Yvan_Lucas/hmm-ccfd .
6.1 Experimental Setup
6.1.1 Feature engineering and dataset partitioning
We use the Python library hmmlearn1.
In order for the HMM-based features and the aggregated features to be compa-rable, we calculate terminal-centered aggregated features in addition to [Whitrow
1https://github.com/hmmlearn/hmmlearn
93
Cette thèse est accessible à l'adresse : http://theses.insa-lyon.fr/publication/2019LYSEI110/these.pdf © [Y. Lucas], [2019], INSA de Lyon, tous droits réservés

et al., 2008] card-holder centered aggregated features (table 6.1)
Feature SignificationAGGCH1 # transactions issued by user in 24h.AGGCH2 Amount spent by user in 24h.AGGCH3 # transactions in the country in 24h.AGGCH4 Amount spent in the country in 24h.AGGTM1 # transactions in terminal in 24h.AGGTM2 Amount spent in terminal in 24h.AGGTM3 # transactions with this card type in 24h.AGGTM4 Amount spent with this card type in 24h.
Table 6.1: Aggregated features centered on the card holders and the terminal
We split temporally the dataset in three different parts (see table 6.2: thetraining set, the validation set and the testing set. We chose to separate thetime period corresponding to the training and validation set and the time periodcorresponding to the testing set with a gap of 7 days. The reason is that the inthe real world fraud detection systems, human investigators have to verify thealerts generated by the classifiers. Since this process takes time, the ground truthis delayed by about one week. The transactions appearing in this gap of 7 daysbefore the testing set are used in order to calculate the value of the aggregatedand HMM-based features in the testing set but not for training the classifiers.
Start Date End DateTraining Set 01.03.2015 26.04.2015Validation Set 27.04.2015 30.04.2015Week gap 01.05.2015 07.05.2015Testing Set 08.05.2015 31.05.2015
Table 6.2: Dataset splitting
6.2 Results
6.2.1 Improvement in fraud detection when using HMM-basedfeatures
We train classifiers using different feature sets in order to compare the efficiencyof prediction when we add HMM-based features to the classification task forthe face-to-face and e-commerce transactions. As stated in section 2.2.2, theprecision-recall AUC metric is affected by class imbalance. Therefore, the differ-ence in term of precision-recall AUC measured between the e-commerce and the
94
Cette thèse est accessible à l'adresse : http://theses.insa-lyon.fr/publication/2019LYSEI110/these.pdf © [Y. Lucas], [2019], INSA de Lyon, tous droits réservés

face-to-face transactions is due to the difference in the class imbalance betweenthese datasets.
We tested the addition of our HMM-based features to several feature sets. Werefer to the feature set ”raw+aggCH” as the state of the art feature engineer-ing strategy since it contains all the raw features with the addition of Whitrow’saggregated features ([Whitrow et al., 2008]). The feature groups we refer to are:the raw features (raw), the features based on the aggregations of card-holderstransactions (aggCH), the features based on the aggregation of terminal transac-tions (aggTM), the proposed HMM-based features (HMM features).
In this section, the HMMs were created with 5 hidden states and the HMM-based features were calculated with a window-size of 3 (actual transaction + 2past transactions of the card-holder and of the terminal). We showed in section6.2.2 that the HMM hyperparameters (number of hiddens state and size of thewindow considered for the calculation of HMM-based features) did not changesignificantly the increase in Precision-Recall AUC observed.
The figures show the precision recall curves and ROC curves with their AUCobtained by testing the efficiency of classifiers (random forest, logistic regression,Adaboost with shallow trees and adaboost with deep trees) trained with severalfeature sets on the transactions of the testing set. The AUC numbers correspondsto the average obtained on 3 different runs. The AUCs are very stable over thedifferent runs and the standard deviation numbers are very low.
95
Cette thèse est accessible à l'adresse : http://theses.insa-lyon.fr/publication/2019LYSEI110/these.pdf © [Y. Lucas], [2019], INSA de Lyon, tous droits réservés
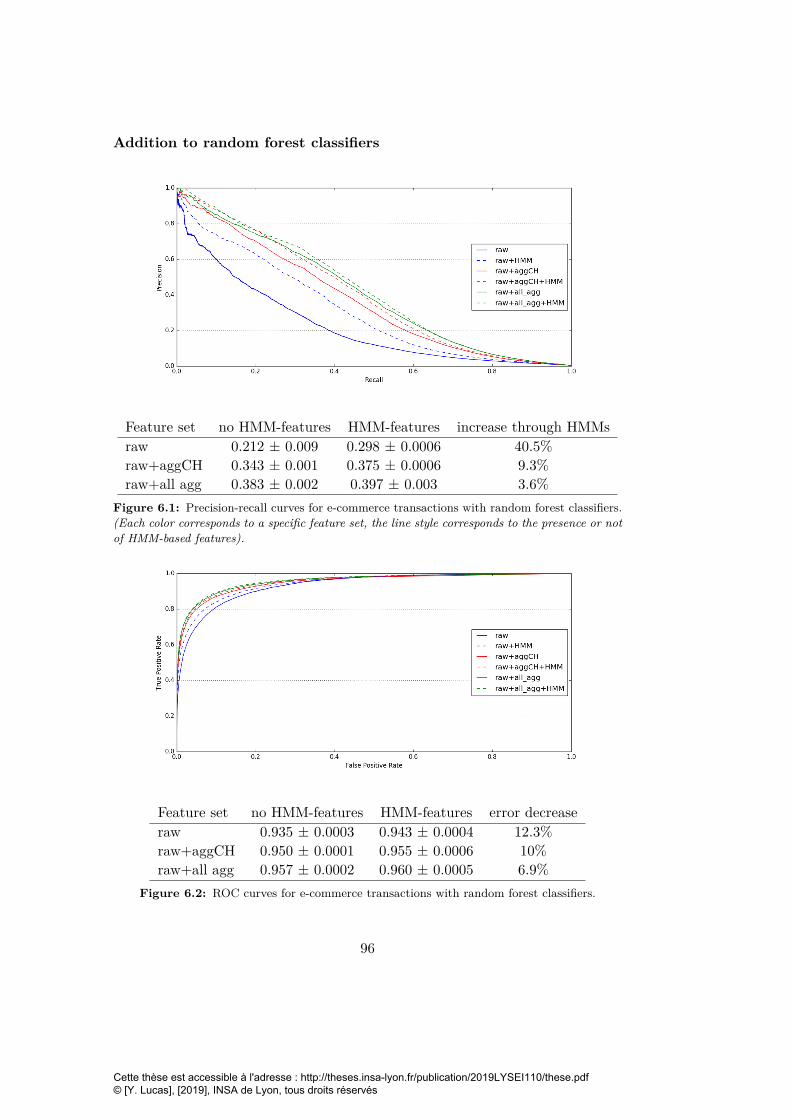
Addition to random forest classifiers
Feature set no HMM-features HMM-features increase through HMMsraw 0.212 ± 0.009 0.298 ± 0.0006 40.5%raw+aggCH 0.343 ± 0.001 0.375 ± 0.0006 9.3%raw+all agg 0.383 ± 0.002 0.397 ± 0.003 3.6%
Figure 6.1: Precision-recall curves for e-commerce transactions with random forest classifiers.(Each color corresponds to a specific feature set, the line style corresponds to the presence or notof HMM-based features).
Feature set no HMM-features HMM-features error decreaseraw 0.935 ± 0.0003 0.943 ± 0.0004 12.3%raw+aggCH 0.950 ± 0.0001 0.955 ± 0.0006 10%raw+all agg 0.957 ± 0.0002 0.960 ± 0.0005 6.9%
Figure 6.2: ROC curves for e-commerce transactions with random forest classifiers.
96
Cette thèse est accessible à l'adresse : http://theses.insa-lyon.fr/publication/2019LYSEI110/these.pdf © [Y. Lucas], [2019], INSA de Lyon, tous droits réservés

Feature set no HMM features HMM features increase through HMMsraw 0.082 ± 0.001 0.152 ± 0.001 85.4%raw+aggCH 0.144 ± 0.001 0.170 ± 0.001 18.1%raw+all agg 0.167 ± 0.001 0.177 ± 0.0006 6.0%
Figure 6.3: Precision-recall curves for face-to-face transactions with random forest classifiers.(Each color corresponds to a specific feature set, the line style corresponds to the presence or notof HMM-based features).
Feature set no HMM-features HMM-features error decreaseraw 0.950 ± 0.0005 0.967 ± 0.0002 33%raw+aggCH 0.964 ± 0.00005 0.967 ± 0.0008 9%raw+all agg 0.967 ± 0.0004 0.969 ± 0.0003 6.1%
Figure 6.4: ROC curves for face-to-face transactions with random forest classifiers.
We tuned the random forest hyperparameters (table 6.3) through a grid searchthat optimized the Precision-Recall area under the curve on the validation set.
97
Cette thèse est accessible à l'adresse : http://theses.insa-lyon.fr/publication/2019LYSEI110/these.pdf © [Y. Lucas], [2019], INSA de Lyon, tous droits réservés

n-trees n-features min-samples-leaf max depth{300} {1, 7, 13} {1, 20, 40} {4,None}
Table 6.3: Random forest grid search
We can observe on figures 6.2 and 6.4 that the face-to-face and the e-commerceresults both show a significant improvement in precision-recall AUC when addingthe proposed HMM-based features to the raw feature set. For the e-commercetransactions, this improvement ranges from 3.6% for the best feature set withoutHMM-based features (raw+all-agg for the e-commerce transactions) to 40.5% forthe worst feature set (raw for the e-commerce transactions). For the face-to-facetransactions, this improvement ranges from 6.0% for the best feature set withoutHMM-based features (raw+all-agg for the face-to-face transactions) to 85.4% forthe worst feature set (raw for the face-to-face transactions).
The relative increase in ROC AUC when adding HMM-based features is muchlower due to the high value of these AUCs. However the decrease in misclassi-fication done by the classifier is significant. It ranges from 6% to 33% for theface-to-face transactions and from 6.9% to 12.3% for the e-commerce transac-tions. The decrease in missclassification when adding HMM-based features tothe state of the art feature engineering strategy ([Whitrow et al., 2008]) is of 10%for the e-commerce transactions and 9% for the face-to-face transactions.
By comparing the AUC of the curves raw+aggCH and raw+aggCH+HMM,we observe that adding HMM-based features to the state of the art feature en-gineering strategy introduced in the work of Whitrow & al. leads to an increaseof 18.1% of the PR AUC for the face-to-face transactions and to an increase of9.3% of the PR AUC for the e-commerce transactions.
The relative increase in PR-AUC when adding terminal centered aggregatedfeatures to the feature set is of 16.0% for the face-to-face dataset. The relativeincrease in PR-AUC when adding terminal centered aggregated features to thefeature set is of 11.7% for the e-commerce transactions. The terminal perspectiveis very valuable for the detection of fraudulent credit card transactions.
98
Cette thèse est accessible à l'adresse : http://theses.insa-lyon.fr/publication/2019LYSEI110/these.pdf © [Y. Lucas], [2019], INSA de Lyon, tous droits réservés
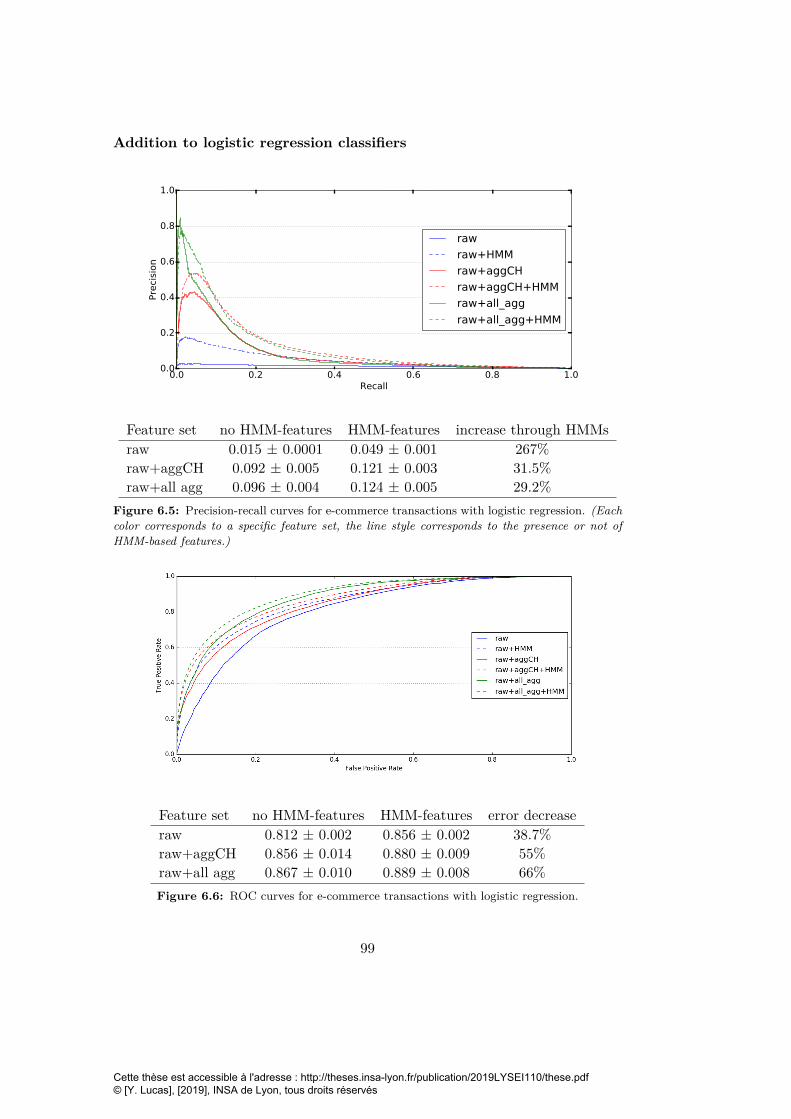
Addition to logistic regression classifiers
0.0 0.2 0.4 0.6 0.8 1.0Recall
0.0
0.2
0.4
0.6
0.8
1.0
Prec
ision
rawraw+HMMraw+aggCHraw+aggCH+HMMraw+all_aggraw+all_agg+HMM
Feature set no HMM-features HMM-features increase through HMMsraw 0.015 ± 0.0001 0.049 ± 0.001 267%raw+aggCH 0.092 ± 0.005 0.121 ± 0.003 31.5%raw+all agg 0.096 ± 0.004 0.124 ± 0.005 29.2%
Figure 6.5: Precision-recall curves for e-commerce transactions with logistic regression. (Eachcolor corresponds to a specific feature set, the line style corresponds to the presence or not ofHMM-based features.)
Feature set no HMM-features HMM-features error decreaseraw 0.812 ± 0.002 0.856 ± 0.002 38.7%raw+aggCH 0.856 ± 0.014 0.880 ± 0.009 55%raw+all agg 0.867 ± 0.010 0.889 ± 0.008 66%Figure 6.6: ROC curves for e-commerce transactions with logistic regression.
99
Cette thèse est accessible à l'adresse : http://theses.insa-lyon.fr/publication/2019LYSEI110/these.pdf © [Y. Lucas], [2019], INSA de Lyon, tous droits réservés

Feature set no HMM features HMM features increase through HMMsraw 0.0094 ± 0.0001 0.030 ± 0.002 219%raw+aggCH 0.014 ± 0.001 0.0247 ± 0.02 76.4%raw+all agg 0.0161 ± 0.0003 0.0315 ± 0.0007 95.6%
Figure 6.7: Precision-recall curves for face-to-face transactions with logistic regression. (Eachcolor corresponds to a specific feature set, the line style corresponds to the presence or not ofHMM-based features).
Feature set no HMM-features HMM-features error decreaseraw 0.916 ± 0.002 0.943 ± 0.003 32.2%raw+aggCH 0.923 ± 0.014 0.943 ± 0.002 26%raw+all agg 0.933 ± 0.004 0.948 ± 0.005 32.5%
Figure 6.8: ROC curves for face-to-face transactions with logistic regression.
We tuned the logistic regression hyperparameters (table 6.4) through a grid searchthat optimized the Precision-Recall Area under the Curve on the validation set.
100
Cette thèse est accessible à l'adresse : http://theses.insa-lyon.fr/publication/2019LYSEI110/these.pdf © [Y. Lucas], [2019], INSA de Lyon, tous droits réservés

C parameter penalty tolerance for stopping{1, 10, 100} {l1, l2} {10, 100}
Table 6.4: Logistic regression grid search
We can observe in figures 6.8 and 6.6 that the face-to-face and the e-commerceresults both show a significant improvement in precision-recall AUC when addingthe proposed HMM-based features to the raw feature set. For the e-commercetransactions, this improvement ranges from 29.2% for the best feature set withoutHMM-based features (raw+all-agg for the e-commerce transactions) to 267% forthe worst feature set (raw for the e-commerce transactions). For the face-to-facetransactions, this improvement ranges from 76.4% for the best feature set with-out HMM-based features (raw+aggCH for the face-to-face transactions) to 219%for the worst feature set (raw for the face-to-face transactions).
The relative increase in ROC AUC when adding HMM-based features is muchlower due to the high value of these AUCs. However the decrease in misclassifi-cation done by the classifier is significant. It ranges from 26% to 32.5% for theface-to-face transactions and from 38.7% to 66% for the e-commerce transactions.The decrease in missclassification when adding HMM-based features to the stateof the art feature engineering strategy ([Whitrow et al., 2008]) is of 26% for theface-to-face transactions and 55% for the e-commerce transactions.
By comparing the AUC of the curves raw+aggCH and raw+aggCH+HMM,we observe that adding HMM-based features to the state of the art feature en-gineering strategy introduced in the work of Whitrow & al. leads to an increaseof 76.4% of the PR AUC for the face-to-face transactions and to an increase of55% of the PR AUC for the e-commerce transactions.
We observe a significant decrease in detection efficiency with logistic regres-sion classifiers compared to random forest classifier. Logistic regression classifieris known to be weak to categorical features encoded with a label encoder (categorytransformed to numbers) since the label encoding implies an order between thecategories that is irrelevant. The results obtained with logistic regression classi-fiers may be improved using one-hot encoding or frequency encoding like advisedin some other credit card fraud detection project ([Pozzolo, 2015], [Fabry, 2019]),however the evolution observed when including the proposed feature engineeringstrategy to logistic regression classifier is consistent with what we observed usingrandom forest classifier.
101
Cette thèse est accessible à l'adresse : http://theses.insa-lyon.fr/publication/2019LYSEI110/these.pdf © [Y. Lucas], [2019], INSA de Lyon, tous droits réservés

Addition to adaboost classifier
Feature set no HMM-features HMM-features increase through HMMsraw 0.103 ± 0.001 0.163 ± 0.007 58.3%raw+aggCH 0.238 ± 0.009 0.247 ± 0.011 3.8%raw+all agg 0.263 ± 0.004 0.264 ± 0.006 0.4%
Figure 6.9: Precision-recall curves for e-commerce transactions with Adaboost classifiers.(Each color corresponds to a specific feature set, the line style corresponds to the presence or notof HMM-based features.)
Feature set no HMM-features HMM-features error decreaseraw 0.857 ± 0.003 0.874 ± 0.013 11.9%raw+aggCH 0.873 ± 0.014 0.872 ± 0.004 -0.8%raw+all agg 0.907 ± 0.006 0.905 ± 0.003 -2.1%
Figure 6.10: ROC curves for e-commerce transactions with Adaboost classifiers.
102
Cette thèse est accessible à l'adresse : http://theses.insa-lyon.fr/publication/2019LYSEI110/these.pdf © [Y. Lucas], [2019], INSA de Lyon, tous droits réservés

Feature set no HMM features HMM features increase through HMMsraw 0.034 ± 0.003 0.058 ± 0.009 70.6%raw+aggCH 0.048 ± 0.002 0.079 ± 0.006 64.6%raw+all agg 0.053 ± 0.003 0.061 ± 0.004 15.1%
Figure 6.11: Precision-recall curves for face-to-face transactions with Adaboost classi-fiers.(Each color corresponds to a specific feature set, the line style corresponds to the presenceor not of HMM-based features).
Feature set no HMM-features HMM-features error decreaseraw 0.825 ± 0.004 0.853 ± 0.018 16%raw+aggCH 0.925 ± 0.024 0.937 ± 0.002 16%raw+all agg 0.83 ± 0.001 0.83 ± 0.001 0%
Figure 6.12: ROC curves for face-to-face transactions with Adaboost classifiers.
We tuned the Adaboost hyperparameters (table 6.5) through a grid search thatoptimized the Precision-Recall Area under the Curve on the validation set.
103
Cette thèse est accessible à l'adresse : http://theses.insa-lyon.fr/publication/2019LYSEI110/these.pdf © [Y. Lucas], [2019], INSA de Lyon, tous droits réservés

tree numbers learning rate tolerance for stopping max tree depth{100, 400} {0.1, 1, 100} {10, 100} {1, 4}
Table 6.5: Adaboost grid search
We can observe in figures 6.10 and 6.12 that the face-to-face and the e-commerce results both show a significant improvement in precision-recall AUCwhen adding the proposed HMM-based features to the raw feature set. For thee-commerce transactions, the improvement is significant for the less informativefeature sets (58.3% improvement in PR AUC for the worst feature set). For theface-to-face transactions, this improvement ranges from 15.1% for the best featureset without HMM-based features (raw+all-agg for the face-to-face transactions)to 70.6% for the worst feature set (raw for the face-to-face transactions).
The relative increase in ROC AUC when adding HMM-based features is muchlower due to the high value of these AUCs. However there is a small decrease inmisclassification done by the classifier. It ranges from 0% to 16% for the face-to-face transactions and from -2.1% to 11.9% for the e-commerce transactions.The decrease in missclassification when adding HMM-based features to the stateof the art feature engineering strategy ([Whitrow et al., 2008]) is of 0% for thee-commerce transactions and 16% for the face-to-face transactions.
By comparing the AUC of the curves raw+aggCH and raw+aggCH+HMM,we observe that adding HMM-based features to the state of the art feature en-gineering strategy introduced in the work of Whitrow & al. leads to an increaseof 64.6% of the PR AUC for the face-to-face transactions and to an increase of3.8% of the PR AUC for the e-commerce transactions.
We observed that shallow adaboost classifiers with a tree depth restricted to1 as adviced in the literature ([Pedregosa et al., 2011]) lead to significantly worsedetection of fraudulent transactions than deeper adaboost classifiers using treesof depth 4. The downside of deeper trees is the increased risk of overfitting ofthe adaboost classifiers since this ensemble method doesn’t prevent overfittinglike random forest do. Monitoring the number of iterations (tree added) fromwhich the classifier starts to overfit could be done by tracking the PR-AUC onthe validation set and on the training set. Due to adaboost design, the PR-AUCon the training set should increase for each tree added, however when the classi-fier overfits, the PR-AUC on the validation set would decrease when the classifieroverfits: the classifier will start to learn particularities of the training set that arenot relevant in other sets.
We can also note that the AUCs obtained with adaboost classifiers are larger
104
Cette thèse est accessible à l'adresse : http://theses.insa-lyon.fr/publication/2019LYSEI110/these.pdf © [Y. Lucas], [2019], INSA de Lyon, tous droits réservés

than the AUCs obtained with logistic regression classifier. This can be due to thefact that adaboost classifiers is composed by decision trees which are adapted tolabel encoded categorical features.
Conclusion
Overall, we can observe that, whatever the classifier used, the addition of fea-tures that describe the sequence of transactions, be it HMM-based features orWhitrow’s aggregated features, increases a lot the Precision-Recall AUC on bothe-commerce and face-to-face transactions. The addition of HMM-based featuresimproves the prediction on both e-commerce and face-to-face transactions andallows the classifiers to reach the best levels of accuracy on both e-commerce andface-to-face transactions.
6.2.2 Robustness to hyperparameters changes
In order to understand if the feature engineering strategy is resilient to a changeof the hyperparameters used for the construction of the HMM-based features,we constructed 9 sets of HMM-based features with different combinations of theHMM-based features hyperparameters. The hyperparameters considered are thenumber of hidden states in the HMMs and the size of the sequence of past trans-actions used for the calculation of the likelihood score.
We used random forest to measure the AUC obtained on the test set whenadding different set of HMM-based features obtained with different combinationsof hyperparameters to the raw feature set. We chose random forest classifiers forthis evaluation since the precedent study showed that they were the best classifierfor our credit card fraud detection task.
Window size3 5 7
Hidden 3 0.280 ± 0.013 0.292 ± 0.015 0.295 ± 0.019states 5 0.315 ± 0.008 0.310 ± 0.006 0.297 ± 0.007
7 0.307 ± 0.003 0.307 ± 0.004 0.296 ± 0.011
Table 6.6: PR-AUCs for E-commerce HMM hyperparameters (raw = 0.203± 0.005)
We observe that, the combination of parameter {window size: 3, hiddenstates: 5} gives the best AUCs on average on 3 runs. However the standarddeviation values (±) are too high to confidently say that a hyperparameters com-bination is better than all the others.
105
Cette thèse est accessible à l'adresse : http://theses.insa-lyon.fr/publication/2019LYSEI110/these.pdf © [Y. Lucas], [2019], INSA de Lyon, tous droits réservés

Window size3 5 7
Hidden 3 0.159 ± 0.020 0.135 ± 0.007 0.150 ± 0.013states 5 0.139 ± 0.006 0.135 ± 0.012 0.123 ± 0.009
7 0.129 ± 0.008 0.131 ± 0.009 0.124 ± 0.007
Table 6.7: PR-AUCs for Face-to-face HMM hyperparameters (raw = 0.089± 0.011)
In a real world case, doing the hyperparameter search can be worth it butrequires to calculate several set of HMM-based features. Overall we can concludethat the HMM-based feature engineering strategy is relatively stable over thehyperparameters.
We also observed that adding all 9 newly calculated HMM-based featuressets provided a slight improvement on the face-to-face transactions (13.3%). Wethought that adding HMM-based features with different hyperparameters couldpossibly bring different type of information. For example the window-size pa-rameter could be seen as: description of short-term/mid-term/long-term historyof the transaction. This small improvement wasn’t observed on the e-commercetransactions (8.5% decrease).
6.3 Handling the missing value limitations
e-commerce face-to-face# transactions # frauds # transactions # frauds
All transactions 5.4 ∗ 106 18472 6.8 ∗ 106 2764History >= 3 4.5 ∗ 106 15650 5.3 ∗ 106 1305History >= 7 3.4 ∗ 106 12493 4.1 ∗ 106 859
Table 6.8: Number of transactions in the test set with different history constraints(History >= 3 means that all the transactions have at least 2 transactions in the past forthe card-holder and for the terminal: we can build sequences of 3 transactions for both per-spectives)
With the HMM feature engineering framework, we can calculate sets of HMMfeatures for different window sizes. However, when the transaction history is notbig enough we can’t calculate the HMM-based features for it. Because of thislimitation we could not consider around 20% of the transactions for the experi-ments of the results section (6.2.1) and around 40% of the transactions for theexperiments of the hyperparameter section (6.2.2). There is a strong need totackle the issue of structural missing values depending on the length of userssequences in order to integrate transactions with short history where part or all
106
Cette thèse est accessible à l'adresse : http://theses.insa-lyon.fr/publication/2019LYSEI110/these.pdf © [Y. Lucas], [2019], INSA de Lyon, tous droits réservés

of the HMM-based features couldn’t have been calculated.
In this section we consider 9 sets of HMM based features obtained with awindow size of 3, 5 and 7 for the card-holder or for the terminal. We thereforehave 16 sets of transactions with different history constraints (terminal history:[0, 3, 5, 7] ∗ card-holder history: [0, 3, 5, 7]).
We try 3 missing values strategies in order to be able to combine predictionsfor different history constraints:
default0 a genuine default value solution where the HMM-based features thatcouldn’t have been calculated for the current transactions are replaced by0.
weighted PR a weighted sum of the predictions of the random forests special-ized on the history constraints of the transaction, among 16 random forestseach trained on one of the 16 possible history constraints. (For example,for a transaction with a terminal history of 6 and a card-holder history of3 we will sum the predictions of the random forests [0,0], [0, 3], [3, 0], [3,3], [5, 0], [5, 3]2). Each random forest is weighted by it’s efficiency on thevalidation set. We used PR AUCs values as weights for the random forests.
stacked RF a stacking approach where a random forest classifier is trained onthe predictions of the 16 random forests specialized on the constraints (0for missing prediction, when the transaction doesn’t satisfy the constraintsof the considered random forest). This approach has the second benefitthat we might stack indivual classifiers thereby creating a more accuratenew one.
Other approaches to handle missing values advise to generate them by modellingthe distribution of the corresponding features. We considered that these solutionsdon’t apply in our case since the missing values appear because there wasn’tenough historical information to calculate the corresponding feature. We thoughtthat replacing the value of a model based feature (HMM based features) usingan other model (k-nearest neighbours or random forest) wasn’t an appropriatesolution.
We can observe in table 6.9 that the simplest solution (default0 ) allows forthe best PR-AUCs with the best stability for both face-to-face and e-commercetransactions. This is also by far the fastest method since it needs to only trainone random forest instead of 16 (resp. 17) for the weighted PR approach (resp.
2The first number describes the terminal history constraint, the second number describes thecard-holder history constraint
107
Cette thèse est accessible à l'adresse : http://theses.insa-lyon.fr/publication/2019LYSEI110/these.pdf © [Y. Lucas], [2019], INSA de Lyon, tous droits réservés

e-commerce face-to-facePR-AUC PR-AUC
raw (no HMM-based features) 0.264± 0.002 0.058± 0.012default0 0.320± 0.001 0.145± 0.004weighted PR 0.275± 0 0.040± 0.002stacked RF 0.317± 0.002 0.133± 0.021
Table 6.9: Fraud detection on the whole test set with different missing values strategies
stacked RF approach).
The weighted PR solution doesn’t allow for satisfying results. However thestacked RF solution gives good PR-AUCs and presents interesting properties inorder to combine different types of classifiers. It could be interesting to combinethe predictions of an LSTM with the prediction of some HMM-based featuresenhanced random forest since these classifiers have been shown to not detect thesame frauds in face-to-face transactions by [Jurgovsky et al., 2018].
Finding satisfying solutions to integrate transactions with structural missingvalue increases drastically the scope of the proposed framework (see table 6.8).The number of transactions that have satisfying characteristics to be classifiedusing the HMM-based features framework is increased by 58% in the face-to-face context and by 65% in the e-commerce context with the addition of anappropriate missing value strategy. Moreover it adds an other perspective to theframework: HMM-based features calculated for a small (resp. big) window-sizewill characterize the short (resp. long) term history.
6.4 Summary
The terminal perspective is usually not used in credit card fraud detection and isshown in this paper to greatly help the detection for face-to-face and e-commercetransactions.
The results show an increase in the precision-recall AUC (18.1% for the face-to-face transactions and 9.3% for the e-commerce ones) due to the addition ofour multi-perspective HMM-based features when compared to the state of theart feature engineering strategies. We also showed that this increase is robust tothe hyperparameters of the HMMs.
Moreover, we briefly compare the most common solutions in order to handlethe structural missing value problem that happens when the history of the card-holder (resp. terminal) is too short.
108
Cette thèse est accessible à l'adresse : http://theses.insa-lyon.fr/publication/2019LYSEI110/these.pdf © [Y. Lucas], [2019], INSA de Lyon, tous droits réservés
Chapter 7
Perspectives and conclusions
7.1 Perspectives
7.1.1 Frequential decomposition for transactions clustering
Further work could be done in order to characterize the buying behaviour (ei-ther restricted to the sequences of the card-holders/merchants or for the wholedataset) from a frequential point of view. Indeed, Fourier transforms allow usersto decompose any signal (for example the sequence of amount spent, or the se-quence of timings) into sub-signals for a deeper understanding of the underlyingbehaviour.
For example, a research direction to follow would be to find a way to separatedifferent buying habits with the help of Fourier decomposition or Wavelet decom-position in order to associate and compare incoming transactions with transac-tions of the same type. This could allow to divide a set of examples into severalspecialized sets containing only transactions of the same type (everyday transac-tions, holidays transactions, christmas transactions, Back to School transactions,etc). These sets could afterwards be leveraged for training more specialized clas-sifiers, or optimize the parameters of hidden Markov models in order to modelparticular types of buying behaviours in the context of the multiple perspectiveHMM-based feature engineering described in this thesis.
In the end, knowledge coming from the frequency domain could bring tolight helpful information in order to differenciate buying behaviours and maybeincrease the detection of fraudulent credit card transactions.
109
Cette thèse est accessible à l'adresse : http://theses.insa-lyon.fr/publication/2019LYSEI110/these.pdf © [Y. Lucas], [2019], INSA de Lyon, tous droits réservés

7.1.2 Interpretation of classifier decision
As highlighted in the research questions, interpretability is a crucial challengeof machine learning. Indeed, some of the most popular models are black boxesbecause of their number of parameters: it is not humanly possible to understandthe decision process of neural networks or random forests by printing the millionsof weights linking neurons or by looking at each decision tree one by one.
Besides, machine learning is taking more and more space in everyday life andtherefore more and more crucial decisions are taken with the help of machinelearning algorithms in domains such as medical diagnosis, fraud detection, au-tonomous driving, etc. Being able to explain models decisions is very importantin case of model failure: an insurance would want to know why an autonomouscar has crashed, a relative would want to know why the data driven medical di-agnosis model failed to discover the disease it was supposed to discover.
There already exists approaches in order to approach model decisions:
• First, some models contain a small enough number of parameters to be hu-manly understandable. One of the asset of the multiple perspective HMM-based feature engineering highlighted in this thesis is that since HMM con-tain few parameters (63 for a gaussian HMM with 7 hidden states). Thissmall number of parameter allows to output the trained model and ana-lyze its decision: for example we could observe that genuine sequences ofamount modelled by the HMM are steadier than fraudulent sequences ofamount. Moreover, such small models are not able to strongly fit to thedata due to their reduced number of parameter. This is an asset and adrawback: the model has to compress the observed behaviours and retainonly a strong abstraction of it, therefore it is more prone to underfitting(see section 2.1.2.
• Studying the features importances of tree based classifiers also enables toidentify which attributes are more relevant for the classifier decision.Authorssuch as [Karax et al., 2019] used feature importance vectors for characteriz-ing the evolution of classifiers decision. However, we observed that the fea-ture importance varies for different types of classifiers for the same learningtask: boosting trees feature importance vectors and random forest featureimportance vectors were very different for the credit card fraud detectiontask for example. Moreover, feature importance has biases towards categor-ical features with a big number of categories according to [Altmann et al.,2010].
• Recently some model agnostic methods have been proposed in order to
110
Cette thèse est accessible à l'adresse : http://theses.insa-lyon.fr/publication/2019LYSEI110/these.pdf © [Y. Lucas], [2019], INSA de Lyon, tous droits réservés
reach model decision. [Pastor and Baralis, 2019] proposed to approach theclassifiers decisions with rules that are produced in the neighbourhood ofthe model decision function. The set of rules produced can afterwards beused in order to have a coarse-grained view of the model decision. [Alt-mann et al., 2010] proposed to use permutation importance instead, whichmeasure the importance of a feature for model decision by the decrease inmodel prediction when shuffling the elements of this feature. If the de-crease is important when shuffling a considered feature, that means thatthis feature was important for the classifier decision and that having it noninformative (because shuffled) cripple the classifier. Others authors suchas [Zintgraf et al., 2017] aimed to understand neural networks decisions byusing prediction difference analyis1 in order to highlight which portions ofan image are relevant in an image classification task (ImageNet).
However, one question that is still to be adressed for model interpretability is:"Towards which class prediction a given attribute move the decision function?"Indeed, the aforementioned methods quantify the importance of each attributefor the decision but aren’t able to explain in which direction each attribute movesthe decision: some questions such as: "Are transactions with a big amount morelikely to be predicted as fraudulent transactions?" can not be answered by thesemethods.
Interpretability of machine learning model is a trendy topic and a motivatingresearch direction. We could measure the importance of this question during themeetings with our industrial partner Worldline: it is harder to trust a modeldecision if its decision is obfuscated.
7.2 Conclusions
At the beginning of this work we introduced the stakes of credit card fraud de-tection and how it is managed in practice. More precisely, we introduced theconcepts of real time and near real time fraud detection in one hand, and thedouble authentication routines performed for e-commerce and for face-to-facetransactions.
However, an axis of progression that was still subject to explorations is: howto describe and afterwards integrate the contextual information relative to eachcredit card transaction? Indeed, fraudulent credit card transactions are very sim-ilar to genuine credit card transactions and the knowledge of the buying habits of
1Similarly to permutation importance, the prediction difference analysis estimates the rele-vance of a feature by measuring how the prediction changes when the feature is unknown
111
Cette thèse est accessible à l'adresse : http://theses.insa-lyon.fr/publication/2019LYSEI110/these.pdf © [Y. Lucas], [2019], INSA de Lyon, tous droits réservés

the concerned card-holder may help distinguish the genuine transactions from thefraudulent transactions within his sequence. Moreover, the buying behaviours aresubject to change over seasons and affect the ability of a fraud detection systemto efficiently detect fraudulent transactions.
The main contributions of this work lead to the construction of a frameworkin order to model in an effective way sequential behaviours from multiple perspec-tives (see chapter 5). Typical approaches for considering sequences in a creditcard fraud detection context aim to extract descriptive statistics from genuinecard-holder sequences of transactions.
• The first contribution of this work is to consider terminal perspective inaddition to card-holder perspective. It has been shown in section 5.1.2 thatgenuinely considering the terminal perspective leads to an average of 10%increase in precision-recall AUC.
• Second, we proposed to model not only genuine behaviours but also fraud-ulent behaviours (for both card-holder and terminal perspectives). Therationale is that to have a risk of fraud, it is not enough for a new sequenceto be far from a genuine buying behaviour but it is also expected for itto be relatively close to a risky behaviour. Assessing the distance froma fraudulent behaviour would allow the classifier to reduce the number offalse alerts where the buying behaviour diverge from an usual behaviourwithout being similar to a risky behaviour.
• Finally, we observed that the state of the art fraud detection feature engi-neering approaches aimed to extract descriptive statistics from sequencesin order to enrich transaction information. We highlighted in section 5.1.3that these descriptive statistic would fail to reveal differencies between twovery different types of card-holders sequences: steady transactions amountsvs oscillating transactions amounts. We chose to use a generative model(hidden Markov model) in order to describe the temporal dependencies be-tween the transactions of a sequence. The choice of a generative model wasmotivated because we wanted to really represent the sequential behaviourwhereas a discriminant model would represent the sequential relationshipbetween a target variable y and a set of attributes x.
Using this multiple perspective HMM-based feature engineering strategy, wecould increase the precision-recall AUC of 18.1% for face-to-face credit card frauddetection and 9.3% for the e-commerce credit card fraud detection. Moreover,we could show that this feature engineering strategy is relevant for various typesof classifiers (random forest, logistic regression and Adaboost) and robust to hy-perparameters choices made for constructing the features. The main drawback
112
Cette thèse est accessible à l'adresse : http://theses.insa-lyon.fr/publication/2019LYSEI110/these.pdf © [Y. Lucas], [2019], INSA de Lyon, tous droits réservés

of this approach is the fact that there may be structural missing values when thehistory is too short to calculate the value of such HMM-based features. Severalsolutions were benchmarked in order to provide a feature engineering that canbe applied for all the transactions, including the ones with short history. Wecan imagine building similar HMM-based features in any supervised task thatinvolves a sequential dataset.
The other contribution of this work was to propose a method for qualifyingthe seasonal covariate shift in any temporal dataset (see chapter 4). We built adistance matrix between the days of the credit card transactions dataset by eval-uating the ability of a classifier to predict the day of each transaction. We couldshow that, within the belgian credit card transactions dataset, the covariate shiftfollowed a calendar-based pattern. When integrating this covariate shift knowl-edge in the credit card fraud detection process, we observed a slight increase inprecision-recall AUC.
The multiple perspectives HMM-based feature engineering strategy was provento be an asset in order to increase classifiers performance for the credit card frauddetection task. It is even more interesting since approaches to characterize se-quences of multidimensional categorical attributes are less prevalent than meth-ods to characterize sequences of continuous signals in the litteratiure. Moreover,this method is not specific to credit card fraud detection and could be exportedto other application domains such as medical diagnosis for example. We canimagine that modelling past evolution of the symptoms of a patient in order tocompute a risk score of his situation could be relevant for decision takers, be itmachine learning models or doctors.
113
Cette thèse est accessible à l'adresse : http://theses.insa-lyon.fr/publication/2019LYSEI110/these.pdf © [Y. Lucas], [2019], INSA de Lyon, tous droits réservés

Cette thèse est accessible à l'adresse : http://theses.insa-lyon.fr/publication/2019LYSEI110/these.pdf © [Y. Lucas], [2019], INSA de Lyon, tous droits réservés

Bibliography
[Abdallah et al., 2016] Abdallah, A., Maarof, M. A., and Zainal, A. (2016).Fraud detection system: A survey. Journal of Network and Computer Ap-plications.
[Acuna and Rodriguez, 2004] Acuna, E. and Rodriguez, C. (2004). The treat-ment of missing values and its effect on classifier accuracy. Classification,clustering and data mining applications.
[Alaiz-Rodriguez and Japkowicz, 2008] Alaiz-Rodriguez, R. and Japkowicz, N.(2008). Assessing the impact of changing environments on classifier perfor-mance. Conference of the Canadian Society for Computational Studies of In-telligence, Springer.
[Ali et al., 2019] Ali, M. A., Azad, M. A., Centeno, M. P., Hao, F., and vanMoorsel, A. (2019). Consumer-facing technology fraud: Economics, attackmethods and potential solutions. Future Generation Computer Systems (vol-ume 100).
[Altmann et al., 2010] Altmann, A., Tolosi, L., Sander, O., and Lengauer, T.(2010). Permutation importance: a corrected feature importance measure.Bioinformatics 26(10).
[Baesens et al., 2015] Baesens, B., Vlasselaer, V. V., and Verbeke, W. (2015).Fraud analytics using descriptive, predictive, and social network techniques: Aguide to data science for fraud detection. Book published by Wiley.
[Bahnsen et al., 2015] Bahnsen, A. C., Aouada, D., Stojanovic, A., and Otter-sten, B. (2015). Detecting credit card fraud using periodic features. IEEE 14thInternational Conference on Machine Learning and Applications.
[Bahnsen et al., 2016] Bahnsen, A. C., Ouada, D., Stojanovic, A., and Ottersten,B. (2016). Feature engineering strategies for credit card fraud detection. ExpertSystems with Applications.
115
Cette thèse est accessible à l'adresse : http://theses.insa-lyon.fr/publication/2019LYSEI110/these.pdf © [Y. Lucas], [2019], INSA de Lyon, tous droits réservés

[Barddal and Enembreck, 2019] Barddal, J. P. and Enembreck, F. (2019). Learn-ing regularized hoeffding trees from data streams. 34th ACM/SIGAPP Sym-posium on Applied Computing (SAC2019).
[Batista et al., 2000] Batista, G., Carvalho, A. C., and Monard, M. C. (2000).Applying one-sided selection to unbalanced datasets. MICAI 2000: Advancesin Artificial Intelligence.
[Batista et al., 2004] Batista, G., Prati, R., and Monard, M. C. (2004). A studyof the behavior of several methods for balancing machine learning trainingdata. ACM SIGKDD Explorations Newsletter.
[Bauer and Kohavi, 1999] Bauer, E. and Kohavi, R. (1999). An empirical com-parison of voting classification algorithms: Bagging, boosting, and variants.Machine learning 36(1-2).
[Baum, 1972] Baum, L. E. (1972). An inequality and associated maximizationtechnique. Statistical estimation for probabilistic functions of Markov processes.
[Bayer, 2015] Bayer, J. S. (2015). Learning sequence representations. PhD thesis,Technische Universitat Munchen.
[Bengio and Frasconi, 1995] Bengio, Y. and Frasconi, P. (1995). An input outputhmm architecture. Advances in neural information processing systems.
[Bengio et al., 1994] Bengio, Y., Simard, P., and Frasconi, P. (1994). Learninglong-term dependencies with gradient descent is difficult. IEEE transactionson neural networks.
[Best and Fisher, 1979] Best, D. J. and Fisher, N. I. (1979). Efficient simulationof the von mises distribution. Journal of the Royal Statistical Society.
[Bhattacharyya et al., 2011] Bhattacharyya, S., Jha, S., Tharakunnel, K., andWestland, J. C. (2011). Data mining for credit card fraud: A comparativestudy. Decision support systems.
[Bickel et al., 2007] Bickel, S., Brückner, M., and Scheffer, T. (2007). Discrimi-native learning for differing training and test distributions. Proceedings of the24th International conference on Machine learning.
[Bifet and Gavalda, 2009] Bifet, A. and Gavalda, R. (2009). Adaptive learningfrom evolving data streams. International Symposium on Intelligent Data Anal-ysis.
[Blattberg et al., 2008] Blattberg, R. C., Kim, B.-D., and Neslin, S. A. (2008).Database marketing: analyzing and managing customers. Book published bySpringer.
116
Cette thèse est accessible à l'adresse : http://theses.insa-lyon.fr/publication/2019LYSEI110/these.pdf © [Y. Lucas], [2019], INSA de Lyon, tous droits réservés
[Bolton and Hand, 2001] Bolton, R. J. and Hand, D. J. (2001). Unsupervisedprofiling methods for fraud detection. Credit Scoring and Credit Control.
[Bolton and Hand, 2002] Bolton, R. J. and Hand, D. J. (2002). Statistical frauddetection: a review. Statistical science.
[Bontemps et al., 2016] Bontemps, L., Cao, V. L., McDermott, J., and Le-Khac,N.-A. (2016). Collective anomaly detection based on long short-term mem-ory recurrent neural networks. International Conference on Future Data andSecurity Engineering.
[Breiman, 1996] Breiman, L. (1996). Bagging predictors. Machine learning 24(2).
[Breiman, 2001] Breiman, L. (2001). Random forests. Machine learning 45(1).
[Carcillo et al., 2018] Carcillo, F., Pozzolo, A. D., Borgne, Y.-A. L., Caelen, O.,Mazzer, Y., and Bontempi, G. (2018). Scarff; a scalable framework for stream-ing credit card fraud detection with spark. Information Fusion.
[Chandola et al., 2012] Chandola, V., Banerjee, A., and Kumar, V. (2012).Anomaly detection for discrete sequences: A survey. IEEE Transactions onKnowledge and Data Engineering.
[Chawla, 2005] Chawla, N. V. (2005). Data mining for imbalance datasets: anoverview. Data mining and knowledge discovery handbook.
[Chawla et al., 2002] Chawla, N. V., Bowyer, K. W., Hall, L. O., andKegelmeyer, W. P. (2002). Smote: Synthetic minority over-sampling tech-nique. Journal of Artificial Intelligence Research 16.
[Chawla et al., 2004] Chawla, N. V., Japkowicz, N., and Kotcz, A. (2004). Ed-itorial: special issue on learning from imbalanced data sets. ACM SIGKDDExplorations Newsletter.
[Chawla et al., 2003] Chawla, N. V., Lazarevic, A., Bowyer, K. W., and Hall,L. O. (2003). Smoteboost: Improving prediction of the minority class in boost-ing. Knowledge Discovery in Databases: PKDD.
[de Fortuny et al., 2014] de Fortuny, E. J., Stankova, M., Moeyersoms, J., Min-naert, B., Provost, F., and Martens, D. (2014). Corporate residence frauddetection. Proceedings of the 20th ACM SIGKDD international conference onKnowledge discovery and data mining.
[Delamaire et al., 2009] Delamaire, L., Abdou, H., and Pointon, J. (2009). Creditcard fraud and detection techniques: a review. Banks and Bank systems.
117
Cette thèse est accessible à l'adresse : http://theses.insa-lyon.fr/publication/2019LYSEI110/these.pdf © [Y. Lucas], [2019], INSA de Lyon, tous droits réservés
[Dhok, 2012] Dhok, S. S. (2012). Credit card fraud detection using hiddenmarkov model. International Journal of Soft Computing and Engineering.
[Dietterich, 2002] Dietterich, T. G. (2002). Machine learning for sequential data:A review. Joint IAPR International Workshops on Statistical Techniques inPattern Recognition (SPR) and Structural and Syntactic Pattern Recognition(SSPR).
[Dorj et al., 2013] Dorj, E., Chen, C., and Pecht, M. (2013). A bayesian hiddenmarkov model-based approach for anomaly detection in electronic systems.IEEE Aerospace conference.
[Drummond and Holte, 2003] Drummond, C. and Holte, R. (2003). C4.5, classimbalance, and cost sensitivity: why undersampling beats over-sampling.Workshop on Learning from Imbalanced Datasets II.
[Elkan, 2001] Elkan, C. (2001). The foundations of cost-sensitive learning. In-ternational Joint Conference on Artificial Intelligence.
[Ergen et al., 2017] Ergen, T., Mirza, A. H., and Kozat, S. S. (2017). Unsuper-vised and semi-supervised anomaly detection with lstm neural networks. arXivpreprint.
[Estabrooks et al., 2004] Estabrooks, A., Jo, T., and Japkowicz, N. (2004). Amultiple resampling method for learning from imbalanced data sets. Compu-tational Intelligence.
[Europol, 2012] Europol (2012). Situation report: payment card fraudin the european union. perspective of law enforcement agencies.https://www.europol.europa.eu/publications-documents/situation-report-payment-card-fraud-in-european-union.
[Fabry, 2019] Fabry, R. (2019). equensworldline fraud risk management. CreditCard Fraud Detection Workshop.
[Fan et al., 1999] Fan, W., Stolfo, S. J., Zhang, J., and Chan, P. K. (1999).Adacost: misclassification cost-sensitive boosting. ICML.
[Fawcett and Provost, 1997] Fawcett, T. and Provost, F. (1997). Adaptive frauddetection. Data mining and knowledge discovery.
[Forrest et al., 1999] Forrest, S., Warrender, C., and Pearlmutter, B. (1999). De-tecting intrusions using system calls: Alternate data models. Proceedings ofthe 1999 IEEE ISRSP.
118
Cette thèse est accessible à l'adresse : http://theses.insa-lyon.fr/publication/2019LYSEI110/these.pdf © [Y. Lucas], [2019], INSA de Lyon, tous droits réservés

[Fossi and Gianini, 2019] Fossi, L. and Gianini, G. (2019). Managing a pool ofrules for credit card fraud detection by a game theory based approach. FutureGenerations Computer Systems.
[Fu et al., 2016] Fu, K., Cheng, D., Tu, Y., and Zhang, L. (2016). Credit cardfraud detection using convolutional neural networks. International Conferenceon Neural Information Processing.
[Gao et al., 2007] Gao, J., Fan, W., Han, J., and Yu, P. (2007). A general frame-work for mining concept-drifting data streams with skewed distributions. Pro-ceedings of the 2007 SIAM International Conference.
[Ghosh and Reilly, 1994] Ghosh, S. and Reilly, D. L. (1994). Credit card frauddetection with a neural-network. IEEE Proceedings of the Twenty-SeventhHawaii International Conference on System Sciences.
[Gomes et al., 2017] Gomes, H. M., Bifet, A., Read, J., Barddal, J. P., Enem-breck, F., Pfharinger, B., Holmes, G., and Abdessalem, T. (2017). Adaptiverandom forest for evolving data stream classification. Machine Learning 106(9).
[Gornitz et al., 2015] Gornitz, N., Braun, M., and Kloft, M. (2015). Hiddenmarkov anomaly detection. 32nd International Conference on Machine Learn-ing.
[Graves, 2012] Graves, A. (2012). Supervised sequence labelling with recurrentneural networks. Springer vol. 385.
[Graves and Jaitly, 2014] Graves, A. and Jaitly, N. (2014). Towards end-to-endspeech recognition with recurrent neural networks. Proceedings of the 31stInternational Conference on Machine Learning.
[Gretton et al., 2009] Gretton, A., Smola, A., Huang, J., Schmittful, M., andBorgwardt, K. (2009). Covariate shift by kernel mean matching. Dataset shiftin machine learning 3(4).
[Guo and Berkhahn, 2016] Guo, C. and Berkhahn, F. (2016). Entity embeddingsof categorical variables. CoRR.
[Han et al., 2005] Han, H., Wang, W.-Y., and Mao, B.-H. (2005). Borderline-smote: a new oversampling method in imbalanced data sets learning. Advancesin intelligent computing, Springer.
[He et al., 2008] He, H., Bai, Y., Garcia, E., and Li, S. (2008). Adasyn: Adaptivesynthetic sampling approach for imbalanced learning. IEEE International JointConference on Neural Networks.
119
Cette thèse est accessible à l'adresse : http://theses.insa-lyon.fr/publication/2019LYSEI110/these.pdf © [Y. Lucas], [2019], INSA de Lyon, tous droits réservés

[Hoare, 2019] Hoare, J. (2019). What is a decision tree? www.displayr.com/what-is-a-decision-tree/ (last visited: August 2019).
[Hochreiter and Schmidhuber, 1997] Hochreiter, S. and Schmidhuber, J. (1997).Long short-term memory. Neural computation 9.
[Hoens et al., 2011] Hoens, R. T., Chawla, N. V., and Polikar, R. (2011). Heuris-tic updatable weighted random subspaces for non-stationary environments.IEEE 11th International Conference on Data Mining.
[Hofmeyr et al., 1998] Hofmeyr, S. A., Forrest, S., and Somayaji, A. (1998). In-trusion detection using sequences of system calls. Journal of Computer Secu-rity.
[Hyunsoo et al., 2005] Hyunsoo, K., Golub, G. H., and Haesun, P. (2005). Miss-ing value estimation for dna microarray gene expression data: local leastsquares imputation. Bioinfomatics 21(2).
[Japkowicz and Stephen, 2002] Japkowicz, N. and Stephen, S. (2002). The classimbalance problem: a systematic study. Intelligent data analysis.
[Jha et al., 2012] Jha, S., Guillen, M., and Westland, J. (2012). Employing trans-action aggregatin strategy to detect credit card fraud. Expert Systems withApplications.
[Jurgovsky et al., 2018] Jurgovsky, J., Granitzer, M., Ziegler, K., Calabretto, S.,Portier, P.-E., He-Guelton, L., and Caelen, O. (2018). Sequence classificationfor credit-card fraud detection. Expert systems with applications.
[Karax et al., 2019] Karax, J. A. P., Malucelli, A., and Barddal, J. P. (2019).Decision tree-based feature ranking in concept drifting data streams. 34thACM/SIGAPP Symposium on Applied Computing (SAC2019).
[Kelly et al., 1999] Kelly, M. G., Hand, D. J., and Adams, N. M. (1999). Theimpact of changing populations on classifier performance. Proceedings of thefifth ACM SIGKDD international conference on Knowledge discovery and datamining ACM.
[Kingsford and Salzberg, 2008] Kingsford, C. and Salzberg, S. L. (2008). Whatare decision trees? Nat Biotechnol 26(9).
[Klinkenberg, 2003] Klinkenberg, R. (2003). Learning drifting concepts: Exampleselection vs. example weighting. Intelligent Data Analysis vol 8.
[Kolter and Maloof, 2003] Kolter, J. Z. and Maloof, M. A. (2003). Dynamicweighted majority: A new ensemble method for tracking concept drift. ThirdIEEE International conference on data mining.
120
Cette thèse est accessible à l'adresse : http://theses.insa-lyon.fr/publication/2019LYSEI110/these.pdf © [Y. Lucas], [2019], INSA de Lyon, tous droits réservés

[Kotsiantis, 2007] Kotsiantis, S. (2007). Supervised machine learning: A reviewof classification techniques. Informatica.
[Kubat and Matwin, 1997] Kubat, M. and Matwin, S. (1997). Addressing thecurse of imbalanced training sets: one-sided selection. ICML.
[Kukar and Kononenko, 1998] Kukar, M. and Kononenko, I. (1998). Cost-sensitive learning with neural networks. ECAI.
[Lafferty et al., 2001] Lafferty, J., McCallum, A., and Pereira, F. C. N. (2001).Conditional random fields: Probabilistic models for segmenting and labelingsequence data. Proceedings of the 18th International Conference on MachineLearning (ICML 2001).
[Laleh and Azgomi, 2009] Laleh, N. and Azgomi, M. A. (2009). A taxonomy offrauds and fraud detection techniques. International Conference on Informa-tion Systems, Technology and Management.
[Lane and Brodley, 1998] Lane, T. and Brodley, C. E. (1998). Approaches toonline learing and concept drift for user identification in computer security.KDD.
[Lichtenwalter and Chawla, 2009] Lichtenwalter, R. N. and Chawla, N. V.(2009). Adaptive methods for classification in arbitrarily imbalanced and drift-ing data streams. Pacific-Asia Conference on Knowledge Discovery and DataMining.
[LifeCLEF, 2018] LifeCLEF (2018). Lifeclef 2018 bird challenge.https://www.imageclef.org/node/230 (visited during 08/2019).
[Liu et al., 2009] Liu, X.-Y., Wu, J., and Zhou, Z.-H. (2009). Exploratory under-sampling for class-imbalance learning. Systems, Man, and Cybernetics, part B:Cybernetics.
[Lucas et al., 2019a] Lucas, Y., Portier, P.-E., Laporte, L., Calabretto, S., Cae-len, O., He-Guelton, L., and Granitzer, M. (2019a). Multiple perspec-tives hmm-based feature engineering for credit card fraud detection. 34thACM/SIGAPP Symposium on Applied Computing (SAC2019).
[Lucas et al., 2019b] Lucas, Y., Portier, P.-E., Laporte, L., Calabretto, S., Cae-len, O., He-Guelton, L., and Granitzer, M. (2019b). Towards automated featureengineering for credit card fraud detection using multi-perspective hmms. Fu-ture Generations Computer Systems Special Issue on: Data Exploration in theWeb 3.0 Age.
121
Cette thèse est accessible à l'adresse : http://theses.insa-lyon.fr/publication/2019LYSEI110/these.pdf © [Y. Lucas], [2019], INSA de Lyon, tous droits réservés

[Lucas et al., 2019c] Lucas, Y., Portier, P.-E., Laporte, L., Calabretto, S., He-Guelton, L., Oblé, F., and Granitzer, M. (2019c). Dataset shift quantificationfor credit card fraud detection. Artificial intelligence and knowledge engineering(AIKE2019).
[Malhotra et al., 2015] Malhotra, P., Vig, L., Shroff, G., and Agarwal, P. (2015).Long short term memory networks for anomaly detection in time series. Eu-ropean Symposium on Artificial Neural Networks, Computational Intelligenceand Machine Learning.
[Mani and Zhang, 2003] Mani, I. and Zhang, I. (2003). knn approach to un-balanced data distributions: a case study involving information extraction.Proceedings of Workshop on Learning from Imbalanced Datasets.
[McCallum et al., 2000] McCallum, A., Freitag, D., and Pereira, F. (2000). Max-imum entropy markov models for information extraction and segmentation.17th International Conference on Machine Learning (ICML 2000).
[Mikolov et al., 2011] Mikolov, T., Deoras, A., Kombrink, S., Burget, L., andCernocky, J. (2011). Empirical evaluation and combination of advanced lan-guage modeling techniques. 12th Annual Conference of the International SpeechCommunication Association.
[Moreno-Torres et al., 2012] Moreno-Torres, J., Raeder, T., Alaiz-Rodriguez, R.,Chawla, N. V., and Herrera, F. (2012). A unifying view on dataset shift inclassification. Pattern recognition.
[Moreno-Torres et al., 2013] Moreno-Torres, J. G., Llora, X., Goldberg, D. E.,and Bhargava, R. (2013). Repairing fractures between data using geneticprogramming-based feature extraction: A case study in cancer diagnosis. In-formation Sciences 222.
[Noghani and Moattar, 2015] Noghani, F. F. and Moattar, M. H. (2015). Ensem-ble classification and extended feature selection for credit card fraud detection.Journal of AI and Data Mining.
[Oba et al., 2003] Oba, S., Sato, M. A., Takemasa, I., Monden, M., Matsubara,K. I., and Ishii, S. (2003). A bayesian missing value estimation method forgene expression profile data. Bioinfomatics 19(16).
[Pastor and Baralis, 2019] Pastor, E. and Baralis, E. (2019). Explaining blackbox models by means of local rules. 34th ACM/SIGAPP Symposium on AppliedComputing (SAC2019).
122
Cette thèse est accessible à l'adresse : http://theses.insa-lyon.fr/publication/2019LYSEI110/these.pdf © [Y. Lucas], [2019], INSA de Lyon, tous droits réservés
[Patidar et al., 2011] Patidar, R., Sharma, L., et al. (2011). Credit card frauddetection using neural network. International Journal of Soft Computing andEngineering (IJSCE).
[Pedregosa et al., 2011] Pedregosa, F., Varoquaux, G., Gramfort, A., Michel, V.,Thirion, B., Grisel, O., Blondel, M., Prettenhofer, P., Weiss, R., Dubourg,V., Vanderplas, J., Passos, A., Cournapeau, D., Brucher, M., Perrot, M., andDuchesnay, E. (2011). Scikit-learn: Machine learning in Python. Journal ofMachine Learning Research.
[Power, 2011] Power, D. (2011). Evaluation: from precision, recall and f-measureto roc, informedness, markedness and correlation. Journal of machine learningtechnology (1).
[Pozzolo, 2015] Pozzolo, A. D. (2015). Adaptive machine learning for credit cardfraud detection. PhD Thesis.
[Pozzolo et al., 2017] Pozzolo, A. D., Boracchi, G., Caelen, O., Alippi, C., andBontempi, G. (2017). Credit card fraud detection: a realistic modeling anda novel learning strategy. IEEE transactions on neural networks and learningsystems.
[Pozzolo et al., 2014] Pozzolo, A. D., Caelen, O., and Borgne, Y. L. (2014).Learned lessons in credit card fraud detection from a practitioner perspective.Expert systems with applications.
[Quinlan, 1996] Quinlan, R. J. (1996). Bagging, boosting and c4.5. AAAI/IAAIVol. 1.
[Rabiner and Juang, 1991] Rabiner, L. R. and Juang, B. H. (1991). Hiddenmarkov models for speech recognition. Technometrics.
[Rashid et al., 2016] Rashid, T., Agrafiotis, I., and Nurse, J. R. C. (2016). A newtake on detecting insider threats: exploring the use of hidden markov mod-els. ACM CCS International Workshop on Managing Insider Security Threats(MIST).
[Robinson and Aria, 2018] Robinson, W. N. and Aria, A. (2018). Sequentialfraud detection for prepaid cards using hidden markov model divergence. Ex-pert Systems with Applications.
[Rumelhart et al., 1986] Rumelhart, D. E., Hinton, G. E., and Williams, R. J.(1986). Learning representations by back-propagating errors. Cognitive mod-eling.
123
Cette thèse est accessible à l'adresse : http://theses.insa-lyon.fr/publication/2019LYSEI110/these.pdf © [Y. Lucas], [2019], INSA de Lyon, tous droits réservés
[Russac et al., 2018] Russac, Y., Caelen, O., and He-Guelton, L. (2018). Embed-dings of categorical variables for sequential data in fraud context. InternationalConference on Advanced Machine Learning Technologies and Applications.
[Shapley, 1953] Shapley, L. S. (1953). A value for n-person games. Annals ofMathematics Study, Princeton University Press.
[Shimodaira, 2000] Shimodaira, H. (2000). Improving predictive inference undercovariate shift by weighting the log-likelihood function. Journal of statisticalplanning and inference 90(2).
[Shirazi and Vasconcelos, 2010] Shirazi, H. M. and Vasconcelos, N. (2010). Riskminimization, probability elicitation and cost-sensitive svms. ICML.
[Srivastava et al., 2008] Srivastava, A., Kundu, A., Sural, S., and Majumdar,A. K. (2008). Credit card fraud detection using hidden markov model. IEEETransactions on dependable and secure computing.
[Stekhoven and Buhlmann, 2011] Stekhoven, D. J. and Buhlmann, P. (2011).Missforest-non-parametric missing value imputation for mixed-type data.Bioinfomatics 28(1).
[Storkey, 2009] Storkey, A. (2009). When training and test sets are different:characterizing learning transfer. Dataset shift in machine learning.
[Sugiyama et al., 2007] Sugiyama, M., Krauledat, M., and Mazller, K.-R. (2007).Covariate shift adaptation by importance weighted cross validation. Journalof Machine Learning Research 8.
[Sun et al., 2007] Sun, Y., Kamel, M. S., Wong, A. K., and Wang, Y. (2007).Cost-sensitive boosting for classification of imbalanced data. Pattern Recogni-tion.
[Troyanskaya et al., 2001] Troyanskaya, O., Cantor, M., Sherlock, G., Brown, P.,Hastie, T., Tibshirani, R., Botstein, D., and Altman, R. B. (2001). Missingvalue estimation methods for dna microarrays. Bioinfomatics 17(6).
[Visa and Ralescu, 2005] Visa, S. and Ralescu, A. (2005). Issues in mining imbal-anced data sets: a review paper. Proceedings of the sixteen midwest artificialintelligence and cognitive science conference.
[Viterbi, 1967] Viterbi, A. J. (1967). Error bounds for convolutional codes and anasymptotically optimum decoding algorithm. IEEE Transactions InformationTheory, vol. IT-13.
124
Cette thèse est accessible à l'adresse : http://theses.insa-lyon.fr/publication/2019LYSEI110/these.pdf © [Y. Lucas], [2019], INSA de Lyon, tous droits réservés

[Vlasselaer et al., 2015] Vlasselaer, V. V., Bravo, C., Caelen, O., Eliassirad, T.,Akoglu, L., Snoeck, M., and Baesens, B. (2015). Apate: A novel approachfor automated credit card transactions fraud detection using network-basedextensions. Decision support systems.
[Wang et al., 2003] Wang, K., Zhou, S., Fu, C. A., and Yu, J. (2003). Miningchanges of classification by correspondance tracing. Proceedings of the 2003SIAM International COnference on Data Mining. Society for Industrial andApplied Mathematics.
[Wang et al., 2009] Wang, S., Tang, K., and Yao, X. (2009). Diversity explorationand negative correlation learning on imbalanced data sets. International JointConference on Neural Networks.
[Webb and Ting, 2005] Webb, G. I. and Ting, K. M. (2005). On the applica-tion of roc analysis to predict classification performance under varying classdistributions. Machine Learning 58.
[Weiss and Provost, 2001] Weiss, G. M. and Provost, F. (2001). The effect ofclass distribution on classifier learning: an empirical study. Rutgers Univ.
[Whitrow et al., 2008] Whitrow, C., Hand, D. J., Juszczak, P., Weston, D. J.,and Adams, N. M. (2008). Transaction aggregatin as a strategy for credit cardfraud detection. Data Mining and Knowledge Discovery 18(1).
[Widmer and Kubat, 1996] Widmer, G. and Kubat, M. (1996). Learning in thepresence of context drift and hidden contexts. Machine Learning 23.
[Wu and Chang, 2003] Wu, G. and Chang, E. Y. (2003). Class-boundary align-ment for imbalanced dataset learning. ICML workshop on learning from im-balanced data sets II.
[Yan et al., 2003] Yan, R., Liu, Y., Jin, R., and Hauptmann, A. (2003). Onpredicting rare classes with svm ensembles in scene classification. IEEE Inter-national Conference on Acoustics, Speech, and Signal Processing.
[Zadrozny et al., 2003] Zadrozny, B., Langford, J., and Abe, N. (2003). Cost-sensitive learning by cost-proportionate example weighting. Data MiningICDM, IEEE.
[Zintgraf et al., 2017] Zintgraf, L., Cohen, T., Adel, T., and Welling, M. (2017).Visualising deep neural network decisions: prediction difference analysis. arXivpreprint.
125
Cette thèse est accessible à l'adresse : http://theses.insa-lyon.fr/publication/2019LYSEI110/these.pdf © [Y. Lucas], [2019], INSA de Lyon, tous droits réservés

FOLIO ADMINISTRATIF
THESE DE L’UNIVERSITE DE LYON OPEREE AU SEIN DE L’INSA LYON
NOM : LUCAS DATE de SOUTENANCE : 12/2019
Prénoms : Yvan, François, Marcel
TITRE : Credit Card Fraud Detection using Machine Learning with Integration of Contextual Knowledge
NATURE : Doctorat Numéro d'ordre : 2019LYSEI110
Ecole doctorale : INFOMATHS
Spécialité : Informatique
RESUME :
La détection de fraude par carte de crédit présente plusieurs caractéristiques qui en font une tâche difficile. Tout d'abord, les attributs décrivant une transaction ignorent les informations séquentielles qui se sont avérées très pertinentes pour la détection des fraudes à la carte de crédit. Des solutions pour intégrer des informations séquentielles au sein des attributs transactionnels existent dans la littérature. La stratégie principale consiste à créer un ensemble d'attributs qui sont des statistiques descriptives obtenues en agrégeant les séquences de transactions des titulaires de carte (somme du montant, nombre de transactions, etc.). Nous avons utilisé cette méthode comme méthode de référence pour la détection des fraudes à la carte de crédit. Cependant, cette stratégie de prétraitement des données a soulevé plusieurs questions de recherche. Tout d'abord, nous avons supposé que ces statistiques descriptives ne pouvaient pas décrire complètement les propriétés séquentielles des motifs temporels frauduleux et non frauduleux et que la modélisation des séquences de transactions pouvait être bénéfique pour la détection de la fraude. De plus, la création de ces fonctionnalités agrégées est guidée par des connaissances expertes, tandis que la modélisation de séquences pourrait être automatisée grâce aux labels de classe disponibles pour les transactions passées. Enfin, ces attributs agrégées sont des estimations ponctuelles pouvant être complétées par une description multi-perspective du contexte de la transaction (en particulier du point de vue du vendeur).Nous avons proposé une stratégie pour la création d'attributs basés sur des modèles de Markov cachés (HMM) caractérisant la transaction par différents points de vue. Cette stratégie permet d'intégrer un large spectre d'informations séquentielles dans les attributs des transactions. En fait, nous modélisons les comportements authentiques et frauduleux des commerçants et des détenteurs de cartes selon deux caractéristiques univariées: la date et le montant des transactions. De plus, les attributs basées sur les HMM sont créées de manière supervisée, réduisant ainsi le besoin de connaissances expertes pour la création du système de détection de fraude. En fin de compte, notre approche à perspectives multiples basée sur des HMM permet un prétraitement automatisé des données pour modéliser les corrélations temporelles afin de compléter et éventuellement remplacer les stratégies d'agrégation de transactions afin d'améliorer l'efficacité de la détection.Des expériences menées sur un vaste ensemble de données de transactions de cartes de crédit issu du monde réel (46 millions de transactions effectuées par des porteurs de carte belges entre mars et mai 2015) ont montré que la stratégie proposée pour le prétraitement des données basé sur les HMM permet de détecter davantage de transactions frauduleuses quand elle est combinée à la stratégie de prétraitement des données de référence basées sur des connaissance expertes pour la détection de fraude à la carte de crédit. La stratégie poposée de construction d'attributs à l'aide des HMM ne devrait pas remplacer la stratégie de réference pour le prétraitement des données car la meilleure détection est obtenue gràce de la combinaison de ces stratégies de prétraitement des données.
MOTS-CLÉS : machine learning, fraud detection, hidden Markov model, sequence modelling, feature engineering, dataset shift
Laboratoire (s) de recherche : LIRIS DRIM
Directeur de thèse: Prof. Dr. Sylvie Calabretto & Prof. Dr. Michael Granitzer
Président de jury : Prof. Dr. Chantal Soulé-Dupuy
Composition du jury : Prof. Dr. Chantal Soulé Dupuy, Prof. Dr. Eric Gaussier, Prof. Dr. Mathias Lux, Dr. Gabriele Gianini, Prof. Dr. Sylvie Calabretto, Prof. Dr. Michael Granitzer, Dr. Pierre-Edouard Portier, Dr. Léa Laporte
Cette thèse est accessible à l'adresse : http://theses.insa-lyon.fr/publication/2019LYSEI110/these.pdf © [Y. Lucas], [2019], INSA de Lyon, tous droits réservés