credit constraints and spillovers from foreign … constraints and spillovers from foreign firms in...
TRANSCRIPT
Credit Constraints and Spillovers from Foreign Firms in China∗
Natasha Agarwal†, Chris Milner‡, and Alejandro Riano§
December 19, 2013
Abstract
This paper examines whether credit constraints affect Chinese firms’ absorption of productivity
spillovers originating from the activity of foreign-owned firms. Using firm-level data for 2001-
2005, we find evidence of positive spillovers originating from foreign-owned firms from countries
other than Hong Kong, Macau and Taiwan for non-state owned Chinese firms operating in the
same industry and province. Using an index of external finance dependence to measure credit
constraints, we find that only non state-owned firms operating in industries with external finance
dependence below the index median exhibit significantly positive spillovers from the activity of
foreign firms.
Keywords: Foreign direct investment; knowledge spillovers; credit constraints; China.
JEL classification: F23; G31; O1; O33.
∗We thank Sanjay Banerji, Sourafel Girma, Beata Javorcik, Zuobao Wei, Zhihong Yu, two anonymous referees andseminar participants at Bournemouth University, the Indian Council for Research on International Economic Rela-tions, Delhi, the Indira Gandhi Institute of Development Research, Mumbai, the Institute for Financial Managementand Research, Chennai and participants at the ECCE-USB Conference on Financial Globalisation and SustainableFinance for their useful comments. We would also like to thank Alessandra Guariglia for kindly providing the datato undertake this study. All remaining errors are our own.†Centre for Advanced Financial Research and Learning, Reserve Bank of India. [email protected]‡University of Nottingham, GEP and CESifo. [email protected]§University of Nottingham, GEP, CFCM and CESifo. [email protected]. Corresponding author.
Tel: +44 (0) 1159 515 466. Fax: +44 (0) 1159 514 159.
1 Introduction
In August 2012, Lenovo, the largest PC manufacturer in China, poached more than 40 laid-off
employees from rival Motorola shortly after the latter announced its plan to cut 4,000 jobs globally.
The main objective behind this move, according to Chen Wenhui, Lenovo’s general manager of
phone R&D, was to take advantage of the former Motorola employees’ vast experience in overseas
markets. Similarly, Google’s announcement that it was shutting down its search service Google.cn
in 2010, resulted in a rush from its Chinese competitors to hire the company’s best staff.1 While a
large number of Chinese companies have enjoyed the opportunity of tapping into a pool of workers
trained in cutting-edge global corporations as well as adapting these multinationals’ technology
and management practices, a large number of firms, particularly privately-owned firms, are unable
to take advantage of these type of positive external effects associated with the operation of foreign-
owned firms, which we refer to from here on as spillovers from foreign activity.
In this paper we ask whether credit constraints hinder the ability of Chinese firms’ to benefit
from productivity spillovers arising from the operation of foreign-owned firms. To address this
research question, however, we first need to establish whether domestically-owned Chinese firms in
our sample actually enjoy benefits or positive spillovers from a greater level of activity of foreign-
owned firms.2 Our first set of results provides evidence in support of spillovers from foreign activity
to Chinese-owned firms operating in the same industry and province. Further inspection reveals
that this positive average effect hides significant heterogeneity in the response of domestic producers
to foreign firm activity, which depend both on the origin of capital sources for foreign firms and the
ownership status of domestic firms. In particular, we find that: (i) only the activities of foreign firms
that do not originate in Hong Kong, Macau or Taiwan (HMT) have a significantly positive effect on
the value-added of Chinese firms and (ii) only non state-owned firms, i.e. privately and collectively-
owned enterprises, enjoy spillovers from foreign activity.3 These results conform with the received
wisdom that a substantial number of HMT-based firms are established by Chinese entrepreneurs
primarily to take advantage of fiscal incentives available to foreign-invested enterprises and also that
state-owned enterprises facing ‘soft budget constraints’ and pursuing multiple economic and social
objectives are less likely to adopt productivity-enhancing techniques diffusing from multinational
firms (Abraham et al., 2010; Prasad and Wei, 2007; Bajona and Chu, 2010; Xu, 2011).
Our main result shows that credit constraints present a significant obstacle to the absorption
of productivity spillovers originating from foreign firms by Chinese firms. Using a sectoral index of
credit constraints proposed by Rajan and Zingales (1998), we find that non state-owned Chinese
firms operating in industries with external finance dependence below the median of this index
exhibit an elasticity of output with respect to foreign activity in the same industry and province
1http://www.chinadaily.com.cn/business/2012-12/03/content_16054002.htm.2The surveys by Gorg and Greenaway (2004) and Keller (2004) discuss in detail the problems associated with the
empirical identification of spillovers from foreign direct investment; for the specific case of China, see Hale and Long(2011).
3The elasticity of real value-added with respect to foreign activity is statistically significant and of similar magni-tude to what previous studies have found (see Jordaan, 2005; Haskel et al., 2007; Abraham et al., 2010).
1

of 0.047. On the other hand, credit-constrained firms, i.e. firms with external finance dependence
above the median, do not benefit at all from the operation of nearby multinational firms in their
own industry. This result has important policy implications. Governments in developing countries
are keen on attracting foreign direct investment in technologically-intensive sectors. However, since
these industries exhibit relatively high dependence on external finance, they might not provide the
greatest benefits for local producers, unless financial markets are sufficiently developed to ensure
the widespread absorption of productivity gains arising from the activities of foreign firms. Thus,
this paper sheds light on the conditions that enable local firms to benefit from greater financial
globalisation.
Our results are robust to alternative measures of credit constraints and firm-level performance
measures, the use of lagged measures of inputs and foreign activity and various arrangements of
clustering of standard errors. We also find that the negative relationship we establish between
external finance dependence and spillovers from foreign activity is not capturing a relationship
between the activity of foreign firms with sectoral characteristics other than credit constraints such
as capital intensity or tradability.
Over the past two decades China has been one of the world’s most important recipients of
foreign direct investment (FDI), partly because of the size and growth of its internal market and its
abundance of unskilled labour, but also because foreign firms have been attracted by a wide range of
policies and incentives laid out by the Chinese government, e.g. generous fiscal schemes favouring
foreign-invested enterprises and the establishment of special economic zones. The existence of
positive spillovers arising as a by-product of the activities of multinational firms has frequently
been used to justify the use of these policies. In this paper, however, we show that the presence
and encouragement of foreign firms is not sufficient for domestic firms to benefit from the activities
of foreign-owned firms.
Our finding that productivity gains from spillovers only accrue to local firms not facing credit
constraints is of particularly importance for China. The 2003 Investment Climate Survey carried
out by the World Bank shows that privately-owned Chinese firms enjoy much less access to formal
finance than firms in any other East Asian country. Several authors have pointed to the high level of
state ownership characterising China’s banking system as the main culprit behind this phenomenon,
as a large share of credit is channeled towards state-owned enterprises to pursue political and social
objectives (Brandt and Li, 2003; Cull and Xu, 2003; Allen et al., 2005). Consequently, as shown by
Ayyagari et al. (2010), private Chinese firms are often forced to rely on small-scale, shorter-term
sources of informal finance, which results in them experiencing slower growth than firms with access
to bank credit. Our results show that lack of access to sources of external finance also hampers
potential productivity gains for privately-owned firms arising from the operation of nearby foreign
firms in the same industry.
Although this paper lies at the intersection of two well-established strands of literature, one
exploring the impact of foreign direct investment in host economies and a second, investigating
how financial development affects performance measures at the aggregate and microeconomic level,
2

there are still relatively few works focusing on the connections between these two research areas.4
Our focus on firm-level implications of credit constraints complements the cross-country studies
of Rajan and Zingales (1998) and Alfaro et al. (2004), which find that more developed financial
markets act as a catalyst for the growth of industries that rely more on external finance and also
boost the effect that foreign direct investment has on economic growth.
At a more disaggregated level, this paper is similar to Javorcik and Spatareanu (2009) and
Du and Girma (2007), who find evidence that local firms’ financial health affects their response
to foreign activity across a wide range of outcomes. Javorcik and Spatareanu (2009) show that
Czech firms that are less affected by liquidity constraints are more likely to self-select into becom-
ing multinationals’ suppliers. Du and Girma (2007) find that export-oriented FDI increases the
likelihood of exporting for privately-owned Chinese firms, particularly those with access to bank
credit, whereas domestic market-oriented FDI has a negative effect on the probability that these
firms start to export. The paper most closely related to ours is Villegas-Sanchez (2009), which finds
that large firms located in more financially developed regions in Mexico enjoy greater productivity
spillovers from FDI. In contrast to her results, we do not find evidence that the way in which credit
constraints affect domestic firms’ ability to appropriate spillovers from foreign activity differs across
the size distribution of firms.
Unlike the papers described above, all of which rely on firm-level financial indicators, we use
the industry-level index of external finance dependence developed by Rajan and Zingales (1998) to
identify credit constraints. The use of a ‘frontier technology’ measure, which reflects the outcome
of efficient market conditions, has the attraction of being exogenously determined (i.e. unaffected
by local decisions) which helps us in overcoming the endogeneity problem that might arise at the
moment of identifying firms facing credit constraints.
The rest of the paper is organised as follows: Section 2 summarises the theoretical underpinnings
for the existence of spillovers arising from the activity of foreign firms; Sections 3 and 4 describe our
data and empirical methodology respectively; Our main results and robustness checks are presented
in Section 5; Section 6 concludes.
2 Spillovers from foreign firms
Two central features that characterise ideas, defined in a very broad sense, are their non-rival
nature and the fact that they are only imperfectly excludable.5 These two characteristics imply
that some of the benefits arising from the development of new ideas can accrue to parties other than
their creator. Therefore, third parties might enjoy ‘spillover’ benefits from using an idea without
4The link between foreign direct investment and foreign firm activity on host country outcomes such as produc-tivity, employment and industrial structure is summarised by Navaretti and Venables (2006); Levine (2005) reviewsthe extensive body of work studying the link between finance and growth.
5This broad definition of ideas includes, but is not limited to, blueprints of new goods, innovations to productionprocesses that reduce production costs, industry-specific ‘trade secrets’ such as lists of suppliers and clients, pricesand terms of delivery and intangible managerial practices, e.g. the use of performance reviews and incentive schemesto motivate employees.
3
acquiring it in a market transaction. From a theoretical standpoint, knowledge spillovers have been
shown to be a crucial force driving sustained economic growth (Grossman and Helpman, 1991;
Aghion and Howitt, 1992; Jones, 2005), as well as shaping market structure at the industry level
and individual firms’ productivity (Dasgupta and Stiglitz, 1980; Spence, 1984; Vives, 2008).
Because the vast majority of innovation activity takes place in only a handful of developed
countries (see Eaton and Kortum, 1999), governments across the world have, especially over the
last three decades, actively sought to attract foreign direct investment (FDI) not only because of
its direct contribution to capital formation but also with the expectation that the operation of
multinational firms would facilitate the diffusion of foreign technology and ideas towards domestic
producers.6 Typical examples of policies aimed at attracting foreign multinationals include tax holi-
days, lenient labour and environmental regulations, streamlined enterprise registration procedures,
among other advantages. China has relied intensively on these instruments, especially through
the establishment of special economic zones as noted by Naughton (1996) and Defever and Riano
(2012), but it also has employed more ‘direct’ methods to elicit the diffusion of knowledge such as
preconditioning access to its domestic market to foreign firms in exchange for direct handovers of
technology, as documented by Holmes et al. (2013).
Findlay (1978) provides the first theoretical account in which FDI generates positive spillovers
in host countries. His model features two key elements that have remained central for the subse-
quent literature: (i) foreign capital embodies more advanced technology, management techniques
and know-how which are unavailable to firms in the relatively ‘backward’ host country, and (ii)
domestic producers, however, can improve their efficiency through their exposure to FDI. The first
assumption is founded on the observation that the technological advantage of multinational firms is
a necessary condition to successfully operate in unfamiliar foreign markets while at the same time
incurring the higher organisational costs associated with international production. The rationale
for a potential positive effect of foreign firms’ activity on local producers follows from the work of
Polanyi (1958) and Arrow (1969), who argue that an important component of knowledge is not
codifiable (either because the problem-solver cannot fully define what he or she is doing, or because
it is prohibitively costly to do so). This in turn implies that the diffusion of knowledge occurs more
effectively through personal contact and demonstration facilitated by operating in close proximity
to the innovator. Findlay (1978) shows in his model that the growth rate of technology in the host
country is positively affected by foreign capital inflows and that this positive spillover effect from
FDI is stronger the greater the technology gap is between the two countries.
Although the non-rival nature of knowledge assumed by Findlay (1978) suggests that ideas
can be easily and costlessly transferred across countries,7 Cohen and Levinthal (1990) argue that
local firms’ ability to assimilate new ideas and apply them to commercial means depend on their
6See Keller (2004) for an extensive review about the process of international technology diffusion and the channelsthrough which it takes place.
7Mansfield and Romeo (1980) provide one of the earliest accounts documenting the extent and speed with whichU.S. multinational firms transfer their technology to their foreign subsidiaries; more recently, Bloom and Van Reenen(2007), using cross-country data, find that multinational firms often transplant their management techniques to theirsubsidiaries overseas.
4

‘absorptive capacity’, which is dependent on a firm’s stock of knowledge capital.8 However, since
the latter is not directly observable, it is common to use a country or a firm’s skilled employment
or R&D intensity to proxy it (Girma, 2005).
One can, however, take a broader view of absorptive capacity and include factors other than
human capital and R&D activity in shaping a firm’s ability to adapt new ideas and techniques from
foreign firms. Our argument is that the extent of credit constraints can be considered an important
feature of a firm’s absorptive capacity. Easier access to external finance allows firms to invest in
long-term projects which in turn help them accumulate both physical and knowledge capital (see
Ayyagari et al., 2011).
3 Data
The data used in this study is drawn from the annual accounting reports in the Oriana database
compiled by Bureau Van Dijk. It covers over 20,000 manufacturing firms for the period 2001-2005.
The sample consists of relatively few small firms with annual sales above Yuan 1 million, and a
majority of large firms with annual turnover above Yuan 5 million. The firms in our sample account
for approximately 35% of total manufacturing value-added and 18% of manufacturing employment
in China.
The dataset contains information on value-added, employment, input costs, geographic location,
industry of operation and foreign ownership status, distinguishing whether the source of foreign
investment originates from Hong Kong, Macau and Taiwan or elsewhere. Thus, we consider a firm
to be foreign-owned if foreign capital participation in it exceeds 25%.9 After cleaning the data,
our sample comprises 78,509 firm-year observations, of which 40% approximately are foreign-owned
enterprises.10 Table 1 presents the definition of all variables used in the paper and Table 2 provides
summary statistics for our sample.
In order to identify credit-constrained firms in our sample, we rely on the industry-level (ISIC-3
digit) index of external finance dependence (EFD) proposed by Rajan and Zingales (1998) and
made available by Braun (2003). This index is constructed as the share of capital expenditures not
financed with cash flow from operation for the median publicly-listed firm in each 3-digit industry
in the United States averaged over the 1980s.11 Because the U.S. has one of the most sophisticated
8Keller (1996) incorporates the notion of absorptive capacity into an endogenous growth model. He shows thatin order for the gains from greater trade openness (due to the acquisition of new technologies from abroad) to besustained a country needs to accumulate skills at a higher rate than before the regime change.
9The National Bureau of Statistics of China considers an enterprise to be foreign-funded if at least 25% of thecompany’s registered capital is of foreign origin in the case of limited liability corporations and Chinese-foreign equityjoint ventures. Exceptions include cooperative joint ventures in which the proportion of capital to be contributed byeach of the parties to the venture is stipulated by contract and the wholly-foreign owned enterprises where the entirecapital comes from foreign investors.
10Following Chen and Guariglia (2011), we drop observations with negative sales, negative total assets minustotal fixed assets, negative total assets minus liquid assets; and negative accumulated depreciation minus currentdepreciation.
11Cash flow from operations is defined as the sum of cash flow from operations plus decreases in inventories,decreases in receivables, and increases in payables.
5

Table 1: Variable description and sources
Variable Description and sourcesFirm levelOutput (Yijpt) Real value added. Oriana database, Bureau Van Dijk.Capital (Kijpt) Real value of tangible fixed assets. Oriana database, Bureau Van Dijk.Labour (Lijpt) Number of employees. Oriana database, Bureau Van Dijk.Industry-province levelForeign activity (Foreignjpt) Total value-added by foreign-owned firms within an industry-province
cell in a given year. Value added of foreign firms from the Orianadatabase, Bureau Van Dijk.
Foreign activity, Hong Kong, Macauand Taiwan (ForeignHMT
jpt )Total value added from foreign firms originating from Hong Kong, Macauand Taiwan in an industry-province cell in a given year. Oriana database,Bureau Van Dijk.
Foreign activity, other countries(Foreignother
jpt )Total value added from foreign firms originating from countries otherthan Hong Kong, Macau and Taiwan in an industry-province cell in agiven year. Oriana database, Bureau Van Dijk.
Industry levelExternal finance dependence (EFDj) Share of capital expenditures not financed with internal funds for the
median publicly-listed U.S. firm in each 3-digit industry for the 1980s.The index is developed by Rajan and Zingales (1998) and was madeavailable by Braun (2003).
External finance dependence, 1970(EFD1970
j )Same as above but calculated using data for the 1970s. From Braun(2003).
External finance dependence, Canada(EFD1980
j,CAN)Same as above but calculated using data for Canadian firms for theperiod 1982-1990. From Rajan and Zingales (1998).
Tangibility index An index calculated as the median level of the ratio of net property, plantand equipment to the book value of assets of all U.S. based companiesin a given industry, based on Compustat’s annual industrial files for theperiod 1986-1995. From Braun (2003).
Capital intensity index An index calculated as the median level of the ratio of fixed assets tonumber of employees in a given industry for U.S. Firms in Compustatfor the period 1980-99. From Kroszner et al. (2007).
Liquidity index An index calculated as the median level of the ratio of inventories to salesfor all active U.S.-based companies in Compustat’s annual industrial filesfor the period 1980-99. From Kroszner et al. (2007).
Durability index An index which takes the value one if a 3-digit industry manufacturespredominantly durable goods, and zero otherwise. From Kroszner et al.(2007).
Investment goods producer index An index calculated as the ratio investment/(investment+consumption)using data from the 1998 BEA Input-Output table at the 3-digit industrylevel. This measure captures whether an industry is specialised in theproduction of investment goods relative to consumption goods. FromBraun and Larrain (2005).
Tradability index An index calculated as the ratio trade/(trade+domestic use), wheretrade is defined as exports plus imports, and domestic use is definedas consumption plus investment, either private or public at the 3-digitindustry level based on data from the BEA use tables. A higher valuemeans that the industry specialises in the production of tradable goods.From Braun and Larrain (2005).
Province levelDeflators Both the GDP and capital goods deflators are taken from the China
Statistical Yearbook (various issues), published by the National Bureauof Statistics of China.
The subscripts i, j, p, and t index firms, 3-digit industries, provinces and years respectively.
6

Table 2: Summary statistics
No. obs. Mean Median Std. devFirm level
All domestic firmsReal value added 48,075 531.92 181.28 2,290.25Employment 54,836 1,276.31 603 3,144.38Capital 54,836 762.89 173.48 4,463.09
State-owned domestic firmsReal value added 12,097 890.56 250.37 3,795.84Employment 14,716 2,220.85 1,041 5,314.02Capital 14,716 1,557.48 408.95 6,549.01
Non state-owned domestic firmsReal value added 35,978 411.31 164.02 1,451.47Employment 40,120 929.86 513 1,645.89Capital 40,120 471.43 126.43 3,343.35
Industry-province levelForeign 2,597 67,14.07 970.70 23,853.78
Foreignother 2,229 5,298.09 899.36 17,838.71
ForeignHMT 1,859 3,026.90 510.64 10,424.51Industry level
EFD 28 0.24 0.21 0.33EFD1970 27 0.04 0.06 0.18EFD1980
CAN 21 0.25 0.34 0.43Tangibility index 28 0.30 0.29 0.14Capital intensity index 28 35.71 22.12 44.40Liquidity index 28 0.16 0.16 0.05Durability index 28 0.46 0.00 0.51Investment goods producer index 28 0.18 0.01 0.27Tradability index 28 0.51 0.50 0.25
financial systems in the world and the EFD index is constructed using data for publicly-listed firms,
it should closely reflect firms’ optimal choice for external finance in an unconstrained environment.
This index has been widely used as a proxy for the extent of financial constraints (Kroszner et al.,
2007; Beck et al., 2008; Manova, 2013).
The theoretical underpinning of the EFD index is that key factors determining a firm’s demand
for external funds, such as project scale, gestation and cash harvest periods, and the requirement
for continuing investment are intrinsic to the production technology available in the firm’s indus-
try. Thus, firms operating in sectors characterised by larger minimum scale requirements, longer
gestation periods, higher R&D intensity or working capital needs are more likely to face credit
constraints. Based on the EFD index, industries identified to be heavily reliant on external fi-
nance include plastic products, machinery and professional equipment whereas sectors like tobacco,
footwear, and clothing are in the lower end of the ranking.
Because the underlying determinants of the demand for external finance vary substantially
across industries while remaining relatively stable across countries and over time within the same
industry, we can use the U.S.-based index to identify sectors in China that are more likely to face
7
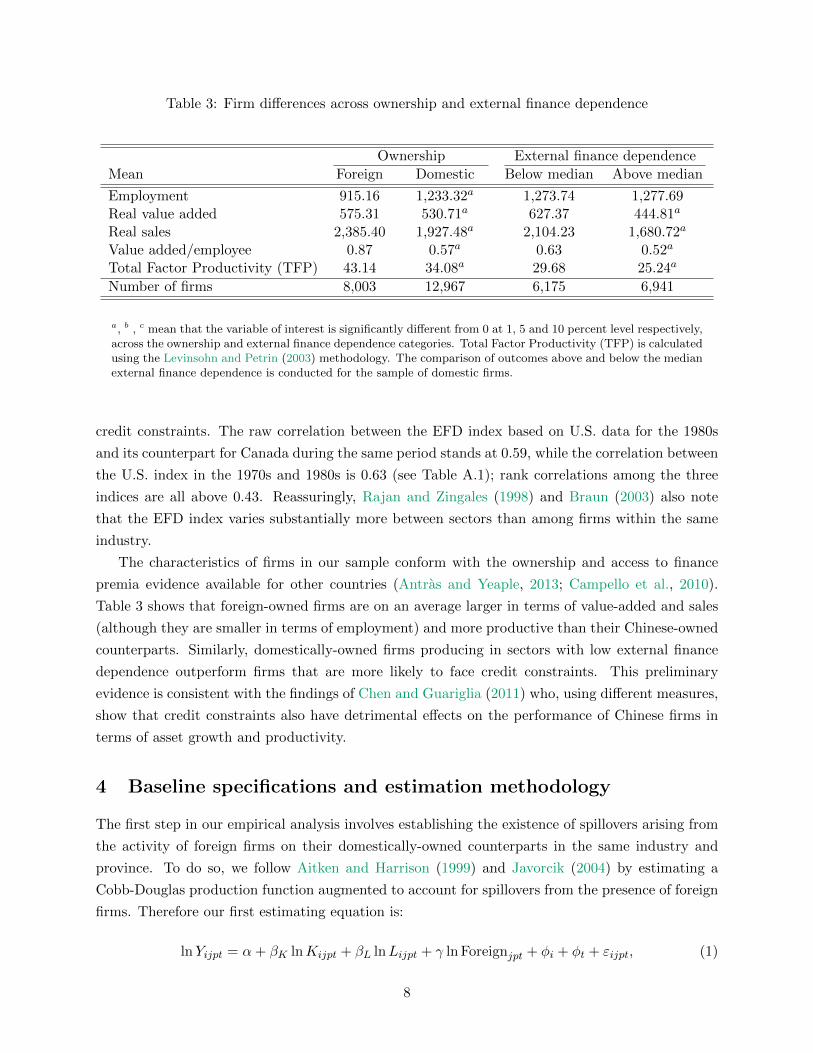
Table 3: Firm differences across ownership and external finance dependence
Ownership External finance dependence
Mean Foreign Domestic Below median Above median
Employment 915.16 1,233.32a 1,273.74 1,277.69Real value added 575.31 530.71a 627.37 444.81a
Real sales 2,385.40 1,927.48a 2,104.23 1,680.72a
Value added/employee 0.87 0.57a 0.63 0.52a
Total Factor Productivity (TFP) 43.14 34.08a 29.68 25.24a
Number of firms 8,003 12,967 6,175 6,941
a, b , c mean that the variable of interest is significantly different from 0 at 1, 5 and 10 percent level respectively,across the ownership and external finance dependence categories. Total Factor Productivity (TFP) is calculatedusing the Levinsohn and Petrin (2003) methodology. The comparison of outcomes above and below the medianexternal finance dependence is conducted for the sample of domestic firms.
credit constraints. The raw correlation between the EFD index based on U.S. data for the 1980s
and its counterpart for Canada during the same period stands at 0.59, while the correlation between
the U.S. index in the 1970s and 1980s is 0.63 (see Table A.1); rank correlations among the three
indices are all above 0.43. Reassuringly, Rajan and Zingales (1998) and Braun (2003) also note
that the EFD index varies substantially more between sectors than among firms within the same
industry.
The characteristics of firms in our sample conform with the ownership and access to finance
premia evidence available for other countries (Antras and Yeaple, 2013; Campello et al., 2010).
Table 3 shows that foreign-owned firms are on an average larger in terms of value-added and sales
(although they are smaller in terms of employment) and more productive than their Chinese-owned
counterparts. Similarly, domestically-owned firms producing in sectors with low external finance
dependence outperform firms that are more likely to face credit constraints. This preliminary
evidence is consistent with the findings of Chen and Guariglia (2011) who, using different measures,
show that credit constraints also have detrimental effects on the performance of Chinese firms in
terms of asset growth and productivity.
4 Baseline specifications and estimation methodology
The first step in our empirical analysis involves establishing the existence of spillovers arising from
the activity of foreign firms on their domestically-owned counterparts in the same industry and
province. To do so, we follow Aitken and Harrison (1999) and Javorcik (2004) by estimating a
Cobb-Douglas production function augmented to account for spillovers from the presence of foreign
firms. Therefore our first estimating equation is:
lnYijpt = α+ βK lnKijpt + βL lnLijpt + γ ln Foreignjpt + φi + φt + εijpt, (1)
8

where the subscripts i, j, p and t index firms, industries, provinces and years respectively. Yijpt
denotes real value-added and Kijpt and Lijpt are capital and labour inputs respectively.12 Our
measure of spillovers arising from foreign activity, Foreignjpt, is defined as total real value-added
accounted for foreign-owned firms in the same industry and province as firm i in a given year; φi
and φt are firm and year-specific fixed effects, and εijpt is a random error term which might be
correlated over time within firms (standard errors are clustered at the firm-level).13
Taking the same industry-province cell to be the reference ‘spillover pool’ assumes that pro-
ductivity spillovers from foreign firms are more likely to be quantitatively important for domestic
firms operating in close proximity to their foreign counterparts in the same industry. This assump-
tion is supported by the findings of Wei and Liu (2006) and Girma and Gong (2008), who show
that spillovers from foreign direct investment in China are more pronounced within regions and
geographical industrial clusters than across firms within the same region operating across differ-
ent industries. Therefore, to the extent that domestic firms benefit from the scale of operation of
foreign firms in the same province and industry, the parameter γ is expected to be positive and
significant. Our choice of estimating a value-added rather than a gross output production function
follows Feenstra et al. (2011), who argue that the former is preferable in the case of China given
the prevalence of export processing activities which tend to be intensive in the use of imported
intermediate inputs.
The intuition behind our empirical specification is that the (potentially) more advanced tech-
nological capabilities or efficient organisational structure of foreign-owned firms gradually leaks
out of the boundaries of the firm and can thus be absorbed by local producers. These spillovers
might take place through a variety of channels which include, but are not limited to (i) direct
imitation/demonstration effects (Das, 1987; Wang and Blomstrom, 1992); (ii) tougher competition
putting pressure on firms to ‘trim down their fat’ in order to remain in the market (Blomstrom and
Kokko, 1998; Aitken and Harrison, 1999); (iii) through vertical linkages that facilitate the contact
between multinational customers and domestic firms (Javorcik, 2004) and (iv) labour turnover from
foreign to domestic-owned firms (Fosfuri et al., 2001). Although some of these channels might be
operative through the continuous interaction between domestic and foreign firms in product and
labour markets, the focus of this paper is on whether the existence and magnitude of spillovers
from foreign activity experienced by Chinese firms is mediated by the degree of credit constraints
they face. For instance, integrating into a multinational supply chain might necessitate a domestic
firm to retool its production facilities or improve the quality of its output; similarly, attracting new
personnel employed in nearby multinationals could also put pressure on payroll costs. Therefore,
tighter credit constraints might preclude firms from enjoying positive external effects brought about
by the operation of foreign firms.
12Firm-level value-added and our measure of foreign-firm activity are both deflated using province-level GDPdeflators, while capital is deflated using a province-level deflator for fixed capital formation available from China’sStatistical Yearbook.
13Tables A.3 and A.9 show that our results are robust to more conservative clustering arrangements of standarderrors, i.e. single clustering at the industry-province level and two-way clustering at the industry and province levels.
9
We use regression (1) not only to establish the existence of spillovers from foreign-owned firms in
our sample, but also to ascertain whether the source of investment for foreign firms or the ownership
structure of local firms affect the magnitude of the spillover effects. For instance, it is likely that
there is a greater scope for the diffusion of productivity-enhancing knowledge from foreign-owned
firms originating from developed countries than from Chinese-owned shell corporations based in
Hong Kong, Macau and Taiwan (HMT) engaged in ‘round-tripping’ aimed at taking advantage of
preferential tax treatment targeted towards foreign firms (Prasad and Wei, 2007). However, it is
also possible that foreign firms originating in HMT play a role in connecting Chinese producers to
foreign customers by establishing distribution links or by providing information on foreign tastes
and preferences, since Hong Kong, Macau and Taiwan are home to a large number of subsidiaries of
corporations based in developed countries. Thus, we re-estimate equation (1) including separately
the total value-added accounted for foreign firms originating from Hong Kong, Macau and Taiwan
in an industry-province cell, ForeignHMTjpt , and the total value-added from foreign firms originating
elsewhere, Foreignotherjpt .
Similarly, the ownership structure of domestic firms can be an important factor influencing their
decision to internalise productivity-enhancing ideas from nearby foreign firms. For instance, state-
owned enterprises (SOE) facing a soft budget constraint are more likely to be poorly managed and
less likely to adopt innovations and managerial and organisational techniques from foreign firms.14
We classify domestically-owned firms in two groups: SOEs and non-state-owned enterprises, the
latter including both privately-owned firms and collective-owned enterprises, and we estimate re-
gression (1) for each subsample. Previous work classifies firms according to their largest ownership
type in a given year. However, according to Sun et al. (2002), the Chinese government uses a ‘state
ownership scheme’, which means that if the assets of a SOE are not completely sold to private
investors, the SOE is still not considered fully privatised and therefore is still required to conform
with communist public ownership principles. Hence, to take this institutional feature into consider-
ation, we identify a domestic firm to be state-owned if the paid-in-capital contributed by the state
is strictly positive, following Dollar and Wei (2007). The remaining firms are classified as non-state
owned enterprises, and we allow domestic firms to switch ownership status across years.
To investigate whether the extent of credit constraints affects the magnitude of spillovers ac-
cruing to domestically-owned Chinese firms, we augment regression (1) with an interaction term
between our measure of foreign activity in an industry-province cell and the industry-level index of
external finance dependence described in Section 3. Thus, our main empirical specification is:
lnYijpt =α+ βK lnKijpt + βL lnLijpt + γ0 ln Foreignotherjpt +
γ1
(ln Foreignother
jpt × EFDj
)+ φi + φt + εijpt. (2)
Based on the results obtained from estimating regression (1), which are discussed in the follow-
14See Qian and Xu (1998) for a theoretical analysis of innovation under soft budget constraints and Girma and Gong(2008) for empirical evidence documenting the lack of productivity improvements among Chinese SOEs generated bymultinational linkages.
10

ing section, we use the total value-added accounted for by non-HMT, foreign-owned firms as our
measure of spillovers when we estimate regression (2) for the group of non state-owned domestic
firms. As a robustness check we also estimate (2) using two different variants of the external finance
dependence index, one calculated using 1970s U.S. data from Braun (2003) and the second based
on data for Canadian firms between 1982 and 1990 from Rajan and Zingales (1998). We also test
the continuous conditioning model in (2) against a dichotomous specification in which the sample
is split at the median level of the EFD index, thus allowing for differential (but constant) effects
above and below this threshold.15
Other studies have explored how financial conditions shape domestic firms’ response to the
exposure to multinational firms, while also employing different measures of credit constraints. For
instance, Javorcik and Spatareanu (2009) use investment’s sensitivity to cash flow as their proxy
for credit constraints to explore whether these affect Czech firms’ decision to become suppliers of
multinational firms. A potential drawback of using the sensitivity of investment to cash flow is that,
as pointed out by Strebulaev and Whited (2012), this measure is neither sufficient nor necessary
for the existence of finance constraints. Du and Girma (2007) find that exposure to export-oriented
foreign direct investment, increases the probability of becoming an exporter for privately-owned
Chinese firms, in particular for those with access to bank credit. The use of firm-level variables to
capture financial constraints as in the previously mentioned papers, is likely to result in endogeneity
problems if similar variables were included in equation (2), e.g. if access to bank credit is easier for
highly productive firms.
In a paper closely related to ours, Villegas-Sanchez (2009) investigates whether financial devel-
opment affects the size of FDI spillovers in Mexico, and also faces a similar endogeneity problem
when measuring financial development at the regional level. Her financial development ranking is
based on the estimated coefficients of regional dummies in a linear probability model predicting
the probability that a firm would report being unable to purchase machinery and equipment due
to lack of financing. Her measure might reflect the fact that that highly productive firms are less
likely to report being financially constrained.16 The use of a ’technology frontier’ measure of ex-
ternal finance dependence based on data for a highly developed financial market overcomes these
problems in our estimation.
One concern that arises when estimating (2) is that our measure of external finance dependence
might be capturing other industry-specific characteristics also affecting the level foreign activity,
despite the fact that at first glance external finance dependence is only weakly correlated with other
sectoral characteristics (see Table A.1). For instance, Braun and Larrain (2005) find that industries
that are highly dependent on external finance are also characterised by large scale of operation,
long gestation periods, high R&D intensity or high working capital needs (e.g. to maintain higher
inventories). Therefore, ignoring these mechanisms, would bias the coefficient γ1 in (2) upwards. To
15Unfortunately, the unbalanced nature of our panel prevents us from using the more sophisticated endogenousthreshold modelling approach developed by Hansen (1999).
16She instruments regional financial development with the share of indigenous population in each region at thebeginning of the twentieth century.
11

deal with this potential omitted variable bias, we add interaction terms between our foreign activity
variable and a host of other industry characteristics in order to verify that our main interaction
term, Foreignotherjpt × EFDj remains significant.
5 Results
Table 4 presents the estimates of the fixed-effects regression (1) across all domestic firms as well as
for the subsamples split across the two types of foreign firms, (originating in Hong Kong, Macau
or Taiwan (HMT) and elsewhere (other)), and domestic ownership status (state and non state-
owned). The coefficients on capital and labour are both statistically significant and their magnitude
is consistent with other estimates using Chinese firm-level data (Feenstra et al., 2011). Because
the Hansen-Sargan test of overidentifying restrictions reported at the bottom of Table 4 strongly
rejects a random effects model in favour of a fixed effects specification, all remaining regressions
are estimated using fixed effects.
Our measure of foreign activity, i.e. the total value-added accounted for by foreign-owned firms
in a given province-industry cell, is positive and statistically significant at 1%, which we interpret
as evidence in favour of spillovers. The point estimate reported in column 1 indicates that a ten
percent increase in the total value-added of foreign firms is associated with a 2.4 percent higher
value-added for domestically-owned firms operating in the same industry-province. The magnitude
of the estimated elasticity of output with respect to foreign activity is comparable to the estimates
found by Jordaan (2005) for Mexico, Haskel et al. (2007) for the UK and Wei and Liu (2006),
Buckley et al. (2002) and Abraham et al. (2010) for China, in the range of 0.01-0.05.
Our finding of positive and significant spillovers from foreign activity is robust to a number of
different econometric specifications presented in Appendix A. These include the addition of other
time-varying firm-level characteristics such as firm’s age and export status (Table A.2); clustering of
standard errors at the province-industry level and two-way clustering at the province and industry
level (Table A.3);17 allowing the coefficients of capital and labour to vary at the 2-digit industry
(Table A.4) and using total factor productivity (TFP) (estimated using the Levinsohn and Petrin
(2003) algorithm in the first stage) as the dependent variable (Table A.5) as in Girma and Gong
(2008), Javorcik and Spatareanu (2009) and Abraham et al. (2010).
We then proceed to disentangle the average net positive spillovers according to the source of
investment of foreign-owned firms. In particular, we investigate whether the operation of multina-
tionals from Hong Kong, Macau and Taiwan (HMT) generates positive spillovers for domestically-
owned Chinese firms. The estimates presented in columns 2 and 3 of Table 1 show that the existence
of positive spillovers is mainly driven by the operation of firms with investments originating out-
side HMT. Based on these findings, the results reported in columns 4 and 5 also show that non
state-owned firms are the ones benefitting the most from the presence of foreign firms. The lack
of evidence of significant spillovers for state-owned firms is consistent with previous findings by
17The former allows firms’ production function residuals to be correlated within province-industry cells, while thelatter produces standard errors that are robust to correlation along either dimension.
12

Table 4: Spillovers from foreign activity
Value-addedAll domestic firms State-
ownedNonstate-owned
(1) (2) (3) (4) (5)Capital 0.199a 0.194a 0.194a 0.272a 0.191a
(0.011) (0.011) (0.012) (0.037) (0.012)Labour 0.559a 0.559a 0.564a 0.530a 0.556a
(0.018) (0.018) (0.019) (0.062) (0.019)Foreign 0.024a
(0.008)
Foreignother 0.018b 0.016 0.019b
(0.007) (0.015) (0.009)
ForeignHMT 0.011(0.007)
Constant 0.512a 0.604a 0.343a -0.053 0.673a
(0.131) (0.129) (0.130) (0.421) (0.141)No. of observations 40,537 38,479 34,859 8,354 30,219No. of firms 11,521 11,135 10,323 3,020 9,435R-squared 0.231 0.230 0.239 0.147 0.255Sargan-Hansen statistic 465.19a 471.83a 487.45a 59.10a 495.86a
Robust standard errors clustered at the firm level in parenthesis. a, b , c significantly differentfrom 0 at 1, 5 and 10 percent level respectively. All regressions include firm and year fixed effects.Capital is measured as the real value of tangible fixed assets. Labour is measured as the numberof employees. FDI is measured as the total value-added by foreign-owned firms within an industry-province pair in a given year. ForeignHMT is measured as the total value-added accounted forforeign firms originating from Hong Kong, Macau and Taiwan (HMT) in an industry-province cell.Foreignother is measured as the total value-added from foreign firms not originating in HMT in anindustry-province pair. The Sargan-Hansen statistic is an overidentifying restrictions test which isrobust to heteroskedasticity and clustering. A rejection of the null hypothesis indicates that a fixedeffects model is preferred to a random effects model.
Girma and Gong (2008) and Hale and Long (2011). Since we do not find evidence of productivity
spillover benefits arising from foreign firms originating from HMT or accruing to state-owned firms,
the remaining of the analysis focuses on whether credit constraints mediate the spillovers generated
by the activity of non-HMT firms on non-state-owned, domestic Chinese producers.
We now proceed to address our main research question: do credit constraints prevent domestic
Chinese firms from realising positive productivity spillovers arising from the activity of foreign-
owned firms? Our findings indicate that credit constraints indeed prevent Chinese firms in industries
above the median level of external finance dependence from enjoying any significant gains from the
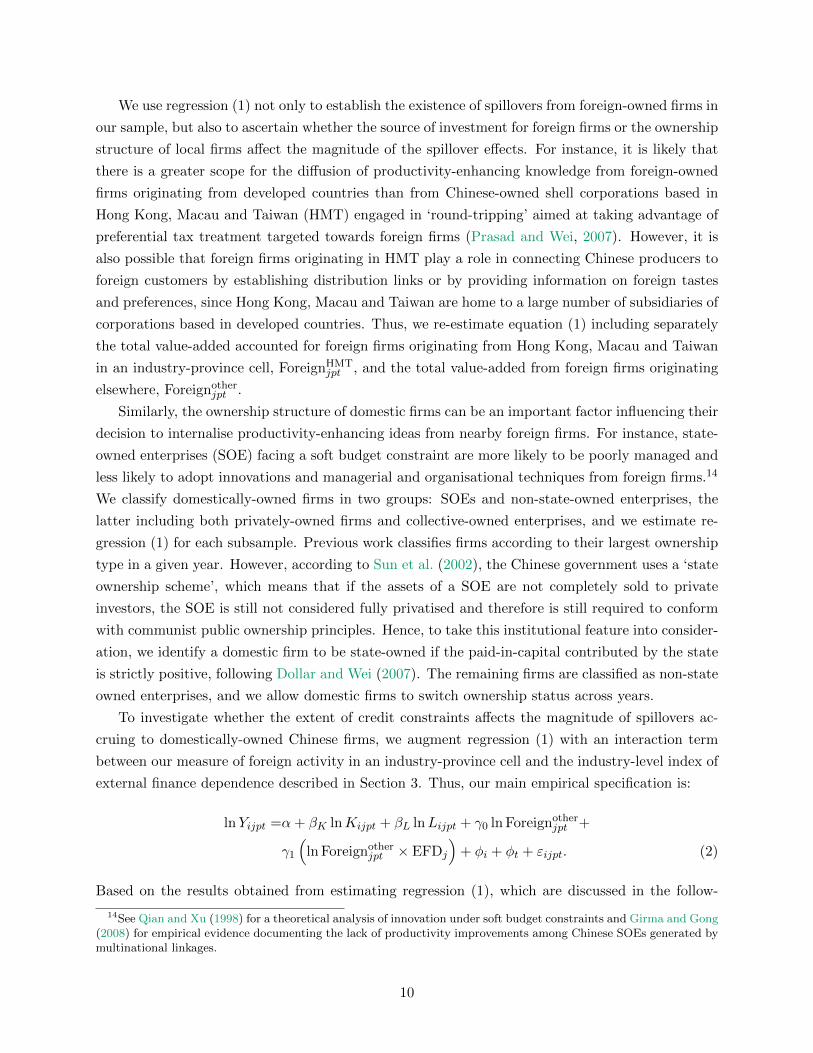
operation of foreign firms in the same industry and province. Table 5 presents the estimates from
regression (2). The interaction term between the activity of foreign firms in an industry-province
cell and the Rajan and Zingales (1998) industry-level measure of external finance dependence (EFD)
is statistically significant at the 1% level, regardless of whether we use the continuous index or a
dummy variable splitting industries at the median of the EFD index. This effect is also robust to
13
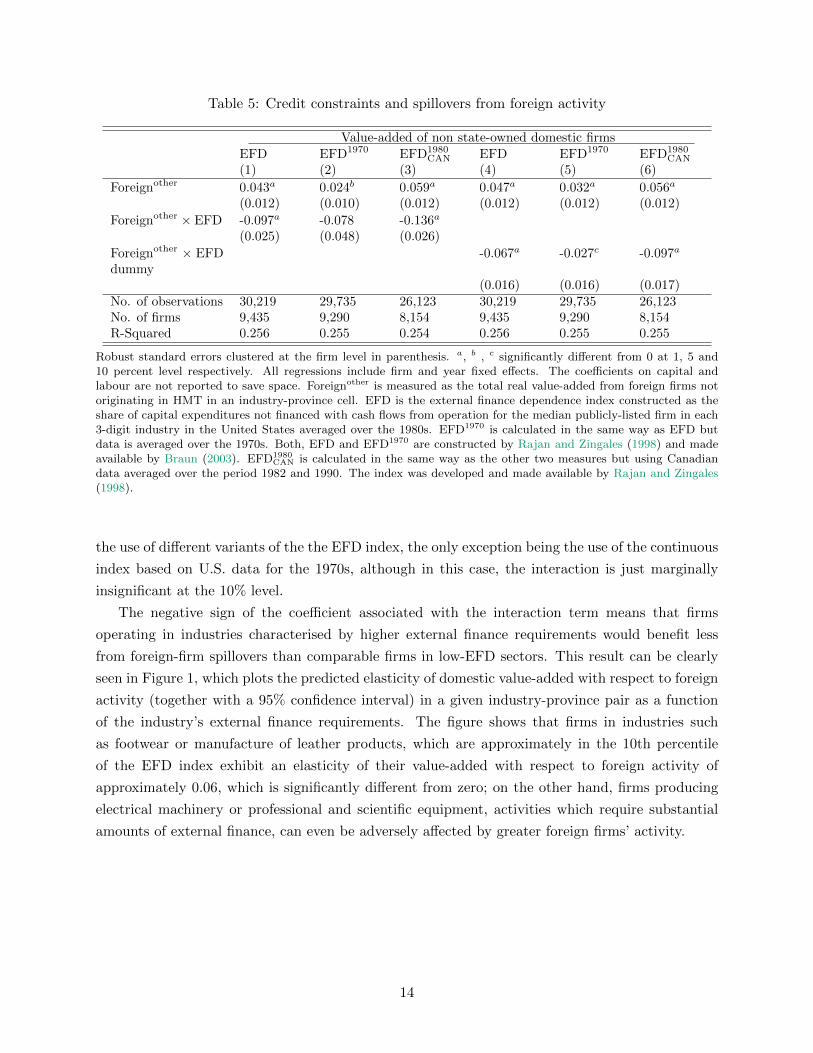
Table 5: Credit constraints and spillovers from foreign activity
Value-added of non state-owned domestic firmsEFD EFD1970 EFD1980
CAN EFD EFD1970 EFD1980CAN
(1) (2) (3) (4) (5) (6)
Foreignother 0.043a 0.024b 0.059a 0.047a 0.032a 0.056a
(0.012) (0.010) (0.012) (0.012) (0.012) (0.012)
Foreignother × EFD -0.097a -0.078 -0.136a
(0.025) (0.048) (0.026)
Foreignother × EFDdummy
-0.067a -0.027c -0.097a
(0.016) (0.016) (0.017)No. of observations 30,219 29,735 26,123 30,219 29,735 26,123No. of firms 9,435 9,290 8,154 9,435 9,290 8,154R-Squared 0.256 0.255 0.254 0.256 0.255 0.255
Robust standard errors clustered at the firm level in parenthesis. a, b , c significantly different from 0 at 1, 5 and10 percent level respectively. All regressions include firm and year fixed effects. The coefficients on capital andlabour are not reported to save space. Foreignother is measured as the total real value-added from foreign firms notoriginating in HMT in an industry-province cell. EFD is the external finance dependence index constructed as theshare of capital expenditures not financed with cash flows from operation for the median publicly-listed firm in each3-digit industry in the United States averaged over the 1980s. EFD1970 is calculated in the same way as EFD butdata is averaged over the 1970s. Both, EFD and EFD1970 are constructed by Rajan and Zingales (1998) and madeavailable by Braun (2003). EFD1980
CAN is calculated in the same way as the other two measures but using Canadiandata averaged over the period 1982 and 1990. The index was developed and made available by Rajan and Zingales(1998).
the use of different variants of the the EFD index, the only exception being the use of the continuous
index based on U.S. data for the 1970s, although in this case, the interaction is just marginally
insignificant at the 10% level.
The negative sign of the coefficient associated with the interaction term means that firms
operating in industries characterised by higher external finance requirements would benefit less
from foreign-firm spillovers than comparable firms in low-EFD sectors. This result can be clearly
seen in Figure 1, which plots the predicted elasticity of domestic value-added with respect to foreign
activity (together with a 95% confidence interval) in a given industry-province pair as a function
of the industry’s external finance requirements. The figure shows that firms in industries such
as footwear or manufacture of leather products, which are approximately in the 10th percentile
of the EFD index exhibit an elasticity of their value-added with respect to foreign activity of
approximately 0.06, which is significantly different from zero; on the other hand, firms producing
electrical machinery or professional and scientific equipment, activities which require substantial
amounts of external finance, can even be adversely affected by greater foreign firms’ activity.
14

Figure 1: The effect of credit constraints on spillovers from foreign firms
The figure presents the estimated elasticity of real value-added with respect to theactivity of foreign firms not originating from Hong Kong, Macau or Taiwan fornon state-owned domestic firms for selected quantiles of the external finance de-pendence index. Each symbol in the figure represents the corresponding percentileof the external finance dependence index (e.g. ’x’ denotes the median and � the75th percentile of the EFD index). The figure is based on the estimates presentedin column (1) of Table 5.
Using a dummy variable splitting industries at the median EFD in column 4 of Table 5, indicates
the existence of positive spillovers for non-SOE domestic firms in industries with external financial
dependence below the median, confirming the results depicted in Figure 1. The dichotomous
specification is our preferred one based on the J-test proposed by Davidson and MacKinnon (1981)
which rejects the linear specification in favour of the exogenous sample splitting at the median model
(see Table A.6). This test involves re-estimating regression (2) including the linear prediction of
the competing model in each regression (continuous interaction and exogenous sample splitting).18
We interpret this result as suggestive of a threshold effect determining whether non state-owned
Chinese domestic firms can benefit from the activities of foreign firms, i.e. firms unconstrained to
access external finance enjoy the spillover benefits, while constrained firms are shut down from this
channel for productivity gains. Girma (2005) provides empirical evidence in support of threshold
18Under the null hypothesis that the linear continuous interaction model explains the variation in the data betterthan the exogenous sample splitting model, the predicted power obtained from the linear prediction of the lattershould appear as insignificant when added to the former model. Analogously, under the null hypothesis that theexogenous sample splitting fits the data better, then the linear prediction of the continuous interaction model wouldbe statistically insignificant when added to the exogenous sample splitting regression.
15

effects of FDI spillovers for domestic firms in the UK.
Our result that credit constraints constitute an important dimension of domestic firms’ absorp-
tive capacity to benefit from spillovers from foreign-owned firms is akin to the finding by Alfaro et al.
(2004) that foreign direct investment plays an important role in contributing to economic growth in
countries with more developed financial markets. Our result is also consistent with the findings of
Villegas-Sanchez (2009) for Mexico showing that firms located in more financially-developed regions
stand to achieve greater productivity gains from the operation of foreign firms.
An important issue that arises in interpreting the results from regression (2) is whether we truly
are measuring cross-industry variation on the tightness of credit constraints, or if on the other hand,
we are capturing other industry characteristics that are correlated with the activity of foreign firms.
For instance, Defever and Riano (2012) show that local governments in China actively encour-
age the operation of foreign firms focused on exporting activities using fiscal incentives channeled
through special economic zones. However, it is also the case that firms operating in highly trad-
able industries are characterised by longer delivery lags and more complex inventory management
(Alessandria et al., 2010), which makes tradability strongly positively correlated with EFD at the
industry level. Thus, our estimated negative coefficient for the interaction term Foreignother×EFD
might be picking up the fact that a greater level of activity by export-oriented multinationals could
result in a tougher competitive environment and lower production by domestic Chinese firms. If
this was indeed the case, we would expect that including an additional interaction term between
our industry-province measure of foreign activity and an industry-level index of tradability should
render the coefficient of interest, γ1, in regression (2) statistically insignificant.
We carry out this robustness exercise using a wide set of indices measuring industry characteris-
tics besides tradability, which include tangibility, durability, liquidity and an indicator for industries
that primarily produce investment goods drawn from Braun and Larrain (2005) and Kroszner et al.
(2007), all of which are calculated using data for publicly-listed firms in the U.S., just as our index
for credit constraints.19
A greater degree of tangibility, which is a measure based on the share of total assets accounted
for net property, plant and equipment, should, everything else equal, facilitate a firm’s access to
external finance as asset hardness reduces the uncertainty regarding a firm’s pledgeable assets.
Thus, we would expect domestic Chinese firms in highly tangible industries to enjoy positive, net
spillovers from nearby non-HMT foreign firms in the same industry as they would be able to raise
the required external finance by pledging hard assets as collateral. Similarly, we would expect firms
in capital-intensive sectors, producing goods that are durable, tradable and for investment purposes
to realise greater spillovers from multinational activity.
Our finding that only firms operating in industries characterised by low dependence on external
finance enjoy spillovers from foreign firms remains statistically and economically significant after
controlling for the interaction of a wide range of industry characteristics and the extent of foreign
19The correlation between EFD and the other industry characteristics we investigate ranges from -0.17 with respectto the liquidity index to 0.38 for the investment goods producer index.
16

Tab
le6:
Isex
tern
alfi
nan
ced
epen
den
cem
easu
rin
got
her
ind
ust
ry-l
evel
char
acte
rist
ics?
Valu
e-ad
ded
of
non
state
-Ow
ned
dom
esti
cfi
rms
(1)
(2)
(3)
(4)
(5)
(6)
(7)
For
eign
oth
er
0.0
47a
0.0
18
-0.0
07
0.0
50a
0.0
19
0.0
45a
0.0
36b
(0.0
12)
(0.0
16)
(0.0
18)
(0.0
13)
(0.0
13)
(0.0
12)
(0.0
17)
For
eign
oth
er×
EF
D-0
.067a
-0.0
51a
-0.0
22
-0.0
65a
-0.0
77a
-0.0
83a
-0.0
61a
(0.0
16)
(0.0
16)
(0.0
19)
(0.0
17)
(0.0
16)
(0.0
20)
(0.0
17)
For
eign
oth
er×
tan
gib
ilit
yd
um
my
0.0
36b
(0.0
16)
For
eign
oth
er×
cap
ital
inte
nsi
tyd
um
my
0.0
65a
(0.0
19)
For
eign
oth
er×
liqu
idit
yd
um
my
-0.0
06
(0.0
17)
For
eign
oth
er×
du
rab
ilit
yd
um
my
0.0
53a
(0.0
16)
For
eign
oth
er×
inve
stm
ent
good
sp
rod
uce
rd
um
my
0.0
28
(0.0
21)
For
eign
oth
er×
trad
abil
ity
du
mm
y0.0
15
(0.0
17)
No.
ofob
serv
atio
ns
30,2
19
30,2
19
30,2
19
30,2
19
30,2
19
30,2
19
30,2
19
No.
offi
rms
9,4
35
9,4
35
9,4
35
9,4
35
9,4
35
9,4
35
9,4
35
R-s
qu
ared
0.2
56
0.2
56
0.2
56
0.2
56
0.2
56
0.2
56
0.2
56
F-t
est
ofeq
ual
ity
ofin
tera
ctio
nte
rms
20.1
0a24.5
1a
4.3
8b
25.6
7a
8.9
0a
16.5
5a
Robust
standard
erro
rscl
ust
ered
at
the
firm
level
inpare
nth
esis
.a,
b,
csi
gnifi
cantl
ydiff
eren
tfr
om
0at
1,
5and
10
per
cent
level
resp
ecti
vel
y.A
llre
gre
ssio
ns
incl
ude
firm
and
yea
rfixed
effec
ts.
The
coeffi
cien
tson
capit
al
and
lab
our
are
not
rep
ort
edto
save
space
.T
angib
ilit
yis
an
indic
ato
rca
lcula
ted
as
the
med
ian
rati
oof
net
pro
per
ty,
pla
nt
and
equip
men
tto
the
book
valu
eof
ass
ets
of
all
US
base
dco
mpanie
sin
agiv
enin
dust
ry,
calc
ula
ted
from
Com
pust
at’
sannual
indust
rial
file
sfo
r1986-1
995
(Bra
un,
2003).
Capit
al
inte
nsi
tyis
an
indic
ato
rdefi
ned
as
the
med
ian
level
of
the
rati
oof
fixed
ass
ets
over
num
ber
of
emplo
yee
sof
US
firm
sin
Com
pust
at
for
the
per
iod
1980-
1999
(Kro
szner
etal.,2007).
Liq
uid
ity
isan
index
calc
ula
ted
as
the
med
ian
level
of
liquid
ity
nee
ds
for
all
act
ive
US
base
dco
mpanie
sin
the
indust
ryca
lcula
ted
from
Com
pust
at’
sannual
indust
rial
file
sfo
r1980-1
999
(Kro
szner
etal.,
2007).
Dura
bilit
yis
an
index
of
whet
her
firm
sin
an
indust
rypro
duce
pre
dom
inantl
ydura
ble
goods,
usi
ng
the
class
ifica
tion
of
US
indust
ries
pro
vid
edby
the
US
Bure
au
of
Eco
nom
icA
naly
sis
(Kro
szner
etal.,
2007).
Inves
tmen
tgoods
pro
duce
ris
an
indic
ato
rw
hic
hm
easu
res
how
tilt
edto
ward
sin
ves
tmen
tgoods
rela
tive
toco
nsu
mpti
on
goods
an
indust
ryis
(Bra
un
and
Larr
ain
,2005).
Tra
dib
ilit
yis
const
ruct
edas
the
rati
otr
ade/
(tra
de+
dom
esti
cuse
),w
her
etr
ade
isdefi
ned
as
exp
ort
splu
sim
port
s,and
dom
esti
cuse
isdefi
ned
as
consu
mpti
on
plu
sin
ves
tmen
t,ei
ther
pri
vate
or
public
(Bra
un
and
Larr
ain
,2005).
The
dum
my
for
each
index
takes
the
valu
e1
ifan
indust
ryhas
an
index
valu
eab
ove
the
med
ian,
(0.2
9fo
rth
eT
angib
ilit
yin
dex
;22.1
2fo
rth
eC
apit
al
inte
nsi
tyin
dex
;0.1
6fo
rth
eL
iquid
ity
Index
;0.3
05
for
the
Inves
tmen
tgoods
pro
duce
rin
dex
and
0.4
95
for
the
Tra
dib
ilit
yin
dex
).F
ore
ignoth
er
ism
easu
red
as
the
tota
lva
lue-
added
from
fore
ign
firm
snot
ori
gin
ati
ng
inH
ong
Kong,
Maca
uor
Taiw
an
ina
giv
enin
dust
ry-p
rovin
cece
ll.
17

Tab
le7:
Usi
ng
lagg
edin
pu
tsan
dfo
reig
nac
tivit
y
Valu
e-ad
ded
All
dom
esti
cfi
rms
Sta
te-o
wn
edN
on
state
-ow
ned
dom
esti
cfi
rms
(1)
(2)
(3)
(4)
(5)
(6)
(7)
(8)
Cap
ital
t−1
0.08
8a
0.0
87a
0.0
85a
0.0
14
0.0
94a
0.0
94a
0.0
94a
0.0
92a
(0.0
11)
(0.0
11)
(0.0
12)
(0.0
36)
(0.0
12)
(0.0
12)
(0.0
12)
(0.0
12)
Lab
our t−1
0.19
4a
0.1
93a
0.1
97a
0.0
46
0.2
10a
0.2
04a
0.2
04a
0.2
05a
(0.0
19)
(0.0
20)
(0.0
20)
(0.0
60)
(0.0
20)
(0.0
20)
(0.0
20)
(0.0
20)
For
eign
t0.0
25c
(0.0
15)
For
eign
t−1
0.01
8c
(0.0
10)
For
eign
oth
er
t−1
0.0
22b
-0.0
01
0.0
26b
0.0
43a
0.0
42a
0.0
54a
(0.0
09)
(0.0
20)
(0.0
10)
(0.0
14)
(0.0
13)
(0.0
14)
For
eign
HM
Tt−
1-0
.004
(0.0
09)
For
eign
oth
er
t×
EF
D-0
.082b
(0.0
36)
For
eign
oth
er
t−1
×E
FD
-0.0
75a
-0.0
82a
(0.0
28)
(0.0
29)
For
eign
oth
er
t−1
×E
FD
du
mm
y-0
.042b
(0.0
19)
Con
stan
t3.
521a
3.3
28a
3.5
41a
5.1
97a
3.3
08a
3.3
98a
3.4
18
3.1
26a
(0.1
56)
(0.1
47)
(0.1
48)
(0.5
16)
(0.1
57)
(0.1
60)
(0.1
62)
(0.1
86)
No.
ofob
serv
atio
ns
28,8
64
27,3
47
24,9
14
5,7
84
21,6
26
20,5
43
20,5
43
20,2
15
No.
offi
rms
10,1
88
9,7
83
9,0
19
2,4
99
8,2
13
7,8
67
7,8
76
7,7
07
R-S
qu
ared
0.04
90.0
49
0.0
49
0.0
10
0.0
67
0.0
70
0.0
70
0.0
70
Robust
standard
erro
rscl
ust
ered
at
the
firm
level
inpare
nth
esis
.a,b
,c
signifi
cantl
ydiff
eren
tfr
om
0at
1,5
and
10
per
cent
level
resp
ecti
vel
y.A
llre
gre
ssio
ns
incl
ude
firm
and
yea
rfixed
effec
ts.
Capit
al t−1
ism
easu
red
as
the
real
valu
eof
tangib
lefixed
ass
ets.
Lab
our t−1
ism
easu
red
as
the
num
ber
of
emplo
yee
s.F
ore
ignt−
1is
mea
sure
das
the
tota
lva
lue-
added
by
fore
ign-o
wned
firm
sw
ithin
an
indust
ry-p
rovin
cece
llin
agiv
enyea
r.F
ore
ignoth
er
t−1
ism
easu
red
as
the
tota
lva
lue-
added
acc
ounte
dfo
rfo
reig
nfirm
snot
ori
gin
ati
ng
from
Hong
Kong,
Maca
uor
Taiw
an
(HM
T)
inan
indust
ry-p
rovin
cece
ll.
FD
IHM
Tt−
1is
mea
sure
das
the
tota
lva
lue-
added
from
fore
ign
firm
sori
gin
ati
ng
inH
MT
inan
indust
ry-p
rovin
cepair
.
18

activity at the province-industry level. The interaction between foreign firms’ value-added and EFD
is negative and statistically significant at the 1% level when we control for all other interaction terms
one by one, with the exception of the capital-intensity.20 The magnitude of the estimated coefficient
for the interaction between foreign activity and external finance dependence is quite similar across
all our specifications. Thus, we are confident that the results presented in Table 5 reflect the fact
that operating in an environment with tighter credit constraints reduces substantially the scope for
domestic firms to realise external productivity gains arising from the operation of foreign firms.
Further robustness checks
We conduct a battery of robustness checks analogous to the one used for regression (1). Controlling
for age and export status (Table A.8), clustering of standard errors at higher levels of aggregation
(Table A.9), more flexible estimation of the production function parameters (Table A.10) and using
total factor productivity as our dependent variable (Table A.11) all yield estimated interaction terms
of similar magnitude as those presented in Table 5, and in all cases statistically significant at the
1% level.
Our finding that external finance dependence is a fundamental factor in a firm’s capacity to
benefit from its interaction with foreign firms, indicates that productivity spillovers do not occur
automatically and might take time to materialise. Thus, Table 7 presents estimates of regressions
(1) and (2) using lagged inputs and a lagged measure of foreign activity.
This empirical specification is also useful to deal with the potential endogeneity of foreign ac-
tivity. Simultaneity bias could occur if foreign firm activity increases because the productivity of
domestic producers in the same industry-province cell increases. As Liu (2008) and Hale and Long
(2011) point out, this bias is of greater concern when the measures of domestic and foreign activ-
ity are at the same level aggregation. In our empirical specification, is plausible to assume that
individual firms’ performance does not affect aggregate foreign activity at the province-industry
level. Moreover, our inclusion of firm fixed effects should control for time-invariant unobservable
characteristics attracting foreign firms to a particular province or industry. Additionally, the use of
lagged foreign activity should reduce any concerns of endogeneity problems arising from simultane-
ity bias. Keller (2004) in its review of the empirical literature that seeks to identify productivity
spillovers from foreign direct investment also notes that this type of endogeneity problem does not
appear to be very important for the estimation of productivity spillovers at the firm level.
The main message from Tables 4 and 5 still carries through. We find evidence of positive
spillovers from the activity of non-HMT multinationals accruing to non state-owned Chinese firms.
Just as in our benchmark results shown in Table 4, the activity of multinationals originating from
Hong Kong, Macau or Taiwan does not improve the productivity of domestic firms and state-owned
enterprises do not enjoy productivity spillovers from non-HMT foreign firms, in contrast to their
20Although the coefficient estimate on Foreignother × EFD is statistically insignificant, the test of equality ofinteraction terms shows that its effect is different from the interaction between capital intensity and EFD. Moreover,this interaction appears as statistically significant when the term Foreignother×capital intensity dummy is introducedas a continuous interaction term (see Table A.7).
19
non-SOE counterparts.
The results presented in columns (6) and (7) of Table 7 show again, that only non state-owned
firms not facing credit constraints (operating in sectors with low dependence on external finance)
receive positive productivity effects from the operation of non-HMT foreign firms in the same indus-
try and province, regardless of whether we use a continuous measure of external finance dependence
or an exogenous sample split at the median EFD. Column (8) includes both contemporaneous and
lagged effects of foreign activity and its interaction with EFD. Foreign activity in the previous year
has a much stronger effect on domestic firms’ value-added than the level of contemporaneous value-
added of foreign firms; however the magnitude of the interaction term between foreign activity and
external finance dependence contemporaneously and with one-year lag is virtually identical. At the
median EFD, the elasticity of domestic firms’ value added with respect to foreign activity in the
same industry and province taking place the year before is 0.037; in contrast, the elasticity with
respect to the current level of foreign activity is not statistically different from zero.
Figure 2: The effect of credit constraints on spillovers across the size distribution
The figure presents the estimated elasticity of real value-added with respect to the activity of foreignfirms not originating from Hong Kong, Macau or Taiwan for non state-owned domestic firms withexternal finance dependence above the median level of the EFD index. Black circles denote thepoint estimate of the elasticity of domestic firms’ value-added with respect to foreign activity fromnon-HMT firms.
Lastly, we investigate whether the mediating effect of credit constraints on spillovers from
foreign activity is sensitive to firm size. Aterido et al. (2011) using firm-level data for a large set of
developing countries find evidence of significant non-linear effects of firm size on access to finance.
20

On the one hand, one would expect small firms to be on average farther away from the technology
frontier and thus have a greater scope to benefit from knowledge spillovers from foreign firms as in
Findlay (1978); on the other hand, small firms tend to be younger and their expected profitability is
more uncertain than that of larger, more established firms. Therefore, if the absorption of spillovers
necessitates costly investments, the negative effect that credit constraints have on spillovers from
foreign activity should be more pronounced for small firms.
To investigate the existence of size-based non-linearities on the effect of credit constraints on
domestic firms’ absorption of spillovers from foreign firms, we run regression (2) separately for each
quartile of the size distribution in our sample; Figure 2 presents the estimated elasticity of domestic
value-added with respect to foreign activity for each size category. Our results do not indicate the
existence of significant non-linearities on the effect of credit constraints on foreign spillovers for local
firms. Although the magnitude of the point-estimate for this elasticity follows a U-shape across
size quartiles, none of the estimates are statistically different from zero. Therefore, our result that
firms with external finance dependence above the median do not benefit from spillovers from foreign
activity does not depend on firm size.
One possible explanation for this finding is that the majority of firms in our sample are actually
quite large in terms of their annual turnover. If, as noted by Aterido et al. (2011), non-linearities
are most important for micro and small establishments, this effect would not be evident in our
regression results. Also, the results of this exercise need to be interpreted with caution because
the use of a sample-splitting criterion (employment in this case) which might be endogenous to
the estimating equation, could produce misleading results (see Bond and Van Reenen, 2007). This
would be the case if, for instance, productivity shocks unobserved by the econometrician affect a
firm’s hiring – the traditional simultaneity bias arising in the estimation of production functions.
6 Conclusions
Using a panel of large Chinese manufacturing firms for 2001-2005, we find that non-state owned,
domestic Chinese firms benefit from positive spillovers arising from the operation of foreign firms
originating outside Hong Kong, Macau and Taiwan. However, this positive average effect masks
the fact that only firms not facing credit constraints are able to enjoy positive spillovers from the
activity of foreign-owned firms. More specifically, these benefits only accrue to firms operating in
sectors with low demand for external finance. We also provide evidence in favour of a threshold
effect on the role that credit constraints play on mediating the impact of foreign activity on local
firms’ value-added and productivity; namely, domestic firms for which external finance dependence
is below the median of our sectoral index of credit constraints (e.g. firms in the footwear or leather
goods manufacture industries) enjoy positive spillovers from foreign firms, whilst Chinese-owned
firms in industries such as production of electrical machinery or manufacture of scientific equipment
do not see their productivity increase by an expansion of the activities of foreign firms operating
in the same industry and province. Our results are robust to the use of different measures of
21

credit constraints, various clustering arrangements of standard errors and controlling for other
confounding factors at the sectoral level that might influence the relationship between spillovers
from the activity of foreign firms and external finance dependence.
Our results demonstrate that positive productivity spillovers occurring as a by-product of the
operation of foreign firms do not accrue automatically to local firms. The latter require access
to external finance in order to take advantage of technological innovations, better management
practices or to attract skilled employees made available by foreign-owned firms. To the best of our
knowledge, ours is the first paper that provides empirical support for the claim that local producers’
access to external sources of finance plays an important role in determining the magnitude of pro-
ductivity spillovers that they can obtain from foreign-owned firms. This relationship is particularly
important for China, as several authors have established that the efficiency of its financial system
has lagged behind other developments in its economy. Thus, improving the access of non-state
owned firms to formal sources of finance could result in important productivity gains as China is
likely to remain one of the most popular recipients of foreign investment in the world.
22

References
Abraham, F., J. Konings, and V. Slootmaekers (2010): “FDI spillovers in the Chinesemanufacturing sector,” The Economics of Transition, 18, 143–182.
Aghion, P. and P. Howitt (1992): “A model of growth through creative destruction,” Econo-metrica, 60, 323–351.
Aitken, B. J. and A. E. Harrison (1999): “Do domestic firms benefit from direct foreigninvestment? evidence from Venezuela,” American Economic Review, 89, 605–618.
Alessandria, G., J. P. Kaboski, and V. Midrigan (2010): “Inventories, lumpy trade, andlarge devaluations,” American Economic Review, 100, 2304–2339.
Alfaro, L., A. Chanda, S. Kalemli-Ozcan, and S. Sayek (2004): “FDI and economicgrowth: the role of local financial markets,” Journal of International Economics, 64, 89–112.
Allen, F., J. Qian, and M. Qian (2005): “Law, finance, and economic growth in China,”Journal of Financial Economics, 77, 57–116.
Antras, P. and S. R. Yeaple (2013): “Multinational firms and the structure of internationaltrade,” NBER Working Papers 18775, National Bureau of Economic Research.
Arrow, K. J. (1969): “Classificatory notes on the production and transmission of technologicalknowledge,” American Economic Review, 59, 29–35.
Aterido, R., M. Hallward-Driemeier, and C. Pages (2011): “Big constraints to small firmsgrowth? business environment and employment growth across firms,” Economic Developmentand Cultural Change, 59, 609–647.
Ayyagari, M., A. Demirguc-Kunt, and V. Maksimovic (2010): “Formal versus informalfinance: evidence from China,” Review of Financial Studies, 23, 3048–3097.
——— (2011): “Firm innovation in emerging markets: the role of finance, governance, and com-petition,” Journal of Financial and Quantitative Analysis, 46, 1545–1580.
Bajona, C. and T. Chu (2010): “Reforming state owned enterprises in China: effects of WTOaccession,” Review of Economic Dynamics, 13, 800–823.
Beck, T., A. Demirguc-Kunt, L. Laeven, and R. Levine (2008): “Finance, firm size, andgrowth,” Journal of Money, Credit and Banking, 40, 1379–1405.
Blomstrom, M. and A. Kokko (1998): “Multinational corporations and spillovers,” Journal ofEconomic Surveys, 12, 247–277.
Bloom, N. and J. Van Reenen (2007): “Measuring and explaining management practices acrossfirms and countries,” The Quarterly Journal of Economics, 122, 1351–1408.
Bond, S. and J. Van Reenen (2007): “Microeconometric models of investment and employ-ment,” in Handbook of Econometrics, ed. by J. Heckman and E. Leamer, Elsevier, vol. 6 ofHandbook of Econometrics, chap. 65.
Brandt, L. and H. Li (2003): “Bank discrimination in transition economies: ideology, informa-tion, or incentives?” Journal of Comparative Economics, 31, 387–413.
23

Braun, M. (2003): “Financial contractibility and asset hardness,” Manuscript, University of Cal-ifornia, Los Angeles.
Braun, M. and B. Larrain (2005): “Finance and the business cycle: international, inter-industryevidence,” Journal of Finance, 60, 1097–1128.
Buckley, P. J., J. Clegg, and C. Wang (2002): “The impact of inward FDI on the performanceof Chinese manufacturing firms,” Journal of International Business Studies, 33, 637–655.
Campello, M., J. R. Graham, and C. R. Harvey (2010): “The real effects of financialconstraints: evidence from a financial crisis,” Journal of Financial Economics, 97, 470–487.
Chen, M. and A. Guariglia (2011): “Financial constraints and firm productivity in China:do liquidity and export behavior make a difference?” Discussion Papers 11/09, University ofNottingham, GEP.
Cohen, Wesley, M. and D. A. Levinthal (1990): “Absorptive capacity: a new perspective onlearning and innovation,” Administrative Science Quarterly, 35, 128–152.
Cull, R. and L. C. Xu (2003): “Who gets credit? the behavior of bureaucrats and state banksin allocating credit to Chinese state-owned enterprises,” Journal of Development Economics, 71,533–559.
Das, S. (1987): “Externalities, and technology transfer through multinational corporations: atheoretical analysis,” Journal of International Economics, 22, 171–182.
Dasgupta, P. and J. Stiglitz (1980): “Industrial structure and the nature of innovative activ-ity,” Economic Journal, 90, 266–293.
Davidson, R. and J. G. MacKinnon (1981): “Several tests for model specification in thepresence of alternative hypotheses,” Econometrica, 49, 781–793.
Defever, F. and A. Riano (2012): “China’s pure exporter subsidies,” CEP Discussion Papers1182.
Dollar, D. and S.-J. Wei (2007): “Das (Wasted) Kapital: firm ownership and investmentefficiency in China,” NBER Working Papers 13103, National Bureau of Economic Research.
Du, J. and S. Girma (2007): “Finance and firm export in China,” Kyklos, 60, 37–54.
Eaton, J. and S. Kortum (1999): “International technology diffusion: theory and measurement,”International Economic Review, 40, 537–570.
Feenstra, R. C., Z. Li, and M. Yu (2011): “Exports and credit constraints under incompleteinformation: theory and evidence from China,” NBER Working Papers 16940.
Findlay, R. (1978): “Relative backwardness, direct foreign investment, and the transfer of tech-nology: a simple dynamic model,” The Quarterly Journal of Economics, 92, 1–16.
Fosfuri, A., M. Motta, and T. Ronde (2001): “Foreign direct investment and spilloversthrough workers’ mobility,” Journal of International Economics, 53, 205–222.
Girma, S. (2005): “Absorptive capacity and productivity spillovers from FDI: a threshold regres-sion analysis,” Oxford Bulletin of Economics and Statistics, 67, 281–306.
24

Girma, S. and Y. Gong (2008): “FDI, linkages and the efficiency of state-owned enterprises inChina,” Journal of Development Studies, 44, 728–749.
Gorg, H. and D. Greenaway (2004): “Much ado about nothing? do domestic firms reallybenefit from foreign direct investment?” World Bank Research Observer, 19, 171–197.
Grossman, G. and E. Helpman (1991): Innovation and growth in the global economy, Cam-bridge, MA: MIT Press.
Hale, G. and C. Long (2011): “Are there productivity spillovers from foreign direct investmentin China?” Pacific Economic Review, 16, 135–153.
Hansen, B. E. (1999): “Threshold effects in non-dynamic panels: estimation, testing, and infer-ence,” Journal of Econometrics, 93, 345–368.
Haskel, J. E., S. C. Pereira, and M. J. Slaughter (2007): “Does inward foreign directinvestment boost the productivity of domestic firms?” The Review of Economics and Statistics,89, 482–496.
Holmes, T. J., E. R. McGrattan, and E. C. Prescott (2013): “Quid pro quo: technologycapital transfers for market access in China,” NBER Working Papers 19249, National Bureau ofEconomic Research.
Javorcik, B. S. (2004): “Does foreign direct investment increase the productivity of domesticfirms? in search of spillovers through backward linkages,” American Economic Review, 94, 605–627.
Javorcik, B. S. and M. Spatareanu (2009): “Liquidity constraints and firms’ linkages withmultinationals,” World Bank Economic Review, 23, 323–346.
Jones, C. I. (2005): “Growth and ideas,” in Handbook of Economic Growth, ed. by P. Aghion andS. Durlauf, Elsevier, vol. 1 of Handbook of Economic Growth, chap. 16, 1063–1111.
Jordaan, J. A. (2005): “Determinants of FDI-induced externalities: New empirical evidence forMexican manufacturing industries,” World Development, 33, 2103–2118.
Keller, W. (1996): “Absorptive capacity: on the creation and acquisition of technology in devel-opment,” Journal of Development Economics, 49, 199–227.
——— (2004): “International technology diffusion,” Journal of Economic Literature, 42, 752–782.
Kroszner, R. S., L. Laeven, and D. Klingebiel (2007): “Banking crises, financial dependence,and growth,” Journal of Financial Economics, 84, 187–228.
Levine, R. (2005): “Finance and growth: theory and evidence,” in Handbook of Economic Growth,ed. by P. Aghion and S. Durlauf, Elsevier, vol. 1 of Handbook of Economic Growth, chap. 12,865–934.
Levinsohn, J. and A. Petrin (2003): “Estimating production functions using inputs to controlfor unobservables,” Review of Economic Studies, 70, 317–341.
Liu, Z. (2008): “Foreign direct investment and technology spillovers: theory and evidence,” Journalof Development Economics, 85, 176–193.
25

Manova, K. (2013): “Credit constraints, heterogeneous firms, and international trade,” Reviewof Economic Studies, 80, 711–744.
Mansfield, E. and A. Romeo (1980): “Technology transfer to overseas subsidiaries by U.S.based firms,” Quarterly Journal of Economics, 95, 737–750.
Naughton, B. (1996): “China’s emergence and prospects as a trading nation,” Brookings Paperson Economic Activity, 27, 273–344.
Navaretti, G. B. and A. J. Venables (2006): Multinational firms in the world economy,Princeton, NJ: Princeton University Press.
Polanyi, M. (1958): Personal knowledge: towards a post-critical philosophy, Chicago, IL: Univer-sity of Chicago Press.
Prasad, E. and S.-J. Wei (2007): “The Chinese approach to capital inflows: patterns andpossible explanations,” in Capital Controls and Capital Flows in Emerging Economies: Policies,Practices and Consequences, National Bureau of Economic Research, 421–480.
Qian, Y. and C. Xu (1998): “Innovation and bureaucracy under soft and hard budget con-straints,” Review of Economic Studies, 65, 151–164.
Rajan, R. G. and L. Zingales (1998): “Financial dependence and growth,” American EconomicReview, 88, 559–586.
Spence, M. (1984): “Cost reduction, competition, and industry performance,” Econometrica, 52,101–121.
Strebulaev, I. A. and T. M. Whited (2012): “Dynamic models and structural estimation incorporate finance,” Manuscript, University of Rochester.
Sun, Q., W. H. S. Tong, and J. Tong (2002): “How does government ownership affect firmperformance? evidence from China’s privatization experience,” Journal of Business Finance &Accounting, 29, 1–27.
Villegas-Sanchez, C. (2009): “FDI spillovers and the role of local financial markets: evidencefrom Mexico,” Manuscript, University of Houston.
Vives, X. (2008): “Innovation and competitive pressure,” Journal of Industrial Economics, 56,419–469.
Wang, J.-Y. and M. Blomstrom (1992): “Foreign investment and technology transfer : Asimple model,” European Economic Review, 36, 137–155.
Wei, Y. and X. Liu (2006): “Productivity spillovers from R&D, exports and FDI in China’smanufacturing sector,” Journal of International Business Studies, 37, 544–557.
Xu, C. (2011): “The fundamental institutions of China’s reforms and development,” Journal ofEconomic Literature, 49, 1076–1151.
26

A Appendix
27
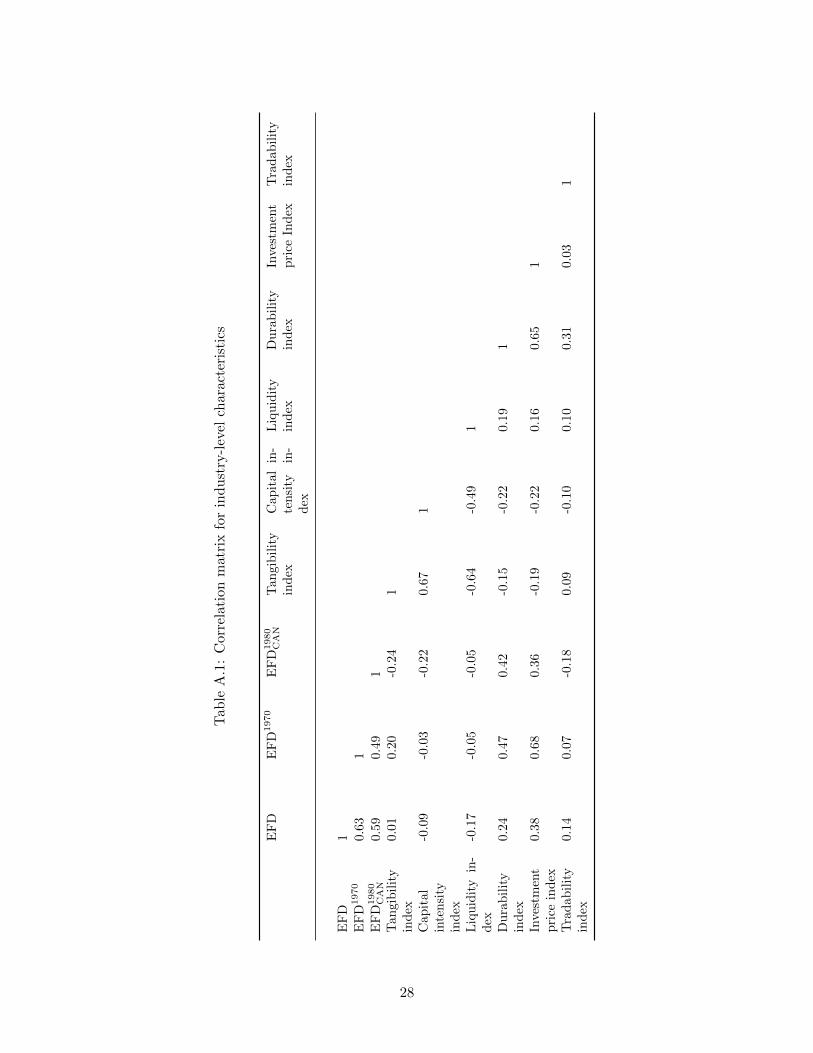
Tab
leA
.1:
Cor
rela
tion
mat
rix
for
ind
ust
ry-l
evel
char
acte
rist
ics
EF
DE
FD
1970
EF
D1980
CAN
Tan
gib
ilit
yin
dex
Cap
ital
in-
ten
sity
in-
dex
Liq
uid
ity
ind
exD
ura
bil
ity
ind
exIn
vest
men
tp
rice
Ind
exT
rad
ab
ilit
yin
dex
EF
D1
EF
D1970
0.63
1E
FD
1980
CAN
0.59
0.49
1T
angi
bil
ity
ind
ex0.
010.
20-0
.24
1
Cap
ital
inte
nsi
tyin
dex
-0.0
9-0
.03
-0.2
20.6
71
Liq
uid
ity
in-
dex
-0.1
7-0
.05
-0.0
5-0
.64
-0.4
91
Du
rab
ilit
yin
dex
0.24
0.47
0.4
2-0
.15
-0.2
20.1
91
Inve
stm
ent
pri
cein
dex
0.38
0.68
0.3
6-0
.19
-0.2
20.1
60.6
51
Tra
dab
ilit
yin
dex
0.14
0.07
-0.1
80.0
9-0
.10
0.1
00.3
10.0
31
28

Table A.2: Adding time-varying firm characteristics
Value-added of domestic firms(1) (2) (3) (4)
Capital 0.199a 0.198a 0.200a 0.198a
(0.011) (0.011) (0.011) (0.011)Labour 0.559a 0.552a 0.559a 0.551a
(0.018) (0.018) (0.018) (0.018)Foreign 0.024a 0.024a 0.024a 0.024a
(0.008) (0.008) (0.008) (0.008)Export dummy 0.100a 0.100a
(0.016) (0.016)Age 0.046 0.046
(0.039) (0.039)Constant 0.512a 0.524a 0.508a 0.520a
(0.131) (0.130) (0.131) (0.131)No. of observations 40,537 40,537 40,513 40,513No. of firms 11,521 11,521 11,519 11,519R-Squared 0.231 0.232 0.230 0.232
Robust standard errors clustered at the firm level in parenthesis. a, b , c
significantly different from 0 at 1, 5 and 10 percent level respectively. Allregressions include firm and year fixed effects. Capital is measured as thereal value of tangible fixed assets. Labour is measured as the number ofemployees. Foreign is measured as the total value-added by foreign-ownedfirms within an industry-province pair in a given year.
Table A.3: Clustering of standard errors at different levels of aggregation
Value-added of domestic firmsOne-way Two-way
Standard errors clustered at: Firm Industry-province Industry and province(1) (2) (3)
Capital 0.199a 0.199a 0.188a
(0.011) (0.011) (0.015)Labour 0.559a 0.559a 0.568a
(0.018) (0.018) (0.042)Foreign 0.024a 0.024c 0.023
(0.008) (0.013) (0.020)Constant 0.512a 0.512a -0.000
(0.131) (0.175) (0.000)No. of observations 40,537 40,537 32,801No. of clusters 11,521 466 -R-Squared 0.231 0.231 0.24
a, b , c significantly different from 0 at 1, 5 and 10 percent level respectively. Allregressions include firm and year fixed effects. Two-way clustering at the industry andprovince level results (column 3) are estimated using the cgmreg command in Stata.Capital is measured as the real value of tangible fixed assets. Labour is measured as thenumber of employees. FDI is measured as the total value-added by foreign-owned firmswithin an industry-province pair in a given year.
29

Table A.4: Two-digit sector-specific production function parameters
Value-added of domestic firms(1) (2)
Capital 0.199a 0.504(0.011) (0.326)
Labour 0.559a 0.516c
(0.018) (0.277)Foreign 0.024a 0.022a
(0.008) (0.008)Constant 0.512a 0.510a
(0.131) (0.130)No. of observations 40,537 40,537No. of firms 11,521 11,521R-Squared 0.231 0.235
Robust standard errors clustered at the firm level in parenthesis.a, b , c significantly different from 0 at 1, 5 and 10 percent levelrespectively. All regressions include 2-digit industry×capital, and2-digit industry×labour interactions as well as firm and year fixedeffects. Capital is measured as the real value of tangible fixed as-sets. Labour is measured as the number of employees. Foreign ismeasured as the total value-added by foreign-owned firms withinan industry-province cell in a given year.
Table A.5: Using Total Factor Productivity (TFP) as dependent variable
Domestic firmsValue-added TFP
(1) (2)Capital 0.199a
(0.011)Labour 0.559a
(0.024)Foreign 0.024a 0.026a
(0.008) (0.008)Constant 0.512a 2.719a
(0.131) (0.075)No. of observations 40,537 40,537No. of firms 11,521 11,521R-Squared 0.231 0.042
Robust standard errors clustered at the firm level in parenthesis. a, b , c
significantly different from 0 at 1, 5 and 10 percent level respectively. Allregressions include firm and year fixed effects. Capital is measured as thereal value of tangible fixed assets. Labour is measured as the number of em-ployees. Foreign is measured as the total value-added by foreign-owned firmswithin an industry-province pair in a given year. Total Factor Productivity(TFP) is calculated using the Levinsohn and Petrin (2003) algorithm.
30

Table A.6: Test of continuous interaction model against exogenous sample splitting model
Value-added of domestic firms(1) (2)
Capital 0.017 0.162b
(0.068) (0.074)Labour 0.050 0.471b
(0.194) (0.214)
Foreignother 0.005 0.042b
(0.018) (0.018)
Foreignother × EFD -0.015(0.037)
Linear prediction exogenous sample splitting 0.910a
(0.347)
Foreignother × EFD dummy -0.061a
(0.023)Linear prediction continuous interaction term 0.154
(0.383)Constant 0.068 0.646b
(0.284) (0.321)No. of observations 30,219 30,219No. of firms 9,435 9,435R-Squared 0.256 0.256
Robust standard errors clustered at the firm level in parenthesis. a, b , c significantly differentfrom 0 at 1, 5 and 10 percent level respectively. Capital is measured as the real value of tangiblefixed assets. Labour is measured as the number of employees. Foreignother is measured asthe total value-added from foreign firms not originating in Hong Kong, Macau or Taiwanin an industry-province cell. EFD is the external financial dependence index constructed asthe share of capital expenditures not financed with cash flow from operation for the medianpublicly-listed firm in each 3-digit industry in the United States averaged over the 1980s. EFDdummy takes the value 1 if an industry has external finance dependence above the median forthe EFD continuous index (0.21) and 0 otherwise.
31

Tab
leA
.7:
Isex
tern
alfi
nan
ced
epen
den
cep
ickin
gu
pot
her
ind
ust
rych
arac
teri
stic
s?U
sin
gco
nti
nu
ous
inte
ract
ion
term
s
Valu
e-ad
ded
of
non
state
-ow
ned
dom
esti
cfi
rms
(1)
(2)
(3)
(4)
(5)
(6)
(7)
For
eign
oth
er
0.0
43a
-0.0
48b
-0.0
13
0.1
11a
0.0
19
0.0
43a
-0.0
19
(0.0
12)
(0.0
23)
(0.0
18)
(0.0
37)
(0.0
13)
(0.0
12)
(0.0
24)
For
eign
oth
er×
EF
D-0
.097a
-0.0
71a
-0.0
71a
-0.0
90a
-0.1
04a
-0.0
97a
-0.0
82a
(0.0
25)
(0.0
25)
(0.0
25)
(0.0
26)
(0.0
26)
(0.0
29)
(0.0
25)
For
eign
oth
er×
tan
gib
ilit
yin
dex
0.2
56a
(0.0
62)
For
eign
oth
er×
cap
ital
inte
nsi
tyin
dex
0.0
01a
(0.0
00)
For
eign
oth
er×
liqu
idit
yin
dex
-0.4
35c
(0.2
28)
For
eign
oth
er×
du
rab
ilit
yin
dex
0.0
44a
(0.0
16)
For
eign
oth
er×
inve
stm
ent
good
sp
rod
uce
rin
dex
-0.0
001
(0.0
29)
For
eign
oth
er×
trad
abil
ity
ind
ex0.0
95a
(0.0
35)
Con
stan
t0.7
23a
0.7
78a
0.7
87a
0.7
41a
0.7
63a
0.7
23a
0.7
65a
(0.1
41)
(0.1
40)
(0.1
41)
(0.1
41)
(0.1
41)
(0.1
41)
(0.1
40)
No.
ofob
serv
atio
ns
30,2
19
30,2
19
30,2
19
30,2
19
30,2
19
30,2
19
30,2
19
No.
offi
rms
9,4
35
9,4
35
9,4
35
9,4
35
9,4
35
9,4
35
9,4
35
R-S
qu
ared
0.2
56
0.2
56
0.2
56
0.2
56
0.2
56
0.2
56
0.2
56
F-t
est
ofeq
ual
ity
ofin
tera
ctio
nte
rms
25.7
2a8.4
7a2.1
919.9
8a
3.7
4c
19.5
2a
Robust
standard
erro
rscl
ust
ered
at
the
firm
level
inpare
nth
esis
.a,
b,
csi
gnifi
cantl
ydiff
eren
tfr
om
0at
1,
5and
10
per
cent
level
resp
ecti
vel
y.A
llre
gre
ssio
ns
incl
ude
firm
and
yea
rfixed
effec
ts.
The
coeffi
cien
tson
capit
al
and
lab
our
are
not
rep
ort
edto
save
space
.T
angib
ilit
yis
an
indic
ato
rca
lcula
ted
as
the
med
ian
rati
oof
net
pro
per
ty,
pla
nt
and
equip
men
tto
the
book
valu
eof
ass
ets
of
all
US
base
dco
mpanie
sin
agiv
enin
dust
ry,
calc
ula
ted
from
Com
pust
at’
sannual
indust
rial
file
sfo
r1986-1
995
(Bra
un,
2003).
Capit
al
inte
nsi
tyis
an
indic
ato
rdefi
ned
as
the
med
ian
level
of
the
rati
oof
fixed
ass
ets
over
num
ber
of
emplo
yee
sof
US
firm
sin
Com
pust
at
for
the
per
iod
1980-
1999
(Kro
szner
etal.,2007).
Liq
uid
ity
isan
index
calc
ula
ted
as
the
med
ian
level
of
liquid
ity
nee
ds
for
all
act
ive
US
base
dco
mpanie
sin
the
indust
ryca
lcula
ted
from
Com
pust
at’
sannual
indust
rial
file
sfo
r1980-1
999
(Kro
szner
etal.,
2007).
Dura
bilit
yis
an
index
of
whet
her
firm
sin
an
indust
rypro
duce
pre
dom
inantl
ydura
ble
goods,
usi
ng
the
class
ifica
tion
of
US
indust
ries
pro
vid
edby
the
US
Bure
au
of
Eco
nom
icA
naly
sis
(Kro
szner
etal.,
2007).
Inves
tmen
tgoods
pro
duce
ris
an
indic
ato
rw
hic
hm
easu
res
how
tilt
edto
ward
sin
ves
tmen
tgoods
rela
tive
toco
nsu
mpti
on
goods
an
indust
ryis
(Bra
un
and
Larr
ain
,2005).
Tra
dib
ilit
yis
const
ruct
edas
the
rati
otr
ade/
(tra
de+
dom
esti
cuse
),w
her
etr
ade
isdefi
ned
as
exp
ort
splu
sim
port
s,and
dom
esti
cuse
isdefi
ned
as
consu
mpti
on
plu
sin
ves
tmen
t,ei
ther
pri
vate
or
public
(Bra
un
and
Larr
ain
,2005).
Fore
ignoth
er
ism
easu
red
as
the
tota
lva
lue-
added
from
fore
ign
firm
snot
ori
gin
ati
ng
inH
ong
Kong,
Maca
uor
Taiw
an
ina
giv
enin
dust
ry-p
rovin
cece
ll.
32

Tab
leA
.8:
Ad
din
gti
me-
vary
ing
firm
char
acte
rist
ics
–in
tera
ctio
nre
gres
sion
Valu
e-ad
ded
of
non
state
-ow
ned
dom
esti
cfi
rms
On
ly(1
)(2
)(3
)(4
)(5
)(6
)(7
)(8
)C
apit
al0.1
91a
0.1
90a
0.1
91a
0.1
90a
0.1
91a
0.1
90a
0.1
91a
0.1
90a
(0.0
12)
(0.0
12)
(0.0
12)
(0.0
12)
(0.0
12)
(0.0
12)
(0.0
12)
(0.0
12)
Lab
our
0.5
56a
0.5
52a
0.5
56a
0.5
52a
0.5
56a
0.5
52a
0.5
56a
0.5
52a
(0.0
19)
(0.0
19)
(0.0
19)
(0.0
19)
(0.0
19)
(0.0
19)
(0.0
19)
(0.0
19)
For
eign
oth
er
0.0
43a
0.0
44a
0.0
44a
0.0
44a
0.0
47a
0.0
48a
0.0
48a
0.0
48a
(0.0
12)
(0.0
12)
(0.0
12)
(0.0
12)
(0.0
12)
(0.0
12)
(0.0
12)
(0.0
12)
For
eign
oth
er×
EF
D-0
.097a
-0.0
99a
-0.0
98a
-0.1
00a
(0.0
25)
(0.0
25)
(0.0
25)
(0.0
25)
For
eign
oth
er×
EF
Dd
um
my
-0.0
67a
-0.0
68a
-0.0
68a
-0.0
69a
(0.0
16)
(0.0
16)
(0.0
16)
(0.0
16)
Exp
ort
du
mm
y0.0
67a
0.0
67a
0.0
68a
0.0
68a
(0.0
18)
(0.0
18)
(0.0
18)
(0.0
18)
Age
-0.0
02
-0.0
05
-0.0
00
-0.0
03
(0.0
68)
(0.0
68)
(0.0
69)
(0.0
69)
Con
stan
t0.7
23a
0.7
25a
0.7
20a
0.7
22a
0.7
56a
0.7
59a
0.7
54a
0.7
56a
(0.1
41)
(0.1
40)
(0.1
41)
(0.1
40)
(0.1
41)
(0.1
41)
(0.1
41)
(0.1
41)
Nu
mb
erof
obse
rvat
ion
s30,2
19
30,2
19
30,2
01
30,2
01
30,2
19
30,2
19
30,2
01
30,2
01
Nu
mb
erof
firm
s9,4
35
9,4
35
9,4
34
9,4
34
9,4
35
9,4
35
9,4
34
9,4
34
R-S
qu
ared
0.2
60.2
60.2
60.2
60.2
56
0.2
57
0.2
56
0.2
57
Robust
standard
erro
rscl
ust
ered
at
the
firm
level
inpare
nth
esis
.a,
b,
csi
gnifi
cantl
ydiff
eren
tfr
om
0at
1,
5and
10
per
cent
level
resp
ecti
vel
y.C
apit
al
ism
easu
red
as
the
real
valu
eof
tangib
lefixed
ass
ets.
Lab
our
ism
easu
red
as
the
num
ber
of
emplo
yee
s.F
ore
ignoth
er
ism
easu
red
as
the
tota
lva
lue-
added
from
fore
ign
firm
sori
gin
ati
ng
else
wher
ein
an
indust
ry-p
rovin
cece
ll.
EF
Dis
the
exte
rnal
financi
al
dep
enden
cein
dex
const
ruct
edas
the
share
of
capit
al
exp
endit
ure
snot
finance
dw
ith
cash
flow
sfr
om
op
erati
on
for
the
med
ian
publicl
y-l
iste
dfirm
inea
ch3-d
igit
indust
ryin
the
Unit
edSta
tes
aver
aged
over
the
1980s.
EF
Ddum
my
takes
the
valu
e1
ifan
indust
ryhas
exte
rnal
finance
dep
enden
ceab
ove
the
index
med
ian
(0.2
1)
and
0oth
erw
ise.
33

Table A.9: Clustering of standard errors at different levels of aggregation – interaction regression
Value-added of non state-owned domestic firmsOne-way Two-way
Standard errors clustered at: Firm Industry-province Industry-province(1) (2) (3) (4) (5) (6)
Capital 0.191a 0.191a 0.191a 0.191a 0.191a 0.191a
(0.012) (0.012) (0.012) (0.012) (0.015) (0.015)Labour 0.556a 0.556a 0.556a 0.556a 0.556a 0.556a
(0.019) (0.019) (0.024) (0.024) (0.046) (0.046)
Foreignother 0.043a 0.047a 0.043b 0.047b 0.043a 0.047a
(0.012) (0.012) (0.021) (0.021) (0.015) (0.017)
Foreignother × EFD -0.097a -0.097a -0.097a
(0.025) (0.037) (0.035)
Foreignother × EFD dummy -0.067a -0.067a -0.067a
(0.016) (0.024) (0.026)Constant 0.723a 0.756a 0.723a 0.756a 0.000 0.000
(0.141) (0.141) (0.192) (0.193) (0.000) (0.000)Number of observations 30,219 30,219 30,219 30,219 30,219 30,219Number of clusters 9,435 9,435 419 419R-Squared 0.256 0.256 0.256 0.256 0.256 0.256
a, b , c significantly different from 0 at 1, 5 and 10 percent level respectively. All regressions includefirm and year fixed effects. Two-way clustering at the industry and province level results (columns 5 and6) are estimated using the cgmreg command in Stata. Capital is measured as the real value of tangiblefixed assets. Labour is measured as the number of employees. Foreignother is measured as the totalvalue-added from foreign firms originating elsewhere in an industry-province cell. EFD is the externalfinancial dependence index constructed as the share of capital expenditures not financed with cash flowsfrom operation for the median publicly-listed firm in each 3-digit industry in the United States averagedover the 1980s. EFD dummy takes the value 1 if an industry has external finance dependence above theindex median (0.21) and 0 otherwise.
34

Table A.10: Two-digit sector-specific production function parameters – interaction regression
Value-added of non state-owned domestic firms(1) (2)
Capital -0.073 -0.085(0.101) (0.105)
Labour 0.421a 0.425a
(0.105) (0.101)
Foreignother 0.042a 0.045a
(0.012) (0.012)
Foreignother × EFD -0.100a
(0.026)
FDIother × EFD dummy -0.066a
(0.016)Constant 0.716a 0.749a
(0.138) (0.139)Number of observations 30,219 30,219Number of firms 9,435 9,435R-Squared 0.261 0.262
Robust standard errors clustered at the firm level in parenthesis. a, b , c significantlydifferent from 0 at 1, 5 and 10 percent level respectively. All regressions include 2-digit industry×capital, and 2-digit industry×labour interactions as well as firm andyear fixed effects. Capital is measured as the real value of tangible fixed assets. Labouris measured as the number of employees. Foreignother is measured as the total value-added from foreign firms originating elsewhere in an industry-province cell. EFD is theexternal financial dependence index constructed as the share of capital expendituresnot financed with cash flows from operation for the median publicly-listed firm in each3-digit industry in the United States averaged over the 1980s. EFD dummy takes thevalue 1 if an industry has external finance dependence above the index median (0.21)and 0 otherwise.
35

Table A.11: Using Total Factor Productivity (TFP) as dependent variable
Non state-owned domestic firmsValue-added TFP(1) (2) (3) (4)
Capital 0.191a 0.191a
(0.012) (0.012)Labour 0.556a 0.556a
(0.019) (0.019)
Foreignother 0.043a 0.047a 0.046a 0.049a
(0.012) (0.012) (0.012) (0.012)
Foreignother × EFD -0.097a -0.099a
(0.025) (0.027)
Foreignother × EFD dummy -0.067a -0.067a
(0.016) (0.016)Constant 0.723a 0.756a 2.834a 2.867a
(0.141) (0.141) (0.078) (0.080)Number of observations 30,219 30,219 30,219 30,219Number of firms 9,435 9,435 9,435 9,435R-Squared 0.256 0.256 0.054 0.055
Robust standard errors clustered at the firm level in parenthesis. a, b , c signif-icantly different from 0 at 1, 5 and 10 percent level respectively. All regressionsinclude firm and year fixed effects. Capital is measured as the real value of tangi-ble fixed assets. Labour is measured as the number of employees. Foreignother ismeasured as the total value-added from foreign firms originating elsewhere in anindustry-province cell. EFD is the external financial dependence index constructedas the share of capital expenditures not financed with cash flows from operationfor the median publicly-listed firm in each 3-digit industry in the United Statesaveraged over the 1980s. EFD dummy takes the value 1 if an industry has ex-ternal finance dependence above the index median (0.21) and 0 otherwise. TotalFactor Productivity (TFP) is calculated using the Levinsohn and Petrin (2003)algorithm.
36