credit investor presentation - lagardere.com · 1) group profile and strategy page 5 to 15 2) h1...
TRANSCRIPT

Credit Investor Presentation
October 2012

Certain of the statements contained in this document are not historical facts but rather are statements of future expectations and otherforward-looking statements that are based on management’s beliefs. These statements reflect such views and assumptions as of the dateof the statements and involve known and unknown risks and uncertainties that could cause future results, performance or future events todiffer materially from those expressed or implied in such statements.
When used in this document, words such as “anticipate”, “believe”, “estimate”, “expect”, “may”, “intend”and “plan”are intended to identifyforward-looking statements which address our vision of expected future business and financial performance. Such forward-lookingstatements include, without limitation, projections for improvements in process and operations, revenues and operating margin growth,cash flow, performance, new products and services, current and future markets for products and services and other trend projections aswell as new business opportunities.
These forward-looking statements are based upon a number of assumptions which are subject to uncertainty and trends that may differmaterially from future results, dependingon a variety of factors including without limitation:
-General economic and labour conditions, including in particulareconomic conditions in Europe and North America
-Legal, financial and governmental risks (including, without limitation, certain market risks) related to the businesses
-Certain risks related to the media industry (including, withoutlimitation, technological risks)
-The cyclical nature of some of the businesses.
Please refer to the most recent Reference Document (Document de Référence) filed by Lagardère SCA with the French Autoritédesmarchés financiers for additional information in relation to such factors, risks and uncertainties.
Lagardère SCA disclaims any intention or obligation to update or reviewthe forward-looking statements referred to above. ConsequentlyLagardère SCA is not responsible for any consequences that could resultfrom the use of any of the above statements.
This document should not be distributed in the United States or to U.S. persons as defined in Regulation S of the U.S. Securities Act of1933, as amended.
Disclaimer (1/2)
Credit Investor Presentation – October 2012
2

3
This presentation does not constitute or form a part of any offer or solicitation to purchase or sell securities in the United States or in anyother jurisdiction. Securities may not be offered or sold in the United States absent registration under the Securities Act of 1933, asamended (the “Securities Act”) or an applicable exemption to registration. Nothing contained in this presentation shall form the basis ofany contract or commitment whatsoever. Any decision to purchase or sell securities in the context of a proposed offering, if any, shouldbe made solely on the basis of information contained in the offering memorandum published in relation to such an offering.
This presentation is for the recipient’s use only. This presentation (or any part of it) is not to be reproduced, published, distributed,passed on, or the contents otherwise divulged or disclosed, directly or indirectly, to any other person without the prior written consent ofLagardère SCA. Neither this presentation nor any copy hereof may be sent, taken or distributed in the United States, Canada, Australia orJapan or to any U.S. person (as defined in Regulation S under the Securities Act). This presentation is being provided only to non-U.S.persons and by accepting the delivery of this presentation, the recipient warrants and acknowledges that it falls within the category ofnon-U.S persons. Non-compliance with these restrictions may result in the violation of legal restrictions of the United States or of otherjurisdictions.
Disclaimer (2/2)
Credit Investor Presentation – October 2012

1) Group profile and Strategy page 5 to 15
2) H1 Performance page 16 to 21
3) Summary financials & Financing structure page 22 to 25
4) Key credit highlights page 26 to 28
5) Appendices page 29 to 40
Table of contents
Credit Investor Presentation – October 2012
4

Group profile & Strategy
5

Lagardère Group profile
6
World leader in Travel retail and
duty free4,000 stores mostly
in travel areas
Strong position in press wholesale
distribution
Leader on European soccer
Leader in sports rights in
Asia and the Middle East
Strong Partnership with
main sports international federations: IOC, FIFA, AFC(1),
CAF(2), IAAF(3)
2nd Publisher worldwide
1st Publisher in Europe
1st e-book supplier in
the UK
5th Publisher in the US
1st Magazine publisher
in France
1st TV production group
in France
1st Media group on
internet and mobile internet in France
(1)Asian Football Federation, (2) Confederation of African Football, (3) International Association of Athletics Federations
Credit Investor Presentation – October 2012

2011 key figures
Net sales…………………………………….. € 7,657m
Recurring EBIT bef. Associates...... € 402m
Adjusted net income (2) ……………… € 226m
Net cash generated (3) ………………… € 766m
1998-2011: refocus on media, with a balanced business mix
7
1998 20152011
(1) Negative recurring EBIT in 2011 for Lagardère Unlimited (-€6m)(2) See definitions on slide 38(3) Net cash generated by operating & investing activities
25%Services: - Travel retail- Wholesale
Unlimited (1)
53%
23%Active
Closed
12%Automotive
52%High tech
36%Media
Publishing
Publishing
Services: Travel retail
Unlimited
Active
As % of Recurring EBIT before associates
Minority stakes as of 2011
7.45% in EADS 20% in Canal Plus France
Credit Investor Presentation – October 2012

53%
25%
23%
Financial profile – 2011
8
Net sales by geographic area
Recurring EBIT by divisionNet sales by division
(1) Recurring EBIT - 2011 - Unlimited: -€6m
Credit Investor Presentation – October 2012
6%
27%
19%
48%
7%2%
36%
36%
11%
8%
Services
Unlimited
Publishing
ActiveServices
Publishing
Active
FranceEuropean
Union
USA & Canada
Rest of Europe
Asia-Pacific
Other
Unimited (1)

RESILIENCE: Track record in Lagardère Publishing
9
Resilient revenues and double-digit margin
*Excluding the Stephenie Meyer effect, net sales were resilient in 2011 (down 0.3% on a like-for-like basis).
Net sales Operating margin
€2,130m €2,159m€2,273m
€2,165m€2,038m*
11.2% 11.4%13.2%
11.6% 10.8%
2007 2008 2009 2010 2011
Credit Investor Presentation – October 2012

RESILIENCE: Lagardère Active: transition to
a more resilient profile
10
2007 2008 2009 2010 2011
Circulation of Elle1: +2.7% p.a. vs. -1% for Reference universe2
2. Maintain leadership in France:strong focus on women and news segments
Performance in magazine circulation better than the marketExposure to the advertising market (as % of sales)
57% 57%
53%54%
2007 2008 2009 2010 2011
A portfolio of attractive brands... …with increased presence in the digital market
+5%
+4%
+4%
+3% +0.3%
1. Reduce exposure to advertising
3. Develop and monetize our brands and content in a digital format
43%*
* Excluding PMI and Russian radio, sold in 2011
Acquisition of LeGuide.com (June 2012), the leading online shopping guide on the European market.
1Paid circulation.2Elle reference universe: upmarket weekly women's magazines.
Credit Investor Presentation – October 2012

2008 2009 2010 2011 H1 2012
GROWTH: Digital books in Lagardère Publishing
11
E-book: an opportunity, thanks to a sound business model
1. Relying on e-reader device penetration
2. E-books boom: respectively 27% and 23% of US and UK sales in adult trade in H1 2012
E-book market forecasts – as percentage of trade market sales Lagardère Publishing E-book sales
0.1%
0.7%
2%
6%
% of Total sales
8.4%
Source: AAP (US market) and internal projections
United States United Kingdom
France
0%
10%
20%
30%
40%
50%
2010 2011 2012 2013 2014 2015 2016 2017 2018
0%
10%
20%
30%
40%
50%
2010 2011 2012 2013 2014 2015 2016 2017 2018
Spain
0%
10%
20%
30%
40%
50%
2010 2011 2012 2013 2014 2015 2016 2017 2018
0%
10%
20%
30%
40%
50%
2010 2011 2012 2013 2014 2015 2016 2017 2018
Credit Investor Presentation – October 2012

GROWTH: Travel retail in Lagardère Services
12
2007 2011
2,8 2,9 3,1 3,2 3,4 3,54,3
6,22 2,1 2,2 2,3 2,4 2,5
3,1
4,5
0
2
4
6
8
10
12
2009 2010 2011 2012 2013 2014 2019 2029
International
Domestic
1. Increase in air traffic
Global long-term Passenger Forecast
Pa
ssen
ger
s (b
illio
ns)
+4.2%
CAGR
3. Other drivers
• Consolidation of the market underway but far from being achieved• Good relationship with landlords • A solid portfolio of contracts (long-term concessions) • Size matters: logistics, purchase power, globalization, sophistication…
€506m
€768m+11%
Travel Retail revenue in emerging markets*
2. Expansion on emerging markets
* Data does not include net sales from emerging country passengers travelling in mature countries.
26%of sales
28%of sales
Sources: Eurostat, IATA, ACI, Air4casts, Aeroports.fr
CAGR
Credit Investor Presentation – October 2012

LS Travel Retail strategic objectives
2/3 by organic growth
1/3 through small / medium acquisitions
Favorable mix evolution
Emphasis on accretive M&A
Fixed costs squeezed
LS Travel Retail sales and Ebitda margin evolution – Proportional view* (2011-2016)
Sales growth** Ebitda margin improvement**
+10% per annum
+0.5 pt to +1.0 pt over the period
13
Reach top 5 in each segment (Duty Free &Luxury, Food Service and Travel essentials)
World #2 position
* Including share of JVs with various airports, notably Paris ** These objectives exclude any major disruption in the global economy as well as the hypothesis of transformational acquisitions.
Credit Investor Presentation – October 2012

GROWTH: Global Sports market growth
14
1. Sports market growth (media rights, sponsorship, ticketing) in $bn
2. Our strategy: turnaround the existing assets and expand progressively in
• New sports• New geographies• New businesses, more regular and less capital intensive
+ 3%
+ 6 %
Source : PwC.
CAGR
CAGR
Credit Investor Presentation – October 2012

Travel retail, digital, and sports are clear expansion areas
15
Lagardère businesses mapping
ENHANCE VALUEDIVEST
EXPAND
Gro
wth
Market position
Travel retailDigital
Sports Rights
Distribution
Book
PublishingMagazines, Radio, TV,
TV Production
Credit Investor Presentation – October 2012

H1 Performance
16

(€m)H1
2011H1
2012 Change
Net sales (a) 900 905 +0.5%
Recurring EBIT before associates (b)
71 57 - €14m
Operating margin (b)/(a) 7.9% 6.3% -1.6 pt
Lagardère Publishing: Financial data
H1 2012 highlights
• Net sales -2.4% like-for-like: soft activity trends on allmarkets.
• Decrease in profitability mainly attributable tosluggish market conditions.
• Continued rise of the e-book (8.4% of total netsales) but not sufficient yet to compensate difficultmarket conditions in the US and the UK.
• The outlook for the second half is positive.
17
Education20%
Illustrated books14%
General littérature
39%
Reference4%
Other23%
FY 2011 sales by activity (H1 2012 NS)
France33%
United Kingdom
& Australia20%
United States & Canada
22%
Spain7%
Other18%
H1 2012 sales by geographical area
Credit Investor Presentation – October 2012

(€m)H1
2011
H1 2011
Pro forma* H1 2012
Change
vs. H1 2011 Pro
forma
Net sales (a) 807 460 450 -2.2 %
Recurring EBIT before associates (b)
52 17 31 +€14m
Operating margin (b)/(a)
6.5% 3.7% 7% +3.3 pts
Lagardère Active: Financial data
H1 2012 highlights:
• Net sales -3,7% like-for-like: negative trends in advertising (- 6,9%) and circulation, partially offset by good performances in TV production.
• However, strong increase in profitability mainly thanks to:
‒ good performance in TV Production and TV channels;
‒ tight cost control more than offsets negative trends in advertising and circulation.
18
France92%
International
8%
Press & other61%
TV and TV production
16%
Radio23%
H1 2012 sales by geographical area H1 2012 sales by activity
*Figures pro forma, excluding major assets sold (International Magazine Publishing-PMI and Russian radio).
Credit Investor Presentation – October 2012

(€m)H1
2011H1
2012 Change
Net sales (a) 1,804 1,821 +1.0%
Recurring EBIT before associates (b)
41 37 -€4m
Operating margin (b)/(a)2.3
%2.0% -0.3 pt
Lagardère Services: Financial data
H1 2012 highlights:
• Net sales +2.4% like-for-like: Travel Retail continuesits dynamic trend (+9.1%).
‒ France: +8.4% (Aelia +18.2%);
‒ Eastern Europe: +15.4%;
‒ Asia Pacific: +6.3%.
• Slight dip in profitability due to:
‒ Decline of LS Distribution mostly;
‒ The equity accounting of several activities in a JV withAéroports de Paris.
19
France28%
Belgium13%
Eastern Europe
19%
United States & Canada
6%
Spain10%
Asia & Australia
7%
Other5%
H1 2012 sales by geographical area
Switzerland
12%
44%
Wholesale
Distribution
26%
53%*
28%*
19%*
Integrated
Retail
18%
56%47%*
*% of net sales in H1 2011. / **Source ACI: April 2012 YTD.
H1 2012 sales by activity
Credit Investor Presentation – October 2012

H1 2012 highlights:
• Net sales -5.2% like-for-like:
– Negative calendar effects (World Sport Group: non-occurrence of the Asian Football Cup) ;
– Partially offset by good performance of Sportfive : AfricanNations Cup and German soccer clubs marketing rights.
• Recurring EBIT before associates :
– Includes a -€22m provision loss on IOC* contract (2014and 2016 Olympic games);
– Excluding this provision, recurring EBIT increased thanksto Sportfive performance.
(€m)H1
2011H1
2012 Change
Net sales (a) 213 213 =
Recurring EBIT before associates (b)
4 (13) -€17m
Operating margin (b)/(a)2.0
%- -
Lagardère Unlimited: Financial data
20
Media rights46%
Marketing rights41%
Other13%
H1 2012 sales by activity
Germany21%
United Kingdom
5%
France11%
Rest of Europe
16%
Asia24%
Rest of World23%
H1 2012 sales by geographical area
*% of net sales in H1 2011.
10%*
39%*
51%*
*International Olympic Committee.
NB: gross margin was €155m in H1 2011 and €161m in H1 2012.
Credit Investor Presentation – October 2012

The second half of the year should benefit from a significant improvement inprofitability after a first half performance that cannot be extrapolated to the full year,and which is traditionally weaker in terms of the Group's activity and results.
The recurring media EBIT target is therefore maintained under conditionsindicated on 8 March: excluding the 2 items described below, at constant scope(excluding PMI and the Russian radio activities) and currency, recurring media EBIT
in 2012 should be stable compared to 2011.
The 2 items excluded from the guidance are the following:• The risk provision related to the IOC contract, for which €22m were booked in the first half ;
• The (potentially positive) settlement of the litigation with the Board of Control for Cricket in India.
2 assets for sale: 20% stake in Canal + France and a 7.4% stake in EADS.
Lagardère intends to sell these assets as soon as market and operational conditions are met.
2012 group outlook and guidance
21
Credit Investor Presentation – October 2012

Summary financials &
Financing structure
22

23
*Change in net sales like for like, and change in recurring EBIT at constant exchange rates.**See definition in appendices.*** Decrease of equity mainly due to impairment losses to the Unlimited division and to Canal + France stake
(€m) 2010 2011 ChangeComparable
change*
Net sales 7,966 7,657 -3.9% +0.2%
Recurring Media EBIT** 468 414 -11.4% -11.1%
Consolidated recurring EBIT incl. Non-Media 462 402 -€60m /
Net income – Group share 163 (707) ns /
Adjusted net income – Group share 284 226 -€58m /
Net cash from operating & investing activities 320 766 +€446m /
Net debt 1,772 1,269 -€503m /
Stockholders’ equity 4,018 3,024 -€994m*** /
Gearing 44.1% 42.0% -2.1 pt /
Key figures – Full year
Credit Investor Presentation – October 2012

Reminder: • Canal + France book value : ……………….……… €1.2 bn
• EADS market value (as of 10 October 2012):…… €1.6 bn
Total potential proceeds: …………………….... €2.8 bn
Prudent financial policy focusedon diversification of funding sources
2007 2011
Significant effort at reducingthe level of debt
Bank loanBonds Other
Debt breakdown (excluding Mandatory exchangeable bond)
2007 2011
€1,269m
€2,570 mNet debt down
€1,3bn
25%
58%
17%
67%
27%
6%
Credit Investor Presentation – October 2012
24
Sound financial position: 2007 – 2011 achievements

Liquidity Jun 12-
Jun 13
Jun 13-
Jun 14
Jun 14-
Jun 15
Jun 15-
Jun 16
Jun 16-
Jun 17
Jun 17-
Jun 18
>Jun 18
Bonds Bank debt Other
Proven ability to deleverage from 2010 to 2011• Leverage (net debt/Ebitda) reduced by 0.8 points to reach 2.0x end 2011
• H1 2012 saw an increase in net debt due to seasonal negative Free cash flow
Reasonable gearing at 42% end 2011 with a target level of 50% over the long term
Ample headroom within financial covenants
Strong liquidity position with €1.6bn* available• of which c.€1bn out of the €1.6bn multicurrency syndicated credit loan (maturity of 5 years) signed in January 2011, and gathering 14 banks
A limited exposure to currency or interest rate risk• Interest rate structure**: 45% floating 55% fixed
• Currencies**: mainly in Euro, except €323m (mostly in USD from the syndicated bank loan)
Willingness to continue the diversification of funding sources through issuance of bonds, extend the debt maturity profile and reduce the 2014 redemption
Sound financial position and conservative financial policy
*At end June 2012
**At end December 2011
***Short-term investments and cash.
Preservation of liquidity and balanced debt repayment schedule*
Credit Investor Presentation – October 2012
A significant effort at reducing the levelof debt & leverage
Authorizedcredit lines:
€953m
Treasury***:€620m
€1,573m
€203m€259m
€995m
€867m
€8m €10m €7m
2010 2011
Net debt/
EBITDA*
€1,269m
€1,772 m
2,8x2,0x
31/12/2010 31/12/2011
25

Key credit highlights
26

Leading market positions in Publishing (#2 worldwide publisher) & Services (worldwide leader in Travel Retail)
A diversified, complementary & unique business mix within the media industry
A geographically diversified group with c.2/3 of revenues generated out of France
Resilient base of Lagardère Publishing & low exposure of Lagardère Active to cyclical advertising spend
Growth opportunities in Travel Retail, digital & sports, encompassing Lagardère's four divisions
Sound financial profile with proven ability to deleverage, strong liquidity profile (EUR1.6bn liquidity available), and diversified funding sources
Substantial financial flexibility provided by stakes in EADS & Canal+, and clear willingness to carry out those disposals
Stable management and shareholder base thanks to the legal structure of the company (SCA)
Key credit highlights
27
Credit Investor Presentation – October 2012

Liquidity Jun 12-
Jun 13
Jun 13-
Jun 14
Jun 14-
Jun 15
Jun 15-
Jun 16
Jun 16-
Jun 17
Jun 17-
Jun 18
>Jun 18
Bonds Bank debt Other LM
Liquidity Jun 12-
Jun 13
Jun 13-
Jun 14
Jun 14-
Jun 15
Jun 15-
Jun 16
Jun 16-
Jun 17
Jun 17-
Jun 18
>Jun 18
Bonds Bank debt Other
Offering summary
€1.6bnDebt maturity profile – End June 2012
Debt maturity profile – Pro Forma Liability Management transaction
Authorizedcredit lines
Treasury
Authorizedcredit lines
Treasury
Credit Investor Presentation – October 2012
28
Issuer: Lagardère SCA
Rating: Unrated
Maturity: 5 yr
Size: Benchmark
Format: Fixed rate
Documentation: Stand alone
Cotation: Luxembourg
Denominations: €100k
T&Cs: Standard T&Cs including CoC
Use of proceeds: General corporate purposes and refinancing of the partial tender offer on the 2014 bonds
Roadshow: October: Paris & Germany (15), London & [Netherlands] (16)
Global Coordinators: CA-CIB, HSBC

Appendices
29

Shareholding structure
30
Capital at end July 2012
Number of shares 131 133 286
Number of voting rights 162 080 709
French institutional investors 16.66%
Lagardère Capital & Management 9.3%
Treasury stock2.84%
Employees 1.5%
Retail investors 5.98%
Non-French institutional investors 50.89%
Lagardère Capital & Management 15.04%
Employees2.15%
Retail investors8.38%
French institutional investors 17.58%
Non-French institutional investors 46.47%
Qatar *12.83%
Qatar *10.38%
Share capital at end July 2012 Voting rights at end July 2012
* As stated in the last threshold crossing disclosure on March 19th 2012
Credit Investor Presentation – October 2012
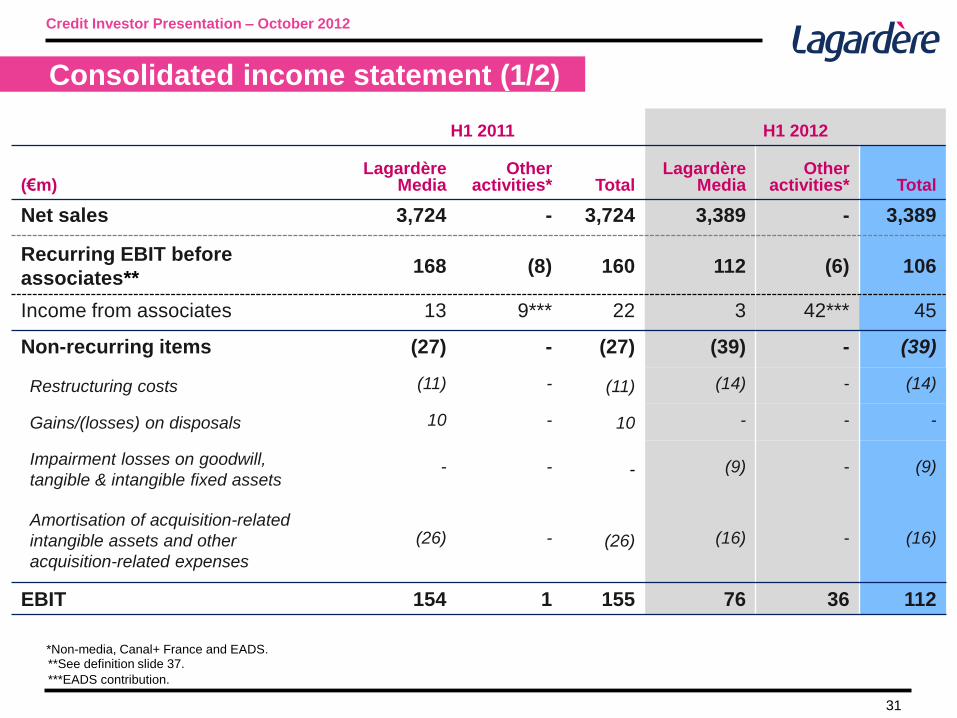
Consolidated income statement (1/2)
31
*Non-media, Canal+ France and EADS.
H1 2011 H1 2012
(€m)Lagardère
MediaOther
activities* TotalLagardère
MediaOther
activities* Total
Net sales 3,724 - 3,724 3,389 - 3,389
Recurring EBIT before
associates**168 (8) 160 112 (6) 106
Income from associates 13 9*** 22 3 42*** 45
Non-recurring items (27) - (27) (39) - (39)
Restructuring costs (11) - (11) (14) - (14)
Gains/(losses) on disposals 10 - 10 - - -
Impairment losses on goodwill,
tangible & intangible fixed assets - - - (9) - (9)
Amortisation of acquisition-related
intangible assets and other
acquisition-related expenses
(26) - (26) (16) - (16)
EBIT 154 1 155 76 36 112
***EADS contribution.
**See definition slide 37.
Credit Investor Presentation – October 2012

Consolidated income statement (2/2)
32
H1 2011 H1 2012
(€m)Lagardère
MediaOther
activities* TotalLagardère
MediaOther
activities* Total
EBIT 154 1 155 76 36 112
Net interest expense (22) (23) (45) (11) (29) (40)
Income before tax 132 (22) 110 65 7 72
Income tax expense (77) 11 (66) (44) 20 (24)
Total net income 55 (11) 44 21 27 48
Attributable to minority interests (16) - (16) (12) - (12)
Net income – Group share 39 (11) 28 9 27 36
*Non-media, Canal+ France and EADS.
Credit Investor Presentation – October 2012

Adjusted net income – Group share
33
*Net of taxes.
(€m) H1 2011 H1 2012
Net income attributable to the Group 28 36
Equity accounted contribution from EADS (9) (42)
Amortisation of acquisition-related intangible assets and other
acquisition-related expenses* 22 13
Impairment losses on goodwill and intangible assets* (1) 10
Restructuring costs* 11 13
Gains (losses) on disposals* 6 -
Adjusted net income excluding EADS 57 30
Credit Investor Presentation – October 2012

Consolidated statement of cash flows
34
(€m) H1 2011 H1 2012
Cash flow from operations before interest, taxes 282 237
Changes in working capital (278) (191)
Cash flow from operations 4 46
Interest paid & received, income taxes paid (62) (44)
Cash generated by/(used in) operating activities (58) 2
Acquisition of property, plant & equipment and intangible assets (121) (103)
Disposal of property, plant & equipment and intangible assets 20 4
Free cash flow (159) (97)
Acquisition of financial assets (54) (107)
Disposal of financial assets 498 16
(Increase)/decrease in short-term investments - 10
Net cash from operating & investing activities 285 (178)
Credit Investor Presentation – October 2012

Consolidated balance sheet
(€m) Dec. 31, 2011 June 30, 2012
Non-current assets (excl. investments in associates) 3,626 3,677
Investments in associates 1,771 1,673
EADS 277 185
Other associates 1,494 1,488
Current assets (other than short-term investments and cash) 2,781 2,858
Short-term investments and cash 737 620
Held-for-sale assets 13 -
TOTAL ASSETS 8,928 8,828
Stockholders’ equity 3,024 2,800
Non-current liabilities (excl. debt) 553 546
Non-current debt 1,843 2,146
Current liabilities (excl. debt) 3,345 3,133
Current liabilities 163 203
Held-for-sale liabilities - -
TOTAL LIABILITIES AND EQUITY 8,928 8,828
35
Credit Investor Presentation – October 2012

Main associates
Balance Sheet Income Statement
(€m)
2011(as of
31/12/2011)
2012(as of
30/06/2012)
2011(as of
30/06/2011)
2012(as of
30/06/2012)
EADS (7.4%) 277 185 9 42
Canal+ France (20%) 1,197 1,197 - -
Marie Claire (42%) 125 125 3 2
Amaury (25%) 99 97 5 -
Other associates 73 69 5 1
TOTAL 1,771 1,673 22 45
Credit Investor Presentation – October 2012
36

Recap of Media performance by division
37
(€m) H1 2012 net sales €m change Change vs H1 2011
Lagardère Publishing 905 +€5m +0.5%
Lagardère Active 450 -€357m -44.2%
Lagardère Services 1,821 +€17m +1.0%
Lagardère Unlimited 213 - -
Total Media 3,389 -€335m -9.0%
Net sales
Recurring Media EBIT before associates
(€m) H1 2012 EBIT €m change Change vs H1 2011
Lagardère Publishing 57 -€14m -19.9%
Lagardère Active 31 -€21m -40.1%
Lagardère Services 37 -€4m -9.0%
Lagardère Unlimited (13) -€17m -
Total Media 112 -€56m -33.4%
Credit Investor Presentation – October 2012

EBITDA
38
(€m) H1 2011 H1 2012 €m change Change vs H1 2011
Lagardère Publishing 83 69 -€14m -16.3%
Lagardère Active 78 30 -€48m -61.3%
Lagardère Services 76 71 -€5m -6.7%
Lagardère Unlimited 59 42 -€17m -29.3%
Total Media 296 212 -€84m -28.4%
Other activities 8 25 +€17m +206.0%
TOTAL 304 237 -€67m -21.8%
Note: see definition slide 37.
Credit Investor Presentation – October 2012

Recurring Media EBIT of consolidated companies is defined as the difference between result before financial charges and tax and the following items of the profit and loss statement:
Contribution of associates
Gains or losses on disposals of assets
Impairment losses on goodwill, property, plant and equipment and intangible assets
Restructuring costs
Items related to business combinations:
• Expenses on acquisitions
• Gains and losses resulting from acquisition price adjustments
• Amortization of acquisition-related intangible assets
EBITDA is defined as: Earnings before interest and tax + Amortization + Impairment losses on goodwill, property, plant and equipment and intangible fixed assets – Positive contribution (+ Negative contribution) of associates + Dividends received from associates.
For the record : definitions of Recurring Media EBIT and EBITDA
Credit Investor Presentation – October 2012
39

Lagardère IR Team
40
Anthony MELLORHead of Investor Relations Tel: 33 1 40 69 18 [email protected]
Sophie BARBOSAInvestor Relations Deputy HeadTel: 33 1 40 69 67 [email protected]
Josefin GUSTAVSENAssistantTel: 33 1 40 69 19 22Fax: 33 1 40 69 22 [email protected]
Address: 4 rue de Presbourg 75116 PARIS FRANCE
Tickers: Bloomberg (MMB FP), Reuters (LAGA.PA)
Credit Investor Presentation – October 2012