credit ratings and the choice of payment method in mergers and
TRANSCRIPT

Credit Ratings and the Choice of Payment Method
in Mergers and Acquisitions
Nikolaos Karampatsas, Dimitris Petmezas and Nickolaos G. Travlos
December 2012
Abstract
This paper establishes that credit ratings affect the choice of payment method in mergers and
acquisitions. We find that bidders holding a credit rating and/or having a higher rating level
are more likely to use cash financing in a takeover. We attribute this finding to the lower
financial constraints and enhanced capability of these firms to access public debt markets as
implied by their higher debt capacity and/or credit quality. Our results are robust to several
firm- and deal- characteristics and are not sensitive to the method used to measure the
probability of payment choice or after controlling for endogeneity bias.
JEL Classification: G14; G24; G32; G34
Keywords: Credit Rating, Method of Payment, Mergers and Acquisitions
*Nikolaos Karampatsas is from Surrey Business School, University of Surrey, UK, E-mail:
[email protected]. Dimitris Petmezas is from Surrey Business School, University of Surrey, UK, E-
mail: [email protected]. Nickolaos G. Travlos is from ALBA Graduate Business School at The
American College of Greece, E-mail: [email protected]. We would like to thank Nihat Aktas, Yakov
Amihud, Panagiotis Avramidis, Helen Bollaert, Jean Gabriel Cousin, Ettore Croci, Eric De Bodt, Andrey
Golubov, Michel Levasseur, John Martin, Andrew Mason, Armin Schwienbacher and seminar participants at the
European Centre for Corporate Control Studies-SKEMA Business School for helpful comments and
suggestions. Karampatsas acknowledges financial support received from Surrey Business School. Travlos
acknowledges financial support received from the Kitty Kyriacopoulos Chair in Finance. All remaining errors
are our own.

1
Credit Ratings and the Choice of Payment Method in Mergers and
Acquisitions
Credit Rating Agencies (CRAs) play an important role in the finance world by
assessing the creditworthiness of a particular firm, security or obligation (Securities and
Exchange Commision (2003)) and assigning a rating. CRAs disclose and disseminate this
information (Healy and Palepu (2001)) to the market, alleviating information asymmetry and,
consequently, lowering firm’s cost of capital. Additionally, prior studies provide evidence on
how firm’s capability to access public debt markets, implied either by the existence of firm
credit rating (Faulkender and Petersen (2006) and Lemmon and Zender (2010)) or rating
level (Denis and Mihov (2003)), can influence capital structure decisions. In this respect,
Kisgen (2006, 2009) shows that firms often target either specific rating levels or seek to
maintain a certain threshold (for instance, investment grade); in particular, in order to secure
the rating, firms change their capital structure decisions by issuing equity, buying back debt
or through assets sales and dividend cuts.
In turn, the capital structure decision has been proved to be of great importance in the
corporate financing decision of merger and acquisition (M&As) investments. Bidding firms
conduct M&As with the use of either cash or stock as the sole consideration in the
transaction, while some transactions employ a mixture of cash and stock means of payment.1
A growing body of prior M&A studies has provided evidence that cash-financed acquisitions
are to a great extent funded by debt (see, e.g., Bharadwaj and Shivdasani (2003); Faccio and
Masulis (2005), Harford, Klasa and Walcott (2009) and Uysal (2011)). Additionally, in the
literature relating investment decisions with financial constraints, Fazzari, Hubbard, Petersen,
Blinder and Poterba (1988) argue that information asymmetry influences firm investment
1 The use of cash as a method of payment in corporate takeovers was prevalent during the 80’s, it was decreased
during the 90’s, and it became popular again over the first decade of the new century (Andrade, Mitchell and
Stafford (2001), Martynova and Renneboog (2008)).

2
decisions because it creates financial constraints in the credit markets. Along these lines,
Whited (1992), Gilchrist and Himmelberg (1995) and Almeida, Campello and Weisbach
(2004) use credit ratings as a measure of firm financial constraints in the credit markets, and
suggest that the existence of credit ratings reduces information asymmetry about firm value,
thus lowering financial constraints. This allows firms with rated public debt to issue funds in
a short notice and according to their investment needs. The above discussion raises two
interesting questions with regards to the relationship between bidders’ credit ratings, as
implied by their capability to access public debt markets, and the choice of method of
payment. Does the existence of bidding firms’ credit ratings affect the financing decision in
M&As? What is the effect of rating level on acquisitions means of exchange?
Motivated by the low financial constraints of (highly) rated firms due to their relatively
higher debt capacity (credit quality), we address these questions and examine the role of
credit ratings in the choice of payment method in mergers and acquisitions. With regards to
debt capacity, numerous prior studies (see, e.g., Cantillo and Wright (2000), Bolton and
Freixas (2000), Faulkender and Petersen (2006) and Lemmon and Zender (2010) use credit
rating existence as measure of debt capacity. There are two main explanations suggested for
the relationship between debt capacity and credit ratings: 1) the demand and supply factors of
debt capacity,2 and 2) the pecking order theory. By arguing that debt capacity is driven by
demand and supply factors, these studies demonstrate that firms with credit ratings have
relatively more tangible assets and fewer growth opportunities (demand side), and lower
levels of information asymmetry and less external frictions of debt in the form of credit
rationing and reorganization costs (supply side), thus being more leveraged (Cantillo and
Wright (2000) and Faulkender and Petersen (2006)). In particular, Faulkender and Petersen
2 On the demand side, firms with stable cash flows, higher proportions of fixed assets and low growth
opportunities have higher debt capacity and therefore higher demand for debt financing (Myers (1977)). On the
supply side, asymmetric information between firm management and investors (Stiglitz and Weiss (1981)), and
debt market frictions (Faulkender and Petersen (2006)) can impede firms’ ability to issue more debt, mainly due
to credit rationing from the lenders and imperfect access to public debt markets.

3
(2006) empirically show that firms with credit ratings are, in general, more leveraged; more
specifically, they use 35% more debt in their capital structure implying relatively higher debt
capacity. Secondly, Lemmon and Zender (2010) document that in the group of firms holding
a credit rating, the pecking order theory of capital structure is a good first-order description of
their financing behavior. That is, firms prefer to use internally generated cash; nevertheless,
when it comes to the decision of debt versus equity, financially unconstrained firms choose
firstly debt and lastly equity. Specifically, they face favorable borrowing costs up to the point
where they do not exceed their debt capacity and therefore the use of extra debt does not
constitute a burden in their value (Myers (1977)).
With respect to credit quality, Liu and Malatesta (2005) and Frank and Goyal (2009)
argue that the higher the level of credit ratings, the lower the information asymmetry and the
adverse selection problem faced by firms. Additionally, evidence from studies that examine
the effect of credit rating levels on bond yield spreads (West (1973), Liu and Thakor (1984),
Ederington, Yawitz and Roberts (1987), Ziebart and Reiter (1992) and Chen, Lesmond and
Wei (2007)) demonstrates a strong negative relationship. This implies that firms with better
credit quality face a lower cost of debt and can, therefore, borrow relatively more. Finally,
several regulations of financial institutions and other intermediaries are directly tied to credit
ratings issued by “Nationally Recognized Statistical Rating Organizations” (NRSROs)
(Kisgen (2007)). In particular, a large number of institutional investors are barred from
investing in low credit rating firms or below a certain threshold (investment grade) due to
concerns related with investors’ wealth protection. Thus, firms with high levels of credit
ratings overcome these regulatory constraints and face a wider “investor base” when seeking
to borrow funds in order to finance specific investment projects. Putting all together, firms of
better credit quality are able to borrow more, since they face higher demand and lower
financing cost for their debt securities.

4
In this study, we use a sample of US acquisitions of publicly traded bidders over the
period 1998-2009 in order to explore our main hypotheses which are summarized as follows:
1) bidders holding a credit rating (i.e. with higher debt capacity) have better access to the
public debt markets. We contend that this lack of financial constraints makes them less
reluctant to spend their cash now as it will be relatively easier for them to borrow “fresh
cash” in the future whenever needed. Note that cash used in M&A transactions may be
sourced either from past operations or from additional debt; the source of accumulated cash is
beyond the scope of this paper. The point we wish to make here is that, irrespective of the
source of cash, rated bidders are more inclined to make use of it due to their ease of access to
the credit markets in the future; 2) bidders with a higher credit rating level (i.e., having better
credit quality) also face relatively better opportunities to borrow due to lower cost and higher
demand for their debt securities. This analysis leads to our testable hypotheses that the
likelihood of a cash offer or the fraction of deal that is paid off with cash versus equity should
be higher for 1) rated bidding firms and 2) bidders with higher credit rating level.
Nevertheless, the prior literature, which examined the determinants of the method of
payment in acquisitions, finds that this choice is driven either by other variables used to
proxy for debt capacity (Faccio and Masulis (2005), Harford et al. (2009) and Uysal (2011)),
or other factors such as growth opportunities (Martin (1996)), the need to reduce information
asymmetry about the bidder or the target (Hansen (1987), Eckbo, Giammarino and Heinkel
(1990) and Chemmanur, Paeglis and Simonyan (2009)), corporate control issues (Amihud,
Lev and Travlos (1990), Martin (1996), Ghosh and Ruland (1998) and Faccio and Masulis
(2005)), considerations regarding the potential competition for the target (Fishman (1989)
and Berkovitch and Narayanan (1990)), agency costs of free cash flow (Jensen (1986)),
market timing (Shleifer and Vishny (2003) and Rhodes-Kropf and Viswanathan (2004)),
target status and diversification effects (Faccio and Masulis (2005)) and the mode of

5
acquisition (Martin (1996)). Thus, we are exploring if and when our hypotheses still hold
true, after taking into consideration the effects of all the above factors. In our tests we control
for these determinants by including the variables suggested in prior studies.
We use different econometric methodologies to measure the probability of the choice of
payment method and find strong support to our conjectures. In particular, we document that:
1) the likelihood of all cash, or percentage of cash used as payment method in the takeover
bid, is positively associated with bidder credit rating existence and is statistically significant,
at least, at the 5% level; 2) the likelihood of all cash, or percentage of cash used in the
acquisition bid, has also a strong positive relationship with bidding firm credit rating level; 3)
unused debt capacity also appears to be a determinant of cash financing in M&As
corroborating the view that credit ratings reflect debt capacity enabling to predict the
payment method in acquisitions; 4) the credit ratings existence variable that constitutes one of
our main variables of interest in our study is endogenously determined, and our results
continue to hold and be statistically significant at the 1% level, even after taking into account
of the self-selection bias.
This study has several contributions in the M&As, capital structure and credit ratings
literature. First, it adds to the existing literature on the determinants of method of payment,
and particularly the association between firm’s debt capacity as well as credit quality and the
use of cash or stock financing in acquisitions. Second, it employs both rating existence and
rating level as measures of firm’s capability to access public debt markets. Third, it provides
further evidence regarding the relation between credit ratings and firm’s capital structure
decisions; in particular, the financing decision in takeover bids. In general, our results imply
that credit ratings mitigate information asymmetry, and consequently they reduce bidding
firms’ cost of capital; firms holding a (high) rating face lower financial constraints and can
issue public debt for investment reasons with relatively less frictions. Our findings also

6
provide further direct implications for academics and practitioners. In particular, bidding
firms with access to public debt markets are able to make cash acquisitions and, therefore, rip
the benefits related to that form of payment. More specifically, prior literature shows that
bidders using cash currency enjoy non-negative abnormal shareholder returns in acquisitions
of public targets (Travlos (1987), Brown and Ryngaert (1991), Moeller, Schlingemann and
Stulz (2004) and Schlingemann (2004)), and positive abnormal shareholder returns in
acquisitions of private targets (Chang (1998), Moeller et al. (2004) and Officer, Poulsen and
Stegemoller (2009)). Moreover, there is empirical evidence that the use of cash meets low
target managerial resistance and deters competition from rival bidders during takeover
contests (Fishman (1989), Jennings and Mazzeo (1993), Betton, Eckbo and Thorburn (2009)
and Chemmanur et al. (2009)).
This study is related with a number of previous works. For instance, studies that
examine the determinants of the method of payment choice, such as Hansen (1987), Eckbo et
al. (1990), Fishman (1989), Berkovitch and Narayanan (1990), Jensen (1986), Amihud et al.
(1990), Martin (1996), Shleifer and Vishny (2003), Rhodes-Kropf and Viswanathan (2004),
Faccio and Masulis (2005), Chemmanur et al. (2009), Harford et al. (2009) and Uysal (2011)
find that various factors influence the decision between cash and stock exchange in
acquisitions. However, Faccio and Masulis (2005), Harford et al. (2009) and Uysal (2011),
who study particularly the impact of firm’s debt capacity on the cash-stock choice are more
directly related to our work. Faccio and Masulis (2005) use bidder’s leverage, collateral and
interlocking directorships, whereas Harford et al. (2009) and Uysal (2011) use the deviation
from bidder’s target debt ratios as a measure of debt capacity. We, instead, use credit ratings
as a measure of debt capacity. More recently, Alshwer, Sibilkov and Zaiats (2011) study the
relationship between financial constraints and the choice of payment method in M&As. Our
study focuses particularly on the direct effects of credit ratings on the M&A financing

7
method using several credit rating variables in the empirical analysis. Faulkender and
Petersen (2006), Lemmon and Zender (2010) and Kisgen (2006, 2009) examine the effect of
credit ratings on firms’ capital structure. In this work, we study the effect of credit ratings on
firms’ financing decision – that is, in turn, related with their capital structure – in the context
of M&As.
The remainder of the paper is organized as follows. Section I documents the related
literature on the determinants of the choice of method of payment in M&As presenting also
the variables used in the analysis. Section II describes our sample. Section III analyzes the
methodology and findings of our empirical tests. We present further robustness checks of our
results in Section IV. Finally, Section V concludes the paper.
I. Related Literature on the Determinants of the Method of Payment
Choice
A. Debt Capacity, Financial Condition, Market Credit Risk and Method of Payment
Apart from our main measure of debt capacity (rating existence), we also consider
variables which are known from the previous literature to be related with debt capacity.
Following Faccio and Masulis (2005), we use the variable Collateral, which is the ratio of
property, plant and equipment (PPE) to book value of total assets at the year-end prior to the
acquisition announcement. Hovakimian, Opler and Titman (2001) report a strong positive
effect of tangible assets to firm’s level of debt. The bidder’s size is another variable of
relevance in our tests, as larger firms are more diversified and, hence, they have lower
probabilities of default, enabling them to issue more debt. To account for this effect, we use
the variable Size, which is the natural logarithm of the market value of equity 4 weeks prior to
the acquisition announcement. Furthermore, we include bidder’s financial leverage to control

8
for its financial condition. The variable Leverage is measured by the ratio of firm’s total
financial debt (long-term debt plus debt in current liabilities) to the book value of total assets
in the fiscal year prior to the acquisition announcement. The predicted sign of this variable is
ambiguous as Faccio and Masulis (2005) find a negative association between leverage and
the likelihood of cash, while Harford et al. (2009) report a positive relation. Finally, in order
to capture the effect of market credit conditions, we follow Harford (2005) and use the
variable Interest Rate Spread, which is the spread between the average rate on commercial
and industrial loans and the Federal Funds rate. This variable is provided by the Federal
Reserve Senior Loan Officer (SLO) survey, and proxies for the ease of financing (in
whatever form) or credit constraints in the economy.3 We expect that when the spread is low,
and therefore firms face relatively lower cost of debt capital, the likelihood of cash
acquisition should be higher. Therefore, we predict a negative relationship between interest
rate spread and the likelihood of cash deals.
B. Growth Opportunities, Market Timing and Method of Payment
The investment opportunities theory posits that a relation between acquirer valuation
and the mode of acquisition exists, as long as firms with more growth opportunities avoid
underinvestment problems caused by high levels of debt finance; in response to that, they
prefer to use stock (Martin (1996) and Jung, Kim and Stulz (1996)). To proxy for growth
opportunities we use bidder’s book to market ratio and we expect a positive relation with the
likelihood of a cash consideration. The variable Book-to-Market is measured as the book
value of equity at the fiscal year-end prior to the acquisition announcement divided by the
market value of equity 4 weeks prior to the acquisition announcement.
3 We also use in our empirical analysis additional proxies of market credit conditions; these are the yield spread
between BBB-AAA bonds (Longstaff (2004)), and the corporate yield spread (Duffee (1998)). The bond data
for the construction of the latter (i.e., corporate yield spread) were collected from TRACE database, and start
from 2002. Our general results are qualitatively similar.

9
Furthermore, according to the market overvaluation theory (Shleifer and Vishny (2003)
and Rhodes-Kropf and Viswanathan (2004)), acquirers favor stock acquisitions when their
equity is relatively overvalued to target firms’ equity in order to decrease acquisition costs.
Alshwer et al. (2011) use book-to-market as a proxy of overvaluation. Additionally, Faccio
and Masulis (2005) use Run-Up to measure bidder overvaluation. Run-Up is calculated as the
bidder market-adjusted buy-and-hold returns over the period (-205, -6) days prior to the
acquisition announcement.
C. Asymmetric Information and Method of Payment
According to Hansen (1987), bidders have higher incentives to finance an acquisition
with stock when there is high information asymmetry about target value. Moreover, this
asymmetry is likely to increase, as the size of the target rises relative to the bidder, mainly
because in larger deals the risks of overpayment and dilution of the dominant shareholders
control are greater. To control for information asymmetry, we follow Faccio and Masulis
(2005) and employ the variable Relative Size, which is estimated as the value of the
transaction divided by bidder market value of equity 4 weeks prior to the acquisition
announcement.
Consistent with Faccio and Masulis (2005) and Harford et al. (2009), we also take into
account the target status. This is justified on the grounds that information asymmetry rises
when the target is a small, more opaque private firm. Furthermore, in deals where an unlisted
target is involved, the seller’s consumption/liquidity needs have to be considered. These
sellers are likely to prefer cash due to the illiquid and concentrated nature of their portfolio
holdings in an attempt to cash out timely their wealth opportunities. Thus, we use the Private
variable, which is an indicator variable taking the value of 1 for an unlisted target and 0
otherwise.

10
D. Firm Control, Monitoring and Method of Payment
In the spirit of Stulz (1988) and Jung et al. (1996), the likelihood of losing control in
their firm leads managers to prefer debt or internal resources relative to equity when deciding
to finance an acquisition; this is due to the fact that the issuance of new stock is likely to
dilute their stake in the bidding firm leading to a loss of control and outside intervention.
Thus, managers with higher ownership stakes in the bidding firm are more likely to use cash
as a payment form in takeover bids (Amihud et al. (1990), Martin (1996), Ghosh and Ruland
(1998) and Faccio and Masulis (2005)).
Furthermore, Shleifer and Vishny (1997) and Burkart, Gromb and Panunzi (1997)
argue that blockholders can monitor the action of corporate managers helping align the
interests of managers and shareholders and leading to better corporate performance. Among
others, one of the major actions that large investors can take to improve corporate
performance is to advise and put pressure on bidder’s managers to proceed to a potential bid
or abandon it. These actions include judgments about the terms of the acquisition bids such as
the choice of the payment method. Given the empirical evidence on the wealth effects of
stock-financed public acquisitions, which demonstrates a significant reduction of bidder’s
shareholders wealth (Travlos (1987), Brown and Ryngaert (1991) and Schlingemann (2004)),
the likelihood of pure stock takeover deals should be lower when blockholdings are higher.
To capture these effects, we use the variable Blockholder Ownership, which is a measure of
the aggregate holdings of blockholders who own at least 5% of the firm’s stock.
E. Pecking Order, Free Cash Flow and Method of Payment
Myers (1984), in his pecking order theory, suggests that managers follow a financing
hierarchy; that is, they use firstly internal finance, then debt, and finally external equity
financing. Moreover, Jensen (1986) states that firms with large amounts of free cash flow are

11
likely to conduct value destroying acquisitions with cash. In particular, firms with large
amounts of cash, cash flow or sufficient amount of debt capacity are more likely to use cash
to finance their various investment projects. To control for this effect, we use the Cash Flows
to Equity variable, which represents the income before extraordinary items plus depreciation
minus dividends on common and preferred stock divided by the number of shares outstanding
times the closing stock price at the fiscal year-end immediately prior to the acquisition
announcement. We expect a positive association between this variable and the likelihood of a
cash acquisition.
F. Hostility, Competition, Mode of Acquisition, Intra-Industry Deals and Method of
Payment
In addition, the characteristics of a takeover deal might have an influence on the
payment method. In hostile acquisitions, or in cases where more than one acquirers bid for a
particular target, the bidder might want to consummate the deal relatively quickly and deter
competition (Fishman (1989) and Berkovitch and Narayanan (1990)), thus, choosing cash as
medium of exchange. Therefore, we use the Hostile Deals, which is an indicator variable
taking the value of 1 for hostile acquisitions and 0 otherwise. We also include the variable
Number of Bidders to proxy for the competition the bidder faces during a takeover; this is
measured by the number of acquirers who bid for the target.
Further, in tender offers when the bidder incumbent management desires to close the
deal earlier, cash is also preferred. That is because tender offers with stock must be made in
accordance with the Securities Act of 1933, which entails a substantial delay, mainly because
the registration statement must be reviewed by the SEC (Martin (1996)). Tender Offers is a
dummy variable taking the value of 1 for acquisitions labeled as tender offers and 0
otherwise.

12
Finally, we control for the industry diversification effect. Faccio and Masulis (2005)
argue that in unrelated industries in which sellers are not well acquainted with the industry
risks and prospects of the bidder’s business sector, they should be relatively more reluctant to
accept stock as a method of payment, primarily because of bidder’s overvaluation risk. In this
case, sellers are likely to prefer cash in order to mitigate the overvaluation problem. To
capture this effect, we use the Diversifying Deals variable, which is a dummy variable taking
the value of 1 for inter-industry transactions, and 0 for intra-industry transactions. Industries
are defined at the 2-digit SIC level from the Thomson Financial SDC.
II. Sample and Data
A. Sample Selection Criteria
We download a sample of US domestic acquisitions announced over the period January
1, 1998 and December 31, 2009 from the Thomson Financial SDC Mergers and Acquisitions
Database. The start date of the sample was driven by the availability of data for all variables
used in the empirical analysis. The sample consists of both successful and unsuccessful deals.
We require deals to have non-missing transaction value and payment method information.
Bidders are listed firms and targets are either listed or private firms. The original sample
includes 13,048 deals. We remove from the sample all deals classified as repurchases,
liquidations, restructurings, divestitures, leveraged buyouts, reverse takeovers, privatizations,
bankruptcy acquisitions and going private transactions. This reduces the sample to 10,828
observations. Furthermore, to include in the sample deals that represent a transfer of control,
we require that the bidder owns less than 10% of target shares before the announcement and
seeks to acquire more than 50% after the acquisition. There are 10,166 transactions that meet
these criteria. Further, we drop deals worth less than 1 US$ million and less than 1% of

13
bidder market value to avoid noise in the analysis. There are 6,819 deals that satisfy the
above requirements.
Credit rating information for the bidder is collected from COMPUSTAT. Credit ratings
represent the Standard & Poor’s (S&P) long-term domestic issuer credit ratings. In our
sample, the highest level of bidder one month prior to the acquisition announcement is AAA
and the lowest is CCC. Out of the 6,819 transactions, 1,747 transactions involve bidders with
a credit rating and 5,072 transactions with unrated firms. The main variables of interest are i)
the Rating Existence, which proxies for bidders’ debt capacity, and it is an indicator taking
the value of 1 if a bidding firm has a credit rating one month prior to the acquisition
announcement, and 0 otherwise;4 and ii) the Rating Level, which ranges from 1 to 22 and
proxies for bidders’ credit quality.5,6
B. Sample Statistics
Table I presents descriptive statistics for the overall sample and by the three payment
methods (i.e., 100% cash, 100% stock, combination of both). For the continuous variables, F-
statistic is computed to examine if the mean values of different bidder and deal characteristics
are equal across the three financing methods. In the case of the categorical variables, χ2-
statistic is used to test for the difference among the three payment methods.
Table I shows that for the entire sample of 6,819 acquisitions, 1,974 targets are
acquired with 100% cash, in 2,793 deals there is a mix of cash and stock, and 2,052
acquisitions comprise 100% stock means of transaction. Panel A demonstrates bidder specific
characteristics, which are found to differ across the three payment types. The proportion of
4 As an alternative measure of debt capacity we use an indicator variable taking the value of 1 if a bidding firm
has an investment-grade rating (above BBB-) one month prior the acquisition announcement and 0 when the
bidding firm has a speculative grade rating (below BBB-) or no rating at all. All our main results remain
unchanged. 5 A higher rating level corresponds to a larger number.
6 In the robustness checks section (V.A.), we also proxy for bidders’ credit quality by using a dummy variable of
investment-grade firms (those with a credit rating BBB- or above).
14
bidders holding a credit rating (Rating Existence) is higher in cash financed deals (31.0%)
than the other two payment forms, while bidders in stock acquisitions have the lowest one
(22.8%). This finding is a first indication in support of our hypothesis regarding debt
capacity. Average bidder Size for pure cash deals has an intermediate level (4,361.893 US$
million), whereas the average bidder size for pure stock deals is the largest (5,930.680 US$
million). Bidders in cash deals have a higher level of Leverage (0.191) relative to bidders in
stock deals that have the lowest level (0.155). Moreover, bidders in cash acquisitions exhibit
a higher level of Collateral (0.364), than bidders in stock deals (0.307). Furthermore, bidders
Book-to-Market ratio is significantly higher in cash-financed acquisitions (0.519), than in
stock acquisitions (0.418), which is consistent with the growth opportunities story. Bidders
Run-Up is significantly lower in cash deals (-0.010) relative to stock financed acquisitions
(0.272). The figures from the Book-to-Market and Run-Up variables support the
overvaluation theory. Regarding bidders’ Blockholder Ownership, in cash acquisitions they
have relatively more concentrated ownership (23.33%), while in stock deals they are the most
widely diffused (15.71%). This finding is in line with the corporate control hypothesis. Cash
Flows to Equity is significantly higher in cash acquisitions (0.048), than in stock acquisitions
(-0.051), in support of the free cash flow hypothesis.
Panel B presents the statistics for deal specific characteristics, which, again, appear to
be quite different across the three financing categories. The Interest Rate Spread is
significantly higher in cash-financed acquisitions (2.200), than in stock acquisitions (2.052).
Furthermore, the average size of the target relative to the bidder (Relative Size) is lower for
cash deals (18.6%), than the relative size of pure stock deals (29.0%). Consistent with our
previous analysis, the likelihood of a bidder and a target being in the same industry is higher
for stock deals as the percentage of diversifying deals is lowest in that group (32.51%), while
cash deals have a higher proportion of diversifying deals (37.54%). The statistics for the
15
Hostile deals support the mode of acquisition hypothesis as the percentage of hostile
acquisitions is higher in pure cash deals (2.53%) than in pure stock acquisitions (0.78%).
Moreover, Tender Offers are dominated being financed entirely with cash (9.78%); only
0.98% of Tender Offers are financed with stock. In cash deals the percentage of acquisitions
of private targets accounts for 69.55% of the overall sample, while in stock deals it accounts
for 51.17%. Finally, the Number of Bidders is not statistically different between the three
payment forms.
[Please Insert Table I About Here]
Table II presents the descriptive statistics by rated and unrated bidders. The statistics
from this table will shed further light on the relation between the method of payment and
credit ratings. Panel A presents bidder characteristics. Rated bidders are, on average, larger
(12,920.240 US$ million) than unrated ones (1,508.230 US$ million). Regarding their
leverage, rated bidders have considerably higher levels of leverage (0.306) relative to unrated
bidders (0.137); in percentage, this equals with over 100% difference in leverage between the
rated and unrated bidders. This provides some preliminary evidence of rated firms’ capability
to have relatively better access to public debt markets. With regards to bidders’ collateral,
there is, again, a large difference between the rated (0.477) and unrated (0.305) groups, which
lends support to our hypothesis that rated bidders exhibit higher debt capacity than their
counterparts. Examining bidders’ book-to-market, we are able to find a statistical difference,
as rated bidders have higher growth opportunities (0.427) than unrated ones (0.504).
Additionally, the statistics for the run-up show that the rated group experiences lower pre-
acquisition run-up (0.02) than the unrated group (0.150). This corroborates the overvaluation
hypothesis, since the unrated bidders are more overvalued and they are likely to prefer the use
of stock instead of cash to take advantage of their relative overvaluation. The average
blockholder ownership is lower for the rated bidders (18.435) relative to the unrated ones

16
(22.956). As for cash holdings, rated bidders exhibit tremendously higher levels (2,272.457
US$ million) relative to the unrated ones (149.318 US$ million).
With respect to deal characteristics, a finding that is worth mentioning is the difference
in the relative size of the deal for rated and unrated bidders. The median value of the rated
group is 0.086 and is significantly lower than the unrated group (0.111). This has three main
implications. First, a deal can be valued very high, so raising large amounts of cash gets more
difficult for unrated bidders. Second, the likelihood of unrated bidders to pay with cash
decreases as the target size increases and the risk of overpayment is relatively greater. Third,
in the case that unrated bidders decide to finance an acquisition with cash, they will have to
borrow more than rated bidders relative to their size and, consequently, the magnitude of the
change in the leverage will be greater and more volatile. Further, in the rated group the
percentage of cash that is used as method of payment is greater (50.641) than the unrated
group (45.741). With respect to hostile acquisitions and tender offers, rated bidders execute
more deals of these types compared to unrated ones. Finally, we find that rated bidders are
involved in less private deals than unrated ones.
[Please Insert Table II About Here]
Table III presents the descriptive statistics of the number of deals and method of
payment by each credit rating level. Regarding the percentage of cash that is used in the deal,
we are able to discern a specific pattern; that is, the majority of cash is used in the lower
credit quality firms, and especially those with speculative grade (below BBB-).7 This,
apparently, contradicts our hypothesis that highly rated firms should have higher likelihood
of using cash as a method of payment. Moreover, when we look at the percentage of stock
that is used in acquisitions, we find a relatively monotonic increase of stock payment method
in higher credit rating levels, except in the case of CCC rated firms, in which the use of stock
7 In unreported analysis, we conduct a t-test for the difference in means of the percentage paid in cash between
the investment and speculative grade groups, and we find that the difference is significant at the 1% level.

17
financing is the highest.8 However, the observed patterns for both cash and stock financing
can be explained by the degree of bidder overvaluation. Specifically, there is an
approximately monotonic decrease in the book-to-market for higher rated bidding firms,
which means that firms of high credit quality are more overvalued than their counterparts;
therefore, it is more likely to use stock as a method of payment in order to time the market
and use their expensive stock for the consummation of the deal. In particular, the speculative
grade firms are on average less overvalued than the investment grade firms, and this can, at
least partially, explain their higher use of cash.
[Please Insert Table III About Here]
From the analysis so far, we have noticed that, for instance, the mere relative size and
overvaluation effects do play a significant role in our interpretations of the relationship
between credit ratings and the choice of method of payment; hence, in order to establish a
more concrete statistical relationship and uncover the net effects of the credit ratings
variables, we present, in the next section, a multivariate analysis in the context of different
regression equations. The correlation matrix of the above variables is presented in Table IV.
Our main variables of interest - Rating Existence and Rating Level - do not exhibit high
correlation with the control variables. This should moderate econometric difficulties (such as
multicollinearity concerns) in disentangling any effects of the credit rating variables on the
choice of the payment method in takeover deals.
[Please Insert Table IV About Here]
8 The higher use of stock can be justified by considering their limited ability to issue debt. It is likely that these
firms, being very close to financial distress, find it difficult to issue additional debt and opt for stock-swap
transaction as the only possible solution. Note, however, that this finding should be treated with caution as there
are only 2 observations with CCC level.

18
III. Empirical Analysis
A. Tobit Regressions
In order to investigate the payment form of acquisitions, we use as dependent variable
the fraction of cash as part of the total price offered by the bidder. Since by definition this
variable lies in the interval [0, 100], we use a two-boundary Tobit estimator. Thus, we apply a
general model of the form:
, (1)
where ui is an independently distributed error term assumed to be normal with zero mean and
variance σ2. The dependent variable is censored from both the left and the right side so that:
{
(2)
where 0 and 100 are the censoring points as in Faccio and Masulis (2005). The parameters β
and σ are estimated using the maximum likelihood method (ML).
A.1. Method of Payment and Credit Ratings Existence
We first examine the relation between bidder credit ratings existence and method of
payment by controlling for various bidder-, and deal-specific characteristics. All regressions
also control for year fixed effects whose coefficients are suppressed. Additionally, we use
heteroskedasticity-robust standard errors adjusted also for bidder clustering due to the
presence of repeated acquirers in our sample. Table V presents the results, in which our main
variable of interest is the Rating Existence. Specification (1) also includes bidder Size. We
find that the coefficient on rating existence is positive and statistically significant at the 1%
significance level. Bidder size has a negative association with the cash consideration in

19
contrast to our hypothesis for debt capacity.9 In specification (2) we add other bidder- and
deal-specific characteristics. In line with our prediction we find that rating existence still
exhibits a positive relation with the cash consideration at the 5% significance level.
Furthermore, in our regression we are able to confirm the results from the past literature as
we find that most of our control variables have a significant relationship with the cash
consideration. More specifically, independent variables that capture firm’s financial
condition, such as Leverage and Collateral carry positive and significant coefficients. Book-
to-Market is consistent with the growth opportunities theory and is positively related with the
use of cash. Additionally, we are able to confirm the market timing hypothesis, since we find
that Run-Up is negatively associated with cash method of payment. That is firms with high
pre-acquisition valuations are less likely to use cash in the transaction. Further, we find that
the higher the concentration of ownership the more likely the use of cash consideration, as
Blockholder Ownership holds a positive and statistically significant coefficient at the 5%
significance level. The free cash flow hypothesis is also supported by our results, as Cash
Flows to Equity carries a positive and significant coefficient at the 1% significance level.
With respect to the information asymmetry about the target, we corroborate the past literature
and find that the Relative Size is negatively related with the use of cash in M&As, while the
target Private status is positively associated with cash financing. Lastly, we document that
the mode of acquisition plays a role in the choice of payment method during a takeover deal;
in particular, in Diversifying, Hostile and Tender Offer deals, cash is more likely to be the
financing choice.10
9 Our results should not be affected by any potential multicollinearity, given the large sample size with sufficient
variation in our explanatory variables. We still perform a multicollinearity (VIF) test for all specifications
throughout the paper and find that correlation between explanatory variables does not have any material effect
on our estimates. 10
In a separate analysis (not reported but available upon request), we investigate whether the effect of our main
variables, Rating Existence and Rating Level (see below) on the choice of method of payment is driven by
considerations related with market credit risk. Ideally we would use an interaction of Rating Existence and
Rating Level with a market credit risk proxy. However, this exercise is infeasible due to multicollinearity found
in VIF test. Therefore, we divide the sample in high and low credit risk groups and conduct a Chow test for the

20
A.2. Method of Payment and Credit Rating Levels
In the previous section we have documented that the relation between the existence of
credit ratings and the use of cash as a method of payment is positive and is attributed to the
fact that firms with credit ratings have higher debt capacity. In this section, we try to shed
light on our second hypothesis: how is credit quality related with the method of payment in
M&As? For that reason, we use the Rating Level as our main independent variable. Table V
(Specifications (3) and (4)) presents the results for this analysis. First, in specification (3) we
also add bidder size. Our variable of interest has a positive and significant coefficient at the
1% significance level. Bidder size exhibits a negative relationship with the use of cash. In
specification (4) we also control for other bidder- and deal-specific characteristics in our
sample. Consistent with our prediction, the higher the credit rating level, the higher the
likelihood of a cash acquisition. From the remaining control variables, size, book-to-market,
run-up, cash flows to equity, relative size, diversifying, hostile, tender offers and private
acquisitions carry significant coefficients at conventional levels, with signs consistent to the
prior M&A literature.
[Please Insert Table V About Here]
B. Probit Regressions
In this section we try to distinguish the qualitative nature of the choice of the medium
of payment by using Probit estimations. In this respect, our dependent variable takes the
value of 0 for all stock deals and 1 for mixed and all cash deals, as in Alshwer et al. (2011).
Table VI presents the results for the Probit regressions.11
difference in coefficients between these groups. The market credit risk is captured by the Interest Rate Spread,
the yield spread between BBB-AAA bonds, and the corporate yield spread variables. Specifically, we find that
the effect of Rating Existence is more pronounced in the high risk groups, whereas in the case of Rating Level
the difference is statistically insignificant at conventional levels. 11
A benefit of a Probit estimation is that it allows us to focus on the qualitative decision to finance with cash,
stock or a mixture of the two. In many mixed deals the acquirer does not always specify the actual percentage of
21
B.1. Method of Payment and Credit Ratings Existence
As in the analysis above we examine the relation between credit ratings existence and
the likelihood of using cash as the consideration in M&As. Our main variable of interest is
the Rating Existence and the control variables are the same as in the analysis so far. In
specifications (1) and (2) we observe that firms holding a credit rating are more likely to
finance the acquisition with cash or mixed form of consideration. The result appears to be
strong as in both specifications the rating existence dummy is statistically significant at the
1% and 5% level, respectively.
B.2. Method of Payment and Credit Rating Levels
Next we test the relation between credit rating levels and the likelihood of using cash as
the method of payment in M&As. Our main variable of interest is the Rating Level and the
control variables are as above. In specification (3), which adds only bidder size as control
variable, the rating level is significant at the 1% significance level, and in specification (4)
which comprises the full model, the rating level is also positive and significant at the 1%
significance level. That is, the higher the credit rating the more likely bidders to incorporate
cash in a takeover deal. 12
[Please Insert Table VI About Here]
cash financing, as target shareholders are offered with a choice of cash or stock financing. Thus, the decision is
more accurately specified as choosing among cash, stock or a mixture. In that respect, an Ordered Probit
regression is preferred, in which the dependent variable is 0 for pure stock deals, 1 for mixed deals, and 2 for all
cash deals as in Faccio and Masulis (2005). We have also run the analysis by using Ordered Probit and our
results are qualitatively similar for both rating existence and rating level. 12
We also put as dependent variable the value of 0 for all cash deals and 1 for mixed and all stock deals and find
the opposite result. In particular, the dependent variable experiences a negative relationship with both rating
existence and rating level, implying that stock method of payment is a decreasing function of rating existence
and rating level.

22
C. Unused Debt Capacity and Method of Payment
Myers and Majluf (1984) propose a specific financial rationale for M&As based on the
complementary fit between different levels of debt capacity of bidders and targets. Bruner
(1988) concentrates particularly in the case in which target firms with increased growth
opportunities face capital constraints regarding the financing of their investment
opportunities; the author suggests that it pays always a bidder with higher debt capacity and
lower growth opportunities to acquire a capital constrained target, since the higher debt
capacity of the combined firm will help the firm to put forward all the positive NPV projects
that the constrained firm might pass up. Hence, we argue that considerations of unused debt
capacity between the merging firms can influence the likelihood of using cash as a method of
payment; this is mainly due to the fact that the unused debt capacity in one of the two
merging parties will lead bidders to use cash for the consummation of the deal, since any
increase in leverage associated with cash payments will be absorbed by the unused debt
capacity of the combined firm.
To measure this effect, we propose the ΒRating/TRating variable, which is the ratio of
the bidder credit rating to target firm credit rating and measures the difference in debt
capacity between the two merging participants. Furthermore, we follow Bruner (1988) and
create an interaction variable between ΒRating/TRating and Relative Size of the deal. This
can be justified on the grounds that the impact of the unused debt capacity of the merging
firms on the choice of cash method of payment should decrease for large transaction values,
since it is more difficult to raise large amounts of cash as the size of the deal increases to very
high levels.
Table VII presents the results for this analysis, which runs Tobit regressions where the
dependent variable is the proportion of cash used in the acquisition. We notice that the
number of observations is reduced significantly due to the requirement that target firms

23
should hold a credit rating, which leaves private deals out of this analysis. In specification (1)
we also add bidder size. The coefficient on ΒRating/TRating carries a positive and significant
coefficient at the 1% significance level. In specification (2) we also add the control variables
used in the previous analysis. We find that the coefficient on ΒRating/TRating still carries a
positive and significant coefficient at the 5% significance level. This means that the unused
debt capacity has a positive relation with the proportion of cash used in the deal. Finally, in
specification (3) we also add the interaction variable ΒRating/TRating x Relative Size. The
coefficient on ΒRating/TRating still carries a positive and significant coefficient at the 1%
significance level. However, as expected, with regards to the coefficient on the interaction
variable, a negative and significant coefficient at the 5% significance level is obtained. This
suggests that the incremental effect of unused debt capacity on the proportion of cash
financing decreases as the relative size of the deal increases. Overall, the results imply that
the existence of unused debt capacity constitutes a determinant of the use of cash as a method
of payment in M&As lending further support to the relationship of credit ratings with the
choice of acquisition financing.
[Please Insert Table VII About Here]
IV. Further Robustness Tests
In the previous analysis, we have provided evidence that firms with higher debt
capacity (holding a credit rating) and credit quality (holding a higher credit rating) are more
likely to use pure cash or a proportion of cash when they finance an acquisition. In this
section, we offer additional auxiliary tests to check the validity of our findings.

24
A. Investment-Grade Vs Speculative-Grade Firms
In order to shed further light in the relation between credit ratings and the choice of
payment method in M&As, we investigate, for robustness reasons, the impact of investment
grade credit ratings. Investment-grade firms are the ones rated with BBB- or above as in An
and Chan (2008). These firms are, in general, of higher quality relative to the speculative-
grade firms (i.e. those with a credit rating below BBB-). In this respect, Chen et al. (2007)
demonstrate that investment grade firms generate lower bond yield spreads relative to the
speculative grade ones. Furthermore, due to the absence of regulation restrictions regarding
allocations in securities of investment grade firms (Kisgen (2007)), these firms enjoy a larger
clientele base and a higher demand for their debt securities. If investment grade firms face
lower cost of debt capital and have a wider access to investors, then it is plausible that they
are able to borrow more, and use cash more frequently as a method of payment in a takeover
deal. Thus, we create the variable Investment Grade dummy taking the value of 1 for firms
rated BBB- and above, and 0 otherwise. Table VIII reports the results.
In specification (1) the dependent variable is the percentage of cash as part of the total
price offered by the bidder; and in specification (2) the dependent variable is the choice
between all stock or mixed and all cash consideration. In all specifications we also
incorporate the control variables employed in previous analysis. The coefficient of the
investment grade carries a positive and significant coefficient at the 1% significance level in
all specifications. These results add further support to our hypothesis that firms with high
credit quality are more likely to use cash financing in M&As.
[Please Insert Table VIII About Here]

25
B. Endogeneity Control
In our analysis we treated the credit rating variables as exogenous to our model; that is
the decision to obtain a credit rating, and the level of credit ratings are randomly allocated
across our sample firms. However, Liu and Malatesta (2005) and An and Chan (2008) argue
that firms determine, at least partially, whether to obtain a credit rating or have a higher rating
level after considering the benefits against the potential costs. Therefore, it is likely that the
decision to obtain a (high) credit rating is based on firm specific characteristics and failure to
account for that would lead to biased estimates in our regressions. To test this hypothesis, we
use an Instrumental Variables two-stage method, with the Rating Existence choice equation
(Probit) being the reduced form, and the method of payment equations (Tobit and Probit)
being the structural form.
In order to determine the probability of a bidder holding a credit rating or having a high
rating, we follow Denis and Mihov (2003), Liu and Malatesta (2005), and Faulkender and
Petersen (2006) and use variables that have been proposed to account for these effects.
Specifically, it has been suggested that a firm is more likely to obtain a credit rating or to
have a high rating if it is older, well known, it operates in an industry where the competitors
have also credit ratings, it is more profitable, and it has a higher credit quality. Hence, we
use: the period in which the bidder firm is covered in the CRSP database before the
acquisition announcement as a proxy for bidder age; a dummy variable equals to 1 when the
firm stock is traded on the NYSE and 0 otherwise as a proxy for firm visibility; the log of 1
plus the percentage of firms with credit ratings on the same 3-digit SIC-level as a proxy of
firm’s probability to obtain a credit rating when the competitors already hold one; the ratio of
bidder earnings before interest, taxes, depreciation and amortization to total assets as a proxy
for the bidder profitability; and bidder Altman (1968) Z-score as a proxy for bidder credit
quality.

26
Table IX presents the results of this analysis for all different methodologies we have
used so far (i.e., Tobit and Probit). In both structural equations (2) and (3), our main variable
of interest is positively related with the dependent variables at the 1% level of significance.
For sensitivity reasons, in the lower part of Table IX we present the Durbin-Wu-Hausman
(DWH) augmented regression test of endogeneity, which tests for the significance in the
correlation of the errors between the reduced and normal equations. From this analysis we
observe that the errors in all models are correlated and are significant at the 1% level of
significance, a result that further leads us to reject the null hypothesis of no endogeneity for
the variable Rating Existence. Furthermore, it is worth noting that after considering the
potential determinants of holding a credit rating, the coefficients in both models are
substantially higher than in the ordinary case; this constitutes further evidence that the Rating
Existence is endogenously determined, and that our previous results were biased downwards
due to a self-selection bias.
[Please Insert Table IX About Here]
With regards to the correction for endogeneity in the case of the continuous variable
Rating Level, we apply an Instrumental Variables two-stage method, with the Rating Level
choice equation (OLS) being the reduced form, and the method of payment equations (Tobit,
and Probit) being the structural form. Table X shows the results for this analysis. In both
structural equations (2) and (3), our main variable of interest is positively related with the
dependent variables at the 1% level of significance. However, in the lower part of Table X,
the DWH test for endogeneity does not reject the null hypothesis of no endogeneity of the
main variable of interest in both models (2) and (3). Therefore, since we are not able to
identify the existence of endogeneity bias for the rating level in these regressions, we can
base our inferences in the results of Table V. In any case, the results support our hypothesis

27
regarding the positive relation of rating level with the likelihood of using cash as a method of
payment in acquisitions.
[Please Insert Table X About Here]
V. Conclusion
In this paper we present a direct empirical analysis of the relation between credit ratings
and the choice of method of payment in M&As. In particular, we examine how rating
existence and rating level affect the likelihood of cash being used as consideration in a
takeover bid. In our empirical analysis, we use different econometric approaches to examine
this relationship, and we are able to confirm our hypotheses establishing a positive relation
between bidders’ credit ratings and cash payment method. Specifically, both rating existence
and rating level are positively associated to the choice of cash in M&A deals. The results are
attributed to the lower financial constraints of firms with a (high) credit rating, as implied by
their higher debt capacity (credit quality). Our investment grade results also confirm the
findings on rating level analysis corroborating the view that cash method of payment is an
increasing function of credit quality. Further, unused debt capacity appears to determine
positively the choice of using cash method of payment lending further support to the
relationship of credit ratings with the choice of payment method. Moreover, our results are
robust even after controlling for endogeneity issues regarding the main variables of interest.
Additionally, in response to the questions raised in the introduction, the findings of this
paper imply that higher capability to access public debt markets affects the choice of method
of payment in M&As. In particular, higher debt capacity favored by the existence of credit
ratings allows rated bidding firms to be less reluctant to use cash in an acquisition investment
as it is less painful for them to find cash for new investments in the future. Further, high

28
credit quality offers more opportunities for bidders to raise debt in order to finance a cash
acquisition given the lower cost and higher demand for their debt securities.
This study adds to the prior literature, by providing further evidence on how credit
ratings affect firm capital structure decisions in general, and financing decisions in the M&As
process more specifically. In particular, we establish a direct relationship of credit ratings as a
determinant of the choice of payment method. The positive likelihood of using cash as a
method of payment in acquisitions in which firms have high debt capacity and/or credit
quality can be considered as a high value asset for bidders’ shareholders, given the well-
documented fact that cash consideration is related with various beneficial outcomes for
bidders’ shareholders, such as favorable valuation effects and determent of competition in the
market for corporate control. Overall, this paper highlights the role of CRAs in firm’s capital
structure decisions related particularly with the financing decision in takeover bids.

29
REFERENCES
Almeida, Heitor, Murillo Campello, and Michael S. Weisbach, 2004, The Cash Flow
Sensitivity of Cash, Journal of Finance 59, 1777-1804.
Alshwer, Abdullah A., Valeriy Sibilkov, and Nataliya Zaiats, 2011, Financial Constraints and
the Method of Payment in Mergers and Acquisitions, Working Paper (University of
Wisconsin, Simmons College).
Altman, Edward I., 1968, Financial Ratios, Discriminant Analysis and the Prediction of
Corporate Bankruptcy, Journal of Finance 23, 589-609.
Amihud, Yakov, Baruch Lev, and Nickolaos G. Travlos, 1990, Corporate Control and the
Choice of Investment Financing: The Case of Corporate Acquisitions, Journal of
Finance 45, 603-616.
An, Heng, and Kam C. Chan, 2008, Credit ratings and IPO pricing, Journal of Corporate
Finance 14, 584-595.
Andrade, Gregor, Mark Mitchell, and Erik Stafford, 2001, New Evidence and Perspectives on
Mergers, Journal of Economic Perspectives 15, 103-120.
Berkovitch, Elazar, and MP Narayanan, 1990, Competition and the medium of exchange in
takeovers, Review of Financial Studies 3, 153-174.
Betton, Sandra, B. Espen Eckbo, and Karin S. Thorburn, 2009, Merger negotiations and the
toehold puzzle, Journal of Financial Economics 91, 158-178.
Bharadwaj, Anu, and Anil Shivdasani, 2003, Valuation effects of bank financing in
acquisitions, Journal of Financial Economics 67, 113-148.
Bolton, Patrick, and Xavier Freixas, 2000, Equity, Bonds, and Bank Debt: Capital Structure
and Financial Market Equilibrium under Asymmetric Information, Journal of
Political Economy 108, 324-351.
Brown, David T., and Michael D. Ryngaert, 1991, The Mode of Acquisition in Takeovers:
Taxes and Asymmetric Information, Journal of Finance 46, 653-669.
Bruner, Robert F., 1988, The Use of Excess Cash and Debt Capacity as a Motive for Merger,
Journal of Financial and Quantitative Analysis 23, 199-217.
Burkart, Mike, Denis Gromb, and Fausto Panunzi, 1997, Large Shareholders, Monitoring,
and the Value of the Firm, Quarterly Journal of Economics 112, 693-728.
Cantillo, Miguel, and Julian Wright, 2000, How do firms choose their lenders? An empirical
investigation, Review of Financial Studies 13, 155-189.
30
Chang, Saeyoung, 1998, Takeovers of Privately Held Targets, Methods of Payment, and
Bidder Returns, Journal of Finance 53, 773-784.
Chemmanur, Thomas J., Imants Paeglis, and Karen Simonyan, 2009, The medium of
exchange in acquisitions: Does the private information of both acquirer and target
matter?, Journal of Corporate Finance 15, 523-542.
Chen, Long, David A. Lesmond, and Jason Wei, 2007, Corporate Yield Spreads and Bond
Liquidity, Journal of Finance 62, 119-149.
Denis, David J., and Vassil T. Mihov, 2003, The choice among bank debt, non-bank private
debt, and public debt: evidence from new corporate borrowings, Journal of Financial
Economics 70, 3-28.
Duffee, Gregory R., 1998, The Relation between Treasury Yields and Corporate Bond Yield
Spreads, Journal of Finance 53, 2225-2241.
Eckbo, B. Espen, Ronald M. Giammarino, and Robert L. Heinkel, 1990, Asymmetric
information and the medium of exchange in takeovers: theory and tests, Review of
Financial Studies 3, 651-675.
Ederington, Louis H., Jess B. Yawitz, and Brian E. Roberts, 1987, The Informational Content
of Bond Ratings, Journal of Financial Research 10, 211.
Faccio, Mara, and Ronald W. Masulis, 2005, The Choice of Payment Method in European
Mergers and Acquisitions, Journal of Finance 60, 1345-1388.
Faulkender, Michael, and Mitchell A. Petersen, 2006, Does the Source of Capital Affect
Capital Structure?, Review of Financial Studies 19, 45-79.
Fazzari, Steven M., R. Glenn Hubbard, Bruce C. Petersen, Alan S. Blinder, and James M.
Poterba, 1988, Financing Constraints and Corporate Investment, Brookings Papers on
Economic Activity 1988, 141-206.
Fishman, Michael J., 1989, Preemptive Bidding and the Role of the Medium of Exchange in
Acquisitions, Journal of Finance 44, 41-57.
Frank, Murray Z., and Vidhan K. Goyal, 2009, Capital Structure Decisions: Which Factors
Are Reliably Important?, Financial Management 38, 1-37.
Ghosh, Aloke, and William Ruland, 1998, Managerial Ownership, the Method of Payment
for Acquisitions, and Executive Job Retention, Journal of Finance 53, 785-798.
Gilchrist, Simon, and Charles P. Himmelberg, 1995, Evidence on the role of cash flow for
investment, Journal of Monetary Economics 36, 541-572.
Hansen, Robert G., 1987, A Theory for the Choice of Exchange Medium in Mergers and
Acquisitions, Journal of Business 60, 75-95.

31
Harford, Jarrad, 2005, What drives merger waves?, Journal of Financial Economics 77, 529-
560.
Harford, Jarrad, Sandy Klasa, and Nathan Walcott, 2009, Do firms have leverage targets?
Evidence from acquisitions, Journal of Financial Economics 93, 1-14.
Healy, Paul M., and Krishna G. Palepu, 2001, Information asymmetry, corporate disclosure,
and the capital markets: A review of the empirical disclosure literature, Journal of
Accounting and Economics 31, 405-440.
Hovakimian, Armen, Tim Opler, and Sheridan Titman, 2001, The Debt-Equity Choice,
Journal of Financial and Quantitative Analysis 36, 1-24.
Jennings, Robert H., and Michael A. Mazzeo, 1993, Competing Bids, Target Management
Resistance, and the Structure of Takeover Bids, Review of Financial Studies 6, 883-
909.
Jensen, Michael C., 1986, Agency Costs of Free Cash Flow, Corporate Finance, and
Takeovers, American Economic Review 76, 323-329.
Jung, Kooyul, Yong-Cheol Kim, and René M. Stulz, 1996, Timing, investment opportunities,
managerial discretion, and the security issue decision, Journal of Financial
Economics 42, 159-186.
Kisgen, Darren J., 2006, Credit Ratings and Capital Structure, Journal of Finance 61, 1035-
1072.
Kisgen, Darren J., 2007, The Influence of Credit Ratings on Corporate Capital Structure
Decisions, Journal of Applied Corporate Finance 19, 65-73.
Kisgen, Darren J., 2009, Do Firms Target Credit Ratings or Leverage Levels?, Journal of
Financial and Quantitative Analysis 44, 1323-1344.
Lemmon, Michael L., and Jaime F. Zender, 2010, Debt Capacity and Tests of Capital
Structure Theories, Journal of Financial and Quantitative Analysis 45, 1161-1187.
Liu, Pu, and Anjan V. Thakor, 1984, Interest Yields, Credit Ratings, and Economic
Characteristics of State Bonds: An Empirical Analysis: Note, Journal of Money,
Credit and Banking 16, 344-351.
Liu, Yang, and Paul H. Malatesta, 2005, Credit Ratings and the pricing of Seasoned Equity
Offerings, Working paper (University of Washington).
Longstaff, Francis A., 2004, The Flight to Liquidity Premium in U.S. Treasury Bond Prices,
Journal of Business 77, 511-526.
Martin, Kenneth J., 1996, The Method of Payment in Corporate Acquisitions, Investment
Opportunities, and Management Ownership, Journal of Finance 51, 1227-1246.

32
Martynova, Marina, and Luc Renneboog, 2008, A century of corporate takeovers: What have
we learned and where do we stand?, Journal of Banking & Finance 32, 2148-2177.
Moeller, Sara B., Frederik P. Schlingemann, and René M. Stulz, 2004, Firm size and the
gains from acquisitions, Journal of Financial Economics 73, 201-228.
Myers, Stewart C., 1977, Determinants of Corporate Borrowing, Journal of Financial
Economics 5, 147-175.
Myers, Stewart C., 1984, The Capital Structure Puzzle, Journal of Finance 39, 575-592.
Myers, Stewart C., and Nicholas S. Majluf, 1984, Corporate financing and investment
decisions when firms have information that investors do not have, Journal of
Financial Economics 13, 187-221.
Officer, Micah S., Annette B. Poulsen, and Mike Stegemoller, 2009, Target-firm information
asymmetry and acquirer returns, Review of Finance 13, 467-493.
Rhodes-Kropf, Matthew, and S. Viswanathan, 2004, Market Valuation and Merger Waves,
Journal of Finance 59, 2685-2718.
Schlingemann, Frederik P., 2004, Financing decisions and bidder gains, Journal of Corporate
Finance 10, 683-701.
Securities and Exchange Commision, 2003, Report on the role and function of credit rating
agencies in the operation of the securities markets.
Shleifer, Andrei, and Robert W. Vishny, 1997, A Survey of Corporate Governance, Journal
of Finance 52, 737-783.
Shleifer, Andrei, and Robert W. Vishny, 2003, Stock market driven acquisitions, Journal of
Financial Economics 70, 295-311.
Stiglitz, Joseph E., and Andrew Weiss, 1981, Credit Rationing in Markets with Imperfect
Information, American Economic Review 71, 393-410.
Stulz, René M., 1988, Managerial control of voting rights: Financing policies and the market
for corporate control, Journal of Financial Economics 20, 25-54.
Travlos, Nickolaos G., 1987, Corporate Takeover Bids, Methods of Payment, and Bidding
Firms' Stock Returns, Journal of Finance 42, 943-963.
Uysal, Vahap B., 2011, Deviation from the target capital structure and acquisition choices,
Journal of Financial Economics 102, 602-620.
West, Richard R., 1973, Bond Ratings, Bond Yields and Financial Regulation: Some
Findings, Journal of Law and Economics 16, 159-168.
Whited, Toni M., 1992, Debt, Liquidity Constraints, and Corporate Investment: Evidence
from Panel Data, Journal of Finance 47, 1425-1460.

33
Ziebart, David A., and Sara A. Reiter, 1992, Bond ratings, bond yields and financial
information, Contemporary Accounting Research 9, 252-282.

34
Appendix A. Variable Definitions
Variable Definition
Panel A: Measures of Payment Form
Percentage of Cash Fraction of cash as part of the total price offered by the bidder to the target
shareholders from Thomson Financial SDC.
Cash and Mixed/Stock Dummy variable: 1 for mixed and all cash deals, 0 for all stock deals from
Thomson Financial SDC.
Panel B: Credit Rating Variable
Rating Existence Dummy variable: 1 for rated bidders, 0 for unrated bidders.
Rating Level Continuous variable for rated bidders: 1 to 22, AAA level takes 22 and D
takes 1.
Investment Grade Dummy variable: 1 for investment grade bidders (above BBB- threshold),
0 for speculative grade bidders (below BBB- threshold).
ΒRating/TRating The ratio of bidder credit rating level to target credit rating level.
Panel C: Bidder Characteristics
Size Firm market value of equity 4 weeks prior to the acquisition announcement
from CRSP in US$ million.
Leverage Firm total financial debt (long-term debt plus debt in current liabilities)
divided by the book value of total assets in the fiscal year prior to the
acquisition announcement from COMPUSTAT.
Collateral The ratio of firm’s property, plant and equipment to total assets at the fiscal
year immediately prior to the acquisition announcement from COMPUSTAT.
Book-to-Market (B/M) Book value of equity at the fiscal year-end prior to the acquisition
announcement divided by the market value of equity 4 weeks prior to the
acquisition announcement. Book value of equity is from COMPUSTAT,
market value of equity is from CRSP.
Run-Up Market-adjusted buy-and-hold returns of the firm over the period starting (-
205, -6) days prior to the acquisition announcement from CRSP.
Blockholder Ownership Aggregate holdings of blockholders who own at least 5% of the company’s
stock from Thomson One.
Cash Flows to Equity Income before extraordinary items plus depreciation minus dividends on
common and preferred stock divided by the number of shares outstanding
times the closing stock price at the fiscal year-end immediately prior to the
announcement from COMPUSTAT.
Panel D: Deal Characteristics
Interest Rate Spread The spread on the interest rate charged for all industrial and commercial loans
over intended federal funds rate. The spread is from the Survey of Terms of
Business Lending published by the Federal Reserve Bank of New York in its
E2 release.

35
Relative Size The ratio of the target’s market value to bidder’s market value of equity 4
weeks prior to the acquisition announcement from CRSP in US$ million.
Diversifying Deals Dummy variable: 1 for inter-industry transactions, 0 for intra-industry
transactions. Industries are defined at the 2-digit SIC level from Thomson
Financial SDC.
Hostile Deals Dummy variable: 1 for deals defined as "hostile" or "unsolicited" by
Thomson Financial SDC, 0 otherwise.
Tender Offers Dummy variable: 1 for tender offers from Thomson Financial SDC, 0
otherwise.
Private Dummy variable: 1 for private targets from Thomson Financial SDC, 0
otherwise.
Number of Bidders Number of bidders during the takeover deal from Thomson Financial SDC.
Panel E: Instrumental Variables
Age Dummy variable: 1 if the firm was at least five-year old before the takeover
announcement, 0 otherwise. Firm age is based on the period the firm is
covered on CRSP.
Firm Trades on NYSE Dummy variable: 1 if the firm stock was trading on the NYSE before the
takeover announcement, 0 otherwise. Exchange codes are from CRSP.
IndFrac Log of 1 plus the fraction of firms in the same 3-digit SIC level that have
credit ratings from COMPUSTAT.
Profitability The ratio of earnings before interest, taxes, depreciation and amortization
(EBITDA) to total assets from COMPUSTAT.
Altman-Z It is calculated from the formula Z = 6.56 (Working Capital/Total Assets) +
3.26 (Retained Earnings/Total Assets) + 6.72 (EBIT/Total Assets) + 1.05
(Book Value of Equity/Book Value of Total Liabilities).

36
Τable I
Sample Descriptive Statistics by Payment Method
The table presents descriptive statistics for a sample of US public acquisitions announced over the period between January 1, 1998 and December 31, 2009 drawn from the Thomson
Financial SDC Mergers and Acquisitions Database. The sample is further classified by the method of payment used in the transaction. The financing category “Cash” includes
payments made solely in cash. The financing category “Mixed” includes payments consisting of both cash and stock. The financing category “Stock” includes payments made solely
in common stock. Panels A and B describe the mean and median values for bidder-, and deal-specific characteristics, respectively. Credit ratings represent the Standard & Poor’s
(S&P) long-term domestic issuer credit ratings from COMPUSTAT. All variables are defined in Appendix A. The F-statistic tests the null hypothesis of no difference between the
mean values when the method of payment is cash, mixed and stock. The χ2-
statistic tests the null hypothesis of no difference between the mean values when the method of payment
is cash, mixed and stock for the categorical variables in our sample.
Method of Payment
Total Sample (N=6,819) Cash (N=1,974) Mixed (N=2,793) Stock (N=2,052) Test Statistics (p-value)
Variable Mean Median Mean Median Mean Median Mean Median
Panel A: Bidder Characteristics
% Rating Existence 25.620 - 31.003 - 23.917 - 22.758 - χ2 = 24.628 (0.000)
Size 4,431.941 491.321 4,361.893 620.342 3,380.333 368.792 5,930.680 588.082 F = 10.26 (0.000)
Leverage 0.182 0.133 0.191 0.153 0.194 0.144 0.155 0.105 F = 25.90 (0.000)
Collateral 0.351 0.241 0.364 0.256 0.367 0.247 0.307 0.205 F = 15.45 (0.000)
Book-to-Market 0.484 0.377 0.519 0.415 0.507 0.405 0.418 0.302 F = 16.60 (0.000)
Run-Up 0.114 -0.050 -0.010 -0.073 0.091 -0.066 0.272 -0.002 F = 42.14 (0.000)
% Blockholder Ownership 21.731 17.190 23.331 23.310 22.477 18.030 15.711 8.700 F = 115.77 (0.000)
Cash Flows to Equity 0.003 0.047 0.048 0.059 0.008 0.050 -0.051 0.030 F = 26.05 (0.000)
Panel B: Deal Characteristics
Interest Rate Spread 2.137 2.09 2.200 2.170 2.157 2.100 2.052 2.050 F = 123.59 (0.000)
Relative Size 0.283 0.105 0.186 0.066 0.347 0.139 0.290 0.114 F = 18.44 (0.000)
% Diversifying Deals 36.090 - 37.538 - 37.701 - 32.505 - χ2 = 11.328 (0.004)
% Hostile Deals 1.466 - 2.533 - 1.217 - 0.780 - χ2 = 1.015 (0.602)
% Tender Offers 4.561 - 9.778 - 3.509 - 0.975 - χ2 = 24.956 (0.000)
% Private 64.482 - 69.554 - 70.677 - 51.170 - χ2 = 156.462 (0.000)
Number of Bidders 1.028 1 1.033 1 1.030 1 1.021 1 F = 1.96 (0.141)

37
Τable II
Sample Descriptive Statistics by Credit Ratings
The table presents descriptive statistics for a sample of US public and private acquisitions announced over the period between January 1, 1998 and December 31, 2009 drawn
from the Thomson Financial SDC Mergers and Acquisitions Database. Panels A and B describe the mean, median and number of observations for bidder- and deal-specific
characteristics, respectively, for credit rated and unrated bidders. Credit ratings represent the Standard & Poor’s (S&P) long-term domestic issuer credit ratings from
COMPUSTAT. Stock price data is from CRSP, accounting data is from COMPUSTAT. All variables are defined in Appendix A. Statistical tests for differences in means and
equality of medians for each characteristic of rated versus unrated bidders are also presented in parentheses.
With Credit Rating (1) Without Credit Rating (2) Difference (1)-(2)
Panel A: Bidder Characteristics
Mean Median N
Mean Median N
(p-value)
Mean
(p-value)
Median Size 12,920.240 3,092.009 1,747 1,508.230 296.317 5,072 (0.000) (0.000) Leverage 0.306 0.273 1,718 0.137 0.072 4,782 (0.000) (0.000) Collateral 0.477 0.346 1,436 0.305 0.210 3,930 (0.000) (0.000) Book-to-Market 0.427 0.360 1,725 0.504 0.386 4,798 (0.000) (0.001) Run-Up 0.018 -0.038 1,707 0.150 -0.054 4.566 (0.000) (0.840) % Blockholder Ownership 18.435 13.880 1,563 22.956 18.705 4,206 (0.000) (0.000) Cash Flows to Equity 0.060 0.062 1,681 -0.018 0.041 4,722 (0.000) (0.000) Panel B: Deal Characteristics
Interest Rate Spread 2.137 2.090 1,747 2.138 2.090 5,072 (0.906) (0.735) Relative Size 0.275 0.086 1,747 0.286 0.111 5,072 (0.665) (0.000) Percentage of Cash 50.641 50.540 1,747 45.741 42.355 5,072 (0.000) (0.000) % Diversifying Deals 36.463 - 1,747 35.962 - 5,072 (0.707) - % Hostile Deals 3.034 - 1,747 0.927 - 5,072 (0.000) - % Tender Offers 9.788 - 1,747 2.760 - 5,072 (0.000) - % Private 41.442 - 1,747 72.417 - 5,072 (0.000) - Number of Bidders 1.057 1 1,747 1.018 1 5,072 (0.000) -

38
Table III
Percentage of Cash/Stock and Bidder Book-to-Market by Credit Rating Level
Credit ratings are from COMPUSTAT and represent the Standard & Poor’s (S&P) long-term domestic issuer
credit ratings. Number of deals is the number of acquisitions by bidders’ credit rating level one month prior to
the acquisition announcement for a sample of US acquisitions over the period 1998-2009. Percentage of Cash
and Percentage of Stock is the total percentage of cash and stock that is used in the deals. The remaining
percentage out of the 100% (not reported in the table) represents what is classified as “other” by SDC. Book-
to-Market is the book value of equity at the fiscal year-end prior to the acquisition announcement divided by
the market value of equity 4 weeks prior to the acquisition announcement. Book value of equity is from
COMPUSTAT, market value of equity is from CRSP.
Credit Rating
Level Number of Deals
Percentage of
Cash
Percentage of
Stock Book-to-Market
D - - - -
C - - - -
CC - - - -
CCC- - - - -
CCC 2 0.00 87.15 0.336
CCC+ 6 49.59 36.92 0.568
B- 42 40.77 56.15 0.368
B 73 40.06 46.12 0.479
B+ 197 57.83 31.58 0.462
BB- 189 59.19 31.63 0.437
BB 129 62.61 29.01 0.537
BB+ 88 59.48 30.86 0.416
BBB- 152 48.95 41.96 0.489
BBB 229 52.50 39.89 0.423
BBB+ 158 47.17 45.31 0.427
A- 133 42.88 49.40 0.436
A 178 41.81 53.06 0.347
A+ 83 48.62 44.62 0.353
AA- 40 28.26 67.50 0.273
AA 26 65.36 31.62 0.275
AA+ 4 50.00 47.01 0.738
AAA 18 28.94 69.47 0.229

39
Table IV
Variables Correlation Matrix
The table presents pair-wise correlations of the variables. The sample consists of US public and private acquisitions announced over the period between January 1,
1998 and December 31, 2009. All variables are defined in Appendix A.
Rating Existence Rating Level Size Leverage Collateral Interest Rate
Spread
Book-to-
Market
Run-Up
Rating Existence 1.000 Rating Level - 1.0000 Size 0.5457 0.6865 1.0000 Leverage 0.3854 -0.4484 0.0691 1.0000 Collateral 0.2251 0.0993 0.0396 0.2989 1.0000 Interest Rate Spread -0.0014 -0.0198 0.0323 -0.0660 -0.0086 1.0000 Book-to-Market -0.0565 -0.0908 -0.3093 -0.0431 -0.0075 0.1151 1.0000 Run-Up -0.0614 -0.1420 0.0907 0.0037 -0.0318 -0.0579 -0.1989 1.0000 Blockholder Ownership -0.0960 -0.3241 -0.1141 -0.0361 -0.0320 0.2183 0.0777 -0.0353 Cash Flows to Equity 0.0803 0.0832 0.1635 0.0314 0.0520 -0.0237 -0.2189 0.0126 Relative Size -0.0052 -0.1319 -0.1573 0.0608 0.0949 -0.0019 0.2014 -0.0365 Diversifying 0.0045 0.0220 -0.0584 0.0407 -0.0585 -0.0290 0.0122 0.0017 Hostile Deals 0.0765 0.0093 0.0670 0.0587 0.0874 0.0070 0.0222 -0.0212 Tender Offers 0.1470 0.1193 0.1538 0.0117 0.0584 0.0243 0.0037 -0.0374 Private -0.2825 -0.3826 -0.3241 -0.0762 -0.1635 0.0030 -0.0174 0.0553 Number of Bidders 0.0824 0.0234 0.0702 0.0486 0.0821 0.0164 0.0288 -0.0145
Blockholder Ownership Cash Flows
to Equity
Relative
Size
Diversifying Hostile
Deals
Tender
Offers
Private Number of
Bidders
Blockholder Ownership 1.0000 Cash Flows to Equity -0.0395 1.0000 Relative Size -0.0113 -0.1441 1.0000 Diversifying 0.0038 0.0112 -0.0005 1.0000 Hostile Deals 0.0094 0.0224 0.0870 -0.0206 1.0000 Tender Offers -0.0048 0.0265 0.0137 0.0318 0.1546 1.0000 Private 0.1526 -0.0114 -0.1067 0.0754 -0.1644 -0.2916 1.0000 Number of Bidders 0.0044 0.0194 0.0797 -0.0328 0.3461 0.1411 -0.1780 1.0000
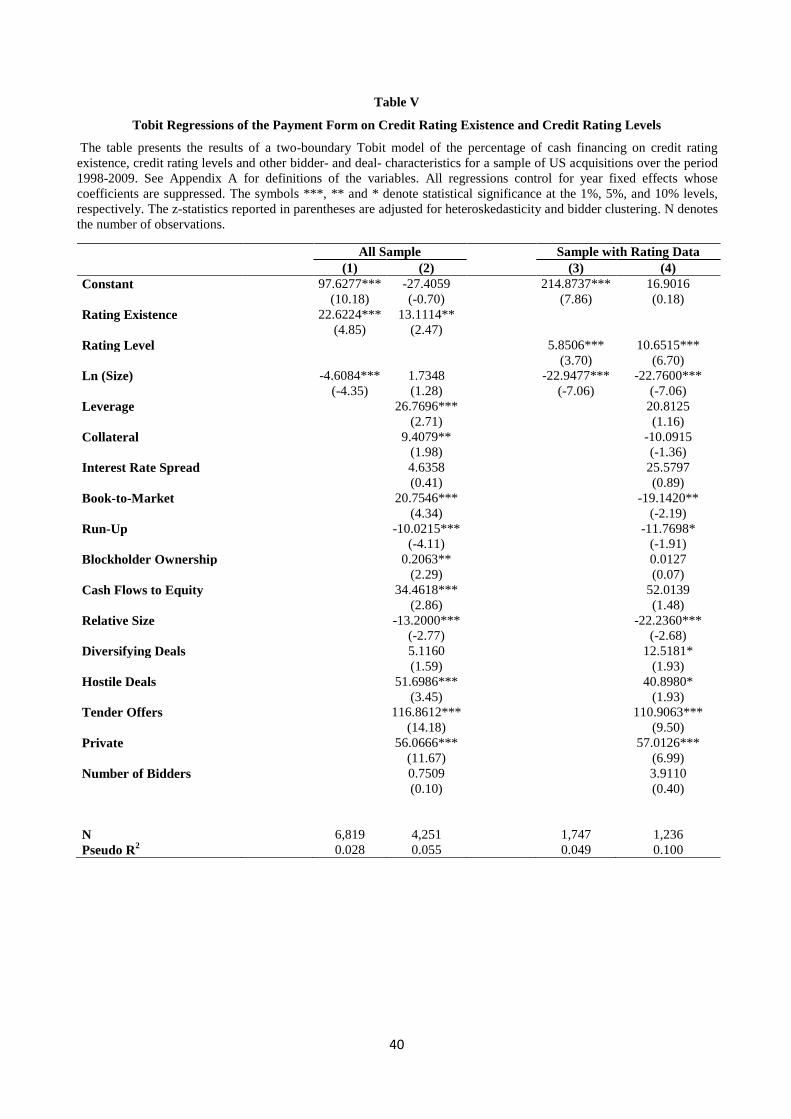
40
Table V
Tobit Regressions of the Payment Form on Credit Rating Existence and Credit Rating Levels
The table presents the results of a two-boundary Tobit model of the percentage of cash financing on credit rating
existence, credit rating levels and other bidder- and deal- characteristics for a sample of US acquisitions over the period
1998-2009. See Appendix A for definitions of the variables. All regressions control for year fixed effects whose
coefficients are suppressed. The symbols ***, ** and * denote statistical significance at the 1%, 5%, and 10% levels,
respectively. The z-statistics reported in parentheses are adjusted for heteroskedasticity and bidder clustering. N denotes
the number of observations.
All Sample Sample with Rating Data
(1) (2) (3) (4)
Constant 97.6277*** -27.4059 214.8737*** 16.9016
(10.18) (-0.70) (7.86) (0.18)
Rating Existence 22.6224*** 13.1114**
(4.85) (2.47)
Rating Level 5.8506*** 10.6515***
(3.70) (6.70)
Ln (Size) -4.6084*** 1.7348 -22.9477*** -22.7600***
(-4.35) (1.28) (-7.06) (-7.06)
Leverage 26.7696*** 20.8125
(2.71) (1.16)
Collateral 9.4079** -10.0915
(1.98) (-1.36)
Interest Rate Spread 4.6358 25.5797
(0.41) (0.89)
Book-to-Market 20.7546*** -19.1420**
(4.34) (-2.19)
Run-Up -10.0215*** -11.7698*
(-4.11) (-1.91)
Blockholder Ownership 0.2063** 0.0127
(2.29) (0.07)
Cash Flows to Equity 34.4618*** 52.0139
(2.86) (1.48)
Relative Size -13.2000*** -22.2360***
(-2.77) (-2.68)
Diversifying Deals 5.1160 12.5181*
(1.59) (1.93)
Hostile Deals 51.6986*** 40.8980*
(3.45) (1.93)
Tender Offers 116.8612*** 110.9063***
(14.18) (9.50)
Private 56.0666*** 57.0126***
(11.67) (6.99)
Number of Bidders 0.7509 3.9110
(0.10) (0.40)
N 6,819 4,251 1,747 1,236
Pseudo R2 0.028 0.055 0.049 0.100

41
Table VI
Probit Regressions of the Payment Form on Credit Rating Existence and Credit Rating Levels
The table presents the results of the Probit regression analysis of the choice between all cash and mixed payments and
all stock on credit rating existence, credit rating levels and other bidder- and deal- characteristics for a sample of US
acquisitions over the period 1998-2009. In all models the dependent variable takes the value of 1 for all cash and mixed
deals, and 0 for all stock deals. See Appendix A for definitions of the variables. All regressions control for year fixed
effects whose coefficients are suppressed. The symbols ***, ** and * denote statistical significance at the 1%, 5%, and
10% levels, respectively. The z-statistics reported in parentheses are adjusted for heteroskedasticity and bidder
clustering. N denotes the number of observations.
All Sample Sample with Rating Data
(1) (2) (3) (4)
Constant 1.3425*** 0.2195 2.4873*** 1.8194
(10.34) (0.31) (7.91) (1.01)
Rating Existence 0.2087*** 0.1712**
(3.85) (2.13)
Rating Level 0.0503*** 0.1297***
(3.02) (5.63)
Ln (Size) -0.0829*** -0.0196 -0.2491*** -0.3354***
(-6.78) (-0.99) (-7.28) (-7.00)
Leverage 0.3084** 0.3118
(2.04) (1.14)
Collateral 0.1504** -0.0738
(2.01) (-0.59)
Interest Rate Spread -0.0347 -0.0623
(-0.16) (-0.12)
Book-to-Market 0.2139*** -0.2489**
(2.85) (-2.03)
Run-Up -0.0893*** -0.0505
(-2.85) (-0.61)
Blockholder Ownership 0.0015 -0.0042
(1.01) (-1.60)
Cash Flows to Equity 0.4192*** 0.7575*
(2.98) (1.74)
Relative Size -0.0933** 0.0121
(-2.26) (0.11)
Diversifying Deals 0.0708 0.0515
(1.43) (0.50)
Hostile Deals 0.6974*** 0.3238
(2.97) (0.98)
Tender Offers 1.6143*** 1.8567***
(10.18) (7.45)
Private 0.7972*** 0.7199***
(12.62) (5.97)
Number of Bidders 0.0923 0.1810
(0.85) (1.10)
N 6,819 4,251 1,747 1,236
Pseudo R2 0.134 0.223 0.182 0.339

42
Table VII
Tobit Regressions of the Payment Form on the Unused Debt Capacity
The table presents the results of the Tobit regression analysis of the percentage of cash financing on the ratio of the
bidder to target credit rating level and other bidder- and deal- characteristics for a sample of US acquisitions over
the period 1998-2009. See Appendix A for definitions of the variables. All regressions control for year fixed
effects whose coefficients are suppressed. The symbols ***, ** and * denote statistical significance at the 1%, 5%,
and 10% levels, respectively. The z-statistics reported in parentheses are adjusted for heteroskedasticity and bidder
clustering. N denotes the number of observations.
(1) (2) (3)
Constant 82.1267** 197.4518 205.8989
(2.52) (1.20) (1.28)
ΒRating/TRating 50.5783*** 26.9520** 42.4202***
(3.92) (2.45) (3.37)
ΒRating/TRating X Relative Size -68.7589**
(-2.20)
Ln (Size) -12.4506*** -8.1216** -10.2007***
(-4.38) (-2.39) (-2.78)
Leverage 4.2754 -4.7377
(0.20) (-0.22)
Collateral -5.5872 0.4437
(-0.57) (0.05)
Interest Rate Spread -40.3717 -41.5129
(-0.86) (-0.91)
Book-to-Market -17.2664 -11.5146
(-1.15) (-0.72)
Run-Up -11.8879 -10.2334
(-1.27) (-1.18)
Blockholder Ownership -0.0474 -0.0256
(-0.20) (-0.11)
Cash Flows to Equity 43.6064 38.9853
(1.21) (1.04)
Relative Size 1.0234 66.7706**
(0.15) (2.32)
Diversifying Deals 12.9235 14.9358
(1.38) (1.64)
Hostile Deals 26.9725* 27.6277*
(1.78) (1.89)
Tender Offers 68.0105*** 64.7685***
(5.55) (5.40)
Number of Bidders -1.3935 -2.4857
(-0.20) (-0.37)
N 318 257 257
Pseudo R2 0.040 0.082 0.087

43
Table VIII
Regressions of the Payment Form on the Investment Grade
The table presents the results of the Tobit (specification (1)), and Probit (specification (2)) regression analyses of
the choice of the method of payment on investment grade and other bidder- and deal- characteristics for a sample
of US acquisitions over the period 1998-2009. See Appendix A for definitions of the variables. All regressions
control for year fixed effects whose coefficients are suppressed. The symbols ***, ** and * denote statistical
significance at the 1%, 5%, and 10% levels, respectively. The z-statistics reported in parentheses are adjusted for
heteroskedasticity and bidder clustering. N denotes the number of observations.
(1) (2)
Constant 71.7145 2.6975
(0.74) (1.54)
Investment Grade 38.4481*** 0.5228***
(4.25) (3.74)
Ln (Size) -14.7726*** -0.2404***
(-5.07) (-5.91)
Leverage 7.0224 0.1616
(0.39) (0.59)
Collateral -6.2500 -0.0216
(-0.84) (-0.18)
Interest Rate Spread 24.8690 -0.1398
(0.86) (-0.26)
Book-to-Market -16.4602* -0.2102*
(-1.77) (-1.65)
Run-Up -17.4667*** -0.0980
(-2.90) (-1.30)
Blockholder Ownership -0.0571 -0.0052*
(-0.30) (-1.94)
Cash Flows to Equity 65.7229* 0.9315**
(1.89) (2.19)
Relative Size -24.1692*** -0.0161
(-2.76) (-0.16)
Diversifying Deals 12.8268* 0.0331
(1.92) (0.32)
Hostile Deals 39.3941* 0.3170
(1.76) (0.94)
Tender Offers 111.9070*** 1.8190***
(9.27) (6.99)
Private 55.4549*** 0.6864***
(6.60) (5.64)
Number of Bidders 4.9135 0.1971
(0.50) (1.21)
N 1,236 1,236
Pseudo R2 0.093 0.324

44
Table IX
Endogeneity Control for Credit Rating Existence
The table presents the results of the instrumental variables regression procedure to control for potential
endogeneity of credit rating existence for a sample of US public acquisitions over the period 1998-2009.
Specification (1) is the reduced regression. Specification (2) is the structural regression for the Tobit regression.
Specification (3) is the structural regression for the Probit regression. See Appendix A for definitions of the
variables. All regressions control for year fixed effects whose coefficients are suppressed. The symbols ***, **
and * denote statistical significance at the 1%, 5%, and 10% levels, respectively. The z-statistics reported in
parentheses are adjusted for heteroskedasticity and bidder clustering. N denotes the number of observations. The
lower part of the table shows the F-test of the DWH augmented regression test for endogeneity with the
corresponding p-values in parenthesis.
Tobit Probit
Reduced Structural Structural
(1) (2) (3)
Constant -6.0687*** 154.1178*** 2.7536***
(-7.29) (3.07) (3.23)
Rating Existence 29.8695*** 0.3830***
(6.69) (5.42)
Age 0.0991
(0.99)
Firm Trades on NYSE 0.4063***
(3.75)
IndFrac 1.6527***
(5.62)
Profitability 1.5321***
(2.82)
Altman-Z -0.0302***
(-4.02)
Ln (Size) 0.6423*** -17.3382*** -0.2656***
(16.33) (-5.08) (-4.98)
Leverage 3.6172*** -95.9854*** -1.3778***
(11.40) (-4.41) (-4.07)
Collateral -0.0966 -4.8623 -0.0195
(-0.84) (-0.93) (-0.24)
Interest Rate Spread -0.2563 12.8700 0.0417
(-1.08) (1.05) (0.19)
Book-to-Market 0.5381*** 0.2040 -0.0576
(4.10) (0.04) (-0.67)
Run-Up -0.2302*** -1.1367 0.0283
(-5.09) (-0.40) (0.73)
Blockholder Ownership 0.0014 0.1325 0.0004
(0.66) (1.44) (0.27)
Cash Flows to Equity 0.1052 21.8675** 0.2587**
(0.44) (2.04) (2.15)
Relative Size -0.0671 -11.0181** -0.0646*
(-1.09) (-2.11) (-1.66)
Diversifying Deals 0.1642** -0.3869 -0.0051
(2.34) (-0.11) (-0.09)
Hostile Deals -0.3671 60.4964*** 0.7550***
(-1.59) (3.75) (3.12)
Tender Offers 0.2972** 105.6074*** 1.4434***
(2.35) (11.94) (8.85)
Private -0.2016** 64.2738*** 0.9128***
(-2.52) (12.84) (13.81)
Number of Bidders -0.0163 2.6709 0.0986
(-0.14) (0.35) (0.91)
N 3,914 3,914 3,914
Pseudo R2 0.559 0.061 0.247
F-test 11.80 8.52
DWH test for endogeneity (0.000) (0.004)

45
Table X
Endogeneity Control for Credit Rating Level
The table presents the results of the instrumental variables regression procedure to control for potential
endogeneity of credit rating levels for a sample of US public acquisitions over the period 1998-2009.
Specification (1) is the reduced regression. Specification (2) is the structural regression for the Tobit regression.
Specification (3) is the structural regression for the Probit regression. See Appendix A for definitions of the
variables. All regressions control for year fixed effects whose coefficients are suppressed. The symbols ***, **
and * denote statistical significance at the 1%, 5%, and 10% levels, respectively. The t-statistics in the reduced
regression and z-statistics in the structural regressions reported in parentheses are adjusted for
heteroskedasticity and bidder clustering. N denotes the number of observations. The lower part of the table
shows the F-test of the DWH augmented regression test for endogeneity with the corresponding p-values in
parenthesis.
Tobit Probit
Reduced Structural Structural
(1) (2) (3)
Constant 0.3204 25.5058 2.7870
(0.19) (0.23) (1.45)
Rating Level 14.5341*** 0.1943***
(3.93) (3.80)
Age 1.1610***
(5.92)
Firm Trades on NYSE 0.9581***
(5.66)
IndFrac 1.9216***
(4.38)
Profitability 11.0334***
(8.24)
Altman-Z -0.0873***
(-2.80)
Ln (Size) 1.1260*** -26.7955*** -0.4054***
(15.34) (-4.71) (-5.35)
Leverage -3.7583*** 36.5740 0.4254
(-6.33) (1.46) (1.12)
Collateral 0.0311 -18.4458** -0.1113
(0.14) (-2.06) (-0.82)
Interest Rate Spread 0.3315 15.3569 -0.4231
(0.72) (0.47) (-0.74)
Book-to-Market 0.5464** -16.6396 -0.2767**
(2.02) (-1.58) (-2.01)
Run-Up -0.5811*** -5.9058 0.0687
(-5.55) (-0.77) (0.70)
Blockholder Ownership -0.0077** 0.0891 -0.0035
(-2.04) (0.42) (-1.27)
Cash Flows to Equity -0.1647 37.3388 0.4241
(-0.78) (1.05) (1.26)
Relative Size -0.1593 -22.0758** 0.0332
(-1.01) (-2.21) (0.31)
Diversifying Deals 0.2493* 12.2691 -0.0282
(1.80) (1.62) (-0.25)
Hostile Deals -0.1754 41.4576 0.3405
(-0.58) (1.60) (0.99)
Tender Offers 0.1452 115.7211*** 1.7460***
(0.66) (8.33) (6.72)
Private -0.2490 65.7365*** 0.7715***
(-1.62) (7.08) (6.06)
Number of Bidders 0.1202 8.0779 0.1885
(0.59) (0.72) (1.10)
N 1,095 1,095 1,095
Adj-R2 (Pseudo R2) 0.710 (0.096) (0.335)
F-test 0.31 1.31
DWH test for endogeneity (0.581) (0.252)