credit shift as global corporate borrowers seek 60 trillion apac will ov
TRANSCRIPT

Credit Shift: As Global CorporateBorrowers Seek $60 Trillion,Asia-Pacific Debt Will Overtake U.S.And Europe Combined
Primary Credit Analyst:
Jayan U Dhru, New York (1) 212-438-7276; [email protected]
Secondary Contacts:
Terry E Chan, CFA, Melbourne (61) 3-9631-2174; [email protected]
Luis Manuel M Martinez, Mexico City (52) 55-5081-4462; [email protected]
David C Tesher, New York (1) 212-438-2618; [email protected]
Paul Watters, CFA, London (44) 20-7176-3542; [email protected]
Table Of Contents
Asia Grows Fast, The U.S. Picks Up The Pace, And Europe Stays Slow
Higher Risk For China's Borrowers Means Higher Risk For The World
Increased Disintermediation Is Occurring Almost Everywhere
The Energy Sector Grows Fastest, Followed By Asian Real Estate And
Health Care
A Confluence Of Risk?
Notes
Related Criteria And Research
WWW.STANDARDANDPOORS.COM/RATINGSDIRECT JUNE 15, 2014 1
1333627 | 300000480

Credit Shift: As Global Corporate Borrowers Seek$60 Trillion, Asia-Pacific Debt Will Overtake U.S.And Europe Combined
The emergence of China as the biggest debt market, gradual disintermediation of banks, faster debt growth in sectors
benefitting from the rising global middle class, and an aging world population have resulted in major credit shifts in
nonfinancial corporate debt issuance since the 2008 recession. We expect these shifts to continue through the next five
years, as corporate issuers will likely seek up to $60 trillion in new debt and refinancing through 2018, an increase from
an estimated $53 trillion last year. (Watch the related CreditMatters TV segments titled "Asia-Pacific's Debt Will
Outpace The U.S. And Eurozone As Global Funding Demand Rises" and "Corporate Debt Disintermediation Prospects
For The Next Five Years–Our Global View," dated June 16 and June 17, 2014, respectively.)
Corporate credit globally has approached an inflection point as the center of gravity shifts to the Asia-Pacific region.
Corporate debt in the region, particularly from China, will exceed that of North America and Europe combined by
2016. We believe this will lead to an overall increase in risk, since the credit quality of corporate borrowers in
Asia-Pacific is generally lower than in North America and Europe. Consequently, without improved risk assessment
among investors and a heightened awareness by regulators of contagion risk, some future financial stress could stem
from Asia.
China now has more outstanding corporate debt than any other country, having surpassed the U.S. last year, a year
sooner than we expected. We expect this gap to widen in the next five years. We estimate corporate debt in China at
$14.2 trillion at the end of 2013, compared with $13.1 trillion in the U.S. We expect that through the end of 2018, the
debt needs of China, with its comparatively high nominal GDP growth, will reach $20 trillion--a full one-third of the
almost $60 trillion in global refinancing and new debt needed.
Since the Great Recession, companies globally (with the exception of deflationary Japan) have turned to debt markets
to raise financing. As the European banking system faces challenges and corporate borrowers seek to diversify their
funding, we believe the region's debt capital markets will play a bigger role through 2018. In China, the government's
inclination to allow more government-related entities to issue debt securities could help deepen their capital markets.
For the U.S., though we envision commercial banks to make a comeback, we project the share of debt securities to
continue to rise. In Japan, unless Abenomics--Prime Minister Shinzo Abe's three-pronged policy approach--proves a
success, the downward drift in share of debt securities in that country could continue.
Higher interest rates are an obvious risk to economic growth and corporate debt quality. In our nominal GDP growth
assumptions, we have factored in policy rates to incrementally increase in most regions as monetary policies
normalize, and view the likelihood of rates rising sharply as quite low. However, such a "black swan" event could
significantly affect corporates at the lower end of the credit spectrum.
WWW.STANDARDANDPOORS.COM/RATINGSDIRECT JUNE 15, 2014 2
1333627 | 300000480

Overview
• We expect Asia-Pacific corporate issuers, particularly from China, to make up half of the $60 trillion in
projected new and refinancing demand over the five years 2014-2018, and more than half the $72 trillion in
projected debt outstanding in 2018. This implies heightened global corporate credit risk, given the larger share
of emerging market debt.
• We expect the percentage of debt securities over total corporate debt to gradually increase by two percentage
points to 26% over the next five years. While a slowdown in momentum compared with the previous five
years, the growth in absolute terms is equivalent to $1.5 trillion. We expect the eurozone and China to lead the
way.
• We compared China's corporate borrowers to their global peers among more than 8,500 listed global
companies (data source: S&P Capital IQ). We found that while China's corporate companies started 2009
better off than global peers, their cash flow and leverage have worsened in subsequent years.
• In the five years to 2013, corporate debt in the energy, Asian real estate, health care, and North American
information technology sectors grew fastest. We expect these sectors to continue to require additional debt
going forward.
Asia Grows Fast, The U.S. Picks Up The Pace, And Europe Stays Slow
While Asia-Pacific now leads the way in terms of funding needs for nonfinancial corporate borrowers, a strengthening
U.S. economic recovery is bolstering North America's second place position. Meanwhile, borrowing in the eurozone is
only slowly picking up, as countries in the monetary union struggle with marginal economic growth. Latin America's
share remains relatively small.
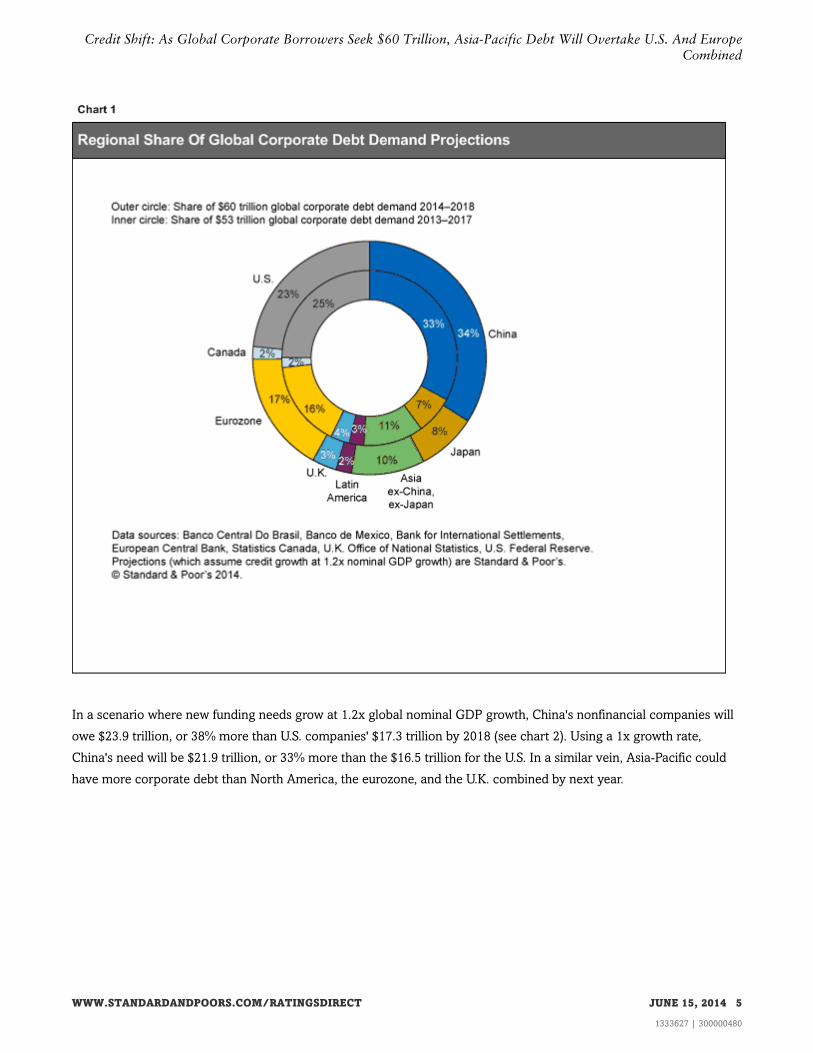
Of the $56 trillion to $60 trillion in financing (rated and unrated bonds and loans) that we estimate nonfinancial
corporate borrowers will need from 2014 to 2018, to-be-refinanced outstanding debt accounts for about $38 trillion,
and new borrowing will make up $18 trillion to $22 trillion (see table 1). The developed Western economies of the U.S.,
Canada, the eurozone, and the U.K. account for about $19 trillion, or 50%, of the refinancing amount. Of the
Asia-Pacific region's $18 trillion in refinancing needs, China's $11 trillion accounts for more than half. We expect China
to account for 34% of new and refinancing demand over 2014-2018, marginally up from our expectation a year ago
(see chart 1).
Table 1
Nonfinancial Corporate Debt Demands
--For 2014-2018--
--New debt demand (bil.
US$)--
--Total debt demand (bil.
US$)--
Total
debt (bil.
US$)
2013
Real local
currency GDP
CAGR
assumed¶
Nominal local
currency GDP
CAGR
assumed¶
1x nom
GDP
growth§
1.2x nom
GDP
growth†
Refi
demand
(bil. US$)**
1x nom
GDP
growth§
1.2x nom
GDP
growth†
Asia-Pacific 24,200 5.0% 7.4% 10,456 13,222 18,150 28,606 31,372
Australia 1,099 2.8% 5.6% 148 215 824 972 1,039
WWW.STANDARDANDPOORS.COM/RATINGSDIRECT JUNE 15, 2014 3
1333627 | 300000480
Credit Shift: As Global Corporate Borrowers Seek $60 Trillion, Asia-Pacific Debt Will Overtake U.S. And EuropeCombined

Table 1
Nonfinancial Corporate Debt Demands (cont.)
China 14,211 7.1% 10.0% 7,655 9,712 10,658 18,313 20,370
Hong Kong 571 3.8% 7.7% 257 318 428 685 746
India 950 6.5% 12.1% 435 592 712 1,148 1,304
Indonesia 201 6.0% 11.6% 67 96 151 218 247
Japan 5,053 1.3% 3.3% 936 1,128 3,790 4,726 4,918
Korea 1,380 3.8% 6.6% 669 799 1,035 1,704 1,835
Malaysia 294 5.5% 8.4% 167 204 220 387 424
Singapore 233 3.6% 6.3% 71 89 175 245 264
Thailand 208 4.3% 7.0% 53 70 156 209 226
North America 14,144 2.9% 4.6% 3,611 4,431 10,608 14,219 15,039
U.S. 13,104 3.0% 4.8% 3,424 4,187 9,828 13,252 14,015
Canada 1,040 2.8% 7.3% 187 243 780 967 1,023
Europe
(Eurozone and
U.K.)
11,235 1.6% 5.1% 3,204 3,657 8,426 11,630 12,084
Eurozone 9,555 1.4% 2.9% 2,531 2,881 7,166 9,697 10,048
U.K. 1,680 2.6% 4.5% 672 776 1,260 1,932 2,036
Latin America 1,140 2.9% 5.1% 319 435 855 1,174 1,290
Brazil 867 2.5% 8.2% 224 314 650 875 964
Mexico 273 3.7% 6.9% 95 121 205 299 326
Total 50,719 3.3% 6.1% 17,590 21,745 38,039 55,628 59,784
¶Based on International Monetary Fund and S&P projections--real local currency GDP growth, nominal local currency GDP growth, and implied
foreign exchange rate forecasts against US$. §Assumes debt grows at the same rate as GDP over the next five years. †Assumes debt grows at 1.2x
the rate of GDP over the next five years. **Assumes the percentage of debt maturing over the next five years is 75%. CAGR--Compound average
growth rate. N/A--Not applicable.
WWW.STANDARDANDPOORS.COM/RATINGSDIRECT JUNE 15, 2014 4
1333627 | 300000480
Credit Shift: As Global Corporate Borrowers Seek $60 Trillion, Asia-Pacific Debt Will Overtake U.S. And EuropeCombined
In a scenario where new funding needs grow at 1.2x global nominal GDP growth, China's nonfinancial companies will
owe $23.9 trillion, or 38% more than U.S. companies' $17.3 trillion by 2018 (see chart 2). Using a 1x growth rate,
China's need will be $21.9 trillion, or 33% more than the $16.5 trillion for the U.S. In a similar vein, Asia-Pacific could
have more corporate debt than North America, the eurozone, and the U.K. combined by next year.
WWW.STANDARDANDPOORS.COM/RATINGSDIRECT JUNE 15, 2014 5
1333627 | 300000480
Credit Shift: As Global Corporate Borrowers Seek $60 Trillion, Asia-Pacific Debt Will Overtake U.S. And EuropeCombined
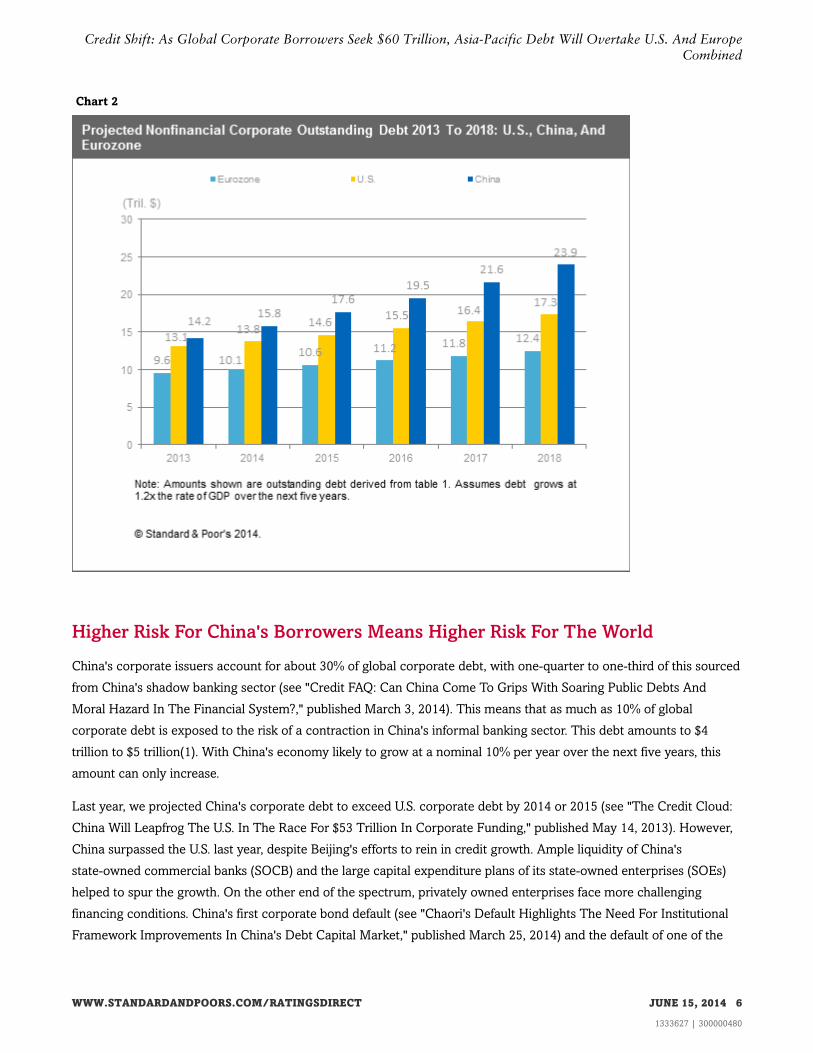
Chart 2
Higher Risk For China's Borrowers Means Higher Risk For The World
China's corporate issuers account for about 30% of global corporate debt, with one-quarter to one-third of this sourced
from China's shadow banking sector (see "Credit FAQ: Can China Come To Grips With Soaring Public Debts And
Moral Hazard In The Financial System?," published March 3, 2014). This means that as much as 10% of global
corporate debt is exposed to the risk of a contraction in China's informal banking sector. This debt amounts to $4
trillion to $5 trillion(1). With China's economy likely to grow at a nominal 10% per year over the next five years, this
amount can only increase.
Last year, we projected China's corporate debt to exceed U.S. corporate debt by 2014 or 2015 (see "The Credit Cloud:
China Will Leapfrog The U.S. In The Race For $53 Trillion In Corporate Funding," published May 14, 2013). However,
China surpassed the U.S. last year, despite Beijing's efforts to rein in credit growth. Ample liquidity of China's
state-owned commercial banks (SOCB) and the large capital expenditure plans of its state-owned enterprises (SOEs)
helped to spur the growth. On the other end of the spectrum, privately owned enterprises face more challenging
financing conditions. China's first corporate bond default (see "Chaori's Default Highlights The Need For Institutional
Framework Improvements In China's Debt Capital Market," published March 25, 2014) and the default of one of the
WWW.STANDARDANDPOORS.COM/RATINGSDIRECT JUNE 15, 2014 6
1333627 | 300000480
Credit Shift: As Global Corporate Borrowers Seek $60 Trillion, Asia-Pacific Debt Will Overtake U.S. And EuropeCombined
largest private steelmakers highlighted this (see "Credit FAQ: Chinese Steelmaker's Default Highlights Troubles In
Sector, Could Benefit Larger Players," published March 31, 2014). Chaori, operating in the overinvested solar panel
industry, was China's first corporate onshore bond default. Shanxi Haixin, one of China's largest private steelmakers,
failed to repay bank loans.
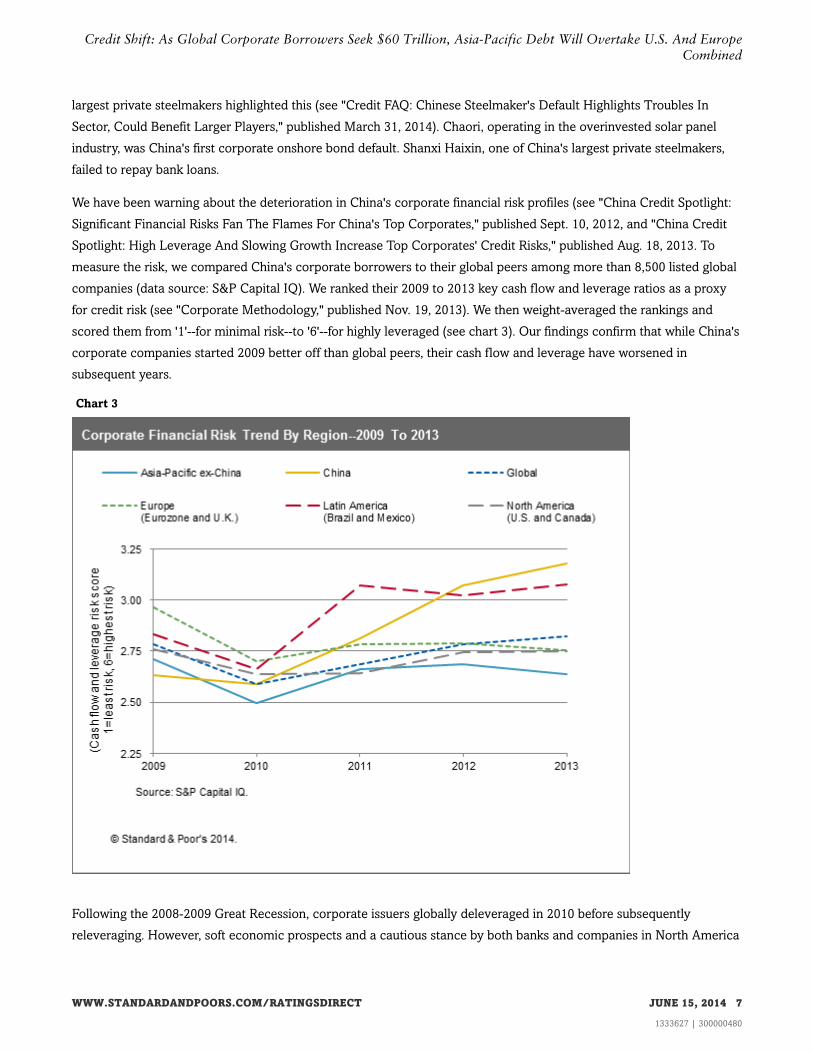
We have been warning about the deterioration in China's corporate financial risk profiles (see "China Credit Spotlight:
Significant Financial Risks Fan The Flames For China's Top Corporates," published Sept. 10, 2012, and "China Credit
Spotlight: High Leverage And Slowing Growth Increase Top Corporates' Credit Risks," published Aug. 18, 2013. To
measure the risk, we compared China's corporate borrowers to their global peers among more than 8,500 listed global
companies (data source: S&P Capital IQ). We ranked their 2009 to 2013 key cash flow and leverage ratios as a proxy
for credit risk (see "Corporate Methodology," published Nov. 19, 2013). We then weight-averaged the rankings and
scored them from '1'--for minimal risk--to '6'--for highly leveraged (see chart 3). Our findings confirm that while China's
corporate companies started 2009 better off than global peers, their cash flow and leverage have worsened in
subsequent years.
Chart 3
Following the 2008-2009 Great Recession, corporate issuers globally deleveraged in 2010 before subsequently
releveraging. However, soft economic prospects and a cautious stance by both banks and companies in North America
WWW.STANDARDANDPOORS.COM/RATINGSDIRECT JUNE 15, 2014 7
1333627 | 300000480
Credit Shift: As Global Corporate Borrowers Seek $60 Trillion, Asia-Pacific Debt Will Overtake U.S. And EuropeCombined

and Europe kept risk fairly steady to 2013. For Asia-Pacific (excluding China), low growth in Japan helped temper risk.
In contrast, risk in China and Latin America spiked up. Indeed, the Chinese corporate pool's risk score worsened by
about 20% over the period.
China's property and steel sectors remain of particular concern. The property sector's expansion is largely debt funded
(forming part of the spike in Asian real estate debt; see chart 5). The funding comes partly from the shadow banking
system, including peer-to-peer lending. Developers' debt appetite remains high, with many increasing their land bank
and allowing property inventory to build (see "China Property Watch: Sales And Prices Are Likely To Moderate This
Year With Tighter Financing," published March 4, 2014). This oversupply has contributed to housing prices falling 10%
this year, with a flow-on effect on construction steel demand. This demand fall-off is further pressuring steel producers
already facing low domestic prices and chronic overcapacity. We expect more defaults in the steel sector. An external
spillover from this has been the more than 25% fall in iron ore prices this year.
Given the substantial share that shadow banking contributes in financing not just China's corporate borrowers but also
local and regional government financing vehicles, a sharp contraction would be detrimental for business generally. A
contraction would particularly hit small-to-medium enterprises (SMEs), which have more limited access to bank
financing. The near-technical default of a trust product developed by a state-owned trust company recently heightened
concerns about a possible shadow banking squeeze (see "More Distressed Trust Products Are Likely To Emerge In
China This Year, Says S&P," published Jan. 29, 2014).
The combination of weakened financial profiles, slower economic growth, tighter access to borrowing, and higher
interest rates pose a significant challenge to China's corporate borrowers, especially the SMEs. With China's large and
still-expanding contribution to global corporate debt, the higher financial risk is causing overall corporate risk to
increase globally (see chart 3). As the world's second largest national economy, any significant reverse for China's
corporate sector could quickly spread to other countries.
Increased Disintermediation Is Occurring Almost Everywhere
Since the Great Recession, corporates globally (with the exception of deflationary Japan) have turned to the debt
capital markets to raise financing (see chart 4). Except for Japan, the stock of debt security financing is between
one-quarter to half as much in percentage terms in 2013 compared with five years before.
WWW.STANDARDANDPOORS.COM/RATINGSDIRECT JUNE 15, 2014 8
1333627 | 300000480
Credit Shift: As Global Corporate Borrowers Seek $60 Trillion, Asia-Pacific Debt Will Overtake U.S. And EuropeCombined

We have made some qualitative assumptions on the projected share of debt securities as a percentage of total debt by
2018. For each country or region, we examined the trend of debt share growth to 2013 and considered the likely
capacity of commercial banks by making a conservative assumption that their equity position only grows through
retained earnings rather than through fresh equity raising as well as other factors that contribute to the pace of
disintermediation.
In Europe, the equity challenge facing eurozone banks, the low absolute (and relative to floating rate) capital markets
funding costs, and the desire to diversify funding sources convince us that the bond markets in Europe (eurozone and
U.K.) will continue to grow their market share of outstanding debt through 2018.
Specifically, the results of our study show that eurozone banks are unlikely to be able to maintain their current 61%
market share of corporate debt funding (see chart 4). We estimate that the Eurozone banks have capacity to increase
their corporate loan exposures by a little more than 3% per year over the next five years, well below the annual 5%
growth in corporate debt that we anticipate over the same period (see "Global Bank Disintermediation Continues As
WWW.STANDARDANDPOORS.COM/RATINGSDIRECT JUNE 15, 2014 9
1333627 | 300000480
Credit Shift: As Global Corporate Borrowers Seek $60 Trillion, Asia-Pacific Debt Will Overtake U.S. And EuropeCombined
Corporate Borrowing Needs Outpace Banks' Capacity," published June 11, 2014). In nominal terms, this funding gap
amounts to about $600 billion, increasing the opportunity for the debt capital markets and nonbank lenders that
already will be tapped for $1.1 trillion in new debt funding, assuming no change in underlying market shares. While this
is certainly a very significant step up in net issuance relative to the $530 billion that has been raised in the European
bond markets over the last five years, it is still substantially less than the $3.8 trillion in new loans (net) during the
five-year period between 2003 and 2008, according to European Central Bank data. Furthermore, our analysis
presumes relatively slow economic growth over this period. If growth quickens, the restricted support that European
banks could provide would imply that disintermediation would likely increase at an even faster pace than we currently
envisage.
In China, the government seems more inclined to let government-related entities tap the debt markets, which could
help deepen their capital markets. In Japan, unless Abenomics is more successful, the drift in share of debt securities in
that country could continue as bonds are allowed to mature without necessarily being refinanced. In the rest of Asia,
while there is a longer-term trend toward developing local bond markets, those in the region are generally still small
relative to the economies they are serving. Asia remains dependent on the banking system, where lending practices
are to an extent still made based on relationship. Consequently, we have assumed only a small gain in capital markets
share by 2018.
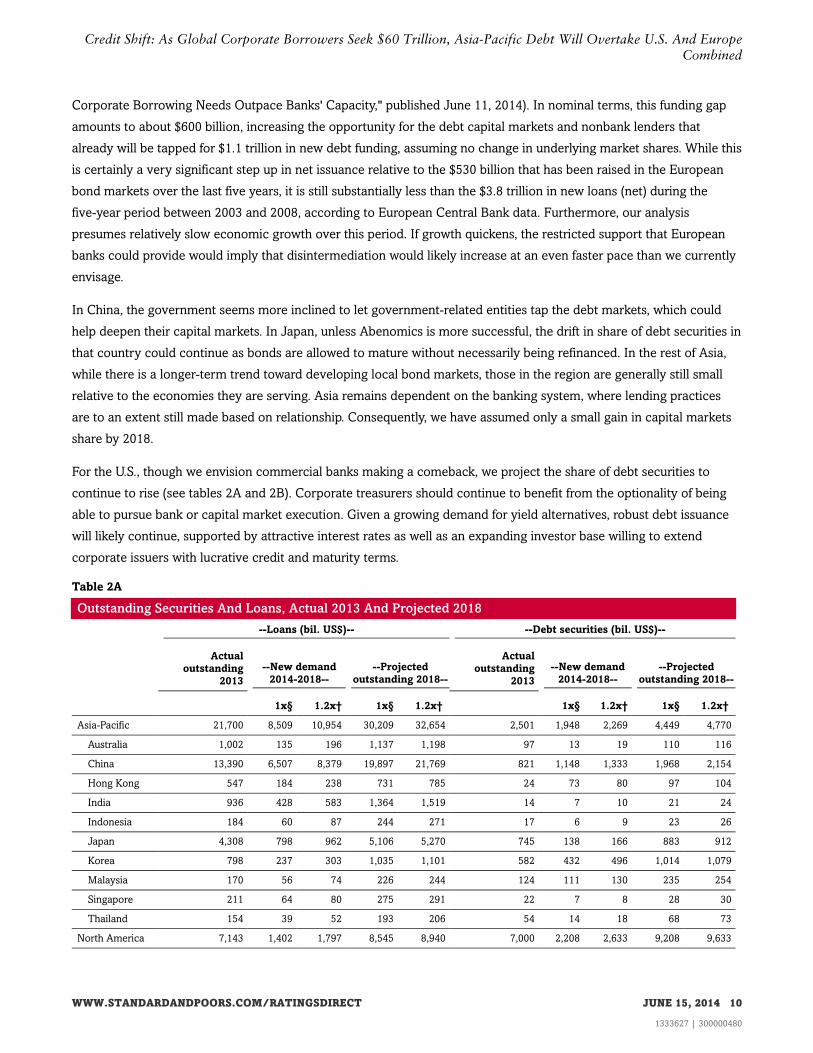
For the U.S., though we envision commercial banks making a comeback, we project the share of debt securities to
continue to rise (see tables 2A and 2B). Corporate treasurers should continue to benefit from the optionality of being
able to pursue bank or capital market execution. Given a growing demand for yield alternatives, robust debt issuance
will likely continue, supported by attractive interest rates as well as an expanding investor base willing to extend
corporate issuers with lucrative credit and maturity terms.
Table 2A
Outstanding Securities And Loans, Actual 2013 And Projected 2018
--Loans (bil. US$)-- --Debt securities (bil. US$)--
Actual
outstanding
2013
--New demand
2014-2018--
--Projected
outstanding 2018--
Actual
outstanding
2013
--New demand
2014-2018--
--Projected
outstanding 2018--
1x§ 1.2x† 1x§ 1.2x† 1x§ 1.2x† 1x§ 1.2x†
Asia-Pacific 21,700 8,509 10,954 30,209 32,654 2,501 1,948 2,269 4,449 4,770
Australia 1,002 135 196 1,137 1,198 97 13 19 110 116
China 13,390 6,507 8,379 19,897 21,769 821 1,148 1,333 1,968 2,154
Hong Kong 547 184 238 731 785 24 73 80 97 104
India 936 428 583 1,364 1,519 14 7 10 21 24
Indonesia 184 60 87 244 271 17 6 9 23 26
Japan 4,308 798 962 5,106 5,270 745 138 166 883 912
Korea 798 237 303 1,035 1,101 582 432 496 1,014 1,079
Malaysia 170 56 74 226 244 124 111 130 235 254
Singapore 211 64 80 275 291 22 7 8 28 30
Thailand 154 39 52 193 206 54 14 18 68 73
North America 7,143 1,402 1,797 8,545 8,940 7,000 2,208 2,633 9,208 9,633
WWW.STANDARDANDPOORS.COM/RATINGSDIRECT JUNE 15, 2014 10
1333627 | 300000480
Credit Shift: As Global Corporate Borrowers Seek $60 Trillion, Asia-Pacific Debt Will Overtake U.S. And EuropeCombined
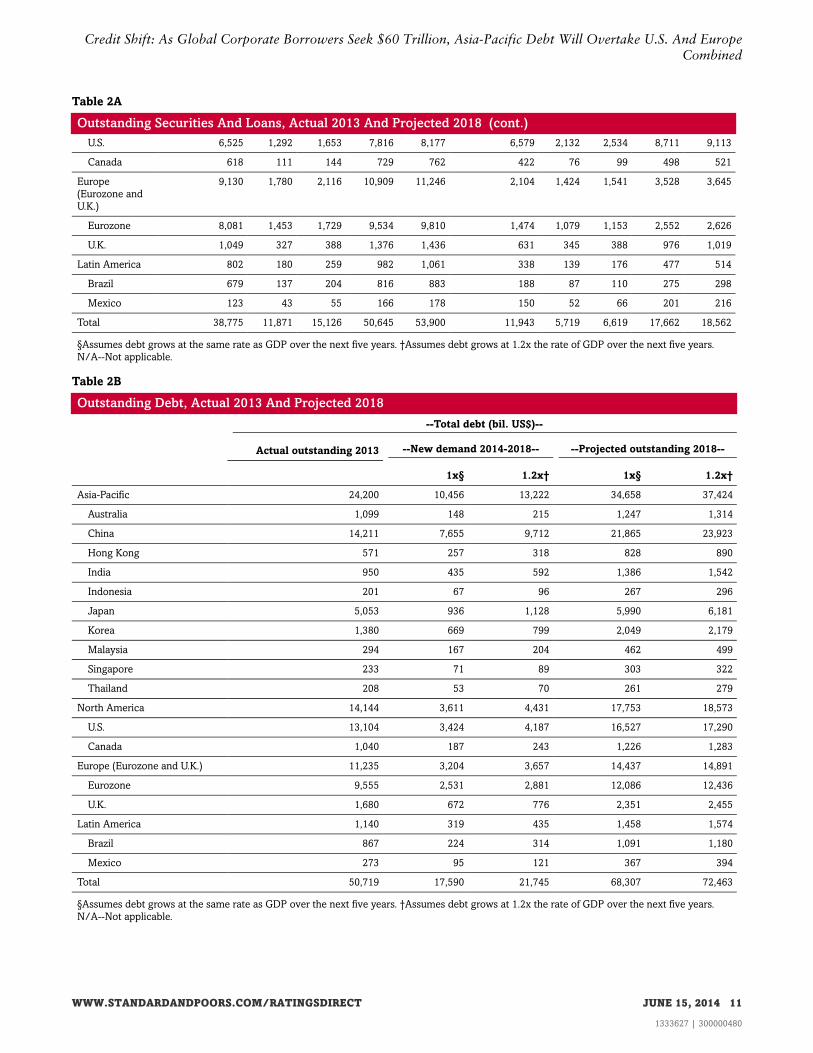
Table 2A
Outstanding Securities And Loans, Actual 2013 And Projected 2018 (cont.)
U.S. 6,525 1,292 1,653 7,816 8,177 6,579 2,132 2,534 8,711 9,113
Canada 618 111 144 729 762 422 76 99 498 521
Europe
(Eurozone and
U.K.)
9,130 1,780 2,116 10,909 11,246 2,104 1,424 1,541 3,528 3,645
Eurozone 8,081 1,453 1,729 9,534 9,810 1,474 1,079 1,153 2,552 2,626
U.K. 1,049 327 388 1,376 1,436 631 345 388 976 1,019
Latin America 802 180 259 982 1,061 338 139 176 477 514
Brazil 679 137 204 816 883 188 87 110 275 298
Mexico 123 43 55 166 178 150 52 66 201 216
Total 38,775 11,871 15,126 50,645 53,900 11,943 5,719 6,619 17,662 18,562
§Assumes debt grows at the same rate as GDP over the next five years. †Assumes debt grows at 1.2x the rate of GDP over the next five years.
N/A--Not applicable.
Table 2B
Outstanding Debt, Actual 2013 And Projected 2018
--Total debt (bil. US$)--
Actual outstanding 2013 --New demand 2014-2018-- --Projected outstanding 2018--
1x§ 1.2x† 1x§ 1.2x†
Asia-Pacific 24,200 10,456 13,222 34,658 37,424
Australia 1,099 148 215 1,247 1,314
China 14,211 7,655 9,712 21,865 23,923
Hong Kong 571 257 318 828 890
India 950 435 592 1,386 1,542
Indonesia 201 67 96 267 296
Japan 5,053 936 1,128 5,990 6,181
Korea 1,380 669 799 2,049 2,179
Malaysia 294 167 204 462 499
Singapore 233 71 89 303 322
Thailand 208 53 70 261 279
North America 14,144 3,611 4,431 17,753 18,573
U.S. 13,104 3,424 4,187 16,527 17,290
Canada 1,040 187 243 1,226 1,283
Europe (Eurozone and U.K.) 11,235 3,204 3,657 14,437 14,891
Eurozone 9,555 2,531 2,881 12,086 12,436
U.K. 1,680 672 776 2,351 2,455
Latin America 1,140 319 435 1,458 1,574
Brazil 867 224 314 1,091 1,180
Mexico 273 95 121 367 394
Total 50,719 17,590 21,745 68,307 72,463
§Assumes debt grows at the same rate as GDP over the next five years. †Assumes debt grows at 1.2x the rate of GDP over the next five years.
N/A--Not applicable.
WWW.STANDARDANDPOORS.COM/RATINGSDIRECT JUNE 15, 2014 11
1333627 | 300000480
Credit Shift: As Global Corporate Borrowers Seek $60 Trillion, Asia-Pacific Debt Will Overtake U.S. And EuropeCombined
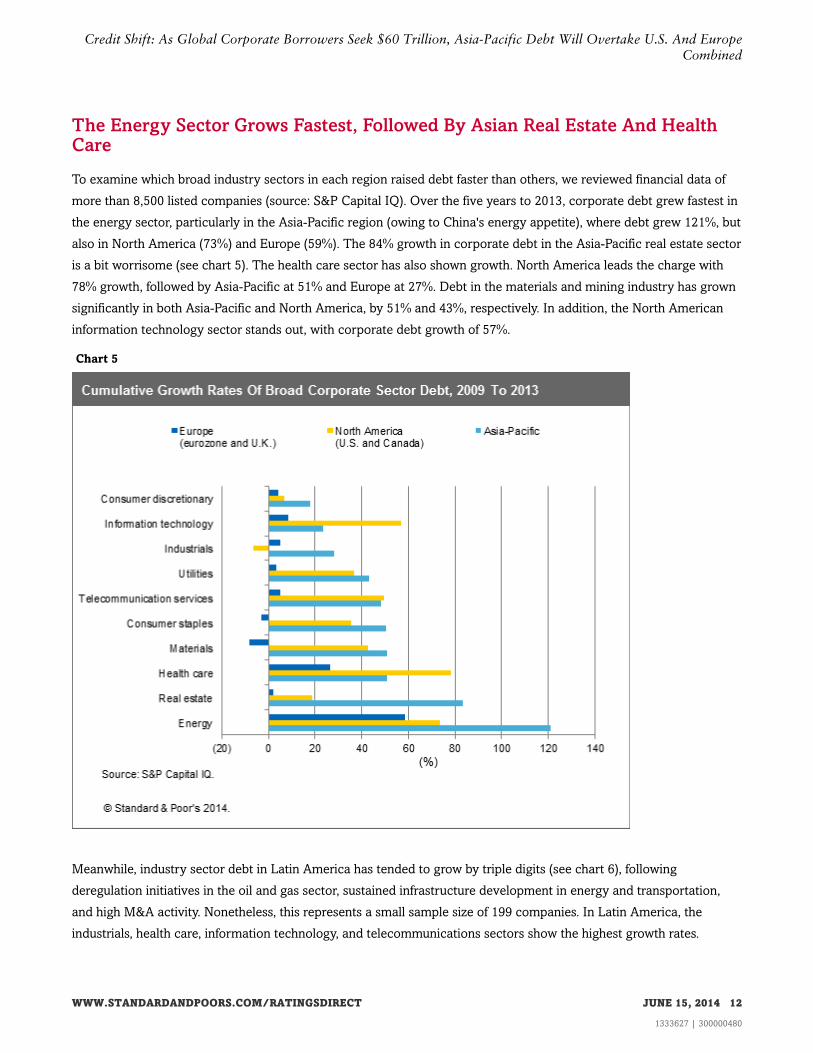
The Energy Sector Grows Fastest, Followed By Asian Real Estate And HealthCare
To examine which broad industry sectors in each region raised debt faster than others, we reviewed financial data of
more than 8,500 listed companies (source: S&P Capital IQ). Over the five years to 2013, corporate debt grew fastest in
the energy sector, particularly in the Asia-Pacific region (owing to China's energy appetite), where debt grew 121%, but
also in North America (73%) and Europe (59%). The 84% growth in corporate debt in the Asia-Pacific real estate sector
is a bit worrisome (see chart 5). The health care sector has also shown growth. North America leads the charge with
78% growth, followed by Asia-Pacific at 51% and Europe at 27%. Debt in the materials and mining industry has grown
significantly in both Asia-Pacific and North America, by 51% and 43%, respectively. In addition, the North American
information technology sector stands out, with corporate debt growth of 57%.
Chart 5
Meanwhile, industry sector debt in Latin America has tended to grow by triple digits (see chart 6), following
deregulation initiatives in the oil and gas sector, sustained infrastructure development in energy and transportation,
and high M&A activity. Nonetheless, this represents a small sample size of 199 companies. In Latin America, the
industrials, health care, information technology, and telecommunications sectors show the highest growth rates.
WWW.STANDARDANDPOORS.COM/RATINGSDIRECT JUNE 15, 2014 12
1333627 | 300000480
Credit Shift: As Global Corporate Borrowers Seek $60 Trillion, Asia-Pacific Debt Will Overtake U.S. And EuropeCombined

Chart 6
In our view, the structural conditions that have required rapid growth in external funding in the energy, health care,
and (in the Americas) information technology sectors in recent years are likely to persist. Specifically, the rise in debt
in the energy sector is a result of the voracious appetite for energy from emerging economies such as China, along
with a desire for energy independence and concern for the environment from the U.S. and other major powers around
the globe. Energy investments will come from the continued push for increases in oil production (and from oil
refineries in particular, excluding Europe) and the impetus toward renewable energy in Europe. Moreover, horizontal
drilling and hydraulic fracturing have tapped into vast reserves of natural gas and oil that had been too costly to
recover. In the U.S., shale gas and oil production has rocketed over the past five years, increasing at least 50% every
year. By the end of the decade, shale oil and gas production could make the U.S. energy independent and create
roughly two million jobs. More broadly, the International Energy Agency estimates that almost $200 billion has been
invested annually in recent years in energy supply in the U.S. and that it could increase by almost 50% in coming
years.
The megatrend of global aging has spurred growth in the health care sector. The first of the baby boom generation
reached 65 in 2011. In the U.S., this generation includes about 78 million people, a demographic that has altered the
contours of U.S. political, social, and economic life from the 1950s to now. But given the sheer size of this group and
WWW.STANDARDANDPOORS.COM/RATINGSDIRECT JUNE 15, 2014 13
1333627 | 300000480
Credit Shift: As Global Corporate Borrowers Seek $60 Trillion, Asia-Pacific Debt Will Overtake U.S. And EuropeCombined

the likelihood that baby boomers will have longer lives than those of previous generations, the market for health care
will continue to increase. In turn, according to the Centers for Medicare & Medicaid Services, Medicare enrollment will
increase over 25% by 2022.
Information technology is helping to transform not just health care but every aspect of society. The dramatic declines
in the cost of memory and microprocessors have created a world of seamless connectivity. This has led to a
proliferation of new business models, such as personalized marketing and social networking. Furthermore, the storing
of everyday transactions has created the world of big data, where large databases help companies better understand
consumer preferences, exploit new market activities, or even search for threats to national security. In response,
privacy and security concerns have prompted telecommunications firms to ensure that their fixed and mobile
broadband networks are both fast and secure. Gartner Inc. (an American information technology research and
advisory firm) estimates worldwide IT spending to reach $3.8 trillion in 2014, an increase of over 3% versus 2013.
A Confluence Of Risk?
With borrowers in Asia-Pacific taking a greater share of global corporate funding needs, some industry sectors growing
much faster than others, and increased bank disintermediation, Standard & Poor's is keeping an close eye on the
concurrent increase in credit risk. As the global recovery broadens, and monetary policy starts to normalize, growing
demand for financing among nonfinancial corporate entities could encounter tighter credit conditions as funding costs
rise and the lending capacity of the banks starts to bite. Our base case is for funding costs to increase incrementally. In
the unlikely event of interest rates rising sharply, the more highly leveraged corporate borrowers, being cost-sensitive,
are most vulnerable.
In the eurozone, where banks appear to have the most limited capacity to increase lending, we see the greatest
potential for further disintermediation, even with growth running at relatively low levels. Banks around the world are
shoring up their balance sheets and, in light of increased regulation and higher cost of capital, are being more selective
regarding the use of their respective balance sheet. More selective lending could squeeze some borrowers, especially
those at the lower end of the ratings spectrum. To avoid a confluence of risk in investment portfolios, investors should
be attentive to the credit shifts in the global corporate landscape by geography, sector, and debt type.
Notes
(1)This estimate is double that calculated by the Financial Stability Board (FSB) as the FSB figure includes only other
financial intermediaries being investment funds, broker-dealers, structured finance vehicles, finance companies and
money market funds, and hedge funds. The FSB figure does not include intercorporate lending.
Related Criteria And Research
Related Criteria
• Corporate Methodology, published Nov. 19, 2013
WWW.STANDARDANDPOORS.COM/RATINGSDIRECT JUNE 15, 2014 14
1333627 | 300000480
Credit Shift: As Global Corporate Borrowers Seek $60 Trillion, Asia-Pacific Debt Will Overtake U.S. And EuropeCombined
Related Research
• For Banks Globally, Higher Capital Requirements And Moderate Returns On Equity Will Constrain Lending Growth,
June 11, 2014
• Global Bank Disintermediation Continues As Corporate Borrowing Needs Outpace Banks' Capacity, June 11, 2014
• Credit FAQ: Chinese Steelmaker's Default Highlights Troubles In Sector, Could Benefit Larger Players, March 31,
2014
• Chaori's Default Highlights The Need For Institutional Framework Improvements In China's Debt Capital Market,
March 25, 2014
• China Property Watch: Sales And Prices Are Likely To Moderate This Year With Tighter Financing, March 4, 2014
• Credit FAQ: Can China Come To Grips With Soaring Public Debts And Moral Hazard In The Financial System?,
March 3, 2014
• More Distressed Trust Products Are Likely To Emerge In China This Year, Says S&P, Jan. 29, 2014
• China Credit Spotlight: High Leverage And Slowing Growth Increase Top Corporates' Credit Risks, Aug. 18, 2013
• The Credit Cloud: China Will Leapfrog The U.S. In The Race For $53 Trillion In Corporate Funding, May 14, 2013
• China Credit Spotlight: Significant Financial Risks Fan The Flames For China's Top Corporates, Sept. 10, 2012
WWW.STANDARDANDPOORS.COM/RATINGSDIRECT JUNE 15, 2014 15
1333627 | 300000480
Credit Shift: As Global Corporate Borrowers Seek $60 Trillion, Asia-Pacific Debt Will Overtake U.S. And EuropeCombined
S&P may receive compensation for its ratings and certain analyses, normally from issuers or underwriters of securities or from obligors. S&P
reserves the right to disseminate its opinions and analyses. S&P's public ratings and analyses are made available on its Web sites,
www.standardandpoors.com (free of charge), and www.ratingsdirect.com and www.globalcreditportal.com (subscription) and www.spcapitaliq.com
(subscription) and may be distributed through other means, including via S&P publications and third-party redistributors. Additional information
about our ratings fees is available at www.standardandpoors.com/usratingsfees.
S&P keeps certain activities of its business units separate from each other in order to preserve the independence and objectivity of their respective
activities. As a result, certain business units of S&P may have information that is not available to other S&P business units. S&P has established
policies and procedures to maintain the confidentiality of certain nonpublic information received in connection with each analytical process.
To the extent that regulatory authorities allow a rating agency to acknowledge in one jurisdiction a rating issued in another jurisdiction for certain
regulatory purposes, S&P reserves the right to assign, withdraw, or suspend such acknowledgement at any time and in its sole discretion. S&P
Parties disclaim any duty whatsoever arising out of the assignment, withdrawal, or suspension of an acknowledgment as well as any liability for any
damage alleged to have been suffered on account thereof.
Credit-related and other analyses, including ratings, and statements in the Content are statements of opinion as of the date they are expressed and
not statements of fact. S&P's opinions, analyses, and rating acknowledgment decisions (described below) are not recommendations to purchase,
hold, or sell any securities or to make any investment decisions, and do not address the suitability of any security. S&P assumes no obligation to
update the Content following publication in any form or format. The Content should not be relied on and is not a substitute for the skill, judgment
and experience of the user, its management, employees, advisors and/or clients when making investment and other business decisions. S&P does
not act as a fiduciary or an investment advisor except where registered as such. While S&P has obtained information from sources it believes to be
reliable, S&P does not perform an audit and undertakes no duty of due diligence or independent verification of any information it receives.
No content (including ratings, credit-related analyses and data, valuations, model, software or other application or output therefrom) or any part
thereof (Content) may be modified, reverse engineered, reproduced or distributed in any form by any means, or stored in a database or retrieval
system, without the prior written permission of Standard & Poor's Financial Services LLC or its affiliates (collectively, S&P). The Content shall not be
used for any unlawful or unauthorized purposes. S&P and any third-party providers, as well as their directors, officers, shareholders, employees or
agents (collectively S&P Parties) do not guarantee the accuracy, completeness, timeliness or availability of the Content. S&P Parties are not
responsible for any errors or omissions (negligent or otherwise), regardless of the cause, for the results obtained from the use of the Content, or for
the security or maintenance of any data input by the user. The Content is provided on an "as is" basis. S&P PARTIES DISCLAIM ANY AND ALL
EXPRESS OR IMPLIED WARRANTIES, INCLUDING, BUT NOT LIMITED TO, ANY WARRANTIES OF MERCHANTABILITY OR FITNESS FOR
A PARTICULAR PURPOSE OR USE, FREEDOM FROM BUGS, SOFTWARE ERRORS OR DEFECTS, THAT THE CONTENT'S FUNCTIONING
WILL BE UNINTERRUPTED, OR THAT THE CONTENT WILL OPERATE WITH ANY SOFTWARE OR HARDWARE CONFIGURATION. In no
event shall S&P Parties be liable to any party for any direct, indirect, incidental, exemplary, compensatory, punitive, special or consequential
damages, costs, expenses, legal fees, or losses (including, without limitation, lost income or lost profits and opportunity costs or losses caused by
negligence) in connection with any use of the Content even if advised of the possibility of such damages.
Copyright © 2016 Standard & Poor's Financial Services LLC, a part of McGraw Hill Financial. All rights reserved.
WWW.STANDARDANDPOORS.COM/RATINGSDIRECT JUNE 15, 2014 16
1333627 | 300000480