credit suisse - cubic corporation suisse dec 1 2016 cub_fnl (1)_12.01... · 01-12-2016 · credit...
TRANSCRIPT

Credit Suisse 4th Annual Industrials Growth Conference
Cubic Corporate Overview Bradley H. Feldmann
President and Chief Executive Officer
John “Jay” D. Thomas Executive Vice President and Chief Financial Officer
December 1, 2016
Safe Harbor
This presentation contains forward-looking statements within the meaning of Section 21E of the Securities Exchange Act of 1934,
as amended, that are subject to the “safe harbor” created by those sections. Any statements about our expectations, beliefs,
plans, objectives, assumptions or future events or our future financial and/or operating performance are not historical and may
be forward-looking. These statements are often, but not always, made through the use of words or phrases such as “may,” “will,”
“anticipate,” “estimate,” “plan,” “project,” “continuing,” “ongoing,” “expect,” “believe,” “intend,” “predict,” “potential,”
“opportunity” and similar words or phrases or the negatives of these words or phrases. These statements involve estimates,
assumptions and uncertainties, including those discussed in “Risk Factors” in the Company’s annual report on Form 10-K for the
year ended September 30, 2016, and throughout this presentation that could cause actual results to differ materially from those
expressed in these statements.
Because the risk factors referred to above could cause actual results or outcomes to differ materially from those expressed in any
forward-looking statements made by us or on our behalf, you should not place undue reliance on any forward-looking statements.
In addition, past financial and/or operating performance is not necessarily a reliable indicator of future performance and you
should not use our historical performance to anticipate results or future period trends. Further, any forward-looking statement
speaks only as of the date on which it is made, and we undertake no obligation to update any forward-looking statement to reflect
events or circumstances after the date on which the statement is made or to reflect the occurrence of unanticipated events. New
factors emerge from time to time, and it is not possible for us to predict which factors will arise. In addition, we cannot assess the
impact of each factor on our business or the extent to which any factor, or combination of factors, may cause actual results to
differ materially from those contained in any forward-looking statements.
2 NYSE: CUB
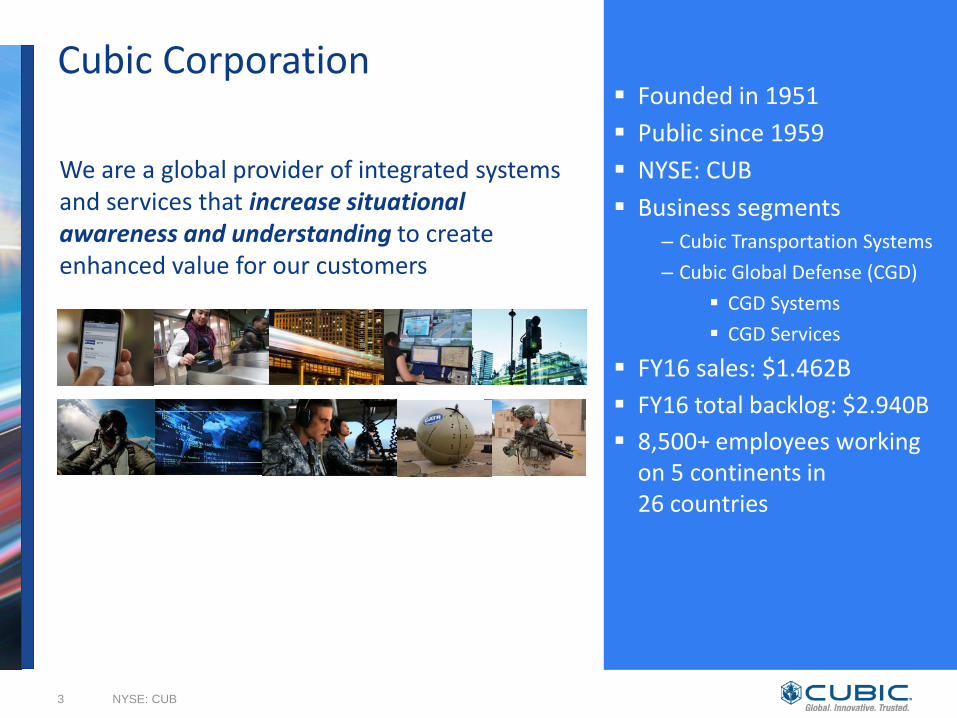
Cubic Corporation
Founded in 1951
Public since 1959
NYSE: CUB
Business segments – Cubic Transportation Systems
– Cubic Global Defense (CGD)
CGD Systems
CGD Services
FY16 sales: $1.462B
FY16 total backlog: $2.940B
8,500+ employees working on 5 continents in 26 countries
NYSE: CUB 3
We are a global provider of integrated systems and services that increase situational awareness and understanding to create enhanced value for our customers
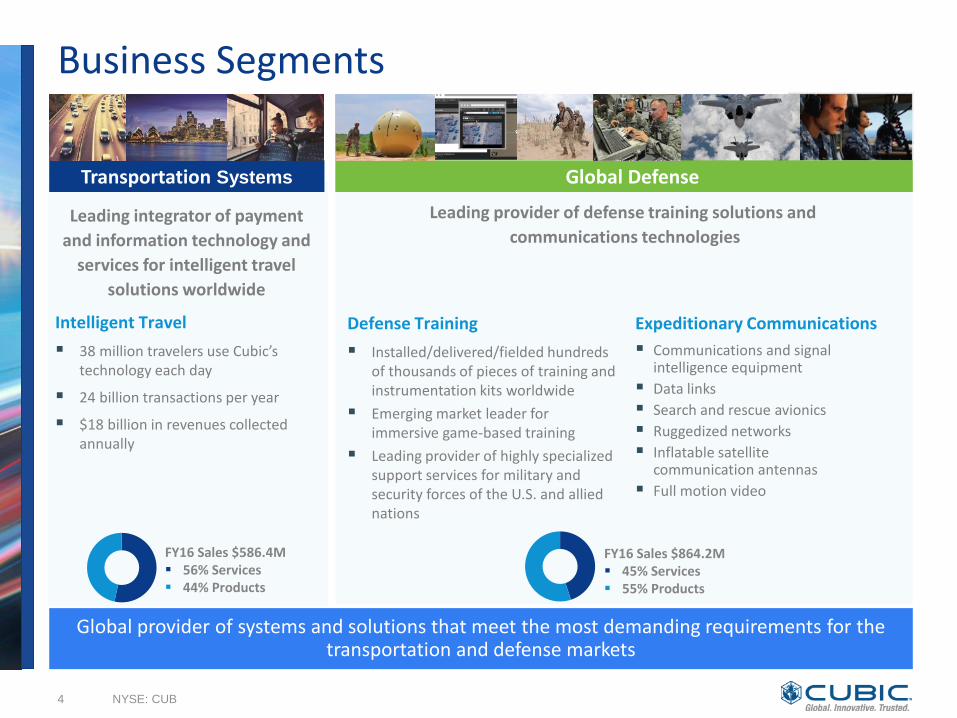
Business Segments
4
Leading provider of defense training solutions and
communications technologies
Leading integrator of payment
and information technology and
services for intelligent travel
solutions worldwide
Intelligent Travel
38 million travelers use Cubic’s technology each day
24 billion transactions per year
$18 billion in revenues collected annually
Transportation Systems Global Defense
NYSE: CUB
Defense Training
Installed/delivered/fielded hundreds of thousands of pieces of training and instrumentation kits worldwide
Emerging market leader for immersive game-based training
Leading provider of highly specialized support services for military and security forces of the U.S. and allied nations
Expeditionary Communications
Communications and signal intelligence equipment
Data links
Search and rescue avionics
Ruggedized networks
Inflatable satellite communication antennas
Full motion video
Global provider of systems and solutions that meet the most demanding requirements for the transportation and defense markets
FY16 Sales $586.4M 56% Services 44% Products
FY16 Sales $864.2M 45% Services 55% Products
NYSE: CUB
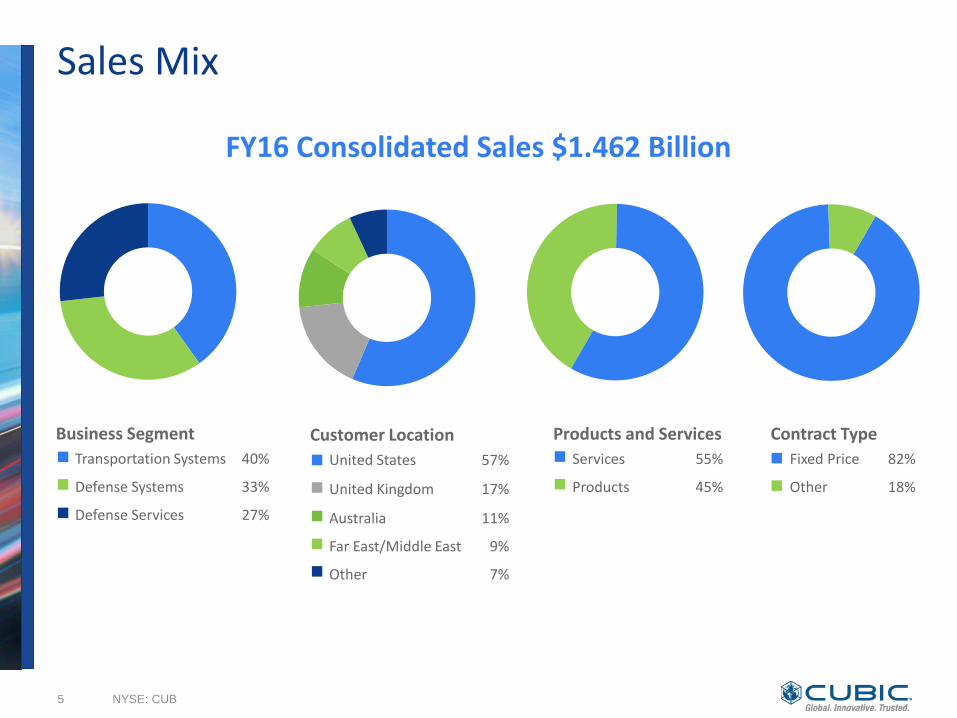
Sales Mix
Products and Services
Services 55%
Products 45%
Customer Location
United States 57%
United Kingdom 17%
Australia 11%
Far East/Middle East 9%
Other 7%
Contract Type
Fixed Price 82%
Other 18%
FY16 Consolidated Sales $1.462 Billion
Business Segment
Transportation Systems 40%
Defense Systems 33%
Defense Services 27%
5

Strategy Update GOAL 2020
By Winning the Customer, we are targeting $2B+ with 10%+ EBITDA margin, growing 10%+ year-on-year
Strategic focus areas for growth are: NextCity, C4ISR, and NextTraining
Improving productivity and efficiency through One Cubic initiatives, which will result in increased profitability
STRATEGIC OBJECTIVES STATUS UPDATE
WINNING THE CUSTOMER
Provide superior solutions, spurred by innovation and ultimate customer focus
BUILDING NEXTCITY GLOBALLY
Expand from mass transit fare collection to smart mobility information & payments provider
GROWING C4ISR BUSINESS
Expand from secure communications to expeditionary communications leader
BUILDING NEXTTRAINING GLOBALLY
Provide innovative, integrated LVC-G solutions to enable performance-based training
LIVING ONE CUBIC
Rebuild infrastructure that is scalable, efficient and effective; share technology, processes & people
6 NYSE: CUB
Leveraging OneAccount in many cities around the world Submitted NYC bid with Cubic customer TfL as a partner Won TfL asset management services for bike-sharing scheme Opened London Innovation Centre
Establishing expeditionary communications leadership
position; multiple awards for GATR and TeraLogics Working to transition T2C2 program to full-rate production HALO R&D contract
Shifting to Performance-Based Training Naval game-based training advantage with LCS LVC Air Combat Training edge with AFRL contract Providing live training on JSF; won SOF re-compete
Successful ERP roll-out in 10/16; complete by early FY18 Decreased supply chain vendors by half – savings started Singapore Thomson-East Coast line win due to One Cubic
(sharing of expertise across Defense and Transportation)
Innovation Blue Ribbon award for LVC Military Training Innovation award for Chicago Ventra app (1M downloads) Multiple innovation awards for NextAgent
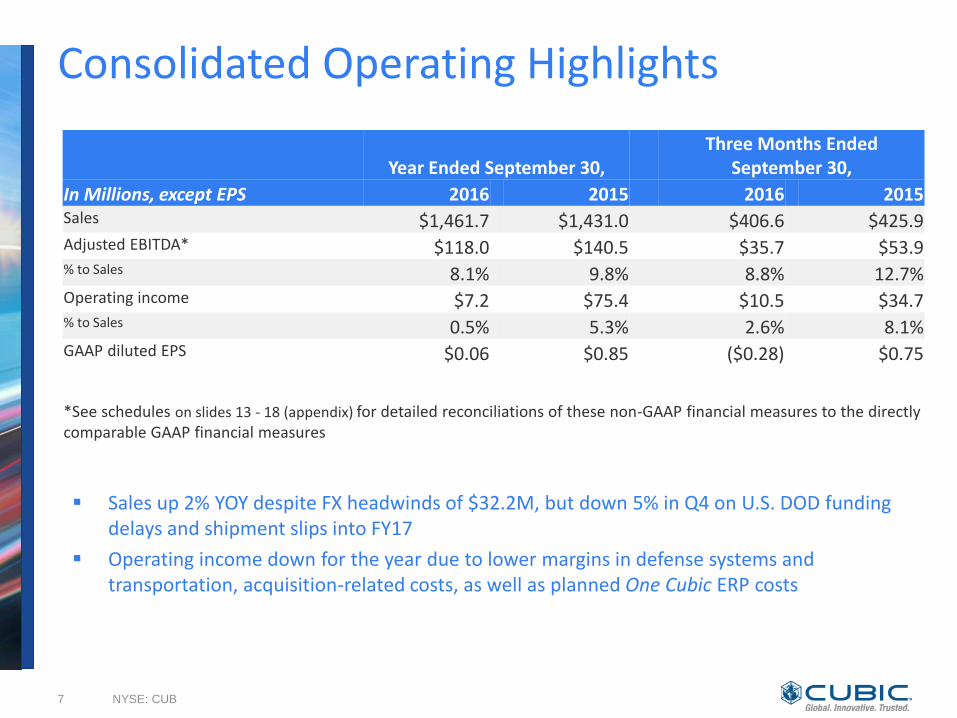
Consolidated Operating Highlights
Sales up 2% YOY despite FX headwinds of $32.2M, but down 5% in Q4 on U.S. DOD funding delays and shipment slips into FY17
Operating income down for the year due to lower margins in defense systems and transportation, acquisition-related costs, as well as planned One Cubic ERP costs
7
Year Ended September 30, Three Months Ended
September 30,
In Millions, except EPS 2016 2015 2016 2015 Sales $1,461.7 $1,431.0 $406.6 $425.9 Adjusted EBITDA* $118.0 $140.5 $35.7 $53.9 % to Sales 8.1% 9.8% 8.8% 12.7% Operating income $7.2 $75.4 $10.5 $34.7 % to Sales 0.5% 5.3% 2.6% 8.1% GAAP diluted EPS $0.06 $0.85 ($0.28) $0.75
*See schedules on slides 13 - 18 (appendix) for detailed reconciliations of these non-GAAP financial measures to the directly comparable GAAP financial measures
NYSE: CUB
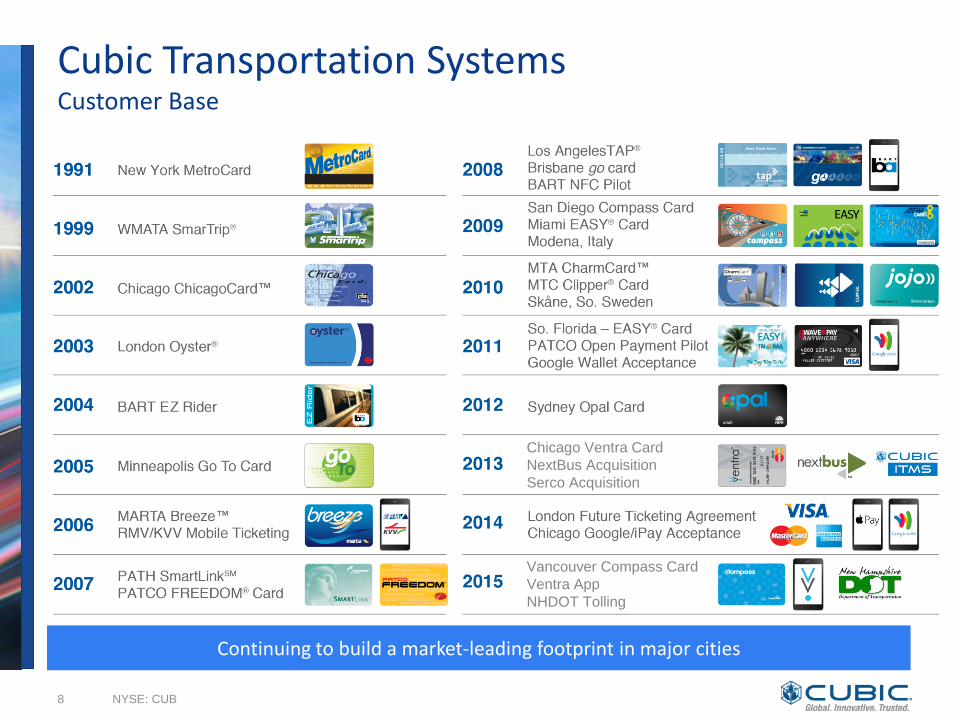
Chicago Ventra Card
NextBus Acquisition
Serco Acquisition
Vancouver Compass Card
Ventra App
NHDOT Tolling
Continuing to build a market-leading footprint in major cities
Cubic Transportation Systems Customer Base
NYSE: CUB 8

Cubic Transportation Systems NextCity Strategy
NYSE: CUB 9

Cubic Transportation Systems
NYSE: CUB 10
CTS sales were higher due to increased North American product and service sales , offset by lower U.K. sales and FX headwinds of $28.5M
Operating income was lower due to expected decrease in profits in the U.K., higher R&D spend and FX headwinds of $3.9M, somewhat offset by higher profits in the U.S. and Australia
R&D ramped up by $5M YOY to accelerate NextCity transportation technologies
Backlog was $1.793B compared to $1.894B last year; negatively impacted by $95M of FX headwinds
Year Ended September 30, Three Months Ended September 30,
In Millions, except EPS 2016 2015 2016 2015
Sales $586.4 $566.8 $155.9 $155.2 Operating Income $57.5 $75.9 $13.7 $25.1 Adjusted EBITDA $67.6 $87.3 $16.7 $27.6 Adjusted EBITDA Margin 11.5% 15.4% 10.7% 17.8%
*See schedules on slides 13-18 (appendix) for detailed reconciliations of these non-GAAP financial measures to the directly comparable GAAP financial measures

Live Training
Full range of military operations
essential for readiness Air combat training systems Laser engagement
simulation system Ground combat training
centers
Cubic Global Defense Systems Business Areas
11
Virtual Skills Training
A realistic operational
environment in a virtual scenario Small arms engagement
skills trainers Mine Resistant Ambush
Protected (MRAP) Vehicle Trainer
Game-Based Immersive Training
Cost-effective interactive education and training
Game-based courseware Mission Bay Trainer/Littoral
Combat Ships
Future
NextTraining – applying the most effective training technologies to increase our customers’ readiness
Stable U.S. and expanding overseas markets
Growing market for realistic, additive, cost-effective training
C4ISR
Reliable end-to-end solutions
Secure wideband
data links Personnel locator
system SIGINT receivers Tactical networking Cross domain Full motion video SATCOM
NYSE: CUB

Cubic Global Defense Systems C4ISR Portfolio
Revolutionary ultra- portable inflatable
communications terminals
Patented technology Strategic contract
vehicles
NYSE: CUB 12
DTech Labs Tactical Communications
[acquired 12.16.2014]
Deployable and tactical ruggedized communications
Established supplier for
- Special Operations
Command (SOCOM)
- U.S. Marine Corps
- Other government and
commercial customers
Real time processing,
exploitation and
dissemination of full
motion video in the cloud
Company developed
proprietary technology
Domain expertise in
secure video delivery
and exploitation
Strategic contract vehicles
TeraLogics Full Motion Video [acquired 12.21.2015]
+ GATR Technologies SATCOM Solutions
[acquired 02.03.2016]
+
High-speed, wideband data
links for
Intelligence, Surveillance
and Reconnaissance (ISR)
data and video
Air- and ground-based
terminals include
- Ships
- UAVs
- Man portable
- Surface
Data Links ISR Data Links [legacy business]
+
Established leadership position in expeditionary communications High growth, higher margin market

Cubic Global Defense Systems
13
Sales increased 5% YOY on recent acquisitions and higher air combat shipments, somewhat offset by lower ground training, datalink and DTECH sales (funding delays)
Operating income impacted by $32.7M of acquisition-related costs
Adjusted EBITDA was 8.2% compared to 10.2% last year, reflecting lower sales on high margin DTECH products, as well as lower ground profits due to cost growth
Backlog was $576.8M compared to $595.7M last year due to lower air and ground training work, somewhat offset by recent acquisitions
NYSE: CUB
Year Ended September 30, Three Months Ended September 30,
In Millions, except EPS 2016 2015 2016 2015
Sales $484.2 $462.1 $152.9 $166.9 Operating Income (Loss) $(17.1) $18.4 $6.6 $15.6 Adjusted EBITDA $39.7 $47.3 $16.5 $24.8 Adjusted EBITDA Margin 8.2% 10.2% 10.8% 14.9%
*See schedules on slides 13-18 (appendix) for detailed reconciliations of these non-GAAP financial measures to the directly comparable GAAP financial measures
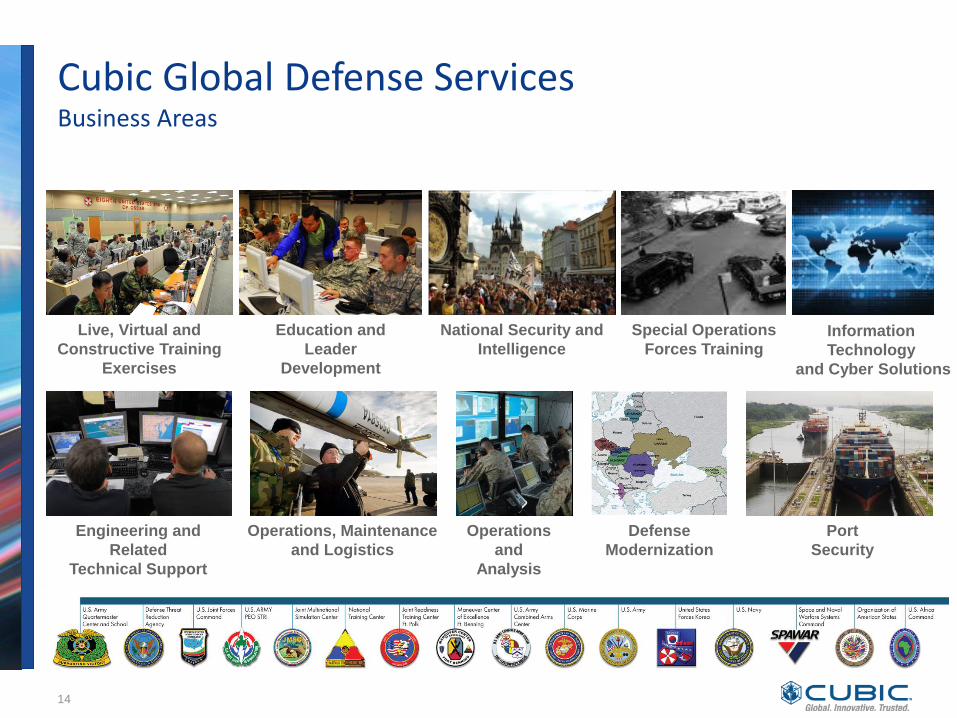
Cubic Global Defense Services Business Areas
14
Live, Virtual and
Constructive Training
Exercises
Information
Technology
and Cyber Solutions
Operations, Maintenance
and Logistics
Engineering and
Related
Technical Support
Education and
Leader
Development
Operations
and
Analysis
Defense
Modernization
Port
Security
National Security and
Intelligence
Special Operations
Forces Training

FY17 Guidance
15 NYSE: CUB
Strong organic growth expected in defense systems in FY17 in the C4ISR Mission Solutions portfolio transportation growth tied to winning NYC and growth of open payment markets
Constructively cautious on defense services business given election changes
Expect good rebound in profitability on less ERP spend and legacy acquisition cost somewhat offset by higher R&D spend
Higher R&D spend tied to next generation technologies and pre-award spend on pivotal contracts in both defense systems and transportation
1 FY17 Guidance assumes no new M&A activity. Key foreign exchange rates used in this forecast compared to the U.S. dollar are as follows: British pound – 1.22; Australian dollar – .76; New Zealand dollar – .72. 2 Adjusted EBITDA assumes add back of estimated $35 - $45 million (~$10M capitalized) of costs related to strategic investment in ERP and $8 - $12 million of legacy acquisition-related expenses. 3 Guidance as of 11.21.2016
FY17 Guidance3
Total Sales1 (constant currency) $1.505B to $1.555B
Operating Income $30M to $50M
EBITDA $80M to $100M
Adjusted EBITDA2 $120M to $140M 8.0% to 9.0% of Sales
GAAP EPS $0.40 to $0.80
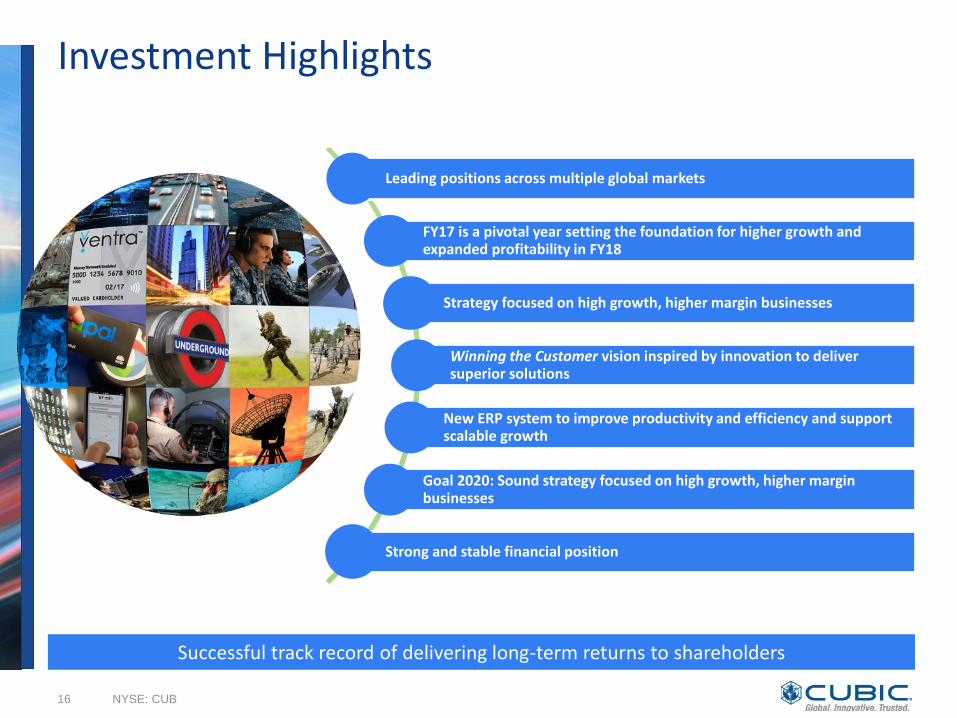
Investment Highlights
16
Leading positions across multiple global markets
FY17 is a pivotal year setting the foundation for higher growth and expanded profitability in FY18
Strategy focused on high growth, higher margin businesses
Winning the Customer vision inspired by innovation to deliver superior solutions
New ERP system to improve productivity and efficiency and support scalable growth
Goal 2020: Sound strategy focused on high growth, higher margin businesses
Strong and stable financial position
Successful track record of delivering long-term returns to shareholders
NYSE: CUB

GAAP to Non-GAAP Reconciliation Earnings before interest, taxes, depreciation and amortization (EBITDA) and Adjusted EBITDA Year Ended September 30, 2016
17 NYSE: CUB
1 Includes transaction costs, retention bonuses and earn out liability changes related to acquired businesses.
In Millions Consolidated CTS CGD Systems CGD Services
Year Ended Sep 30, 2016 Net income attributable to Cubic $ 1.7 Provision for income taxes (9.2) Interest expense (income), net 9.7 (1.2) $ - $ (0.1)
Other non-operating expense (income), net 5.0 0.4 $ 0.6 $ -
Operating Income (loss) $ 7.2 $ 57.5 $ (17.1) $ 11.2
Depreciation and amortization 45.5 8.2 28.7 5.2
Other non-operating expense (income), net (5.0) (0.4) (0.6) -
EBITDA $ 47.7 $ 65.3 $ 11.0 $ 16.4
Acquisition related expenses, excluding amortization 1 28.7 0.9 27.8 -
ERP/Supply Chain Initiatives 34.8 - - -
Restructuring costs 1.8 1.0 0.3 0.5 Other non-operating expense (income), net 5.0 0.4 0.6 -
Adjusted EBITDA $ 118.0 $ 67.6 $ 39.7 $ 16.9
EBITDA Margin 3.3% 11.1% 2.3% 4.2%
Adjusted EBITDA Margin 8.1% 11.5% 8.2% 4.3%
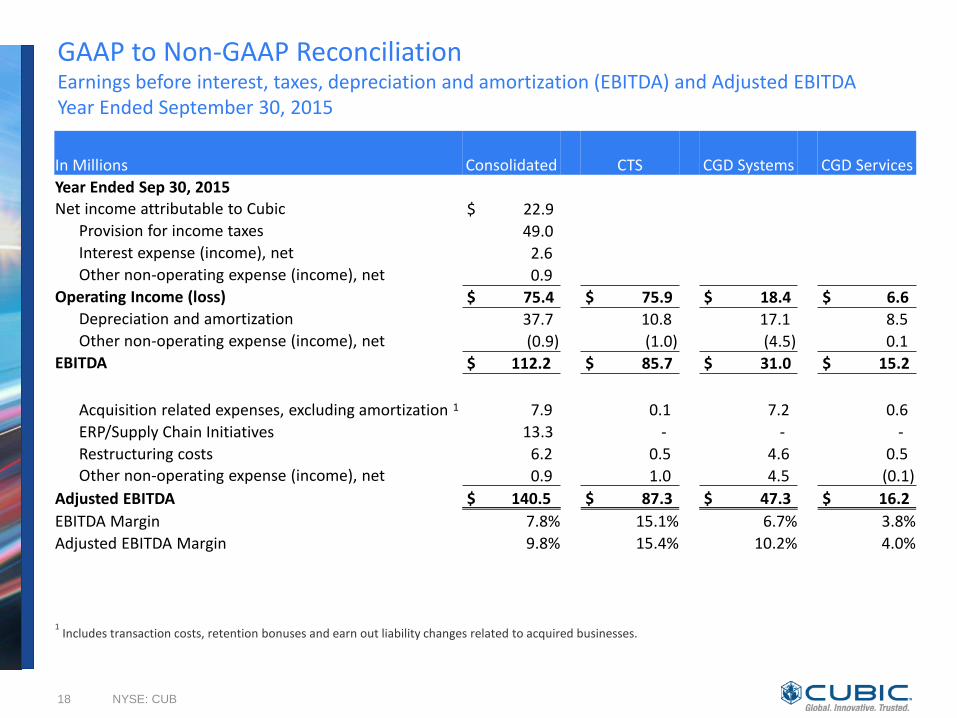
GAAP to Non-GAAP Reconciliation Earnings before interest, taxes, depreciation and amortization (EBITDA) and Adjusted EBITDA Year Ended September 30, 2015
18 NYSE: CUB
1 Includes transaction costs, retention bonuses and earn out liability changes related to acquired businesses.
In Millions Consolidated CTS CGD Systems CGD Services
Year Ended Sep 30, 2015 Net income attributable to Cubic $ 22.9 Provision for income taxes 49.0 Interest expense (income), net 2.6 (1.2) (0.4) - Other non-operating expense (income), net 0.9 1.0 4.5 (0.1) Operating Income (loss) $ 75.4 $ 75.9 $ 18.4 $ 6.6
Depreciation and amortization 37.7 10.8 17.1 8.5
Other non-operating expense (income), net (0.9) (1.0) (4.5) 0.1
EBITDA $ 112.2 $ 85.7 $ 31.0 $ 15.2
Acquisition related expenses, excluding amortization 1 7.9 0.1 7.2 0.6
ERP/Supply Chain Initiatives 13.3 - - -
Restructuring costs 6.2 0.5 4.6 0.5
Other non-operating expense (income), net 0.9 1.0 4.5 (0.1)
Adjusted EBITDA $ 140.5 $ 87.3 $ 47.3 $ 16.2
EBITDA Margin 7.8% 15.1% 6.7% 3.8%
Adjusted EBITDA Margin 9.8% 15.4% 10.2% 4.0%
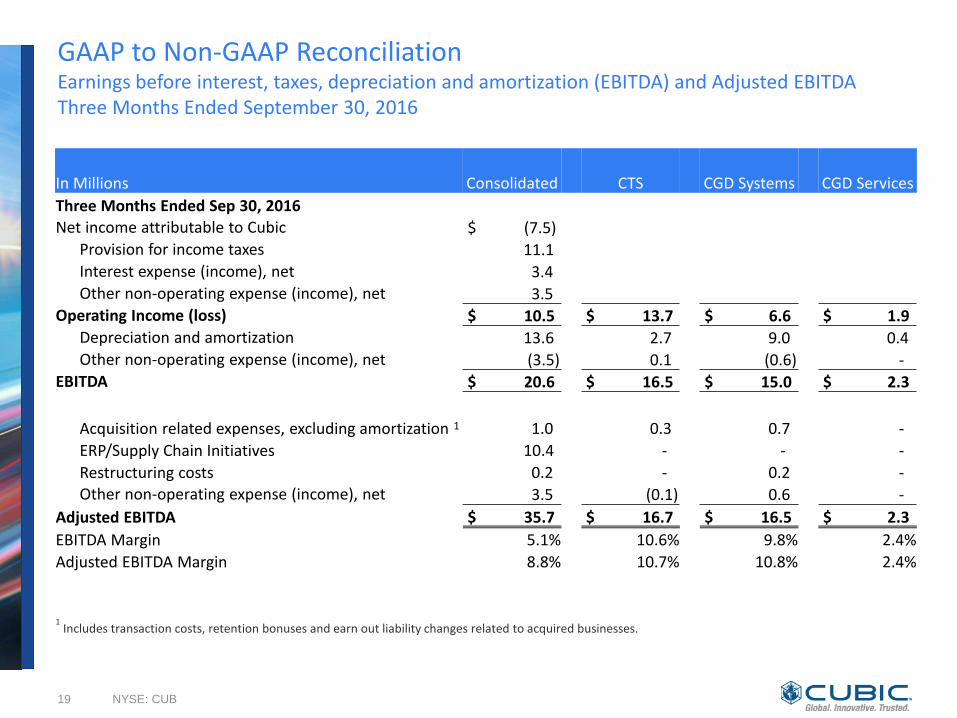
GAAP to Non-GAAP Reconciliation Earnings before interest, taxes, depreciation and amortization (EBITDA) and Adjusted EBITDA Three Months Ended September 30, 2016
19 NYSE: CUB
1 Includes transaction costs, retention bonuses and earn out liability changes related to acquired businesses.
In Millions Consolidated CTS CGD Systems CGD Services
Three Months Ended Sep 30, 2016
Net income attributable to Cubic $ (7.5)
Provision for income taxes 11.1
Interest expense (income), net 3.4 (0.2) - (0.1)
Other non-operating expense (income), net 3.5 (0.1) 0.6 - Operating Income (loss) $ 10.5 $ 13.7 $ 6.6 $ 1.9 Depreciation and amortization 13.6 2.7 9.0 0.4 Other non-operating expense (income), net (3.5) 0.1 (0.6) -
EBITDA $ 20.6 $ 16.5 $ 15.0 $ 2.3
Acquisition related expenses, excluding amortization 1 1.0 0.3 0.7 -
ERP/Supply Chain Initiatives 10.4 - - -
Restructuring costs 0.2 - 0.2 -
Other non-operating expense (income), net 3.5 (0.1) 0.6 -
Adjusted EBITDA $ 35.7 $ 16.7 $ 16.5 $ 2.3
EBITDA Margin 5.1% 10.6% 9.8% 2.4%
Adjusted EBITDA Margin 8.8% 10.7% 10.8% 2.4%
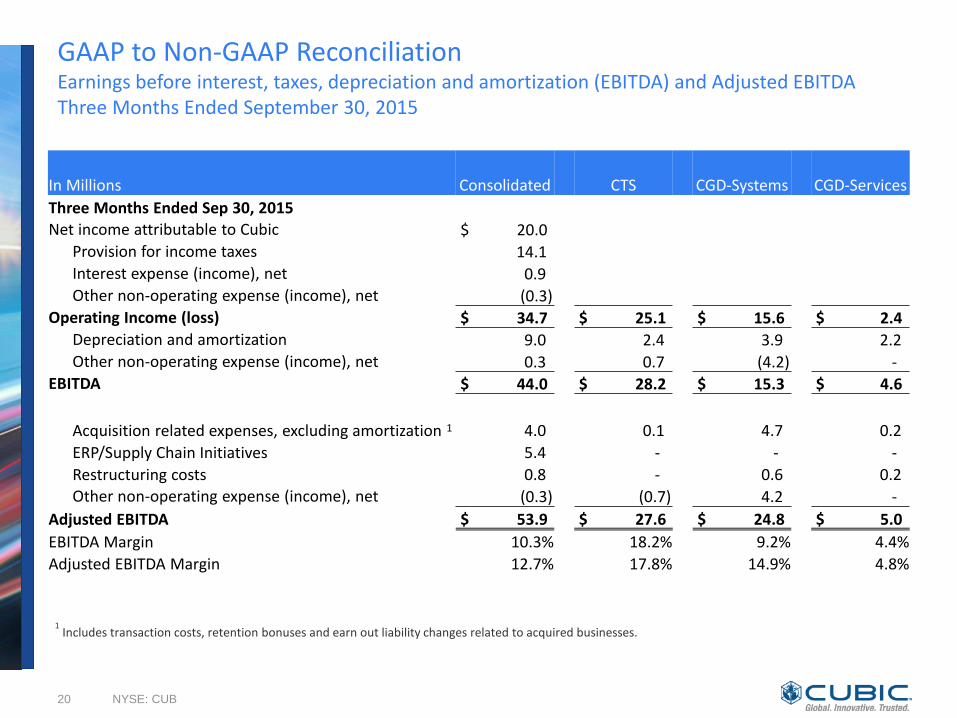
GAAP to Non-GAAP Reconciliation Earnings before interest, taxes, depreciation and amortization (EBITDA) and Adjusted EBITDA Three Months Ended September 30, 2015
NYSE: CUB 20
1 Includes transaction costs, retention bonuses and earn out liability changes related to acquired businesses.
In Millions Consolidated CTS CGD-Systems CGD-Services
Three Months Ended Sep 30, 2015
Net income attributable to Cubic $ 20.0
Provision for income taxes 14.1
Interest expense (income), net 0.9 (0.4) (0.2) - Other non-operating expense (income), net (0.3) (0.7) 4.2 - Operating Income (loss) $ 34.7 $ 25.1 $ 15.6 $ 2.4 Depreciation and amortization 9.0 2.4 3.9 2.2 Other non-operating expense (income), net 0.3 0.7 (4.2) - EBITDA $ 44.0 $ 28.2 $ 15.3 $ 4.6
Acquisition related expenses, excluding amortization 1 4.0 0.1 4.7 0.2
ERP/Supply Chain Initiatives 5.4 - - -
Restructuring costs 0.8 - 0.6 0.2 Other non-operating expense (income), net (0.3) (0.7) 4.2 -
Adjusted EBITDA $ 53.9 $ 27.6 $ 24.8 $ 5.0
EBITDA Margin 10.3% 18.2% 9.2% 4.4%
Adjusted EBITDA Margin 12.7% 17.8% 14.9% 4.8%
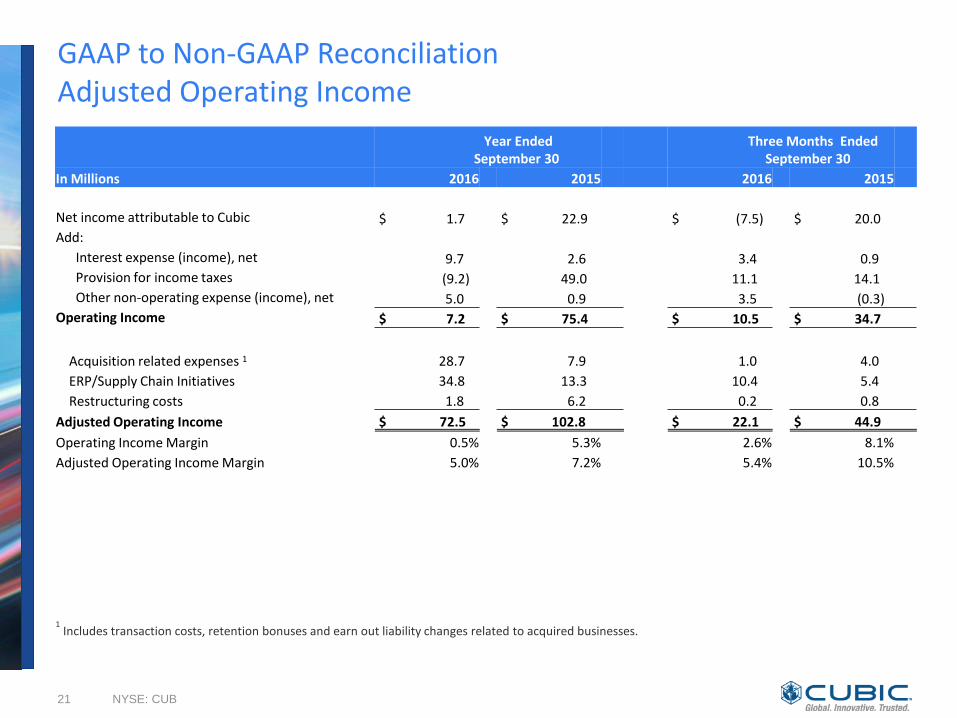
GAAP to Non-GAAP Reconciliation Adjusted Operating Income
21 NYSE: CUB
Year Ended
September 30 Three Months Ended
September 30
In Millions 2016 2015 2016 2015
Net income attributable to Cubic $ 1.7 $ 22.9 $ (7.5) $ 20.0
Add:
Interest expense (income), net 9.7 2.6 3.4 0.9
Provision for income taxes (9.2) 49.0 11.1 14.1
Other non-operating expense (income), net 5.0 0.9 3.5 (0.3)
Operating Income $ 7.2 $ 75.4 $ 10.5 $ 34.7
Acquisition related expenses 1 28.7 7.9 1.0 4.0
ERP/Supply Chain Initiatives 34.8 13.3 10.4 5.4
Restructuring costs 1.8 6.2 0.2 0.8
Adjusted Operating Income $ 72.5 $ 102.8 $ 22.1 $ 44.9
Operating Income Margin 0.5% 5.3% 2.6% 8.1%
Adjusted Operating Income Margin 5.0% 7.2% 5.4% 10.5%
1 Includes transaction costs, retention bonuses and earn out liability changes related to acquired businesses.
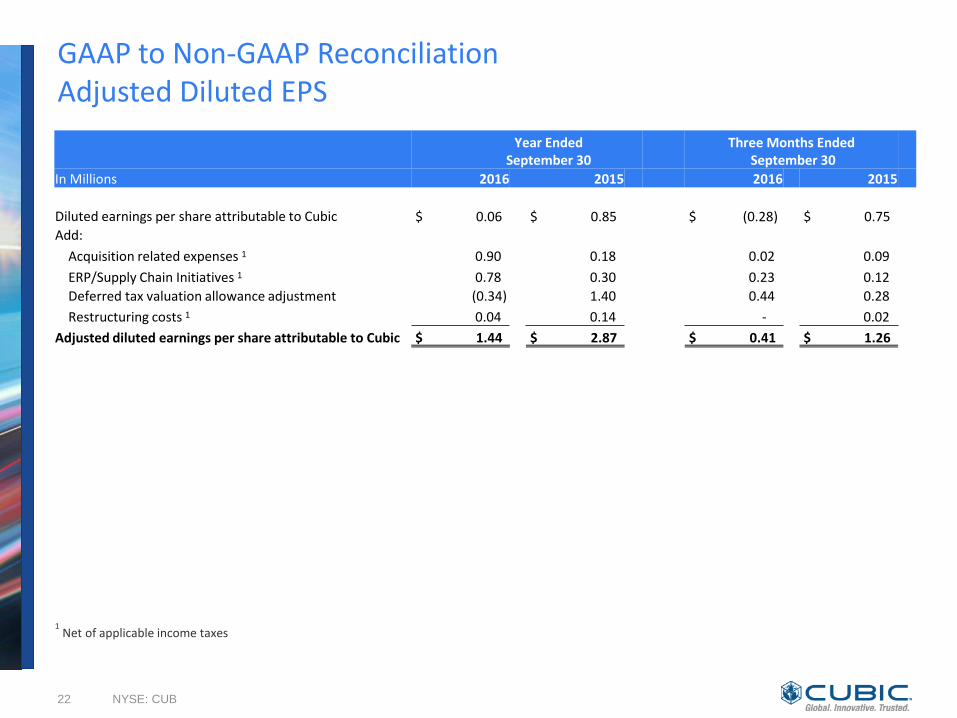
GAAP to Non-GAAP Reconciliation Adjusted Diluted EPS
22 NYSE: CUB
Year Ended
September 30 Three Months Ended
September 30
In Millions 2016 2015 2016 2015
Diluted earnings per share attributable to Cubic $ 0.06 $ 0.85 $ (0.28) $ 0.75
Add:
Acquisition related expenses 1 0.90 0.18 0.02 0.09
ERP/Supply Chain Initiatives 1 0.78 0.30 0.23 0.12
Deferred tax valuation allowance adjustment (0.34) 1.40 0.44 0.28
Restructuring costs 1 0.04 0.14 - 0.02
Adjusted diluted earnings per share attributable to Cubic $ 1.44 $ 2.87 $ 0.41 $ 1.26
1 Net of applicable income taxes