credit suisse international annual report 2016 panel on takeovers and mergers, member tuck european...
TRANSCRIPT

Credit Suisse International
Annual Report 2014
Credit Suisse International Annual Report 2016


1Credit Suisse International, Annual Report 2016
Credit Suisse International
Credit Suisse InternationalAnnual Report 2016
Copyright © 2016 Credit Suisse group. All rights reserved.
Board of Directors as at 30 March 2017
Noreen Doyle (Chair and Independent Non-Executive)
David Mathers (CEO)
Alison Halsey (Independent Non-Executive)
Robert Endersby (Independent Non-Executive)
Robert Arbuthnott (CFO)
Christopher Horne
Paul Ingram (CRO)
Eraj Shirvani
Company Secretary
Paul E Hare
Company Registration Number 2500199

2
Noreen DoyleBorn 1949Irish and US Citizen
Non-Executive
Board member since 2011
Chair of the Board
Professional history
2011–present Credit Suisse International Credit Suisse Securities (Europe) Limited
Chair of the Board of Directors (2012-present)
Non-Executive Director (2011-present)
Chair of the Remuneration Committee (2014-present)
Chair of the Nomination Committee (2013-present)
Member of the Risk Committee (2013-present)
Member of the Audit Committee (2011-present)
2004–present Credit Suisse AG & Credit Suisse Group AG
Member of the Board of Directors (2004-present)
Vice-Chair and Lead Independent Director of the Board of Directors (2014-present)
Member of the Chairman’s and Governance Committee (2014-present)
Member of the Risk Committee (2004-2007; 2009-2014; 2016-present)
Member of the Audit Committee (2007-2009; 2014-2016)
1992-2005 European Bank for Reconstruction (EBRD)
First vice president and head of banking (2001-2005)
Deputyvicepresidentfinanceanddirectorofriskmanagement(1997-2001)
Chiefcreditofficeranddirectorofsyndications(1994-1997)
Head of syndications (1992-1994)
Prior to 1992 Bankers Trust Company, Houston, New York and London
Managing director, European Structured Sales (1990-1992)
Various positions at management level
Education
1974 MBA in Finance, Tuck at Dartmouth College, New Hampshire
1971 BA in Mathematics, The College of Mount Saint Vincent, New York
Other activities and functions
Newmont Mining Corporation, chair of the board of directors, member of the audit committee
British Bankers’ Association (BBA), chair
UK Panel on Takeovers and Mergers, member
Tuck European Advisory Board, member
Marymount International School, London, chair of the board of governors
Sarita Kenedy East Foundation, trustee
NewTA Limited, director
David R. MathersBorn 1965British Citizen
Board member since 2016
Chief Executive Officer
Professional history
2005–present Credit Suisse International Credit Suisse Securities (Europe) Limited
Executive Director (2016-present; 2005-2006)
CEO (2016-present)
Alternate Director of the Board of Directors (2005)
1998–present Credit Suisse AG & Credit Suisse Group AG
Chairman of Strategic Resolution Oversight Board (2015-present)
Member of the Executive Board (2010-present)
ChiefFinancialOfficer(2010-present)
Head of IT and Operations AG (2012-2015)
Head of Finance and COO of Investment Banking (2007-2010)
Senior positions in Credit Suisse’s Equity business, including Director of European Research and Co-Head of European Equities (1998-2007)
Prior to 1998 HSBC
Global head of equity research (1997 – 1998)
Research analyst, HSBC James Capel (1987 – 1997)
Education
1991 MA in Natural Sciences, University of Cambridge, England
1987 BA in Natural Sciences, University of Cambridge, England
Other activities and functions
European CFO Network, member
Women in Science & Engineering (WISE) program and academic awards and grants at Robinson College, Cambridge, sponsor

3Credit Suisse International, Annual Report 2016
Credit Suisse International
Alison HalseyBorn 1956British Citizen
Non-Executive
Board member since 2015
Professional history
2015–present Credit Suisse International Credit Suisse Securities (Europe) Limited
Non-Executive Director (2015-present)
Chair of the Audit Committee (2015-present)
Member of the Risk Committee (2015-present)
Member of the Nomination Committee (2015-present)
Member of the Remuneration Committee (2015-present)
Co-chairoftheConflictsCommittee(2016-present)
2011–present Super Duper Family LLP
Managing Partner
1977 – 2011 KPMG
Global Lead Partner (2002-2011)
UK Head of Financial Services (2001-2004)
Audit Partner, Financial Services (1991-2001)
Secondment, Assistant Commissioner, Building Societies Commission (1989-1991)
Senior Manager, Specialist Banking Department (1986-1989)
Education
1980 UK FCA, Institute of Chartered Accountants in England and Wales
1977 BA in French, King’s College, London
Other activities and functions
Cambian Group plc, Non-executive Director, Chair of the Audit & Risk Committee and Member of the Nomination and Remuneration Committees
Provident Financial Group plc, Non-executive Director, Chair of the Audit Committee, and Member of the Nomination, Remuneration and Risk Advisory Committees
Aon UK Limited, Non-executive Director, Member of the Risk & Compliance and Nominations Committees and Chair of the Audit Committee
Robert EndersbyBorn 1959British Citizen
Non-Executive
Board member since 2016
Professional history
2016–present Credit Suisse International Credit Suisse Securities (Europe) Limited
Non-Executive Director (2016-present)
Chair of the Risk Committee (2016-present)
Member of the Audit Committee (2016-present)
Member of the Nomination Committee (2016-present)
Member of the Remuneration Committee (2016-present)
Co-ChairoftheConflictsCommittee(2016-present)
2012 – 2014 Danske Bank Group
ChiefRiskOfficer&MemberofExecutiveBoard
Chair of Executive Risk Committee
Chair of Group Liquidity Risk Committee
2011 – 2012 Royal Bank of Scotland plc
ChiefOperatingOfficer,GroupCreditRisk
2006 – 2010 Barclays Bank plc
Commercial Credit Risk Director, Global Retail & Commercial Banking
Group Wholesale Credit Risk Director
Education
1982 BA in Social Science (Economics), University of the West of England
Other activities and functions
Tesco Personal Finance Group Limited and
Tesco Personal Finance Plc, Non-executive Director, Chair of Risk Committee, Member of Audit Committee, Remuneration Committee and Disclosure Committee

4
Robert K. ArbuthnottBorn 1968British Citizen
Board member since 2016
Chief Financial Officer
Professional history
2015–present Credit Suisse International Credit Suisse Securities (Europe) Limited
Executive Director (2016-present)
Managing Director, Regional CFO for UK Regulated Entities, Chairman of the UK Pension Committee (2015-2016)
Member of the Board of Directors of Credit Suisse Investments (UK) and Credit Suisse Investment Holdings (UK) (2016-present)
2007 – 2015 Barclays, Singapore
Head of India Finance Shared Services (2014-2015)
CFOAsiaPacific,Singapore(2008-2014)
Regional Head of Product Control, Singapore (2007-2008)
2000 – 2007 Merrill Lynch, Japan and UK
CFO EMEA Credit, Mortgages, Real Estate, Private Equity, London (2006-2007)
CFO FICC Asia, Tokyo (2005-2006)
Head of Rates ISS, Tokyo (2002-2004)
Finance Risk Management FICC, Tokyo (2000-2002)
1997 – 2000 Salomon Brothers, London
Head of Product Control for Structured Credit EMEA
1995 – 1997 BZW, London
Fixed Income Salesman
1994 – 1995 Goethe Institute, Germany
1993 – 1994 LIFFE, London
Market Supervision Division
1990 – 1993 KPMG, London
Accountant
Education
1993 UK ACA, Institute of Chartered Accountants in England and Wales
1989 Master of Arts, Cambridge University
1986 Lancing College
Other activities and functions
Parrish Solutions Ltd BVI, Director and advisory board member
Tanglin Trust School, Director and advisory board member
Christopher G. B. HorneBorn 1964British Citizen
Board member since 2015
Professional history
1997–present Credit Suisse International Credit Suisse Securities (Europe) Limited
Executive Director (2015-present; 2010-2011)
Chair of the Disclosure Committee (2015-present)
Alternate Director of the Board of Directors (2008)
Deputy CEO (2015-present)
Branch Manager, Credit Suisse AG, London Branch (2015-present)
Member of the Board of Directors of Credit Suisse Investments (UK) and Credit Suisse Investment Holdings (UK) (2014-present)
Deputy Head of the European Investment Banking Department (2014-2015)
Global COO of the Investment Banking Department (2009-2014)
Europe COO of the Investment Banking Department (2005-2008)
Managing Director, Global Mergers and Acquisitions Group (2004-2005)
Co-head of Corporate Advisory & Finance within the Global Industrial & Services team in Europe (2001-2004)
Credit Suisse First Boston‘s European Mergers & Acquisitions Department and European Corporate Advisory & Finance team (1997-2000)
1990 – 1997 BZW, London
Investment Banker
1986 – 1990 Deloitte Haskins & Sells, London
Accountant
Education
1989 UK ACA, Institute of Chartered Accountants in England and Wales
1986 BSc Honours, Chemistry, Durham University
Other activities and functions
British Bankers Association Board, member

5Credit Suisse International, Annual Report 2016
Credit Suisse International
Paul R. IngramBorn 1963British Citizen
Board member since 2015
Chief Risk Officer
Professional history
2013–present Credit Suisse International Credit Suisse Securities (Europe) Limited
Executive Director (2015-present)
ChiefRiskOfficer(2013-present)
2009 – 2013 RBS Group
Investment Banker
Global Head of Market Risk and Insurance Risk
1994 – 2008 HSBC Group
Global Head of Market Risk and Traded Credit Risk (2001-2008)
HeadofFinance,Operations&Risk,AsiaPacific(exHongKong), Hong Kong (1998-2001)
Country CFO & Branch Manager Midland Bank Japan, Tokyo (1995-1998)
Head of Markets Product Control & Risk Projects, New York (1994-1995)
1987 – 1994 Samuel Montagu & Co
Various Markets roles
1985 – 1987 LittleJohn Fraser
Audit & Consultancy
Education
1985 BA Honours Economics, University of Essex
Eraj ShirvaniBorn 1966British, American and Iranian Citizen
Board member since 2016
Professional history
1988–present Credit Suisse International Credit Suisse Securities (Europe) Limited
Executive Director (2016-present; 2010-2011)
Alternate Director (2008)
Global Head of Solutions & Head of Fixed Income EMEA (2016-present)
Member of the Management Committee of Credit Suisse AG, London Branch (2010-2011)
Global Head of Emerging Markets Group & Head of Fixed Income EMEA (2015-2016)
Co-Head of Global Credit Products & Head of Fixed Income EMEA (2011-2015)
Head, European Credit Products (2006-2009)
Head,European&PacificCreditSales&Trading(2000-2006)
Head of European Credit Trading (1998-2000)
Various Positions in US Credit Trading (1990-1998)
Investment Banking Analyst Program Participant (1988-1990)
Education
1994 MBA, Columbia University
1988 BA in International Relations & French, University of Pennsylvania
Other activities and functions
GFMA, Board Member
AFME, Board Member
Royal National Children’s Foundation, Trustee
GuardTime Holdings Pte Ltd, Director/Advisory Board Member

6
Strategic Report for the year ended 31 December 2016The Directors present their Annual Report and the Consolidated Financial Statements for the Year ended 31 December 2016.
BUSINESS REVIEWProfileCredit Suisse International (‘CSi’ or ‘Bank’) is a bank domiciled in the United Kingdom. CSi together with its subsidiaries is referred to as the ‘CSi group’. The Financial Statements are presented in United States Dollars (‘USD’), which is the functional currency of the Bank and in accordance with International Financial Reporting Standards (‘IFRS’).
CSi is a global market leader in over-the-counter (‘OTC’) deriv-ative products with respect to counterparty service, innovation, product range and geographic scope of operations. CSi offers a range of interest rate, currency, equity and credit-related OTC derivatives and certain securitised products. CSi’s business is pri-mary client-driven, focusing on transactions that address the broad financing,riskmanagementandinvestmentconcernsofitsworld-wide client base. CSi enters into derivative contracts in the normal course of business for market-making, as well as for risk manage-ment needs, including mitigation of interest rate, foreign currency and credit risk.
CSi is an unlimited company and an indirect wholly owned sub-sidiary of Credit Suisse Group AG (‘CSG’). CSi is authorised under the amended Financial Services and Markets Act 2000 by the Prudential Regulation Authority (‘PRA’) and regulated by the Financial Conduct Authority (‘FCA’) and the PRA.
The Bank has branch operations in Dublin, Milan, Madrid, Sweden and Amsterdam. The Bank also maintains representation officesinHongKong,GenevaandZurich.
CSG, a company domiciled in Switzerland, is the ultimate par-ent of a worldwide group of companies (collectively referred to as
the ‘CSgroup’).CSGprepares financial statementsunderUSGenerally Accepted Accounting Principles (‘US GAAP’). These accounts are publicly available and can be found at www.credit-su-isse.com.
Asaleadingfinancialservicesprovider,CSgroupiscommittedtodelivering its combinedfinancial experienceandexpertise tocorporate, institutional and government clients and high-net-worth individuals worldwide, as well as to retail clients in Switzerland. CS group serves its diverse clients through three regionally focused divisions: Swiss Universal Bank, International Wealth Management andAsiaPacific.Theseregionalbusinessesaresupportedbytwodivisions specialising in investment banking capabilities: Global Markets and Investment Banking & Capital Markets. The Strategic Resolution Unit consolidates the remaining portfolios from the for-mer non-strategic units plus additional businesses and positions thatdonotfitwithourstrategicdirection.Thesebusinessdivisionsco-operatecloselytoprovideholisticfinancialsolutions,includinginnovative products and specially tailored advice. Founded in 1856, CS group has a truly global reach today, with operations in over 50 countries and a team of more than 47,170 employees from approximately 150 different nations.
Management and governanceThe Board of Directors (‘Board’) is responsible for governance arrangements that ensure effective and prudent management of CSi, including the segregation of duties and the prevention of con-flictsofinterest.TheBoardapprovesandoverseestheimplemen-tation of strategic objectives, risk strategy and internal governance; ensurestheintegrityoftheaccountingandfinancialreportingsys-tems; oversees disclosure and communications processes; pro-vides effective oversight of senior management; and assesses the effectiveness of governance arrangements.
Members of the Board and Board Committees
Board member Audit Risk Nomination Remuneration Conflicts since Independence Committee Committee Committee Committee Committee
Noreen Doyle, Chair 2011 Independent Member Member Chair Chair -
Robert Endersby 2016 Independent Member Chair Member Member Co-chair
Alison Halsey 2015 Independent Chair Member Member Member Co-chair
Christopher Horne, Deputy CEO 2015 - - - - - -
Robert Arbuthnott 2016 - - - - - -
Paul Ingram, CRO 2015 - - - - - -
David Mathers, CEO 2016 - - - - - -
Eraj Shirvani 2016 - - - - - -
Stephen Dainton* 2016 - - - - - -
* Resigned as a member of the Board with effect from 26 January 2017.
Board and ManagementA number of management and governance changes have been effected during the year. Robert Endersby has been appointed as
an Independent Non-Executive Director and Chair of the Risk Committee. David Mathers, Robert Arbuthnott, Stephen Dainton and Eraj Shirvani have been appointed as Executive Directors.

7Credit Suisse International, Annual Report 2016
Strategic Report for the year ended 31 December 2016
Richard Thornburgh resigned as a Non-Executive Director and Stephen Dainton, Jason Forrester and David Livingstone have resigned as Executive Directors as a result of resignations from the Bank or changes in responsibilities.
The requirements of the PRA & FCA Senior Managers & Cer-tificationRegime (‘SMCR’)were implemented inCSiwitheffectfrom 07 March 2016. The SMCR framework seeks to increase individual accountability and enhance culture in Financial Services through: mandating the clear allocation of all activities, business areas and management functions of the in-scope legal entities to a small number of Senior Managers who are approved by the UK Regulators; identifying a set of functions that expose the in-scope legal entities to risk through their day-to-day activities and requir-ing that the staff performing these functions are captured as Cer-tifiedStaffandconfirmedannuallyas ‘Fit&Proper’;and imple-mentingandenforcingasetofConductRulesthatreflectthecorestandards expected of staff. The implementation of SMCR in CSi is alignedwith,andbuildson, thesignificantprogress thathasbeen made over the past three years in developing CSi’s gover-nance and culture.
Principal products/Principal product areasLast year, Credit Suisse announced the restructuring of the CS group, with the creation of a new regionally focused division, and the realignment of existing businesses/divisions; Global Markets announced a further restructuring in March 2016. This resulted in anumberofchangeswhichhavebeenreflectedinthestructureofCSi, and as a result, the CSi group now has six principal business lines: p Global Markets brings together equity sales and trading,
credit products and trading as well as structured lending and selected derivative capabilities to create a fully integrated fran-chise for clients. Global Markets provides a broad range of financialproductsandservicesofclientdrivenbusinessesandalso supports the CS group’s private banking businesses and their clients. The suite of products and services include global securities sales, trading and execution and comprehensive investmentresearch.Clientsincludefinancialinstitutions,cor-porations, governments and institutional investors, such as pension and hedge funds. The division consists of four sub-di-visions Equities, Credit, Solutions and Management.
p Within the Asia Pacificdivisionarangeoffinancialproductsand services is offered, focusing on corporates, and institu-tional clients. CSi delivers integrated client coverage to provide connectivityandaccesstobroaderfinancialmarkets,differen-tiatedproductofferings,andtailoredfinancingsolutions.Theinvestment banking business supports corporate clients by advising on all aspects of corporate sales and restructurings, divestitures and takeover defence strategies and provides equity and debt underwriting capabilities for entrepreneur, cor-porate and institutional clients. In addition, the business includesequitiesandfixedincomesalesandtradingservices,and provides access to a range of debt and equity securities, derivative products, and financing opportunities across the
capital spectrum for corporate, sovereign and institutional clients.
p The Investment Banking & Capital Markets division offers a broad range of investment banking products and services which includes advisory services related to M&A, divestitures, takeover defence, restructurings and spin-offs, as well as debt and equity underwriting of public offerings and private place-ments. Derivative transactions related to these activities are alsooffered.Clientsincludeleadingcorporations,andfinancialinstitutions. Investment banking capabilities are delivered through regional and local teams based in both major devel-oped and emerging market centres. An integrated business model enables the delivery of high value, customised solutions that leverage the expertise offered across Credit Suisse and that help clients to unlock capital and value in order to achieve their strategic goals.
p The Swiss Universal Bank division within CSi offers clients Sales and Trading Services in foreign exchange products as well as Emerging Local Market currency trading.
p The International Wealth Management division has a joint venture with Swiss Universal Bank offering Sales and Trading Services in foreign exchange products as well as Emerging Local Market currency trading.
p The Strategic Resolution Unit was created to facilitate the right-sizing of business divisions from a capital perspective and includes remaining portfolios from the former non-strategic units plus transfers of additional exposures from other busi-ness divisions. The Strategic Resolution Unit predominantly comprises derivative portfolios across interest rate and credit products. The portfolio includes a tail of long-dated trades, and spans both central counterparties (‘CCP’) and bilateral coun-terparties. The primary focus of the Strategic Resolution Unit (‘SRU’) is on facilitating the rapid wind-down of capital usage and costs in order to reduce the negative impact on the overall CSi group performance.
Economic environmentDuring2016thefinancialmarketswerevolatileandexperiencedfurther heightened uncertainty caused by a number of political developments. The UK’s decision to leave the European Union post the referendum in June 2016 and the US presidential election resultinNovember2016werekeydrivingfactorsbehindfinancialmarket moves globally.
The annual rate of Consumer Price Index (‘CPI’) inflationincreased to 1.6% at the end of December 2016 from 0.2% at the end of December 2015. In August 2016, the Bank of England (‘BOE’) announced additional measures to ease monetary policy by increasing the size of its asset purchase program and reducing the base interest rate to 0.25%. The unemployment rate dropped marginally to 4.8% at the end of December 2016 from 5.1% at the end of December 2015. Looking at 2016 as a whole, UK Gross Domestic Product (‘GDP’) growth slowed modestly to 2 percent from 2.2 percent in 2015. The European Central Bank (‘ECB’) announced further monetary easing measures at its March 2016

8
meeting, including cuts in all main interest rates, an increase in the asset purchase program and additional bank funding measures. Later in the year, the ECB announced its intention to scale back monthly asset purchases to EUR 60 billion beginning in April 2017. At its December 2016 meeting, the US Federal Reserve (‘Fed’) decided to raise the target range for the policy rate by 25 basis points. The weakest major currency in 2016 compared with theUSdollarwas theBritishpound,whichsignificantlydepreci-ated after the outcome of the UK referendum on EU membership in June.
At the beginning of 2016, major equity markets declined sharply due to the weaker than expected macroeconomic data in developed economies, economic growth concerns in China and low oil prices. Since the middle of February 2016, equity markets recovered supported by improved commodity markets and accom-modative monetary policies of major central banks. Towards the end of year, equity markets continued to move higher, driven by bettereconomicdataandtheexpectationsforfiscalstimulusintheUS under a new presidential administration. Among developed markets,CanadaandUKequitiesoutperformed,benefittingfromhigher commodity prices and a weaker currency, respectively, while Swiss and Japanese equities lagged behind.
Throughout the first half of the year, financial marketsbecame increasingly sensitive to expectations of the outcome of the UK referendum and following a perceived increase in the like-lihood of a leave vote in early June, the sterling exchange rate and short-term interest rates fell. The expectations for a broadly more accommodative stance of monetary policy from major cen-tral banks helped to reverse some of these moves. After the decline in the first half of the year, government bond yieldsincreased in the second half of 2016. UK government bond yields rose more than international equivalents following an increased perception among market participants that the UK’s future trade arrangements with the European Union may be less open than previously anticipated.
In September, the BOE commenced purchases of corporate bonds under the Corporate Bond Purchase Scheme (‘CBPS’). TheBankpurchasedGBP4billionoverthefirsttwomonthsof the scheme. Although sterling investment grade corporate bond spreads fell on the announcement of the scheme in August, they have since risen gradually over the remainder of the year. After a strong pickup over the summer, issuance of sterling in - vestment grade corporate bonds slowed in the later part of the year due to market volatility, as well as strong sterling issu- ance immediately following the announcement of the CBPS in August.
Key performance indicators (‘KPIs’)TheBankusesa rangeofKPI’s (incorporatingfinancialperfor-mance,capitalandliquidity)tomanageitsfinancialposition.Inachanging regulatory environment and with the increasing cost of capital these KPIs are critical to the successful management of thebusiness toachieve theBank’sobjectives.Profitability andRisk Weighted Assets (‘RWA’) are reviewed at the business line level to promote the drive towards the development and
maintenanceofprofitableandcapital efficientbusiness; capitalintensive businesses are closely monitored and reviewed.
2016 2015
Earnings
Net profit/(loss) after tax (USD million):
Continued (328) (303)
Discontinued 132 185
Total (196) (118)
2016 2015
Capital (USD million):
Risk Weighted Assets 126,723 163,722
Tier 1 capital 21,023 21,236
Return on Tier 1 capital (0.93)% (0.56)%
2016 2015
Liquidity (USD million):
Liquidity Buffer 20,240 30,604
2016 2015
Consolidated Statement of Financial Position (USD million):
Total Assets 332,381 400,989
Total Asset growth/(reduction) (17.11)% (26.85)%
Return on Total Assets (0.06)% (0.03)%
PerformanceConsolidated Statement of IncomeFor the year ended 31 December 2016, CSi group reported a net loss attributable to shareholders of USD 196 million (2015: USD 118 million loss). Net revenues from continuing operations amounted to USD 1,384 million (2015: USD 1,745 million). After operating expenses, the CSi group reported a loss before tax from continuing operations of USD 330 million (2015: USD 237 million loss). Income tax credit for the year ended 31 December 2016 was USD 2 million (2015: USD 66 million tax expense). In addi-tion,theCSigroupreportedaprofitbeforetaxfromdiscontinuedoperations of USD 132 million (2015: USD 185 million).
In 2016, Global Markets revenues decreased 13% year on year to USD 1,248 million, as challenging trading conditions resulted in low levels of client activity. Within Global Markets Solu-tions, the Macro business revenues decreased by 10% to USD 439 million and Equity Derivatives decreased by 32% to USD 323 million, driven by a continued low rate environment amid geopoliti-cal uncertainty in the run up to the UK Referendum vote and US Presidential election. Global Credit revenues decreased by 13% to USD 173 million, driven by reduced client activity, trading vol-umes and activity in both primary and secondary credit markets. This was offset by an increase in Emerging Markets revenues of 25% to USD 213 million mainly driven by new transactions.
Investment Banking & Capital Markets revenues increased by 43% to USD 434 million for the year. The year on year increase is mainly due to a full year of revenues post the acquisition of the investment banking business from Credit Suisse Securities (Europe) Limited (‘CSS(E)L’) in 2015.
Asia Pacific reported revenues of USD670million, a 7%decreasecompared to2015.WithinAsiaPacific,Fixed Income

9Credit Suisse International, Annual Report 2016
Strategic Report for the year ended 31 December 2016
reported an increase of 56% to USD 331 million, mainly driven by an increase in demand for Yen denominated structured notes amid a low interest rate environment. This was offset by a decrease in Equity Derivatives of 26% to USD 337 million, due to adverse marketconditionandsignificantlylowerclientflow.
The SRU division’s net revenues moved to a loss of USD 70 million compared to gains of USD 83 million in 2015. The loss in 2016 was mainly due to the cost to wind down and exit certain positions in line with the CS group strategy.Net revenues were impacted by the following items not included in the divisional revenues above:p Increased revenue sharing expenses for the period of USD
548 million (2015: USD 488 million). This relates to revenue sharing agreements between the CSi group and other CS group companies.
p Increased treasury funding charges of USD 260 million (2015: USD 247 million). This primarily comprises excess funding chargesonlongtermfinancingversusovernightfundingrates,which are only allocated out to the businesses at the CS group level.
The CSi group’s operating expenses (including Continued and Dis-continued operations, refer to Note 28 – Discontinued Operations and Asset Held of Sale) decreased by USD 270 million to USD 1,724 million (2015: USD 1,994 million). Compensation and Ben-efitscostshaveincreasedbyUSD64milliontoUSD636million(2015: USD 572 million). The increase is mainly due to the trans-fer of employees from CSS(E)L to CSi. General administrative and trading expenses have dropped by USD 357 to USD 948 million due to reduction in expense recharges from other CS group com-panies due to the cost reduction program run in the UK and glob-ally. There was also a decrease in litigation expenses of USD 129 million. Restructuring expenses have increased by USD 23 million to USD 140 million due to the execution of the cost reduction pro-gram in the UK.
The effective tax rate for the period to December 2016 was higher than the UK statutory tax rate primarily as a result of per-manent differences, tax rate reduction, non-recoverable foreign taxes and the effect of prior year adjustments. Similarly, the effec-tive tax rate for the period to December 2015 was higher than the UK statutory tax rate primarily as a result of permanent differ-ences, non-recoverable foreign taxes and the effect of deferred tax not recognised.
Discontinued operations and Assets held for saleThe CSi group has begun to transfer a subset of derivatives and securitiesintheAsiaPacificdivisionintoanotherCSgroupentity.This transfer has commenced and will continue through 2017. The total assets held for sale within the Discontinued operations were USD 2.6 billion as at 31 December 2016 which was equivalent of 0.79% of the total assets. The total liabilities held for sale within the Discontinued operations were USD 2.9 billion as at 31 Decem-ber 2016 which was equivalent of 0.96% of the total liabilities. This transaction represents discontinued operations treatment underIFRS,andpost-taxprofitorlosshasbeenclassifiedasdis-continued operations in the CSi group’s Consolidated Statement of Income. CSi group’s prior period results have been restated to
conform to the current presentation. Assets and liabilities relating tothetransfersthathavenotyetcompletedhavebeenclassifiedas Assets/Liabilities held for sale in the Consolidated Statement of Financial Position. No impairment losses were required to be rec-ognised as a result of having to measure the Assets/Liabilities held for sale at fair value less cost to sell.
During the year the CSi group has also entered into other transactions which qualify as Held for Sale. No prior period restatement is required. For further information, please refer to Note 28 – Discontinued Operations and Asset held for Sale.
Consolidated Statement of Financial PositionAs at 31 December 2016 the CSi group had total assets of USD 332 billion (31 December 2015: USD 401 billion). The reduction in assets is driven by CSi’s goal to reduce balance sheet size, Risk Weighted Assets and lower the capital requirements in the UK.
Business driven movements in the Consolidated Statement of Financial Position are:p Tradingfinancialassetsatfairvaluethroughprofitorlosshave
decreased by USD 53 billion. The decrease was primarily due to mark to market moves on interest rate derivative products, trade compressions, business migrations to Credit Suisse enti-ties in Asia and reduction of trades in the SRU division. There has similarly been a decrease of USD 59 billion in Trading financialliabilitiesatfairvaluethroughprofitorloss.
p Associated with this, other assets have decreased by USD 9 billion to USD 37 billion (31 December 2015: USD 46 billion) primarily due to a decrease in cash collateral provided to coun-terparties in relation to derivative exposures and placing certain collateral in security form instead of cash.
p Assets and liabilities held for sale increased by USD 4 billion due to the recognition of assets and liabilities qualifying as dis-continued operations.
Further movements in the Consolidated Statement of Financial Positionreflecttheimpactsofmanagingtherequiredliquiditypro-file in accordance with risk appetite, regulatory requirementsincluding European Banking Authority (‘EBA’) Basel III, and overall optimisationofthefundingprofile.Thishasresultedin:p A decrease of USD 21 billion in securities purchased under
resale agreements and securities borrowing transactions of predominantly high quality liquid assets due to changes in Liquidity Coverage Ratio (‘LCR’) regulations which allowed excess assets to be reduced.
p A decrease in short term borrowings of USD 18 billion from a CS group entity (as a result of underlying business activity).
p An increase in long term debt of USD 5 billion is principally as a result of an increase in senior debt from a CS group company.
Total shareholder’s equity has remained stable at USD 23 billion (31 December 2015: USD 23 billion).
Financial instruments carried at fair value are categorised underthethreelevelsofthefairvaluehierarchy,wherethesignifi-cant inputs for the Level 3 assets and liabilities are unobservable.
Total Level 3 assets were USD 6.2 billion as at 31 December 2016 (31 December 2015: USD 8.5 billion), which was equivalent

10
to 1.87% of total assets. The decrease in Level 3 assets was due to cash settlements and the disposal of Level 3 positions, mainly credit derivatives and loans. Total Level 3 liabilities were USD 5.7 billion as at 31 December 2016 (31 December 2015: USD 7.7 billion), which was equivalent to 1.83% of total liabilities. The decrease in Level 3 liabilities is primarily due to reduction in credit derivatives.
Fair Value disclosures are presented in Note 38 – Financial Instruments.
The Bank has incurred substantial taxes in the UK during 2016, including Bank Levy of USD 32 million (2015: USD 39 mil-lion), employers social security of USD 82 million (2015: USD 71 million) and irrecoverable UK value added tax (‘VAT’) of USD 13 million (2015: USD 12 million). However, as disclosed in Note 44 – Country-by-Country Reporting, Corporation taxes paid in the United Kingdom (‘UK’) are nil (2015: USD Nil) for CSi as the Bank hasnotmadetaxableprofitsduringtheyear.TheCSigrouphaspaid USD 1 million (2015: USD 11 million) in taxes in branches located outside of the UK.
Principal Risks and UncertaintiesThe Bank faces a variety of risks that are substantial and inherent in its businesses including Market risk, Liquidity risk, Currency risk, Credit risk, Country risk, Legal and Regulatory risk, Operational risk, Conduct risk, and Reputational risk. These are detailed in Note 41 – Financial Instruments Risk Position.
Therehavebeensignificantchangesinthewaylargefinancialservice institutions are regulated over recent years. There are increased prudential requirements as well as stricter regulations on thefinancialinstitutionsingeneralandmanyofthereformsbeingdiscussed inwiderforumswillchangetheway inwhichfinancialservices is structured affecting the CSi group business model.
OutlookCSi remains focused on continuing to strengthen its position in executing a client-focused, capital-efficient strategy to meetemerging client needs and regulatory trends. CSi is progressing towards achieving specific goals to reduce its cost base andstrengthen its capital position, and has operated under the Basel III capital framework, as implemented in the EU, since January 2014. During 2016, Global Markets announced a restructure within their division resulting in four sub divisions being created, Equities, Credit, Solutions and Management, creating a business modelwithareducedriskprofileandreducedearningsvolatility.
The Strategic Resolution Unit (‘SRU’), introduced in 2015, continuestowinddownbusinessesandpositionsthatnolongerfitthe Bank’s strategic direction. In the second half of the year CSi group has also made a progress in reducing its derivative portfolio within the SRU division. The progress in the SRU is central to the restructuring of the CSi and the CS group and contributes to gen-erating the resources needed to invest in areas where higher returns could be generated.
The CSi group has begun to transfer its portfolio of deriva-tivesandsecurities in theAsiaPacificdivision intoanotherCSgroup entity. This transfer has commenced and will continue through 2017. This accounts for approximately 9% of the 2016 net revenues. A global cost reduction strategy is also underway
and as a result the Bank expects the London campus and head-count to reduce, having a direct impact on the cost base of the Bank. The Bank has recognised USD 80 million provision on onerous lease contracts (2015: USD 101 million). During 2017 the CSi group will move all critical staff in the Bank’s Corporate functions and critical service contracts into a separate legal vehi-cle as part of the global Too-Big-To-Fail legislation, where major banks are required to prepare and implement Recovery and Res-olution Plans (‘RRPs’). The resolution part of the RRP must demonstrate that a bank or a company can be wound down in an orderly fashion, while supporting the continuation of systemical-ly-important functions in the event of the Bank’s impending insol-vency. In the UK, the Bank has begun the process of establish-ing Credit Suisse Services AG, London Branch as the local service company. This is a branch of Credit Suisse Services AG (the Service Company parent entity) which was established in Switzerland. The new Service Company will house the employ-ees, contracts and assets required to perform services that are deemed resolution-critical and which support multiple Material Legal Entities on a cross-border basis.
CSi will continue to adapt to a challenging market environment and compete in its chosen business and markets around the world.
The CSi group continues to be committed to offering a broad spectrum of products and is focused on businesses in which the Bankhasacompetitiveadvantageandisabletooperateprofitablywith an attractive return on capital.
UK ReferendumOn 23rd June 2016, voters in the UK voted to leave the European Union(‘EU’) inanon-bindingreferendum.Amongthesignificantglobal implications of the referendum is the increased uncertainty concerning a potentially more persistent and widespread imposi-tion by central banks of negative interest rate policies, caused by general political uncertainty. The European Central Bank (‘ECB’) and others have already introduced negative interest rates to addressdeflationaryconcernsandtopreventappreciationoftheirrespective currencies. The BOE has announced a cut to its bank rate of 25 basis points to 0.25% and introduced a package of measures designed to provide additional monetary stimulus. The package included the rate cut, a new Term Funding Scheme to reinforce the pass-through of the cut in Bank Rate; the purchase of up to GBP 10 billion of UK corporate bonds; and an expansion of the asset purchase scheme for UK government bonds of GBP 60 billion, taking the total stock of these asset purchases to GBP 435billion.Thelastthreeelementswillbefinancedbytheissu-ance of central bank reserves.
In addition, a decision taken to introduce a countercyclical buf-fer for UK exposures of 0.5% from March 2017 has been reversed. Following the UK Referendum result, the Financial Policy Commit-tee (‘FPC’) reduced the UK countercyclical capital buffer rate from 0.5% to 0% of banks’ UK exposures with immediate effect. Absent any material change in the outlook, and given the need to give banks the clarity necessary to facilitate their capital planning, the FPC stated that it expects to maintain a 0% UK counter cycli-cal capital buffer rate until at least June 2017. The FPC expects that this will allow banks to use some of their capital buffers to maintain lending.

11Credit Suisse International, Annual Report 2016
Strategic Report for the year ended 31 December 2016
CSi is exploring solutions to various outcomes, post triggering Article50inMarch2017includingaHardBrexit,andisrefiningthe in-depth analysis and looking at ways to optimise the current infrastructure, including options for continuing to service EU clients and accessing markets and leveraging the existing EU presence where appropriate. CSi already provides a comprehensive range of services to clients through both our London operations and a num-ber of different subsidiaries and branches across the Continent. ThisprovidesCSiwiththeflexibilitytorespondtopotentialchangesintheUKandEUfinancialservicesindustryinthefuture.
The UK’s unexpected decision to leave the EU was followed by an initial period of market volatility and a longer-term fall in the value of sterling. While there have been no instances of counter-party distress in the CSi portfolio following the referendum, Credit Risk Management (‘CRM’) has downgraded its UK country rating. ThisreflectstheexpecteddifficultiesoftheexitnegotiationsafterArticle 50 is activated and lower economic growth forecasts. How-ever, rating strength remains underpinned by the country’s wealthy anddiversifiedeconomy,high institutional strength,aswellasaflexiblemonetaryandfiscalpolicythatshouldensuresomeresil-ience against the expected challenges over the next two years. CSi has a high-quality portfolio comprising of relationships with regulated funds, qualifying central counterparties and banks. In addition to a UK country exposure limit, CRM has introduced a lower exposure review trigger to improve management oversight of the portfolio. CRM continues to assess its risk to further sterling weakening through GBP-focused scenarios.
Regulatory Market Changes The CSi group has implemented the Basel Committee on Banking Supervision (‘BCBS’) and International Organisation of Securities Commission (‘IOSCO’) revised framework for margin requirements for non-centrally cleared derivatives in each jurisdiction in which this regulation has been implemented. The requirements centre around the posting and collecting of segregated initial margin for non-centrally cleared derivatives and daily settlement of variation margin. Initial Margin and Variation Margin rules impacting the CSi group and other in-scope, “Phase 1”, market participants were introduced in the U.S., Japan and Canada on 1 Sept 2016 and in mostotherglobalfinancialcentreson4Feb2017.Eachyearforthe next 4 years the in-scope market participants qualifying for Initial Margin conditions will increase. Variation Margin conditions impacting the majority of the clients of the CSi group became effective on 1 March 2017. The CSi group is assessing the impact of increased liquidity requirements to fund these margin requirements.
LitigationThe risks in relation to litigation are set out in Note 36 – Guaran-tees and Commitments.
LiquidityThe Bank’s Liquidity position is managed in accordance with Liquidity Risk Metrics set both externally and internally. The Liquid-ityCoverageRatio(‘LCR’),asdefinedbythePRAbasedonrec-ommendations by the Basel Committee on Banking Supervision, ensures adequate unencumbered High Quality Liquid Assets
(‘HQLA’) that can easily be converted to cash to meet liquidity needs for a 30 day liquidity stress scenario. The Basel III Net Sta-ble Funding Ratio (‘NSFR’) is a 1 year structural ratio ensuring a fundingprofileprovidingsufficientlong-termstablefundinginrela-tion to the composition of its assets and off-balance sheet activities.
TheCSgroupconsidersastrongandefficientliquiditypositionto be a priority. The liquidity position is monitored in accordance with all metrics, taking account of the current regulatory regime and any forthcoming changes to the regulatory framework or to the Bank’s business strategy. The CS group continues to provide confirmationthatitwillprovidesufficientfundingtoCSitoensurethatitmaintainsasoundfinancialsituationandisinapositiontomeet its debt obligations.
Significant Accounting DevelopmentsThe CSi group will adopt the IFRS 9 Financial Instruments accounting standard on 1 January 2018. In July 2014, the IASB (InternationalAccountingStandardsBoard)publishedthefinalver-sion of IFRS 9, which replaces the existing guidance in IAS 39 Financial Instruments Recognition and Measurement. The stan-dard includesamendedguidanceforclassificationandmeasure-mentoffinancial instruments,newhedgingguidanceandanewimpairment model which will result in earlier recognition of potential losses. IFRS 9 also requires extensive new disclosures as well as the revision of current disclosure requirements under IFRS 7 Financial Instruments: Disclosures.
The impairment guidance included within IFRS 9 replaces the current incurred loss model with an expected loss model which is based on changes in credit quality since initial recognition. IFRS 9 appliesoneclassificationapproachforalltypesoffinancialassets,basedon thebusinessmodelwithinwhichfinancial assetsaremanaged,andtheircontractualcashflowcharacteristics(whetherthecashflows represent ‘solelypaymentsofprincipaland inter-est’).Nochangeswereintroducedfortheclassificationandmea-surement of financial liabilities, except for the recognition ofchanges in own credit risk in Other Comprehensive Income for liabilitiesdesignatedatfairvaluethroughprofitandloss.
IFRS 15 Revenue from Contracts with Customers, was issued in May 2014 and establishes a single, comprehensive framework for revenue recognition. The core principle of IFRS 15 is that an entity will recognise revenue to depict the transfer of promised goodsorservicestocustomersinanamountthatreflectsthecon-sideration to which the entity expects to be entitled in exchange for those goods or services. IFRS 15 also includes disclosure require-mentstoenableusersoffinancialstatementstounderstandthenature,amount,timinganduncertaintyofrevenueandcashflowsarising from contracts with customers. IFRS 15 is effective for annual reporting periods beginning on or after 1 January 2018.
The CSi group has established a cross-functional implementa-tion team and governance structure for the project to implement IFRS 9 and IFRS 15.
For further information on the guidance in IFRS 9 and IFRS 15, as well as the implementation status for the CSi group, please refer to the ‘Standards and Interpretations endorsed by the EU and not yet effective’ section in Note 2- Significant AccountingPolicies.

12
Key Credit Risk Developments2016wasayearmarkedbysignificantpoliticalevents inseveralcountries and regions, most notably the UK referendum on leaving the European Union, the US presidential election and the failed coup in Turkey. Events and other key risks which could potentially have an impact on the credit portfolio of the Bank are discussed further below.
European Banks European banks continued to feature in the news in 2016, most notably Deutsche Bank’s settlement with the US Department of Justice over its involvement in US residential-mortgage-backed securities, and the ongoing capital-raising efforts of Italian banks. CSi’s exposure is weighted towards financial counterparties,including a concentration in the banking industry, however this is diversifiedacrossregionsandcounterparties.ExposurestoEuro-pean banks have been declining in recent years as a result of active management by CRM alongside an industry-driven trend towardscentral clearing,aswell asCSi-specificconsiderationssuch as the SRU wind-down resulting in portfolio compression. Exposure reduction is likely to continue as a result of regulatory requirements to post initial margin for non-centrally cleared deriva-tives. Exposures to European banks remain within CSi’s risk appe-tite. With respect to Italian banks, CRM has actively managed down credit exposure over a number of years and CSi has no sig-nificant exposure to weaker Italian banks that may requirerecapitalisation.
Turkey Turkey has seen several market destabilising events during 2016. Despite these events of 2016, the banking sector in Turkey contin-ues to operate smoothly and no major stress has been observed in the corporate sector. CSi has a portfolio of funding trades with Turkish banks which are subject to structural risk mitigants includ-ing Credit Default Swaps (‘CDS’) spread triggers for additional collateral, counterparty rating-based triggers enabling CSi to ter-minateintheeventofacounterpartydowngradebelowaspecificlevel, and other early-termination options. Overall exposure to Turkish banks is closely managed under a portfolio limit framework which is subject to regular review and challenge by the CSi Credit Risk Committee.
Leveraged Finance High-yield market volumes, for what proved to be a volatile 2016, totalled EUR 84 billion for European issuers, markedly down on the EUR 110 billion seen in 2015. The market featured prolonged peri-ods of little or no activity. The year started slowly amid questions
around Chinese growth forecasts before a short Quantitative Eas-ing- fuelled boost of issuance around April/May. The market stalled again in June due to the uncertainty surrounding the UK referen-dum, before picking up strongly after the summer break in Septem-ber/October and then tapering off again around the US elections. Despite healthy appetite from traditional high-yield investors, the high-yield bond and leveraged-loan markets continued their conver-gence in 2016, with increasing Floating Rate Notes (‘FRNs’) issu-ance. A total of 18 FRNs were issued totalling EUR 5.25 billion compared with EUR 2.5 billion the previous year as corporates took advantage of strong demand from Collateralised Loan Obligations (‘CLOs’). A number of issuers this year across the loans and bonds universe realigned the debt mix within their capital structures, with more first-lien or senior secured debt. CRM continues to monitor the Bank’s leveraged finance exposures closely.
Selected credit risk exposure views by country and industry segmentThe table below shows selected exposures in CSi by country, including the three largest countries and risk focus countries. The three largest country exposures are in large developed countries with stable economies (United States, United Kingdom and France), and collectively these countries account for more than 50% of the total. CSi undertakes business with counterparties across the Eurozone and the table includes the countries with the largest net exposures. With elections in several key countries, 2017 is likely to see increased political risk in the Eurozone, how-ever the table shows that exposures have been reducing in France, Germany, the Netherlands, Luxembourg and Italy. With respect to emerging markets, sovereign risk makes up the majority of expo-sure in China and sub-Saharan Africa, while in Russia and Brazil exposure is drivenby a combinationof sovereignandfinancialcounterparties. Exposure in Turkey is due to the portfolio of fund-ing trades with Turkish banks (see notes above), however on a net basis exposure is not material.
Gross credit risk exposures, presented on a risk based view, include loans and loan commitments, investments (such as cash securities and other investments) and all exposures of derivatives (not limited to credit protection purchased and sold), after consid-eration of legally enforceable netting agreements. Gross expo-sures are calculated after offsetting long and short positions, capped at nil for net short positions. Net exposures include the impact of risk mitigation such as CDS and other hedges, guaran-tees, insurance and collateral (primarily cash and securities). Col-lateral values applied for the calculation of the net exposure are determined in accordance with risk management policies and reflectapplicablemarginingconsiderations.

13Credit Suisse International, Annual Report 2016
Strategic Report for the year ended 31 December 2016
Sovereign Financial Institutions Corporate Total AnnualΔ
Net Exposure as % of Gross Net Gross Net Gross Net Gross Net Gross Net All Country
31 December 2016 (USD millions) Exposure Exposure Exposure Exposure Exposure Exposure Exposure Exposure Exposure Exposure Exposures
United States 745 745 14,867 9,512 1,990 917 17,602 11,174 (540) 13 32%
United Kingdom 441 71 9,202 3,688 887 664 10,530 4,423 (1,540) (603) 13%
France 574 520 4,166 1,294 1,625 1,287 6,365 3,101 (1,318) (274) 9%
Germany 1,473 660 3,805 1,383 547 288 5,825 2,331 (1,753) (396) 7%
Netherlands 74 74 1,672 1,338 493 454 2,239 1,866 (491) (201) 5%
China 783 740 214 179 108 108 1,105 1,027 (4) 88 3%
Luxembourg 36 0 1,090 709 191 188 1,317 897 (778) (34) 3%
Italy 2,736 363 1,116 418 74 56 3,926 837 (669) (375) 2%
Sub-saharan Africa 710 595 28 14 118 118 856 727 522 621 2%
Brazil 151 151 161 153 24 21 336 325 106 148 1%
Russia 174 153 346 81 93 72 613 306 (392) (58) 1%
Turkey 0 0 733 34 0 0 733 34 (947) (21) 0%
Total 7,897 4,072 37,400 18,803 6,150 4,173 51,447 27,048 (7,804) (1,092) 78%
Sovereign Financial Institutions Corporate Total
Gross Net Gross Net Gross Net Gross Net 31 December 2015 (USD millions) Exposure Exposure Exposure Exposure Exposure Exposure Exposure Exposure
United States 1,252 1,252 14,020 8,252 2,870 1,657 18,142 11,161
United Kingdom 107 22 10,960 4,211 1,003 793 12,070 5,026
France 842 791 5,200 1,400 1,641 1,184 7,683 3,375
Germany 1,885 190 4,864 1,989 829 548 7,578 2,727
Netherlands 0 0 2,123 1,556 607 511 2,730 2,067
China 772 705 320 217 17 17 1,109 939
Luxembourg 9 1 1,846 690 240 240 2,095 931
Italy 3,465 646 1,049 504 81 62 4,595 1,212
Sub-saharan Africa 181 34 90 9 63 63 334 106
Brazil 3 3 162 117 65 57 230 177
Russia 168 146 625 91 212 127 1,005 364
Turkey 13 13 1,667 42 0 0 1,680 55
Total 8,697 3,803 42,926 19,078 7,628 5,259 59,251 28,140
The table below shows selected exposures in CSi by industry seg-ment, including the three largest industries and risk focus industries. CSi’s largest industry exposures are in financial sectors: Fund Linked Products, Sovereigns and CCPs. Exposure in the Fund Linked Prod-ucts industry segment has decreased due to planned transfers of positions from CSi to CS AG, a process which will continue in 2017.
The table also includes exposure to the Commercial Banks industry segment in light of the notes above on European banks. Further to the 2015 report which focused on the Oil & Gas and Metals & Mining industries segment, the table shows there have been modest increases in gross exposures in these sectors, however net exposure remains small relative to the size of the overall portfolio.

14
2016 2015 AnnualΔ
Net Exposure as % of Gross Net All Industry Gross Net Gross Net Industry Segments (USD millions) Exposure Exposure Exposures Exposure Exposure Exposure Exposure
Fund Linked Products 8,890 8,718 26% 11,194 11,155 (2,304) (2,437)
Sovereigns, Monetary Authorities, Central Banks 10,050 5,592 17% 11,824 6,150 (1,774) (558)
Central Clearing Parties 3,988 3,988 12% 7,832 5,619 (3,844) (1,631)
Commercial Banks 19,099 3,486 10% 20,674 3,107 (1,575) 379
Oil & Gas 993 509 2% 911 701 82 (192)
Metals & Mining 434 405 1% 296 281 138 124
Total 43,454 22,698 67% 52,731 27,013 (9,277) (4,315)
Capital ResourcesThe Bank closely monitors its capital and liquidity position on a continuing basis to ensure ongoing stability and support of its busi-ness activities. This monitoring takes account of the requirements of the current regime and any forthcoming changes to the capital framework or to the Bank’s business model and includes reviewing potential opportunities for capital repatriation to shareholders. CS groupcontinuestoprovideconfirmationthatitwillensurethattheBank is able to meet its debt obligations and maintain a sound financialpositionovertheforeseeablefuture.
The Bank is required at all times to monitor and demonstrate compliance with the relevant regulatory capital requirements of the PRA. No breaches were reported to the PRA during the period.
Pillar 3 disclosures required under the Capital Requirements Reg-ulation (‘CRR’) can be found separately at www.credit-suisse.com.
During the year, USD 2 billion of subordinated debt was repaid to CS PSL Gmbh, a direct subsidiary of Credit Suisse AG. Changes in senior and subordinated debt are set out in Note 27 – Long Term Debt. Changes in capital are set out in Note 30 – Share Capital and Share Premium.
Corporate Governance Internal Control and Financial Reporting
Board responsibilityThe directors are ultimately responsible for the effectiveness of internal control in the CSi group. Procedures have been designed for safeguarding assets, for maintaining proper accounting records; andforassuringthereliabilityoffinancialinformationusedwithinthe business, and for that provided to external users. Such proce-dures are designed to manage rather than eliminate the risk of failure to achieve business objectives and can only provide reason-able and not absolute assurance against material misstatement, errors, losses or fraud.
The key procedures that have been established are designed to provide effective internal control within the CSi group. Such proceduresfortheongoingidentification,evaluationandmanage-mentofthesignificantrisksfacedbytheCSigrouphavebeeninplace throughout the year and up to 30 March 2017, the date of approval of the Credit Suisse International Annual Report for 2016.
Key risk appetite is formally reviewed and assessed at least once a year by the Board. Key risks are formally reviewed and assessed on a quarterly basis by the Board. In addition to which key busi-ness risks are identified, evaluatedandmanagedbyoperatingmanagement on an ongoing basis by means of procedures such as credit, market, operational and other authorisation limits, and segregation of duties.
The Board also receives regular reports on any risk matters thatneedtobebroughttoitsattention.Significantrisksidentifiedin connection with the development of new activities are subject to consideration by the Board.
There are well-established budgeting procedures in place and reports are presented regularly to the Board detailing the perfor-mance of each principal business unit, variances against budget and prior year forecasts, and other performance data.
The Board’s primary functions and types of decisions taken by the Board are:
Strategy and Managementp Set local strategy and oversee that the management of CSi is
in line with the strategy of the CSG;p Act in good faith in the best interests of the Bank, exercise
independentjudgementandavoidconflictsofinterestwherepossibleordeclareconflictsandensuretheyaremanaged;
p EnsurethefulfilmentoftheCSistatutorydutiesandthatCSioperates within the rules of applicable jurisdictions;
p Ensure that CS group policies applicable to CSi are in accor-dance with the appropriate law and regulatory requirements and guidelines, and are being properly implemented at the CSi level;
p Manage CSi business within the business framework of CSG, delegating to Board Committees as appropriate and ensure thatCSisubsidiaries,branchesandrepresentativeofficesareadequately controlled;
p Review the business strategy as recommended by executive management ensuring that it does not expose CSi to unac-ceptable risk;
p Provide direction for and challenge to management;p Review CSi performance and execution of business strategy
and plan;

15Credit Suisse International, Annual Report 2016
Strategic Report for the year ended 31 December 2016
p Ensure thatCSi has adequate financial resources tomeetobjectives and effectively manage risk;
p Review material new business proposals;p Reviewstandardreporting,includingCSifinancials,riskexpo-
sures, capital, liquidity and funding; andp Review material internal control, regulatory, legal and compli-
ance issues.
Culturep Review initiatives to support appropriate culture, conduct and
behaviour of staff;p Review disciplinary actions by management quarterly and at a
year end for compensation purposes;p Review CSi Executive Committee decisions regarding registra-
tion and de-registration of Senior Managers;p Ensure that HR policies accord with the law and do not expose
CSi to unacceptable risk; andp Review reports prepared by Compliance and the Audit Com-
mittee on CSi systems and controls in relation to whistleblowing.
Risk Managementp Review and approve the risk appetite framework, statement
and limits for CSi;p Review CSi material credit, market, operational, conduct, and
reputational risk exposures;p Review CSi liquidity and liability management;p Review the Capital Framework to ensure the safety of CSi
operations;p Ensure appropriate systems and controls are in place to pro-
vide a reasonable level of assurance that the appetite of risk that CSi will incur is consistent with that which the Board con-siders it prudent to take; and
p Review risk limits or exceptions escalated from the Board Risk Committee.
Financial Reporting and Internal Controlp Review quarterly financial information and approve Annual
Financial Statements;p Review and approve the annual Financial Plan;p Review and approve the control frameworks for all business
booked into CSi;p Review the control framework for all functions that support the
business of CSi;p Consider reports relating toCSifinancials includingFinancial
Accounting, Product Control and Tax, market and credit risk exposures, capital, liquidity and funding, internal control, regu-latory, legal or compliance escalated from Board Sub-Commit-tees or management committees; and
p Consider the adequacy of management information.
Board EvaluationEach year, the Board undertakes a formal, rigorous Board Evalua-tion against the responsibilities listed in its Terms of Reference and the Board’s objectives to assess Board Committee effectiveness and to evaluate and decide on future objectives, and focus topics and work plan, in light of the CS group Strategy and structure, and to identify internalbriefings/ trainingandprofessionaldevelop-ment required by individual Directors in the coming years. The Evaluation also assists the Board Nomination Committee to assess the structure, size, composition and performance of the Board, and knowledge, skills, experience and diversity of Board members and Board succession planning and Board member appointments. From time to time, the Board may also mandate an external advi-sor to facilitate the evaluation process; usually the evaluation is internal for two years and external for every third year.
The Board held the annual 2016 Board Evaluation and has reviewed the Board performance including self-assessment ques-tionnaires and time allocations and considered year-end target achievements compared to the Board objectives, Board gover-nance including structure and composition, and proposed 2017 Board objectives. The 2016 Board Evaluation also took into accountthefindingsoftheFinancialReportingCouncil‘CorporateCulture and the Role of the Board’ statement and the PRA rules regardingdiversitywithinfirms’managementbodies.
It was concluded that the Board was effective and Board Director performance was satisfactory in 2016. The Board agreed its 2017 objectives.
Board TrainingIn addition to Board Evaluation and Board Director Induction, BoardDirectorsundertakeongoinginternalbriefingsandtrainingwhich are tailored to CSi business strategy and the Board objec-tives and to decisions to be taken by the Board; and an external Board governance course to provide for the professional develop-ment of the Board.
Board MeetingsTen Board meetings and one Board Strategy Onsite were held in 2016. All members of the Board are expected to spend the neces-sary time outside of these meetings to discharge their responsibil-ities appropriately.TheChair calls themeetingswith sufficientnotice and prepares an agenda for each meeting. The Chair has the discretion to invite members of management or others to attend the meetings. The Board also holds separate private ses-sions without management present. Minutes are kept of the pro-ceedings and resolutions of the Board.
Meeting attendanceThe members of the Board are encouraged to attend all meetings of the Board and the committees on which they serve.

16
Meeting attendance
Board of Audit Risk Nomination Remuneration Conflicts Directors Committee Committee Committee Committee Committee
in 2016
Total number of meetings held 10 6 4 3 4 1
Number of members who missed no meetings 7 3 3 2 4 2
Number of members who missed one meeting 4 1 1 1 – –
Number of members who missed two or more meetings 1 – – – – –
Meeting attendance, in % 93 94 94 89 100 100
1 The Board consisted of seven members as of the beginning of the year and nine members at the end of the year respectively, with three members resigned during the year and five members being appointed.
2 The Audit/Risk/Nomination/Remuneration Committee consisted of three members as of the beginning of the year and at the end of the year, with one member resigning and one being appointed.
3 The Conflicts Committee consists of two members.
CommitteesCertain responsibilities are delegated to Board Committees, which assist the Board in carrying out its functions and ensure that there is independent oversight of internal control and risk management: The Chair of each Board Committee reports to the Board on the matters discussed at Committee meetings.
Credit SuisseInternationalAuditCommitteeThe Audit Committee’s (‘AC’) primary function is to assist the Board of Directors (‘Board’) in fulfilling its financial oversightresponsibilitiesdefinedbylaw,articlesofassociationandinternalregulations by:p monitoringandassessingtheoverall integrityof thefinancial
statementsanddisclosuresofthefinancialcondition,resultsofoperationsandcashflowsofCSi;
p reporting to the CSi Board on the outcome of the statutory audit and explaining how the statutory audit contributed to the integrityoffinancialreportingandwhattheroleoftheACwasin that process;
p monitoringtheadequacyandintegrityofthefinancialaccount-ing and reporting processes and the effectiveness of internal quality controls and risk management systems regarding CSi financialreporting;
p monitoring processes designed to ensure compliance by CSi in allsignificantrespectswithlegalandregulatoryrequirements,including disclosure controls and procedures, and the impact (or potential impact) of developments related thereto;
p monitoring the adequacy of the management of operational risks, jointly with the Risk Committee including assessing the effectiveness of internal controls that go beyond the area of financialreporting;
p monitoring the adequacy of the management of reputational risks, jointly with the Risk Committee;
p reviewing and assessing the integrity, independence and effectiveness of CSi policies and procedures on whistleblow-ing, including those policies and procedures intended to pro-tect whistle-blowers from being victimised because they have disclosed reportable concerns;
p being responsible for the procedure for the selection of the External Auditors and recommending the External Auditors to be appointed;
p monitoringthequalifications, independenceandperformanceof the External Auditors including the suitability of the External Auditors’ provision (if any) of non-audit services to the Bank;
p monitoring the statutory audit of CSi annual and consolidated financialstatements,inparticularitsperformance,takingintoaccountanyfindingsandconclusionsbythecompetentauthor-ity; and
p reviewing and assessing the independence, integrity and ade-quacy of resourcing, and overseeing the performance of CSi Internal Audit Department, in particular its implementation and maintenance of an audit plan to examine and evaluate the ade-quacy and effectiveness of CSi systems, internal control mechanisms and arrangements.
In reviewing the Credit Suisse International Annual Report 2016, the Audit Committee considered critical accounting estimates and judgements including the valuation of Level 3 assets and liabilities, and the recoverability of the deferred tax asset. The Audit Commit-tee additionally considered the projected capital requirements in the next 12 months and, in this context, the continued access to appro-priate funding to maintain adequate capital and liquidity positions.
The Audit Committee members are Alison Halsey (Chair), Nor-een Doyle and Robert Endersby.
Credit SuisseInternationalRiskCommitteeThe Risk Committee’s (‘RC’) primary function is to assist the Boardinfulfillingitsriskmanagementresponsibilitiesasdefinedbyapplicable law and regulations as well as CSi articles of associa-tion and internal regulations, by periodically:p providing advice to the Board on CSi overall current and future
risk appetite and assisting the Board in overseeing the imple-mentation of that strategy by management;
p reviewing and approving the strategies and policies for taking on,managing,monitoringandmitigatingtherisksthefirmisormight be exposed to, including those posed by the

17Credit Suisse International, Annual Report 2016
Strategic Report for the year ended 31 December 2016
macroeconomic environment in which it operates in relation to the status of the business cycle;
p reviewing and assessing the independence, integrity and ade-quacy of resourcing, and overseeing the performance of the risk management function of CSi in particular as it relates to market,credit,and liquidity&fundingrisksandnon-financialrisks such as legal, strategic and business risks; and group risk;
p reviewing and assessing the independence, integrity and ade-quacy of resourcing, and overseeing the performance, of the compliance function of CSi including processes and organiza-tional structures to detect and monitor any risk of failure to comply with applicable regulatory requirements or that CSi maybeusedtofurtherfinancialcrime;
p reviewing the adequacy of CSi regulatory capital and its alloca-tion to CSi businesses; and group risk;
p reviewing certain risk limits and regular risk reports including Risk Appetite and make recommendations to the Board;
p reviewing the Internal Capital Adequacy Assessment Process (ICAAP) and providing input into the range of scenarios and analyses that management should consider;
p reviewing the Internal Liquidity Adequacy Assessment Process (ILAAP) and providing input into the range of scenarios and analyses that management should consider;
p reviewing and assessing the adequacy of the management of reputational risks, jointly with the Audit Committee; and
p reviewing and assessing the adequacy of the management of operational risks including the adequacy of the internal control system, jointly with the Audit Committee.
The Risk Committee members are Robert Endersby (Chair), Nor-een Doyle and Alison Halsey.
Credit SuisseInternationalNominationCommitteeCreditSuisseInternationalisdefinedasaCRRfirm(i.e.afirmsub-ject to EU regulation on prudential requirements for credit institu-tions and investment firms) supervised by the PRA which isrequired to: p establish a Nomination Committee (‘NC’) composed of mem-
bers of the Board who do not perform any executive function in the Bank;
p ensure that the NC is able to use any forms of resources the NC deems appropriate, including external advice; and
p ensure that the NC receives appropriate funding.
The duties of the NC are to:p engage a broad set of qualities and competences when recruit-
ing members to the Board and put in place a policy promoting diversity on the Board;
p identify and recommend for approval, by the Bank shareholder (CSG),candidatestofillBoardvacancies,havingevaluatedthebalance of knowledge, skills, diversity and experience of the Board;
p make recommendations to the Board concerning the role of the chairman and membership of the board committees, in consultation with the chairmen of those committees;
p prepare a description of the roles and capabilities for a partic-ular appointment, and assess the time commitment required;
p periodically, and at least annually, assess the structure, size, composition and performance of the Board and make recom-mendations to the Board with regard to any changes;
p periodically, and at least annually, assess the knowledge, skills and experience of individual members of the Board and of the Board collectively, and report this to the Board;
p periodically review the policy of the Board for selection and appointment of senior management and review with the CEO the appointment of senior management;
p in performing its duties and to the extent possible on an on going basis, take account of the need to ensure that the Board’s decision making is not dominated by any one individual or small group of individuals in a manner that is detrimental to the interest of the Bank as a whole; and
p recommend to the Board the appointment and removal of Chief Executive Officer (‘CEO’) and Chief Financial Officer (‘CFO’);
The NC members are Noreen Doyle (Chair), Alison Halsey and RobertEndersby.TheNCcomplieswiththerequirementsdefinedin the PRA handbook for ‘General Organisational Requirements’, chapter 6 (Nomination Committee).
Credit Suisse International Advisory Remuneration CommitteeThe purpose of the Committee is to advise the CSG Compensa-tion Committee in respect of matters relating to remuneration for the employees of Credit Suisse International, in particular mem-bers of the CSi Executive Committee, PRA/FCA Code Staff and other individuals, whose role, individually or as part of a group, has been identifiedashavingapotential impactonmarket, reputa-tional or operational risk.
Consistent with the requirements of the PRA Remuneration Code, the Bank has broadened the ‘Malus clause’ which is appli-cable to Code Staff, UK Managing Directors and certain other identifiedemployees.
The CSi Advisory Remuneration Committee members are Nor-een Doyle (Chair), Alison Halsey and Robert Endersby.
Credit SuisseInternationalConflictsCommitteeTheBoardhasformedaBoardConflictsCommitteeconsistingoftwo independent Non-Executive Directors Alison Halsey and Rob-ert Endersby. The Committee reviews the effectiveness of the ConflictsManagementFrameworkannually.TheCommitteemetin 2016 and concluded that the Framework operated effectively in 2016.
Credit SuisseInternationalDisclosureCommitteeThe purpose of the Committee is to ensure compliance with the EU Prospectus and Transparency directives in relation to the listing by the Bank of debt securities on European exchanges. The Com-mittee reviews and updates the Bank’s disclosure document and ongoing disclosure requirements so as to provide investors with all such information as may reasonably be required to make an informed assessment of the Bank as an issuer of debt securities.The CSi Disclosure Committee Chairman is Christopher Horne.

18
CSi Disclosure Committee
CSi Audit
Committee
CSi Risk
Committee
CSi Nomination Committee
CSi Advisory Remuneration
Committee
CSi Conflicts
Committee
Summary of Key Governance Committees
Tier 1
Board Level
Tier 2
CSi Executive
Committee
CSi Board of Directors
CSi Risk Management
Committee
CSi VARMC
CSi ALM CARMC
CSi Operating Committee
Business Management Committees
Board Diversity PolicyCSi recognisesandembraces thebenefitsofbuildingadiverseand inclusive culture and having a diverse board. The Board Diver-sity Policy sets out the approach to diversity on the Board of Direc-tors. A diverse Board will include and make good use of differ-ences in the skills, regional and industry experience, independence and knowledge, background, race, gender and other distinctions between Directors. The Committee will consider these differences in determining the optimum composition of the Board and when possible will be balanced appropriately. At the date of adoption of this Policy, the Board set a target to ensure that at least 25 per cent female representation on the Board to be achieved by the end of 2016; the Board continue to monitor its target in 2017 through periodic reviews of structure, size, composition and performance of the Board.
The aforementioned Board responsibilities and Board commit-teescomplywiththerequirementsdefinedinthePRAhandbookfor ‘General Organisational Requirements’, chapter 5 (Manage-ment Body).
Risk ManagementOverviewThe Bank’s risk management framework is based on transpar-ency, management accountability and independent oversight. Risk
management plays an important role in the Bank’s business plan-ning process and is strongly supported by senior management and the Board of Directors. The primary objectives of risk management aretoprotecttheBank’sfinancialstrengthandreputation,whileensuring that capital and liquidity are well deployed to support business activities and grow shareholder value. The Bank has implemented risk management processes and control systems and it works to limit the impact of negative developments by monitoring all relevant risks including credit, market, liquidity, operational and reputational risks, and managing concentrations of risks.
Risk governanceThe prudent taking of risk in line with the Bank’s strategic priorities is fundamental to its business as part of a leading global banking group. To meet the challenges in a fast changing industry with new market players and innovative and complex products, the Bank seeks to continuously strengthen the risk function, which is inde-pendent of but closely interacts with the businesses, to ensure the appropriateflowofinformation.
Committees are implemented at a senior management level to support risk management.
The key committees which support the Board of Directors are:Tier 1 comprises a single management committee for CSi, the
CSiExecutiveCommittee.ItischairedbytheChiefExecutiveOffi-cer (‘CEO’), CSi and members include the CEO, CSi; Deputy CEO,CSi;ChiefFinanceOfficer(‘CFO’),CSi;ChiefRiskOfficer(‘CRO’), CSi; Head of Internal Audit, CSi; Chief Compliance
Officer(‘CCO’),CSi;BusinessHeadsandotherSeniorManagers.The Deputy CEO, CSi deputises as Chair when necessary.
The purpose of the CSi Executive Committee is to support the CEO, CSi in the day-to-day management of CSi and, in particular, in the delivery of the strategy agreed by the CSi Board. The CSi Executive Committee facilitates the decision-making process

19Credit Suisse International, Annual Report 2016
Strategic Report for the year ended 31 December 2016
which impacts all aspects of CSi including: culture, strategy, reve-nue, reporting, policy, regulatory compliance, risk and control, costs and people. The CSi Executive Committee is also responsi-ble for identifying and escalating issues to the CSi Board or rele-vant Board committees for review, recommendation and/or approval as necessary.
Tier 2 committees were established by the CSi Executive Committee. Given the breadth of business activities and multiple areas of focus, the CSi Executive Committee has established a support structure comprising executive committees with a more focused mandate. These Tier 2 committees are chaired by mem-bers of the CSi Executive Committee and are all accountable to the CSi Executive Committee. The CSi Executive Committee has delegated particular aspects of its mandate to these Tier 2 committees.p CSi Risk Management Committee (‘CSi RMC’): chaired by the
CRO of CSi, the CSi RMC is delegated authority from the CSi Executive Committee to establish more granular limits within the bounds of CSi’ s overall risk limits and risk appetite. Its pur-pose is to:i ensure that proper standards for risk oversight and man-
agement are in place;ii make recommendations to the CSi Board on risk appetite;iii review the Internal Capital Adequacy Assessment Process
(‘ICAAP’) and the Individual Liquidity Adequacy Assess-ment Process (‘ILAAP’) and make recommendations to the CSi Board;
iv define and establish risk limits for both individual busi-nesses and at the portfolio level within authorities dele-gated by the CSi Board; and
v review and implement appropriate controls over remote booking risk relating to CSi.
p Valuation Risk Management Committee (‘VARMC’) is the most senior decision making forum for valuation issues in CSi, and is run as a sub-committee of CSG VARMC. Its purpose is to:i review, challenge and ratify/modify conclusions from Inven-
tory Valuation Reviews; andii directresolutionofsignificantinventoryvaluationissues.It
also establishes non-actionable variance thresholds (both positive and negative) that are to be monitored on a monthly basis.
p CSi Asset and Liability Management (‘ALM’) Capital Allocation and Risk Management Committee (‘CARMC’): chaired by the CFO, CSi, the CSi ALM CARMC is responsible for assisting the CSi Board in providing a robust governance and oversight function with respect to capital, liquidity and balance sheet management in relation to CSi. Its purpose is to:i monitor and challenge the capital and liquidity positions of
CSi against internal and external regulatory limits;ii monitor and challenge the systems and controls related to
the ALM management framework for CSi; andiii manage CSi’s leverage ratio.
p CSi Operating Committee (‘CSi OpCo’): The CSi OpCo is chaired by the Deputy CEO, CSi and has a remit in relation to
CSi, CSS(E)L and CS AG London Branch. In relation to the activities of CSi, it provides a forum for the effective manage-mentoffront-to-backissuesandtheefficientcommunicationof priorities to all departments of CSi. It manages both on going activities and also change management activities:
For on going activities its purpose is to:i communicate strategy / business plans to support
functions;ii ensure outsourcing activities are managed in line with
applicable policies; andiii ensure good communication between CSi management
and central function heads and relevant business Chief OperatingOfficers(‘COO’)forCSiactivities.
p For change management activities its purpose is to:i ensure that project needs of CSi are anticipated at an early
stage, are prioritised appropriately against other division/function priorities, and are reported on accurately; and
ii provide an escalation route for change teams, individual businesses or central function heads to use to resolve pri-oritisation, resource and budget issues (often through onwards escalation to CSi Executive Committee for mat-ters relating to CSi).
p CSi Business Management Committees (‘CSi BMC’): Divi-sional CEOs have established management committee struc-tures to undertake the management of divisional operations. Certain of these committees have a key role to play in UK governance, with reporting requirements into the CSi Execu-tive Committee in relation to the activities of CSi. The CSi Executive Committee establishes governance requirements appropriatetoitsUKspecificremitandagreeswiththerele-vant committee procedures for the on going management of, and reporting against, these requirements. The following divi-sional committees are responsible for identifying issues rele-vant to those requirements, for escalation to the CSi Executive Committee:i Europe, Middle East and Africa (‘EMEA’) Global Markets
Management Committee;ii EMEA Investment Banking & Capital Markets Operating
Committee (EMEA IBCM OpCo);iii Strategic Risk Oversight Board; andiv APAC.
Tier 3 Risk Management Committees are:p The CSi Credit Risk Committee, chaired by the CSi Chief
CreditOfficer, definesand implements theCSiCreditRiskFramework. It is responsible for reviewing emerging risks and assessing the impact of any issues that impact the UK IB credit por tfolio including counterpar ty, sector and concentration.
p The CSi Market Risk Committee, chaired by the CSi Head of MarketRisk, defines and implements theCSiMarketRiskFramework. It is responsible for reviewing emerging risks and assessing any issues that impact on the CSi market risk profile.
20
p The CSi Operational Risk Management Committee, chaired by the CSi Head of Operational Risk, provides oversight for oper-ational risk management in CSi including review and challenge oftheoperationalriskprofile,definingandimplementingoper-ational risk mitigation strategies and supporting the assess-ment and allocation of operational risk capital.
p The CSi Stress Test Committee, chaired by the CSi Head of Enterprise Risk, is responsible for identifying, developing and maintaining appropriate stress scenarios which are relevant for UK entities based on material risk factors.
p The CSi Reputational Risk Committee, co-chaired by the CSi CRO, CSi CCO and Deputy CEO CSi, is responsible for reviewing and approving transactions that pose a material risk to the bank’s reputation and are escalated as having potential to have a negative impact on the CSi reputation.
Risk organisationRisks arise in all of the Bank’s business activities and they are monitored and managed through its internal control environment. TheBank’s riskmanagementorganisation reflects the specificnature of the various risks in order to ensure that risks are taken within limits set in a transparent and timely manner.
The Bank’s independent risk management function is headed by the CSi CRO, who reports jointly to the Bank’s CEO and the CRO of CS group. The CSi CRO is responsible for overseeing the Bank’sriskprofileacrossallrisktypesandforensuringthatthereis an adequate independent risk management function. The Bank has strengthened the risk management function to provide a more dedicated focus on the risks at the Bank level, in addition to the global risk management processes applied by CS group.The Risk Management department, as of January 2016, comprises:p Market (Traded & Non Traded) & Liquidity Risk Management;p Credit Risk Management;p Operational Risk Management; p Enterprise Risk Management; andp Reputational Risk Management.
The CSi CRO is responsible for providing risk management over-sight and establishing an organisational basis to manage all risk management matters through its primary risk functions: p The Market and Liquidity Risk Management (‘MRM’) depart-
ment is responsible for assessing and monitoring the market andliquidityriskprofilesoftheBankandrecommendscorrec-tive action where necessary;
p Credit Risk Management (‘CRM’) is responsible for approving credit limits, monitoring, and managing individual exposures, and assessing and managing the quality of credit portfolios and allowances;
p Operational Risk Management (‘ORM’) is responsible for the identification,assessmentandmonitoringofoperationalrisks;
p Enterprise Risk Management (‘ERM’) is responsible for cover-ing cross-divisional and cross-functional approaches towards identifyingandmeasuringrisksaswellasdefiningandmanag-ing risk appetite levels; and
p Reputational Risk management (‘RRM’) is responsible for assessing actions or transactions which may pose a
reputational risk to the Bank’s reputation as escalated by both the First and Second Lines of Defence, providing independent appraisal and facilitating the calibration of such risks.
These areas form part of a matrix management structure with reporting lines into both the CSi CRO and the relevant Global Risk Head. Furthermore, these departments are supported by a global infrastructure and data process which is maintained by the central, Risk and Finance Data and Reporting (‘RFDAR’) group.
Risk limitsA sound system of risk limits is fundamental to effective risk man-agement.The limitsdefineCSigroup’s riskappetitegivenman-agement capabilities, the market environment, business strategy andfinancial resourcesavailable toabsorbpotential losses.Theoverall risk limits for the Bank are set by the Board of Directors.
Within the bounds of the overall risk appetite of the Bank, as definedbythelimitssetbytheBoard,theCSiCROisthenomi-nated executive who is responsible for implementing a limit frame-workwiththeaimofensuringthattheriskprofileremainswithinthe Board’s risk appetite. The Bank has a range of more granular limitsfor individualbusinesses,concentrationsandspecificrisks,including limits on transactions booked from remote locations.
Market risk limit measures are typically based on Value at Risk (‘VaR‘) and scenario analysis, although they also include risk sen-sitivities, notionals and other metrics. Liquidity risk limits include regulatoryandinternalmetricsbasedoncomputingliquidityinflowsandoutflowsunderstressscenariosoverdifferenttimehorizons.Credit risk limits include overall limits on portfolio credit quality and a system of individual counterparty, country, industry, product and scenario limits, which are used to mitigate concentration risks. These risk limits are generally set to ensure that any meaningful increase in riskexposures ispromptly identified, analysedand,where necessary, escalated to more senior levels of management. In addition, the Bank has allocated operational risk capital to the businesses and has established thresholds for operational risk losses that trigger additional management action. These thresh-olds are set in both quantitative (considering historical losses and gains) and qualitative (bank-wide statements linked to risk and control indicators) terms.
The majority of these limits are monitored on a daily basis, though those for which the inherent calculation time is longer (such as some credit portfolio limits) are monitored on a weekly or monthly basis.
TheBank’sfinancialriskmanagementobjectivesandpoliciesand the exposure of the CSi group to market risk, credit risk, liquidity risk and currency risk are outlined in Note 41 – Financial Instruments Risk Position.
Corporate Employee PolicyThe CSi group adopts the CS group’s policies which are commit-ted to providing equal opportunities for all employees, irrespective of factors such as race, gender, sexual orientation, gender reas-signment, religion or belief, age, marital or family status, or disabil-ity or any other characteristic protected by applicable law.
Internal experts work closely with the businesses across all regionstoensurethatthediversityandinclusionstrategyisfirmly

21Credit Suisse International, Annual Report 2016
Strategic Report for the year ended 31 December 2016
embedded in CSi’s corporate culture. Managers are advised on the planning and implementation of necessary internal structures and measures to ensure CSi can offer an inclusive working envi-ronmentthatisfreefromdiscriminationandcantakethespecificneeds of clients into account in CSi product and service offering. Councils headed by senior leaders are responsible for ensuring thatCSisystematicallystrivestoachievethetargetsdefinedandappropriate measures are implemented.
The CSi group is committed to ensuring it has an appropriate corporateculture,reflectingafocusonrisk,ethicsandvalues.TheCSi group believes having the right culture will deliver a number of otherbenefits including theopportunity tocreateacompetitiveadvantage. Leveraging the CS group’s corporate values, the UK Culture Program was set up to articulate the culture aspired to for CS in the UK and also to create the right environment for those who work here, encouraging individuals to behave consistently in line with these aspirations.
In December, in anticipation of the global launch of a set of new Conduct and Ethics Standards for the bank in 2017, new gov-ernance was implemented in the UK to manage the delivery of our Culture Program and the disciplinary process. As such, the UK Culture Steering Committee and the Disciplinary Review Commit-tee became the UK Conduct and Ethics Board (‘UK CEB’).The UK CEB has two related purposes:p to establish a clearly articulated and strong corporate culture
across the UK based on the global conduct and ethics stan-dards; and
p to ensure disciplinary decisions for UK employees, and employ-ees outside of the UK who are in the scope of the UK regula-tors, are fair, consistent and meet the expectations of the CS group CEB, UK CEB and the UK regulators.
With regards to disciplinary decisions the UK CEB:p reviews the outcome of disciplinary cases on a quarterly retro-
spective basis (the “ex-post facto review”) to assess fairness and consistency and meeting both internal and external expectations;
p considers the impact of a disciplinary sanction on compensa-tion, rating and promotion eligibility;
p monitors the conduct and ethics trends in the UK;p implements mitigating measures to ensure disciplinary infrac-
tions are not repeated in alignment with the Divisions/Corpo-rate Functions and escalating concerns to the relevant CEB; and
p collaborates with Divisional/Corporate Functions and any other regional CEBs to ensure the way in which they address mis-conduct for employees in the scope of the UK Legal Entities meets with the expectations of the UK CEB and UK regulators.
The UK CEB is chaired by the Bank’s CEO and comprises senior regional representatives from the businesses and Corporate Functions.
The CS group currently supports more than 40 internal employee networks worldwide that serve as a platform for the exchange of knowledge and experience, fostering mutual under-standing and helping to strengthen corporate culture. The net-works within the Bank, which are run by employees on a voluntary basis, and focus on women, families, Lesbian, Gay, Bisexual and Transgender (‘LGBT’) individuals, the older and younger genera-tions, and employees from various ethnic backgrounds. The net-works within the Bank also support veterans, employees with physical disabilities, mental health issues and employees who have responsibilities of care.
Modern Slavery & Human TraffickingIn its role as an employer, and as a user and provider of services, CS group is committed to human rights and respects them as a key element of responsible business conduct. Credit Suisse volun-tarily pledged to uphold to international human rights-related agreements, including: Equator Principles, Principles for Responsi-ble Investment and UN Global Compact.
A number of internal policies, commitments and controls which are already in place help to eradicate modern slavery and human traffickinginoursupplychainandacrossourbusiness.Inadditionthe CS group Supplier Code of Conduct aims to ensure that our external business partners, including their employees, subsidiaries and subcontractors, respect human rights, labour rights, employ-ment laws and environmental regulations. In 2016 CS introduced a formal Third Party Risk Management (‘TPRM’) framework to scru-tiniseandmonitor theoperational,financialand reputational riskassociated with third party relationships. The TPRM framework provides for structured due diligence assessments of our suppliers toidentifywheremodernslaveryandhumantraffickingrisksmayexist.
The complete statement, made pursuant to section 54, Part 6 of the Modern Slavery Act 2015, is publicly available and can be found at www.credit-suisse.com.
By Order of the Board
Paul E HareCompany Secretary
One Cabot Square London E14 4QJ30 March 2017

22
Directors’ Report for the year ended 31 December 2016International Financial Reporting StandardsThe CSi group and Bank 2016 Financial Statements have been prepared in accordance with International Financial Reporting Standards (‘IFRS’) as adopted for use in the European Union (‘EU’).
The Financial Statements were authorised for issue by the directors on 30 March 2017.
DividendsNo dividends were paid or are proposed for the year ended 31 December 2016 (2015: USD Nil).
DirectorsThe names of the Directors as at the date of this report are set out on page 1. Changes in the directorate since 31 December 2015 and up to the date of this report are as follows:
Appointment
Stephen Dainton 29 January 2016
David Mathers 24 March 2016
Eraj Shirvani 16 June 2016
Robert Arbuthnott 22 July 2016
Robert Endersby 29 September 2016
Resignation
Stephen Dainton 26 January 2017
David Livingstone 04 March 2016
Jason Forrester 25 March 2016
Gael de Boissard 31 December 2015
Richard Thornburgh 31 May 2016
NoneoftheDirectorswhoheldofficeattheendofthefinancialyearweredirectlybeneficially interested,atany timeduring theyear,inthesharesoftheBank.DirectorsoftheBankbenefitedfrom qualifying third party indemnity provisions in place during the financialyearandatthedateofthisreport.
Statement of Directors’ ResponsibilitiesThe Directors are responsible for preparing the Annual Report of the CSi group and the Bank in accordance with applicable law and regulations. Under applicable law and regulations, the Directors are also responsible for preparing a Strategic Report, Directors’ Report, and Corporate Governance Statement that complies with that law and those regulations.
Company law requires the Directors to prepare group and par-entcompanyfinancialstatementsforeachfinancialyear.Underthat law theyare required toprepare thegroupfinancial state-ments in accordance with IFRSs as adopted by the EU and appli-cablelawandhaveelectedtopreparetheparentcompanyfinan-cial statements on the same basis.
UndercompanylawtheDirectorsmustnotapprovethefinan-cialstatementsunlesstheyaresatisfiedthattheygiveatrueandfair view of the state of affairs of the group and parent company andoftheirprofitorlossforthatperiod.InpreparingeachoftheCSi group and Bank financial statements, the Directors arerequired to:p select suitable accounting policies and then apply them
consistently;p make judgements and estimates that are reasonable and
prudent;p state whether they have been prepared in accordance with
IFRSs as adopted by the EU; andp prepare thefinancial statementson thegoingconcernbasis
unless it is inappropriate to presume that the CSi group and the Bank will continue in business.
TheDirectorsconfirmtothebestoftheirknowledge:p The financial statements, prepared in accordancewith the
applicable set of accounting standards, give a true and fair viewoftheassets,liabilities,financialpositionandprofitorlossof CSi and the undertakings included in the consolidation taken as a whole;
p The Strategic Report includes a fair review of the development and performance of the business and the position of CSi and the undertakings included in the consolidation taken as a whole, together with a description of the principal risks and uncertainties faced.

23Credit Suisse International, Annual Report 2016
Directors’ Report for the year ended 31 December 2016
The Directors are responsible for keeping adequate accounting recordsthataresufficienttoshowandexplaintheCSigroupandthe Bank’s transactions and disclose with reasonable accuracy at anytimethefinancialpositionoftheCSigroupandtheBankandenablethemtoensurethatitsfinancialstatementscomplywiththeCompanies Act 2006. They have general responsibility for taking such steps as are reasonably open to them to safeguard the assets of the CSi group and to prevent and detect fraud and other irregularities.
The Directors are responsible for the maintenance and integ-rity of the corporate and financial information included on theBank’s website. Legislation in the UK governing the preparation anddisseminationoffinancialstatementsmaydifferfromlegisla-tion in other jurisdictions.
Risk and CapitalThe way in which these risks are managed is detailed in the Stra-tegic Report, and the risks are detailed in Note 41 – Financial Instruments Risk Position.
Changes made to the capital structure are set out in Note 30 – Share Capital and Share Premium.
Disclosure of Information to AuditorTheDirectorswhoheldofficeatthedateofapprovalofthisDirec-tors’Reportconfirmthat,sofarastheyareeachaware,thereisno relevant audit information of which the CSi group’s auditor is
unaware and each director has taken all the steps that he ought to have taken as a director to make himself aware of any relevant audit information and to establish that the CSi group’s auditor is aware of that information.
AuditorPursuant to Section 487 of the Companies Act 2006 the auditor will be deemed to be reappointed and KPMG LLP will therefore continueinoffice.
By Order of the Board
Robert ArbuthnottDirector
One Cabot Square London E14 4QJ30 March 2017

24
Independent Auditor’s Report to the Members of Credit Suisse InternationalWehaveauditedthefinancialstatementsofCreditSuisseInterna-tional (“CSi”) for the year ended 31 December 2016 set out on pages26to145.Thefinancialreportingframeworkthathasbeenapplied in their preparation is applicable law and International Financial Reporting Standards (IFRSs) as adopted by the EU and, asregardstheparentcompany(‘theBank’)financialstatements,as applied in accordance with the provisions of the Companies Act 2006.
This report is made solely to the Bank’s members, as a body, in accordance with Chapter 3 of Part 16 of the Companies Act 2006. Our audit work has been undertaken so that we might state to the Bank’s members those matters we are required to state to them in an auditor’s report and for no other purpose. To the fullest extent permitted by law, we do not accept or assume responsibility to anyone other than the Bank and the Bank’s mem-bers, as a body, for our audit work, for this report, or for the opin-ions we have formed.
Respective responsibilities of directors and auditorAs explained more fully in the Directors’ Responsibilities Statement set out on page 22 – 23, the directors are responsible for the preparationofthefinancialstatementsandforbeingsatisfiedthatthey give a true and fair view. Our responsibility is to audit, and expressanopinionon,thefinancialstatementsinaccordancewithapplicable law and International Standards on Auditing (UK and Ireland). Those standards require us to comply with the Auditing Practices Board’s Ethical Standards for Auditors.
Scope of the audit of the financial statementsAdescriptionof thescopeofanauditoffinancialstatements isprovided on the Financial Reporting Council’s website at www.frc.org.uk/auditscopeukprivate.
Opinion on financial statementsIn our opinion:p thefinancialstatementsgiveatrueandfairviewofthestateof
the CSi group’s and of the Bank’s affairs as at 31 December 2016 and of the CSi group’s loss for the year then ended;
p theCSigroupfinancial statementshavebeenproperlypre-pared in accordance with IFRSs as adopted by the EU;
p theBankfinancialstatementshavebeenproperlypreparedinaccordance with IFRSs as adopted by the EU and as applied in accordance with the provisions of the Companies Act 2006; and
p thefinancial statementshavebeenprepared inaccordancewith the requirements of the Companies Act 2006 and, as regards thegroupfinancial statements,Article4of the IASRegulation.
Opinion on other matters prescribed by Companies Act 2006In our opinion:p the information given in the Strategic Report and the Directors’
Report for thefinancial year is consistentwith thefinancialstatements; and
p the information given in the Corporate Governance Statement set out on pages 14 to 21 with respect to internal control and riskmanagementsystemsinrelationtofinancialreportingpro-cessesandaboutsharecapitalstructures(“thespecifiedCor-porateGovernanceinformation”)isconsistentwiththefinancialstatements.

25Credit Suisse International, Annual Report 2016
Independent Auditor’s Report to the Members of Credit Suisse International
Based solely on the work required to be undertaken in the course oftheauditofthefinancialstatementsandfromreadingtheStra-tegic Report, the Directors’ Report and the Corporate Governance Statement:p wehavenotidentifiedmaterialmisstatementsintheStrategic
Report,theDirectors’Report,orthespecifiedCorporateGov-ernance information;
p In our opinion, the Strategic Report and the Directors’ Report have been prepared in accordance with the Companies Act 2006; and
p the Corporate Governance Statement has been prepared in accordance with rules 7.2.5 and 7.2.6 of the Disclosure Guid-ance and Transparency Rules of the Financial Conduct Authority.
Matters on which we are required to report by exceptionWe have nothing to report in respect of the following matters where the Companies Act 2006 requires us to report to you if, in our opinion:p adequate accounting records have not been kept by the Bank,
or returns adequate for our audit have not been received from branches not visited by us;
p theBankfinancialstatementsarenot inagreementwith theaccounting records and returns; or
p certaindisclosuresofDirectors’remunerationspecificby laware not made;
p we have not received all the information and explanations we require for our audit;
p a Corporate Governance Statement has not been prepared by the Bank.
Dean Rogers (Senior Statutory Auditor) for and on behalf of KPMG LLP, Statutory AuditorChartered Accountants15 Canada SquareLondonE14 5GL30 March 2017

26
Financial Statements for the year ended 31 December 2016Consolidated Statement of Income for the Year ended 31 December 2016
Reference
to note in
2016 2015 1
Consolidated Statement of Income (USD million)
Continuing Operations
Interest income 5 662 637
Interest expense 5 (822) (571)
Net interest (expense)/income (160) 66
Commission and fee income 6 503 303
Commission and fee expense 6 (122) (86)
Net commission and fee income 381 217
(Additional)/Release of provision for credit losses 7 (2) 3
Net gains from financial assets/liabilities at fair value through profit or loss 8 1,532 1,694
Other revenues 9 (367) (235)
Net revenues 1,384 1,745
Compensation and benefits 10 (636) (572)
General, administrative and trading expenses 11 (938) (1,293)
Restructuring expenses 12 (140) (117)
Total operating expenses (1,714) (1,982)
Loss before tax from continuing operations (330) (237)
Income tax benefit/(expense) from continuing operations 13 2 (66)
Loss after tax from continuing operations (328) (303)
Discontinued Operations
Profit before tax from discontinued operations 28 132 185
Income tax benefit/(expense) from discontinued operations 0 0
Profit after tax from discontinued operations 132 185
Net Loss attributable to Credit Suisse International shareholders (196) (118)
1 2015 numbers have been restated to disclose the impact of discontinued operations. Details are included in Note 28 – Discontinued Operations and Assets Held for Sale.
Consolidated Statement of Comprehensive Income for the Year ended 31 December 2016
Reference
to note in
2016 2015
Consolidated Statement of Comprehensive Income (USD million)
Net Loss (196) (118)
Foreign currency translation differences 29 – (2)
Cash flow hedges – reclassified to profit or loss 29 – 4
Total items that may be reclassified to net income – 2
Other comprehensive income, net of tax – 2
Total comprehensive income (196) (116)
Attributable to Credit Suisse International shareholders (196) (116)
The Bank’s loss after tax was USD 179 million for the year ended 31 December 2016 (2015: Loss USD 70 million). As permitted by
s408 of the Companies Act 2006, no separate income statement is presented in respect of the Bank.
The notes on pages 34 to 145 form an integral part of the Financial Statements.
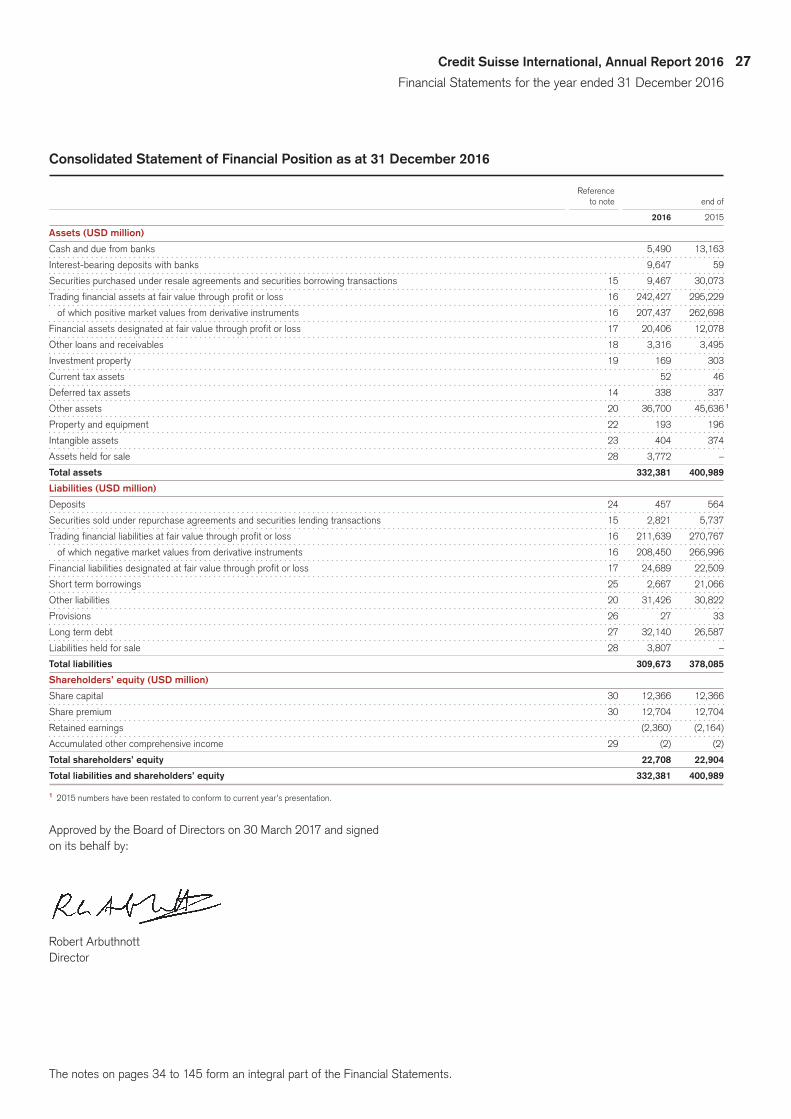
27Credit Suisse International, Annual Report 2016
Financial Statements for the year ended 31 December 2016
Consolidated Statement of Financial Position as at 31 December 2016
Reference
to note end of
2016 2015
Assets (USD million)
Cash and due from banks 5,490 13,163
Interest-bearing deposits with banks 9,647 59
Securities purchased under resale agreements and securities borrowing transactions 15 9,467 30,073
Trading financial assets at fair value through profit or loss 16 242,427 295,229
ofwhichpositivemarketvaluesfromderivativeinstruments 16 207,437 262,698
Financial assets designated at fair value through profit or loss 17 20,406 12,078
Other loans and receivables 18 3,316 3,495
Investment property 19 169 303
Current tax assets 52 46
Deferred tax assets 14 338 337
Other assets 20 36,700 45,636 1
Property and equipment 22 193 196
Intangible assets 23 404 374
Assets held for sale 28 3,772 –
Total assets 332,381 400,989
Liabilities (USD million)
Deposits 24 457 564
Securities sold under repurchase agreements and securities lending transactions 15 2,821 5,737
Trading financial liabilities at fair value through profit or loss 16 211,639 270,767
ofwhichnegativemarketvaluesfromderivativeinstruments 16 208,450 266,996
Financial liabilities designated at fair value through profit or loss 17 24,689 22,509
Short term borrowings 25 2,667 21,066
Other liabilities 20 31,426 30,822
Provisions 26 27 33
Long term debt 27 32,140 26,587
Liabilities held for sale 28 3,807 –
Total liabilities 309,673 378,085
Shareholders’ equity (USD million)
Share capital 30 12,366 12,366
Share premium 30 12,704 12,704
Retained earnings (2,360) (2,164)
Accumulated other comprehensive income 29 (2) (2)
Total shareholders’ equity 22,708 22,904
Total liabilities and shareholders’ equity 332,381 400,989
1 2015 numbers have been restated to conform to current year’s presentation.
Approved by the Board of Directors on 30 March 2017 and signed on its behalf by:
Robert ArbuthnottDirector
The notes on pages 34 to 145 form an integral part of the Financial Statements.

28
Bank Statement of Financial Position as at 31 December 2016
Reference
to note end of
2016 2015
Assets (USD million)
Cash and due from banks 5,361 13,082
Interest-bearing deposits with banks 9,647 59
Securities purchased under resale agreements and securities borrowing transactions 15 9,467 30,073
Trading financial assets at fair value through profit or loss 16 242,255 294,985 1
ofwhichpositivemarketvaluesfromderivativeinstruments 16 207,437 262,716
Financial assets designated at fair value through profit or loss 17 20,699 12,488 1
Other loans and receivables 18 3,316 3,495
Current tax assets 52 46
Deferred tax assets 14 338 337
Other assets 20 36,700 45,636 1
Property and equipment 22 193 196
Intangible assets 23 404 374
Assets held for sale 28 3,772 –
Total assets 332,204 400,771
Liabilities (USD million)
Deposits 24 457 564
Securities sold under repurchase agreements and securities lending transactions 15 2,821 5,737
Trading financial liabilities at fair value through profit or loss 16 211,647 270,775
ofwhichnegativemarketvaluesfromderivativeinstruments 16 208,458 267,004
Financial liabilities designated at fair value through profit or loss 17 24,683 22,267
Short term borrowings 25 2,667 21,066
Other liabilities 20 31,426 30,822
Provisions 26 27 33
Long term debt 27 31,937 26,596
Liabilities held for sale 28 3,807 –
Total liabilities 309,472 377,860
Shareholders’ equity (USD million)
Share capital 30 12,366 12,366
Share premium 30 12,704 12,704
Retained earnings (2,336) (2,157)
Accumulated other comprehensive income 29 (2) (2)
Total shareholders’ equity 22,732 22,911
Total liabilities and shareholders’ equity 332,204 400,771
1 2015 numbers have been restated to conform to current year’s presentation.
Approved by the Board of Directors on 30 March 2017 and signed on its behalf by:
Robert ArbuthnottDirector
The notes on pages 34 to 145 form an integral part of the Financial Statements.

29Credit Suisse International, Annual Report 2016
Financial Statements for the year ended 31 December 2016
Consolidated Statement of Changes in Equity for the Year ended 31 December 2016
Share Share Retained
2016 Note Capital Premium earnings AOCI Total
2016 Consolidated statement of changes in equity (USD million)
Balance at 1 January 2016 12,366 12,704 (2,164) (2) 22,904
Loss for the year – – (196) – (196)
Foreign exchange translation differences – – – – –
Cash flow hedges – reclassified to profit or loss – – – – –
Total comprehensive loss for the year – – (196) – (196)
Issue of ordinary shares 30 – – – – –
Capital reduction of ordinary shares 30 – – – – –
Decrease in retained earnings due to purchase of business from a common control entity – – – – –
Balance at 31 December 2016 12,366 12,704 (2,360) (2) 22,708
2015 Consolidated statement of changes in equity (USD million)
Balance at 1 January 2015 13,108 12,699 (1,774) (4) 24,029
Loss for the year – – (118) – (118)
Foreign exchange translation differences – – – (2) (2)
Cash flow hedges – reclassified to profit or loss – – – 4 4
Total comprehensive loss for the year – – (118) 2 (116)
Issue of ordinary shares 30 8 5 – – 13
Capital reduction of ordinary shares 30 (750) – – – (750)
Decrease in retained earnings due to purchase of business from a common control entity 45 – – (272) – (272)
Balance at 31 December 2015 12,366 12,704 (2,164) (2) 22,904
There were no dividends paid during 2016 (2015: Nil).
The notes on pages 34 to 145 form an integral part of the Financial Statements.

30
Bank Statement of Changes in Equity for the Year ended 31 December 2016
Share Share Retained Note Capital Premium earnings AOCI Total
2016 Bank statement of changes in equity (USD million)
Balance at 1 January 2016 12,366 12,704 (2,157) (2) 22,911
Loss for the year – – (179) – (179)
Foreign exchange translation differences – – – – –
Cash flow hedges – reclassified to profit or loss – – – – –
Total comprehensive loss for the year – – (179) – (179)
Issue of ordinary shares 30 – – – – –
Capital reduction of ordinary shares 30 – – – – –
Decrease in retained earnings due to purchase of business from a common control entity – – – – –
Balance at 31 December 2016 12,366 12,704 (2,336) (2) 22,732
2015 Bank statement of changes in equity (USD million)
Balance at 1 January 2015 13,108 12,699 (1,815) (4) 23,988
Loss for the year – – (70) – (70)
Foreign exchange translation differences – – – (2) (2)
Cash flow hedges – reclassified to profit or loss – – – 4 4
Total comprehensive loss for the year – – (70) 2 (68)
Issue of ordinary shares 30 8 5 – – 13
Capital reduction of ordinary shares 30 (750) – – – (750)
Decrease in retained earnings due to purchase of business from a common control entity 45 – – (272) – (272)
Balance at 31 December 2015 12,366 12,704 (2,157) (2) 22,911
There were no dividends paid during 2016 (2015: Nil).
The notes on pages 34 to 145 form an integral part of the Financial Statements.

31Credit Suisse International, Annual Report 2016
Financial Statements for the year ended 31 December 2016
Consolidated Statement of Cash Flows for the Year ended 31 December 2016
Reference to note 2016 1 2015 1
Cash flows from operating activities (USD million)
(Loss)/Profit before tax for the period (198) (52)
Adjustments to reconcile net (loss)/profit to net cash generated from/(used in) operating activities (USD million)
Non-cash items included in net loss before tax and other adjustments:
Depreciation, impairment and amortisation 162 200
Depreciation & impairment on investment property 19 37 31
Loss on disposal of property and equipment – 5
Loss on disposal of intangible assets – 7
(Reversal of provision)/impairment on loan commitments (3) 1
Accrued interest on long term debt 5 365 226
Provision for credit losses/ (Release of allowance for loan losses) 7 2 (3)
Foreign exchange (gain)/loss (812) (1,069)
Provisions 26 (6) 19
Total adjustments (255) (583)
Cash generated from/(used in) before changes in operating assets and liabilities (453) (635)
Net (increase)/decrease in operating assets:
Securities purchased under resale agreements and securities borrowing transactions 20,606 3,669
Trading financial assets at fair value through profit or loss 49,342 132,933
Financial assets designated at fair value through profit or loss (8,640) 4,367
Other loans and receivables 179 (158)
Other assets 9,019 3,808
Net (increase)/decrease in operating assets 70,506 144,619
Net increase/(decrease) in operating liabilities:
Deposits (34) (1,905)
Securities sold under repurchase agreements and securities lending transactions (2,916) (2,913)
Trading financial liabilities at fair value through profit or loss (56,811) (135,122)
Financial liabilities designated at fair value through profit or loss 3,616 (4,831)
Short term borrowings (18,399) 3,799
Share Based Compensation (Included in other liabilities & provisions) (38) 39
Other liabilities and provisons 696 (4,729)
Net increase/(decrease) in operating liabilities (73,886) (145,662)
Income taxes refunded – 1
Income taxes paid (4) (11)
Group relief received/(paid) – 5
Net cash (used in)/generated from operating activities (3,837) (1,683)
Cash flows from investing activities (USD million)
Capital expenditures for property, plant equipment and intangible assets 22,23 (191) (213)
Purchase consideration paid on business combinations 45 – (259)
Net cash used in investing activities (191) (472)
Cash flow from financing activities (USD million)
Issuances of long term debt 11,620 6,975
Repayments of long term debt (5,604) (4,427)
Capital reduction of ordinary shares – (750)
Net cash flow generated from/(used in) financing activities 6,016 1,798
Net (decrease)/increase in cash and cash equivalents 1,988 (357)
Cash and cash equivalents at beginning of period 12,692 13,049
Cash and cash equivalents at end of period (USD million) 14,680 12,692
Cash and due from banks 5,490 13,163
Interest-bearing deposits with banks 9,647 59
Demand deposits 24 (457) (530)
Cash and cash equivalents at end of period (USD million) 14,680 12,692
1 The CSi group has elected to present a Consolidated Statement of Cash Flows that analyses all cash flows in total – i.e. including both continuing and discontinued operations; amounts related to discontinued operations are disclosed in Note 28.
RefertoNote30–ShareCapitalandSharePremiumforsignifi-cant non-cash transactions.
The notes on pages 34 to 145 form an integral part of the Financial Statements.
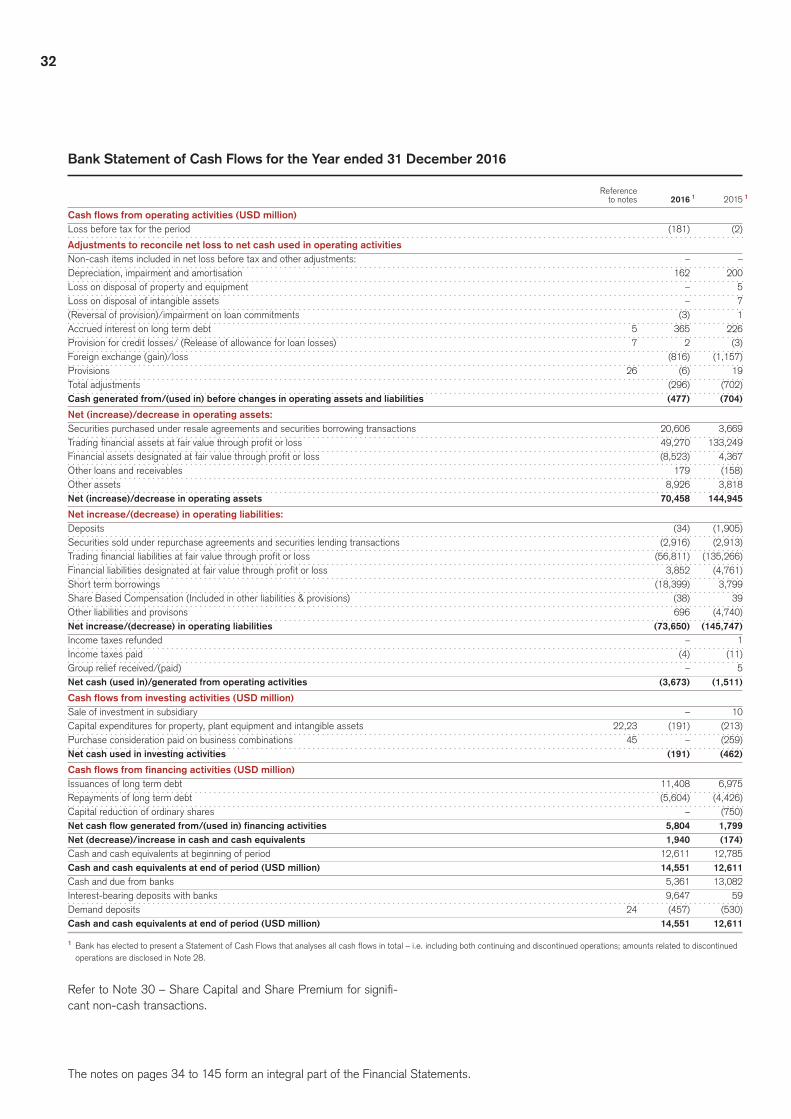
32
Bank Statement of Cash Flows for the Year ended 31 December 2016
Reference to notes 2016 1 2015 1
Cash flows from operating activities (USD million)
Loss before tax for the period (181) (2)
Adjustments to reconcile net loss to net cash used in operating activities
Non-cash items included in net loss before tax and other adjustments: – –
Depreciation, impairment and amortisation 162 200
Loss on disposal of property and equipment – 5
Loss on disposal of intangible assets – 7
(Reversal of provision)/impairment on loan commitments (3) 1
Accrued interest on long term debt 5 365 226
Provision for credit losses/ (Release of allowance for loan losses) 7 2 (3)
Foreign exchange (gain)/loss (816) (1,157)
Provisions 26 (6) 19
Total adjustments (296) (702)
Cash generated from/(used in) before changes in operating assets and liabilities (477) (704)
Net (increase)/decrease in operating assets:
Securities purchased under resale agreements and securities borrowing transactions 20,606 3,669
Trading financial assets at fair value through profit or loss 49,270 133,249
Financial assets designated at fair value through profit or loss (8,523) 4,367
Other loans and receivables 179 (158)
Other assets 8,926 3,818
Net (increase)/decrease in operating assets 70,458 144,945
Net increase/(decrease) in operating liabilities:
Deposits (34) (1,905)
Securities sold under repurchase agreements and securities lending transactions (2,916) (2,913)
Trading financial liabilities at fair value through profit or loss (56,811) (135,266)
Financial liabilities designated at fair value through profit or loss 3,852 (4,761)
Short term borrowings (18,399) 3,799
Share Based Compensation (Included in other liabilities & provisions) (38) 39
Other liabilities and provisons 696 (4,740)
Net increase/(decrease) in operating liabilities (73,650) (145,747)
Income taxes refunded – 1
Income taxes paid (4) (11)
Group relief received/(paid) – 5
Net cash (used in)/generated from operating activities (3,673) (1,511)
Cash flows from investing activities (USD million)
Sale of investment in subsidiary – 10
Capital expenditures for property, plant equipment and intangible assets 22,23 (191) (213)
Purchase consideration paid on business combinations 45 – (259)
Net cash used in investing activities (191) (462)
Cash flows from financing activities (USD million)
Issuances of long term debt 11,408 6,975
Repayments of long term debt (5,604) (4,426)
Capital reduction of ordinary shares – (750)
Net cash flow generated from/(used in) financing activities 5,804 1,799
Net (decrease)/increase in cash and cash equivalents 1,940 (174)
Cash and cash equivalents at beginning of period 12,611 12,785
Cash and cash equivalents at end of period (USD million) 14,551 12,611
Cash and due from banks 5,361 13,082
Interest-bearing deposits with banks 9,647 59
Demand deposits 24 (457) (530)
Cash and cash equivalents at end of period (USD million) 14,551 12,611
1 Bank has elected to present a Statement of Cash Flows that analyses all cash flows in total – i.e. including both continuing and discontinued operations; amounts related to discontinued operations are disclosed in Note 28.
RefertoNote30–ShareCapitalandSharePremiumforsignifi-cant non-cash transactions.
The notes on pages 34 to 145 form an integral part of the Financial Statements.

33Credit Suisse International, Annual Report 2016
Financial Statements for the year ended 31 December 2016
34 1 General34 2 Significant Accounting Policies45 3 Critical Accounting Estimates and Judgements in Applying Accounting Policies 48 4 Segmental Analysis50 5 Net Interest income51 6 Net Commissions and Fee Income51 7 (Additional)/Release of Provision for Credit Losses51 8 Net Gains/(Losses) from Financial Assets/Liabilities at Fair Value through Profit or Loss 52 9 Other Revenues53 10 Compensation and Benefits53 11 General, Administrative and Trading Expenses54 12 Restructuring Expenses54 13 Income Tax55 14 Deferred Taxes56 15 Securities Borrowed, Lent and Purchased/Sold under Resale/Repurchase Agreements57 16 Trading Financial Assets and Liabilities at Fair Value Through Profit or Loss58 17 Financial Assets and Liabilities Designated at Fair Value through Profit or Loss59 18 Other Loans and Receivables59 19 Investment Property60 20 Other Assets and Other Liabilities60 21 Brokerage Receivables and Brokerage Payables61 22 Property and Equipment63 23 Intangible Assets63 24 Deposits64 25 Short Term Borrowings64 26 Provisions65 27 Long Term Debt65 28 Discontinued Operations and Assets Held for Sale66 29 Accumulated Other Comprehensive Income67 30 Share Capital and Share Premium67 31 Retirement Benefit Obligations70 32 Employee Share-based Compensation and Other Compensation Benefits74 33 Related Parties77 34 Employees77 35 Derivatives and Hedging Activities80 36 Guarantees and Commitments82 37 Interests in Other Entities88 38 Financial Instruments121 39 Assets Pledged or Assigned121 40 Derecognition123 41 Financial Instruments Risk Position136 42 Offsetting of Financial Assets and Financial Liabilities140 43 Capital Adequacy141 44 Country-by-Country Reporting143 45 Business Combinations143 46 CSi’s Subsidiaries and Associates
Notes to the consolidated financial statements
Page Note Description

34
Notes to the Financial Statements for the year ended 31 December 20161 General
Credit Suisse International (‘CSi’ or the ‘Bank’) is a bank domiciled in the United Kingdom. The address of the Bank’s registered officeisOneCabotSquare,London,E144QJ.TheConsolidatedFinancial Statements for the year ended 31 December 2016
comprise CSi and its subsidiaries (together referred to as the ‘CSi group’). The Consolidated Financial Statements were authorised for issue by the Directors on 30 March 2017.
2 Significant Accounting Policies
a) Statement of complianceBoth theBankfinancial statementsand theCSigroupfinancialstatements have been prepared on a going concern basis and approved by the Directors in accordance with International Finan-cial Reporting Standards as adopted by the EU (‘Adopted IFRS’). On publishing the parent company financial statements heretogetherwiththeCSigroupfinancialstatements,theBankistak-ing advantage of the exemption in s408 of the Companies Act 2006 not to present its individual Statement of Income and related notes.
b) Basis of preparationThe Consolidated Financial Statements are presented in United States Dollars (‘USD’) rounded to the nearest million. They are prepared on the historical cost basis except that the following assetsandliabilitiesarestatedattheirfairvalue:derivativefinan-cialinstruments,financialinstrumentsheldfortrading,andfinan-cial instruments designated by CSi group as at fair value through profitorloss.
The preparation of Financial Statements in conformity with adopted IFRS requires management to make judgements, esti-mates and assumptions that affect the application of policies and reported amounts of assets and liabilities, income and expenses. The estimates and associated assumptions are based on historical experience and various other factors that are believed to be rea-sonable under the circumstances, the results of which form the basis of making the judgements about carrying values of assets and liabilities that are not readily apparent from other sources. Actual results may differ from these estimates. Critical accounting estimates and judgements applied to these Financial Statements are set out in Note 3 – Critical Accounting Estimates and Judge-ments in Applying Accounting policies.
The estimates and underlying assumptions are reviewed on an ongoing basis. Revisions to accounting estimates are recognised in the period in which the estimate is revised if the revision affects only that period or in the period of revision and future periods if the revision has a significant effect on both current and futureperiods.
CSGcontinuestoprovideconfirmationthatitwillprovidesuffi-cientfundingtotheBanktoensurethatitmaintainsasoundfinan-cial situation and is in a position to meet its debt obligations for the
foreseeable future. Accordingly the Directors have prepared these accounts on a going concern basis.
Standards and Interpretations effective in the current period The CSi group has adopted the following amendments in the cur-rent year: p Annual Improvements to IFRSs 2012-2014 Cycle: In Septem-
ber 2014, the IASB issued ‘Annual Improvements to IFRSs 2012-2014 cycle’ (Improvements to IFRSs 2012-2014). The adoption of the Improvements to IFRSs 2012-2014 on 1 Jan-uary2016,didnothaveanimpacttotheCSigroup’sfinancialposition,resultsofoperationorcashflows.
p Amendments to IAS 27: Equity Method in Separate Financial Statements: In August 2014 the IASB issued ‘Equity Method in Separate Financial Statements’ (Amendments to IAS 27). The Amendments reinstate the equity method as an account-ing option for investments in subsidiaries, joint ventures and associates inanentity’s separatefinancial statements.Theadoption of the Amendments to IAS 27 on 1 January 2016, didnothavean impact to theCSigroup’sfinancialposition,resultsofoperationorcashflows.
p Disclosure Initiative (Amendments to IAS 1): In December 2014, the IASB issued Amendments to IAS 1 as part of their Disclosure Initiative. The Amendments clarify guidance regard-ingmateriality,notestothefinancialstatementsandthepre-sentation of the Statement of Financial Position and Statement of Profit or Loss and Other Comprehensive income. TheAmendments allow entities to use more judgement when pre-paringandpresentingfinancial statements.As theAmend-ments to IAS 1 impact disclosures only, the adoption on 1 Jan-uary2016,didnothaveanimpacttotheCSigroup’sfinancialposition,resultsofoperationorcashflows.
p Investment entities: Applying the Consolidation Exception (Amendments to IFRS 10, IFRS 12 and IAS 28): In December 2014, the IASB issued ‘Investment Entities: Applying the Con-solidation Exception’ (Amendments to IFRS 10, IFRS 12 and IAS 28). The Amendments address issues that have arisen in relation to the exemption from consolidation for investment entities. The adoption of the Amendments to IFRS 10, IFRS 12 and IAS 28 did not have an impact on the CSi group’s financialposition,resultsofoperationorcashflows.

35Credit Suisse International, Annual Report 2016
Notes to the Financial Statements for the year ended 31 December 2016
Standards and Interpretations endorsed by the EU and not yet effective The CSi group is not yet required to adopt the following standards and interpretations which are issued by the IASB but not yet effective.p IFRS 9 Financial Instruments: In November 2009 the IASB
issued IFRS 9 ‘Financial Instruments’ (IFRS 9) covering the classificationandmeasurementoffinancialassetswhichintro-ducesnewrequirementsforclassifyingandmeasuringfinan-cial assets. In October 2010, the IASB reissued IFRS 9, which incorporatednewrequirementsontheaccountingforfinancialliabilities. In July 2014, the IASB issued IFRS 9 as a complete standard. The Standard includes requirements for recognition and measurement, impairment, derecognition and general hedge accounting. The amendments to IFRS 7 resulting from IFRS 9 also require new disclosures as well as the revision of current disclosure requirements.
UnderIFRS9,financialassetswillbeclassifiedonthebasisoftwocriteria:1)thebusinessmodelofhowthefinancialassetsaremanagedand2)thecontractualcashflowcharacteristicsof thefinancialasset. These factorswilldeterminewhetherthe financial assets aremeasured at AmortisedCost, Fairvalue through Other Comprehensive Income or Fair value throughProfit&Loss.Theaccounting forfinancial liabilitiesremainslargelyunchangedexceptforthosefinancialliabilitiesdesignatedatfairvaluethroughprofitorloss,wherethegainsand losses arising from changes in credit risk will be presented inOtherComprehensiveIncomeratherthanprofitorloss.TheCSigrouphasnotyet identifiedanymaterialchangesto theclassificationandmeasurementoffinancial instrumentshow-ever this review remains ongoing.
Under IFRS 9, the new impairment requirements will primarily applytofinancialassetsmeasuredatamortisedcostandfairvalue through other comprehensive income as well as certain loan commitments and financial guarantee contracts. Theimpairment requirements will change from an incurred loss model to an expected loss model by incorporating reasonable and supportable forecasts of future economic conditions avail-able at the reporting date. If the credit risk has increased sig-nificantly since initial recognition of the financial instrument, the impairment measurement will change from 12-month expected credit losses (Stage 1) to lifetime expected credit losses (Stage 2). Therefore impairment will be recognized earlier than is the case under IAS 39 because IFRS 9 requires the recognition of expected credit losses before a loss event occurs and the financial asset is deemed to be credit-impaired (Stage 3). The definition of credit-impaired under IFRS 9 will be similar to the current indicators in IAS 39 of objective evidence of impair-ment. The assessment of a significant increase in credit risk since initial recognition will be based on different quantitative and qualitative factors that will be relevant to the particular financial instrument in scope.
The CSi group has established a cross-functional implementa-tion team and governance structure for the project. The CSi group has decided on a point-in-time, forward-looking approach, incorporating probability of default, loss given default and exposure at default, as an expected credit loss (“ECL”)
methodologyforfinancialinstrumentssubjecttoStage1andStage2.The IFRS9definitionofdefault is intended tobealignedwith thecurrent regulatorydefinitionofdefault.TheCSi group is currently in the process of building the ECL mod-els. Once completed, this will be followed by a test phase and subsequently a parallel-run. The CSi group expects that the new ECL methodology would generally result in increased and more volatile allowance for loan losses. The main impact driv-ers include:p the requirement to measure lifetime expected credit losses,
if there isasignificant increase incredit risksince initialrecognitiononafinancialinstrument;
p the point of time in the economic cycle at the adoption date because of the new requirement to incorporate reasonable and supportable forward looking information and macro-economic factors; and
p thecreditqualityof thefinancial instruments inscopeatthe adoption date.
IFRS 9 is effective for annual periods beginning on or after 1 January 2018. However certain sections of IFRS 9 relating tofinancial liabilitiesdesignatedatfairvaluethroughprofitorloss can be early adopted in isolation. The CSi group does not plan to early adopt. Upon adoption the CSi group expects an adjustment to be posted to retained earnings for any changes in impairment losses. As the implementation progresses, the CSi group will continue evaluating the extent of the impact of adopting IFRS 9, however it is not practical to disclose reliable financialimpactestimatesuntiltheimplementationprogrammeis further advanced. Impacts are expected to be disclosed in the financial statements for the year ended 31December2017.
p IFRS 15 Revenue from Contracts with Customers: In May 2014, the IASB issued ‘Revenue from Contracts with Customers’ (IFRS 15). IFRS 15 establishes a single, comprehensive frame-work for revenue recognition. The core principle of IFRS 15 is that an entity will recognise revenue to depict the transfer of promised goods or services to customers in an amount that reflects the consideration to which the entity expects to be enti-tled in exchange for those goods or services. IFRS 15 also includes disclosure requirements to enable users of financial statements to understand the nature, amount, timing and uncertainty of revenue and cash flows arising from contracts with customers. In April 2016, the IASB issued Clarifications to IFRS 15 ‘Revenue from Contracts with Customers’ (Clarifica-tions to IFRS 15), which is yet to be endorsed by the EU. The Clarifications to IFRS 15 are intended to address implementa-tion questions that were discussed by the Joint Transition Resource Group for Revenue Recognition on licenses of intel-lectual property, identifying performance obligations, principal versus agent application guidance and transition. IFRS 15 is effective for annual reporting periods beginning on or after 1 January 2018. The CSi group has established a cross-func-tional implementation team and governance structure for the project. The CSi group’s implementation efforts include the identification of revenue within the scope of the guidance, as well as the evaluation of revenue contracts under the new guid-ance. The guidance does not apply to revenue associated with

36
financial instruments, including loans and securities that are accounted for under other IFRSs. The CSi group has not yet identified any material changes in the timing and amount of rev-enue recognition however this evaluation remains ongoing.
Standards and Interpretations not endorsed by the EU and not yet effective The CSi group is not yet required to adopt the following standards and interpretations which are issued by the IASB but not yet effec-tive and have not yet been endorsed by the EU.p IFRS 16 Leases: In January 2016 the IASB issued IFRS 16
‘Leases’ (IFRS 16) which sets out the principles for the recog-nition, measurement, presentation and disclosure of leases for both lessees and lessors. IFRS 16 includes disclosure require-ments to provide more information about the amount, timing and uncertainty of cash flows arising from leases. Lessoraccounting is substantially unchanged compared to the current accounting guidance. Under the current lessee accounting modeltheCSigroupisrequiredtodistinguishbetweenfinanceleases, which are recognised on balance sheet, and operating leases, which are not. IFRS 16 will require lessees to present a right-of-use asset and a corresponding lease liability on the balance sheet for all leases with a lease term of greater than twelve months, unless the underlying asset is of low value. IFRS 16 is effective for annual periods beginning on or after 1 January 2019. The CSi group has established a cross-func-tional implementation team and governance structure for the project. The CSi group is currently reviewing its existing con-tracts to determine the impact of the adoption of IFRS 16. The CSi group expects an increase in total assets and total liabili-ties as a result of recognising right-of use-assets and lease liabilities for all leases under the new guidance and is currently evaluating the extent of the impact of the adoption of IFRS 16 ontheCSigroup’sresultsofoperationsandcashflows.
p Amendments to IAS 12: Income Taxes: In January 2016, the IASB issued ‘Recognition of Deferred Tax Assets for Unreal-ised Losses’ (Amendments to IAS 12). The Amendments clar-ify how to account for deferred tax assets related to debt instruments measured at fair value. The adoption of the Amendments to IAS 12 on 1 January 2017, will not have a materialimpacttotheCSigroup’sfinancialposition,resultsofoperationorcashflows.
p Disclosure Initiative (Amendments to IAS 7): In January 2016, the IASB issued amendments to IAS 7 as part of their Disclo-sure Initiative. The Amendments require enhanced statement ofcashflowdisclosuresregardingchangesinliabilitiesarisingfromfinancingactivities, includingchanges fromcashflowsand non-cash changes. As the Amendments to IAS 7 impact disclosures only, the adoption on 1 January 2017, will not have animpacttotheCSigroup’sfinancialposition,resultsofoper-ationorcashflows.
p Amendments to IFRS 2: Share-based Payment: In June 2016, the IASB issued narrow scope amendments to IFRS 2 Share-based payments (Amendments to IFRS 2). The Amendments clarify how to account for certain types of share-based pay-ment transactions. The Amendments to IFRS 2 are effective for annual periods beginning on or after 1 January 2018, with
early application permitted. The CSi group is currently evaluat-ing the impact of adopting the Amendments to IFRS 2.
p IFRIC 22: In December 2016, the IASB issued IFRIC 22 “For-eign Currency Transactions and Advance Consideration” (IFRIC22). IFRIC22clarifiesthedateof thetransactionforthe purposes of determining the exchange rate used on initial recognition of related asset, expense or income, when an entity has received or paid advance consideration in a foreign currency. IFRIC 22 is effective for annual periods beginning on or after 1 January 2018. The CSi group is currently evaluating the impact of adopting IFRIC 22.
p Amendments to IAS 40: Investment Property: In December 2016, the IASB issued “Transfers of Investment Property” (Amendments to IAS 40). The Amendments clarify the require-ments on when a company should transfer a property asset to, or from, investment property. The Amendments to IAS 40 are effective for annual periods beginning on or after 1 January 2018, with early application permitted. The CSi group does not expect the adoption the Amendments to IAS 40 to have a materialimpacttotheCSigroup’sfinancialposition,resultsofoperationorcashflows.
p Annual Improvements to IFRSs 2014-2016 Cycle: In Decem-ber 2016, the IASB issued ‘Annual Improvements to IFRSs 2014-2016 cycle’ (Improvements to IFRSs 2014-2016). The Improvements to IFRSs 2014-2016 are effective for annual periods beginning on or after 1 January 2017. The CSi group is currently evaluating the impact of adopting the Improve-ments to IFRSs 2014-2016.
The accounting policies have been applied consistently by the CSi groupentities.Certainreclassificationshavebeenmadetotheprior year Consolidated Financial Statements of the CSi group to conform to the current year’s presentation and had no impact on net income/ (loss) or total shareholders’ equity.
c) Basis of consolidationThe consolidated financial statements include the results and posi-tions of the CSi group and its subsidiaries (which includes consoli-dated structured entities). Subsidiaries are entities controlled by the CSi group. The CSi group controls an entity when it is exposed to, or has rights to, variable returns from its involvement with the entity and has the ability to affect those returns through its power over the entity. When the CSi group has decision making rights, it assesses whether it controls an entity and determines whether it is a principal or an agent. The CSi group also determines whether another entity with decision-making rights is acting as an agent for the CSi group. An agent is a party primarily engaged to act on behalf and for the benefit of another party (the principal) and there-fore does not control the entity when it exercises its decision-mak-ing authority. A decision maker considers the overall relationship between itself and other parties involved with the entity, in particu-lar all of the factors below, in determining whether it is an agent:p The scope of its decision making authority over the entityp The rights held by other partiesp The remuneration to which it is entitledp The decision maker’s exposure to variability of returns from
other interests that it holds in the entity

37Credit Suisse International, Annual Report 2016
Notes to the Financial Statements for the year ended 31 December 2016
TheCSigroupmakes significant judgementsandassumptionswhen determining if it has control of another entity. The CSi group may control an entity even though it holds less than half of the vot-ing rights of that entity, for example if the CSi group has control over an entity on a de facto basis because the remaining voting rights are widely dispersed and/or there is no indication that other shareholders exercise their votes collectively. Conversely, the CSi group may not control an entity even though it holds more than half of the voting rights of that entity, for example where the CSi group holds more than half of the voting power of an entity but does not control it, as it has no right to variable returns from the entity and is not able to use its power over the entity to affect those returns. Thefinancialstatementsofsubsidiariesareincludedintheconsol-idated financial statements from the date which control com-mences until the date on which control ceases. The CSi group reassesses consolidation status on at least a quarterly basis.
The effects of intra-group transactions and balances, and any unrealised income and expenses arising from such transactions havebeeneliminatedinpreparingtheconsolidatedfinancialstate-ments. Unrealised gains arising from transactions with equity-ac-counted investees are eliminated against the investment to the extent of the CSi group’s interest in the investee. Unrealised losses are eliminated in the same way as unrealised gains, but only to the extent that there is no evidence of impairment.
CSi group accounts for a combination of entities or businesses under common control at book value. If the consideration trans-ferred in such a transaction is higher than the carrying amount of the net assets received and CSi group is the acquirer in the trans-action, the difference is recorded as a reduction in retained earn-ings. If CSi group is the seller in the transaction, the difference is recorded as an increase in Capital contribution. If the consider-ation transferred in such a transaction is lower than the carrying amount of the net assets received and CSi group is the acquirer in the transaction, the difference is recorded as an increase in Capi-tal contribution. If CSi group is the seller in the transaction, the difference is recorded as a reduction in retained earnings. No goodwill or gain or loss is recorded in such a transaction.
d) Equity method investmentsThe CSi group’s interest(s) in an associate(s) is/are accounted for using the equity method. Associates are entities in which the CSi grouphassignificant influence,butnotcontrol (or jointcontrol),over theoperatingandfinancialmanagement policy decisions.This is generally demonstrated by the CSi group holding in excess of 20%, but no more than 50%, of the voting rights. The CSi groupmakessignificantjudgementsandassumptionswhendeter-miningifithassignificantinfluenceoveranotherentity.TheCSigroupmayhavesignificantinfluencewithregardstoanentityeventhough it holds less than 20 per cent of the voting rights of that entity, for example, if the CSi group has the power to participate in thefinancialandoperatingdecisionsbysittingontheBoard.Con-versely,theCSigroupmaynothavesignificantinfluencewhenitholds more than 20 per cent of the voting rights of that entity as it doesnothavethepowertoparticipateinthefinancialandoperat-ing decisions of an entity.
Equity method investments are initially recorded at cost and increased (or decreased) each year by the CSi group’s share of the
post-acquisitionnetincome(orloss),orothermovementsreflecteddirectly in the equity of the equity method investment, until the dateonwhichsignificantinfluence(orjointcontrol)ceases.
e) Foreign currencyThe Bank’s functional currency is United States Dollars (‘USD’). Transactions denominated in currencies other than the functional currency of the reporting entity are translated at the foreign exchange rate ruling at the date of the transaction. Monetary assets and liabilities denominated in foreign currencies at the reporting date are translated to USD at the foreign exchange rate ruling at that date. Foreign exchange differences arising from translation are recognised in the Consolidated Statement of Income. Nonmonetary assets and liabilities, unless revalued at fair value, denominated in foreign currencies at the reporting date are not revalued for movements in foreign exchange rates.
Assets and liabilities of CSi group companies with functional currencies other than USD are translated to USD at foreign exchange rates ruling at the Statement of Financial Position date. The revenue and expenses of these CSi group companies are translated to USD at the average foreign exchange rates for the year. The resulting translation differences are recognised directly in a separate component of equity. On disposal, these translation differences are reclassified to the Consolidated Statement ofIncome as part of gain or loss on disposal.
f) Cash and due from banks For the purpose of preparation and presentation of the Consolidated Statement of Cash Flows, cash and cash equivalents comprise the components of cash and due from banks that are short term, highly liquid instruments with original maturities of three months or less which are subject to an insignificant risk of changes in their fair value and that are held or utilised for the purpose of cash management.
Where cash is received or deposited as collateral, the obliga-tion to repay or the right to receive that collateral is recorded in ‘Other assets’ or ‘Other liabilities’.
The CSi group collects and remits cash between its clients and various Central Counterparty Clearing Houses (‘CCPs’), Brokers andDepositBanks.WheretheCSigroupobtainsbenefitsfromorcontrols the cash from its clients, the cash is an asset of the CSi group and is included within cash and due from banks on the Con-solidated Statement of Financial Position and the corresponding liability is included in ‘Other liabilities’. Where the CSi group has contractually agreed with the client that:p The CSi group will pass through to the client all interest paid by
the CCP, Broker or Deposit Bank on cash deposits;p The CSi group is not permitted to transform cash balances into
other assets; and p The CSi group does not guarantee and is not liable to the client
for the performance of the CCP, Broker or Deposit Bank.Then cash collected from clients and remitted to the CCP, Broker orDepositBankisnotreflectedontheCSigroup’sConsolidatedStatement of Financial Position. Examples include initial margin where the CSi group acts as Broker in an agency capacity and cash designated as client money under the Client Assets (‘CASS’) client money rules of the UK’s Financial Conduct Authority (‘FCA’).

38
g) Interest income and expenseInterest income and expense includes interest income and expense on the CSi group’s financial instruments owned and financialinstruments sold not yet purchased, short-term and long-term bor-rowings, reverse repurchase and repurchase agreements and securities borrowed and securities lending transactions. Interest incomeandexpensedoesnot include interestflowson theCSigroup’s trading derivatives (except for hedging relationships) and certain financial instruments classified as at fair value throughprofitorlosswhichareincludedin‘Netgainsfromfinancialassets/liabilitiesatfairvaluethroughprofitorloss’.Interestincomeandexpense is accrued, and any related net deferred premiums, dis-counts, origination fees or costs are amortised as an adjustment to the yield over the life of the related asset or liability.
h) Commissions and feesFee and commission revenue is recognised from a diverse range of services provided to its customers and is accounted for as follows:p Incomeearnedon theexecutionof a significantact is rec-
ognised as revenue when the act is completed (for example, fees arising from negotiating, or participating in the negotiation of, a transaction for a third party, such as fees from mergers and acquisitions and other corporate finance advisoryservices);
p Income earned from the provision of services is recognised as revenue as the services are provided (for example, portfolio management, granting of loan commitments where it is not probable that theCSigroupwillenter intoaspecific lendingarrangement, customer trading and custody services);
p Income which forms an integral part of the effective interest rateofafinancialinstrumentisrecognisedasanadjustmenttothe effective interest rate (for example, certain loan commit-ment fees where it is probable that the CSi group will enter into a specific lending agreement) and recorded in ‘Interestincome’; and
p Performance-linked fees or fee components are recognised whentherecognitioncriteriaarefulfilled.
Incremental costs that are directly attributable to securing invest-ment management contracts may be deferred to match the reve-nue recognised in relation to that transaction. These costs are recognised as and when the CSi group recognises the related revenue.
i) Income TaxIncome tax recognised in the Consolidated Statement of Income and the Statement of Other Comprehensive Income for the year comprises current and deferred taxes. Income tax is recognised in the Consolidated Statement of Income unless it relates to items recognised in the Statement of Other Comprehensive Income or directly in equity, in which case the income tax is recognised in the Statement of Other Comprehensive Income or directly in equity respectively. For items initially recognised in equity and subse-quently recognised in the Consolidated Statement of Income, the related income tax initially recognised in equity is also subse-quently recognised in the Consolidated Statement of Income.
Current tax is the expected tax payable on the taxable income for the year and includes any adjustment to tax payable in respect of previous years. Current tax is calculated using tax rates enacted or substantively enacted at the reporting date. Withholding taxes are also treated as income taxes.
For UK corporation tax purposes CSi may surrender or claim certain losses from another UK group company. The surrendering company will be compensated in full for the value of the tax losses surrendered to the claimant company. The surrendering entity will showabenefitreceivedforthe lossessurrenderedwhichwillberecorded as a reduction to current tax expense and taxes payable whereas the claimant entity will have an increase in current tax expense and taxes payable respectively.
Deferred tax is provided using the Statement of Financial Posi-tion liability method, providing for temporary differences between thecarryingamountsofassetsandliabilitiesforfinancialreportingpurposes and their tax-base. The amount of deferred tax provided is based on the amount at which it is expected to recover or settle the carrying amount of assets and liabilities on the Consolidated Statement of Financial Position, using tax rates that are expected to be applied to the temporary differences when they reverse, based on the laws that have been enacted or substantively enacted at the Consolidated Statement of Financial Position date.
Deferred tax is not recognised for the following temporary dif-ferences: the initial recognition of assets or liabilities in a transac-tion that is not a business combination and that affects neither accountingnor taxableprofitor lossanddifferences relating toinvestments in subsidiaries and jointly controlled entities to the extent that it is probable that they will not reverse in the foresee-able future. In addition, deferred tax is not recognised for taxable temporary differences arising on the initial recognition of goodwill.
Deferred tax asset is recognised only to the extent that it is probablethatfuturetaxableprofitswillbeavailableagainstwhichthe asset can be utilised. Deferred tax assets are reduced to the extentthatitisnolongerprobablethattherelatedtaxbenefitwillbe realised. Tax assets and liabilities of the same type (current or deferred) are offset when they arise from the same tax reporting group, they relate to the same tax authority, the legal right to offset exists, and they are intended to be settled net or realised simultaneously
Additional income taxes that may arise from the distribution of dividends are recognised at the same time as the liability to pay the related dividend arises. Information as to the calculation of income tax recognised in the Consolidated Statement of Income for the periods presented is included in Note 13 – Income Tax.
Tax ContingenciesSignificant judgement isrequiredindeterminingtheeffectivetaxrate and in evaluating certain tax positions. The CSi group may accrue for tax contingencies on a best estimate basis. Tax contin-gency accruals are adjusted due to changing facts and circum-stances, such as case law, progress of tax authority audits or when an event occurs that requires a change to the tax contin-gency accruals. Management regularly assesses the appropriate-ness of provisions for income taxes. Management believes that it has appropriately accrued for any contingent tax liabilities.
39Credit Suisse International, Annual Report 2016
Notes to the Financial Statements for the year ended 31 December 2016
j) Securities purchased or sold under resale agreements or repurchase agreementsSecurities purchased under resale agreements (‘reverse repur-chase agreements’) and securities sold under repurchase agree-ments (‘repurchase agreements’) do not constitute economic sales andarethereforetreatedascollateralisedfinancingtransactions.In reverse repurchase agreements, the cash advanced, including accrued interest is recognised on the Consolidated Statement of Financial Position as an asset. In repurchase agreements, the cash received, including accrued interest is recognised on the Consolidated Statement of Financial Position as a liability.
Securities received under reverse repurchase agreements and securities delivered under repurchase agreements are not rec-ognised or derecognised unless all or substantially all the risks and rewards are obtained or relinquished. The CSi group monitors the market value of the securities received or delivered on a daily basis and provides or requests additional collateral in accordance with the underlying agreements.
Interest earned on reverse repurchase agreements and inter-est incurred on repurchase agreements is recognised on an effec-tive yield basis and recorded as interest income or interest expense.
k) Securities borrowing and lending transactionsSecurities borrowing and securities lending transactions are gen-erally entered into on a collateralised basis. The transfer of the securitiesthemselvesisnotreflectedontheConsolidatedState-ment of Financial Position unless the risks and rewards of owner-ship are also transferred. If cash collateral is advanced or received, securities borrowing and lending activities are recorded at the amount of cash collateral advanced (cash collateral on securities borrowed) or received (cash collateral on securities lent). The sale of securities received in a security borrowing transaction results in the recognition of a trading liability (short sale).
The CSi group monitors the market value of the securities bor-rowed and lent on a daily basis and provides or requests additional collateral in accordance with the underlying agreements. Fees are recognised on an accrual basis and interest received or paid is rec-ognised on an effective yield basis and recorded as interest income or interest expense.
l) Financial assets and liabilities at fair value through profit or lossTheCSigroupclassifiescertainfinancialassetsandliabilitiesaseitherheldfortradingordesignatedatfairvaluethroughprofitorloss. Financialassetsand liabilitieswitheitherclassificationarecarriedatfairvalue.Fairvalueisdefinedasthepricethatwouldbe received to sell an asset or transfer a liability in an orderly trans-action between market participants at the measurement date. When determining the fair value of an instrument, the CSi group maximises the use of relevant observable inputs and minimises the use of unobservable inputs. Where the fair value is not determined using a quoted price in an active market for an identical asset or liability or a valuation technique that uses data from observable inputs, then reserves are established for unrealised gains or losses evident at the inception of the contracts so that no gain or loss is
recorded at inception. Such reserves are amortised to income over the life of the instrument or released into income when observable inputs becomes available. Related realised and unreal-ised gains and losses are included in ‘Net gains/(losses) from financialassets/liabilitiesatfairvaluethroughprofitorloss’.
Trading financial assets and financial liabilities at fair value through profit or lossTradingfinancialassetsandfinancialliabilitiesincludemainlydebtand equity securities, derivative instruments, loans and precious metals. These assets and liabilities are included as part of the trading portfolio based on management’s intention to sell the assets or repurchase the liabilities in the near term, and are carried at fair value.
Financial instruments designated as held at fair value through profit or lossFinancial assets and liabilities are only designated as held at fair valuethroughprofitorlossiftheinstrumentscontainanembeddedderivative, or when doing so results in more relevant information, because either:(i) iteliminatesorsignificantlyreducesaninconsistencyinmea-
surement or recognition (sometimes referred to as an ‘accounting mismatch’) that would otherwise arise from mea-suring assets or liabilities or recognising the gains and losses on them on different bases. This election is used for instru-ments that would otherwise be accounted for under an accrual method of accounting where their economic risks are hedged with derivative instruments that require fair value accounting.Thiselectioneliminatesorsignificantlyreducesthe measurement mismatch between accrual accounting and fair value accounting; or
(ii) agroupoffinancialassets,financialliabilitiesorbothisman-aged and its performance is evaluated on a fair value basis, in accordance with a documented risk management or invest-ment strategy, and information about the CSi group is pro-vided internally on that basis to the entity’s key management personnel. This election is used for instruments purchased or issued by business units that manage their performance on a fair value basis. For all instruments elected under this crite-rion, the business maintains a documented strategy that states that these instruments are risk managed on a fair value basis. Additionally, management relies upon the fair value of these instruments in evaluating the performance of the business.
The Fair Value Option has been applied to certain debt instru-ments,equitysecuritiesandloansandtherelatedfinancialassetsandfinancial liabilitiesarepresentedas ‘Financialassetsdesig-natedatfairvaluethroughprofitorloss’or‘Financialliabilitiesdes-ignatedatfairvaluethroughprofitorloss’.Movementsin‘Finan-cial assets designated at fair value through profit or loss’ or‘Financial liabilitiesdesignatedatfairvaluethroughprofitorloss’arerecognisedin‘Netgains/(losses)fromfinancialassets/liabili-tiesatfairvaluethroughprofitorloss’.Oncedesignatedthiselec-tion is irrevocable.

40
m) Other loans and receivablesOther loans and receivables are initially recorded at fair value, plus any directly attributable transaction costs and subsequently are amortised on an effective interest method, less impairment losses. In the event of an impairment loss the effective interest will be re-estimated.
When calculating the effective interest, the CSi group esti-matescashflowsconsideringallcontractualtermsofthefinancialinstruments including premiums, discounts, fees and transactions costs but not future credit losses.
Impairment on other loans and receivablesThe CSi group assesses at each Consolidated Statement of Finan-cialPositiondatewhetherthereisobjectiveevidencethatasignifi-cantloanpositionoraportfolioofloansisimpaired.Asignificantindividual loan position or portfolio of loans is impaired and impair-ment losses are incurred if, and only if, there is objective evidence of impairment as a result of one or more loss events that occurred after the initial recognition of the asset and prior to the Consoli-dated Statement of Financial Position date (‘a loss event’) and that loss event or events has had an impact on the estimated future cashflowsofthefinancialassetortheportfoliothatcanbereliablyestimated.
All individually significant loans are assessed for specificimpairment.Individuallysignificantloansfoundnottobeimpairedare then collectively assessed for impairment that has been incurred,butnotyetbeenidentified.Loansthatarenotindividuallysignificantareassessedcollectivelyforimpairment.Loanssubjectto collective impairment testing are grouped to loan portfolios on the basis of similar risk, industry or country rating. Objective evi-dence thatan individual loan is impairedcan includesignificantfinancialdifficultyof theborrower,defaultordelinquencyby theborrower and indications that a borrower will enter bankruptcy. Objective evidence that a loan portfolio is impaired can include changes of the payment status of borrowers in the group or eco-nomic conditions that correlate with defaults in the group.
Many factors can affect the CSi group’s estimate of the impair-ment losses on loans, including volatility of default probabilities, rating migrations and loss severity. The estimate of the compo-nentof theallowance for specifically identifiedcredit lossesonimpaired loans is based on a regular and detailed analysis of each loan in the portfolio considering collateral and counterparty risk. For certain non-collateral dependent impaired loans, impairment charges are measured using the present value of estimated future cashflowsdiscountedattheasset’soriginaleffectiveinterestrate.For collateral dependent impaired loans, impairment charges are measured using the value of the collateral.
The estimation of impairment for a loan portfolio involves applyinghistoricallossexperience,adjustedtoreflectcurrentmar-ket conditions, to homogeneous loans based on risk rating and product type. The amount of the loss is recognised in the Consol-idated Statement of Income within ‘Release of provision for credit losses’. The methodology and assumptions used for estimating futurecashflowsarereviewedregularlytoreduceanydifferencesbetween loss estimates and actual loss experience. An allowance for impairment is reversed only if the amount of the impairment
loss decreases and the decrease can be objectively related to an event occurring after the impairment was recognised.
Write-off of loansWhen it is considered certain that there is no realistic prospect of recovery and all collateral has been realised or transferred to the CSi group, the loan and any associated allowance is written off. Any repossessed collateral is initially measured at fair value. The subsequent measurement will depend on the nature of the collateral.
Renegotiated loansWhere possible, the CSi group seeks to restructure loans rather than to take possession of collateral. This may involve extending thepaymentarrangementsand theagreementofmodified loanconditions. Once the terms have been renegotiated any impair-ment is measured using the effective interest rate as calculated beforethemodificationoftermsandtheloanisnolongerconsid-ered past due. Management continuously reviews renegotiated loans to ensure that all criteria are met and that future payments are likely to occur. The loans continue to be subject to an individ-ual or collective impairment assessment, calculated using the loan’s original effective interest rate.
Loan commitmentsCertainloancommitmentsareclassifiedasfinancialassets/liabili-tiesatfairvaluethroughprofitorlossinaccordancewiththepolicydiscussed in note l. All other loan commitments remain off-balance sheet. If such commitments are considered onerous, a provision is raised in accordance with IAS 37, “Provisions, Contingent Liabili-ties and Contingent Assets” (IAS 37) based upon management’s best estimate of the expenditure required to settle the obligation.
n) Investment propertyInvestment property is initially measured at cost, and subsequent to initial recognition is measured using the cost model. Investment property held under the cost model is subsequently measured at cost less depreciation and any provision for impairment unless held for sale. If held for sale it will be subsequently measured at the lower of carrying amount and fair value less costs to sell.
To assess for impairment, on an annual basis an independent external valuer is engaged to assist in the determination of the fair value using recognised valuation techniques. Consideration is giventothespecificnatureofthepropertiestoreflecttheirhighestand best use including any appropriate business plan.
o) Property and equipmentProperty and equipment are stated at historical cost less accumu-lated depreciation and accumulated impairment losses. Historical cost includes expenditure that is directly attributable to the acquisi-tion of the items.
Subsequent costs are included in the asset’s carrying amount or are recognised as a separate asset, as appropriate, only when it isprobablethatfutureeconomicbenefitsassociatedwiththeitemwillflowtotheCSigroupandthecostoftheitemcanbereliablymeasured. All other repairs and maintenance are charged to the

41Credit Suisse International, Annual Report 2016
Notes to the Financial Statements for the year ended 31 December 2016
ConsolidatedStatementof Incomeduring thefinancialperiod inwhich they are incurred. Depreciation on assets is calculated using the straight-line method to allocate their cost to their residual values over their maximum useful lives, as follows:
Long leasehold buildings 67 years
lower of lease term or useful life, Leasehold improvements generally not exceeding 10 years
Computer equipment 2 – 7 years
Office equipment 5 years
The carrying amounts of property and equipment are reviewed at each reporting date to determine whether there is any indi-cation of impairment. An impairment charge is recorded in the Consolidated Statement of Income to the extent the recover-able amount, which is the higher of fair value less costs to sell and value in use, is less than its carrying amount. Value in use is thepresent valueof the future cashflowsexpected tobede- rived from the asset. After the recognition of impairment, the depreciation charge is adjusted in futureperiods to reflect theasset’s revised carrying amount. The carrying amount of an asset for which an impairment loss has been recognised in prior years shall be increased to its recoverable amount only in the event of a change of estimate in the asset’s recoverable amount.
Gains and losses on disposals are determined by comparing proceeds with the carrying amount. These are included in the ‘General, Administrative and Trading expenses’ in the Consolidated Statement of Income.
p) Intangible assetsIntangible assets consist primarily of internally developed software. Expenditure on internally developed software is recognised as an asset when the CSi group is able to demonstrate its intention and ability to complete the development and use the software in a mannerthatwillgeneratefutureeconomicbenefits,andcanreli-ably measure the costs to complete the development. The capital-ised costs of internally developed software include all costs directly attributable to developing the software.
Internally developed software that is capitalised is depreciated on a straight-line basis over a maximum useful life of seven years. The amortisation of the intangible assets is included in the ‘Gen-eral, Administrative and Trading expenses’ in the Consolidated Statement of Income.
The carrying amounts of the CSi group’s intangible assets are reviewed at each reporting date to determine whether there is any indication of impairment. If any such indication exists, then the asset’s recoverable amount is estimated. The recoverable amount of an asset is the greater of its value in use and its fair value less costs to sell. In assessing value in use, the estimated future cash flowsarediscountedtotheirpresentvalueusingapre-taxdiscountratethatreflectscurrentmarketassessmentsofthetimevalueofmoneyandtherisksspecifictotheasset.Animpairmentlossisrecognised if the carrying amount of an asset exceeds its esti-mated recoverable amount. Impairment losses are recognised in the Consolidated Statement of Income.
q) DepositsDeposits are funds held from customers (both retail and commer-cial) and banks, generally for the cash safekeeping and/or liquidity needs of those customers. Deposits are initially recognised at fair value and subsequently recognised at amortised cost, which rep-resents the nominal values of the deposits less any unearned dis-counts or nominal value plus any unamortised premiums.
r) ProvisionsProvisions are recognised for present obligations as a result of past events which can be reliably measured, where it is probable thatanoutflowofresourcesembodyingeconomicbenefitswillberequired to settle the obligations. The amount recognised as a provision is the best estimate of the consideration required to set-tle the present obligation as of the Consolidated Statement of Financial Position date, taking into account the risks and uncer-tainties surrounding the obligation. The expense recognised when provisions are established is recorded in ‘General, Administrative and Trading expenses’ on the Consolidated Statement of Income.
A provision for onerous contracts is measured at the present value of the lowest net cost of exiting from the contract, which is the lower of the expected cost of terminating the contract and the expectedcostoffulfillingit.Beforeaprovisionisestablished,theCSi group recognises any impairment loss on the assets associ-ated with that contract.
s) Long term debtDebt issued by the CSi group is initially measured at fair value, which is the fair value of the consideration received, net of transac-tion costs incurred. Subsequent measurement is at amortised cost, using the effective interest method to amortise cost at incep-tion to the redemption value over the life of the debt. CSi group’s long-term debt also includes instruments with embedded derivative features which are substantially all accounted for at fair value.
Debt with embedded derivativesThe CSi group issues long term debt containing embedded deriva-tives,mostofwhichhavebeendesignatedasfinancialliabilitiesatfairvaluethroughprofitorloss.Formoreinformationonthecrite-ria thatmustbemet todesignatea financial instrumentat fairvalue please refer to the previous section of this disclosure with the same name. Both the host instrument and embedded derivative in these structured notes are remeasured at each reporting period with changes in fair value being reported in ‘Net gains/ (losses) fromfinancialassets/liabilitiesatfairvaluethroughprofitorloss’inthe Consolidated Statement of Income.
t) Disposal Groups and Discontinued OperationsAdisposalgroupcomprisingassetsand liabilities isclassifiedasheld for sale if it is highly probable that it will be recovered primarily through sale rather than through continuing use.
A disposal group is generally measured at the lower of its car-rying amount and fair value less costs to sell. However, certain assets, such as deferred tax assets, assets arising from employee benefits,financialassetsandtherelatedliabilitiesareexemptfromthis measurement requirement. Rather, those assets and liabilities

42
are measured in accordance with other applicable IFRSs. The dis-posal groups presented in CSi group’s Statement of Financial Position consist exclusively of assets and liabilities that are mea-sured in accordance with other applicable IFRSs.
A discontinued operation is a component of CSi group that eitherhasbeendisposedoforisclassifiedasheldforsaleand:
(a) represents a separate major line of business or geographi-cal area of operations;
(b) is part of a single co-ordinated plan to dispose of a sepa-rate major line of business or geographical area of opera-tions; or
(c) is a subsidiary acquired exclusively with a view to resale.
Classificationasadiscontinuedoperationoccursattheearlierofdisposalorwhentheoperationmeetsthecriteriatobeclassifiedasheldforsale.Whenanoperationisclassifiedasadiscontinuedoperation, the comparative Consolidated Statement of Income is re-presented as if the operation had been discontinued from the start of the comparative year.
u) Retirement benefit costsTheCSigrouphasbothdefinedcontributionanddefinedbenefitpensionplans.ThedefinedbenefitplansareCSgroupschemes,in which the Bank is not the sponsoring entity. Obligations for contributionstodefinedcontributionpensionplansarerecognisedas an expense in the Consolidated Statement of Income as incurred.
In accordance with the provisions of IAS 19, “Employee Bene-fits” (IAS19) fordefinedbenefitplans that share risksbetweenvariousentitiesundercommoncontrol,noretirementbenefitobli-gation is recognised in the Consolidated Statement of Financial Position of the Bank and defined contribution accounting isapplied, as the CSi group has no contractual agreement or stated policy for incurring any charges by the sponsoring employer for the netdefinedbenefitcost.TheCSigroup’sshareoftheretirementbenefitobligationisinsteadrecognisedintheConsolidatedState-ment of Financial Position of the sponsoring entity, CSS(E)L which is external to the CSi group but is a related party due to both enti-ties being owned by CSG.
v) Share-based paymentsThe Bank grants shares in its ultimate parent, Credit Suisse Group (‘CSG’) to certain employees. The Bank pays for CSG shares at market value at the time of settlement to employees.
Theshare-basedawardsareclassifiedasacash-settledsharebased payment plan. A liability equal to the portion of the services received is recognised at the current market value determined at each balance sheet date. The expense for share-based payments is determined by treating each tranche as a separate grant of share awards and is accrued over the vesting period for each tranche, unless the employee is eligible for early retirement or retirement before the end of the vesting period, in which case rec-ognition of the expense would be accelerated over the shorter period. Share awards are made to employees in one of the following ways:i) Phantom Share Awards;
ii) Special Awards, which are typically awarded upon hiring of certain senior employees or in relation to business acquisi-tions. The terms (including amount, vesting, settlement, etc) ofspecialawardsvarysignificantlyfromawardtoaward;
iii) Performance Share Awards; iv) Contingent Capital Share Awards.
Phantom shares and Performance share awards are accrued over the 3 or 4 year vesting period. Certain awards vest at grant date and are therefore accrued fully at grant date. Special awards are accrued over the vesting period as per award terms.
Changes in foreign exchange and market value of the above share plan obligations between grant date and settlement date are expensed within operating expenses. Total value of awards accrued and outstanding at end of the accounting period is classi-fiedasaliability.
Share awards granted between January 1, 2014 and Decem-ber 31, 2015 do not include the right to receive dividend equiva-lents during the vesting period, while share awards granted after January 1, 2016 include the right to receive dividend equivalents.
w) Other compensation plansThe CSi group has other deferred compensation plans which can be in the formoffixedor variabledeferredcashcompensation.The expense for these awards is recognised over the service period, which is the period the employee is obligated to work in order to become entitled to the cash compensation. Fixed deferred cash compensation is generally awarded in the form of sign-on bonuses and employee forgivable loans. Variable deferred cashcompensationsareawardswhere thefinal cashpayout isdetermined by the performance of certain assets, a division or the CS group as a whole. The awards are expensed over the required service period and accruals are adjusted for changes to the expectedfinalpayout.
x) Derivative financial instruments and hedgingAll freestanding derivative contracts are carried at fair value in the Consolidated Statement of Financial Position regardless of whether these instruments are held for trading or risk management purposes. Derivativesclassifiedas tradingassetsand liabilitiesinclude those held for trading purposes and those used for risk management purposes that do not qualify for hedge accounting. Derivatives held for trading purposes arise from proprietary trading activity and from customer-based activity, with changes in fair value included in ‘Netgains/(losses) fromfinancialassets/liabili-tiesatfairvaluethroughprofitorloss’.Derivativecontracts,whichare both designated and qualify for hedge accounting, are reported in the Consolidated Statement of Financial Position as ‘Other assets’ or ‘Other liabilities’.
Embedded derivativesWhen derivative features embedded in certain contracts that meet thedefinitionofaderivativearenotconsideredcloselyrelatedtothe host instrument, either the embedded feature will be accounted for separately at fair value, with changes in fair value recorded in the Consolidated Statement of Income, or the instrument, includ-ing the embedded feature, is accounted for at fair value either

43Credit Suisse International, Annual Report 2016
Notes to the Financial Statements for the year ended 31 December 2016
underthefairvalueoptionorduetoclassificationasheldfortrad-ing. In the latter case the entire instrument is recorded at fair value with changes in fair value recorded in the Consolidated Statement of Income. If separated for measurement purposes, the derivative is recorded in the same line in the Consolidated Statement of Financial Position as the host instrument.
Cash flow hedge accountingFor hedges of the variability of cash flows from forecasted transac-tions and floating rate assets or liabilities, the effective portion of the change in the fair value of a designated derivative is recorded in Accumulated Other Comprehensive Income (‘AOCI’) as part of shareholders’ equity. These amounts are reclassified into the Con-solidated Statement of Income when the variable cash flow from the hedged item impacts earnings (e.g. when periodic settlements on a variable rate asset or liability are recorded in the Consolidated Statement of Income or when the hedged item is disposed of). Hedge ineffectiveness is recorded in “Net gains/(losses) from financial assets/liabilities at fair value through profit or loss”.
Whenhedgeaccountingisdiscontinuedonacashflowhedge,thenetgainorlosswillremaininAOCIandbereclassifiedintotheConsolidated Statement of Income in the same period or periods during which the formerly hedged transaction is reported in the Consolidated Statement of Income.
When the CSi group discontinues hedge accounting because a forecasted transaction is no longer expected to occur, the deriva-tive will continue to be carried on the Consolidated Statement of Financial Position at its fair value, and gains and losses that were previously recorded in equity will be recognised immediately in the Consolidated Statement of Income. When the CSi group discon-tinues hedge accounting but the forecasted transaction is still expected to occur, the derivative will continue to be recorded at its fair value with all subsequent changes in value recorded directly in the Consolidated Statement of Income. Any gains or losses recorded in equity prior to the date hedge accounting is no longer appliedwill be reclassified tonet incomewhen the forecastedtransaction takes place.
y) Financial guarantee contracts Financialguaranteecontractsrequiretheissuertomakespecifiedpayments to reimburse the holder for a loss it incurs because a specifieddebtorfailstomakepaymentswhendueinaccordancewiththetermsofadebtinstrument.Suchfinancialguaranteecon-tractsaregiventobanks,financialinstitutionsandotherpartiesonbehalf of customers to secure loans, overdrafts and other payables.
Financial guarantee contracts are initially recognised in the Consolidated Financial Statements at fair value on the date the guarantee was given, which is generally the fee received or receiv-able. Subsequent to initial recognition, the CSi group’s liabilities under such guarantees are measured at the higher of the initial fair value, less cumulative amortisation, and the best estimate for the expenditurerequiredtosettleanyfinancialobligationarisingasofthe Statement of Financial Position date when it is probable that thefinancialobligationwilloccur.Theseestimatesaredeterminedbased on experience with similar transactions and history of past losses, and management’s determination of the best estimate. Any
increase in the liability relatedtofinancialguaranteecontracts isrecorded in the Consolidated Statement of Income under ‘Provi-sion for credit losses’.
z) Operating leasesThe leases entered into by the CSi group are exclusively operating leases. The total payments made under operating leases are charged to the Consolidated Statement of Income on a straight-line basis over the period of the lease. When an operating lease is terminated before the lease period has expired, any early termina-tion payment required to be made to the lessor is recognised as an expense in the period in which termination takes place. If leased premises are vacated before the minimum lease term ends, a pro-vision for the remaining minimum lease payments, net of any expected sublease income, is recognised in the period in which the CSi group makes the decision to leave the property. For lease incentive provided by the lessor, the CSi group, as lessee, recog-nisestheaggregatebenefitasareductionofrentalexpenseoverthe lease term on a straight-line basis.
If the CSi group is the lessor in an operating lease it continues topresenttheassetsubjecttotheleaseinitsfinancialstatementsand recognises lease income on a straight-line basis over the period of the lease.
SubleasesThe subleases entered into by the CSi group are exclusively oper-ating leases. Sublease payments received are recognised through ‘General, Administrative and Trading expenses’ in the Consolidated Statement of Income on a straight-line basis over the period of the lease.
aa) Contingent liabilitiesContingent liabilities are possible obligations that arise from past events,andwhoseexistencewillbeconfirmedonlybytheoccur-rence or non-occurrence of one or more uncertain future events not wholly within the control of the entity, or are present obligations where it isnotprobablethatanoutflowofresourcesembodyingeconomicbenefitswillbe required tosettle theobligationor theamountoftheobligation,cannotbemeasuredwithsufficientreli-ability. A contingent liability is not recognised as a liability but is disclosed (unless the possibility of an outflow of economicresources is remote), except for those acquired under business combinations, which are recognised at fair value.
ab) Recognition and derecognitionRecognitionTheCSigroup recognisesfinancial instrumentson itsConsoli-dated Statement of Financial Position when the CSi group becomes a party to the contractual provisions of the instrument.
Regular-way securities transactionsAregular-waypurchaseorsaleisapurchaseorsaleofafinancialasset under a contract whose terms require delivery of the asset within the time frame established generally by regulation or con-vention in the marketplace concerned. The CSi group recognises regular-waypurchasesorsalesof tradingfinancialassetsat thesettlement date unless the instrument is a derivative.

44
DerecognitionThe CSi group enters into transactions where it transfers assets including securitisation assets, recognised on its Consolidated Statement of Financial Position, but retains either all risks and rewards of the transferred assets or a portion of them. If all or substantially all risks and rewards are retained, the transferred assets are not derecognised from the Consolidated Statement of Financial Position. Transactions where substantially all risk and rewards are retained include securities purchased or sold under repurchase agreements, securities borrowing and lending transac-tions,andsalesoffinancialassetswithconcurrentreturnswapson the transferred assets.
In transactions where the CSi group neither retains nor trans-ferssubstantiallyallrisksandrewardsofownershipofafinancialasset, it derecognises the asset if control over the asset is lost. The rights and obligations retained in the transfer are recognised separately as assets and liabilities as appropriate. In transfers where control over the asset is retained, the CSi group continues to recognise the asset to the extent of its continuing involvement, determined by the extent to which it is exposed to changes in the value of the transferred asset.
TheCSigroupderecognisesafinancialliabilitywhenitscon-tractual obligations are discharged or cancelled or expire. Where theCSigrouphasafinancialliabilityandafinancialinstrumentisexchangedforanewfinancialinstrumentwiththesamecounter-party,whichissubstantiallydifferent,orwhenanexistingfinancialinstrumentclassifiedasafinancialliabilityissubstantiallymodified,theoldfinancial instrument isdeemed tobeextinguishedandanew financial liability is recognised. Any gain or loss due toderecognition of the extinguished instrument is recorded in the ConsolidatedStatementofIncome.Whereamodificationandnotan extinguishment is deemed to have occurred, the difference is adjusted to the carrying value of the new instrument and reclassi-fiedintoincomeusingtheeffectiveinterestmethod.
SecuritisationThe CSi group securitises assets, which generally results in the sale of these assets to structured entities, which in turn issue securities to investors. The transferred assets may qualify for derecognition in full or in part, under the above mentioned policy onderecognitionoffinancialassets.
Interestsinsecuritisedfinancialassetsmayberetainedintheform of senior or subordinated tranches, interest only strips or other residual interests (collectively referred to as ‘retained inter-ests’). Provided the CSi group’s retained interests do not result in
consolidation of the structured entity, nor in continued recognition of the transferred assets, these retained tranches are typically recordedin‘Tradingfinancialassetsatfairvaluethroughprofitorloss’. Gains or losses on securitisation are recognised in the Con-solidated Statement of Income. The line item in the Consolidated Statement of Income, in which the gain or loss is presented, will depend on the nature of the asset securitised.
ac) Netting TheCSigrouponlyoffsetsfinancialassetsandliabilitiesandpres-ents the net amount on the Consolidated Statement of Financial Position where it:p currently has a legally enforceable right to set off the rec-
ognised amounts; andp intends either to settle on a net basis, or to realise the asset
and liability simultaneously.
In many instances the CSi group’s net position on multiple bilateral OTC derivative transactions with the same counterparty is legally protected by Master Netting Agreements. Such agreements nor-mally ensure that the net position is settled in the event of default of either counterparty and effectively limits credit risk on gross exposures.
However, because such contracts are not currently enforce-able in the normal course of business and the transactions them-selves are not intended to be settled net, nor will they settle simul-taneously, it is not permissible under IAS 32 “Financial Instruments: Presentation” (IAS 32) to offset transactions falling under Master Netting Agreements. For certain derivative transactions cleared with a central clearing counterparty (CCP) , the offsetting criteria under IAS 32 are met because the CSi group has the current legally enforceable right to set off (based on the offsetting provi-sions in the CCP rulebook) and the intention to settle net or simul-taneously (considering the daily payment process with the CCP). For securities purchased or sold under resale agreements or repurchase agreements, such legally enforceable agreements qualify for offsetting under IAS 32, if the gross settlement mecha-nism for these transactions has features that eliminate or result in insignificantcreditand liquidity riskand thatwillprocess receiv-ables and payables in a single settlement process or cycle and will therefore meet the net settlement criterion as an equivalent.
ad) DividendsDividends on ordinary shares are recognised as a liability and deducted from equity when declared.

45Credit Suisse International, Annual Report 2016
Notes to the Financial Statements for the year ended 31 December 2016
3 Critical Accounting Estimates and Judgements in Applying Accounting Policies
In order to prepare the Consolidated Financial Statements in accordance with International Financial Reporting Standards as adopted by the EU (‘Adopted IFRS’), management is required to make certain accounting estimates to ascertain the value of assets and liabilities. These estimates are based upon judgement and the information available at the time, and actual results may differ materially from these estimates. Management believes that the estimates and assumptions used in the preparation of the Consol-idated Financial Statements are reasonable and consistently applied.
For further informationonsignificantaccounting judgementsandestimates refer toNote2–SignificantAccountingPolicies,specificallythefollowing:i) Income tax l) Financialassetsand liabilitiesat fair value throughprofitor
lossm) Other loans and receivablesr) Provisions u) Retirementbenefitcostsv) Share-based payments x) Derivativefinancialinstrumentsandhedgingaa) Contingent liabilities ab) Recognition and derecognition
Management believes that the critical accounting estimates dis-cussedbelowinvolvethemostsignificantjudgementsandassess-ments. Use of available information and application of judgement are inherent in the formation of estimates. Actual results in the future could differ from such estimates and the differences may be material to the Consolidated Financial Statements.
TaxesDeferred tax valuation Deferred tax assets (‘DTA’) and deferred tax liabilities (‘DTL’) are recognised for the estimated future tax effects of operating loss carry-forwards and temporary differences between the carrying amounts of existing assets and liabilities and their respective tax bases at the Statement of Financial Position date. The realisation of deferred tax assets on temporary differences is dependent upon the generation of taxable income in future accounting peri-ods after those temporary differences become deductible. The realisation of deferred tax assets on net operating losses is depen-dent upon the generation of future taxable income. Management regularly evaluates whether deferred tax assets can be realised. Only if management considers it probable that a deferred tax asset will be realised is a corresponding deferred tax asset established without impairment.
In evaluating whether deferred tax assets can be realised, management considers both positive and negative evidence, including projected future taxable income, the scheduled reversal of deferred tax liabilities and tax planning strategies. This evalua-tion requires significantmanagement judgement, primarilywithrespect to projected taxable income, also taking into account the history of losses of the Bank. The future taxable income can never be predicted with certainty, but management also evaluates the
factors contributing to the losses and considers whether or not they are temporary or indicate an expected permanent decline in earnings. The evaluation is derived from budgets and strategic business plans but is dependent on numerous factors, some of whicharebeyondmanagement’scontrol, suchas thefiscalandregulatory environment and external economic growth conditions. Substantial variance of actual results from estimated future tax-ableprofits,orchangesinCSigroup’sestimateoffuturetaxableprofitsandpotential restructurings,could lead tochanges in theamount of deferred tax assets that are realisable, or considered realisable, and would require a corresponding adjustment to the level of recognised DTA. Please see Note 14 – Deferred Taxes for more information.
Fair Value AsignificantportionoftheCSigroup’sfinancialinstruments(trad-ingfinancialassetsandliabilities,derivativeinstrumentsandfinan-cial assets and liabilities designated at fair value) are carried at fair value in the Consolidated Statement of Financial Position. Related changes in the fair value are recognised in the Consolidated State-mentof Income.Deteriorationoffinancialmarketscouldsignifi-cantlyimpactthefairvalueofthesefinancialinstrumentsandtheresults of operations.
ThefairvalueofthemajorityoftheCSigroup’sfinancialinstru-ments is based on quoted prices in active markets or observable inputs. These instruments include government and agency securi-ties, certain commercial papers (‘CP’), most investment grade cor-porate debt, certain high grade debt securities, exchange-traded and certain over the counter (‘OTC’) derivative instruments and most listed equity securities.
Inaddition,theCSigroupholdsfinancialinstrumentsforwhichno prices are available and which have little or no observable inputs. For these instruments, the determination of fair value requires subjective assessment and judgement depending on liquidity, pricing assumptions, the current economic and competi-tiveenvironmentandtherisksaffectingthespecificinstrument.Insuch circumstances, valuation is determined based on manage-ment’s own judgements about the assumptions that market partic-ipants would use in pricing the asset or liability, including assump-tions about risk. These instruments include certain OTC derivatives, including equity and credit derivatives, certain corpo-rate equity-linked securities, mortgage-related and Collateralised Debt Obligations (‘CDO’s’), securities, private equity investments, certain loansandcredit products, (including leveragedfinance,certain syndicated loans and certain high yield bonds).
Thefairvalueoffinancialassetsandliabilitiesisimpactedbyfactorssuchasbenchmarkinterestrates,pricesoffinancialinstru-ments issued by third parties, commodity prices, foreign exchange rates and index prices or rates. In addition, valuation adjustments are an integral part of the valuation process when market prices are not indicative of the credit quality of a counterparty, and are applied to both OTC derivatives and debt instruments.
The impact of changes in a counterparty’s credit spreads (known as credit valuation adjustments or ‘CVA’) is considered when measuring the fair value of assets and the impact of changes

46
in the CSi group’s own credit spreads (known as debit valuation adjustments or ‘DVA’) is considered when measuring the fair value of its liabilities.
For OTC derivatives, the impact of changes in both the CSi group’s and the counterparty’s credit standing is considered when measuring their fair value, based on current Credit Default Swaps (‘CDS’) prices. The adjustments also take into account contrac-tual factors designed to reduce the CSi group’s credit exposure to a counterparty, such as collateral held and master netting agreements.
For hybrid debt instruments with embedded derivative features, the impact of changes in the CSi group’s credit standing is consid-ered when measuring their fair value, based on current funded debt spreads.
As of the end of 2016, 80.2% and 77.5% of CSi group’s total assets and total liabilities respectively, were measured at fair value (2015: 76.6% and 77.6%, respectively). Level 3 assets and Level 3 liabilities were USD 6.2 billion and USD 5.7 billion respec-tively as of the end of 2016 (2015: USD 8.5 billion and USD 7.7 billion). As of the end of 2016, these assets comprised 1.86% of total assets (2015: 2.12%) and 1.83% of total liabilities (2015: 2.04%).
For further information on the fair value hierarchy and a description of CSi group’s valuation techniques, refer to Note 38 – Financial Instruments.
TheCSigroupdoesnotrecogniseadealerprofitorunrealisedgains or losses at the inception of a derivative or non-derivative transaction unless the valuation underlying the unrealised gains or losses is evidenced by quoted market prices in an active market, observable prices of other current market transactions, or other observable data supporting a valuation technique in accordance withIAS39AG76.Thefinancialinstrumentisrecognisedatfairvaluewithanyprofitorlossimpliedfromthevaluationtechniqueattrade date is deferred and amortised over the life of the contract or over the period up to when the fair value is expected to become observable.
Control processes are applied to ensure that the fair value of the financial instruments reported in theBank andCSi groupFinancial Statements, including those derived from pricing models, are appropriate and determined on a reasonable basis. For further information related to the CSi group’s control and governance pro-cesses on the fair value of financial instruments please referNote 38 – Financial Instruments.
Allowances and impairment losses on other loans and receivablesAs a normal part of its business, the CSi group is exposed to credit risks through its lending relationships, commitments and letters of credit and as a result of counterparty risk on derivatives, foreign exchange and other transactions. Credit risk is the risk that a bor-rowerorcounterpartyisunabletomeetitsfinancialobligations.Inthe event of a default, the CSi group generally incurs a loss equal to the amount owed by the counterparty, less a recovery amount resulting from foreclosure, liquidation of collateral or restructuring of the counterparty’s obligation. The CSi group maintains allow-ances for loan losses which are considered adequate to absorb credit losses existing at the reporting date. These allowances are
for incurred credit losses inherent in existing exposures and credit exposuresspecifically identifiedas impaired. The inherent lossallowance is forall creditexposuresnotspecifically identifiedasimpaired which, on a portfolio basis, are considered to contain incurred inherent losses. Loans are segregated by risk, industry or country rating in order to collectively estimate inherent losses. The loan valuation allowance for inherent loss is established by analys-ing historical and current default probabilities, historical recovery assumptions and internal risk ratings. The methodology for calcu-latingspecificallowancesinvolvesjudgementsatmanylevels,suchasearly identificationofdeterioratingcredits. Extensive judge-ment is required in order to properly evaluate the various indicators of financial condition of a counterparty and likelihood ofrepayment.
The CSi group performs an in-depth review and analysis of impaired loans, considering factors such as recovery and exit options as well as considering collateral and counterparty risk. In general, all impaired loans are individually assessed. Corporate & Institutional loans are reviewed at least annually based on the bor-rower’sfinancialstatementsandanyindicationsofdifficultiestheymay experience. Loans that are not impaired, but which are of special concern due to changes in covenants, downgrades, nega-tivefinancialnewsandotheradversedevelopments,areincludedon a watch list. All loans on the watch list are reviewed at least quarterly to determine whether they should be moved to CSi group recovery management at which point they are reviewed quarterly forimpairment.Ifanindividualloanspecificallyidentifiedforeval-uation is considered impaired, the allowance is determined as a reasonable estimate of credit losses existing as of the end of the reporting period. Thereafter, the allowance is revalued by CSi group credit risk management at least annually or more frequently dependingon the riskprofileof theborroweror credit relevantevents. Please see Note 18 – Other Loans and Receivables for more information.
Disposal Group and Discontinued Operations Theclassificationofassetsandliabilitiesasadisposalgroupheldfor sale and the related presentation of discontinued operations requires a judgement by management, as to whether it is highly probable that the assets and liabilities will be recovered primarily through a sale, rather than through continuing use. For manage-ment to consider a sale to be highly probable, it must be commit-ted to a plan to sell the disposal group and an active programme to locate a buyer and complete the plan must have been initiated. Further, the disposal group must be actively marketed for sale at a price that is reasonable in relation to its current fair value. The evaluation performed by management focused on the timing of these plans within the wider strategic plan of the company and the reduction plans of the SRU. The sale should be expected to qualify for recognition as a completed sale within one year from the date ofclassificationandactionsrequiredtocompletetheplanshouldindicatethatitisunlikelythatsignificantchangestotheplanwillbemade or that the plan will be withdrawn. Events or circumstances may extend the period to complete the sale beyond one year. The estimate of the time period required until the transfer of a disposal group held for sale is recognised as a completed sale represents a critical accounting estimate. Note 28 – Discontinued Operations

47Credit Suisse International, Annual Report 2016
Notes to the Financial Statements for the year ended 31 December 2016
and Assets Held for Sale discloses those disposal groups for which management expects that a completed sale will be rec-ognised within one year or for which events or circumstances have extended the period to complete the sale beyond one year. The estimate of the time period required until the transfer of a disposal group held for sale is recognised as a completed sale represents a critical accounting estimate. Note 28 – Discontinued Operations and Assets Held for Sale discloses those disposal groups for which management expects that a completed sale will be rec-ognised within one year or for which events or circumstances have extended the period to complete the sale beyond one year.
Retirement Benefit Costs TheCSigrouphasbothdefinedcontributionanddefinedbenefitpensionplans.ThedefinedbenefitplansareCSgroupschemes,CSi being a participant to the scheme and CSS(E)L, a related party also owned by the CSG, as the sponsor. The CSi group’s share of the retirement benefit obligation,main estimates andjudgements lie with CSS(E)L which are described below:
The following relates to the assumptions CSS(E)L, the spon-sorofthedefinedbenefitplan,hasmadeinarrivingatthevalua-tionsof the variouscomponentsof thedefinedbenefitplan,ofwhich the CSi group is a participant.
The calculation of the expense and liability associated with the definedbenefitpensionplans requires theuseofassumptions,which include the discount rate and rate of future compensation increases as determined by CSS(E)L. Management determines these assumptions based upon currently available market and industry data and the historical performance of the plans and their assets. Management also consults with an independent actuarial firmtoassistinselectingappropriateassumptionsandvaluingitsrelated liabilities. The actuarial assumptions used by CSS(E)L may differ materially from actual results due to changing market and economic conditions, higher or lower withdrawal rates or lon-ger or shorter life spans of the participants. Any such differences couldhaveasignificantimpactontheamountofpensionexpenserecorded in future years.
Thediscountrateusedindeterminingthebenefitobligationisbased upon either high quality corporate bond rates or government bonds. In estimating the discount rate, CSS(E)L takes into con-sideration the relationship between the corporate bonds and the timingandamountofthefuturecashoutflowsonitsbenefitpay-ments.PleaseseeNote31–RetirementBenefitObligationsformore information.
Share-based payments The CSi group uses the liability method to account for its share-based payment plans, which requires the CSi group’s obligation under these plans to be recorded at its current estimated fair value. Share awards and share unit awards that contain market condi-tions are marked-to-market based on the latest share price infor-mationreflectingthetermsoftheaward.Shareunitawardsthatcontain earnings performance conditions are marked-to-market based on CSG’s actual earnings performance to date and CSG’s internal earnings projections over the remaining vesting period of theaward.Indeterminingthefinalliability,CSGalsoestimatesthenumber of forfeitures over the life of the plan based on
management’s expectations for future periods, which also consid-ers past experience. Please see Note 32 – Employee Share-basedCompensationandOtherCompensationBenefitsformoreinformation.
Transfer PricingTax transfer pricing charges are determined based on arm’s
length pricing principles. These net charges are adjusted as required due to evolving facts and changes in tax laws, progress of tax authority audits as well as tax authority negotiated arrange-ments for current and prior periods. Management continuously assess these factors and make adjustments as required. Please see Note 33 – Related Parties for more information.
Contingencies and loss provisions According to IAS 37 “Provisions, Contingent Liabilities and Contin-gent Assets”, a provision shall be recognised when: (a) an entity has a present obligation (legal or constructive) as a
result of a past event; (b) it isprobable thatanoutflowof resourcesembodyingeco-
nomicbenefitswillberequiredtosettletheobligation;and(c) a reliable estimate can be made of the amount of the
obligation.
A contingency is an existing condition that involves a degree of uncertainty that will ultimately be resolved upon the occurrence of future events. Please see Note 26 – Provisions for more information.
Litigation contingencies The CSi group is involved in a variety of legal, regulatory and arbi-tration matters in connection with the conduct of its businesses.
Itisinherentlydifficulttopredicttheoutcomeofmanyofthesematters, particularly those cases in which the matters are brought on behalf of various classes of claimants, which seek damages of unspecifiedor indeterminateamountsorwhich involvequestion-able legal claims. A provision is recognised if, and only if a present obligation (legal or constructive) has arisen as a result of a past event (the obligating event). In presenting the Consolidated Finan-cial Statements, management makes estimates regarding the out-come of legal, regulatory and arbitration matters and takes a charge to income when losses with respect to such matters are probable and can be reasonably estimated. Charges are not established for matters when losses cannot be reasonably esti-mated. Estimates, by their nature, are based on judgement and currently available information and involve a variety of factors, including but not limited to the type and nature of the litigation, claim or proceeding, the progress of the matter, the advice of legal counsel and other advisers, the CSi group’s defences and its experience in similar cases or proceedings, as well as the CSi group’s assessment of matters, including settlements, involving other defendants in similar or related cases or proceedings. Please see Note 26 – Provisions for more information.
Structured Entities As part of normal business, the CSi group engages in various transactions that include entities which are considered structured

48
entities. A structured entity is an entity that has been designed so that voting or similar rights are not the dominant factor in deciding who controls the entity, such as when any voting rights relate to administrative tasks only and the relevant activities are directed by means of contractual arrangements.
Transactions with structured entities are generally executed to facilitatesecuritisationactivitiesor tomeetspecificclientneeds,such as providing liquidity or investment opportunities, and, as part of these activities, the CSi group may hold interests in the struc-tured entities. If the CSi group controls the structured entity then
that entity is included in theCSigroup’s consolidatedfinancialstatements.TheCSigroupdisclosesinformationaboutsignificantjudgements and assumptions made in determining whether the CSi group has ( joint) control of, or significant influence over,another entity including structured entities. The CSi group also provides disclosures with regards to unconsolidated structured entities such as when it sponsors or has an interest in such an entity.
Please see Note 37 – Interests in Other Entities for more information.
4 Segmental Analysis
In October 2015, CSG announced the restructuring of the CS group, with the new regionally focused divisions and the realign-ment of existing businesses/divisions. As a result of the restruc-ture, the Bank has 6 reportable segments that are regularly reviewed by the Chief Operating Decision Maker (‘CODM’) when assessing the performance and allocation of resources. The CODM has been determined to be the Board. The historical Fixed Income and Equities segments have predominantly been combined to form the new Global Markets segment which has been further apportioned into Equities, Credit, Solutions and Management
divisions,withAsiarelatedfixedincomeandequitytradingbeingconsolidatedwithinanewAsiaPacificsegment.Formernon-stra-tegic units within the Fixed Income, Equities and Investment Bank-ing segments have been moved into the new Strategic Resolution Unit. Sales and Trading Services in foreign exchange products as well as Emerging Local Market currency trading was transferred into the Swiss Universal Bank and International Wealth Manage-ment Division as a 50:50 joint venture.
The new segments below are based on products and services offered by the CSi group:
Global Markets: The Global Markets division consists of four sub divisions, Equities, Credit, Solutions and Management. These sub divisions together offer trading in cash equities, prime services, systematic market making, emerging markets, equity derivatives, global macro, global credit and securitised products.
APAC: Investment banking capabilities in Asia Pacific, serving corporate and institutional clients.
Investment Banking The Investment Banking & Capital Markets (‘IBCM’) division service offering includes mergers and acquisitions, & Capital Markets: debt, equity and other capital raising activities.
Swiss Universal Bank: The Swiss Universal Bank (‘SUB’) division primarily offers sales and trading services for foreign exchange including emerging markets businesses.
International The International Wealth Management division has a joint venture with Swiss Universal Bank offering Sales and Trading
Wealth Management: Services in Foreign exchange products as well as Emerging Local Market currency trading.
Strategic Resolution Unit: Operations include ongoing management and wind-down of legacy businesses in CDOs, RMBS origination and CMBS.
Segment performance is assessed by the Board based on the CEO report, which details revenues and pre-tax income by seg-ment. CSi assets and liabilities are not managed by segment. Expenses are managed as part of the wider CS group manage-ment processes and therefore, while the CODM does assess the overallexpensebaseforCSi,itdoesnotspecificallymanagetheexpenses at a CSi segment level. Certain revenue items are not
directly allocated to the above business segments at a CSi level. These items include certain transfer pricing, certain credit risk allo-cations, treasury and corporate centre allocations. These are not included as an operating segment as they are not separate busi-ness activities from which CSi may earn revenues. Transactions between reportable segments are held at an arm’s length basis and are included in the segment results.

49Credit Suisse International, Annual Report 2016
Notes to the Financial Statements for the year ended 31 December 2016
The following table shows the external revenue of each operating segment during the year:
2016 2015 1
Revenues (USD million)
Global Markets 1,248 1,436
- Credit 173 182
- Equities 14 3
- Solutions 970 1,129
- Management 91 122
APAC 670 717
Investment Banking & Capital Markets 434 303
International Wealth Management 40 3
Swiss Universal Bank 41 6
Strategic Business 2,433 2,465
Strategic Resolution Unit (70) 83
Total 2,363 2,548
1 2015 numbers have been restated to confirm to the current year’s presentation
The following table shows the Income/ (loss) before taxes of each operating segment during the year:
2016 2015 1
Consolidated (Loss)/Income before taxes (USD million)
Global Markets 76 106
- Credit 22 (70)
- Equities (68) (63)
- Solutions 202 321
- Management (80) (82)
APAC 227 332
Investment Banking & Capital Markets (54) 153
International Wealth Management (3) (9)
Swiss Universal Bank 4 (9)
Strategic Business 250 573
Strategic Resolution Unit (396) (429)
Total (146) 144
1 2015 numbers have been restated to confirm to the current year’s presentation
CSi group Assets:Non-currentassets,otherthanfinancialinstruments,deferredtaxassets,post-employmentbenefitassetsand rightsarisingunder
insurance contracts, consist of property and equipment, invest-ment property and intangible assets totaling USD 766 million (2015: USD 873 million).
Reconciliation of reportable segment revenues
2016 2015 3
Reconciliation of reportable segment revenues (USD million)
Total revenues for reportable segments 2,363 2,548
Revenue sharing agreements (548) (488)
Treasury funding (260) (247)
Other corporate items (36) (9)
CSi group to primary reporting reconciliations 1 7 138
Net revenues as per Consolidated Statement of Income 1,526 1,942
Of which net revenues – discontinued operations 2 142 197
Of which net revenues – continued operations 1,384 1,745
1 This is the difference between the monthly board summaries which are prepared on a US GAAP basis and the CSi accounts prepared in accordance with IFRS.2 See Note 28 – Discontinued Operations and Assets Held for Sale3 2015 numbers have been restated to confirm to the current year’s presentation
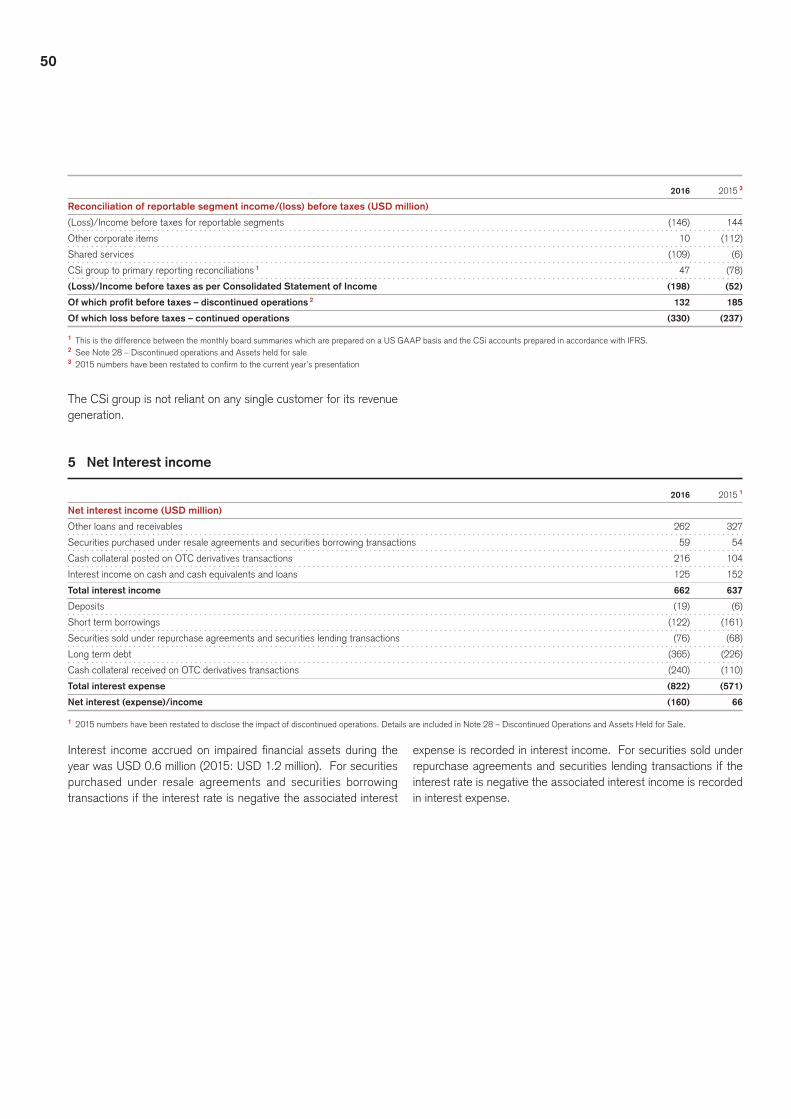
50
2016 2015 3
Reconciliation of reportable segment income/(loss) before taxes (USD million)
(Loss)/Income before taxes for reportable segments (146) 144
Other corporate items 10 (112)
Shared services (109) (6)
CSi group to primary reporting reconciliations 1 47 (78)
(Loss)/Income before taxes as per Consolidated Statement of Income (198) (52)
Of which profit before taxes – discontinued operations 2 132 185
Of which loss before taxes – continued operations (330) (237)
1 This is the difference between the monthly board summaries which are prepared on a US GAAP basis and the CSi accounts prepared in accordance with IFRS.2 See Note 28 – Discontinued operations and Assets held for sale3 2015 numbers have been restated to confirm to the current year’s presentation
The CSi group is not reliant on any single customer for its revenue generation.
5 Net Interest income
2016 2015 1
Net interest income (USD million)
Other loans and receivables 262 327
Securities purchased under resale agreements and securities borrowing transactions 59 54
Cash collateral posted on OTC derivatives transactions 216 104
Interest income on cash and cash equivalents and loans 125 152
Total interest income 662 637
Deposits (19) (6)
Short term borrowings (122) (161)
Securities sold under repurchase agreements and securities lending transactions (76) (68)
Long term debt (365) (226)
Cash collateral received on OTC derivatives transactions (240) (110)
Total interest expense (822) (571)
Net interest (expense)/income (160) 66
1 2015 numbers have been restated to disclose the impact of discontinued operations. Details are included in Note 28 – Discontinued Operations and Assets Held for Sale.
Interest incomeaccruedon impairedfinancial assetsduring theyear was USD 0.6 million (2015: USD 1.2 million). For securities purchased under resale agreements and securities borrowing transactions if the interest rate is negative the associated interest
expense is recorded in interest income. For securities sold under repurchase agreements and securities lending transactions if the interest rate is negative the associated interest income is recorded in interest expense.

51Credit Suisse International, Annual Report 2016
Notes to the Financial Statements for the year ended 31 December 2016
6 Net Commissions and Fee Income
2016 2015 1
Commission and fee income (USD million)
Lending business 86 129
Brokerage 77 15
Underwriting 11 14
Other customer services 329 2 145
Total commission and fee income 503 303
Brokerage (13) (13)
Other customer services (109) (73)
Total commission and fee expense (122) (86)
Net commission and fee income 381 217
1 2015 numbers have been restated to disclose the impact of discontinued operations. Details are included in Note 28 – Discontinued Operations and Assets Held for Sale.2 Income under other customer services primarily consists of fees from mergers and acquisitions and advisory services.
Feeexpenseincludesfeespaidtoaffiliates,CCPs/clearingven-ues, brokers and exchanges on exchange traded products under agencyagreements.Reflected in theabovecommissionandfee
income is the increase in commission following the acquisition that incurred in 2015 of the investment banking business from CSS(E)L.
7 (Additional)/Release of Provision for Credit Losses
2016 2015
(Additional)/Release of provision for credit losses (USD million)
Allowances for loan losses (12) (3)
Provision for off-balance sheet exposure (3) (5)
Additional Provision for credit losses (15) (8)
Allowances for loan losses 8 7
Provision for off-balance sheet exposure 5 4
Release of provision for credit losses 13 11
(Additional)/ Release of provision for credit losses (2) 3
8 Net Gains/(Losses) from Financial Assets/Liabilities at Fair Value through Profit or Loss
2016 2015 1
Net gains from financial assets/liabilities at fair value through profit or loss (USD million)
Interest rate 4,835 5,068
Foreign exchange (1,162) (1,153)
Equity (1,976) (1,699)
Commodity 133 131
Credit (200) (648)
Other (98) (5)
Total net gains from financial assets/liabilities at fair value through profit or loss 1,532 1,694
Of which:
Net gains/(losses) from financial assets/liabilities designated at fair value through profit or loss (USD million) 2
Securities purchased under resale agreements and securities borrowing transactions (25) (217)
Loans (5) (169)
Other financial assets designated at fair value through profit or loss (470) (385)
Securities sold under repurchase agreements and securities lending transactions (19) 539
Short term borrowings (29) (222)
Long term debt 140 (1,116)
Other financial liabilities designated at fair value through profit or loss 8 27
Total net (losses) from financial assets/liabilities designated at fair value through profit or loss (400) (1,543)
1 2015 numbers have been restated to disclose the impact of discontinued operations. Details are included in Note 28 – Discontinued Operations and Assets Held for Sale.2 The “Of which” table contains both continued and discontinued operations.
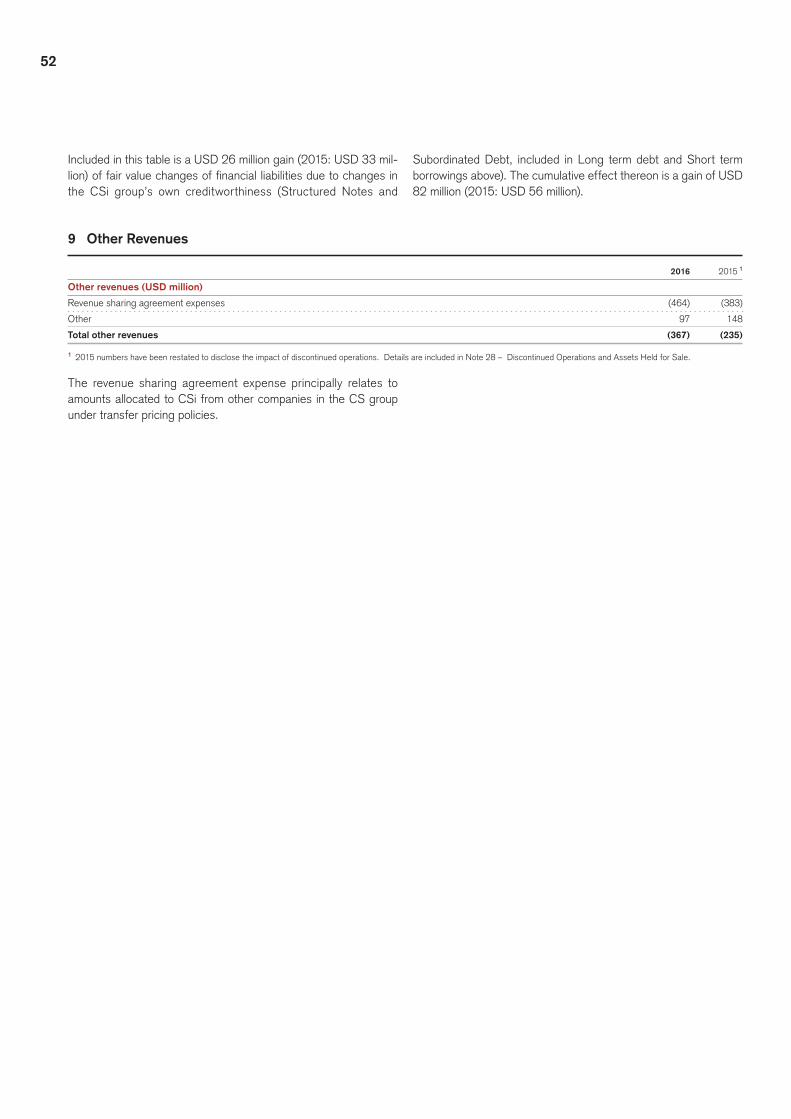
52
Included in this table is a USD 26 million gain (2015: USD 33 mil-lion)offairvaluechangesoffinancialliabilitiesduetochangesinthe CSi group’s own creditworthiness (Structured Notes and
Subordinated Debt, included in Long term debt and Short term borrowings above). The cumulative effect thereon is a gain of USD 82 million (2015: USD 56 million).
9 Other Revenues
2016 2015 1
Other revenues (USD million)
Revenue sharing agreement expenses (464) (383)
Other 97 148
Total other revenues (367) (235)
1 2015 numbers have been restated to disclose the impact of discontinued operations. Details are included in Note 28 – Discontinued Operations and Assets Held for Sale.
The revenue sharing agreement expense principally relates to amounts allocated to CSi from other companies in the CS group under transfer pricing policies.

53Credit Suisse International, Annual Report 2016
Notes to the Financial Statements for the year ended 31 December 2016
10 Compensation and Benefits
2016 2015
Compensation and benefits (USD million)
Salaries and variable compensation (516) (474)
Social security (82) (71)
Pensions (26) (19)
Other (12) (8)
Total compensation and benefits (636) (572)
Included in the above table are amounts relating to Directors’ remuneration, details of which are disclosed in Note 33 – Related
Parties. The increase in compensation and benefits is due totransfer of employees from CSS(E)L to CSi.
11 General, Administrative and Trading Expenses
Reference to note 2016 2015 1
General, administrative and trading expenses (USD million)
Brokerage charges and clearing house fees (201) (228)
Insurance charges (32) (35)
Trading expenses (233) (263)
Occupancy expenses (22) (13)
Depreciation and amortisation expenses 22,23 (160) (196)
Depreciation and impairment of investment property 19 (37) (31)
Litigation 26 (3) (132)
Auditor remuneration (2) (3)
Professional services (104) (96)
Impairment of intangible asset 23 (2) (4)
CSG trademark (5) (3)
Net Overheads allocated from other CS group entities (202) (400)
UK Bank Levy (32) (39)
Marketing data, publicity and subscription (33) (22)
Non income taxes (43) (47)
Other (60) (44)
General and administrative expenses (705) (1,030)
Total general, administrative and trading expenses (938) (1,293)
1 2015 numbers have been restated to disclose the impact of discontinued operations and reclassification of restructuring expenses. Details are included in Note 28 – Discontinued Operations and Assets Held for Sale and Note 12 – Restructuring Expenses respectively.
The expenses incurred by other CS group company under com-mon control are recharged to CSi group through ‘Net overheads allocated from other CS group entities’. The recharges comprise
compensationandbenefitexpensesandgeneral administrativeexpenses. The reduction is driven by the cost reduction pro-gramme in the UK.
Auditor’s remunerationAuditor’sremunerationinrelationtothestatutoryauditamountedtoUSD1.4million(2015:USD1.7 million).Thefollowingfeeswerepayable by the CSi group to the auditor, KPMG LLP.
CSi Auditor’s remuneration (USD ‘000) 2016 2015
Fees payable to the Bank’s auditor for the audit of the Bank’s annual accounts (1,438) (1,738)
Fees payable to the CSi group’s auditor and its associates for other services: (45) (371)
Audit-related assurance services (724) (405)
Other assurance services (53) (186)
Total fees (2,260) (2,700)

54
12 Restructuring Expenses
In accordance with the CS group wide strategic review, restructur-ing expenses of USD 140 million (2015: USD 117 million) were recognised by CSi group during 2016. Restructuring expenses
primarily include termination costs, expenses in connection with the acceleration of certain deferred compensation awards and an onerous lease arrangement.
2016 2015
Restructuring expenses by type (USD million)
Compensation and benefits-related expenses (46) (16)
ofwhichseverance (25) (12)
ofwhichaccelerateddeferredcompensation (21) (4)
General and administrative-related expenses (94) (101)
Total Restructuring expenses by type (140) (117)
2016 2015
General and General and Severance administrative- Severance administrative- expenses expenses Total expenses expenses Total
Restructuring provision (USD million)
Balance at beginning of the period/year 12 101 113 – – –
Net additional charges 25 94 119 1 12 101 113
Utilisation (25) (42) (67) – – –
Balance at end of the period/year 12 153 165 2 12 101 113
1 Liability arising on restructuring has been included in Note 20 – Other Assets and Other Liabilities as follows: Liabilities arising due to acceleration of expense accretion relating to unsettled share based compensation of USD 16 million and unsettled cash based deferred compensation of USD 5 million (not included in the table above) have been included in ‘Share-based compensation liability’ and ‘Other’, respectively. The settlement date for the unsettled share-based compensation remains unchanged.
2 Liability relating to severance expenses and general and administrative expenses of USD 165 million have been included in ‘Other’ under Note 20 – Other Assets and Other Liabilities. Also, within General and administrative-related expenses are provisions for onerous leases. In 2016 USD 75 million was recorded for onerous leases for 17 Columbus Courtyard and One Cabot Square and an additional provision of USD 5 million for 5 Canada Square. In 2015, USD 101 million was recorded for onerous leases for 5 Canada Square. Provision were recognised based on best estimate of potential losses for space that will be vacated and space that will be sublet at a reduced rate.
13 Income Tax
Group Bank
2016 2015 2016 2015
Current and deferred taxes (USD million)
Current tax
Current tax benefit/(expense) for the period 1 25 (11) 25 (11)
Adjustments in respect of previous periods (24) (2) (24) (2)
Current income tax benefit/(expense) 1 (13) 1 (13)
Deferred tax
Origination and reversal of temporary differences 16 13 16 13
Tax losses (utilised)/incurred – (50) – (50)
Other movements in deferred tax for current period – (16) – (16)
Effect of changes in tax rate or the imposition of new taxes (15) – (15) –
Deferred income tax benefit/(expense) 1 (53) 1 (53)
Income tax benefit/(expense) 2 (66) 2 (66)
1 For 2016, withholding taxes are included within income taxes.
The UK corporation tax rate reduced from 23% to 21% with effect from 1 April 2014 and from 21% to 20% with effect from 1 April 2015. Furthermore, the UK corporation tax rate will reduce from 20% to 19% with effect from 1 April 2017 and from 19% to 17% with effect from 1 April 2020.
Further information about deferred income tax is presented in Note 14 – Deferred Taxes. The income tax expense for the year can be reconciled to the loss per the statement of income as follows:

55Credit Suisse International, Annual Report 2016
Notes to the Financial Statements for the year ended 31 December 2016
Reconciliation of taxes computed at the UK statutory rate
Group Bank
2016 2015 2016 2015
Reconciliation of taxes computed at the UK statutory rate (USD million)
Loss before tax (198) (52) (181) (2)
Income tax benefit computed at the statutory rate of 28% (2015: 20.25%) 1 56 11 51 1
(Increase)/decrease in income taxes resulting from:
Other permanent differences (9) (45) (4) (35)
Effect of group relief surrendered for consideration at less than statutory rate (14) – (14) –
Non-recoverable foreign taxes including withholding taxes 2 (8) (14) (8) (14)
Other movements in deferred tax for current period 16 (16) 16 (16)
Adjustments to current tax in respect of previous periods (24) (2) (24) (2)
Effect on deferred tax resulting from changes to tax rates (15) – (15) –
Income tax benefit/(expense) 2 (66) 2 (66)
1 Includes impact of bank corporation tax surcharge of 8%
2 For 2016, withholding taxes are included within income taxes.
14 Deferred Taxes
Deferred taxes are calculated on all temporary differences under the liability method using an effective tax rate of 25% (2015: 26%). Deferred taxes are calculated on carry forward tax losses using effective tax rates of 17% or 25% (2015: 18%).
The Finance Act 2013, which passed into law on 17 July 2013, reduced the UK corporation tax rate from 23% to 21% with effect from 1 April 2014 and 21% to 20% with effect from 1 April 2015.
The Finance (No.2) Act 2015, which passed into law on 18 November 2015, included rate reductions in the UK corporation tax rate from 20% to 19% with effect from 1 April 2017 and 19%
to 18% with effect from 1 April 2020. The Finance (No.2) Act 2015 also introduced legislation to levy a surcharge of 8% on the profitsofbankingcompanies.TheCompanyissubjecttothissur-charge from 1 January 2016.
The Finance Act 2016, which was enacted on 15 September 2016, further reduced the UK corporation tax rate from 18% to 17% with effect from 1 April 2020.
The reduction in the UK corporation tax rate to 17% has had an impact on the income statement of USD 15 million (2015: USD Nil).
Group and Bank 2016 2015
Deferred tax (USD million)
Deferred tax assets 338 337
Net position 338 337
Balance at 1 January 337 386
Credit/ (Debit) to income for the year 16 (53)
Other movements – 4
Effect of change in tax rate expensed to Statement of Income (15) –
At end of the year 338 337
Deferred tax assets and liabilities are attributable to the following items:
Group and Bank 2016 2015
Components of net deferred tax assets (USD million)
Share-based compensation 27 33
Decelerated tax depreciation 180 160
Other provisions 55 54
Unpaid interest 76 90
At end of the year 338 337

56
Details of the tax effect of temporary differencesThedeferredtaxbenefit/(expense)intheStatementofIncomecomprisesthefollowingtemporarydifferences:
Group and Bank 2016 2015
Tax effect of temporary differences (USD million)
Derivative financial instruments – (3)
Share-based compensation (6) 8
Decelerated tax depreciation 20 13
Other provisions 1 (17)
Unpaid interest (14) 8
Deferred tax impact on losses carried forward – (62)
Total deferred tax benefit/(expense) in the Statement of Income 1 (53)
Deferred tax assets (DTA) and deferred tax liabilities (DTL) are recognised for the estimated future tax effects of operating loss carry-forwards and temporary differences between the carrying amounts of existing assets and liabilities and their respective tax bases at the balance sheet date. The realisation of deferred tax assets on temporary differences is dependent upon the generation of taxable income in future accounting periods after those tempo-rary differences become deductible. The realisation of deferred tax assets on net operating losses is dependent upon the generation of future taxable income. Management regularly evaluates whether deferred tax assets can be realised. Only if management considers it probable that a deferred tax asset will be realised is a corre-sponding deferred tax asset established without impairment.
In evaluating whether deferred tax assets can be realised, management considers both positive and negative evidence, including projected future taxable income, the scheduled reversal of deferred tax liabilities and tax planning strategies. This evalua-tion requires significantmanagement judgement, primarilywithrespect to projected taxable income, also taking into account the history of losses of the Bank. The future taxable income can never be predicted with certainty, but management also evaluated the factors contributing to the losses and considered whether or not they were temporary or indicated an expected permanent decline in earnings. The evaluation is derived from budgets and strategic business plans but is dependent on numerous factors, some of
whicharebeyondmanagement’scontrol, suchas thefiscalandregulatory environment and external economic growth conditions. Substantial variance of actual results from estimated future tax-ableprofits,orchanges inourestimateof future taxableprofitsand potential restructurings, could lead to changes in the amount of deferred tax assets that are realisable, or considered realisable, and would require a corresponding adjustment to the level of rec-ognised DTA.
As a consequence of this evaluation, deferred tax assets of USD 955 million (2015: USD 997 million) have not been rec-ognised.Ifstrategiesandbusinessplanswillsignificantlydeviateinthe future from current management assumptions, the current level of deferred tax assets may need to be adjusted if full recovery of the remaining DTA balance is no longer probable.
From 1 April 2015, the use of tax losses carried forward by UK banks is restricted to amaximumof50%of taxableprofits inrespect of losses incurred prior to 1 April 2015. From 1 April 2016, the use of tax losses carried forward by UK banks is further restricted toamaximumof25%of taxableprofits in respectoflosses incurred prior to 1 April 2015. Furthermore, the UK budget announcement of 16 March 2016 included proposals for new rules on corporation tax loss relief with effect from 1 April 2017. This UK tax law change and the future enactment of the further loss restriction proposals is not expected to have a material impact on the recoverability of the net deferred tax asset.
15 Securities Borrowed, Lent and Purchased/Sold under Resale/Repurchase Agreements
The following table summarises the securities purchased under agreements to resell and securities borrowing transactions, at their respective carrying values:
Group and Bank 2016 2015
Securities purchased under resale agreements and securities borrowing transactions (USD million)
Securities purchased under resale agreements 6,936 26,866
Deposits paid for securities borrowed 2,531 3,207
Total Securities purchased under resale agreements and securities borrowing transactions 9,467 30,073

57Credit Suisse International, Annual Report 2016
Notes to the Financial Statements for the year ended 31 December 2016
The following table summarise the securities lent under agreements to repurchase and securities lending transactions, at their respective carrying values:
Group and Bank 2016 2015
Securities sold under repurchase agreements and securities lending transactions (USD million)
Securities sold under repurchase agreements 565 793
Deposits received for securities lent 2,256 4,944
Total Securities sold under repurchase agreements and securities lending transactions 2,821 5,737
Securities borrowed, lent and subject to resale and repurchase agreements are mainly due within one year.
Repurchase and resale agreements represent collateralised financing transactions used to earn net interest income, increase liquidity or facilitate trading activity. These instruments are collater-alised principally by government securities and money market instru-ments and generally have terms ranging from overnight to a longer or unspecified period of maturity. The CSi group monitors the fair value of securities received or delivered. For securities purchased under resale agreements, the CSi group requests additional securi-ties, or the return of a portion of the cash disbursed when appropri-ate, in response to a decline in the market value of the securities
received. Similarly, the return of excess securities or additional cash is requested, when appropriate, in response to an increase in the market value of securities sold under repurchase agreements.
Deposits paid for securities borrowed and deposits received for securities lent are recorded at the amount of cash paid or received. These transactions are typically collateralised by cash or marketable securities. For securities lending transactions, the CSi group receives cash or securities as collateral in an amount gener-ally in excess of the market value of securities lent. The CSi group monitors the market value of securities borrowed and securities lent on a daily basis and additional collateral is obtained as necessary.
16 Trading Financial Assets and Liabilities at Fair Value Through Profit or Loss
Group Bank
2016 2015 2016 2015
Trading financial assets at fair value through profit or loss (USD million)
Debt securities 27,713 22,529 27,592 22,457
Equity securities 5,253 7,050 5,209 6,876
Derivative instruments 207,437 262,698 207,437 262,716
Other 2,024 2,952 2,017 2,936 1
Trading financial assets at fair value through profit or loss 242,427 295,229 242,255 294,985
Trading financial liabilities at fair value through profit or loss (USD million)
Short positions 3,180 3,758 3,180 3,758
Derivative instruments 208,450 266,996 208,458 267,004
Other 9 13 9 13
Trading financial liabilities at fair value through profit or loss 211,639 270,767 211,647 270,775
1 2015 numbers have been restated to conform to current year’s presentation.
Debt securities primarily consist of corporate bonds and govern-ment securities.
TradingfinancialassetsincludeUSD16billion(2015:USD15billion) which are encumbered. The transactions in relation to the
encumbered assets are conducted under terms that are usual and customary for securities lent, repurchase agreements or other col-lateralised borrowings.

58
17 Financial Assets and Liabilities Designated at Fair Value through Profit or Loss
Group Bank
2016 2015 2016 2015
Financial Assets designated at fair value through profit or loss (USD million)
Loans 3,361 6,348 3,654 6,758 1
Securities purchased under resale agreements and securities borrowing transactions 14,911 3,172 14,911 3,172
Other 2,134 2,558 2,134 2,558
Total financial assets designated at fair value through profit or loss 20,406 12,078 20,699 12,488
1 2015 numbers have been restated to conform to current year’s presentation.
Of thefinancialassetsdesignatedat fair value throughprofitorloss, loans and reverse repurchase agreements were elected to alleviateanaccountingmismatchwhileotherfinancialassetsdes-ignatedatfairvaluethroughprofitorloss(primarilyincludefailedpurchases) were elected because they are managed on a fair value basis.
For loans designated at fair value through profit or loss, the maximum fair value exposure to credit risk as at 31 December 2016 was USD 3.4 billion (2015: USD 6.3 billion). To mitigate this credit risk, securities are held as collateral, and credit default swaps with a notional value of USD 1.9 billion (2015: USD 1.4 billion) have been transacted to transfer this risk into the capital markets.
The fair value movement attributable to counterparty credit on loansdesignatedat fairvalue throughprofitor loss iscalculatedusingcreditspreadsapplicabletospecificpointsintime.Allotherrisk variables are held constant and the credit spreads are moved
based on current market conditions. During the year ended 31 December 2016, this fair value movement was a increase of USD 16 million (2015: decrease USD 25 million). The cumulative effect thereon at the year-end was a decrease of USD 1.23 billion (2015: decrease USD 1.25 billion). The corresponding increase in fair value of the swaps and securities in place to mitigate this risk was USD 8 million (2015: decrease USD 28 million). The cumula-tive effect thereon at the year-end was an increase of USD 2.12 billion (2015: increase USD 2.11 billion).
For securities purchased under resale agreements, the Bank’s credit exposure to the counterparties of these trades is mitigated by posted collateral and through subsequent margin calls. Accord-ingly, the Bank does not enter into hedges to mitigate credit expo-sure to its counterparties. Also, given that the credit exposure is almost eliminated, the fair value changes attributable to credit risk isinsignificant.
Group Bank
2016 2015 2016 2015
Financial Liabilities designated at fair value through profit or loss (USD million)
Subordinated Debt 71 70 71 70
Structured notes (includes Long term debt and Short term borrowings) 9,936 11,211 9,929 10,969
Securities sold under repurchase agreement and securities lending transactions 14,195 10,593 14,196 10,593
Other 487 635 487 635
Total financial liabilities designated at fair value through profit or loss 24,689 22,509 24,683 22,267
Ofthefinancialliabilitiesdesignatedatfairvaluethroughprofitorloss, subordinated debt and repurchase agreements were primarily elected to alleviate an accounting mismatch, while structured notes were mainly elected because they are managed on a fair value basis.
Thefairvalueofafinancialliabilityincorporatesthecreditriskofthatfinancialliability.Iftheinstrumentisquotedinanactivemarket, the movement in fair value due to credit risk is calculated as the amount of change in fair value that is not attributable to changes in market conditions that give rise to market risk. If the instrument is not quoted in an active market, the fair value is cal-culated using a valuation technique that incorporates credit risk bydiscounting the contractual cash flowson thedebt usinga
credit-adjustedyieldcurvewhichreflects the levelatwhich theCSi group would issue similar instruments as of the reporting date.
The fair value of subordinated debt and structured notes is cal-culatedusingayieldcurvewhich reflects theCSigroup’screditrating in the market. This is achieved by adjusting the relevant yield curve by the CSi group’s credit spread, dependent on the tier of the debt, at each point in the curve to provide an own credit adjusted valuation.
The carrying amount is USD 6 billion lower than the principal amount that the CSi group would be contractually required to pay totheholderofthesefinancialliabilitiesatmaturity(2015:USD2billion lower).

59Credit Suisse International, Annual Report 2016
Notes to the Financial Statements for the year ended 31 December 2016
18 Other Loans and Receivables
The following table sets forth details of the domestic (United Kingdom) and foreign portfolios:
2016 2015
Group and Bank
Loans (USD million)
Real estate 37 101
Commercial and industrial loans 815 672
Financial institutions 2,469 2,727
Gross loans 3,321 3,500
ofwhichdomestic 2,998 3,040
ofwhichforeign 323 460
Net unearned income (2) (2)
Allowance for loan losses (3) (3)
Net loans 3,316 3,495
Gross impaired loans 19 19
ofwhichloanswithanindividualallowance 19 19
Other loans and receivables due within one year for the CSi group and Bank, amount to USD 39 million (2015: USD 130 million).
Reconciliation of the allowance for loan losses by classThe following table sets forth the movements in the allowances for impairment losses on other loans and receivables:
Banks Customers Total
Group and Bank
Allowance for loan losses (USD million)
Balance at 1 January 2016 (2) (1) (3)
Additionalallowancesforimpairmentlosses (2) (1) (3)
Reversalofallowancesforimpairmentlosses 1 2 3
Movement recognised in Consolidated Statement of Income (1) 1 –
Balance at 31 December 2016 (3) – (3)
Balance at 1 January 2015 (4) (2) (6)
Additionalallowancesforimpairmentlosses (1) – (1)
Reversalofallowancesforimpairmentlosses 3 1 4
Movement recognised in Consolidated Statement of Income 2 1 3
Balance at 31 December 2015 (2) (1) (3)
19 Investment Property
The CSi group consolidates a number of structured entities which hold property. Investment properties are currently held at cost less depreciation and provision for impairment. An impairment charge
of USD 27 million (2015: USD 21 million) was taken to the Con-solidated Statement of Income for the year. The fair value and carrying value amount were the same as at 31 December 2016.
Group 2016 2015
Investment property (USD million)
Balance at the beginning of the year 303 426
Reclassification to real estate held-for-sale (94) (6)
Depreciation charge for the year (10) (10)
Impairment charge for the year (27) (21)
Foreign Currency Translation (3) (86)
Balance at the end of year 169 303

60
The recoverable amount of investment property is estimated based on its value-in-use. Based on the assessment in 2016, the carry-ing amount of the unit was determined to be higher than its recov-erable amount of USD 169 million and an impairment loss of USD 27 million was recognised for the year ended 31 December 2016.
The value-in-use is based on an externally obtained appraisal which calculates the Net Present Value using the ‘Business Plan Assessment’ approach (which assumes a sell off of each property over the next 3 years).
20 Other Assets and Other Liabilities
Group Bank
2016 2015 2016 2015
Other Assets (USD million)
Brokerage receivables (refer to Note 21) 5,095 8,299 1 5,095 8,299 1
Interest and fees receivable 416 316 1 416 316 1
Cash collateral on derivative instruments
Banks 13,056 15,936 13,056 15,936
Customers 17,798 20,853 1 17,798 20,853 1
Other 335 232 1 335 232 1
Total other assets 36,700 45,636 36,700 45,636
1 2015 numbers have been restated to conform with the current year’s presentation
Other assets are mainly due within one year.
Group Bank
2016 2015 2016 2015
Other Liabilities (USD million)
Brokerage payables (refer to Note 21) 2,432 2,258 1 2,432 2,258 1
Interest and fees payable 820 639 1 820 639 1
Cash collateral on derivative instruments
Banks 18,184 16,449 18,184 16,449
Customers 8,462 10,606 8,462 10,606
Share-based compensation liability 125 163 125 163
Other 1,403 707 1 1,403 707 1
Total other liabilities 31,426 30,822 31,426 30,822
1 2015 numbers have been restated to conform with the current year’s presentation
Other liabilities are mainly due within one year. Other liabilities include liability towards restructuring cost of USD 165 million (2015: USD 113 million). Refer Note 12 – Restructuring Expenses.
21 Brokerage Receivables and Brokerage Payables
Brokerage receivables and payables included in the table below represent amounts due to and from banks, brokers and dealers as well as customers for varying transaction types. Included within these balances are margin accounts where cash has been depos-ited with an exchange, bank or broker to facilitate future transac-tions and where the CSi group requires customers to maintain margin collateral in compliance with applicable regulatory and internal guidelines.
The CSi group also enters into fully margined exchange traded derivatives such as futures and balances payable to or receivable from the exchange the next day are recorded in the brokerage bal-ances. In addition the CSi group performs brokerage and clear-ance activities for clients where exchange fees are incurred and receivable from clients.

61Credit Suisse International, Annual Report 2016
Notes to the Financial Statements for the year ended 31 December 2016
Group Bank
2016 2015 2016 2015
Brokerage receivable (USD million)
Due from customers 1,697 1,544 1,697 1,544
Due from banks, brokers and dealers 3,398 6,755 1 3,398 6,755 1
Total brokerage receivables 5,095 8,299 5,095 8,299
Brokerage payable (USD million)
Due to customers 1,769 824 1 1,769 824 1
Due to banks, brokers and dealers 663 1,434 1 663 1,434 1
Total brokerage payables 2,432 2,258 2,432 2,258
1 2015 numbers have been restated to conform with the current year’s presentation
During the current reporting period there were no defaults or breaches in respect of third party brokerage payables.
Includedwithinpayablesareliabilitiesidentifiedinrespectofclient money received from clients, but only where it has been determined that the cash received represents an asset of the CSi group. The CSi group and Bank held USD 5,273 million of client
money as at 31 December 2016 (2015: USD 4,837 million), USD 4,121 million as of 31 December 2016 (2015: USD 4,429 million) of which was not recorded in the Consolidated Statement of Financial Position as those balances did not represent assets of the CSi group. This cash, when recognised on the balance sheet, is recorded under ‘Cash and due from banks’ and ‘Other assets’.
22 Property and Equipment
Leasehold Computer Office Improvements Equipment Equipment Total
2016
Group and Bank
Property and equipment (USD million)
Cost:
Cost as at 1 January 2016 418 201 82 701
Additions 23 31 – 54
Acquisitions during the year – – – –
Disposals (43) (23) (8) (74)
Cost as at 31 December 2016 398 209 74 681
Accumulated depreciation:
Accumulated depreciation as at 1 January 2016 (288) (140) (77) (505)
Charge for the year (22) (32) (2) (56)
Acquisitions during the year – – – –
Disposals 42 23 8 73
Accumulated depreciation as at 31 December 2016 (268) (149) (71) (488)
Net book value as at 1 January 2016 130 61 5 196
Net book value as at 31 December 2016 130 60 3 193

62
Leasehold Computer Office Improvements Equipment Equipment Total
2015
Group and Bank
Property and equipment (USD million)
Cost:
Cost as at 1 January 2015 530 218 106 854
Additions 6 43 3 52
Acquisitions during the year 12 1 3 16
Disposals (130) (61) (30) (221)
Cost as at 31 December 2015 418 201 82 701
Accumulated depreciation:
Accumulated depreciation as at 1 January 2015 (387) (164) (99) (650)
Charge for the year (19) (32) (5) (56)
Acquisitions during the year (11) (1) (3) (15)
Disposals 129 57 30 216
Accumulated depreciation as at 31 December 2015 (288) (140) (77) (505)
Net book value as at 1 January 2015 143 54 7 204
Net book value as at 31 December 2015 130 61 5 196
Leasehold improvements relate to improvements to land and build-ings occupied by the Bank and its fellow subsidiaries for their own activities.
No interest has been capitalised within property and equipment (2015: USD Nil).

63Credit Suisse International, Annual Report 2016
Notes to the Financial Statements for the year ended 31 December 2016
23 Intangible Assets
Internally Customer Developed
Group and Bank list Software Total
2016
Intangible Assets (USD million)
Cost:
Cost as at 1 January 2016 – 1,283 1,283
Additions – 137 137
Disposals – (31) (31)
Cost as at 31 December 2016 – 1,389 1,389
Accumulated amortisation:
Accumulated amortisation as at 1 January 2016 – (909) (909)
Amortisation for the year – (104) (104)
Impairment – (2) (2)
Disposals – 30 30
Accumulated amortisation as at 31 December 2016 – (985) (985)
Net book value as at 1 January 2016 – 374 374
Net book value as at 31 December 2016 – 404 404
2015 (USD million)
Cost:
Cost as at 1 January 2015 5 1,347 1,352
Additions – 161 161
Disposals (5) (225) (230)
Cost as at 31 December 2015 – 1,283 1,283
Accumulated amortisation:
Accumulated amortisation as at 1 January 2015 (1) (987) (988)
Amortisation for the year (1) (139) (140)
Impairment – (4) (4)
Disposals 2 221 223
Accumulated amortisation as at 31 December 2015 – (909) (909)
Net book value as at 1 January 2015 4 360 364
Net book value as at 31 December 2015 – 374 374
The recoverable amount of CSi’s intangible assets is estimated based on their value-in-use. An assessment was performed in 2016, and the carrying amount of the certain intangible assets was determined to be higher than their recoverable amount and an impair-ment loss of USD 2 million was recognised for the year ended 31 December 2016 (2015: USD 4 million). Intangible assets of USD 3 million, representing a customer list acquired in 2011 in the course
of the acquisition of the Prime Fund Services (‘PFS’) business, was disposed off in 2015 as part of the sale of the PFS business to BNP Paribas. The recoverable amount for the Internally Developed Soft-ware is estimated based on its value-in-use. The value-in-use is calculated based on detailed reviews and specific information regard-ing the individual projects and their capitalisation. Semi-annual assessments are performed to calculate any required impairment.
24 Deposits
Group and Bank 2016 2015
Deposits (USD million)
Non-interest bearing demand deposits 8 44
Interest-bearing demand deposits 449 486
Time deposits – 34
Total deposits 457 564
ofwhichduetobanks 457 563
ofwhichduetocustomers – 1

64
25 Short Term Borrowings
Group and Bank 2016 2015
Short-term borrowings (USD million)
Short term borrowings:
frombanks 2,667 21,066
Total short term borrowings 2,667 21,066
26 Provisions
Group and Bank Property Litigation Total
2016
Provisions (USD million)
Balance at 1 January 2016 3 30 33
Charges during the year – 9 9
Released during the year – (6) (6)
Utilised during the year – (9) (9)
Balance at 31 December 2016 3 24 27
2015
Provisions (USD million)
Balance at 1 January 2015 3 11 14
Charges during the year – 138 138
Released during the year – (6) (6)
Utilised during the year – (113) (113)
Balance at 31 December 2015 3 30 33
Property provisionThe property provision mainly relates to property reinstatement obligations that will be incurred when the leases expire.
Building Provision Utilisation period
17 Columbus Courtyard, London USD 1 million 31 December 2024
5 Canada Square, London USD 1 million 31 December 2027
Pall Mall, London USD 1 million 31 March 2018
Onerous lease provisions are recorded in other liabilities. Refer Note 12 – Restructuring Expenses.
Litigation provisionThe CSi group accrues litigation provisions (including fees and expenses of external lawyers and other service providers) in
connection with certain judicial, regulatory and arbitration proceed-ings when reasonably possible losses, additional losses or ranges of loss are more likely than not and can be reasonably estimable. General Counsel in consultation with the business reviews CS group’s judicial, regulatory and arbitration proceedings each quar-ter to determine the adequacy of its litigation provisions and may increase or release provisions based on management’s judgement and the advice of counsel. The anticipated utilisation of these liti-gation provisions typically ranges from six to eighteen month period, however certain litigation provisions are anticipated to extend beyond this period. Further provisions or releases of litiga-tion provisions may be necessary in the future as developments in such litigation, claims or proceedings warrant.

65Credit Suisse International, Annual Report 2016
Notes to the Financial Statements for the year ended 31 December 2016
27 Long Term Debt
Group Bank
2016 2015 2016 2015
Long-term debt (USD million)
Senior debt 26,016 18,424 25,813 18,433
Subordinated debt 6,124 8,163 6,124 8,163
Total long term debt 32,140 26,587 31,937 26,596
The increase of USD 7 billion in Senior debt was principally as a result of issuances of new securities driven by long term funding require-ments. Subordinated debt decreased by USD 2 billion primarily due to the repayment of USD denominated subordinated bonds.
Total long term debt is principally comprised of debt issuances managed by Treasury which do not contain derivative features (vanilla debt), which are issued as part of the CSi group’s struc-tured activities.
28 Discontinued Operations and Assets Held for Sale
The CSi group has begun to transfer a subset of derivatives andsecurities in theAsiaPacificdivision toanotherCSgroupentity, facilitated through a sale of positions currently held at fair value, with no gain or loss. The related assets and liabilities have been disclosed on the CSi group’s balance sheet as Held for Sale. This transfer will continue until 2017. The transaction is presented asdiscontinuedoperationsunderIFRS,andpost-taxprofitorlosshasbeenclassifiedasdiscontinuedoperationsinCSigroup’sCon-solidated Statement of Income. CSi group’s prior period results
have been restated to conform to the current presentation. Assets and liabilities relating to the transfers that have not yet completed havebeenclassifiedasAssets/LiabilitiesheldforsaleintheCon-solidatedStatementofFinancialPosition.CashinflowofUSD582million was generated from operational activities. No impairment losses were required to be recognised as a result of having to measure the Assets/Liabilities held for sale at fair value less cost to sell. During the year CSi group has also entered into other transactions which qualify as Held for Sale.
Held for Held for Discontinuing Sale – CDS Sale –
Group and Bank Operations Portfolio Securities Total
2016 (USD million)
Trading financial assets at fair value through profit or loss 2,311 824 325 3,460
ofwhichpositivemarketvaluesfromderivativeinstruments 1,837 824 – 2,661
Financial assets designated at fair value through profit or loss 312 – – 312
Other assets – – – –
Total assets held for sale 2,623 824 325 3,772
Trading financial liabilities at fair value through profit or loss 1,469 848 – 2,317
ofwhichnegativemarketvaluesfromderivativeinstruments 1,290 848 – 2,138
Financial liabilities designated at fair value through profit or loss 1,436 – – 1,436
Other liabilities 54 – – 54
Total liabilities held for sale 2,959 848 – 3,807
The assets and liabilities of discontinuing operations for which the sale has not yet been completed are presented as assets held for sale and liabilities held for sale, respectively, and prior periods are not reclassified. There is no cumulative income or expensesincluded in OCI relating to the disposal group. The presentation of assets and liabilities held for sale required the separation of certain assets and liabilities that were previously treated as a single unit of
account into disaggregated asset and liability positions. This resulted in 2016 in an increase of USD 51 million in Total assets and Total liabilities in the Consolidated Statement of Financial Position (Total assets increased from USD 332,330 million to USD 332,381 million and Total liabilities increased from USD 309,622 million to USD 309,673 million).

66
Group and Bank 2016 2015
(USD million)
Interest expense (4) (6)
Net interest expense (4) (6)
Commission and fee expense – (1)
Net commission and fee expense – (1)
Net gains from financial assets/liabilities at fair value through profit or loss 230 309
Other revenues (84) (105)
Net revenues 142 197
General, administrative and trading expenses (10) (12)
Total operating expense (10) (12)
Profit before tax 132 185
Income tax expense – –
Profit after tax 132 185
The above table does not present a gain or loss recognised on the measurement to fair value less costs to sell or on the disposal of the assets or disposal groups constituting the discontinued operation. This is because the disposal group does not contain assets or liabil-ities that are measured at the lower of the carrying amount or fair value less cost to sell.
CSigroupdiscloseddiscontinuedoperationsforthefirsttimeintheJune2016interimfinancialstatements.Duringthesecond
half of 2016 the migration plans were changed and this impact wouldhavereducedthedisclosedprofitaftertaxfromdiscontin-ued business from USD 131 million to USD 72 million, the total assets disclosed as held for sale would have reduced from USD 39 billion to USD 10 billion and the total liabilities disclosed as held for sale would have reduced from USD 38 billion to USD 10 billion, in the unaudited interim financial statements of CSi for the 6months ended 30 June 2016.
29 Accumulated Other Comprehensive Income
Accumulated Cumulative Gains/(losses) other com- Transalation on cash flow prehensive Group and Bank Adjustment hedges income
2016
Accumulated other comprehensive income (USD million)
Balance at 1 January 2016 (2) – (2)
(Increase)/decrease:
Foreign exchange translation differences – – –
Cash flow hedges – reclassified to profit or loss – – –
Balance at 31 December 2016 (2) – (2)
2015
Accumulated other comprehensive income (USD million)
Balance at 1 January 2015 – (4) (4)
(Increase)/decrease:
Foreign exchange translation differences (2) – (2)
Cash flow hedges – reclassified to profit or loss – 4 4
Balance at 31 December 2015 (2) – (2)

67Credit Suisse International, Annual Report 2016
Notes to the Financial Statements for the year ended 31 December 2016
30 Share Capital and Share Premium
Group and Bank 2016 2015
Share Capital
Allotted called-up and fully paid (USD million)
Opening Balance
131,158,070,611 Ordinary shares of USD 0.09 each 12,366 –
131,076,560,047 Ordinary shares of USD 0.10 each – 13,108
1 December 2015:
Issuance of Ordinary shares (81,510,564 of USD 0.10 each) on Business combinations – 8
28 December 2015:
Capital reduction of Ordinary shares (131,158,070,611 of USD 0.005716 each) – (750)
Total allotted called-up and fully paid capital 12,366 12,366
Share Premium (USD million)
Opening Balance
1 December 2015 12,704 12,699
Issuance of Ordinary shares (81,510,564 of USD 0.06372 each) – 5
Share Premium 12,704 12,704
The ordinary shares have attached to them full voting, dividend and capital distribution (including on winding up) rights.
On 1 December 2015, the Bank issued 81,510,564 Ordinary shares at nominal value of USD 0.10, with USD 8 million recorded
in share capital and USD 5 million in share premium in connection with acquisition of business from one of the CS group entities.
On 23 December 2015, USD 750 million of equity was repa-triated to existing shareholders, in the same proportion as to their respective holding.
31 Retirement Benefit Obligations
The following disclosures contain the balances for the entire definedbenefitplansponsoredbyCSS(E)L,ofwhichtheBankisone of many participants, who are all related parties under com-mon control. The Bank has no contractual agreement or stated policy for incurring any charges by the sponsoring employer for the netdefinedbenefitcost, thereforeas theBank isnot the legalsponsoritaccountsforitsshareoftheplanusingdefinedcontribu-tion accounting. During 2016 the Bank expensed USD 3 million (2015: USD 2 million) in respect of its contributions to the UK definedbenefitscheme.
Profile of the pension plansApproximately 10% of theUK plan’s final salary liabilities areattributable to current employees, 73% to former employees yet to retire and 17% to current pensioners and dependants. The UK plan duration is an indicator of the weighted-average time until benefitspaymentsaremade.
For the UK plan as a whole the duration is around 25 years reflecting theapproximatesplit of thedefinedbenefitobligationbetween current employees (duration of 28 years), deferred mem-bers (duration of 26 years) and current pensioners (duration of 16 years).

68
Thefollowingtableshowsthechangesinthedefinedbenefitobligationandthefairvalueofplanassetsduring2016and2015,andtheamountsincludedinCSS(E)L’sconsolidatedfinancialstatementsforthedefinedbenefitpensionplanasat31December2016and2015 respectively:
Group and Bank 2016 2015
Defined benefit pension plans (USD million)
Defined benefit obligation – 1 January 1,745 1,876
Current service cost 5 5
Interest cost 61 68
Actuarial losses/ (gains) on assumptions 444 (60)
arisingoutofchangesindemographicassumptions (17) 6
arisingoutofchangesinfinancialassumptions 461 (66)
Actuarial (gains)/ losses – experience (15) (1)
Benefit payments (70) (55)
Exchange rate gains (301) (88)
Defined benefit obligation – 31 December 1,869 1,745
Fair value of plan assets – 1 January 2,578 2,704
Expected return on plan assets 91 98
Actuarial gains/ (losses) 683 (49)
Actual return on plan assets 774 49
Employer Contributions 9 9
Administrative expense (2) (2)
Benefit payments (70) (55)
Exchange rate losses (448) (127)
Fair value of plan assets – 31 December 2,841 2,578
Funding requirementsUK legislation requires that pension schemes are funded pru-dently. The last funding valuation of the UK plan was carried out by aqualifiedactuaryasat31December2014andshowedasurplusof GBP 39.1 million. The next funding valuation is measured at 31 December 2017.
Contributions will be paid to cover administrative expenses, administration rebates and death in service pensions. Expected regularcontributionstobepaidtotheUKdefinedbenefitplanforall participating entities for the year ending 31 December 2017 is approximately USD 8 million.
AssumptionsTheassumptionsused inthemeasurementofthedefinedbenefitobligationandnetperiodicpensioncostfortheCredit SuisseUKpensionplanasat31 Decemberwereasfollows:
Group and Bank 2016 2015
Benefit obligation (%)
Discount rate 2.65% 3.90%
Retail Price Inflation 3.15% 3.10%
Consumer Price Inflation 2.05% 2.00%
Pension increases 1 3.00% 3.04%
Salary increases 3.30% 3.25%
Net periodic pension cost (%)
Discount rate 3.90% 3.70%
Salary increases 3.25% 4.25%
1 Pension earned pre 6 April 1997 are subject to pension increases on a discretionary basis, which were considered to be Nil.
Mortality AssumptionsThe life expectancy assumptions for 2016 have been updated from those used for 2015.
Theassumptionsforlifeexpectancyforthe2016UKbenefitobligation pursuant to IAS 19 are based on the ‘SAPS 2 light’
base table with improvements in mortality in line with the proposed new CMI model with core assumptions calibrated to end of 2015 as published in working paper 91, and a scaling factor of 95%. Underpins to future mortality improvement have also been incorpo-rated, the annual long term rate of improvement being 1.50% p.a.

69Credit Suisse International, Annual Report 2016
Notes to the Financial Statements for the year ended 31 December 2016
On this basis the post-retirement mortality assumptions are as follows:
2016 2015
Life expectancy at age 60 for current pensioners aged 60 (years)
Males 28.8 28.9
Females 29.9 30.1
Life expectancy at age 60 for future pensioners currently aged 40 (years)
Males 30.5 31.2
Females 31.7 32.5
Sensitivity AnalysisChangesintheprincipalassumptionsusedtomeasurethebenefitobligationcostwouldhavehadthefollowingeffects:
Defined Defined Benefit Benefit Obligation Increase Obligation Decrease USD million % USD million %
Defined Benefit obligation
One-percentage point change
- 1%/ +1% Discount rate 2,382 27 1,472 ( 21 )
+1% / -1% Inflation rate 2,185 17 1,598 ( 14 )
+1% / -1% Salary increases rate 1,878 0 1,860 0
+1 / -1 year to life expectancy at 60 1,906 2 1,831 ( 2 )
The sensitivity analysis above has been derived using a number of additional full valuation runs that have been carried out using the samedataas thatusedforcalculating the2016definedbenefitobligation. The sensitivity analysis focuses on changes to the obli-gation.Forthesensitivitiestodiscountrateandinflationratestheimpact on the UK funded status will most likely be lower to the impacton thebenefitobligation,asa resultof theassetsbeing(partially) matched to the obligations.
The methodology used to calculate the sensitivities is consis-tent with previous years.
Plan assets and investment strategyResponsibility for governance and running of the UK Plan – includ-ing investment decisions (after consultation with CSS(E)L) and con-tribution schedules (which requires the agreement of CSS(E)L) – lies with the board of trustees. CSS(E)L’s defined benefit pension plan looks to minimise risk subject to adopting an investment strat-egy that has a reasonable expectation of achieving a certain level of return by investing in a range of asset classes of appropriate liquidity and security which will generate income and capital growth to meet, together with agreed contributions from CSS(E)L, the cost of bene-fits. Risk tolerance is established through careful consideration of plan liabilities, plan funded status and corporate financial condition.
The Fund has a hedging target of around 100% of interest rate andinflationriskarisingfromtheTechnicalProvisionsmeasureofthe liabilities. Guidelines have been put in place for the hedging portfolio to limit the risk between it and the basis on which the Technical Provisions measure of the liabilities is calculated. In par-ticular limits have been placed on the level of exposure that may be obtained from bonds and gilt total return swaps, both in terms of interestrateandinflationsensitivity.
Equity investments are diversified across UK and non-UKstocks as well as between growth, value and small and large
capitalisation stocks. Other assets such as hedge funds, property and corporate bonds are used to enhance long term returns while improvingportfoliodiversification.
Investment risk is monitored and measured on an ongoing basis with quarterly investment and funding reports together with periodic asset/liability analysis and reviewsof the inflationandinterest rate hedge. To limit investment risk, CSS(E)L’s pension plansfollowdefinedstrategicassetallocationguidelines.
Risks Associated with UK PlanThe UK plan exposes the Bank to a number of risks, the most sig-nificantofwhichare:
Asset volatilityThe liabilities are calculated using a discount rate set with refer-ence to corporate bond yields; if assets underperform this yield, thiswillreducethesurplus.TheUKplanholdsasignificantpropor-tion of growth assets which, though expected to outperform cor-porate bonds in the long-term, create volatility and risk in the short-term. The allocation to growth assets is monitored to ensure it remains appropriate given the UK plan’s long term objectives.
Changes in bond yieldsA decrease corporate bond yields will increase the value placed on the UK plan’s liabilities for accounting purposes, although this will be partially offset by an increase in the value of the plan’s bond holdings. The plan does hedge interest rate risk, so whilst it might be expected that the hedge increases in value if bond yields decrease, the plan is exposed to the extent that the hedge is not designedtocover100%oftheaccountingdefinedbenefitobliga-tion and also the fact that the hedge does not mitigate decreases in credit spreads.

70
Inflation RiskAsignificantproportionof theUKplan’sbenefitobligationsarelinkedtoinflation,andhigherinflationwill leadtohigherliabilities(although,inmostcases,capsonthelevelofinflationaryincreasesare inplacetoprotectagainstextremeinflation).Themajorityofthe assets are either unaffected by or only loosely correlated with inflation,meaningthatanincreaseininflationwillalsoincreasethe
deficit to theextent that the inflationswapdoesnotmatch theincrease.
Life expectancyThemajorityoftheUKplans’sobligationsaretoprovidebenefitsfor the life of the member, therefore increase in life expectancy will result in an increase in the liabilities.
Defined Benefit Pension Plans UK Plans 2016
Estimated future benefit payments (USD million)
2017 15
2018 16
2019 19
2020 22
2021 26
For five years thereafter 196
Plan assets measured at fair value
2016 2015
% of total % of total fair value fair value of scheme of scheme Quoted Unquoted Total assets Quoted Unquoted Total assets
Plan assets measured at fair value (USD million)
Cash and cash equivalents – 124 124 4.4% – 180 180 7.0%
Debt Securities 1,581 210 1,791 63.0% 1,320 234 1,554 60.3%
ofwhichgovernments 1,008 – 1,008 35.5% 692 – 692 26.9%
ofwhichcorporates 573 210 783 27.5% 628 234 862 33.4%
Equity Securities 192 245 437 15.4% 211 246 457 17.7%
Derivatives – 314 314 11.0% – 233 233 9.0%
Alternative investments – 175 175 6.2% – 154 154 6.0%
ofwhichhedgefunds – 116 116 4.1% – 103 103 4.0%
ofwhichother – 59 59 2.1% – 51 51 2.0%
Total plan assets UK Plans 1,773 1,068 2,841 100.0% 1,531 1,047 2,578 100.0%
Derivatives consist of a variety of products to manage market risks (e.g. interest, inflation)andarerecordedat fairvalue in linewiththe accounting policy disclosed in Note 3.
Alternative investments primarily consists of investments in hedge funds. Investments in third-party hedge funds, are mea-sured at fair value based on their published net asset values (‘NAV’).
Defined Contribution Pension PlansTheBankalsocontributestovariousdefinedcontributionpensionsprimarily in the United Kingdom. The contributions in these plans during 2016 and 2015 were USD 23 million and USD 18 million, respectively.
32 Employee Share-based Compensation and Other Compensation Benefits
Payment of deferred compensation to employees is determined by the nature of the business, role, location and performance of the employee. Unless there is a contractual obligation, granting deferred compensation is solely at the discretion of senior man-agement. Special deferred compensation granted as part of a con-tractual obligation is typically used to compensate new senior employees in a single year for forfeited awards from previous
employers upon joining the Bank. It is the Bank’s policy not to make multi-year guarantees.
Compensation expense for share-based and other awards that were granted as deferred compensation is recognised in accor-dancewith thespecific termsandconditionsofeach respectiveaward and is primarily recognised over the future requisite service and vesting period, which is determined by the plan, retirement

71Credit Suisse International, Annual Report 2016
Notes to the Financial Statements for the year ended 31 December 2016
eligibility of employees, two-year moratorium periods on early retirement and certain other terms. All deferred compensation plans are subject to non-compete and non-solicit provisions. Com-pensation expense for share based and other awards that were granted as deferred compensation also includes the current esti-mated outcome of applicable performance criteria, estimated future forfeitures and mark-to-market adjustments for certain awards that are still outstanding.
Total compensation expense for cash-settled share-based compensation plans recognised during 2016 and 2015 was USD 11 million and USD 124 million respectively. The total stock award liability recorded as at 31 December 2016 was USD 129 million (2015: USD 163 million). The fair value used to calculate the stock award liability was the closing CSG share price as at 31 December 2016 CHF 14.61 (2015: CHF 21.69). The average weighted fair value of awards granted in 2016 was CHF 17.04 (2015: CHF 14.85). The intrinsic value of vested share based awards outstand-ing as at year end was USD 24 million (2015: USD 20 million).
The recognition of compensation expense for the deferred compensation awards granted in February 2017 began in 2017 andthushadnoimpactonthe2016financialstatements.
Phantom Share AwardsShare awards granted in February 2017 are similar to those granted in January 2016. Each share award granted entitles the holder of the award to receive one Credit Suisse Group (‘CSG’) share, subject to service conditions. Share awards vest over three years with one third of the share awards vesting on each of the
three anniversaries of the grant date (ratable vesting), with the exceptionofawardsgrantedtoindividualsclassifiedasriskman-agers or senior managers under the UK PRA Remuneration. Code Shareawardsgrantedtoriskmanagersvestoverfiveyearswithonefifthoftheawardvestingoneachofthefiveanniversariesofthe grant date, while share awards granted to senior managers vestoverfiveyearscommencingon the thirdanniversaryof thegrantdate,withonefifthoftheawardvestingoneachofthethirdto seventh anniversaries of the grant date. Share awards are expensed over the service period of the awards. The value of the share awards is solely dependent on the CSG share price at the time of delivery.
The share awards include other awards, such as blocked shares, and special awards, which may be granted to new employ-ees. These awards entitle the holder to receive one CSG share, subject to continued employment with the Company, contain restrictive covenants and cancellation provisions and generally vest betweenzeroandfiveyears.
The number of share awards granted to employees was deter-mined by dividing the deferred component of variable compensa-tion being granted as shares by the average price of CSG share over the ten business days ended February 28, 2017. The fair value of each share award was CHF 15.42, the CSG share price on the grant date. While share awards granted between January 1, 2014 and December 31, 2015 did not include the right to receive dividend equivalents, share awards granted after January 1, 2016 include the right to receive dividends equivalents, upon vesting.
Movements in the number of Phantom Share outstanding were as follows:
Group and Bank 2016 2015
Number of units (millions)
As at 1 January 7.05 4.48
Granted 4.88 2.01
Shares transferred in/out (0.26) 3.21
Delivered (3.34) (2.42)
Forfeited (0.30) (0.23)
As at 31 December 8.03 7.05
Performance Share Awards (‘PSA’)Certain employees received a portion of their deferred variable compensation in the form of performance share awards. Perfor-mance share awards are similar to share awards, except that the full balance of outstanding performance share awards, including those awarded in prior years, are subject to performance-based malus provisions. Performance share awards granted until 2015 were subject to a negative adjustment in the event of a negative strategic ROE of CSG, which was calculated based on Core Results, adjusted for the goodwill impairment charge related to the re-organisation of the former Investment Banking division. How-ever, following thechange inourfinancial reportingstructure in2015, the strategic ROE is no longer calculated, and consequently, any negative adjustment to performance share awards is subject to the discretion of the Compensation Committee. For 2016, the cal-culation was based on adjusted results, which the Compensation
Committeeconsideredasthemostaccuratereflectionoftheoper-ating performance of the businesses. There was no negative adjustment applied to performance share awards granted in 2015 and 2014 given that the 2016 divisional adjusted results and adjusted ROE of CSG were both positive.
Performance share awards granted for 2016 are subject to a negative adjustment in the event of a divisional loss by the division in which the employees worked as at December 31, 2016, or a negative CSG ROE, whichever results in a larger adjustment. For employees in Corporate Functions and the Strategic Resolution Unit, the negative adjustment only applies in the event of a nega-tive CSG ROE and is not linked to the performance of the divi-sions. The basis for the ROE calculation may vary from year to year, depending on the Compensation Committee’s determination for the year in which the performance shares are granted.

72
The number of performance share awards was determined by dividing the deferred component of variable compensation being granted as performance shares by the average price of a CSG share over the ten business days ended February 28, 2017. The fair value of each performance share award was CHF 15.42, the CSG share price on the grant date.
While performance share awards granted between January 1, 2014 and December 31, 2015 did not include the rights to receive dividend equivalents, performance share awards granted after January 1, 2016 include the rights to receive dividend equivalents, upon vesting.
Movements in the number of PSA outstanding were as follows:
Group and Bank 2016 2015
Number of units (millions)
As at 1 January 3.34 1.97
Granted 2.00 0.95
Shares transferred in/out (0.04) 1.39
Delivered (1.46) (0.95)
Forfeited (0.14) (0.02)
As at 31 December 3.70 3.34
Contingent Capital Share AwardsIn March 2016, the CSG executed a voluntary exchange offer, under which employees had the right to voluntarily convert all or a portion of their respective CCA into Contingent Capital share awards at a conversion price of CHF 14.57. CCA holders elected to convert USD 8 million of their CCA into Contingent Capital
share awards during the election period. This fair value repre-sented an approximate conversion rate of 8%. Each Contingent Capital share award had a grant-date fair value of CHF 14.45 and contains the same contractual term, vesting period, performance criteria and other terms and conditions as the original CCA.
Movements in the number of CCA share outstanding were as follows:
Group and Bank 2016 2015
Number of units (millions)
As at 1 January – –
Granted 0.51 –
Shares transferred in/out (0.01) –
Delivered (0.05) –
Forfeited (0.01) –
As at 31 December 0.44 –
Contingent Capital AwardsContingent Capital Awards (‘CCA’) were granted in February 2017, January 2016, 2015 and 2014 as part of 2016, 2015, 2014 and 2013 deferred variable compensation and have rights and risks similar to those of certain contingent capital instruments issued by CSG in the market. CCA are scheduled to vest on the third anniversary of the grant date, other than those granted to certainemployees,whereCCAvestonthefifthandseventhanni-versaries of the grant date, respectively, and will be expensed over the vesting period. CCA provide a conditional right to receive semi-annual cash payments of interest equivalents until settled, with rates being dependent upon the vesting period and currency of denomination:p CCA granted in 2017, 2016, 2015 and 2014 that are denomi-
natedinUSdollarsandvestthree,fiveandsevenyearsfromthe date of grant receive interest rate equivalents at a rate of 4.27%, 5.41%, 5.75% and 5.33%, respectively, per annum over the six-month US dollar London Interbank Offered Rate (LIBOR) and
p CCA granted in 2017, 2016, 2015 and 2014 that are denomi-nated in Swiss francs and vest three years from the date of grant receive interest rate equivalents at a rate of 3.17%, 4.23%, 4.85% and 4.75% per annum over the six-month Swiss franc LIBOR.
The rates were set in line with market conditions at the time of grant and existing high-trigger and low-trigger contingent capital instruments that CSG has issued. For CCA granted in February 2017, employees who received compensation in Swiss francs received CCA denominated in Swiss francs and all other employ-ees received CCA denominated in US dollars.
As CCA qualify as going-concern loss-absorbing capital of CSG, the timing and form of distribution upon settlement is subject to approval by the Swiss Financial Market Supervisory Authority FINMA (FINMA). At settlement, employees will receive either a contingent capital instrument or a cash payment based on the fair value of the CCA. The fair value will be determined by CSG. In the case of a cash settlement, the CCA award currency denomination

73Credit Suisse International, Annual Report 2016
Notes to the Financial Statements for the year ended 31 December 2016
will be converted into the local currency of each respective employee.
CCA have loss-absorbing features such that prior to settle-ment, the principal amount of the CCA would be written down to zero if any of the following trigger events were to occur:p CSG’s reported common equity tier 1 (‘CET1’) ratio falls below
7%; orp FINMA determines that cancellation of the CCA and other sim-
ilar contingent capital instruments is necessary, or that CSG requires public sector capital support, in either case to prevent it from becoming insolvent or otherwise failing.
Total compensation expense recognised for Jan16, Jan15 and Jan14 CCA during the year ended December 31, 2016 was USD 25 million (2015: USD 23 million).
Other Variable CompensationIn 2016, CSG granted deferred cash retention awards relating to the reorganisation of the Global Markets and Investment Banking & Capital Markets businesses. These awards will be expensed over a period of up to seven years from the grant date. Amortisa-tion of these awards was recognised in the Corporate Center. Total compensation expense recognised during the year ended Decem-ber 31, 2016 was USD 5 million (2015: Nil).
Plus Bond awardsCertain employees received a portion of 2012 deferred variable compensation in the form of Plus Bond awards. The Plus Bond awardwasessentiallyafixedincomeinstrument,denominatedinUS dollars, which provided a coupon payment that was commen-surate with market-based pricing. Plus Bond award holders were entitled to receive semi-annual cash payments on their adjusted award amounts at the rate of LIBOR plus 7.875% per annum until settlement. The Plus Bond settled in July 2016 based on the amount of the initial award less any portfolio losses in excess of a firstlossportionretainedbyCSGofUSD600million.Thevalueofthe Plus Bond awards was based on the performance of a portfo-lio of unrated and sub-investment-grade asset-backed securities (‘ABS’) that were held in inventory by various trading desks. The Plus Bond award plan contributed to a reduction of CSG’s risk-weighted assets and constituted a risk transfer from CSG to the Plus Bond award holders. Final payout upon settlement of these awards was 100% of the amount awarded.Total compensation expense recognised during the year ended 31 December 2016 was USD 0.1 million (2015: USD 1 million).
2011 Partner Asset Facility (‘PAF2’)As part of the 2011 annual compensation process, CSG awarded a portion of deferred variable compensation for certain employees in the form of 2011 Partner Asset Facility (‘PAF2’) units. PAF2 unitsareessentiallyfixedincomestructurednotesthatareexposedto a portion of the credit risk that arises in CSG’s derivative activi-ties, including both current and possible future swaps and other derivative transactions. The value of the award (for both the inter-estaccrualandthefinalredemption)willbereducediftheamountofrealisedcreditlossesfromaspecificreferenceportfolioexceedsapre-definedthreshold.CSGwillbearthefirstUSD500millionof
such losses and the PAF2 holders, across a number of CSG enti-ties including CSi will bear any losses in excess of USD 500 mil-lion, up to the full amount of the deferred compensation awarded.Certain employees received PAF2 awards, which vested in the firstquarterof2012.
PAF2 awards were linked to a portfolio of CSG’s credit exposures, providing risk offset and capital relief. Due to regulatory changes, this capital relief would no longer be available. As a result, CSG restructured the awards in March 2014, requiring PAF2 holders to reallocate the exposure of their awards from the pool of counter-party credit risks in the original PAF2 structure to one of the fol-lowing options, or a combination thereof:p Capital Opportunity Facility (‘COF’): participants elect for their
award to be referenced to a COF. The COF is a seven-year facility that is linked to the performance of a portfolio of risk-transfer and capital mitigation transactions, to be entered into with CSG, chosen by a COF management team. The value of the COF awards will be reduced if there are losses from the COF portfolio, up to the full amount of the award. Participants who elect the COF will receive semi-annual US dollar cash distributions of 6.5% per annum until settlement in cash in 2021, and such semi-annual distributions will reduce the cash settlement amount payable in 2021; and
p Contingent Capital Awards: participants elect to receive CCA, with similar terms to the instruments granted as part of the 2013 compensation awards. Settlement of these awards occurredinthefirsthalfof2016,followingregulatoryapprov-als. Final payout upon settlement of these awards was 94% of the amount awarded.
Total compensation (income)/expense recognised for the PAF2 CCA during the year ended December 31, 2016 was USD (2) million (2015: USD 3 million).
Total compensation expense recognised for the COF during the year ended 31 December 2016 was USD 1 million (2015: USD 1 million).
2008 Partner Asset Facility (‘PAF’) As part of the 2008 annual compensation process, CSG granted certain employees the majority of the deferred compensation in the form of 2008 Partner Asset Facility (‘PAF’) awards, denomi-nated in US dollars. The PAF awards are indexed to, and represent afirst-loss interest in, a specifiedpool of illiquidassets (AssetPool) that originated in the former Investment Banking division.
The notional value of the Asset Pool was based on the fair market value of the assets within the Asset Pool on December 31, 2008, and those assets will remain static throughout the contrac-tual term of the award or until liquidated. The PAF holders will par-ticipate in the potential gains on the Asset Pool if the assets within the pool are liquidated at prices above the initial fair market value. If the assets within the Asset Pool are liquidated at prices below theinitialfairmarketvalue,thePAFholderswillbearthefirstlossontheAssetPool.Asaresult,asignificantportionofriskpositionsassociated with the Asset Pool has been transferred to the

74
employees and removed from CSG’s risk-weighted assets, result-ing in a reduction in capital usage.
The PAF awards, which have a contractual term of eight years, are fully vested. Each PAF holder will receive a semi-annual cash interest payment of LIBOR plus 250 basis points applied to the notional value of the PAF award granted throughout the contrac-tualtermoftheaward.Beginninginthefifthyearafterthegrantdate, the PAF holders will receive an annual cash payment equal to 20% of the notional value of the PAF awards if the fair market
value of the Asset Pool in that year has not declined below the ini-tialfairmarketvalueoftheAssetPool.Inthefinalyearofthecon-tractual term, thePAFholderswill receiveafinal settlement incash equal to the notional value, less all previous cash payments made to the PAF holder, plus any related gains or less any related losses on the liquidation of the Asset Pool. Settlement is expected tooccurinthefirsthalfof2017.
Total compensation expense recognised during the year ended 31 December 2016 was USD 1 million (2015: USD 4 million).
33 Related Parties
The CSi group is controlled by CSG, its ultimate parent, which is incorporated in Switzerland. The CSi group’s parent company, which holds a majority of the voting rights in the undertaking, is Credit Suisse AG, which is incorporated in Switzerland. The regis-tered address of CSG and Credit Suisse AG is Paradeplatz 8, 8070 Zurich, Switzerland.
TheCSi group has significant related party balanceswithsubsidiaries andaffiliatesofCSG. These transactions largelycomprise derivative trades, as the Bank is the principal risk taker for derivatives within the CS group, as well as funding trades via use of loans or deposits, repurchase or repurchase agreements.
In addition, the ordinary shares are issued to CSG and subsidiar-ies of CSG, as outlined in Note 30 – Share Capital and Share Premium. The Bank is also charged for operating costs that mainly relate to employee-related services and other business expenses. Further, these transactions also include transfer pric-ing income/charges with CS group entities that provide services in respect of the global derivatives business which is centrally booked in the Bank.
The Bank generally enters into the above transactions in the ordinary course of business on market terms that could be obtained from unrelated parties.
a) Related party assets and liabilities
31 December 2016 31 December 2015 Fellow Fellow group group
Group Parent companies Total Parent companies Total
Assets (USD million)
Cash and due from banks – 4,513 4,513 97 12,183 12,280
Interest-bearing deposits with banks – 9,647 9,647 – 59 59
Securities purchased under resale agreements
and securities borrowing transactions – 9,467 9,467 – 30,072 30,072
Trading financial assets at fair value through profit or loss 875 23,632 24,507 3,447 30,230 33,677
Financial assets designated at fair value through profit or loss – 10,023 10,023 – 3,648 3,648
Other loans and receivables – 2,988 2,988 – 2,993 2,993
Other assets 8 4,786 4,794 1 5,222 5,223
Asset Held For Sale 5 1,056 1,061 – – –
Total assets 888 66,112 67,000 3,545 84,407 87,952
Liabilities and Equity (USD million)
Deposits – 143 143 83 37 120
Securities sold under repurchase agreements
and securities lending transactions – 2,821 2,821 – 5,737 5,737
Trading financial liabilities at fair value through profit or loss 562 20,481 21,043 949 28,326 29,275
Financial liabilities designated at fair value through profit or loss 2,460 12,251 14,711 4,757 5,750 10,507
Short term borrowings – 2,664 2,664 – 21,066 21,066
Other liabilities 111 4,867 4,978 93 3,559 3,652
Long term debt 1,100 30,774 31,874 – 26,555 26,555
Share capital 3,110 9,256 12,366 3,110 9,256 12,366
Share premium 4,110 8,594 12,704 4,110 8,594 12,704
Liabilities Held For Sale 2 61 63 – – –
Total liabilities and equity 11,455 91,912 103,367 13,102 108,880 121,982

75Credit Suisse International, Annual Report 2016
Notes to the Financial Statements for the year ended 31 December 2016
31 December 2016 31 December 2015
Fellow Fellow group group
Bank Parent companies Subsidiaries Total Parent companies Subsidiaries Total
Assets (USD million)
Cash and due from banks – 4,513 – 4,513 97 12,183 – 12,280
Interest-bearing deposits with banks – 9,647 – 9,647 – 59 – 59
Securities purchased under resale agreements
and securities borrowing transactions – 9,467 – 9,467 – 30,072 – 30,072
Trading financial assets at fair value through profit or loss 875 23,632 308 24,815 3,447 30,230 435 34,112
Financial assets designated at fair value through profit or loss – 10,023 – 10,023 – 3,648 – 3,648
Other loans and receivables – 2,988 – 2,988 – 2,993 – 2,993
Other assets 8 4,786 – 4,794 1 5,222 – 5,223
Asset Held For Sale 5 1,056 – 1,061 – – – –
Total assets 888 66,112 308 67,308 3,545 84,407 435 88,387
Liabilities and Equity (USD million)
Deposits – 143 – 143 83 37 – 120
Securities sold under repurchase agreements
and securities lending transactions – 2,821 – 2,821 – 5,737 – 5,737
Trading financial liabilities at fair value through profit or loss 562 20,481 8 21,051 949 28,326 8 29,283
Financial liabilities designated at fair value through profit or loss 2,460 12,251 – 14,711 4,757 5,750 9 10,516
Short term borrowings – 2,664 – 2,664 – 21,066 – 21,066
Other liabilities 111 4,867 – 4,978 93 3,559 – 3,652
Long term debt 1,100 30,774 56 31,930 – 26,555 9 26,564
Share capital 3,110 9,256 – 12,366 3,110 9,256 – 12,366
Share premium 4,110 8,594 – 12,704 4,110 8,594 – 12,704
Liabilities Held For Sale 2 61 – 63 – – – –
Total liabilities and equity 11,455 91,912 64 103,431 13,102 108,880 26 122,008
Related party off-balance sheet transactions
31 December 2016 1 31 December 2015
Fellow Fellow group group
Credit Suisse International Parent companies Total Parent companies Total
Other credit guarantees – 155 155 – 155 155
Other indemnifications – 402 402 – 353 353
Irrevocable loan commitments – 178 178 – 190 190
Total – 735 735 – 698 698
1 Above table shows off-balance sheet transactions of continued and discontinued operations.
b) Related party revenues and expenses
31 December 2016 1 31 December 2015
Fellow Fellow group group
Group (USD million) Parent companies Total Parent companies Total
Interest income 2 189 191 – 195 195
Interest expense (62) (527) (589) (45) (415) (460)
Net interest expense (60) (338) (398) (45) (220) (265)
Commissions and fees (1) 57 56 – 17 17
Revenue sharing agreements expense (9) (519) (528) (9) (479) (488)
Other revenue – 84 84 – 106 106
Total non-interest revenues (10) (378) (388) (9) (356) (365)
Net operating income (70) (716) (786) (54) (576) (630)
Total operating expenses 2 1 (47) (46) (2) (185) (187)
1 Above table shows revenues and expenses of continued and discontinued operations. 2 Net overheads allocated from other CS group entities of USD 202 million (2015: USD 400 million) are not included in the Total operating expenses.

76
c) Remuneration
Remuneration of Directors
(USD ‘000) 2016 2015
Emoluments 2,997 2,650
Long term incentive schemes:
AmountsPaidunderDeferredCashAwards 630 1,660
AmountsDeliveredunderShareBasedAwards 1,444 2,855
Total 5,071 7,165
Compensation for loss of office 3 –
Bank’s contributions to defined contribution 51 38
Total 5,125 7,203
Emoluments include amounts paid to or receivable by the Direc-tors. Only vested Cash Retention Awards are included in emolu-ments. Long term incentive schemes consist of deferred cash awards and share based awards and are only given to Executive Directors.TheNon-ExecutiveDirectorsonly receiveafixed fee.Deferred cash awards are included in the period when the amounts vest and are paid, and share based awards are included in the period when the amounts vest and are delivered.
Where directors perform services for a number of companies within the CS group, the total remuneration payable to each direc-tor has been apportioned to the respective entities based on a time spent per company allocation for that director.
The aggregate of emoluments and deferred cash awards paid to or receivable by the highest paid director was USD 1,412,000
(2015: USD 4,413,000). The director was also a member of a definedcontributionpensionplanandthecontributionpaidduringthe year into the plan was USD 7,000 (2015: USD 6,000). There werenocontributionsmadefordefinedbenefitlumpsum(2015:USD Nil). During the year the highest paid director also received an entitlement to shares under a long term incentive scheme.
The amounts included in the Companies Act disclosures are on a different basis than the recognition requirements of IFRS 2 and IAS 37 and the disclosure requirements of IAS 24. The aggregate amount of remuneration accrued in the Bank’s accounts for direc-tors in accordance with IFRS requirements for 2016 was USD 5,208,000 (2015: USD 5,635,000).
d) Number of Directors and Benefits
(Number of Directors) 2016 2015
Retirement benefits are accruing to the following number of Directors under:
Defined contribution schemes 6 6
No scheme 4 4
Both defined contribution and defined benefit 1 –
Both defined contribution and defined benefit lump sum 1 –
Directors in respect of whom services were received or receivable under long term incentive scheme 9 7
e) Remuneration of Key Management Personnel
(USD’ 000) 2016 2015
Remuneration of Key Management Personnel
Emoluments 6,735 7,101
Long term incentive schemes 2,561 7,591
Total 9,296 14,692
Compensation for loss of office – –
Bank’s contributions to defined contribution plan 127 111
Bank’s contributions to defined benefit lump sum 206 –
Total 9,629 14,803
The numbers disclosed in the ‘Remuneration of Key Management Personnel’arebasedonamountsaccrued inthefinancialstate-ments for all emoluments and long term incentive schemes.
Where Key Management Personnel perform services for a number of companies within the CS group, the total remuneration payable to each key management person has been apportioned to

77Credit Suisse International, Annual Report 2016
Notes to the Financial Statements for the year ended 31 December 2016
the respective entities based on a time spent per company alloca-tion for that key management person.
Key management personnel are those persons having author-ity and responsibility for planning, directing and controlling the
activities of the CSi group, directly or indirectly, including any direc-tor of the CSi group.
Key management personnel include Directors and the mem-bers of the CSI Executive Committee, (2015 the UK Investment Bank Executive Committee).
CSG Shares awarded to Key Management Personnel
2016 2015
Number of shares 356,171 326,830
The shares included in the table are the shares accrued in the period under the requirements of IFRS 2. These numbers differ from the share awards included in the Company’s Act disclosures above, which are disclosed in the period in which they vest and are delivered.
f) Loans and Advances to Directors and Key Management PersonnelLoans outstanding to or due from Directors or key management personnel of the CSi group as at 31 December 2016 were USD 6,000 (2015: USD 4,000), of which loans to Directors were USD 2,000 (2015: USD 2,000).
34 Employees
The average number of persons employed during the year was as follows:
Group and Bank (Number) 2016 2015
Business functions 1,300 964
Corporate functions 395 237
Total 1,695 1,201
The CSi group receives a range of services from related compa-nies, in particular from fellow subsidiary Credit Suisse Securities (Europe) Limited which is the primary Credit Suisse employing entity in the UK. The headcount related to these services cannot be accurately ascertained and is not therefore included in the
above numbers. Staff costs and staff numbers do not differ between Bank and CSi group.
The increase in headcount primarily relates to the transfer of employees in relation to business acquisition from CSS(E)L towards the end of 2015.
35 Derivatives and Hedging Activities
Derivatives are generally either privately negotiated OTC contracts or standard contracts transacted through regulated exchanges. The Bank’s most frequently used freestanding derivative products, entered into for trading and risk management purposes, include interest rate, equity, cross currency and credit default swaps, inter-est rate and foreign currency options, foreign exchange forward contracts, and foreign currency and interest rate futures.
Furthermore, the Bank enters into contracts that are not considered derivatives in their entirety but include embedded derivatives features. Such transactions primarily include issued and purchased structured debt instruments where the return may be calculated by reference to an equity security, index, or
third-party credit risk or that have non-standard or foreign cur-rency terms.
On the date the derivative contract is entered into, the Bank designates the derivative as belonging to one of the following categories:p a trading activity;p a risk management transaction that does not qualify as a
hedge under accounting standards (referred to as an economic hedge); or
p ahedgeofthevariabilityofcashflowstobereceivedorpaidrelated to a recognised asset or liability or a forecasted transaction.

78
The following table sets forth details of trading derivatives instruments:
31 December 2016 31 December 2015
Trading 1 Trading
Positive Negative Positive Negative replacement replacement replacement replacement Group value value value value
Trading and hedging derivatives instruments (USD million)
Forwards and forward rate agreements 166 233 325 437
Swaps 89,187 83,495 113,981 108,368
Options bought and sold (OTC) 41,829 39,291 49,959 47,982
Options bought and sold (Exchange traded) 162 208 50 26
Interest rate products 131,344 123,227 164,315 156,813
Forwards and forward rate agreements 10,688 10,999 12,037 12,015
Swaps 34,043 39,871 31,681 41,429
Options bought and sold (OTC) 7,393 7,717 16,336 16,973
Foreign exchange products 52,124 58,587 60,054 70,417
Forwards and forward rate agreements – 3 2 2
Swaps 5,508 5,325 6,519 5,570
Options bought and sold (OTC) 6,743 6,928 7,220 7,497
Options bought and sold (Exchange traded) 10,296 11,375 8,111 9,787
Equity/indexed-related products 22,547 23,631 21,852 22,856
Swaps 10,399 11,024 21,214 21,636
Options bought and sold (OTC) 38 32 57 43
Credit products 10,437 11,056 21,271 21,679
Forwards and forward rate agreements 93 195 71 125
Swaps 239 330 718 465
Options bought and sold (OTC) 450 376 230 211
Options bought and sold (Exchange traded) 33 83 18 26
Other products 815 984 1,037 827
Total derivative instruments 217,267 217,485 268,529 272,592
1 Above tables includes both continued and discontinued operations. Details are included in Note 28 – Discontinued Operations and Assets Held for Sale.
2016 1 2015
Positive Negative Positive Negative replacement replacement replacement replacement Group value value value value
Replacement values (USD million)
Replacement values (trading) before netting 217,267 217,485 268,529 272,592
Replacement values (trading) after netting 210,098 210,588 262,698 266,996
1 Above tables includes both continued and discontinued operations. Details are included in Note 28 – Discontinued Operations and Assets Held for Sale.

79Credit Suisse International, Annual Report 2016
Notes to the Financial Statements for the year ended 31 December 2016
31 December 2016 31 December 2015
Trading 1 Trading
Positive Negative Positive Negative replacement replacement replacement replacement Bank value value value value
Trading and hedging derivatives instruments (USD million)
Forwards and forward rate agreements 166 233 325 437
Swaps 89,187 83,495 113,999 108,376
Options bought and sold (OTC) 41,829 39,291 49,959 47,982
Options bought and sold (Exchange traded) 162 208 50 26
Interest rate products 131,344 123,227 164,333 156,821
Forwards and forward rate agreements 10,688 10,999 12,037 12,015
Swaps 34,043 39,871 31,681 41,429
Options bought and sold (OTC) 7,393 7,717 16,336 16,973
Foreign exchange products 52,124 58,587 60,054 70,417
Forwards and forward rate agreements – 3 2 2
Swaps 5,508 5,325 6,519 5,570
Options bought and sold (OTC) 6,743 6,929 7,220 7,497
Options bought and sold (Exchange traded) 10,296 11,374 8,111 9,787
Equity/indexed-related products 22,547 23,631 21,852 22,856
Swaps 10,399 11,032 21,214 21,636
Options bought and sold (OTC) 38 32 57 43
Credit products 10,437 11,064 21,271 21,679
Forwards and forward rate agreements 93 195 71 125
Swaps 239 330 718 465
Options bought and sold (OTC) 450 376 230 211
Options bought and sold (Exchange traded) 33 83 18 26
Other products 815 984 1,037 827
Total derivative instruments 217,267 217,493 268,547 272,600
1 Above tables includes both continued and discontinued operations. Details are included in Note 28 – Discontinued Operations and Assets Held for Sale.
2016 1 2015
Positive Negative Positive Negative replacement replacement replacement replacement Bank value value value value
Replacement values (USD million)
Replacement values (trading) before netting 217,267 217,493 268,547 272,600
Replacement values (trading) after netting 210,098 210,596 262,716 267,004
1 Above tables includes both continued and discontinued operations. Details are included in Note 28 – Discontinued Operations and Assets Held for Sale.
Trading ActivitiesThe Bank is active in most of the principal trading markets and transacts in many popular trading and hedging products. As noted above, this includes the use of swaps, futures, options and struc-tured products (custom transactions using combinations of deriva-tives) in connection with its sales and trading activities. Trading activities include market-making, positioning and arbitrage activi-ties. The majority of the Bank’s derivatives held as at 31 Decem-ber 2016 were used for trading activities.
Economic HedgesEconomic hedges arise when the CSi group enters into derivative contracts for its own risk management purposes, but the contracts
entered into do not qualify for hedge accounting under IFRS. These economic hedges include the following types:p interest rate derivatives to manage net interest rate risk on cer-
tain banking business assets and liabilities;p foreign exchange derivatives to manage foreign exchange risk
on certain banking business revenue and expense items, as well as on banking business assets and liabilities;
p credit derivatives to manage credit risk on certain loan portfo-lios; and
p economic hedges are accounted for and presented in the same way as trading derivatives, since hedge accounting is not applied.

80
Hedge effectiveness assessmentThe CSi group assesses the effectiveness of hedging relationships both prospectively and retrospectively. The prospective assess-ment is made both at the inception of a hedging relationship and on an ongoing basis and requires the CSi group to justify its expectation that the relationship will be highly effective over future periods. The retrospective assessment is also performed on an ongoing basis and requires the CSi group to determine whether or not the hedging relationship has actually been effective. If the CSi group concludes, through a retrospective evaluation, that hedge accounting is appropriate for the current period, then it measures the amount of hedge ineffectiveness to be recognised in earnings. There were no hedges as at 31 December 2016 and 31 Decem-ber 2015.
Disclosures relating to contingent credit riskCertain of the Bank’s derivative instruments contain provisions thatrequire it tomaintainaspecifiedcreditratingfromeachofthe major credit rating agencies. If the ratings fall below the level
specified in thecontract, thecounterparties to theagreementscould request payment of additional collateral on those derivative instruments that are in a net liability position. Certain of the derivative contracts also provide for termination of the contract, generally upon a downgrade of either CSG or the counterparty, at the existing mark to market replacement value of the derivative contract.
On a daily basis, the level of incremental collateral that would be required by derivative counterparties in the event of a CSG ratings downgrade is monitored. Collateral triggers are main-tained by the Collateral Management department and vary by counterparty.
The impact of downgrades in the CSG’s long-term debt ratings are considered in the stress assumptions used to determine the liquidityandfundingprofileoftheBank.TheBankholdsaliquiditypool made up of ‘high quality liquid assets’ (‘HQLA’) to meet any additional collateral calls as a result of a downgrade. The assess-ment takes into consideration a two-notch downgrade in credit rating of CSG.
36 Guarantees and Commitments
The following tables set forth details of contingent liabilities associated with guarantees and other commitments:
Maturity
Total gross Collateral Net of Group and Bank <1 year 1-3 years 3-5 years >5 years amount received collateral
31 December 2016
Guarantees (USD million)
Credit guarantees and similar instruments 36 – 50 – 86 4 82
Performance guarantees and similar instruments 267 210 55 – 532 – 532
Other Guarantees – 402 – – 402 402
Total guarantees 303 612 105 – 1,020 4 1,016
Maturity
Total gross Collateral Net of Group and Bank <1 year 1-3 years 3-5 years >5 years amount received collateral
31 December 2016
Other commitments (USD million)
Loan commitments 4,938 1,263 2,210 84 8,495 4,938 3,557
Other Commitments – Commitments to purchase cash securities <1 year 1,124 – – – 1,124 – 1,124
Total other commitments 6,062 1,263 2,210 84 9,619 4,938 4,681
Maturity
Total gross Collateral Net of Group and Bank <1 year 1-3 years 3-5 years >5 years amount received collateral
31 December 2015
Guarantees (USD million)
Credit guarantees and similar instruments 77 – 50 – 127 1 126
Performance guarantees and similar instruments 188 355 55 – 598 – 598
Other Guarantees 353 – – – 353 – 353
Total guarantees 618 355 105 – 1,078 1 1,077

81Credit Suisse International, Annual Report 2016
Notes to the Financial Statements for the year ended 31 December 2016
Maturity
Total gross Collateral Net of Group and Bank <1 year 1-3 years 3-5 years >5 years amount received collateral
31 December 2015
Other commitments (USD million)
Irrevocable commitments under documentary credit – – – – – – –
Loan commitments 4,598 3,712 1,505 369 10,184 4,954 5,230
Other Commitments – Commitments to purchase cash securities <1 year 2,310 – – – 2,310 – 2,310
Total other commitments 6,908 3,712 1,505 369 12,494 4,954 7,540
Credit guarantees are contracts that require the CSi group to makepayments,shouldathirdpartyfailtodosounderaspecifiedexisting credit obligation. For example, in connection with its cor-porate lending business and other corporate activities, the CSi group provides guarantees to counterparties in the form of standby letters of credit, which represent obligations to make payments to thirdpartiesifthecounterpartyfailstofulfillitsobligationunderaborrowing arrangement or other contractual obligation.
Performance guarantees and similar instruments are arrange-ments that require contingent payments to be made when certain performance-related targets or covenants are not met. Such cov-enants may include a customer’s obligation to deliver certain prod-ucts and services or to perform under a construction contract. Performance-related guarantees are frequently executed as part ofprojectfinancetransactions.
Other Guarantees consist of an indemnity that Credit Suisse International has provided to Credit Suisse Securities (Europe) Limited with respect to potential funding requests up to a maxi-mum of USD 402 million in relation to the UK Pension Fund for the period starting 01 June 2016 and ending 31 May 2018. Credit Suisse International is receiving a fee of USD 50 million in monthly instalments for this indemnity.
Loan commitments include unused credit facilities that cannot be revoked at any time without prior notice.
Commitments to purchase cash securities represents the value of debt and equity cash security contracts which requires CSi group to make payments to customers, banks, brokers and dealers which have not settled as at the reporting date.
Lease CommitmentsThe following table sets forth details of future minimum operating lease commitments under non-cancellable operating leases:
Group and Bank 2016 2015
Operating lease commitments (USD million)
Up to 1 year 87 96
From 1 year and no later than 5 years 327 383
From 5 years and over 628 858
Future operating lease commitments 1,042 1,337
Less minimum non-cancellable sublease rentals (10) (50)
Total net future minimum operating lease commitments 1,032 1,287
The future operating lease commitments include service charges of USD 19 million (2015: USD 21 million).
The following table sets forth details of rental expenses for all operating leases:
Group and Bank 2016 2015
Net rental expense (USD million)
Minimum rentals 85 95
Sublease rental income (63) (82)
Total net rental expenses 22 13
Contingent Liabilities and Other CommitmentsThe Bank is party to various legal proceedings as part of its normal course of business. The Directors of the Bank believe that the aggregate liability, if any, resulting from these proceedings will not
materiallyprejudice thefinancial positionof theBankandhavebeen provided for where deemed necessary or in accordance with accounting policy.

82
US Antitrust Class Action re CDS: Credit Suisse entities, as well as other banks, have been named in civil litigation in the US, currently pending in the US District Court for the Southern District of New York. In September 2015, Credit Suisse and the other defendants executed agreements with the putative class action plaintiffs to settle this litigation. In April 2016 the court granted finalapproval to thesettlementagreement,enteringfinal judge-ment and dismissing the action.
A lawsuit was brought against CSi in the English courts by Rosserlane Consultants Limited and Swinbrook Developments Limited. The litigation relates to the forced sale by CSi in 2008 of Caspian Energy Group LP (‘CEG’), the vehicle through which the plaintiffshelda51%stake in theKyurovdagoilandgasfield inAzerbaijan. CEG was sold for USD 245 million following two unsuccessful merger and acquisition processes. The plaintiffs allege that CEG should have been sold for at least USD 700 mil-lion. The trial took place at the end of 2014 and on 20 February, 2015 the case was dismissed and judgement given in favor of CSi. The plaintiffs appealed the judgement and in January 2017 the Court of Appeal ruled in CSi’s favour.
CSi is defending a EUR 170 million claw back claim brought by the Winding Up Committee (‘WUC’) of the Icelandic Bank Kaupth-ing Bank hf in the District Court of Reykjavik, Iceland. The claim relates to CSi’s issuance of ten credit linked notes in 2008, which the WUC is seeking to challenge under various provisions of Icelan-dic insolvency law in order to claw back funds paid to CSi. The WUC is also claiming significant penalty interest under Icelandic law. CSi argues that the purchase of the credit linked notes is gov-erned by English law, which does not provide a legal basis for such clawback actions. In October 2014, the Court of the European Free
Trade Association States issued a non-binding decision supporting CSi’s position that the governing law of the transactions is relevant. A trial is currently expected to take place in 2017. Separately, CSi is pursuing a claim for USD 226 million in the District Court of Reyk-javik, Iceland against Kaupthing Bank hf’s WUC in order to enforce certain security rights arising under a 2007 structured trade. CSi acquired the security rights following Kaupthing Bank hf’s insol-vency in 2008. In December 2016 CSi and Kaupthing ehf (formerly Kaupthing Bank hf) entered into a confidential settlement agree-ment bringing an end to these proceedings.
CSi is the defendant in German court litigation brought by Stadtwerke Munchen GmbH, a German water utility company. The litigation relates to a series of interest rate swaps entered into between 2008 and 2012. The claimant alleges breach of an advi-sorydutytoprovidebothinvestor-andinvestment-specificadvice,including in particular a duty to disclose the initial mark-to-market value of the trades at inception. The claimant seeks damages of EUR 39 million, repayment of EUR 184 million of collateral held by CSi and release from all future obligations under the trades. A preliminary hearing took place in February 2016, and further hear-ing dates are due in Q2 2017.
CSi is responding to requests from regulatory and enforce-mentauthoritiesrelatedtoCSi’sarrangementofloanfinancingtoMozambique state enterprises, Proindicus S.A. and Empresa Mocambiacana de Atum S.A. (EMATUM), a distribution to private investors of loan participation notes (LPN) related to the EMATUM financinginSeptember2013,andCSi’ssubsequentroleinarrang-ing the exchange of those LPNs for Eurobonds issued by the Republic of Mozambique. CSi has been cooperating with the authorities on this matter.
37 Interests in Other Entities
SubsidiariesComposition of the CSi GroupSubsidiaries are entities (including structured entities) controlled by the CSi group. The CSi group controls an entity when it is exposed to, or has rights to, variable returns from its involvement with the entity and has the ability to affect those returns through its power
over the entity. The financial statements of subsidiaries areincludedintheconsolidatedfinancialstatementsfromthedateonwhich control commences until the date on which control ceases.
The following table sets forth the full list of related undertak-ings (which is not limited to subsidiary undertakings) the CSi group owns, directly or indirectly.

83Credit Suisse International, Annual Report 2016
Notes to the Financial Statements for the year ended 31 December 2016
Composition of the Group
Percentage Percentage of of ownership ownership
Company Name Domicile Currency held 2016 held 2015
31 December 2016
AHL Investment Strategies PCC – Class F3 Global Futures Cayman Islands 1 USD – 100
AHL Investment Strategies PCC – Class I1 AHL Global Futures 6 EUR Shares Guernsey 1 EUR 100 100
AHL Investment Strategies PCC – Class K1 AHL Global Futures 7 EUR Shares Guernsey 1 EUR 100 100
AHL Investment Strategies PCC – Class L1 AHL Global Futures 8 EUR Shares Guernsey 1 EUR 100 100
AI3 Segregated Portfolio Cayman Islands 1 USD 100 100
Ajanta Limited Gibraltar 1 EUR 100 100
Andrea Investments (Jersey) PCC Jersey 1 GBP 100 100
Andrea Investments (Jersey) PCC – Cell Series 1000 EUR Jersey 1 EUR 100 –
Andrea Investments (Jersey) PCC – Cell Series 1000 PC Jersey 1 USD 100 100
Andrea Investments (Jersey) PCC – Cell Series 1000 USD Jersey 1 USD 100 –
Argentum Capital Series 2015-5 Luxembourg 1 USD 100 100
Arundel (International) Limited Gibraltar 1 EUR 100 100
Bellingham Properties Limited Gibraltar 1 EUR 100 100
Boats Investments (Jersey) Ltd Series 532,546,548,551,557,561,562,564,565 Jersey 1 USD 100 100
Boats Investments (Jersey) Ltd Series 545,550,558,559,560 Jersey 1 USD – 100
Boats Investments (Jersey) Ltd Series 567,568,569,570,571,572,575,576,577,
578,579,582,584,585,586,587,588,589,590 Jersey 1 USD 100 –
Bondstreet 2 GmbH Germany 1 USD 100 100
Brevan Howard Multi-Manager Limited Cayman Islands 1 USD 100 100
CARMF Alternative 1 France 1 USD 100 100
Carmil Properties Limited Gibraltar 1 EUR 100 100
Cepheus Holdings Limited Gibraltar 1 EUR 100 100
Coxaro Holdings Limited Cyprus 1 USD 100 100
Credit Suisse Backwardation Fund Ireland, Republic of 1 USD 100 100
Credit Suisse Bond Fund Ireland, Republic of 1 EUR 100 100
Credit Suisse Custom Markets Luxembourg 1 USD – 100
Credit Suisse Global Carry selector Fund II Ireland, Republic of 1 USD 100 –
Crown RF Segregated Portfolio Cayman Islands 1 USD – 100
Culross Global SPC Limited – Culross UCITS Index Segregated Portfolio British Virgin Islands 1 USD 100 100
Custom Markets PLC Ireland, Republic of 1 USD – 100
Custom Markets PLC – Credit Suisse Movers Fund Ireland, Republic of 1 EUR – 100
Custom Markets QIF PLC Ireland, Republic of 1 USD 100 100
Dutch Holding Rembrandt B.V. Netherlands 1 EUR 100 100
Dutch Property Company Rembrandt BV Entities 1 – 9 Netherlands 1 EUR 100 100
Ecureuil Vie – Separate Account (EV) Segregated Portfolio Cayman Islands 1 USD 100 100
Global Bond Fund Ireland, Republic of 1 USD 100 –
HOLT Emerging Markets Equity Fund Ireland, Republic of 1 USD 100 100
HOLT Global Equity Fund Luxembourg 1 USD 100 100
Interleuvenlaan 15 Real Estate Ltd Gibraltar 1 EUR 100 100
Kaylen Properties Limited Gibraltar 1 EUR 100 100
LHI Mid Market Buy-Out Europe LP Guernsey 1 EUR 80 80
Lux Multi Flex Hubel Luxembourg 1 EUR – 100
Mistral SPC Cayman Islands 1 USD 100 100
Mistral SPC – Long/Short Equity Cayman Islands 1 USD 100 100
Xanthos Holding – Segregated Portfolio Cayman Islands 1 USD 100 100

84
Composition of the Group (Continued)
31 December 2016
New Jersey S.A. Luxembourg 1 EUR 100 100
RPM SPC – Enhanced Risk Segregated Portfolio Cayman Islands 1 USD – 100
RPM SPC – Global Futures Selection Enhanced Risk Segregated Portfolio Cayman Islands 1 USD 100 100
SAPIC Global Macro Fund Ltd. Cayman Islands 1 USD – 100
SAPIC Global Macro Master Fund Ltd. Cayman Islands 1 USD 100 100
SAPIC-98 Master Fund Cayman Islands 1 USD – 100
SAPIC-98 Reference Fund (55) LIMITED Cayman Islands 1 EUR – 100
SAPIC-98 Reference Fund (56) LIMITED Cayman Islands 1 EUR – 100
Silver Hake Limited Gibraltar 1 EUR 100 100
Simplon Capital Ltd. SPC – AlphAlgo Segregated Fund Portfolio Cayman Islands 1 EUR 100 100
Sontex (International) Limited Gibraltar 1 EUR 100 100
Weiveldlaan 41 Real Estate Ltd Gibraltar 1 EUR 100 100
Westwood S.A Portugal 1 USD 100 100
Xanthos Arrow Index Trust Cayman Islands 1 USD – 100
YI Active Spezial ESPA Fund. Austria 1 EUR 100 100
Zephyros Limited Cayman Islands 1 USD 100 100
1 Detailed Registered Office address mentioned in Note 46 (Table 2)
There are no material differences between the date of the end of thereportingperiodofthefinancialstatementsoftheCSigroupand those of any of its subsidiaries (including any consolidated structured entities). There was drop in the CS relative % holding in
1 of the consolidated structured entities which resulted in a change in the consolidation conclusion during the reporting year ended 31 December 2016.
Changes in ownership that did result in the loss of control
(USD million) 2016 2015
31 December 2016
Cash Consideration 37 19
Carrying value of net assets 1 42
Gain/(Loss) on disposal of interests recorded 2 2
RestrictionsThe CSi group and its subsidiaries have certain restrictions which may restrict the ability of the CSi group to access or use the assets and settle the liabilities of the CSi group. These restrictions may be statutory, contractual or regulatory in nature.
The Bank must at all times monitor and demonstrate compli-ance with the relevant regulatory capital requirements set out in the EU Capital Requirements Regulation (‘CRR’) and additionally as laid down by the PRA. The Bank has put into place processes and controls to monitor and manage its capital adequacy. For more information regarding the Bank’s capital adequacy and how the capital resources are managed and monitored please refer to Note 43 – Capital Adequacy.
The Bank is required to maintain minimum levels of capital in the form of equity shares and reserves to meet PRA requirements.
Restricted assets also include those assets protected under client segregation rules. Please refer to Note 21 – Brokerage Receivables and Brokerage Payables for further information.
The CSi group pledges assets mainly for repurchase agree-mentsandothersecuritiesfinancing.Certainpledgedassetsmay
be encumbered, meaning the counterparty has the right to resell or repledge the pledged asset. Please refer to Note 16 – Trading FinancialAssets andLiabilities atFairValueThroughProfit orLoss for more information on encumbered assets.
Other restrictions include those that prevent some subsidiaries from making any distributions to the parent such as restrictions on redemption or the payments of dividends.
Unconsolidated structured entitiesThe CSi group has interests in structured entities which are not consolidated. An interest is either a contractual or non-contractual involvement that exposes the CSi group to variability in returns from the performance of another entity. An interest in another entity can be evidenced by, but is not limited to, the holding of equity or debt instruments as well as other forms of involvement such as the provision of funding, liquidity, credit enhancement and guarantees.
The CSi group does not have an interest in another entity solely because of a Typical Customer Supplier Relationship such as fees other than management and performance fees that are passively earned and are typically one-off in nature.

85Credit Suisse International, Annual Report 2016
Notes to the Financial Statements for the year ended 31 December 2016
Type of structured entityCollateralised Debt ObligationsThe CSi group engages in CDO transactions to meet client and investorneeds,earnfeesandsellfinancialassets.TheCSigroupmay act as underwriter, placement agent or asset manager and may warehouse assets prior to the closing of a transaction. As partof itsstructuredfinancebusiness, theCSigrouppurchasesloans and other debt obligations from and on behalf of clients for the purpose of securitisation. The loans and other debt obligations are sold to structured entities, which in turn issue CDOs to fund the purchase of assets such as investment grade and high yield corporate debt instruments.
The maximum exposure to loss consists of the fair value of instruments issued by such structures that are held by the CSi group.
Financial IntermediationTheCSigrouphassignificantinvolvementwithstructuredentitiesinitsroleasafinancialintermediaryonbehalfofclients.Financialintermediation consists of securitisations, funds, loans and other vehicles.
SecuritisationsSecuritisations are primarily CMBS, RMBS and ABS vehicles. The CSi group acts as an underwriter, market maker, liquidity pro-vider, derivative counterparty and/or provider of credit enhance-ments to structured entities related to certain securitisation transactions.
The maximum exposure to loss is the carrying value of the loan securities and derivative positions that are variable returns if any, plus the exposure arising from any credit enhancements the CSi group provided. The CSi group’s maximum exposure to loss does notincludeanyeffectsfromfinancialinstrumentsusedtoeconom-ically hedge the risks of the structured entities.
FundsFunds include investment structures such as mutual funds, funds of funds, private equity funds and fund-linked products. where the investors’ interest is typically in the form of debt rather than equity, thereby making them structured entities. The CSi group may have various relationships with such structured entities in the form of
structurer, investment advisor, investment manager, administrator, custodian, underwriter, placement agent, market maker and/or as prime broker. These activities include the use of structured enti-ties in structuring fund-linked products, hedge funds of funds or private equity investments to provide clients with investment opportunities in alternative investments. In such transactions, a structured entity holds underlying investments and issues securi-ties that provide the investors with a return based on the perfor-mance of those investments.
The maximum exposure to loss consists of the fair value of instruments issued by such structures that are held by the CSi group. The investors typically retain the risk of loss on such trans-actions, but for certain fund types, the CSi group may provide principal protection on the securities to limit the investors’ expo-sure to downside market risk. The CSi group’s maximum exposure to lossdoesnot includeanyeffects fromfinancial instrumentsused to economically hedge the risk of the structured entities.
LoansLoansaresingle-financingvehicleswheretheCSigroupprovidesfinancingforspecifiedassetsorbusinessventuresandtherespec-tive owner of the assets or manager of the businesses provides the equity in the vehicle. These tailored lending arrangements are establishedtopurchase, leaseorotherwisefinanceandmanageclients’ assets.
The maximum exposure to loss is the carrying value of the CSi group’s loan exposure, which is subject to the same credit risk management procedures as loans issued directly to clients. The clients’ creditworthiness is carefully reviewed, loan-to-value ratios are strictly set and, in addition, clients provide equity, additional collateralorguarantees,allofwhichsignificantlyreducetheCSigroup’s exposure. The CSi group considers the likelihood of incur-ring a loss equal to the maximum exposure to be remote because of the CSi group’s risk mitigation efforts which includes over-col-lateralisationandeffectivemonitoring toensure thatasufficientloan-to-value ratio is maintained.
Thefollowingtableprovidesthecarryingamountsandclassifi-cations of the assets and liabilities of interests recorded in the CSi group’s Consolidated Statement of Financial Position, the maxi-mum exposure to loss and the total assets of the unconsolidated structured entities.

86
Interests in unconsolidated structured entities
Type of structured entity Financial intermediation Securiti-
End of 2016 CDO sations Funds Loans Other Total
Balance sheet line item (USD million)
Trading financial assets at fair value through profit or loss
Debt securities – 269 2,045 203 – 2,517
Equity securities – – 1,594 – 16 1,610
Derivative instruments 90 8 – 87 – 185
Other – – 3 – 3
Financial assets designated at fair value through profit or loss
Loans – – – – 235 235
Total assets 90 277 3,639 293 251 4,550
Trading financial liabilities at fair value through profit or loss
Equity securities – – – – (220) (220)
Derivative instruments – (52) – – (11) (63)
Financial liabilities designated at fair value through profit or loss
Long term debt – – – – – –
Total liabilities – (52) – – (231) (283)
Maximum exposure to loss 90 277 3,639 293 251 4,550
Unconsolidated structured entity assets 449 16,899 731,565 1,724 798 751,435
Type of structured entity Financial intermediation Securiti-
End of 2015 CDO sations Funds Loans Other Total
Balance sheet line item (USD million)
Trading financial assets at fair value through profit or loss
Debt securities – 531 3,128 220 – 3,879
Equity securities – – 1,250 – 21 1,271
Derivative instruments 93 19 – – 32 144
Other – – – 5 – 5
Financial assets designated at fair value through profit or loss
Loans – 3 – – 77 80
Total assets 93 553 4,378 225 130 5,379
Trading financial liabilities at fair value through profit or loss
Equity securities – – – – (76) (76)
Derivative instruments – (76) – – (22) (98)
Financial liabilities designated at fair value through profit or loss
Long term debt – – – – – –
Total liabilities – (76) – – (98) (174)
Maximum exposure to loss 93 553 4,378 225 130 5,379
Unconsolidated structured entity assets 481 18,979 601,241 866 1,462 623,029
The unconsolidated structured entity assets relate to where the CSi group has an interest in the unconsolidated structured entity. These amounts represent the assets of the entities themselves
and are typically unrelated to the exposures the CSi group has with the entity and thus are not amounts that are considered for risk management purposes.

87Credit Suisse International, Annual Report 2016
Notes to the Financial Statements for the year ended 31 December 2016
Income and losses from unconsolidated structured entities
Income/(Losses)
Other Commission Other Gain/(Loss) Interest Income/ and Fees/ Derivative Fair Value on Sale Income/ (Other (Other
31 December 2016 Gain/(Loss) Gain/(Loss) of Assets (Expense) Losses) Expenses) Total
Structured entity type (USD million)
Securitisations (19) 97 1 9 – 1 89
Funds (3) 54 (23) – (6) – 22
Loans 11 9 – 27 – – 47
Other (27) 8 – (4) 1 7 (15)
Total (38) 168 (22) 32 (5) 8 143
Income/(Losses)
Other Commission Other Gain/(Loss) Interest Income/ and Fees/ Derivative Fair Value on Sale Income/ (Other (Other
31 December 2015 Gain/(Loss) Gain/(Loss) of Assets (Expense) Losses) Expenses) Total
Structured entity type (USD million)
Securitisations 234 120 – 15 – 5 374
Funds – 12 (2) – 2 – 12
Loans – 26 – 18 – – 44
Other (45) (14) – 23 – 7 (29)
Total 189 144 (2) 56 2 12 401
The table above shows the income earned from unconsolidated structured entities during the reporting period. Income from an unconsolidated structured entity includes, but is not limited to recurring and non-recurring fees, interest and commission received, gains or losses from the transfer of assets and liabilities and changes in the fair value of instruments, including derivatives.
The CSi group considers itself the sponsor of a structured entity when either its name appears in the name of the structured
entity or in products issued by it or there is a general expectation from the market that the CSi group is associated with the struc-tured entity or the CSi group was involved in the design or set up of the structured entity and has a form of involvement with the structured entity.
The table below shows information about the unconsolidated structured entities sponsored by the CSi group where no interest is held by the CSi group.
Sponsored unconsolidated structured entities
Income/(Losses)
Other Carrying Gain/(Loss) Income/ Value Derivative on Sale (Other of Assets Structured entity type Gain/(Loss) of Assets Losses) Total transferred
31 December 2016 (USD million)
Securitisations (16) 11 16 11 524
Funds – – – – –
Loans – – – – –
Other 1 2 5 8 422
Total (15) 13 21 19 946
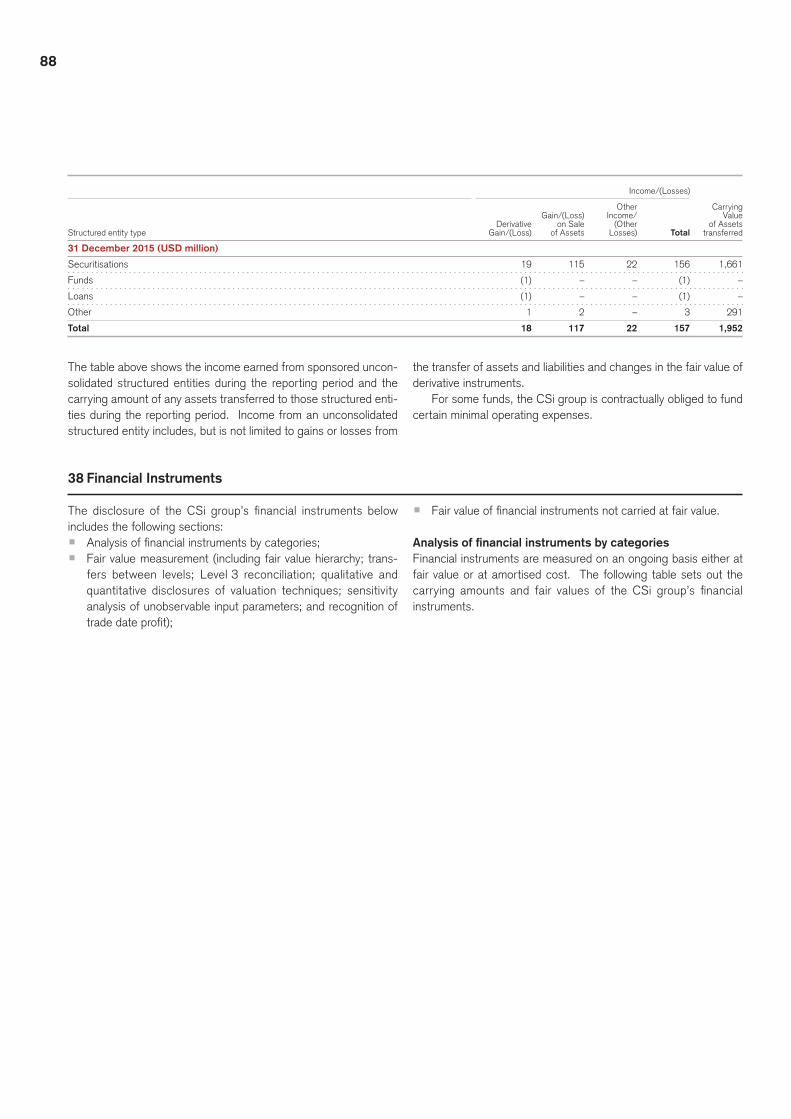
88
Income/(Losses)
Other Carrying Gain/(Loss) Income/ Value Derivative on Sale (Other of Assets Structured entity type Gain/(Loss) of Assets Losses) Total transferred
31 December 2015 (USD million)
Securitisations 19 115 22 156 1,661
Funds (1) – – (1) –
Loans (1) – – (1) –
Other 1 2 – 3 291
Total 18 117 22 157 1,952
The table above shows the income earned from sponsored uncon-solidated structured entities during the reporting period and the carrying amount of any assets transferred to those structured enti-ties during the reporting period. Income from an unconsolidated structured entity includes, but is not limited to gains or losses from
the transfer of assets and liabilities and changes in the fair value of derivative instruments.
For some funds, the CSi group is contractually obliged to fund certain minimal operating expenses.
38 Financial Instruments
The disclosure of theCSi group’s financial instruments belowincludes the following sections:p Analysisoffinancialinstrumentsbycategories;p Fair value measurement (including fair value hierarchy; trans-
fers between levels; Level 3 reconciliation; qualitative and quantitative disclosures of valuation techniques; sensitivity analysis of unobservable input parameters; and recognition of tradedateprofit);
p Fairvalueoffinancialinstrumentsnotcarriedatfairvalue.
Analysis of financial instruments by categoriesFinancial instruments are measured on an ongoing basis either at fair value or at amortised cost. The following table sets out the carrying amounts and fair values of the CSi group’s financialinstruments.

89Credit Suisse International, Annual Report 2016
Notes to the Financial Statements for the year ended 31 December 2016
Financial assets and liabilities by categories
Carrying Total
31 December 2016 value fair value
Total Other carrying Held for Designated Loans and amortised
Group (USD million) value trading at fair value receivables cost
Financial assets (USD million)
Cash and due from banks 5,490 – – – 5,490 5,490
Interest-bearing deposits with banks 9,647 – – – 9,647 9,647
Securities purchased under resale agreements and securities borrowing transactions 9,467 – – – 9,467 9,467
Trading financial assets at fair value through profit or loss 242,427 242,427 – – – 242,427
Financial assets designated at fair value through profit or loss 20,406 – 20,406 – – 20,406
Other loans and receivables 3,316 – – 3,316 – 3,322
Other assets 36,700 – – – 36,700 36,700
Assets held for Sale 3,772 3,460 312 – – 3,772
Total financial assets 331,225 245,887 20,718 3,316 61,304 331,231
Financial liabilities (USD million)
Deposits 457 – – – 457 457
Securities sold under repurchase agreements and securities lending transactions 2,821 – – – 2,821 2,821
Trading financial liabilities at fair value through profit or loss 211,639 211,639 – – – 211,639
Financial liabilities designated at fair value through profit or loss 24,689 – 24,689 – – 24,689
Short term borrowings 2,667 – – – 2,667 2,667
Other liabilities 31,426 – – – 31,426 31,426
Long term debt 32,140 – – – 32,140 32,140
Liabilities held for sale 3,753 1 2,317 1,436 – – 3,753
Total financial liabilities 309,592 213,956 26,125 – 69,511 309,592
1 Liabilities held for sale does not include USD 54 million Day 1 gain as it is out of purview of the Financial instruments disclosure.
Financial assets and liabilities by categories
Carrying Total
31 December 2016 value fair value
Total Other carrying Held for Designated Loans and amortised
Bank (USD million) value trading at fair value receivables cost
Financial assets (USD million)
Cash and due from banks 5,361 – – – 5,361 5,361
Interest-bearing deposits with banks 9,647 – – – 9,647 9,647
Securities purchased under resale agreements and securities borrowing transactions 9,467 – – – 9,467 9,467
Trading financial assets at fair value through profit or loss 242,255 242,255 – – – 242,255
Financial assets designated at fair value through profit or loss 20,699 – 20,699 – – 20,699
Other loans and receivables 3,316 – – 3,316 – 3,322
Other assets 36,700 – – – 36,700 36,700
Assets held for Sale 3,772 3,460 312 – – 3,772
Total financial assets 331,217 245,715 21,011 3,316 61,175 331,223
Financial liabilities (USD million)
Deposits 457 – – – 457 457
Securities sold under repurchase agreements and securities lending transactions 2,821 – – – 2,821 2,821
Trading financial liabilities at fair value through profit or loss 211,647 211,647 – – – 211,647
Financial liabilities designated at fair value through profit or loss 24,683 – 24,683 – – 24,683
Short term borrowings 2,667 – – – 2,667 2,667
Other liabilities 31,426 – – – 31,426 31,426
Long term debt 31,937 – – – 31,937 31,937
Liabilities held for sale 3,753 1 2,317 1,436 – – 3,753
Total financial liabilities 309,391 213,964 26,119 – 69,308 309,391
1 Liabilities held for sale does not include USD 54 million Day 1 gain/loss as it is out of purview of the Financial instruments disclosure.

90
Financial assets and liabilities by categories
Carrying Total
31 December 2015 value fair value
Total Other carrying Held for Designated Loans and amortised
Group (USD million) value trading at fair value receivables cost
Financial assets
Cash and due from banks 13,163 – – – 13,163 13,163
Interest-bearing deposits with banks 59 – – – 59 59
Securities purchased under resale agreements and securities borrowing transactions 30,073 – – – 30,073 30,073
Trading financial assets at fair value through profit or loss 295,229 295,229 – – – 295,229
Financial assets designated at fair value through profit or loss 12,078 – 12,078 – – 12,078
Other loans and receivables 3,495 – – 3,495 – 3,499
Other assets 45,636 – – – 45,636 45,636
Total financial assets 399,733 295,229 12,078 3,495 88,931 399,737
Financial liabilities
Deposits 564 – – – 564 564
Securities sold under repurchase agreements and securities lending transactions 5,737 – – – 5,737 5,737
Trading financial liabilities at fair value through profit or loss 270,767 270,767 – – – 270,767
Financial liabilities designated at fair value through profit or loss 22,509 – 22,509 – – 22,509
Short term borrowings 21,066 – – – 21,066 21,066
Other liabilities 30,822 – – – 30,822 30,822
Long term debt 26,587 – – – 26,587 26,587
Total financial liabilities 378,052 270,767 22,509 – 84,776 378,052
Financial assets and liabilities by categories
Carrying Total
31 December 2015 value fair value
Total Other carrying Held for Designated Loans and amortised
Bank (USD million) value trading at fair value receivables cost
Financial assets
Cash and due from banks 13,082 – – – 13,082 13,082
Interest-bearing deposits with banks 59 – – – 59 59
Securities purchased under resale agreements and securities borrowing transactions 30,073 – – – 30,073 30,073
Trading financial assets at fair value through profit or loss 294,985 294,985 – – – 294,985
Financial assets designated at fair value through profit or loss 12,488 – 12,488 – – 12,488
Other loans and receivables 3,495 – – 3,495 – 3,499
Other assets 45,636 – – – 45,636 45,636
Total financial assets 399,818 294,985 12,488 3,495 88,850 399,822
Financial liabilities
Deposits 564 – – – 564 564
Securities sold under repurchase agreements and securities lending transactions 5,737 – – – 5,737 5,737
Trading financial liabilities at fair value through profit or loss 270,775 270,775 – – – 270,775
Financial liabilities designated at fair value through profit or loss 22,267 – 22,267 – – 22,267
Short term borrowings 21,066 – – – 21,066 21,066
Other liabilities 30,822 – – – 30,822 30,822
Long term debt 26,596 – – – 26,596 26,596
Total financial liabilities 377,827 270,775 22,267 – 84,785 377,827

91Credit Suisse International, Annual Report 2016
Notes to the Financial Statements for the year ended 31 December 2016
Fair value measurementFair value is the price that would be received to sell an asset or paid to transfer a liability in an orderly transaction in the principal (or most advantageous) market at the measurement date. A signif-icantportionof theCSigroup’sfinancial instrumentsarecarriedatfairvalue.Deteriorationoffinancialmarketscouldsignificantlyimpactthefairvalueofthesefinancialinstrumentsandtheresultsof operations.
ThefairvalueofthemajorityoftheCSigroup’sfinancialinstru-ments is based on quoted prices in active markets or observable inputs. These instruments include government and agency securi-ties, certain CP, most investment grade corporate debt, certain high yield debt securities, exchange-traded and certain OTC deriv-ative instruments and most listed equity securities.
Inaddition,theCSigroupholdsfinancialinstrumentsforwhichno prices are available and which have little or no observable inputs. Furtherdeteriorationof financialmarkets could signifi-cantly impact the value of these financial instruments and theresults of operations. For these instruments, the determination of fair value requires subjective assessment and varying degrees of judgement, depending on liquidity, concentration, pricing assump-tions, the current economic and competitive environment and the risksaffecting thespecific instrument. In suchcircumstances,valuation is determined based on management’s own assumptions about the assumptions that market participants would use in pric-ing the asset or liability, including assumptions about risk. These instruments include certain OTC derivatives, including equity and credit derivatives, certain corporate equity-linked securities, mort-gage-related and Collateralised Debt Obligation (‘CDO’) securi-ties, private equity investments, certain loans and credit products, including leveragedfinance,certainsyndicated loansandcertainhigh yield bonds. The fair value measurement disclosures exclude derivative transactions that are daily settled.
Thefairvalueoffinancialassetsandliabilitiesisimpactedbyfactorssuchasbenchmarkinterestrates,pricesoffinancialinstru-ments issued by third parties, commodity prices, foreign exchange rates and index prices or rates. In addition, valuation adjustments are an integral part of the valuation process when market prices are not indicative of the credit quality of a counterparty, and are applied to both OTC derivatives and debt instruments. The impact of changes in a counterparty’s credit spreads (known as credit val-uation adjustments) is considered when measuring the fair value of assets and the impact of changes in the CSi group’s own credit spreads (known as debit valuation adjustments) is considered when measuring the fair value of its liabilities. For OTC derivatives, the impact of changes in both the CSi group’s and the counterpar-ty’s credit standing is considered when measuring their fair value, based on current Credit Default Swap (‘CDS’) prices. The adjust-ments also take into account contractual factors designed to reduce the CSi group’s credit exposure to counterparty, such as collateral held and master netting agreements. For hybrid debt instruments with embedded derivative features, the impact of changes in the CSi group’s credit standing is considered when measuring their fair value, based on current funded debt spreads.
IFRS 13 permits a reporting entity to measure the fair value of agroupoffinancialassetsandfinancial liabilitiesonthebasisof
the price that would be received to sell a net long position or paid to transfer a net short position for a particular risk exposure in an orderly transaction between market participants at the measure-ment date. This is consistent with industry practice. As such, the CSi group applies bid and offer adjustments to net portfolios of cash securities and/or derivative instruments to adjust the value of the net position from a mid-market price to the appropriate bid or offer level that would be realised under normal market conditions forthenetlongornetshortpositionforaspecificmarketrisk.Inaddition,theCSigroupreflectsthenetexposuretocreditriskforits derivative instruments where the CSi group has legally enforce-able agreements with its counterparties that mitigate credit risk exposure in the event of default. Valuation adjustments are recorded in a reasonable and consistent manner that results in an allocationtotherelevantdisclosures inthenotestothefinancialstatements as if the valuation adjustment had been allocated to the individual unit of account.
Fair value hierarchyThefinancial instrumentscarriedat fair valuewerecategorisedunder the three levels of the fair value hierarchy as follows:p Level 1: Quoted market prices (unadjusted) in active markets
for identical assets or liabilities that the CSi group has the abil-ity to access. This level of the fair value hierarchy provides the most reliable evidence of fair value and is used to measure fair value whenever available.
p Level 2: Inputs to valuation models/techniques, other than quoted prices included within Level 1, that are observable for the asset or liability, either directly or indirectly. These inputs include: (i) quoted prices for similar assets or liabilities in active markets; (ii) quoted prices for identical or similar assets or sim-ilar liabilities in markets that are not active, that is, markets in which there are few transactions for the asset and liability, the prices are not current or price quotations vary substantially either over time or among market makers, or in which little information is publicly available; (iii) inputs other than quoted prices that are observable for the asset or liability; or (iv) inputs that are derived principally from or corroborated by observable market data by correlation or other means.
p Level 3: Inputs to valuation models/techniques, for the asset or liability that are not based on observable market data (signif-icant unobservable inputs). These inputs reflect the CSigroup’s own assumptions about the assumptions that market participants would use in pricing the asset or liability (including assumptions about risk). These inputs are developed based on the best information available in the circumstances, which includes the CSi group’s own data. The CSi group’s own data used to develop unobservable inputs is adjusted if information indicates that market participants would use different assumptions.
The following tablepresents thecarrying valueof thefinancialinstruments held at fair value across the three levels of the fair value hierarchy.

92
Fair value of assets and liabilities measured at fair value on a recurring basis
Impact Total at As at 31 December 2016 Group Level 1 Level 2 Level 3 of netting 1 fair value
Assets (USD million)
Debt securities 18,343 7,881 1,489 – 27,713
ofwhichUKgovernment 11,330 60 – – 11,390
ofwhichforeigngovernments 6,751 536 45 – 7,332
ofwhichcorporates 262 6,705 1,389 – 8,356
ofwhichresidentialmortgagebackedsecurities – 269 29 – 298
ofwhichcommercialmortgagebackedsecurities – 311 26 – 337
Equity securities 3,477 1,752 24 – 5,253
Derivatives 2,050 209,857 2,699 (7,169) 207,437
ofwhichinterestrateproducts 87 130,523 494 (890) 130,214
ofwhichforeignexchangeproducts 13 51,599 343 – 51,955
ofwhichequity/index-relatedproducts 1,948 18,208 969 (6,279) 14,846
ofwhichcreditderivatives – 8,714 893 – 9,607
ofwhichotherderivativeproducts 2 813 – – 815
Other – 1,498 526 – 2,024
Trading financial assets at fair value through profit or loss 23,870 220,988 4,738 (7,169) 242,427
Securities purchased under resale agreements and securities borrowing transactions – 16,410 – (1,499) 14,911
Loans – 2,967 394 – 3,361
ofwhichcommercialandindustrialloans – 263 158 – 421
ofwhichloanstofinancialinstitutions – 2,179 200 – 2,379
ofwhichgovernmentandpublicinstitutions – 525 36 – 561
Other financial assets designated at fair value through profit or loss – 2,008 126 – 2,134
ofwhichfailedpurchases – 1,976 102 – 2,078
ofwhichother – 32 24 – 56
Financial assets designated at fair value through profit or loss – 21,385 520 (1,499) 20,406
Debt securities – 456 62 – 518
ofwhichforeigngovernments – 11 – – 11
ofwhichcorporates – 445 62 – 507
Equity securities 270 11 – – 281
Derivatives – 2,086 575 – 2,661
ofwhichinterestrateproducts – 157 83 – 240
ofwhichforeignexchangeproducts – 168 – – 168
ofwhichequity/index-relatedproducts – 946 475 – 1,421
ofwhichcreditderivatives – 815 17 – 832
Other – – – – –
Trading financial assets at fair value through profit or loss 270 2,553 637 – 3,460
Loans – – 312 – 312
ofwhichloanstofinancialinstitutions – – 312 – 312
Assets held for sale 270 2,553 949 – 3,772
Total assets at fair value 24,140 244,926 6,207 (8,668) 266,605
1 Derivative contracts/ Securities purchased under resale agreements and securities borrowing transactions are reported on a gross basis by Level. The impact of netting represents an adjustment related to counterparty netting.

93Credit Suisse International, Annual Report 2016
Notes to the Financial Statements for the year ended 31 December 2016
Fair value of assets and liabilities measured at fair value on a recurring basis
Impact Total at As at 31 December 2016 Group Level 1 Level 2 Level 3 of netting 1 fair value
Liabilities (USD million)
Debt securities 441 551 – – 992
ofwhichforeigngovernments 441 113 – – 554
ofwhichcorporates – 438 – – 438
Equity securities 2,111 77 – – 2,188
Other securities – 9 – – 9
Derivatives 1,997 210,675 2,675 (6,897) 208,450
ofwhichinterestrateproducts 90 122,760 292 (619) 122,523
ofwhichforeignexchangeproducts 13 58,174 112 – 58,299
ofwhichequity/index-relatedproducts 1,892 19,667 1,164 (6,278) 16,445
ofwhichcreditderivatives – 9,093 1,107 – 10,200
ofwhichotherderivativeproducts 2 981 – – 983
Trading financial liabilities at fair value through profit or loss 4,549 211,312 2,675 (6,897) 211,639
Securities sold under resale agreements and securities borrowing transactions – 15,694 – (1,499) 14,195
Short term borrowings – 1,535 119 – 1,654
Long term debt – 5,811 2,542 – 8,353
ofwhichstructurednotesbetweenoneandtwoyears – 874 66 – 940
ofwhichotherdebtinstrumentsbetweenoneandtwoyears – 36 6 – 42
ofwhichtreasurydebtovertwoyears – 71 – – 71
ofwhichstructurednotesovertwoyears – 3,296 1,463 – 4,759
ofwhichotherdebtinstrumentsovertwoyears – 1,527 1,007 – 2,534
ofwhichnon-recourseliabilities – 7 – – 7
Other financial liabilities designated at fair value through profit or loss 4 169 314 – 487
ofwhichfailedsales 4 146 311 – 461
ofwhichother – 23 3 – 26
Financial liabilities designated at fair value through profit or loss 4 23,209 2,975 (1,499) 24,689
Debt securities – 5 – – 5
ofwhichcorporates – 5 – – 5
Equity securities 173 1 – – 174
Derivatives – 2,109 29 – 2,138
ofwhichinterestrateproducts – 66 18 – 84
ofwhichforeignexchangeproducts – 292 – – 292
ofwhichequity/index-relatedproducts – 905 3 – 908
ofwhichcreditderivatives – 846 8 – 854
Trading financial liabilities at fair value through profit or loss 173 2,115 29 – 2,317
Long term debt – 1,463 – (27) 1,436
ofwhichotherdebtinstrumentsovertwoyears – 1,463 – (27) 1,436
Liabilities held for sale 173 2 3,578 29 (27) 3,753
Total liabilities at fair value 4,726 238,099 5,679 (8,423) 240,081
Net assets/liabilities at fair value 19,414 6,827 528 (245) 26,524
1 Derivative contracts/Securities sold under resale agreements and securities borrowing transactions are reported on a gross basis by Level. The impact of netting represents an adjustment related to counterparty netting.
2 Liabilities held for sale does not include USD 54 million Day 1 gain/loss as it is out of purview of the Financial instruments disclosure.

94
Fair value of assets and liabilities measured at fair value on a recurring basis
Impact Total at As at 31 December 2016 Bank Level 1 Level 2 Level 3 of netting 1 fair value
Assets (USD million)
Debt securities 18,343 7,760 1,489 – 27,592
ofwhichUKgovernment 11,330 60 – – 11,390
ofwhichforeigngovernments 6,751 536 45 – 7,332
ofwhichcorporates 262 6,584 1,389 – 8,235
ofwhichresidentialmortgagebackedsecurities – 269 29 – 298
ofwhichcommercialmortgagebackedsecurities – 311 26 – 337
Equity securities 3,477 1,708 24 – 5,209
Derivatives 2,050 209,857 2,699 (7,169) 207,437
ofwhichinterestrateproducts 87 130,523 494 (890) 130,214
ofwhichforeignexchangeproducts 13 51,599 343 – 51,955
ofwhichequity/index-relatedproducts 1,948 18,208 969 (6,279) 14,846
ofwhichcreditderivatives – 8,714 893 – 9,607
ofwhichotherderivativeproducts 2 813 – – 815
Other – 1,498 519 – 2,017
Trading financial assets at fair value through profit or loss 23,870 220,823 4,731 (7,169) 242,255
Securities purchased under resale agreements and securities borrowing transactions – 16,410 – (1,499) 14,911
Loans – 2,967 687 – 3,654
ofwhichcommercialandindustrialloans – 263 158 – 421
ofwhichloanstofinancialinstitutions – 2,179 493 – 2,672
ofwhichgovernmentandpublicinstitutions – 525 36 – 561
Other financial assets designated at fair value through profit or loss – 2,008 126 – 2,134
ofwhichfailedpurchases – 1,976 102 – 2,078
ofwhichother – 32 24 – 56
Financial assets designated at fair value through profit or loss – 21,385 813 (1,499) 20,699
Debt securities – 456 62 – 518
ofwhichforeigngovernments – 11 – – 11
ofwhichcorporates – 445 62 – 507
Equity securities 270 11 – – 281
Derivatives – 2,086 575 – 2,661
ofwhichinterestrateproducts – 157 83 – 240
ofwhichforeignexchangeproducts – 168 – – 168
ofwhichequity/index-relatedproducts – 946 475 – 1,421
ofwhichcreditderivatives – 815 17 – 832
Trading financial assets at fair value through profit or loss 270 2,553 637 – 3,460
Loans – – 312 – 312
ofwhichloanstofinancialinstitutions – – 312 – 312
Assets held for sale 270 2,553 949 – 3,772
Total assets at fair value 24,140 244,761 6,493 (8,668) 266,726
1 Derivative contracts/ Securities purchased under resale agreements and securities borrowing transactions are reported on a gross basis by Level. The impact of netting represents an adjustment related to counterparty netting.

95Credit Suisse International, Annual Report 2016
Notes to the Financial Statements for the year ended 31 December 2016
Fair value of assets and liabilities measured at fair value on a recurring basis
Impact Total at As at 31 December 2016 Bank Level 1 Level 2 Level 3 of netting 1 fair value
Liabilities (USD million)
Debt securities 441 551 – – 992
ofwhichforeigngovernments 441 113 – – 554
ofwhichcorporates – 438 – – 438
Equity securities 2,111 77 – – 2,188
Other securities – 9 – – 9
Derivatives 1,997 210,683 2,675 (6,897) 208,458
ofwhichinterestrateproducts 90 122,760 292 (619) 122,523
ofwhichforeignexchangeproducts 13 58,174 112 – 58,299
ofwhichequity/index-relatedproducts 1,892 19,667 1,164 (6,278) 16,445
ofwhichcreditderivatives – 9,101 1,107 – 10,208
ofwhichotherderivativeproducts 2 981 – – 983
Trading financial liabilities at fair value through profit or loss 4,549 211,320 2,675 (6,897) 211,647
Securities sold under resale agreements and securities borrowing transactions – 15,695 – (1,499) 14,196
Short term borrowings – 1,535 119 – 1,654
Long term debt – 5,804 2,542 – 8,346
ofwhichstructurednotesbetweenoneandtwoyears – 874 66 – 940
ofwhichotherdebtinstrumentsbetweenoneandtwoyears – 36 6 – 42
ofwhichtreasurydebtovertwoyears – 71 – – 71
ofwhichstructurednotesovertwoyears – 3,296 1,463 – 4,759
ofwhichotherdebtinstrumentsovertwoyears – 1,527 1,007 – 2,534
Other financial liabilities designated at fair value through profit or loss 4 169 314 – 487
ofwhichfailedsales 4 146 311 – 461
ofwhichother – 23 3 – 26
Financial liabilities designated at fair value through profit or loss 4 23,203 2,975 (1,499) 24,683
Debt securities – 5 – – 5
ofwhichcorporates – 5 – – 5
Equity securities 173 1 – – 174
Other securities – – – – –
Derivatives – 2,109 29 – 2,138
ofwhichinterestrateproducts – 66 18 – 84
ofwhichforeignexchangeproducts – 292 – – 292
ofwhichequity/index-relatedproducts – 905 3 – 908
ofwhichcreditderivatives – 846 8 – 854
Trading financial liabilities at fair value through profit or loss 173 2,115 29 – 2,317
Long term debt – 1,463 – (27) 1,436
ofwhichotherdebtinstrumentsovertwoyears – 1,463 – (27) 1,436
Liabilities held for sale 173 2 3,578 29 (27) 3,753
Total liabilities at fair value 4,726 238,101 5,679 (8,423) 240,083
Net assets/liabilities at fair value 19,414 6,660 814 (245) 26,643
1 Derivative contracts/Securities sold under resale agreements and securities borrowing transactions are reported on a gross basis by Level. The impact of netting represents an adjustment related to counterparty netting.
2 Liabilities held for sale does not include USD 54 million Day 1 gain/loss as it is out of purview of the Financial instruments disclosure.

96
Fair value of assets and liabilities measured at fair value on a recurring basis
Impact Total at As at 31 December 2015 Group Level 1 Level 2 Level 3 of netting 1 fair value
Assets (USD million)
Debt securities 10,320 10,648 1,561 – 22,529
ofwhichUKgovernment 6,233 175 – – 6,408
ofwhichforeigngovernments 4,055 674 110 – 4,839
ofwhichcorporates 32 8,663 1,419 – 10,114
ofwhichresidentialmortgagebackedsecurities – 532 – – 532
ofwhichcommercialmortgagebackedsecurities – 604 32 – 636
Equity securities 4,746 2,210 94 – 7,050
Derivatives 1,489 262,641 4,399 (5,831) 262,698
ofwhichinterestrateproducts 51 163,350 914 (623) 163,692
ofwhichforeignexchangeproducts 22 59,685 347 – 60,054
ofwhichequity/index-relatedproducts 1,409 19,140 1,303 (5,208) 16,644
ofwhichcreditderivatives – 19,436 1,835 – 21,271
ofwhichotherderivativeproducts 7 1,030 – – 1,037
Other – 1,750 1,202 – 2,952
Trading financial assets at fair value through profit or loss 16,555 277,249 7,256 (5,831) 295,229
Securities purchased under resale agreements and securities borrowing transactions – 3,668 – (496) 3,172
Loans – 5,154 1,194 – 6,348
ofwhichcommercialandindustrialloans – 407 651 – 1,058
ofwhichloanstofinancialinstitutions – 4,054 440 – 4,494
ofwhichgovernmentandpublicinstitutions – 693 53 – 746
ofwhichrealestate – – 50 – 50
Other financial assets designated at fair value through profit or loss – 2,481 77 – 2,558
ofwhichfailedpurchases – 2,459 52 – 2,511
ofwhichother – 22 25 – 47
Financial assets designated at fair value through profit or loss – 11,303 1,271 (496) 12,078
Total assets at fair value 16,555 288,552 8,527 (6,327) 307,307
1 Derivative contracts/ Securities purchased under resale agreements and securities borrowing transactions are reported on a gross basis by Level. The impact of netting represents an adjustment related to counterparty netting.
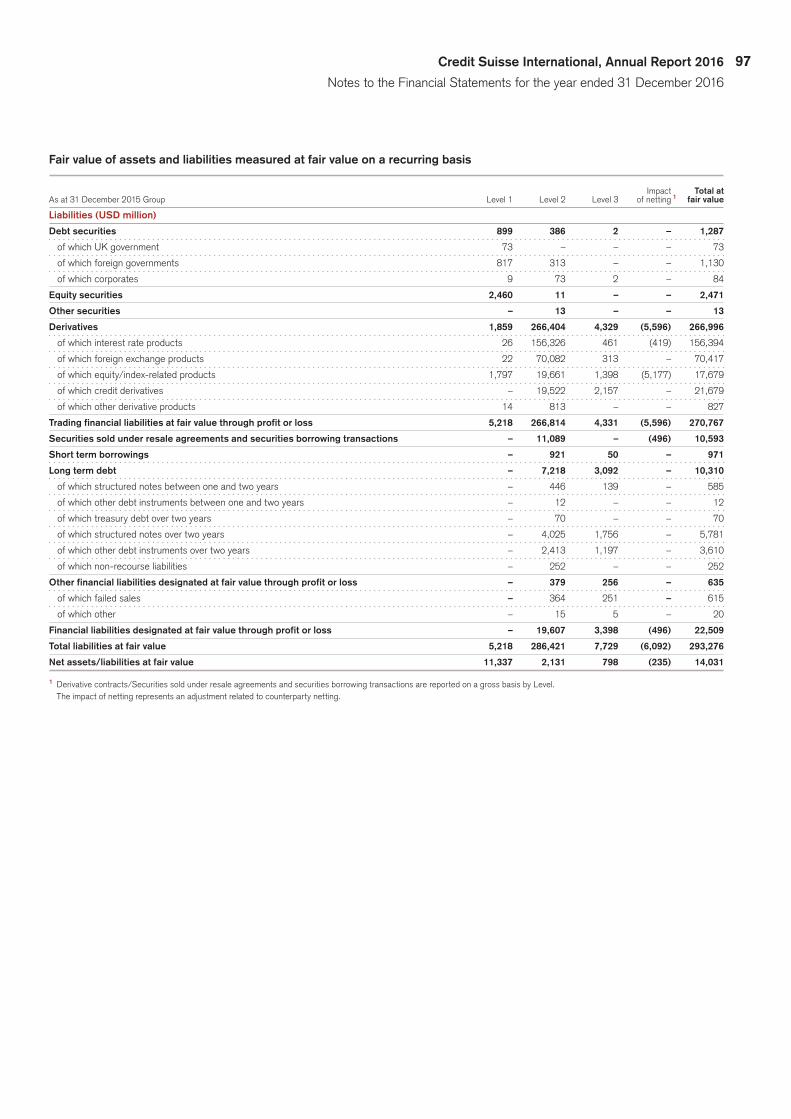
97Credit Suisse International, Annual Report 2016
Notes to the Financial Statements for the year ended 31 December 2016
Fair value of assets and liabilities measured at fair value on a recurring basis
Impact Total at As at 31 December 2015 Group Level 1 Level 2 Level 3 of netting 1 fair value
Liabilities (USD million)
Debt securities 899 386 2 – 1,287
ofwhichUKgovernment 73 – – – 73
ofwhichforeigngovernments 817 313 – – 1,130
ofwhichcorporates 9 73 2 – 84
Equity securities 2,460 11 – – 2,471
Other securities – 13 – – 13
Derivatives 1,859 266,404 4,329 (5,596) 266,996
ofwhichinterestrateproducts 26 156,326 461 (419) 156,394
ofwhichforeignexchangeproducts 22 70,082 313 – 70,417
ofwhichequity/index-relatedproducts 1,797 19,661 1,398 (5,177) 17,679
ofwhichcreditderivatives – 19,522 2,157 – 21,679
ofwhichotherderivativeproducts 14 813 – – 827
Trading financial liabilities at fair value through profit or loss 5,218 266,814 4,331 (5,596) 270,767
Securities sold under resale agreements and securities borrowing transactions – 11,089 – (496) 10,593
Short term borrowings – 921 50 – 971
Long term debt – 7,218 3,092 – 10,310
ofwhichstructurednotesbetweenoneandtwoyears – 446 139 – 585
ofwhichotherdebtinstrumentsbetweenoneandtwoyears – 12 – – 12
ofwhichtreasurydebtovertwoyears – 70 – – 70
ofwhichstructurednotesovertwoyears – 4,025 1,756 – 5,781
ofwhichotherdebtinstrumentsovertwoyears – 2,413 1,197 – 3,610
ofwhichnon-recourseliabilities – 252 – – 252
Other financial liabilities designated at fair value through profit or loss – 379 256 – 635
ofwhichfailedsales – 364 251 – 615
ofwhichother – 15 5 – 20
Financial liabilities designated at fair value through profit or loss – 19,607 3,398 (496) 22,509
Total liabilities at fair value 5,218 286,421 7,729 (6,092) 293,276
Net assets/liabilities at fair value 11,337 2,131 798 (235) 14,031
1 Derivative contracts/Securities sold under resale agreements and securities borrowing transactions are reported on a gross basis by Level. The impact of netting represents an adjustment related to counterparty netting.

98
Fair value of assets and liabilities measured at fair value on a recurring basis
Impact Total at 31 December 2015 Bank Level 1 Level 2 Level 3 of netting 1 fair value
Assets (USD million)
Debt securities 10,320 10,576 1,561 – 22,457
ofwhichUKgovernment 6,233 175 – – 6,408
ofwhichforeigngovernments 4,055 674 110 – 4,839
ofwhichcorporates 32 8,591 1,419 – 10,042
ofwhichresidentialmortgagebackedsecurities – 532 – – 532
ofwhichcommercialmortgagebackedsecurities – 604 32 – 636
Equity securities 4,746 2,036 94 – 6,876
Derivatives 1,489 262,659 4,399 (5,831) 262,716
ofwhichinterestrateproducts 51 163,368 914 (623) 163,710
ofwhichforeignexchangeproducts 22 59,685 347 – 60,054
ofwhichequity/index-relatedproducts 1,409 19,140 1,303 (5,208) 16,644
ofwhichcreditderivatives – 19,436 1,835 – 21,271
ofwhichotherderivativeproducts 7 1,030 – – 1,037
Other – 1,750 1,186 – 2,936
Trading financial assets at fair value through profit or loss 16,555 277,021 7,240 (5,831) 294,985
Securities purchased under resale agreements and securities borrowing transactions – 3,668 – (496) 3,172
Loans – 5,154 1,604 – 6,758
ofwhichcommercialandindustrialloans – 407 651 – 1,058
ofwhichloanstofinancialinstitutions – 4,054 850 – 4,904
ofwhichgovernmentandpublicinstitutions – 693 53 – 746
ofwhichrealestate – – 50 – 50
Other financial assets designated at fair value through profit or loss – 2,481 77 – 2,558
ofwhichfailedpurchases – 2,459 52 – 2,511
ofwhichother – 22 25 – 47
Financial assets designated at fair value through profit or loss – 11,303 1,681 (496) 12,488
Total assets at fair value 16,555 288,324 8,921 (6,327) 307,473
1 Derivative contracts/ Securities purchased under resale agreements and securities borrowing transactions are reported on a gross basis by Level. The impact of netting represents an adjustment related to counterparty netting.

99Credit Suisse International, Annual Report 2016
Notes to the Financial Statements for the year ended 31 December 2016
Fair value of assets and liabilities measured at fair value on a recurring basis
Impact Total at 31 December 2015 Bank Level 1 Level 2 Level 3 of netting 1 fair value
Liabilities (USD million)
Debt securities 899 386 2 – 1,287
ofwhichUKgovernment 73 – – – 73
ofwhichforeigngovernments 817 313 – – 1,130
ofwhichcorporates 9 73 2 – 84
Equity securities 2,460 11 – – 2,471
Other securities – 13 – – 13
Derivatives 1,859 266,412 4,329 (5,596) 267,004
ofwhichinterestrateproducts 26 156,334 461 (419) 156,402
ofwhichforeignexchangeproducts 22 70,082 313 – 70,417
ofwhichequity/index-relatedproducts 1,797 19,661 1,398 (5,177) 17,679
ofwhichcreditderivatives – 19,522 2,157 – 21,679
ofwhichotherderivativeproducts 14 813 – – 827
Trading financial liabilities at fair value through profit or loss 5,218 266,822 4,331 (5,596) 270,775
Securities sold under resale agreements and securities borrowing transactions – 11,089 – (496) 10,593
Short term borrowings – 921 50 – 971
Long term debt – 6,976 3,092 – 10,068
ofwhichstructurednotesbetweenoneandtwoyears – 446 139 – 585
ofwhichotherdebtinstrumentsbetweenoneandtwoyears – 22 – – 22
ofwhichtreasurydebtovertwoyears – 70 – – 70
ofwhichstructurednotesovertwoyears – 4,025 1,756 – 5,781
ofwhichotherdebtinstrumentsovertwoyears – 2,413 1,197 – 3,610
Other financial liabilities designated at fair value through profit or loss – 379 256 – 635
ofwhichfailedsales – 364 251 – 615
ofwhichother – 15 5 – 20
Financial liabilities designated at fair value through profit or loss – 19,365 3,398 (496) 22,267
Total liabilities at fair value 5,218 286,187 7,729 (6,092) 293,042
Net assets/liabilities at fair value 11,337 2,137 1,192 (235) 14,431
1 Derivative contracts/Securities sold under resale agreements and securities borrowing transactions are reported on a gross basis by Level. The impact of netting represents an adjustment related to counterparty netting.
Transfers between Level 1 and Level 2
2016 1 2015 1
Transfers Transfers to Transfers Transfers to out of Level Level 1 out out of Level Level 1 out USD million 1 to Level 2 of Level 2 1 to Level 2 of Level 2
Assets
Trading financial assets at fair value through profit or loss 1,157 4,781 427 3,433
Total transfers in assets at fair value 1,157 4,781 427 3,433
Liabilities
Trading financial liabilities at fair value through profit or loss 69 3,297 – 3,460
Total transfers in liabilities at fair value 69 3,297 – 3,460
1 Amounts in the above table includes both continued and discontinued operations.
The transfers from Level 1 to Level 2 were mainly driven by debt and equity securities where the liquidity had decreased and subse-quently lacked pricing transparency. All transfers were reported at the end of the reporting period.
The transfers from Level 2 to Level 1 are mainly driven by the transfer of exchange traded options as they moved closer to
maturity and inputs become observable. All transfers were reported at the end of the reporting period.
Movements of Level 3 instrumentsThe following tablepresentsa reconciliationof financial instru-ments categorised in Level 3 of the fair value hierarchy.

100
Assets and liabilities measured at fair value on a recurring basis for Level 3
Trading
revenues
Balance as On Balance as at at 1 January Transfers Transfers transfers On all 31 December Group 2016 in out Purchases Sales Issuances Settlements in/out 1 other 2016
Assets at fair value (USD million)
Debt securities 1,561 472 (530) 1,422 (1,526) – – 6 84 1,489
ofwhichforeigngovernments 110 51 (49) 40 (107) – – 3 (3) 45
ofwhichcorporates 1,419 390 (481) 1,382 (1,419) – – 3 95 1,389
ofwhichcommercialmortgage
backedsecurities 32 – – – – – – – (6) 26
ofwhichResidential
Mortgage-BackedSecurities – 31 – – – – – – (2) 29
Equity securities 94 31 (33) 29 (75) – – (2) (20) 24
Derivatives 4,399 1,204 (981) – – 1,825 (3,400) 12 (360) 2,699
ofwhichinterestrateproducts 914 44 (84) – – 458 (549) (20) (269) 494
ofwhichforeignexchangeproducts 347 1 (14) – – 15 (87) (2) 83 343
ofwhichequity/index-relatedproducts 1,303 138 (210) – – 809 (972) 22 (121) 969
ofwhichcreditderivatives 1,835 1,021 (673) – – 542 (1,791) 12 (53) 893
ofwhichotherderivativeproducts – – – – – 1 (1) – – –
Other 1,202 400 (713) 973 (1,240) 161 (312) 2 53 526
Trading financial assets
at fair value through profit or loss 7,256 2,107 (2,257) 2,424 (2,841) 1,986 (3,712) 18 (243) 4,738
Loans 1,194 – (225) 214 (283) 127 (621) – (12) 394
ofwhichcommercial
andindustrialloans 651 – (225) 191 (27) 61 (482) 3 (14) 158
ofwhichloanstofinancialinstitutions 440 – – 23 (256) 66 (70) (3) – 200
ofwhichgovernment
andpublicinstitutions 53 – – – – – (18) – 1 36
ofwhichrealestate 50 – – – – – (51) – 1 –
Other financial assets designated
at fair value through profit or loss 77 2 (1) 82 (14) – – 1 (21) 126
ofwhichfailedpurchases 52 – – 82 (10) – – – (22) 102
ofwhichother 25 2 (1) – (4) – – 1 1 24
Financial assets designated
at fair value through profit or loss 1,271 2 (226) 296 (297) 127 (621) 1 (33) 520
Debt securities – 3 (1) 107 (20) – – – (27) 62
ofwhichforeigngovernments – – – – – – – – – –
ofwhichcorporates – 3 (1) 107 (20) – – – (27) 62
Equity securities – – – – – – – – – –
Derivatives – 45 (38) – – 360 (115) (2) 325 575
ofwhichinterestrateproducts – 31 – – – 1 (1) – 52 83
ofwhichequity/index-relatedproducts – 5 (11) – – 358 (108) 2 229 475
ofwhichcreditderivatives – 9 (27) – – 1 (6) (4) 44 17
Trading financial assets
at fair value through profit or loss – 48 (39) 107 (20) 360 (115) (2) 298 637
Loans – 182 – – – 38 (3) – 95 312
ofwhichloanstofinancialinstitutions – 182 – – – 38 (3) – 95 312
Assets held for sale – 230 (39) 107 (20) 398 (118) (2) 393 949
Total assets at fair value 8,527 2,339 (2,522) 2,827 (3,158) 2,511 (4,451) 17 117 6,207
1 For all transfers to Level 3 or out of Level 3, the CSi group determines and discloses as Level 3 events only gains or losses through the last day of the reporting period.

101Credit Suisse International, Annual Report 2016
Notes to the Financial Statements for the year ended 31 December 2016
Assets and liabilities measured at fair value on a recurring basis for Level 3
Trading
revenues
Balance as On Balance as at at 1 January Transfers Transfers transfers On all 31 December Group 2016 in out Purchases Sales Issuances Settlements in/out 1 other 2016
Liabilities at fair value (USD million)
Debt securities 2 – – – (2) – – – – –
ofwhichcorporates 2 – – – (2) – – – – –
Derivatives 4,329 1,153 (1,070) – – 1,164 (3,846) 68 877 2,675
ofwhichinterestrateproducts 461 22 (33) – – 106 (234) (22) (8) 292
ofwhichforeignexchangeproducts 313 2 (6) – – 6 (405) 3 199 112
ofwhichequity/index-relatedproducts 1,398 111 (302) – – 610 (1,272) 42 577 1,164
ofwhichcreditderivatives 2,157 1,017 (728) – – 439 (1,934) 45 111 1,107
ofwhichotherderivativeproducts – 1 (1) – – 3 (1) – (2) –
Trading financial liabilities
at fair value through profit or loss 4,331 1,153 (1,070) – (2) 1,164 (3,846) 68 877 2,675
Short term borrowings 50 2 – – – 157 (104) – 14 119
Long term debt 3,092 181 (71) – – 249 (882) 3 (30) 2,542
ofwhichstructurednotes
betweenoneandtwoyears 139 16 (14) – – 31 (138) 5 27 66
ofwhichotherdebtinstruments
betweenoneandtwoyears – – – – – 6 – – – 6
ofwhichstructurednotes
overtwoyears 1,756 131 (57) – – 142 (482) (2) (25) 1,463
ofwhichotherdebtinstruments
overtwoyears 1,197 34 – – – 70 (262) – (32) 1,007
Other financial liabilities designated
at fair value through profit or loss 256 26 (18) 231 (34) – (182) – 35 314
ofwhichfailedsales 251 20 (15) 230 (29) – (182) – 36 311
ofwhichothers 5 6 (3) 1 (5) – – – (1) 3
Financial liabilities designated
at fair value through profit or loss 3,398 209 (89) 231 (34) 406 (1,168) 3 19 2,975
Derivatives – 39 (9) – – 12 (7) (2) (4) 29
ofwhichinterestrateproducts – 20 – – – – (3) – 1 18
ofwhichequity/index-relatedproducts – 5 (5) – – 9 – – (6) 3
ofwhichcreditderivatives – 14 (4) – – 3 (4) (2) 1 8
Trading financial liabilities
at fair value through profit or loss – 39 (9) – – 12 (7) (2) (4) 29
Liabilities held for sale – 39 (9) – – 12 (7) (2) (4) 29
Total liabilities at fair value 7,729 1,401 (1,168) 231 (36) 1,582 (5,021) 69 892 5,679
Net assets/liabilities at fair value 798 938 (1,354) 2,596 (3,122) 929 570 (52) (775) 528
1 For all transfers to Level 3 or out of Level 3, the CSi group determines and discloses as Level 3 events only gains or losses through the last day of the reporting period.

102
Assets and liabilities measured at fair value on a recurring basis for Level 3
Trading
revenues
Balance as On Balance as at at 1 January Transfers Transfers transfers On all 31 December Bank 2016 in out Purchases Sales Issuances Settlements in/out 1 other 2016
Assets at fair value (USD million)
Debt securities 1,561 472 (530) 1,422 (1,526) – – 6 84 1,489
ofwhichforeigngovernments 110 51 (49) 40 (107) – – 3 (3) 45
ofwhichcorporates 1,419 390 (481) 1,382 (1,419) – – 3 95 1,389
ofwhichcommercialmortgage
backedsecurities 32 – – – – – – – (6) 26
ofwhichResidential
Mortgage-BackedSecurities – 31 – – – – – – (2) 29
Equity securities 94 31 (33) 29 (75) – – (2) (20) 24
Derivatives 4,399 1,204 (981) – – 1,825 (3,400) 12 (360) 2,699
ofwhichinterestrateproducts 914 44 (84) – – 458 (549) (20) (269) 494
ofwhichforeignexchangeproducts 347 1 (14) – – 15 (87) (2) 83 343
ofwhichequity/index-relatedproducts 1,303 138 (210) – – 809 (972) 22 (121) 969
ofwhichcreditderivatives 1,835 1,021 (673) – – 542 (1,791) 12 (53) 893
ofwhichotherderivativeproducts – – – – – 1 (1) – – –
Other 1,186 400 (713) 973 (1,241) 161 (302) 2 53 519
Trading financial assets
at fair value through profit or loss 7,240 2,107 (2,257) 2,424 (2,842) 1,986 (3,702) 18 (243) 4,731
Loans 1,604 – (225) 214 (283) 127 (738) 1 (13) 687
ofwhichcommercial
andindustrialloans 651 – (225) 191 (27) 61 (482) 4 (15) 158
ofwhichloanstofinancialinstitutions 850 – – 23 (256) 66 (187) (3) – 493
ofwhichgovernment
andpublicinstitutions 53 – – – – – (18) – 1 36
ofwhichrealestate 50 – – – – – (51) – 1 –
Other financial assets designated
at fair value through profit or loss 77 2 (1) 82 (14) – – 1 (21) 126
ofwhichfailedpurchases 52 – – 82 (10) – – – (22) 102
ofwhichother 25 2 (1) – (4) – – 1 1 24
Financial assets designated
at fair value through profit or loss 1,681 2 (226) 296 (297) 127 (738) 2 (34) 813
Debt securities – 3 (1) 107 (20) – – – (27) 62
ofwhichcorporates – 3 (1) 107 (20) – – – (27) 62
Derivatives – 45 (38) – – 361 (116) (2) 325 575
ofwhichinterestrateproducts – 31 – – – 1 (1) – 52 83
ofwhichequity/index-relatedproducts – 5 (11) – – 359 (109) 2 229 475
ofwhichcreditderivatives – 9 (27) – – 1 (6) (4) 44 17
Trading financial assets
at fair value through profit or loss – 48 (39) 107 (20) 361 (116) (2) 298 637
Loans – 182 – – – 38 (3) – 95 312
ofwhichloanstofinancialinstitutions – 182 – – – 38 (3) – 95 312
Assets held for sale – 230 (39) 107 (20) 399 (119) (2) 393 949
Total assets at fair value 8,921 2,339 (2,522) 2,827 (3,159) 2,512 (4,559) 18 116 6,493
1 For all transfers to Level 3 or out of Level 3, the CSi group determines and discloses as Level 3 events only gains or losses through the last day of the reporting period.

103Credit Suisse International, Annual Report 2016
Notes to the Financial Statements for the year ended 31 December 2016
Assets and liabilities measured at fair value on a recurring basis for Level 3
Trading
revenues
Balance as On Balance as at at 1 January Transfers Transfers transfers On all 31 December Bank 2016 in out Purchases Sales Issuances Settlements in/out 1 other 2016
Liabilities at fair value (USD million)
Debt securities 2 – – – (2) – – – – –
ofwhichcorporates 2 – – – (2) – – – – –
Derivatives 4,329 1,153 (1,070) – – 1,164 (3,846) 68 877 2,675
ofwhichinterestrateproducts 461 22 (33) – – 106 (234) (22) (8) 292
ofwhichforeignexchangeproducts 313 2 (6) – – 6 (405) 3 199 112
ofwhichequity/index-relatedproducts 1,398 111 (302) – – 610 (1,272) 42 577 1,164
ofwhichcreditderivatives 2,157 1,017 (728) – – 439 (1,934) 45 111 1,107
ofwhichotherderivativeproducts – 1 (1) – – 3 (1) – (2) –
Trading financial liabilities
at fair value through profit or loss 4,331 1,153 (1,070) – (2) 1,164 (3,846) 68 877 2,675
Short term borrowings 50 2 – – – 156 (103) – 14 119
Long term debt 3,092 181 (71) – – 246 (879) 3 (30) 2,542
ofwhichstructurednotes
betweenoneandtwoyears 139 16 (14) – – 30 (137) 5 27 66
ofwhichotherdebtinstruments
betweenoneandtwoyears – – – – – 6 – – – 6
ofwhichstructurednotes
overtwoyears 1,756 131 (57) – – 141 (481) (2) (25) 1,463
ofwhichotherdebtinstruments
overtwoyears 1,197 34 – – – 69 (261) – (32) 1,007
Other financial liabilities designated
at fair value through profit or loss 256 26 (18) 231 (34) – (182) – 35 314
ofwhichfailedsales 251 20 (15) 230 (29) – (182) – 36 311
ofwhichothers 5 6 (3) 1 (5) – – – (1) 3
Financial liabilities designated
at fair value through profit or loss 3,398 209 (89) 231 (34) 402 (1,164) 3 19 2,975
Derivatives – 39 (9) – – 12 (7) (2) (4) 29
ofwhichinterestrateproducts – 20 – – – – (3) – 1 18
ofwhichequity/index-relatedproducts – 5 (5) – – 9 – – (6) 3
ofwhichcreditderivatives – 14 (4) – – 3 (4) (2) 1 8
Trading financial liabilities
at fair value through profit or loss – 39 (9) – – 12 (7) (2) (4) 29
Liabilities held for sale – 39 (9) – – 12 (7) (2) (4) 29
Total liabilities at fair value 7,729 1,401 (1,168) 231 (36) 1,578 (5,017) 69 892 5,679
Net assets/liabilities at fair value 1,192 938 (1,354) 2,596 (3,123) 934 458 (51) (776) 814
1 For all transfers to Level 3 or out of Level 3, the CSi group determines and discloses as Level 3 events only gains or losses through the last day of the reporting period.

104
Assets and liabilities measured at fair value on a recurring basis for Level 3
Trading
revenues
Balance as On Balance as at at 1 January Transfers Transfers transfers On all 31 December Group 2015 in out Purchases Sales Issuances Settlements in/out 1 other 2015
Assets at fair value (USD million)
Debt securities 1,067 576 (234) 1,154 (1,115) – – (15) 128 1,561
ofwhichforeigngovernments 178 70 (5) 4 (109) – – – (28) 110
ofwhichcorporates 811 506 (229) 1,150 (966) – – (15) 162 1,419
ofwhichcommercialmortgage
backedsecurities 78 – – – (40) – – – (6) 32
Equity securities 94 – – 180 (78) – – – (102) 94
Derivatives 6,211 2,052 (1,483) – – 4,056 (3,604) (3) (2,830) 4,399
ofwhichinterestrateproducts 1,662 169 (565) – – 480 (549) (14) (269) 914
ofwhichforeignexchangeproducts 283 6 (31) – – 12 (241) 11 307 347
ofwhichequity/index-relatedproducts 1,329 85 (159) – – 3,127 (910) 24 (2,193) 1,303
ofwhichcreditderivatives 2,936 1,792 (727) – – 437 (1,903) (24) (676) 1,835
ofwhichotherderivativeproducts 1 – (1) – – – (1) – 1 –
Other 1,273 980 (829) 825 (913) - (155) (15) 36 1,202
Trading financial assets
at fair value through profit or loss 8,645 3,608 (2,546) 2,159 (2,106) 4,056 (3,759) (33) (2,768) 7,256
Loans 2,754 175 (241) 1 (321) 446 (1,561) 1 (60) 1,194
ofwhichcommercial
andindustrialloans 1,193 87 – – (215) 267 (665) – (16) 651
ofwhichloanstofinancialinstitutions 788 88 (74) – (14) 179 (491) 1 (37) 440
ofwhichgovernment
andpublicinstitutions 562 – (167) – (92) – (243) – (7) 53
ofwhichrealestate 211 – – 1 – – (162) – – 50
Other financial assets designated
at fair value through profit or loss 226 – (14) 6 (106) – – 4 (39) 77
ofwhichfailedpurchases 174 – 5 (78) – – (49) 52
ofwhichother 52 – (14) 1 (28) – – 4 10 25
Financial assets designated
at fair value through profit or loss 2,980 175 (255) 7 (427) 446 (1,561) 5 (99) 1,271
Total assets at fair value 11,625 3,783 (2,801) 2,166 (2,533) 4,502 (5,320) (28) (2,867) 8,527
1 For all transfers to Level 3 or out of Level 3, the CSi group determines and discloses as Level 3 events only gains or losses through the last day of the reporting period.

105Credit Suisse International, Annual Report 2016
Notes to the Financial Statements for the year ended 31 December 2016
Assets and liabilities measured at fair value on a recurring basis for Level 3
Trading
revenues
Balance as On Balance as at at 1 January Transfers Transfers transfers On all 31 December Group 2015 in out Purchases Sales Issuances Settlements in/out 1 other 2015
Liabilities at fair value (USD million)
Debt securities 111 – – 2 (111) – – – – 2
ofwhichcorporates – – – 2 – – – – – 2
ofwhichforeigngovernments 111 – – – (111) – – – – –
Derivatives 6,225 2,416 (1,737) – – 1,162 (3,806) (22) 91 4,329
ofwhichinterestrateproducts 938 127 (360) – – 124 (286) 12 (94) 461
ofwhichforeignexchangeproducts 544 2 (21) – – 4 (88) 2 (130) 313
ofwhichequity/index-relatedproducts 1,531 249 (629) – – 684 (1,244) 21 786 1,398
ofwhichcreditderivatives 3,208 2,037 (723) – – 350 (2,180) (58) (477) 2,157
ofwhichotherderivativeproducts 4 1 (4) – – – (8) 1 6 –
Trading financial liabilities
at fair value through profit or loss 6,336 2,416 (1,737) 2 (111) 1,162 (3,806) (22) 91 4,331
Short term borrowings 80 30 (16) – 266 (299) (1) (10) 50
Long term debt 4,769 65 (255) – – 631 (2,029) (9) (80) 3,092
ofwhichstructurednotes
betweenoneandtwoyears 107 44 (85) – 151 (71) (4) (3) 139
ofwhichotherdebtinstruments
betweenoneandtwoyears 49 – – – – – (51) – 2 –
ofwhichstructurednotes
overtwoyears 2,838 – (100) – – 302 (1,017) (3) (264) 1,756
ofwhichotherdebtinstruments
overtwoyears 1,767 21 (63) – – 178 (890) (1) 185 1,197
ofwhichnon-recourseliabilities 8 – (7) – – – – (1) – –
Other financial liabilities designated
at fair value through profit or loss 224 18 (5) 30 (6) – – 2 (7) 256
ofwhichfailedsales 214 14 (4) 30 2 – – 2 (7) 251
ofwhichother 10 4 (1) – (8) – – – – 5
Financial liabilities designated
at fair value through profit or loss 5,073 113 (276) 30 (6) 897 (2,328) (8) (97) 3,398
Total liabilities at fair value 11,409 2,529 (2,013) 32 (117) 2,059 (6,134) (30) (6) 7,729
Net assets/liabilities at fair value 216 1,254 (788) 2,134 (2,416) 2,443 814 2 (2,861) 798
1 For all transfers to Level 3 or out of Level 3, the CSi group determines and discloses as Level 3 events only gains or losses through the last day of the reporting period.

106
Assets and liabilities measured at fair value on a recurring basis for Level 3
Trading
revenues
Balance as On Balance as at at 1 January Transfers Transfers transfers On all 31 December Bank 2015 in out Purchases Sales Issuances Settlements in/out 1 other 2015
Assets at fair value (USD million)
Debt securities 1,067 576 (234) 1,154 (1,115) – – (15) 128 1,561
ofwhichforeigngovernments 178 70 (5) 4 (109) – – – (28) 110
ofwhichcorporates 811 506 (229) 1,150 (966) – – (15) 162 1,419
ofwhichcommercialmortgage
backedsecurities 78 – – – (40) – – – (6) 32
Equity securities 94 – – 180 (78) – – – (102) 94
Derivatives 6,211 2,052 (1,483) – – 4,056 (3,604) (3) (2,830) 4,399
ofwhichinterestrateproducts 1,662 169 (566) – – 480 (549) (14) (268) 914
ofwhichforeignexchangeproducts 283 6 (32) – – 12 (240) 11 307 347
ofwhichequity/index-relatedproducts 1,329 85 (158) – – 3,127 (910) 24 (2,194) 1,303
ofwhichcreditderivatives 2,936 1,792 (726) – – 437 (1,904) (24) (676) 1,835
ofwhichotherderivativeproducts 1 – (1) – – – (1) – 1 –
Other 1,248 2 980 (829) 809 (888) 2 – (155) (15) 36 1,186 2
Trading financial assets
at fair value through profit or loss 8,620 3,608 (2,546) 2,143 (2,081) 2 4,056 (3,759) (33) (2,768) 7,240 2
Loans 3,231 2 175 (241) 1 (388) 2 446 (1,561) 1 (60) 1,604 2
ofwhichcommercial
andindustrialloans 1,193 87 – – (215) 267 (665) – (16) 651
ofwhichloanstofinancialinstitutions 1,265 88 (74) – (81) 2 179 (491) 1 (37) 850 2
ofwhichgovernment
andpublicinstitutions 562 – (167) – (92) – (243) – (7) 53
ofwhichrealestate 211 – – 1 – – (162) – – 50
Other financial assets designated
at fair value through profit or loss 226 – (14) 6 (106) – – 4 (39) 77
ofwhichfailedpurchases 174 – – 5 (78) – – (49) 52
ofwhichother 52 – (14) 1 (28) – – 4 10 25
Financial assets designated
at fair value through profit or loss 3,457 2 175 (255) 7 (494) 2 446 (1,561) 5 (99) 1,681 2
Total assets at fair value 12,077 2 3,783 (2,801) 2,150 (2,575) 2 4,502 (5,320) (28) (2,867) 8,921 2
1 For all transfers to Level 3 or out of Level 3, the CSi group determines and discloses as Level 3 events only gains or losses through the last day of the reporting period. 2 2015 numbers have been restated to conform to the current year’s presentation.

107Credit Suisse International, Annual Report 2016
Notes to the Financial Statements for the year ended 31 December 2016
Assets and liabilities measured at fair value on a recurring basis for Level 3
Trading
revenues
Balance as On Balance as at at 1 January Transfers Transfers transfers On all 31 December Bank 2015 in out Purchases Sales Issuances Settlements in/out 1 other 2015
Liabilities at fair value (USD million)
Debt securities 111 – – 2 (111) – – – – 2
ofwhichcorporates – – – 2 – – – – – 2
ofwhichforeigngovernments 111 – – – (111) – – – – –
Derivatives 6,225 2,416 (1,737) – – 1,162 (3,806) (22) 91 4,329
ofwhichinterestrateproducts 938 127 (360) – – 124 (286) 12 (94) 461
ofwhichforeignexchangeproducts 544 2 (21) – – 4 (88) 2 (130) 313
ofwhichequity/index-relatedproducts 1,531 249 (629) – – 684 (1,244) 21 786 1,398
ofwhichcreditderivatives 3,208 2,037 (723) – – 350 (2,180) (58) (477) 2,157
ofwhichotherderivativeproducts 4 1 (4) – – – (8) 1 6 –
Trading financial liabilities
at fair value through profit or loss 6,336 2,416 (1,737) 2 (111) 1,162 (3,806) (22) 91 4,331
Short term borrowings 80 30 (16) – 266 (299) (1) (10) 50
Long term debt 4,761 65 (248) – – 631 (2,029) (8) (80) 3,092
ofwhichstructurednotes
betweenoneandtwoyears 107 44 (85) – – 151 (71) (4) (3) 139
ofwhichotherdebtinstruments
betweenoneandtwoyears 49 – – – – – (51) – 2 –
ofwhichstructurednotes
overtwoyears 2,838 – (100) – – 302 (1,017) (3) (264) 1,756
ofwhichotherdebtinstruments
overtwoyears 1,767 21 (63) – – 178 (890) (1) 185 1,197
Other financial liabilities designated
at fair value through profit or loss 224 18 (5) 30 (6) – – 2 (7) 256
ofwhichfailedsales 214 14 (4) 30 2 – – 2 (7) 251
ofwhichothers 10 4 (1) – (8) – – – – 5
Financial liabilities designated
at fair value through profit or loss 5,065 113 (269) 30 (6) 897 (2,328) (7) (97) 3,398
Total liabilities at fair value 11,401 2,529 (2,006) 32 (117) 2,059 (6,134) (29) (6) 7,729
Net assets/liabilities at fair value 676 2 1,254 (795) 2,118 (2,458) 2 2,443 814 1 (2,861) 1,192
1 For all transfers to Level 3 or out of Level 3, the CSi group determines and discloses as Level 3 events only gains or losses through the last day of the reporting period. 2 2015 numbers have been restated to conform to the current year’s presentation.
Gains and losses on assets and liabilities measured at fair value on a recurring basis using significant unobservable inputs (Level 3)
Group and Bank 2016 2015
Trading revenues (USD million)
Net realised/unrealised (losses)/gains included in net revenues (827) 1 (2,859) 1
Whereof:
Trading financial assets at fair value through profit or loss 370 536
Financial assets designated at fair value through profit or loss (8) (3)
Assets held for sale 234 –
Trading financial liabilities at fair value through profit or loss (642) (478)
Financial liabilities designated at fair value through profit or loss (236) 11
Liabilities held for sale (8) –
Total changes in unrealised gains/(losses) relating to assets and liabilities still held as of the reporting date (290) 66
1 Bank Loss of USD 827 million (2015 : Loss of USD 2,860 million)

108
Both observable and unobservable inputs may be used to deter-mine the fair valueofpositions thathavebeenclassifiedwithinLevel 3. As a result, the unrealised gains and losses from assets and liabilities within Level 3 presented in the table above may include changes in fair value that were attributable to both observ-able and unobservable inputs.
The CSi group employs various economic hedging techniques in order to manage risks, including risks in Level 3 positions. Such techniquesmay include thepurchaseorsaleoffinancial instru-ments thatareclassified inLevels1and/or2.The realisedandunrealised gains and losses for assets and liabilities in Level 3 pre-sented in the tableabovedonot reflect the related realisedorunrealised gains and losses arising on economic hedging instru-mentsclassifiedinLevels1and/or2.
Transfers in and out of Level 3Trading financial assets at fair value through profit or lossTradingfinancialassets transferred intoandoutofLevel3asat31 December 2016 amounted to USD 2,107 million and USD (2,257) million, respectively for both CSi group and Bank. USD 1,421 million of transfers into Level 3 related to credit derivatives and others. Transfers out of Level 3 largely comprised of credit, equity and interest rate derivatives and loans. Transfers in and out of Level 3, is due to reduced or improved observability of pricing data.
TradingfinancialassetstransferredintoandoutofLevel3in2015 amounted to USD 3,608 million and USD (2,546) million, respectively for both CSi group and Bank. USD 2,772 million of transfers into Level 3 related to credit derivatives and loans. Trans-fers out of Level 3 largely comprised of credit, equity and interest rate derivatives and loans.
Assets held for sale transferred into and out of level 3 in 2016 amounted to USD 48 million and USD (39) million, respectively for both Group and Bank. USD 31 million of assets held for sale transfers into level 3 was related to interest rate derivatives. Trans-fers out of Level 3 largely comprised of equity and credit deriva-tives. Transfers in and out of Level 3 is due to reduced or improved observability of pricing data.
Financial assets designated at fair value through profit or lossFinancial assets designated at fair value throughprofit or losstransferred into and out of Level 3 in 2016 amounted to USD 2 million and USD (226) million respectively, for both CSi group and Bank. Both transfers into and out of Level 3 were loan related.
Financialassetsdesignatedatfairvaluethroughprofitorlosstransferred into and out of Level 3 in 2015 amounted to USD 175 million and USD (255) million, respectively for both CSi group and Bank. Transfers into Level 3 were loan related. Transfers out of Level 3 were in relation to both failed purchases and securities purchased under resale agreements and securities borrowing transactions.
Assets held for sale transferred into Level 3 in 2016 amounted to USD 182 million related to loans, for both CSi group and Bank.
Trading financial liabilities at fair value through profit or lossTradingfinancialliabilitiestransferredintoandoutofLevel3asat31 December 2016 amounted to USD 1,153 million and USD (1,070) million, respectively for both CSi group and Bank. USD 1,017 million of transfers into Level 3 were related to credit deriva-tives. Transfers out of Level 3 largely comprised of equity/index related derivatives and credit derivatives.
TradingfinancialliabilitiestransferredintoandoutofLevel3in2015 amounted to USD 2,416 million and USD (1,737) million, respectively for both CSi group and Bank. USD 2,037 million of transfers into Level 3 were related to credit derivatives. Transfers out of Level 3 largely comprised of equity/index related derivatives and credit derivatives.
For CSI group, Liabilities held for sale transferred into and out of Level 3 in 2016 amounted to USD 39 million and USD (9) mil-lion. For CSI Bank, Liabilities held for sale transferred into and out of Level 3 in 2016 amounted to USD 39 million and USD (9) mil-lion. Transfers into Level 3 were in relation to both interest rate and credit derivatives. Transfers out of Level 3 were largely related to credit derivatives.
Financial liabilities designated at fair value through profit or lossFinancial liabilitiesdesignatedat fair value throughprofitor losstransferred into and out of Level 3 as at 31 December 2016 amounted to USD 209 million and USD (89) million, respectively for both CSi group and Bank. Transfers into Level 3 were in rela-tion to both structured notes and failed sales. Transfers out of Level 3 were largely related to structured notes.
For CSi group, financial liabilities designated at fair valuethroughprofit or loss transferred intoandout ofLevel3asat31 December 2015 amounted to USD 113 million and USD (276) million,respectively.ForBank,financialliabilitiesdesignatedatfairvaluethroughprofitorlosstransferredintoandoutofLevel3asat31 December 2015 amounted to USD 113 million and USD (269) million respectively. Transfers into Level 3 were in relation to both structured notes and failed sales. Transfers out of Level 3 were largely related to structured notes.
Qualitative disclosures of valuation techniquesThe CSi group has implemented and maintains a valuation control framework, which is supported by policies and procedures that definetheprinciplesforcontrollingthevaluationoftheCSigroup’sfinancialinstruments.ProductControlandRiskManagementcre-ate, reviewandapprovesignificant valuationpoliciesandproce-dures. The framework includes three main internal processes: (i) valuationgovernance;(ii)independentpriceverificationandsignifi-cant unobservable inputs review; and (iii) a cross-functional pricing model review. Through this framework, the CSi group determines thereasonablenessofthefairvalueofitsfinancialinstruments.
On a monthly basis, meetings are held for each business line withseniorrepresentativesoftheFrontOfficeandProductControltodiscussindependentpriceverificationresults,valuationadjust-ments,andothersignificantvaluationissues.Onaquarterlybasis,areviewofsignificantchangesinthefairvalueoffinancialinstru-ments is undertaken by Product Control and conclusions are reached regarding the reasonableness of those changes.

109Credit Suisse International, Annual Report 2016
Notes to the Financial Statements for the year ended 31 December 2016
Additionally, on a quarterly basis, meetings are held for each busi-nesslinewithseniorrepresentativesoftheFrontOffice,ProductControl, Risk Management, and Group Finance to discuss inde-pendentpriceverification results, valuation issues,businessandmarketupdates,aswellasareviewofsignificantchangesinfairvalue from thepriorquarter, significantunobservable inputsandprices used in valuation techniques, and valuation adjustments.
The results of these meetings are aggregated for presentation to the Valuation and Risk Management Committee (‘VARMC’) and the Audit Committee. The VARMC, which is comprised of CSG Executive Board members and the heads of the business and con-trol functions, meets to review and ratify valuation review conclu-sions,andtoresolvesignificantvaluationissuesfortheCSigroup.VARMC includes a formal CSi voting sub-committee comprising the CSi CEO, CFO and CRO, who ratify decisions relevant to the entity. Oversight of the valuation control framework is through spe-cificandregularreportingonvaluationdirectlytotheCSGExecu-tive Board and CSi Board through the VARMC.
One of the key components of the governance process is the segregationofdutiesbetweentheFrontOfficeandProductCon-trol.TheFrontOfficeisresponsibleformeasuringinventoryatfairvalue on a daily basis, while Product Control is responsible for independently reviewing and validating those valuations on a peri-odicbasis.TheFrontOfficevaluestheinventoryusing,whereverpossible, observable market data which may include executed transactions, dealer quotes, or broker quotes for the same or sim-ilar instruments. Product Control validates this inventory using independently sourced data that also includes executed transac-tions, dealer quotes, and broker quotes.
Product Control utilises independent pricing service data as part of their review process. Independent pricing service data is analysed to ensure that it is representative of fair value including confirmingthatthedatacorrespondstoexecutedtransactionsorexecutable broker quotes, review and assessment of contributors to ensure they are active market participants, review of statistical data and utilisation of pricing challenges. The analysis also includes understanding the sources of the pricing service data and any models or assumptions used in determining the results. The purpose of the review is to judge the quality and reliability of the data for fair value measurement purposes and its appropriate level of usage within the Product Control independent valuation review.
Forcertainfinancialinstrumentsthefairvalueisestimatedinfull or in part using valuation techniques based on assumptions that are not supported by market observable prices, rates, or other inputs. In addition, there may be uncertainty about a valuation, which results from the choice of valuation technique or model used, the assumptions embedded in those models, the extent to which inputs are not market observable, or as a consequence of other elements affecting the valuation technique or model. Model calibration isperformedwhensignificantnewmarket informationbecomes available or at a minimum on a quarterly basis as part of thebusinessreviewofsignificantunobservable inputsfor level3instruments.Formodelsthathavebeendeemedtobesignificanttotheoverallfairvalueofthefinancialinstrument,modelvalidationis performed as part of the periodic review of the related model.
TheCSigroupperformsasensitivityanalysisofitssignificantlevel3financialinstruments.Thissensitivityanalysisestimatesa
fairvaluerangebychangingtherelatedsignificantunobservableinputs value. Where a model-based technique is used to deter-minethefairvalueofthelevel3financialinstrument,analternativeinput value is utilised to derive an estimated fair value range. Where a price-based technique is used to determine the fair value ofthelevel3financialinstrument,FrontOfficeprofessionaljudge-ment is used to estimate a fair value range.
The following information on the valuation techniques and sig-nificantunobservable inputsof thevariousfinancial instruments,and the sensitivity of fair value measurements to changes in signif-icant unobservable inputs, should be read in conjunction with the table “Quantitative disclosure of valuation techniques”.
Securities purchased/sold under resale/repurchase agreements and securities borrowing/lending transactions Securities purchased under resale agreements and securities sold under repurchase agreements are measured at fair value using discountedcashflowanalysis.Futurecashflowsarediscountedusing observable market interest rate repurchase/resale curves for the applicable maturity and underlying collateral of the instruments. As such, the significantmajority of both securities purchasedunder resale agreements and securities sold under repurchase agreements are included in Level 2 of the fair value hierarchy. Structured resale and repurchase agreements include embedded derivatives, which are measured using the same techniques as described below for stand-alone derivative contracts held for trad-ing purposes or used in hedge accounting relationships.
Securities purchased under resale agreements are usually fully collateralised or over collateralised by government securities, money market instruments, corporate bonds or other debt instru-ments. In the event of counterparty default, the collateral service agreement provides the CSi group with the right to liquidate the collateral held.
The CSi group enters into transactions involving securities bor-rowed and securities loaned transactions as part of the CSi group’s matched-bookactivitiestoaccommodateclients,financetheCSigroup’s trading inventory, obtain securities for settlement and earn interest spreads.
Debt securitiesForeign governments and corporatesGovernment debt securities typically have quoted prices in active markets and are categorised as level 1 instruments. For debt securities for which market prices are not available, valuations are basedon yields reflectingcredit rating,historical performance,delinquencies, loss severity, the maturity of the security, recent transactions in the market or other modeling techniques, which may involve judgement. Those securitieswhere the significantprice or model inputs are observable in the market are categorised as level 2 instruments, while those securities where prices are not observableandsignificantmodelinputsareunobservablearecat-egorised as level 3 of the fair value hierarchy.
Corporatebondsarepriced to reflect currentmarket levelseither through recent market transactions or broker or dealer quotes. Where a market price for the particular security is not directlyavailable,valuationsareobtainedbasedonyieldsreflectedby other instruments in the specific or similar entity’s capital

110
structure and adjusting for differences in seniority and maturity, benchmarking to a comparable security where market data is available (taking into consideration differences in credit, liquidity andmaturity), or through theapplicationof cashflowmodelingtechniques utilising observable inputs, such as current interest rate curvesandobservableCDSspreads. Significantunobservableinputs may include market comparable price, buyback probability, correlation, volatility and credit spread. For securities using market comparable price, the differentiation between level 2 and level 3 is basedupon the relativesignificanceofanyyieldadjustmentsaswell as the accuracy of the comparison characteristics (i.e. the observable comparable security may be in the same country but a different industry and may have a different seniority level – the lower the comparability the more likely the security will be level 3). Generally, the interrelationship between volatility and correlation is positively correlated.
CMBS securitiesFair values of CMBS may be available through quoted prices, which are often based on the prices at which similarly structured and collateralised securities trade between dealers and to and fromcustomers.FairvaluesofCMBSforwhichtherearesignifi-cant unobservable inputs are valued using capitalisation rate. Price may not be observable for fair value measurement purposes for many reasons, such as the length of time since the last exe-cuted transaction for the related security, use of a price from a similar instrument, or use of a price from an indicative quote. Prices from similar observable instruments are used to calculate implied inputs which are then used to value unobservable instru-mentsusingdiscountedcashflow.Thediscountedcashflowpriceis then compared to the unobservable prices and assessed for reasonableness.
Equity securitiesThe majority of the CSi group’s positions in equity securities are traded on public stock exchanges for which quoted prices are readily and regularly available and are therefore categorised as level 1 instruments. Level 2 and level 3 equities include fund-linked products, convertible bonds or equity securities with restric-tionsthatarenottradedinactivemarkets.Significantunobserv-able inputs may include earnings before interest, taxes, depreciation and amortisation, (‘EBITDA’) multiple, discount rate and capitalisation rate.
DerivativesDerivatives held for trading purposes or used in hedge accounting relationships include both OTC and exchange-traded derivatives. The fair values of exchange-traded derivatives measured using observable exchange prices are included in level 1 of the fair value hierarchy. For exchange-traded derivatives where the market is not considered active, the observable exchange prices may not be considered executable at the reporting date. These derivatives are valued in the same manner as similar observable OTC derivatives and are included in level 2 of the fair value hierarchy. If the similar OTC derivative used for valuing the exchange-traded derivative is not observable, then the exchange-traded derivative is included in level 3 of the fair value hierarchy.
The fair values of OTC derivatives are determined on the basis of either industry standard models or internally developed proprietary models. Both model types use various observable and unobservable inputs in order to determine fair value. The inputs include those char-acteristics of the derivative that have a bearing on the economics of the instrument. The determination of the fair value of many deriva-tives involves only a limited degree of subjectivity because the required inputs are observable in the market place, while more com-plex derivatives may use unobservable inputs that rely on specific proprietary modeling assumptions. Where observable inputs (prices from exchanges, dealers, brokers or market consensus data provid-ers) are not available, attempts are made to infer values from observ-able prices through model calibration (spot and forward rates, mean reversion, benchmark interest rate curves and volatility inputs for commonly traded option products). For inputs that cannot be derived from other sources, estimates from historical data may be made. OTC derivatives where the majority of the value is derived from mar-ket observable inputs are categorised as level 2 instruments, while those where the majority of the value is derived from unobservable inputs are categorised as level 3 of the fair value hierarchy.
CSi valuation of derivatives includes an adjustment for the cost of funding uncollateralised OTC derivatives.
Interest rate derivativesOTC vanilla interest rate products, such as interest rate swaps, swaptions, and caps and floors are valued by discounting theanticipatedfuturecashflows.Thefuturecashflowsanddiscount-ing are derived from market standard yield curves and industry standard volatility inputs. Where applicable, exchange-traded prices are also used to value exchange-traded futures and options and can be used in yield curve construction. For more complex products inputs include, but are not limited to, correlation, volatility skew, prepayment rate, credit spread, basis spread, recovery rate and mean reversion.
Foreign exchange derivativesForeign exchange derivatives include vanilla products such as spot, forward and option contracts where the anticipated discounted futurecashflowsaredeterminedfromforeignexchangeforwardcurves and industry standard optionality modeling techniques. Where applicable, exchange-traded prices are also used for futures and option prices. For more complex products inputs include, but are not limited to, prepayment rate, correlation, volatil-ity skew and credit spread and event probability.
Equity and index-related derivativesEquity derivatives include vanilla options and swaps in addition to different types of exotic options. Inputs for equity derivatives can include market comparable price, correlation, volatility, skew and buyback probability. Generally, volatility, forward skew, correlation and gap risk are positively correlated.
Credit derivativesCredit derivatives include index and single name CDSs in addition to more complex structured credit products. Vanilla products are valued using industry standard models and inputs that are gener-ally market observable including credit spread and recovery rate.

111Credit Suisse International, Annual Report 2016
Notes to the Financial Statements for the year ended 31 December 2016
Complex structured credit derivatives are valued using propri-etary models requiring unobservable inputs such as recovery rate, credit spread, correlation, funding spread, discount rate, default rate, market comparable price and prepayment rate. These inputs are generally implied from available market observable data. Fair valuesdeterminedbypricemayincludediscountedcashflowmod-els using the inputs default rate, loss severity and discount rate.
Other Trading AssetsOther trading assets primarily include loans and receivables which are valued using market comparable price and discounted cash flow.Thesignificantunobservableinputsofthetradingloansandreceivables are credit spread and price.
Other financial assets designated at fair value through profit or lossLoansThe CSi group’s loan portfolio which is measured at fair value pri-marily consists of commercial and industrial loans, loans to govern-ment and public institutions, and loans to financial institutions. These categories include commercial loans, real estate loans, corporate loans, leverage finance loans and emerging market loans. Fair value is based on recent transactions and quoted prices, where available. Where recent transactions and quoted prices are not available, fair value may be determined by relative value benchmarking (which includes pricing based upon another position in the same capital structure, other comparable loan issues, generic industry credit spreads, implied credit spreads derived from CDS for the specific borrower, and enterprise valuations) or calculated based on the exit price of the collateral, based on current market conditions.
Both the funded and unfunded portion of revolving credit lines on the corporate lending portfolio are valued using a CDS pricing model,which requires estimates of significant inputs includingcredit spreads, recovery rates, credit conversion factors, and weightedaveragelifeoftheloan.Significantunobservableinputsmay include credit spread and market comparable price and mor-tality rate.
Short-term borrowings and long-term debtThe CSi group’s short-term borrowings and long-term debt include structurednotes(hybridfinancial instrumentsthatarebothbifur-catable and non-bifurcatable), funded derivatives and vanilla debt. The fair value of structured notes is based on quoted prices, where available. When quoted prices are not available, fair value is deter-minedbyusingadiscountedcashflowmodel incorporating theCSi group’s credit spreads, the value of derivatives embedded in the debt and the residual term of the issuance based on call options. Derivatives structured into the issued debt are valued consistently with the CSi group’s stand-alone derivative contracts held for trading purposes or used in hedge accounting
relationships as discussed above. The fair value of structured debt isheavilyinfluencedbythecombinedcalloptionsandperformanceof the underlying derivative returns. Significant unobservableinputs for long-term debt and short-term borrowings include buy-back probability, gap risk, correlation, volatility, credit spread and market comparable price. Generally, volatility, credit curve, forward skew, correlation and gap risk are positively correlated.
Other financial liabilities designated at fair value through profit or lossFailed salesThese liabilities represent securitisations that do not meet the cri-teria for sale treatment under IFRS. Failed sales are valued in a manner consistent with the related underlying financialinstruments.
Short-termfinancialinstrumentsCertain short-term financial instruments are not carried at fairvalueon thestatementoffinancialposition,buta fair valuehasbeen disclosed in the table “Financial assets and liabilities by cate-gories”. These instruments include: cash and due from banks deposits, cash collateral receivables and payables and other receivables and payables arising in the ordinary course of busi-ness.Forthesefinancialinstruments,thecarryingvalueapproxi-mates the fair value due to the relatively short period of time between their origination and expected realisation, as well as the minimal credit risk inherent in these instruments.
Sensitivityoffairvaluemeasurementstochangesinsignificantunobservable inputsForlevel3assetswithasignificantunobservableinputofbuybackprobability, contingent probability, correlation, price, volatility, mean reversion, mortality and discount rate in general, an increase in the significantunobservable inputwould increasethefairvalue.Forlevel3assetswithasignificantunobservableinputofcapitalisationrate, prepayment rate, recovery rate and credit spread, in general, anincreaseinthesignificantunobservableinputwoulddecreasethe fair value.
For level 3 liabilities, in general, an increase in the related sig-nificantunobservableinputswouldhavetheinverseimpactonfairvalue.Anincreaseinthesignificantunobservableinputgapriskwould increase the fair value.
InterrelationshipsbetweensignificantunobservableinputsExcept as noted above, there are no material interrelationships between the significant unobservable inputs for the financialinstruments. As thesignificantunobservable inputsmaymoveindependently,generallyanincreaseordecreaseinonesignificantunobservable inputmayhaveno impacton theothersignificantunobservable inputs.

112
Quantitative information about level 3 assets and liabilities at fair valueThe following tables provide the representative range of minimum and maximum values and the associated weighted average of each significantunobservableinputforlevel 3assetsandliabilitiesbytherelatedvaluationtechniquemostsignificanttotherelatedfinancialinstrument.
As at 31 December 2016 Valuation Unobservable Minimum Maximum Weighted
Group (USD million except as indicated) Fair Value technique input value value average
Assets at fair value
Debt securities 1,551
ofwhichcorporates 1,451
ofwhich 438 Option model Correlation in % (85) 98 23
90 Volatility in % 2 180 29
ofwhich 261 Discounted cash flow Credit spread in bp 9 1,004 443
ofwhich 645 Market comparable Price in % 0 117 99
ofwhichCMBS 26 Discounted cash flow Capitalisation rate in % 8 9 9
Derivatives 3,274
ofwhichinterestrateproducts 577
ofwhich 41 Option model Correlation in % 22 100 62
115 Mean reversion, in % (14) 5 (6)
329 Prepayment rate in % 1 32 16
ofwhichforeignexchangeproducts 343
ofwhich 112 Option model Correlation in % (13) 70 27
123 Prepayment rate in % 22 32 27
ofwhich 48 Discounted cash flow Credit spread in bp 11 2,341 210
44 Contingent probability, in % 64 95 79
ofwhichequity/index-relatedproducts 1,444
ofwhich 1,041 Option model Correlation in % (85) 98 35
299 Volatility in % 2 180 28
19 Buyback probability in % 50 100 62
ofwhichcreditderivatives 910
ofwhich 0 Discounted cash flow Correlation in % 97 97 98
276 Credit spread in bp 0 1,635 377
58 Recovery rate in % 0 45 23
510 Discount rate in % 1 45 21
0 Default rate in % 0 33 5
0 Loss severity in % 15 100 69
Other 526
ofwhichtradingloans 432
ofwhich 37 Discounted cash flow Credit spread in bp 50 212 69
ofwhich 395 Market comparable Price in % 0 103 95
Loans 706
ofwhichcommercialandindustrialloans 158
ofwhich 147 Discounted cash flow Credit spread in bp 169 975 321
ofwhichloanstofinanceinstitutions 512
ofwhich 135 Discounted cash flow Credit spread in bp 194 244 210
314 Option model Mortality in % – 70 6
ofwhichgovernmentandpublicinstitutions 36
ofwhich 36 Discounted cash flow Credit spread in bp 240 240 240

113Credit Suisse International, Annual Report 2016
Notes to the Financial Statements for the year ended 31 December 2016
As at 31 December 2016 Valuation Unobservable Minimum Maximum Weighted
Group (USD million except as indicated) Fair Value technique input value value average
Liabilities at fair value (USD million)
Derivatives 2,704
ofwhichinterestrateproducts 310
46 Correlation, in % 22 100 64
177 Prepayment rate, in % 1 32 9
9 Mean reversion, in % (10) 5 0
ofwhichforeignexchangeproducts 112
45 Prepayment rate, in % 22 32 27
ofwhich 4 Discounted cash flow Credit spread, in bp 393 1,016 590
44 Contingent probability in % 64 95 79
ofwhichequity/index-relatedproducts 1,167
ofwhich 350 Option model Correlation, in % (85) 98 23
446 Volatility, in % 2 180 27
303 Buyback probability in % 50 100 62
12 Gap risk in % 0 8 2
ofwhichcreditderivatives 1,115
ofwhich 0 Discounted cash flow Correlation, in % 97 97 97
400 Credit spread, in bp 0 1,635 159
58 Recovery rate, in % 0 60 31
510 Discount rate, in % 2 45 21
0 Default rate, in % 0 33 5
0 Loss severity, in % 15 100 70
Long term debt 2,542
ofwhichstructurednotesovertwoyears 1,463
ofwhich 249 Option model Correlation, in % (74) 99 33
72 Volatility, in % 2 180 21
134 Gap risk, in % 0 2 1
732 Buyback probability, in % 50 100 62
ofwhich 35 Discounted cash flow Credit spread, in bp 45 461 106
ofwhichotherdebtovertwoyears 1,007
ofwhich 740 Option model Correlation, in % (74) 98 41
147 Volatility, in % 2 180 26
36 Buyback probability, in % 50 100 62
25 Gap risk, in % 0 2 1
ofwhichstructurednotesbetweenoneandtwoyears 66
ofwhich 11 Option model Correlation, in % (74) 98 13
2 Volatility, in % 2 180 10
ofwhich 35 Discounted cash flow Credit spread, in bp 962 962 962
ofwhich 13 Market comparable Price, in % 99 99 99
Other Financial liabilities designated at fair value 314
ofwhichfailedsales 311
ofwhich 273 Market comparable Price in % – 109 57
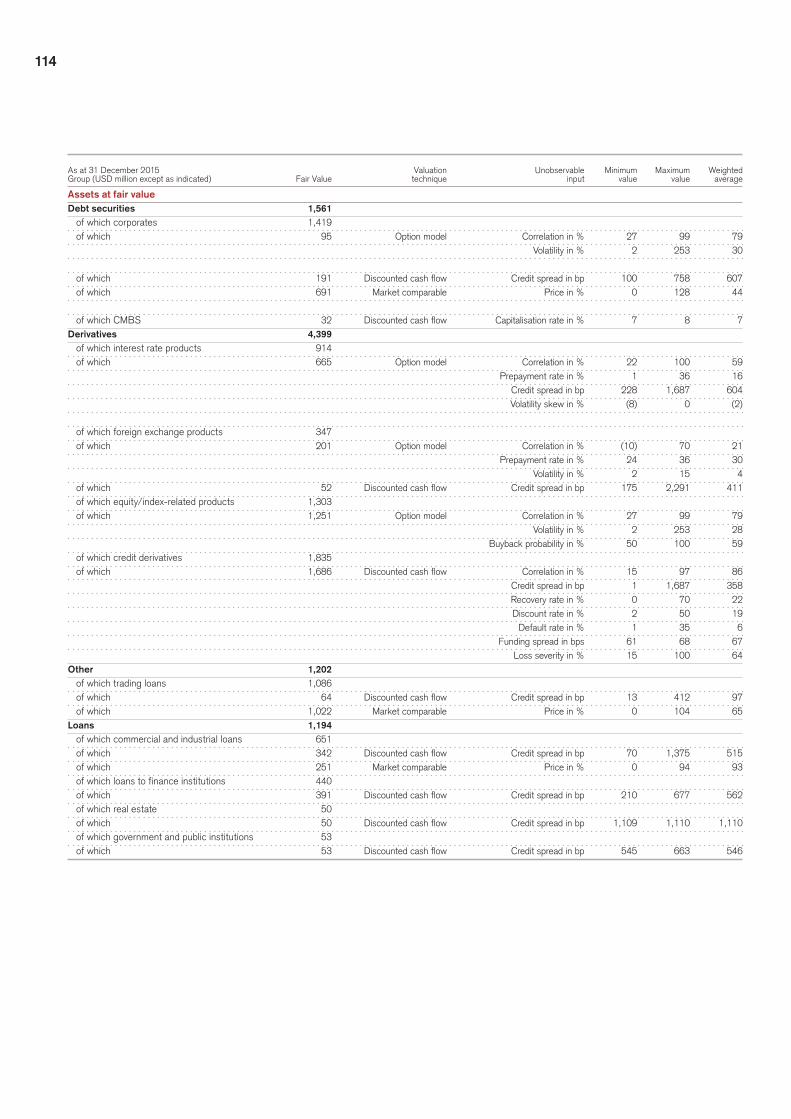
114
As at 31 December 2015 Valuation Unobservable Minimum Maximum Weighted
Group (USD million except as indicated) Fair Value technique input value value average
Assets at fair value
Debt securities 1,561
ofwhichcorporates 1,419
ofwhich 95 Option model Correlation in % 27 99 79
Volatility in % 2 253 30
ofwhich 191 Discounted cash flow Credit spread in bp 100 758 607
ofwhich 691 Market comparable Price in % 0 128 44
ofwhichCMBS 32 Discounted cash flow Capitalisation rate in % 7 8 7
Derivatives 4,399
ofwhichinterestrateproducts 914
ofwhich 665 Option model Correlation in % 22 100 59
Prepayment rate in % 1 36 16
Credit spread in bp 228 1,687 604
Volatility skew in % (8) 0 (2)
ofwhichforeignexchangeproducts 347
ofwhich 201 Option model Correlation in % (10) 70 21
Prepayment rate in % 24 36 30
Volatility in % 2 15 4
ofwhich 52 Discounted cash flow Credit spread in bp 175 2,291 411
ofwhichequity/index-relatedproducts 1,303
ofwhich 1,251 Option model Correlation in % 27 99 79
Volatility in % 2 253 28
Buyback probability in % 50 100 59
ofwhichcreditderivatives 1,835
ofwhich 1,686 Discounted cash flow Correlation in % 15 97 86
Credit spread in bp 1 1,687 358
Recovery rate in % 0 70 22
Discount rate in % 2 50 19
Default rate in % 1 35 6
Funding spread in bps 61 68 67
Loss severity in % 15 100 64
Other 1,202
ofwhichtradingloans 1,086
ofwhich 64 Discounted cash flow Credit spread in bp 13 412 97
ofwhich 1,022 Market comparable Price in % 0 104 65
Loans 1,194
ofwhichcommercialandindustrialloans 651
ofwhich 342 Discounted cash flow Credit spread in bp 70 1,375 515
ofwhich 251 Market comparable Price in % 0 94 93
ofwhichloanstofinanceinstitutions 440
ofwhich 391 Discounted cash flow Credit spread in bp 210 677 562
ofwhichrealestate 50
ofwhich 50 Discounted cash flow Credit spread in bp 1,109 1,110 1,110
ofwhichgovernmentandpublicinstitutions 53
ofwhich 53 Discounted cash flow Credit spread in bp 545 663 546

115Credit Suisse International, Annual Report 2016
Notes to the Financial Statements for the year ended 31 December 2016
As at 31 December 2015 Valuation Unobservable Minimum Maximum Weighted
Group (USD million except as indicated) Fair Value technique input value value average
Liabilities at fair value (USD million)
Derivatives 4,329
ofwhichinterestrateproducts 461
ofwhich 400 Option model Basis spread, in bp (7) 53 25
Correlation, in % 22 100 68
Prepayment rate, in % 0 36 9
Credit spread, in bp 130 2,349 324
Volatility skew in % 2 15 4
Mean reversion, in % 0 5 5
ofwhichforeignexchangeproducts 313
ofwhich 265 Option model Correlation, in % (10) 70 54
Prepayment rate, in % 24 36 30
ofwhich 1 Discounted cash flow Credit spread, in bp 397 1,467 411
ofwhichequity/index-relatedproducts 1,398
ofwhich 1,321 Option model Correlation, in % 27 99 79
Volatility, in % 2 253 28
Buyback probability in % 50 100 59
ofwhichcreditderivatives 2,157
ofwhich 1,661 Discounted cash flow Correlation, in % 85 97 96
Credit spread, in bp 1 1,687 362
Recovery rate, in % 0 75 23
Discount rate, in % 2 50 19
Funding spread in bps 51 68 68
Default rate, in % 1 33 5
Loss severity, in % 15 100 64
ofwhich 89 Market comparable Price, in % 13 100 100
Long term debt 3,092
ofwhichstructurednotesovertwoyears 1,756
ofwhich 1,473 Option model Correlation, in % 27 99 78
Volatility, in % 2 253 22
Gap risk, in % 0 3 1
Buyback probability, in % 50 100 59
ofwhich 12 Discounted cash flow Credit spread, in bp 1,109 1,110 1,110
ofwhichotherdebtovertwoyears 1,197
ofwhich 1,158 Option model Correlation, in % 27 99 78
Volatility, in % 2 253 6
Buyback probability, in % 50 100 59
Gap risk, in % 0 3 1
ofwhichstructurednotesbetweenoneandtwoyears 139
ofwhich 56 Option model Correlation, in % 27 99 79
Volatility, in % 2 253 30
ofwhich 64 Discounted cash flow Credit spread, in bp 106 320 242
ofwhich 19 Market comparable Price, in % 100 100 100
Other Fianncial liabilities designated at fair value 256
ofwhichfailedsales 251
ofwhich 245 Market comparable Price in % – 95 89

116
The ‘Quantitative informationaboutLevel 3assetsand liabilitiesat fair value’ tableapplies tobothCSigroupandBank,with theexception of the following adjusted line item in respect of Assets at fair value – Other (trading loan that is eliminated on consolidation from the Group table).
As at 31 December 2016 Valuation Unobservable Minimum Maximum Weighted
Bank Fair Value technique input value value average
Assets at fair value (USD million)
Other 526
ofwhichtradingloans 480
ofwhich 169 Discounted cash flow Capitalisation rate, in % 9 9 9
ofwhich 311 Market comparable Price, in % 0 103 100
As at 31 December 2015 Valuation Unobservable Minimum Maximum Weighted
Bank Fair Value technique input value value average
Assets at fair value (USD million)
Other 1,596
ofwhichtradingloans 898
ofwhich 306 Discounted cash flow Capitalisation rate, in % 9 9 9
ofwhich 592 Market comparable Price, in % 0 100 86
Qualitative discussion of the ranges of significant unobservable inputsThe following sections provide further information about the ranges of significantunobservable inputs included in the tablesabove.The levelofaggregationanddiversitywithin thefinancial instru-ments disclosed in the tables above result in certain ranges of significantinputsbeingwideandunevenlydistributedacrossassetand liability categories.
Discount rateThe discount rate is the rate of interest used to calculate the pres-ent valueof theexpectedcashflowsofa financial instrument.There are multiple factors that will impact the discount rate for any givenfinancialinstrumentincludingthecouponontheinstrument,thetermandtheunderlyingriskoftheexpectedcashflows.Twoinstrumentsofsimilartermandexpectedcashflowsmayhavesig-nificantly different discount ratesbecause the couponson theinstruments are different.
Default rate and loss severityForfinancialinstrumentsbackedbyresidentialrealestateorotherassets,diversityintheportfolioisreflectedinawiderangeforlossseverity due to varying levels of default. The lower end of the range represents high performing or government guaranteed col-lateral with a low probability of default or guaranteed timely pay-ment of principal and interest while the higher end of the range relates to collateral with a greater risk of default.
Credit spread and recovery rateFor financial instrumentswhere credit spread is the significantunobservable input, the wide range represents positions with vary-ing levels of risk. The lower end of the credit spread range typi-cally represents shorter-dated instruments and/or those with bet-ter perceived credit risk. The higher end of the range typically compriseslonger-datedfinancialinstrumentsorthosereferencingnon-performing, distressed or impaired reference credits.
Similarly, the spread between the reference credit and an index canvarysignificantlybasedon the riskof the instrument. Thespread will be positive for instruments that have a higher risk of default than the index (which is based on a weighted average of its components) and negative for instruments that have a lower risk of default than the index.
Similarly,recoveryratescanvarysignificantlydependinguponthespecificassetsand termsofeach transaction. Transactionswith higher seniority or more valuable collateral will have higher recovery rates while those transactions which are more subordi-nated or with less valuable collateral will have lower recovery rates.
CorrelationThere are many different types of correlation inputs, including credit correlation, cross-asset correlation (such as equity-interest rate correlation), and same-asset correlation (such as interest rate-interest rate correlation). Correlation inputs are generally used to value hybrid and exotic instruments. Due to the complex and unique nature of these instruments, the ranges for correlation inputs can vary widely across portfolios.
Prepayment ratePrepayment rates may vary between collateral pools, and are drivenbyavarietyofcollateral-specificfactors,includingthetypeand location of the underlying borrower, the remaining tenor of the obligationandthelevelandtype(e.g.,fixedorfloating)ofinterestrate being paid by the borrower.
Volatility and volatility skewVolatility and its skew are impacted by the underlying risk, term and strike price of the derivative. In the case of interest rate derivatives, volatility may vary significantly between differentunderlying currencies and expiration dates on the options. Simi-larly, in the case of equity derivatives’ the volatility attributed to a structure may vary greatly depending upon the underlying refer-ence name.

117Credit Suisse International, Annual Report 2016
Notes to the Financial Statements for the year ended 31 December 2016
PriceBondequivalentprice isaprimarysignificantunobservable inputfor bonds and loans. Where market prices are not available for an instrument, benchmarking may be utilised to identify comparable issues (same industry and similar product mixes) while adjustments are considered for differences in deal terms and performance.
Buyback probabilityBuyback probability is the probability assigned to structured notes being unwound prior to their legal maturity.
Gap RiskGap risk is theprimary significant unobservable input for fundlinked Constant Proportion Portfolio Insurance (‘CPPI’) products and structures where the payoff may be sensitive to “discontinuity” in the hedging portfolio.
Mean ReversionMean reversion is theprimarysignificantunobservable input forcallable Constant Maturity Swap (‘CMS’) spread exotics and rep-resents the idea that prices and returns eventually move back towards the historical average.
Funding SpreadFundingspread is theprimarysignificantunobservable input forSPV funding facilities. Synthetic funding curves which represent the assets pledged as collateral are used to value structured financingtransactions.Thecurvesprovideanestimateofwheresecured funding can be sourced and are expressed as a basis point spread in relation to the referenced benchmark rate.
Basis SpreadBasis spread is the primary significant unobservable input fornon-callable constant maturity treasury-CMS products and is used to determine interest rate risk as a result of differing lending and borrowing rates.
Capitalisation RateCapitalisationrateistheprimarysignificantunobservableinputforCMBS loans and is used to estimate the potential return on invest-ment. This is done by dividing the yearly income by the total value of the property.
Contingent ProbabilityContingentprobabilityistheprimarysignificantunobservableinputfor contingent foreign exchange forward trades where the delivery or exercise and the premium payment are contingent on an event such as completion of an M&A deal or regulatory approval for a product.
Mortality RateMortalityrateistheprimarysignificantunobservableinputforvari-able annuities-backed loans with early termination clause based on mortality or lapse of the policy holders.
Sensitivity of fair values to reasonably possible alternative assumptionsThe fair valueofcertainfinancial instruments recognised in theconsolidatedfinancialstatementsisdependentinpartorfullyuponunobservable parameters which may include market inputs, prices or other data.
Thefollowingtablesummarisesthesensitivityofthesefinancialinstrumentstoreasonablechangesintheassumptionsunderlyingtheseparameters:
Group As at 31 December 2016 As at 31 December 2015
Favourable Unfavourable Favourable Unfavourable changes changes changes changes
Impact on net income/(loss) (USD million)
Derivative assets and liabilities 238 (265) 262 (305)
Assets-backed securities, loans and derivatives 18 (19) 21 (20)
Debt and equity securities 41 (14) 117 (40)
Loans 22 (21) 42 (46)
Total 319 (319) 442 (411)
Bank As at 31 December 2016 As at 31 December 2015
Favourable Unfavourable Favourable Unfavourable changes changes changes changes
Impact on net income/(loss) (USD million)
Derivative assets and liabilities 238 (265) 262 (305)
Assets-backed securities, loans and derivatives 18 (19) 21 (20)
Debt and equity securities 41 (14) 117 (40)
Loans 30 (29) 57 (61)
Total 327 (327) 457 (426)

118
When the fair value of an instrument has multiple unobservable inputs, there is assumed to be no correlation between those inputs,assuchthetotalsensitivity reflected in thetablemaybelarger than if correlation had been included in the analysis. The analysis also ignores any correlation between the different catego-riesoffinancialinstrumentslistedinthetable.
Derivative assets and liabilities include primarily equity, for-eign exchange, credit and interest rate derivatives. The primary parameters subjected to sensitivity analysis included correlations, volatilities and credit spreads. Correlation sensitivities for equity and interest rate positions were subjected to equal movements up and down. The movements varied by product and existing levels of correlation based upon management judgement. Vola-tility sensitivities are predominantly equity volatilities and are gen-erally subjected to a 5% to 10% movement up and down. Credit spread sensitivities were subjected to generally equal movements up and down based upon management judgement and underly-ing market conditions.
Asset backed securities, loans and derivatives include CMBS, ABS CDO and balance guaranteed swap positions. CMBS sen-sitivities are calculated by subjecting the prices of the positions to a 5% movement up and down. ABS CDO positions were sub-jected to sensitivities to underlying asset prices, as well as recov-ery rates on the underlying assets. The underlying asset prices were subjected to a range of downward movements with no movement up. Balance guaranteed swap positions were sub-jected to sensitivities on prepayment speeds which were
estimated based on management’s assessment of fast/slow notional bands for movements up and down.
Debt and equity securities include equity fund linked products, variable funding notes and corporate and emerging market bonds. The primary parameters subjected to sensitivity analysis for equity fund linked products and variable funding notes include price, gap risk and secondary market reserves. Price sensitivity is generally estimated based on a +/- bump in the price of the underlying security. Gap risk sensitivity is estimated by using limited pricing service information and valuing to the conservative side of the range of values. The parameter subjected to sensitivity for emerg-ing market positions is price.
Loans include emerging market loans and corporate loans. For emerging market loans the parameter subjected to sensitivity analysis is credit spreads which is subjected to a 15% movement up and down. For corporate loans the parameter subjected to sen-sitivity analysis is the loan price which is subjected to an equal movement up and down which ranges from 5 to 10 points depend-ing upon the position.
Recognition of trade date profitIf therearesignificantunobservable inputsused in thevaluationtechnique,thefinancialinstrumentisrecognisedatthetransactionpriceandanyprofitimpliedfromthevaluationtechniqueattradedate is deferred over the period fair value is expected to become observable.
Thefollowingtablesetsout theaggregatedifferenceyet toberecognised inprofitor lossat thebeginningandendofyearwithareconciliation of the changes of the balance during the year:
2016 2015
Deferred trade date profit (USD million)
Balance at the beginning of period 310 372
Increase due to new trades 181 148
Reduction due to passage of time (32) (180)
Reduction due to redemption, sales, transfers or improved observability (46) (30)
Balance at the end of period 413 310

119Credit Suisse International, Annual Report 2016
Notes to the Financial Statements for the year ended 31 December 2016
Fair value of financial instruments not carried at fair valueIFRS requires thedisclosureof the fair valueoffinancial instru-ments not carried at fair value in the Consolidated Statements of
Financial Position. IFRS also requires the disclosure of the fair values of these financial instruments within the fair valuehierarchy.
Fair Value of financial instruments not recognised at fair value by level of fair value hierarchy
As at 31 December 2016
Group (USD million) Level 1 Level 2 Level 3 Fair value
Financial assets
Cash and due from banks 5,448 42 – 5,490
Interest-bearing deposits with banks – 9,647 – 9,647
Securities purchased under resale agreements and securities borrowing transactions – 9,467 – 9,467
Other loans and receivables – 3,247 75 3,322
Other assets – 36,692 8 36,700
Total fair value of financial assets 5,448 59,095 83 64,626
Financial liabilities
Deposits 457 – – 457
Securities sold under repurchase agreements and securities lending transactions – 2,821 – 2,821
Short term borrowings – 2,667 – 2,667
Long term debt – 32,140 – 32,140
Other financial liabilities – 31,426 – 31,426
Total fair value of financial liabilities 457 69,054 – 69,511
As at 31 December 2016
Bank (USD million) Level 1 Level 2 Level 3 Fair value
Financial assets
Cash and due from banks 5,319 42 – 5,361
Interest-bearing deposits with banks – 9,647 – 9,647
Securities purchased under resale agreements and securities borrowing transactions – 9,467 – 9,467
Other loans and receivables – 3,247 75 3,322
Other financial assets – 36,692 8 36,700
Total fair value of financial assets 5,319 59,095 83 64,497
Financial liabilities
Deposits 457 – – 457
Securities sold under repurchase agreements and securities lending transactions – 2,821 – 2,821
Short term borrowings – 2,667 – 2,667
Long term debt – 31,937 – 31,937
Other financial liabilities – 31,426 – 31,426
Total fair value of financial liabilities 457 68,851 – 69,308

120
As at 31 December 2015
Group (USD million) Level 1 Level 2 Level 3 Fair value
Financial assets
Cash and due from banks 13,077 86 – 13,163
Interest-bearing deposits with banks – 59 – 59
Securities purchased under resale agreements and securities borrowing transactions – 30,073 – 30,073
Other loans and receivables – 3,199 300 3,499
Other assets – 45,602 34 45,636
Total fair value of financial assets 13,077 79,019 334 92,430
Financial liabilities
Deposits 530 34 – 564
Securities sold under repurchase agreements and securities lending transactions – 5,737 – 5,737
Short term borrowings – 21,066 – 21,066
Long term debt – 26,585 2 26,587
Other financial liabilities – 30,822 – 30,822
Total fair value of financial liabilities 530 84,244 2 84,776
As at 31 December 2015
Bank (USD million) Level 1 Level 2 Level 3 Fair value
Financial assets
Cash and due from banks 13,077 5 – 13,082
Interest-bearing deposits with banks – 59 – 59
Securities purchased under resale agreements and securities borrowing transactions – 30,073 – 30,073
Other loans and receivables – 3,199 300 3,499
Other assets – 45,602 34 45,636
Total fair value of financial assets 13,077 78,938 334 92,349
Financial liabilities
Deposits 530 34 – 564
Securities sold under repurchase agreements and securities lending transactions – 5,737 – 5,737
Short term borrowings – 21,066 – 21,066
Long term debt – 26,594 2 26,596
Other financial liabilities – 30,822 – 30,822
Total fair value of financial liabilities 530 84,253 2 84,785

121Credit Suisse International, Annual Report 2016
Notes to the Financial Statements for the year ended 31 December 2016
39 Assets Pledged or Assigned
The following table sets forth details of assets pledged or assigned:
Group and Bank 2016 2015
Assets pledged or assigned (USD million)
Trading financial assets at fair value through profit or loss 16,435 15,360
Collateral received (USD million)
Fair value of collateral received with the right to resell or repledge 89,384 93,435
Ofwhichsoldorrepledged 61,105 47,664
Assets pledged or assigned represents the balance sheet position of tradingassetsat fair value throughprofitor losswhichhavebeen pledged as collateral under securities sold under repurchase agreements, securities lending transactions and derivatives trans-actions. Refer to Note 16 – Trading Financial Assets and Liabili-tiesatFairValueThroughProfitorLossfortheamountofsecuri-ties transferred which are encumbered.
As at 31 December 2016 and 2015 collateral was received in connection with resale agreements, securities borrowings and loans, derivative transactions and margined broker loans. As at these dates, a substantial portion of the collateral received by the CSi group had been sold or repledged in connection with repur-chase agreements, securities sold not yet purchased, securities lent, pledges to clearing organisations, segregation requirements
under securities laws and regulations, derivative transactions and bank loans.
These transactions were generally conducted under terms that are usual and customary for standard securitised lending activities and the other transactions described. The CSi group, as the secured party, has the right to sell or repledge such collateral, sub-ject to the CSi group returning equivalent securities upon comple-tion of the transaction.
The CSi group enters into agreements with counterparties where collateral or security interests in positions, which the CSi group holds, has been provided. This includes situations where the CSi group has registered charges to certain counterparties over the CSi group’s assets in connection with its normal operating activities.
40 Derecognition
In the normal course of business, the CSi group enters into trans-actionswhere it transferspreviously recognisedfinancialassets,suchasdebtsecurities,equitysecuritiesandotherfinancialinstru-ments. The CSi group’s accounting policy regarding derecognition ofsuchassetsunderIAS39isdescribedinNote2–SignificantAccounting Policies.
Transferred Financial Assets that are derecognised with continuing involvementWhere the transferofafinancialassetmeets thederecognitioncriteria under IAS 39, the CSi group may have continuing involve-mentinafinancialassetthathasbeenderecognised.Thecon-tinuing involvement can take several forms, including but not lim-ited to derivative instruments and debt instruments issued by structured entities to which the asset has been transferred. In addition, the CSi group does not have a continuing involvement in a transferredfinancial asset if, aspart of the transfer, theCSigroup neither retains any of the contractual rights or obligations
inherent in the transferredfinancial assetnoracquiresanynewcontractualrightsorobligationsrelatingtothetransferredfinancialasset. The CSi group does not have continuing involvement in a transferredfinancialassetifithasneitheraninterestinthefutureperformanceofthetransferredfinancialassetnoraresponsibilityunder any circumstances to make payments in respect of the transferredfinancialassetinthefuture.TheCSigroup’sexposureresulting from continuing involvement in a transferred asset is gen-erally limited to where the CSi group retains any form of rights or obligations relating to the transferred asset.
Thetablebelowprovidesinformationforthetransferoffinan-cial assets that qualify for sale accounting and subsequent derecognition, in which the CSi group still has continuing involve-ment as at 31 December 2016, irrespective of the date when the transfer occurred. The maximum exposure to loss from continuing involvement represents the maximum exposure before taking into account the amount of any collateral held against the continuing involvement.

122
Information on transferred assets by type of continuing involvement
Carrying amount of
continuing involvement Maximum
in statement of Fair value of continuing exposure Loss from Income / Expense from financial position involvement to loss transfer continuing involvement
Trading Trading financial financial assets at liabilities at For the year Cumulative fair value fair value ended to 2016 through profit through profit 31 Decem- 31 Decem-
Group and Bank (USD million) or loss or loss Assets Liabilities ber 2016 ber 2016
Type of continuing involvement
Derivatives
Swaps 71 (59) 71 (59) 71 (13) 9 (12)
Notes 31 – 31 – 31 – – –
Total 102 (59) 102 (59) 102 (13) 9 (12)
Carrying amount of
continuing involvement Maximum
in statement of Fair value of continuing exposure Loss from Income / Expense from financial position involvement to loss transfer continuing involvement
Trading Trading financial financial assets at liabilities at For the year Cumulative fair value fair value ended to 2015 through profit through profit 31 Decem- 31 Decem-
Group and Bank (USD million) or loss or loss Assets Liabilities ber 2015 ber 2015
Type of continuing involvement
Derivatives
Swaps 98 (47) 98 (47) 98 11 (4) (12)
Notes 40 – 40 – 40 – – –
Total 138 (47) 138 (47) 138 11 (4) (12)
The majority of the CSi group’s continuing involvement in derecognisedtransferredfinancialassetsisintheformofderiva-tive transactions. To reduce its credit risk to derivatives, the CSi group enters into legally enforceable netting agreements with its derivative counterparties. Collateral on these derivative contracts is usually posted on a net counterparty basis.
The following table shows a maturity analysis of undiscounted cash outflows that the CSi group may be required to pay to
repurchase the asset or any other amounts payable (such as divi-dends and interest payable) to the counterparty. The below table includes situations where the CSi group has an option to repur-chase the asset. In such instances, where the timing of the cash flows isnot specified, the total undiscountedamounthasbeenincluded in the earliest maturity bucket in the disclosure below. Cash outflows to the counterpartymay be triggered by creditevents.
Maturity analysis of undiscounted cash flows to repurchase transferred assets by type of continuing involvement
2016 Less than 1 – 5 more than
Group and Bank (USD million) Total On demand 1 year years 5 years
Type of continuing involvement
Derivatives 1
Swaps (358) (358) – – –
1 The derivative provides CSi group the right but not the obligation to repurchase the transferred asset at the CSi group’s option.
2015 Less than 1 – 5 more than
Group and Bank (USD million) Total On demand 1 year years 5 years
Type of continuing involvement
Derivatives 1
Swaps (319) (319) – – –
1 The derivative provides CSi group the right but not the obligation to repurchase the transferred asset at the CSi group’s option.

123Credit Suisse International, Annual Report 2016
Notes to the Financial Statements for the year ended 31 December 2016
Instruments that are considered to be continuing involvement are included in Note 16 – Trading Financial Assets and Liabilities at FairValueThroughProfit andLossandNote27–LongTermDebt.
Transferred Financial Assets that are not derecognised in their entiretyCertain transactions may include provisions that prevent derecog-nition of the transferred financial asset and the transfers areaccounted for as secured financing transactions. Repurchaseagreements, securities lending agreements and total return swaps, in which the CSi group retains substantially all of the associated
credit, market, interest rate and foreign exchange risks and rewards associated with the assets, represent the most common examples of such transactions. Where the transfer of an asset does not meet derecognition, it remains on the CSi groups balance sheet with a corresponding liability established to represent an obligation to the counterparty. As part of the CSi group’s repur-chase agreements and securities lending transactions, there is an obligation to return equivalent securities at the end of the transaction.
The following tableprovidesdetailsoffinancialassetswhichhave been sold or otherwise transferred, but which do not qualify for derecognition, together with their associated liabilities.
Carrying amount of transferred assets not derecognised and associated liabilities
2016 2015
Carrying Carrying Carrying amount of Carrying amount of amount associated amount associated Group and Bank (USD million) of assets liabilities of assets liabilities
Financial assets not derecognised due to the following transactions
Repurchase & Securities lending agreements 16,435 16,435 14,902 14,902
Total Return Swaps 565 385 655 427
Other 76 76 189 189
The CSi group also participates in securities lending agreements where the counterparty provides securities as collateral or fees. The carrying amount of the assets not derecognised in such trans-actions is equal to USD 1,925 million (2015: USD 3,376 million).
Where the CSi group sells the contractual rights to the cash flowsofthesecuritiesincludedabove,itdoesnothavetheabilityto use the transferred assets during the term of the arrangement.
The counterparties to the associated liabilities included above, have full recourse to CSi.
Assets not derecognised are included in Note 16 – Trading FinancialAssets andLiabilities atFairValueThroughProfit orLoss and the corresponding liabilities are included in Note 15 – Securities Borrowed, Lent and Purchased/Sold under Resale/Repurchase Agreements and Note 17 – Financial Assets and Lia-bilitiesDesignatedatFairValueThroughProfitorLoss.
Oftheabove,otherfinancialassetsnotderecognisedincludesfailed sale items including fair value elected items which are shown underFinancialassetsdesignatedat fair value throughprofitorloss in the Consolidated Statement of Financial Position.
41 Financial Instruments Risk Position
Risks Detaili) Market RiskOverviewMarket risk is the risk of loss arising from adverse changes in inter-est rates, foreign currency exchange rates, equity prices, com-modity prices and other relevant parameters, such as market vola-tilities and corelations. The Bank defines its market risk aspotential changes in the fair values of financial instruments inresponse to market movements. A typical transaction will be exposed to a number of different market risks.
The Bank has policies and processes in place to ensure that market risk is captured, accurately modelled and reported, and effectively managed. Trading and non-trading portfolios are man-aged at various organisational levels, from the overall risk positions attheBankleveldowntospecificportfolios.TheBankusesmar-ket risk measurement and management methods in line with regu-latory and industry standards. These include general tools capable of calculating comparable risk metrics across the Bank’s many activitiesandfocusedtoolsthatcanspecificallymodeltheunique
characteristics of certain instruments or portfolios. The tools are used for internal market risk management, internal market risk reporting and external disclosure purposes. The principal portfolio measurement methodologies are Value-at-Risk (‘VaR’) and sce-nario analysis. The risk management techniques and policies are regularly reviewed to ensure they remain appropriate.
Value-at-RiskVaRmeasuresthepotentiallossintermsoffairvalueoffinancialinstrumentsdue to adversemarketmovementsover a definedtimehorizonata specifiedconfidence level. VaR isapplicable for market risk exposures with appropriate price histories. Posi-tions can be aggregated in several ways, across risk factors, products and businesses. For example, interest rate risk includes risk arising from money market and swap transactions, bonds, and interest rate, foreign exchange, equity and commodity options. The use of VaR allows the comparison of risk across different asset classes, businesses and Divisions, and also pro-vides a means of aggregating and netting a variety of positions

124
within a portfolio to reflect actual correlations and offsetsbetween different assets.
Historical financialmarket rates, prices and other relevantparameters serve as a basis for the statistical VaR model underly-ing the potential loss estimation. The Bank uses a ten-day holding periodandaconfidencelevelof99%tomodeltheriskinitstrad-ing portfolios. These assumptions are compliant with the stan-dards published by the Basel Committee on Banking Supervision (‘BCBS’).
The Bank uses a historical simulation model for the majority of the risk types and businesses within its trading portfolios. Where insufficientdata isavailable forsuchanapproach,an ‘extreme-move’methodologyisused.Themodelisbasedontheprofitorloss distribution resulting from historical changes in market rates, prices and other relevant parameters applied to evaluate the port-folio. This methodology also avoids any explicit assumptions on the correlation between risk factors. The Bank uses a three-year historical dataset to compute VaR. To ensure that VaR responds appropriately in times of market stress, the Bank uses a scaling technique that automatically increases VaR where the short-term market volatility is higher than the long-term volatility in the three year dataset. This results in a more responsive VaR model, as the impact of changes in the overall market volatility is reflectedpromptly in the VaR model output.
The Bank has approval from the PRA to use its regulatory VaR model in the calculation of the trading book market risk capital requirements.
The VaR model uses assumptions and estimates that the Bank believes are reasonable, but changes to assumptions or estimates could result in a different VaR measure. The main assumptions and limitations of VaR as a risk measure are: p VaR relies on historical data to estimate future changes in mar-
ket conditions, which may not capture all potential future out-comes,particularlywheretherearesignificantchangesinmar-ket conditions and correlations across asset classes.
p VaRprovidesanestimateoflossesata99%confidencelevel,which means that it does not provide any information on the size of losses that could occur beyond that threshold.
p VaR is based on a ten-day holding period. This assumes that risks can be either sold or hedged over that period, which may not be possible for all types of exposure, particularly during periods of market illiquidity or turbulence.
p VaR is calculated using positions held at the end of each busi-ness day and does not include intra-day changes in exposures.
Scenario analysisStress testing complements other risk measures by capturing the Bank’s exposure to unlikely but plausible events, which can be expressed througha rangeof significantmovesacrossmultiplefinancialmarkets. Themajorityofscenarioanalysiscalculations
performedarespecificallytailoredtowardtheriskprofileofpartic-ular businesses, and limits may be established if they are consid-ered the most appropriate control. In addition, to identify areas of risk concentration and potential vulnerability to stress events at Bank level, a set of scenarios are used which are consistently appliedacrossallbusinessesandassesstheimpactofsignificant,simultaneous movements across a broad range of markets and asset classes.
Stress testing is a fundamental element of the Bank’s risk con-trol framework, stress testing results are used in risk appetite dis-cussions and strategic business planning, and support the Bank’s internal capital adequacy assessment. Stress testing is conducted on a regular basis and the results, trend information and support-ing analysis are reported to the Board, senior management and shared and discussed with the business lines.
Scenarioscanbedefinedwithreferencetohistoriceventsorbased on forward looking, hypothetical events that could impact theBank’spositions,capital,orprofitability.Thescenariosusedwithin the Bank are reviewed at the individual risk committee level as well as by a dedicated scenario design forum. It is expected thatthescenariosusedwithintheBankareredefinedasrequiredby changes in market conditions and as business strategies evolve.
Trading portfoliosRisk measurement and managementMarket risk arises in the Bank’s trading portfolios primarily through the trading activities within the bank.
For the purposes of this disclosure, VaR is used to quantify marketriskinthetradingportfolio.Thisclassificationofassetsastrading is based on the trading intent and for the purpose of ana-lysingtheBank’smarketriskexposure,notforfinancialstatementpurposes.
The Bank is active in the principal global trading markets, using the majority of common trading and hedging products, including derivatives such as swaps, futures, options and structured prod-ucts (some of which are customised transactions using combina-tionsofderivativesandexecutedtomeetspecificclientorpropri-etary needs). As a result of the Bank’s broad participation in products and markets, trading strategies are correspondingly diverse and exposures are generally spread across a range of risk factors and locations.
Development of trading portfolio risksThe table below shows the trading related market risk exposure for the Bank, as measured by ten-day 99% VaR. The VaR in the table has been calculated using a three-year historical dataset. VaR estimates are computed separately for each risk type and for the whole portfolio using the historical simulation methodology. Thediversificationbenefitreflectsthenetdifferencebetweenthesum of the 99th percentile loss for each individual risk type and for the total portfolio.

125Credit Suisse International, Annual Report 2016
Notes to the Financial Statements for the year ended 31 December 2016
Ten-day, 99% VaR – trading portfolios
Interest rate Diversifi- and Foreign cation
End of period credit spread exchange Commodity Equity benefit 1 Total
2016 (USD million)
Average 32 17 6 27 (34) 49
Minimum 16 4 2 17 – 2 27
Maximum 46 30 15 42 – 2 85
End of period 37 16 2 27 (40) 43
2015 (USD million)
Average 40 17 5 20 (31) 51
Minimum 30 5 1 11 – 2 32
Maximum 54 75 11 53 – 2 102
End of period 33 10 2 27 (22) 50
1 Diversification benefit reflects the net difference between the sum of the 99% percentile loss.2 As the minimum and maximum occur on different days for different risk types, it is not meaningful to calculate a portfolio diversification benefit.
VaR resultsThe CSi group’s ten-day, 99% regulatory VaR as of 31 December 2016 decreased by 14% to USD 43 million, compared to 31 December 2015 (USD 50 million).
Banking portfoliosRisk measurement and managementThe market risks associated with the non-trading portfolios are measured, monitored and limited using several tools, including scenario analysis, sensitivity analysis and VaR. For the purpose of this disclosure, the aggregated market risks associated with the Bank’s non-trading portfolios are measured using sensitivity anal-ysis. The sensitivity analysis for the non-trading activities mea-sures the amount of potential change in economic value resulting fromspecifiedhypotheticalshockstomarketfactors. It isnotameasure of the potential impact on reported earnings in the cur-rent period, since the non-trading activities generally are not marked to market through earnings. Foreign exchange translation risk is not included in this analysis.
Development of non-trading portfolio risksInterest rate risk on banking book positions is shown using sensi-tivity analysis that estimates the potential change in value resulting fromdefinedchangesininterestrateyieldcurves.Theimpactofa one-basis-point parallel move in yield curves on the fair value of interest rate-sensitive non-trading book positions would be USD 0.2 million as of 31 December 2016 compared to USD 2.1 million as of 31 December 2015. Non-trading interest rate risk is assessed using other measures including the potential value changeresultingfromasignificantchangeinyieldcurves.Asof31 December 2016, the fair value impacts of 200-basis-point moveinyieldcurves(noflooringatzero)were:
A fair value loss of USD 2 million (2015: gain of USD 373 mil-lion) for a +200bps move.
A fair value loss of USD 72 million (2015: loss of USD 443 mil-lion) for a -200bps move.
ii) Liquidity RiskLiquidity risk is the risk that a bank is unable to fund assets and meet obligations as they fall due under both normal and stressed market conditions.
CS group-wide management of liquidity risk Liquidity, as with funding, capital and foreign exchange exposures, is centrally managed by Treasury. Oversight of these activities is provided by the Capital Allocation and Risk Management Commit-tee (‘CARMC’), a committee that includes the Chief Executive Officers (‘CEOs’)of theCSgroupand thedivisions, theChiefFinancial Officer (‘CFO’), the Chief Risk Officer (‘CRO’) andTreasurer.
The liquidity and funding strategy is approved by CARMC with ultimate responsibility residing with the CSG Board of Directors. The implementation and execution of the funding and liquidity strategy is managed by Treasury for adherence to the funding pol-icyand theefficientcoordinationof thesecured fundingdesks.The liquidityand fundingprofile is regularly reported toCARMCandtheBoardofDirectors,whodefinetheBank’srisktoleranceand set parameters for the balance sheet usage of businesses.
The liquidity and fundingprofileofCreditSuisseAG (‘CS’)reflectstheriskappetite,businessactivities,strategy,marketcon-ditions and overall operating environment. CS’s liquidity and fund-ing policy is designed to ensure that funding is available to meet all obligations in times of stress, whether caused by market events and/orissuesspecifictoCS.ThisapproachenhancesCS’sabilityto manage potential liquidity and funding risks and to promptly adjust the liquidity and funding levels in response to stressed conditions.
The funding sourced by CS is part of an Asset-Liability Man-agement (‘ALM’) strategy aimed at maintaining a funding structure with long term stable funding sources being in excess of illiquid assets. CS primarily funds the balance sheet through core cus-tomer deposits, long-term debt and shareholders’ equity.
The fundingprofile isdesigned toenableCS tocontinue topursue activities for an extended period of time without changing business plans during times of stress. To address short term liquid-ity needs in any stress, a liquidity buffer consisting of a portfolio of

126
highly liquid securities and cash is maintained which can be utilised in the event of a crisis.
The principal measure used to monitor the structural liquidity positionofthefirmandasthebasisforfundstransferpricingpol-icy is the Net Stable Funding Ratio (‘NSFR’). This is comple-mented by CS’s internal liquidity barometer, which measures sur-vival days under stressed conditions and considers the adjusted market value of unencumbered assets (including cash) against the aggregate value of expected contractual, contingent and client behaviouralliquidityoutflows.Thisframeworkissupplementedbythe modeling of additional stress events and additional liquidity risk measurement tools.
In the event of a liquidity crisis, CS would activate its Contin-gencyFundingPlan(‘CFP’),whichfocusesonthespecificactionsthat would be taken as a response, including a detailed communi-cation plan for creditors, investors and customers.
The contingency plan would be activated by the Funding Exe-cution Committee (‘FEC’), which includes senior business line, fundingandfinancedepartmentmanagementadaptedtoincludethe relevant stakeholders depending upon the degree and nature of stress. This committee would meet frequently throughout the crisis to ensure that the plan is executed.
On regulatory developments, the BCBS issued the Basel III international framework for liquidity risk measurement, standards and monitoring. The framework includes a liquidity coverage ratio (‘LCR’) and NSFR.
The LCR, which is being phased in beginning 1 January 2015 through 1 January 2019, following an observation period which began in 2011, addresses liquidity risk over a 30-day period. The LCR aims to ensure that banks have a stock of unencumbered high-quality liquid-assets available to meet liquidity needs for a 30-day time horizon under a severe stress scenario. The LCR is comprised of two components: the value of the stock of high qual-ity liquid assets in stressed conditions and the total net cash out-flowscalculatedaccordingtospecifiedscenarioparameters.Theratioofliquidassetsovernetcashoutflowswassubjecttoaninitialproposed minimum requirement of 60%, which increases by 10% each year, reaching 100% by 1 January 2019.
The NSFR, which under BCBS is expected to be introduced on 1 January 2018 following an observation period which began in 2012, establishes criteria for a minimum amount of stable funding based on the liquidity of a bank’s assets and activities over a one-year horizon. The NSFR is intended to ensure banks maintain a structurallysoundlong-termfundingprofilebeyondoneyearandisacomplementarymeasuretotheLCR.Thestandardisdefinedasthe ratio of available stable funding over the amount of required stable funding and should always be at least 100%.
It should be noted that local Regulators are free to interpret the BCBS proposals and have implemented various aspects differently including timescales for implementation of the LCR and NSFR.
Legal entity management of liquidity riskThe liquidity risk of CSi is managed as an integral part of the over-all CS global liquidity risk management framework. CSi aims to achieve a prudent approach in the management of liquidity to
ensure it can meet its obligations as they fall due. The core liquid-ity adequacy analysis used for CSi is aligned to those used globally for the CS barometer.
The legal entity internal liquidity risk management framework also includes local regulatory compliance requirements. Such compliance requirements are measured as part of the Prudential Regulation Authority’s Individual Liquidity Guidance (‘ILG’) which results in CSi holding term funding and a local liquid asset buffer of qualifying securities.
Following global regulatory developments, the European Bank-ing Authority (‘EBA’) has published its version of the LCR and NSFR as part of the implementation guidance for Basel III. Under CRDIV guidelines, the LCR was initially introduced with a minimum requirement of 80% on October 1, 2015 with an increase to 90% from January 1, 2017 and full compliance by January 1, 2018 (one year prior to BCBS guidelines). The NSFR was expected to be introduced on January 1, 2018 in-line with the BCBS proposal, howeverinNovember2016theEuropeanCommissionconfirmedthat it will not apply at a level of 100% until two years after the date of entry in to force of the proposed Regulation. The date for this is not yet known however entry in to force is expected around mid-2018.
In the context of liquidity management at the legal entity, the Bank’s Board is responsible for setting the liquidity risk appetite. Some of the key characteristics determining CSi’s liquidity risk management approach include, but are not limited to:p Board approved legal entity risk appetite;p Compliance with local regulatory requirements;p Holding a liquid asset portfolio composed of highly liquid unen-
cumbered assets;p The liquidity value of assets, liabilities and the calibration of
contingent liabilities being aligned with the CS global liquidity risk methodologies.
CSi has implemented a liquidity risk management framework including legal entity governance, systems and controls and fre-quent management information to measure, monitor and manage liquidity risk.
The legal entity risk appetite and assumptions underlying the relevant stress tests, which form part of CSi’s liquidity risk man-agement framework, are reviewed by Risk and Treasury and ulti-mately approved by the Bank’s Board of Directors on at least an annual basis or as market conditions dictate.
Treasury is responsible for maintaining a CFP that details spe-cific dealing strategies, actions and responsibilities requireddepending upon severity of the crisis. Treasury supports the plan with key liquidity tools, including early warning indicators. The CFP gives consideration to the impact of operational constraints in terms of time and ability to monetise assets, trapped liquidity, day-light collateral requirements and communicated strategies.
Incremental to CSi’s unsecured funding sources from CS, CSi has the ability to access secured funding markets via repurchase agreements and a structured notes issuance programme. These fundingstreamsprovidediversificationtothefundingprofileoftheentity.

127Credit Suisse International, Annual Report 2016
Notes to the Financial Statements for the year ended 31 December 2016
Thefollowingtablesetsoutdetailsoftheremainingcontractualmaturityofallfinancialliabilities:
Due Due between between
Group Due within 3 and 12 1 and 5 Due after
31 December 2016 On Demand 3 months months years 5 years Total
Financial liabilities (USD million)
Deposits 457 – – – – 457
Securities sold under repurchase agreements and securities lending transactions 630 447 1,626 – 118 2,821
Trading financial liabilities at fair value through profit or loss 211,639 – – – – 211,639
Financial liabilities designated at fair value through profit or loss 130 12,844 2,907 4,709 4,099 24,689
Short term borrowings – 2,667 – – – 2,667
Long term debt – 3,333 550 25,473 4,684 34,040
Other liabilities 31,426 – – – - 31,426
Liabilities held for sale 155 922 – 946 1,730 3,753
Total 244,437 20,213 5,083 31,128 10,631 311,492
Due Due between between
Group Due within 3 and 12 1 and 5 Due after
31 December 2015 On Demand 3 months months years 5 years Total
Financial liabilities (USD million)
Deposits 529 1 34 – – 564
Securities sold under repurchase agreements and securities lending transactions 895 465 4,050 – 327 5,737
Trading financial liabilities at fair value through profit or loss 270,767 – – – – 270,767
Financial liabilities designated at fair value through profit or loss 16 10,256 2,190 7,828 2,219 22,509
Short term borrowings – 21,066 – – – 21,066
Long term debt – 5,307 248 17,994 4,587 28,136
Other liabilities 30,822 – – – – 30,822
Total 303,029 37,095 6,522 25,822 7,133 379,601
Due Due between between
Bank Due within 3 and 12 1 and 5 Due after
31 December 2016 On Demand 3 months months years 5 years Total
Financial liabilities (USD million)
Deposits 457 – – – – 457
Securities sold under repurchase agreements and securities lending transactions 630 447 1,626 – 118 2,821
Trading financial liabilities at fair value through profit or loss 211,647 – – – – 211,647
Financial liabilities designated at fair value through profit or loss 131 12,844 2,907 4,702 4,099 24,683
Short term borrowings – 2,667 – – – 2,667
Long term debt – 3,389 550 25,294 4,605 33,838
Other liabilities 31,426 – – – - 31,426
Liabilities held for sale 155 922 – 946 1,730 3,753
Total 244,446 20,269 5,083 30,942 10,552 311,292
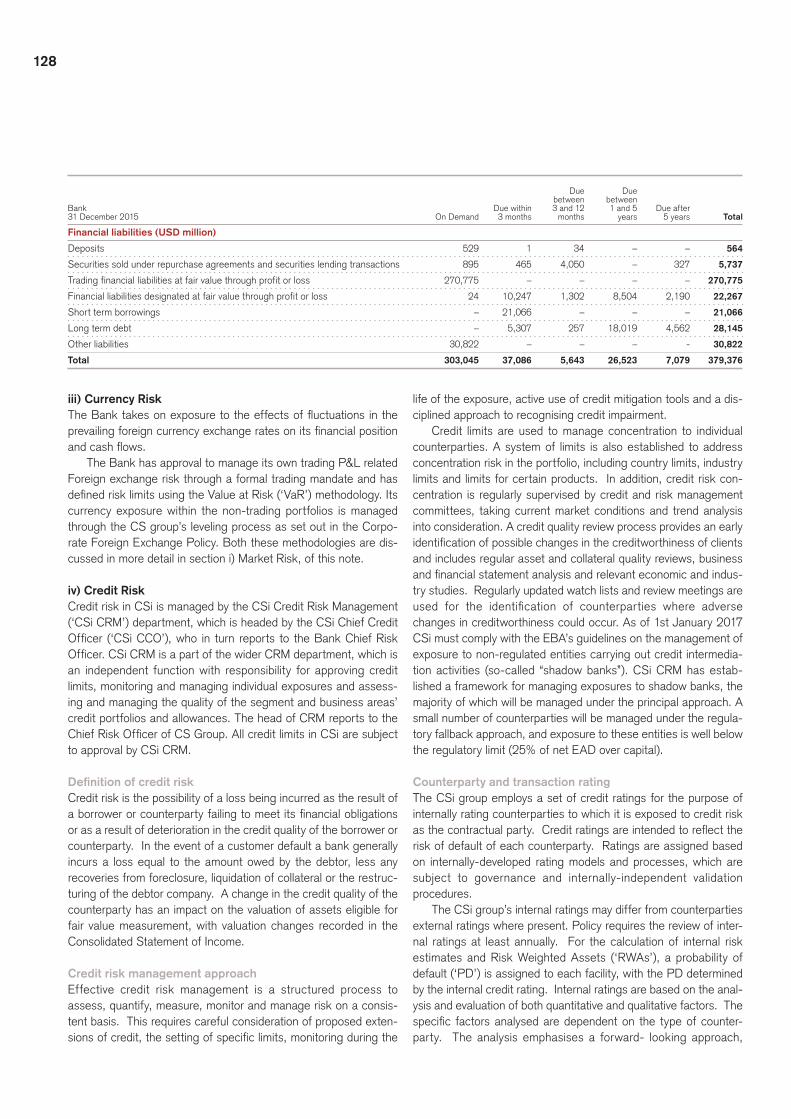
128
Due Due between between
Bank Due within 3 and 12 1 and 5 Due after
31 December 2015 On Demand 3 months months years 5 years Total
Financial liabilities (USD million)
Deposits 529 1 34 – – 564
Securities sold under repurchase agreements and securities lending transactions 895 465 4,050 – 327 5,737
Trading financial liabilities at fair value through profit or loss 270,775 – – – – 270,775
Financial liabilities designated at fair value through profit or loss 24 10,247 1,302 8,504 2,190 22,267
Short term borrowings – 21,066 – – – 21,066
Long term debt – 5,307 257 18,019 4,562 28,145
Other liabilities 30,822 – – – - 30,822
Total 303,045 37,086 5,643 26,523 7,079 379,376
iii) Currency RiskTheBanktakesonexposuretotheeffectsoffluctuationsintheprevailingforeigncurrencyexchangeratesonitsfinancialpositionandcashflows.
The Bank has approval to manage its own trading P&L related Foreign exchange risk through a formal trading mandate and has definedrisklimitsusingtheValueatRisk(‘VaR’)methodology.Itscurrency exposure within the non-trading portfolios is managed through the CS group’s leveling process as set out in the Corpo-rate Foreign Exchange Policy. Both these methodologies are dis-cussed in more detail in section i) Market Risk, of this note.
iv) Credit RiskCredit risk in CSi is managed by the CSi Credit Risk Management (‘CSi CRM’) department, which is headed by the CSi Chief Credit Officer (‘CSiCCO’),who in turn reports to theBankChiefRiskOfficer.CSiCRMisapartofthewiderCRMdepartment,whichisan independent function with responsibility for approving credit limits, monitoring and managing individual exposures and assess-ing and managing the quality of the segment and business areas’ credit portfolios and allowances. The head of CRM reports to the ChiefRiskOfficerofCSGroup.AllcreditlimitsinCSiaresubjectto approval by CSi CRM.
Definition of credit riskCredit risk is the possibility of a loss being incurred as the result of aborrowerorcounterpartyfailingtomeetitsfinancialobligationsor as a result of deterioration in the credit quality of the borrower or counterparty. In the event of a customer default a bank generally incurs a loss equal to the amount owed by the debtor, less any recoveries from foreclosure, liquidation of collateral or the restruc-turing of the debtor company. A change in the credit quality of the counterparty has an impact on the valuation of assets eligible for fair value measurement, with valuation changes recorded in the Consolidated Statement of Income.
Credit risk management approachEffective credit risk management is a structured process to assess, quantify, measure, monitor and manage risk on a consis-tent basis. This requires careful consideration of proposed exten-sionsofcredit,thesettingofspecificlimits,monitoringduringthe
life of the exposure, active use of credit mitigation tools and a dis-ciplined approach to recognising credit impairment.
Credit limits are used to manage concentration to individual counterparties. A system of limits is also established to address concentration risk in the portfolio, including country limits, industry limits and limits for certain products. In addition, credit risk con-centration is regularly supervised by credit and risk management committees, taking current market conditions and trend analysis into consideration. A credit quality review process provides an early identificationofpossiblechangesinthecreditworthinessofclientsand includes regular asset and collateral quality reviews, business andfinancialstatementanalysisandrelevanteconomicandindus-try studies. Regularly updated watch lists and review meetings are used for the identification of counterparties where adversechanges in creditworthiness could occur. As of 1st January 2017 CSi must comply with the EBA’s guidelines on the management of exposure to non-regulated entities carrying out credit intermedia-tion activities (so-called “shadow banks”). CSi CRM has estab-lished a framework for managing exposures to shadow banks, the majority of which will be managed under the principal approach. A small number of counterparties will be managed under the regula-tory fallback approach, and exposure to these entities is well below the regulatory limit (25% of net EAD over capital).
Counterparty and transaction ratingThe CSi group employs a set of credit ratings for the purpose of internally rating counterparties to which it is exposed to credit risk asthecontractualparty.Creditratingsareintendedtoreflecttherisk of default of each counterparty. Ratings are assigned based on internally-developed rating models and processes, which are subject to governance and internally-independent validation procedures.
The CSi group’s internal ratings may differ from counterparties external ratings where present. Policy requires the review of inter-nal ratings at least annually. For the calculation of internal risk estimates and Risk Weighted Assets (‘RWAs’), a probability of default (‘PD’) is assigned to each facility, with the PD determined by the internal credit rating. Internal ratings are based on the anal-ysis and evaluation of both quantitative and qualitative factors. The specific factorsanalysedaredependenton the typeofcounter-party. The analysis emphasises a forward- looking approach,
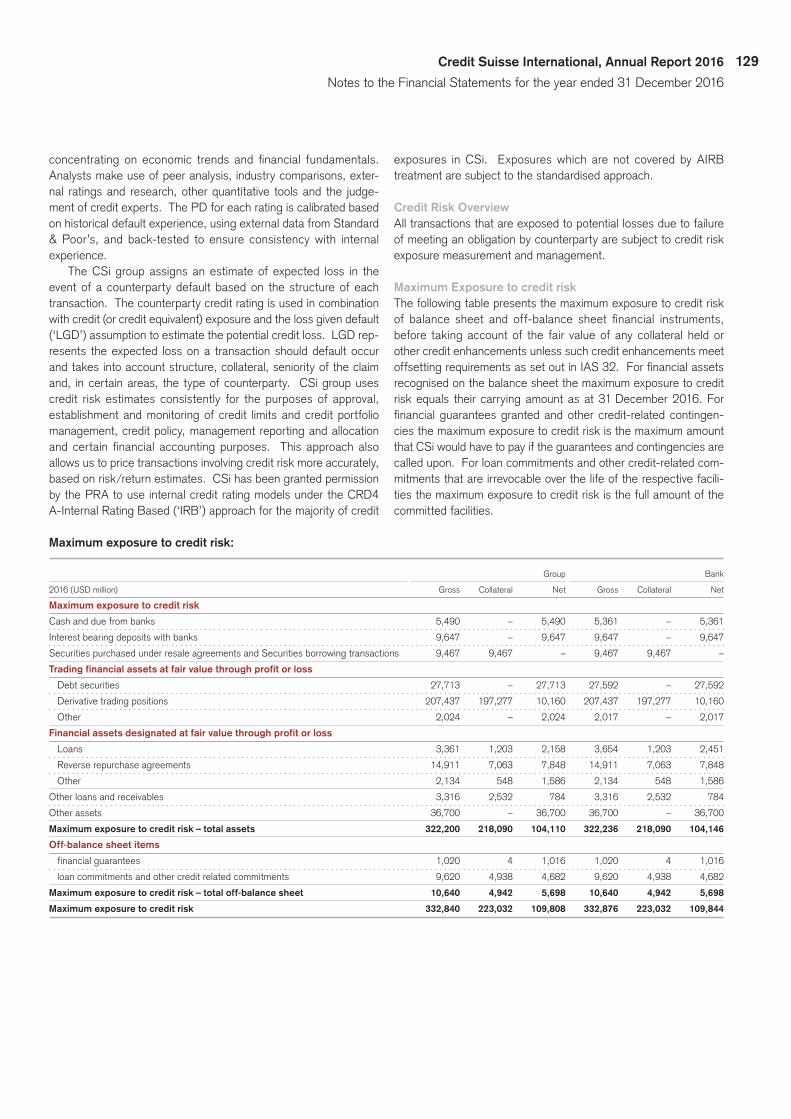
129Credit Suisse International, Annual Report 2016
Notes to the Financial Statements for the year ended 31 December 2016
concentrating on economic trends and financial fundamentals.Analysts make use of peer analysis, industry comparisons, exter-nal ratings and research, other quantitative tools and the judge-ment of credit experts. The PD for each rating is calibrated based on historical default experience, using external data from Standard & Poor’s, and back-tested to ensure consistency with internal experience.
The CSi group assigns an estimate of expected loss in the event of a counterparty default based on the structure of each transaction. The counterparty credit rating is used in combination with credit (or credit equivalent) exposure and the loss given default (‘LGD’) assumption to estimate the potential credit loss. LGD rep-resents the expected loss on a transaction should default occur and takes into account structure, collateral, seniority of the claim and, in certain areas, the type of counterparty. CSi group uses credit risk estimates consistently for the purposes of approval, establishment and monitoring of credit limits and credit portfolio management, credit policy, management reporting and allocation andcertain financial accountingpurposes. Thisapproachalsoallows us to price transactions involving credit risk more accurately, based on risk/return estimates. CSi has been granted permission by the PRA to use internal credit rating models under the CRD4 A-Internal Rating Based (‘IRB’) approach for the majority of credit
exposures in CSi. Exposures which are not covered by AIRB treatment are subject to the standardised approach.
Credit Risk OverviewAll transactions that are exposed to potential losses due to failure of meeting an obligation by counterparty are subject to credit risk exposure measurement and management.
Maximum Exposure to credit riskThe following table presents the maximum exposure to credit risk of balance sheet and off-balance sheet financial instruments,before taking account of the fair value of any collateral held or other credit enhancements unless such credit enhancements meet offsettingrequirementsassetoutinIAS32.Forfinancialassetsrecognised on the balance sheet the maximum exposure to credit risk equals their carrying amount as at 31 December 2016. For financialguaranteesgrantedandothercredit-relatedcontingen-cies the maximum exposure to credit risk is the maximum amount that CSi would have to pay if the guarantees and contingencies are called upon. For loan commitments and other credit-related com-mitments that are irrevocable over the life of the respective facili-ties the maximum exposure to credit risk is the full amount of the committed facilities.
Maximum exposure to credit risk:
Group Bank
2016 (USD million) Gross Collateral Net Gross Collateral Net
Maximum exposure to credit risk
Cash and due from banks 5,490 – 5,490 5,361 – 5,361
Interest bearing deposits with banks 9,647 – 9,647 9,647 – 9,647
Securities purchased under resale agreements and Securities borrowing transactions 9,467 9,467 – 9,467 9,467 –
Trading financial assets at fair value through profit or loss
Debtsecurities 27,713 – 27,713 27,592 – 27,592
Derivativetradingpositions 207,437 197,277 10,160 207,437 197,277 10,160
Other 2,024 – 2,024 2,017 – 2,017
Financial assets designated at fair value through profit or loss
Loans 3,361 1,203 2,158 3,654 1,203 2,451
Reverserepurchaseagreements 14,911 7,063 7,848 14,911 7,063 7,848
Other 2,134 548 1,586 2,134 548 1,586
Other loans and receivables 3,316 2,532 784 3,316 2,532 784
Other assets 36,700 – 36,700 36,700 – 36,700
Maximum exposure to credit risk – total assets 322,200 218,090 104,110 322,236 218,090 104,146
Off-balance sheet items
financialguarantees 1,020 4 1,016 1,020 4 1,016
loancommitmentsandothercreditrelatedcommitments 9,620 4,938 4,682 9,620 4,938 4,682
Maximum exposure to credit risk – total off-balance sheet 10,640 4,942 5,698 10,640 4,942 5,698
Maximum exposure to credit risk 332,840 223,032 109,808 332,876 223,032 109,844
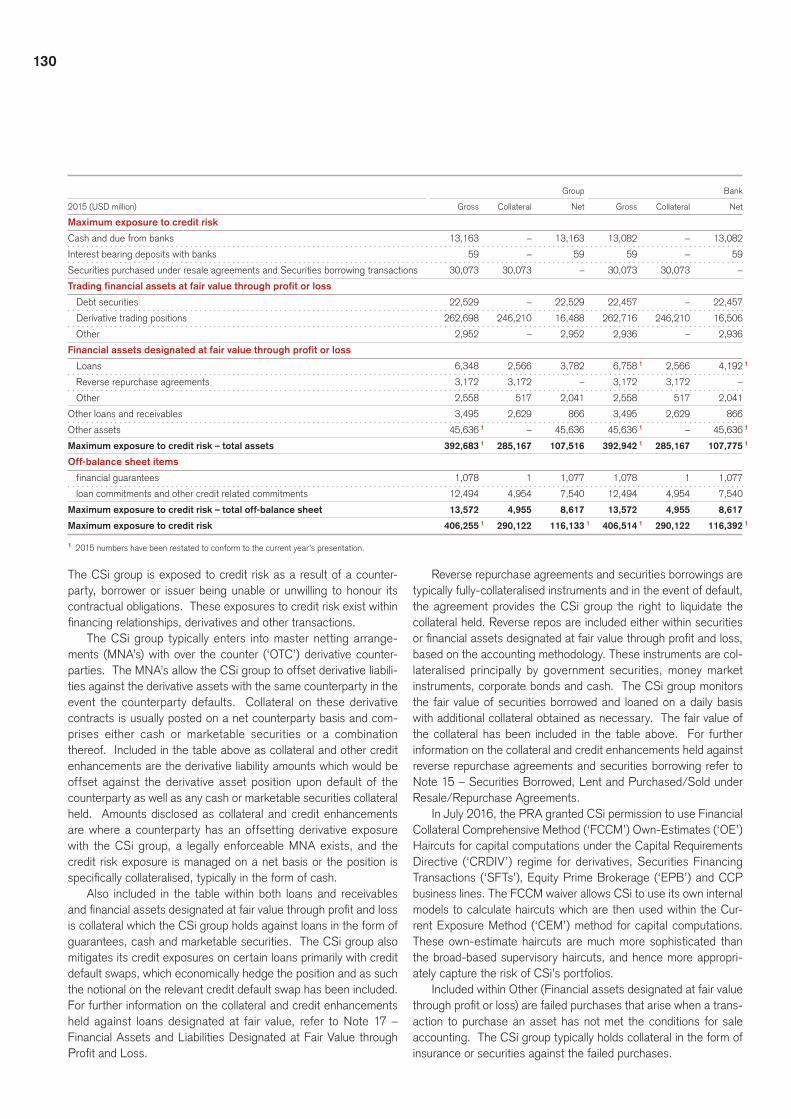
130
Group Bank
2015 (USD million) Gross Collateral Net Gross Collateral Net
Maximum exposure to credit risk
Cash and due from banks 13,163 – 13,163 13,082 – 13,082
Interest bearing deposits with banks 59 – 59 59 – 59
Securities purchased under resale agreements and Securities borrowing transactions 30,073 30,073 – 30,073 30,073 –
Trading financial assets at fair value through profit or loss
Debtsecurities 22,529 – 22,529 22,457 – 22,457
Derivativetradingpositions 262,698 246,210 16,488 262,716 246,210 16,506
Other 2,952 – 2,952 2,936 – 2,936
Financial assets designated at fair value through profit or loss
Loans 6,348 2,566 3,782 6,758 1 2,566 4,192 1
Reverserepurchaseagreements 3,172 3,172 – 3,172 3,172 –
Other 2,558 517 2,041 2,558 517 2,041
Other loans and receivables 3,495 2,629 866 3,495 2,629 866
Other assets 45,636 1 – 45,636 45,636 1 – 45,636 1
Maximum exposure to credit risk – total assets 392,683 1 285,167 107,516 392,942 1 285,167 107,775 1
Off-balance sheet items
financialguarantees 1,078 1 1,077 1,078 1 1,077
loancommitmentsandothercreditrelatedcommitments 12,494 4,954 7,540 12,494 4,954 7,540
Maximum exposure to credit risk – total off-balance sheet 13,572 4,955 8,617 13,572 4,955 8,617
Maximum exposure to credit risk 406,255 1 290,122 116,133 1 406,514 1 290,122 116,392 1
1 2015 numbers have been restated to conform to the current year’s presentation.
The CSi group is exposed to credit risk as a result of a counter-party, borrower or issuer being unable or unwilling to honour its contractual obligations. These exposures to credit risk exist within financingrelationships,derivativesandothertransactions.
The CSi group typically enters into master netting arrange-ments (MNA’s) with over the counter (‘OTC’) derivative counter-parties. The MNA’s allow the CSi group to offset derivative liabili-ties against the derivative assets with the same counterparty in the event the counterparty defaults. Collateral on these derivative contracts is usually posted on a net counterparty basis and com-prises either cash or marketable securities or a combination thereof. Included in the table above as collateral and other credit enhancements are the derivative liability amounts which would be offset against the derivative asset position upon default of the counterparty as well as any cash or marketable securities collateral held. Amounts disclosed as collateral and credit enhancements are where a counterparty has an offsetting derivative exposure with the CSi group, a legally enforceable MNA exists, and the credit risk exposure is managed on a net basis or the position is specificallycollateralised,typicallyintheformofcash.
Also included in the table within both loans and receivables andfinancialassetsdesignatedatfairvaluethroughprofitandlossis collateral which the CSi group holds against loans in the form of guarantees, cash and marketable securities. The CSi group also mitigates its credit exposures on certain loans primarily with credit default swaps, which economically hedge the position and as such the notional on the relevant credit default swap has been included. For further information on the collateral and credit enhancements held against loans designated at fair value, refer to Note 17 – Financial Assets and Liabilities Designated at Fair Value through ProfitandLoss.
Reverse repurchase agreements and securities borrowings are typically fully-collateralised instruments and in the event of default, the agreement provides the CSi group the right to liquidate the collateral held. Reverse repos are included either within securities orfinancialassetsdesignatedatfairvaluethroughprofitandloss,based on the accounting methodology. These instruments are col-lateralised principally by government securities, money market instruments, corporate bonds and cash. The CSi group monitors the fair value of securities borrowed and loaned on a daily basis with additional collateral obtained as necessary. The fair value of the collateral has been included in the table above. For further information on the collateral and credit enhancements held against reverse repurchase agreements and securities borrowing refer to Note 15 – Securities Borrowed, Lent and Purchased/Sold under Resale/Repurchase Agreements.
In July 2016, the PRA granted CSi permission to use Financial Collateral Comprehensive Method (‘FCCM’) Own-Estimates (‘OE’) Haircuts for capital computations under the Capital Requirements Directive (‘CRDIV’) regime for derivatives, Securities Financing Transactions (‘SFTs’), Equity Prime Brokerage (‘EPB’) and CCP business lines. The FCCM waiver allows CSi to use its own internal models to calculate haircuts which are then used within the Cur-rent Exposure Method (‘CEM’) method for capital computations. These own-estimate haircuts are much more sophisticated than the broad-based supervisory haircuts, and hence more appropri-ately capture the risk of CSi’s portfolios.
Included within Other (Financial assets designated at fair value throughprofitorloss)arefailedpurchasesthatarisewhenatrans-action to purchase an asset has not met the conditions for sale accounting. The CSi group typically holds collateral in the form of insurance or securities against the failed purchases.

131Credit Suisse International, Annual Report 2016
Notes to the Financial Statements for the year ended 31 December 2016
Collateralheldagainstfinancialguaranteesandloancommit-ments typically includes securities and letters of credit. For further information about the collateral and credit enhancements held against financial guarantees and loan commitments refer toNote 36 – Guarantees and Commitments.
For further information on collateral held as security that the CSi group is permitted to sell or repledge refer to Note 39 – Assets Pledged or Assigned.
If collateral or the credit enhancement value for a particular instrument is in excess of the maximum exposure then the value of collateral and other credit enhancements included in the table has been limited to the maximum exposure to credit risk.
Risk MitigationCSi actively manages its credit exposure utilising credit hedges and monetiseable collateral (cash and marketable securities).
Credit hedges represent the notional exposure that has been transferred to other market counterparties generally through the use of credit default swaps. CSi also actively enters into collateral arrangements for OTC derivatives and other traded products which allow it to limit the counterparty exposure risk associated with these products. Collateral taken generally represents cash or gov-ernment securities although other securities may be accepted. The valueofcollateralreflectedasariskmitigantisnetofanappropri-ate haircut. Collateral securing loan transactions includes:p Financial collateral pledged against loans collateralised by
securities (mostly cash and marketable securities); and p Physical collateral (real estate property for mortgages, mainly
retail residential, but alsomulti-familybuildings,officesandcommercial properties); and
p Other types of lending collateral such as accounts receivable, inventory and plant and equipment.
Counterparty exposure before collateral by rating
2016 2015
USD million % USD million %
AAA 938 2 2,495 4
AA+ to AA- 12,375 23 14,357 21
A+ to A- 20,301 36 25,130 37
BBB+ to BBB- 13,790 25 15,883 23
BB+ to BB- 3,722 7 5,932 9
B+ and below 3,802 7 4,158 6
54,928 100 67,955 100
Unsecured exposure by rating (including provisions)
2016 2015
USD million % USD million %
AAA 476 2 718 2
AA+ to AA- 5,407 23 8,169 27
A+ to A- 11,056 47 12,779 43
BBB+ to BBB- 3,777 16 5,133 17
BB+ to BB- 752 3 780 3
B+ and below 2,170 9 2,362 8
23,638 100 29,941 100
The above tables include all loans, commitments, derivatives, securi-ties purchased and sold under repurchase and resale agreements, and short term cash trades on a net counterparty exposure basis for the Bank as most of the trading portfolio mainly resides in the Bank.
Thefirst table representsmark tomarketexposuresbeforeoffsetting any eligible collateral held; the second table represents mark to market exposures after offsetting collateral.
Wrong-way riskWrong-way exposuresIn a wrong-way trading situation, the Bank’s exposure to the coun-terpartyincreaseswhilethecounterparty’sfinancialhealthandits
ability to pay on the transaction diminishes. Capturing wrong-way risk requires the establishment of basic assumptions regarding correlations within a given trading product. The Bank has multiple processes that allow us to capture and estimate wrong-way risk.
Credit approval and reviewsA primary responsibility of Credit Risk Management (‘CRM’) is the approval of new counterparty trading relationships and the subse-quent on-going review of the creditworthiness of the client. Part of the review and approval process involves the consideration of the motivation of the client and the directional nature of the trading in which the client is engaged. Credit limits are sized to the level of

132
FrameworkdefinesQuantitativeand QualitativeSpecificand General Wrong Way Risk Processes
Anautomatedlogicflagsandtreats legal connection. Correlation based processes require feedback from CRMofficers
Trade and Collateral Processes definedwithintheFramework
Specific Wrong Way Risk
Legal Connection
Material Positive
Correlation
Trade TradeCollateral Collateral
General Wrong Way Risk
Wrong Way Risk
comforttheCRMofficerhaswiththestrategyofthecounterparty,the levelofdisclosureoffinancial informationandtheamountofrisk mitigation that is present in the trading relationship (e.g. level of collateral).
Exposure adjusted risk calculationWrong way risk can arise from different business relationships.
An exposure methodology based on jump to default assumptions, ineligibility of collateral or scenario-based add-ons is in place to identify and adjust exposures for all wrong-way risk types as per the distinction in the table below.
With respect to general wrong-way risk, a scenario-based expo-sureadd-onisappliedtothosecounterpartiesidentifiedfollowingthequantitativeandqualitativereviewfromCreditOfficerswheretheBaselIIIexposureisnotdeemedsufficienttocapturetheaddi-tional risk fully.
Wrong-way risk monitoringRegular reporting of wrong-way risk at both the individual trade and portfolio level allows wrong-way risk to be monitored and cor-rective action taken by CRM in the case of heightened concern. Transactions containing wrong-way risk due to legal connection areautomaticallyflaggedandincludedinregularreporting.Gen-eralWrongwayrisk(‘WWR’)andtransactionscontainingspecificwrong-wayriskduetocorrelationareflaggedtoCRMofficersforconfirmationand then included into regular reporting. Theout-comeof theWWR identificationprocess is subject tomonthlyreview from the UK CRM management team via a regular forum.
Settlement RiskSettlement risk arises whenever the settlement of a transaction results in timing differences between the disbursement of cash or securities and the receipt of counter-value from the counterparty. This risk arises whenever transactions settle on a ‘free of pay-ment’ basis and is especially relevant when operating across time zones.
In those instances where market convention and/or products preclude a value-for-value exchange, the CSi group manages its riskthroughconfirmationandaffirmationoftransactiondetailswithcounterparties. In order to reduce gross settlement risk, the CSi group leverages Clearing Houses, Central Counterparties and CentralSettlementservicesandwillalsonetgrosscashflowswitha given counterparty where possible. CSi group proactively seeks to manage the timing of settlement instructions to agents and the reconciliation of incoming payments in order to reduce the window of exposure. In addition, CRM establishes and monitors limits to control the amount of settlement risk incurred to each counterparty.
v) Country RiskCountry risk is the risk of a substantial, systemic loss of value in thefinancialassetsofacountryorgroupofcountries,whichmaybe caused by dislocations in the credit, equity and/or currency markets. CSi CRM has incorporated country limits into its Credit Risk Appetite Framework in order to mitigate this risk in CSi.
For CSi, country limits are set for both developed and emerg-ing markets, based on a potential future exposure view and on a scenario view respectively. Upon CSi CRM recommendation, max-imum appetite and operational limits are calibrated and approved by the CSi RMC on an annual basis or, if warranted by a funda-mental change in strategy or market conditions, more frequently.
133Credit Suisse International, Annual Report 2016
Notes to the Financial Statements for the year ended 31 December 2016
The measurement of exposures against country limits is reported weekly to CSi CRM dedicated teams and senior management. FrontOfficerepresentativesareresponsibleforensuringlimitsarerespected and any breach is promptly managed. CRM provide independent oversight to ensure that businesses operate within their limits. During the course of the year, reserves are available to CSi CCO and the CSi CRO in case a temporary or permanent limit increase isneededand justified froma risk/returnperspective.Morefundamentalchangestothecountryriskprofileofthefirmnecessitate discussions and approval at the CSi RMC.
vi) Legal and Regulatory RiskTheCSgroupfacessignificantlegalrisksinitsbusinesses.Legalrisks include, among other things, disputes over the terms of trades and other transactions in which the CS group acts as prin-cipal; the unenforceability or inadequacy of the documentation used to give effect to transactions in which the CS group partici-pates; investment suitability concerns; compliance with the laws and regulations (including change in laws or regulations) of the many countries in which the CS group does business; and dis-putes with its employees. Some of these transactions or disputes result in potential or actual litigation that the CS group must incur legal expenses to defend.
The CS group seeks to minimise legal risk through the adop-tion of compliance and other policies and procedures, continuing torefinecontrolsoverbusinesspracticesandbehavior,employeetraining sessions, the use of appropriate legal documentation, and the involvement of the General Counsel and Compliance depart-ment, and outside legal counsel and other external specialists. In addition, the CS group is an active participant in a number of key industry and other professional market forums including Interna-tional Swaps and Derivatives Association (‘ISDA’), Association for Financial Markets in Europe (‘AFME’) and British Bankers’ Associ-ation (‘BBA’) which inter alia focus on improving levels of market andproductstandardisation,legaldefinitionandprotocol.
Asaparticipantinthefinancialservicesindustry,theCSgroupis subject to extensive regulation by governmental agencies, supervisory authorities and self-regulatory organisations around the world. Such regulation is increasingly more extensive and com-plex and, in recent years, costs related to our compliance with these requirements and the penalties and fines sought andimposedonthefinancialservicesindustrybyregulatoryauthoritieshaveall increasedsignificantlyandmay increase further.Theseregulations often serve to limit activities, including through the application of increased capital, leverage and liquidity require-ments, customer protection and market conduct regulations and direct or indirect restrictions on the businesses in which the CSi group may operate. Such limitations can have a negative effect on the CSi group’s business and ability to implement strategic initia-tives. To the extent that disinvestment is required from certain businesses, losses could be incurred, as the CSi group may be forced to sell such businesses at a discount, which in certain instances could be substantial, as a result of both the constrained timingofsuchsalesandthepossibilitythatotherfinancialinstitu-tions are liquidating similar investments at the same time.
Thefinancialservicesindustrycontinuestobeaffectedbythesignificantcomplexityofon-going regulatory reforms,alongside
more recently, the potential impact of Brexit. Changes in laws, rules or regulations, or in their interpretation or enforcement, or the implementation of new laws, rules or regulations, may adversely affect the results of operations.
vii) Operational RiskDefinitionOperationalriskistheriskoffinanciallossarisingfrominadequateor failed internal processes, people or systems, or from external events.
Sources of operational riskOperational risk is inherent in most aspects of our business, includ-ing the systems and processes that support our activities. It com-prises a large number of disparate risks that can manifest in a variety of ways. Particularly relevant examples of operational risk include the risk of fraudulent transactions, trade processing errors, business disruptions, failures in regulatory compliance, defective transactions, and unauthorised trading events. Operational risk can arise from human error, inappropriate conduct, failures in sys-tems, processes and controls, or natural and man-made disasters.
Evaluation and management of operational riskOperational risk frameworkThe diverse nature and wide extent of operational risk makes it inherentlydifficulttomeasure.CSibelievesthateffectivemanage-ment of operational risk requires a common operational risk frame-work that focuseson theearly identification, recording,assess-ment, monitoring, prevention and mitigation of operational risks, as well as timely and meaningful management reporting. CSi started to introduce our current operational risk framework in 2013, which improved the integration of previously separate operational risk processes, providing a more coherent approach to managing all aspects of the operational risk landscape. Over the past three years, CSi has redesigned the framework, introducing new com-ponents and upgrading existing components with a particular focus on ensuring that the components work well together.
The operational risk framework provides a structured approach to managing operational risk. It seeks to apply consistent stan-dards and techniques for evaluating risks while providing individual businesseswithsufficientflexibilitytotailorspecificcomponentstoreflecttherisksthattheyrun.Themaincomponentsoftheopera-tional risk framework are described below: p Governance and policies: The operational risk framework relies
on an effective governance process that establishes clear roles and responsibilities for managing operational risk and definesappropriateescalationprocesses foroutcomes thatare outside expected levels. CSi utilises a comprehensive set of policies and procedures that set out how employees are expected to conduct their activities.
p Operational risk appetite: This determines our approach to risk-taking and articulates the motivations for taking, accept-ing or avoiding certain types of risks or exposures. Senior CSi management expresses their risk appetite in terms of quantita-tive tolerance levels that apply to operational risk incidents and qualitative statements covering outcomes that should be

134
avoided.TheydefinetheirriskappetitewiththeCSiBoardandrelevant risk management committees in agreement with the operational risk management function.
p Operational risk register: The register comprises a catalog of inherent operational risks arising as a consequence of our business activities. It provides a consistent approach for classi-fying operational risks which ensures that they are treated con-sistently by other operational risk framework components using the appropriate processes and tools.
p Internal control assessment: CSi utilises a comprehensive set of internal controls that are designed to ensure that CSi’s activities follow agreed policies and that processes operate as intended. Certain key controls are subject to independent test-ing to evaluate their effectiveness. The results of these tests are considered by other operational risk framework compo-nents, such as in the risk and control self-assessment (‘RCSA’) process.
p Risk and control indicators: These are metrics that are used to monitor particular operational risks and controls over time. Theyareassociatedwith thresholds that defineacceptableperformance and provide early warning signals about potential issues.
p Incident data: CSi systematically collects, analyses and reports data on operational risk incidents to ensure that CSi under-stands the reasons why they occurred and how controls can be improved to reduce the risk of future incidents. CSi focus’ on both incidents that result in economic losses and events that provide information on potential control gaps, even if no losses occurred. CSi also collects and utilises available data on incidentsat relevantpeerfirmsto identifypotential risks thatmay be relevant in the future, even if they have not impacted the CSi group.
p Risk and control self-assessments: RCSA’s are comprehen-sive, bottom-up assessments of the key operational risks in each business and control function. They comprise a self-as-sessment that covers the inherent risks of each business and control function, an evaluation of the effectiveness of the con-trols in place to mitigate these risks and a decision to either accept or remediate any residual risks. The self-assessments are subject to quality assurance by the operational risk man-agement function to ensure that they have been conducted appropriately. RCSA’s utilise other components of the opera-tional risk framework, such as risk and control indicators and incident data, and they generate outputs that are used to man-age and monitor risks.
p Top operational risks and remediation plans: A set of top oper-ationalrisksareusedtohighlightthemostsignificantriskstosenior management, along with associated risk remediation efforts. Top operational risks are generated using both a top-down assessment by senior management and a bottom-up process that collates the main themes arising from the RCSA process.
p Reporting: CSi produces a wide range of regular management information reports covering the key inputs and outputs of the operational risk framework. These reports are used by senior management to monitor outcomes against agreed targets and tolerance levels.
p Responses framework: This provides a structured approach to responding to operational risk incidents and reaches of opera-tional risk appetite. The incident management component includesadefinedprocessforidentifying,categorising,inves-tigating, escalating and remediating incidents. CSi conducts detailedinvestigationsorsignificantoperationalriskincidents.These investigations seek to assess the causes of control fail-ings, establish appropriate remediation actions and ascertain whether events have implications for other businesses. They can result in recommendations to impose restrictions on busi-nesses while risk management processes and controls are improved. The breach component provides a methodology for evaluating breaches of quantitative and qualitative operational risk appetite statements. Its goal is to provide senior manage-ment with the information needed to make decisions on how best to remediate issues that fall outside agreed risk appetite levels.
p Scenarios and capital modelling: Scenarios are used to identify and measure exposure to a range of adverse events, such as unauthorised trading. These scenarios help businesses assess the suitability of controls in the light of potential losses. Regu-latory capital is determined using the Business Indicator Approach and supplemented by scenario analysis. The capital requirements are allocated to individual businesses for perfor-mance measurement purposes and to incentivise appropriate management actions.
p Conduct and behaviour: Recognising that effective operational risk management relies on employees conducting themselves appropriately, several operational risk framework components include assessments of behaviour. For example, investigations of incidents typically consider whether employees escalated issues at an appropriately early stage. Risks that have implica-tionsforconduct riskcanbe identifiedandassessedvia theoperational risk register and the RCSA process.
In addition to managing and mitigating operational risks under the operational risk framework through business- and risk-related pro-cesses and organisation, CSi also transfers the risk of potential loss from certain operational risks to third-party insurance compa-nies, where appropriate.
Developments in 2016CSi is continuously enhancing the operational risk management practices through an ongoing program to roll out improvements to each of the components of the operational risk framework and to ensure that the links between individual components work effec-tively. Potential enhancements are typically tested in one area to check that theydeliver the intendedbenefitsbeforebeing rolledout more broadly.
Maintaining the effectiveness of the CSi control environment is critical to ensuring that operational risks remain within acceptable levels. In 2016, we made improvements to our approaches to cat-aloging, documenting and evaluating key controls, which will pro-vide more robust and supportable control assessments for use in theRCSAprocess.ThisworknowformsasignificantpartoftheEnterprise Risk and Control Framework that was launched in 2016 which focuses on introducing a systematic control activities

135Credit Suisse International, Annual Report 2016
Notes to the Financial Statements for the year ended 31 December 2016
framework that applies consistent standards and approaches to relevant business activities. This is a multi-year initiative that starts with themost significant controls and rolls out newprocessesusing a phased approach.
CSi has continued to make progress in embedding assess-ments of employee behaviour in the risk assessment framework. In 2016, the business conduct behaviours continued to be reference in a number of HR processes, including recruitment, induction, performance assessment, promotion, and compensation. CSi also introduced enhanced risk indicator reporting covering behaviour and conduct-related matters.
Operational risk governanceEach individual business area takes responsibility for its opera-tional risks and the provision of adequate resources and proce-dures for the management of those risks. Businesses are sup-ported by designated operational risk teams who are responsible for the implementation of the operational risk management frame-work, methodologies, tools and reporting within their areas as well as working with management on any operational risk issues that arise. Businesses and relevant control functions meet regularly to discuss operational risk issues and identify required actions to mit-igate risks.
The operational risk management function is responsible for the overall design of the operational risk management framework, for operational risk capital modeling and for providing assistance and challenge to business line operational risk teams. It ensures the cohesiveness of policies, tools and practices for operational riskmanagement, specificallywith regard to the identification,evaluation, mitigation, monitoring and reporting of relevant CSi operational risks.
Operational risk exposures, metrics, issues and remediation efforts are discussed at the CSi Board and Board Risk with stand-ing updates to the CSi Risk Management committee and CSi Operational Risk Management committee which have senior staff representatives from all the relevant functions.
viii) Conduct RiskConduct risk is the risk that poor conduct by the CS group, employees or representatives could result in clients not receiving a fairtransaction,damagetotheintegrityofthefinancialmarketsorthewiderfinancialsystem,or ineffectivecompetition in themar-kets in which we operate that disadvantages clients.
Conduct risk may arise from a variety of sources, including unauthorised trading, the potential unsuitability of products sold or advice provided to clients, inadequate disclosure, trade processing errors, inaccurate benchmark submissions, failure to safeguard client data or assets, and breaches of regulatory rules or laws by individual employees or market conduct.
Conduct risk is being further embedded into the RCSA pro-cess within the operational risk framework, which considers the
risks generated by each business and the strength of the associ-ated mitigating controls. Conduct risk is also assessed by review-ingpastincidentsandthosefromotherfirmsinthefinancialser-vices sector.
Conduct risk isprimarilyaddressed throughspecificsupervi-sory controls implemented across CSi and targeted training activi-ties. CSi seeks to promote good behaviour and conduct through the Code of Conduct, which provides a clear statement of the ethical values and professional standards as a basis for maintain-ing and strengthening our reputation for integrity, fair dealing and measured risk-taking, and the set of business conduct behaviours. The Code of Conduct and the set of business conduct behaviours are linked to the employee performance assessment and compen-sation processes.
ix) Reputational RiskThe Credit Suisse (‘CS’) Code of Conduct states that “Our most valuable asset is our reputation”. CS reputation is driven by the perception of clients, shareholders, the media and the public. The CS Global Policy on Reputational Risk (‘the Policy’) states that each employee is responsible for assessing the potential reputa-tional impact of all businesses in which they engage, and for deter-mining whether any actions or transactions should be formally sub-mitted through the Reputational Risk Review Process (‘RRRP’) for review.
Reputational risk may arise from a variety of sources, including, but not limited to, the nature or purpose of a proposed transaction, the identity or nature of a potential client, the regulatory or political climateinwhichthebusinesswillbetransactedorsignificantpub-lic attention surrounding the transaction itself.
The CSi Board has formally delegated reputational risk issues to CS group’s global RRRP which includes an overview of the transactionoractionbeingconsidered,therisksidentifiedandanymitigating factors and views from internal subject matter experts. All formal submissions in the RRRP require review by senior busi-ness management in the relevant division, and are then subse-quently referred to one of CS group’s Reputational Risk Approvers (‘RRA’), each of whom is independent of the business divisions and has the authority to approve, reject, or impose conditions on CS group’s participation. If the RRA considers there to be a mate-rial reputational risk associated with a submission, it is escalated to the EMEA Reputational Risk Committee (‘the Committee’) for fur-therdiscussion,reviewandfinaldecision.TheCommitteeiscom-prised of senior regional, divisional, shared services and CSi entity management.
Reputational risk is assessed on an entity based approach whereby the region of the RRRP submission is driven by the loca-tion of the booking entity. Where a submission relates to a Remote Booking, a submission will be made through to EMEA RRRP and the RRAs in other regions will be consulted as appropriate, which may include escalation to the Committee.

136
42 Offsetting of Financial Assets and Financial Liabilities
The disclosures set out in the tables below include derivative instruments, reverse repurchase and repurchase agreements, securities lending and borrowing transactions, and other assets and liabilities that:p are offset in the CSi group’s Consolidated Statement of Finan-
cial Position; orp are subject to an enforceable master netting agreement or
similar agreement (enforceable master netting agreements), irrespective of whether they are offset in the CSi group’s Con-solidated Statement of Financial Position.
Similar agreements include derivative clearing agreements, global master repurchase agreements, global master securities lending agreements,andanyrelatedrightstofinancialcollateral.
Financial instruments such as loans and deposits are not dis-closed in the tables below. They are not offset in the Consolidated Statement of Financial Position.
DerivativesThe CSi group transacts bilateral OTC derivatives (OTC derivatives) mainly under International Swaps and Derivatives Association (ISDA) Master Agreements. These agreements provide for the net settlement of all transactions under the agreement through a sin-gle payment in the event of default or termination under the agreement.
The above ISDA Master Agreements do not meet the criteria for offsetting in the Statement of Financial Position. This is because they create a right of set-off of recognised amounts that is enforceable only following an event of default, insolvency or bankruptcy of the CSi group or the counterparties or following other predetermined events. In addition CSi group and its counter-parties do not intend to settle on a net basis or to realise the assets and settle the liabilities simultaneously.
Collateral for OTC derivatives is received and provided in the form of cash and marketable securities. Such collateral may be subject to the standard industry terms of an ISDA Credit Support Annex. The terms of an ISDA Credit Support Annex provide that securities received or provided as collateral may be pledged or sold during the term of the transactions and must be returned upon maturity of the transaction. These terms also give each counter-party the right to terminate the related transactions upon the other counterparty’s failure to post collateral. Financial collateral received or pledged for OTC derivatives may also be subject to collateralagreementswhichrestricttheuseoffinancialcollateral.
For exchange-traded derivatives and OTC-cleared derivatives, positive and negative replacement values and related cash collat-eral are offset if the terms of the rules and regulations governing these exchanges and central clearing counterparties permit such netting and offset because the CSi group:(a) currently has a legally enforceable right to set off the rec-
ognised amounts; and(b) intends either to settle on a net basis, or to realise the asset
and settle the liability simultaneously.To meet criterion (a), the right of set-off:p must not be contingent on a future event; andp must be legally enforceable in all of the following
circumstances: (i) the normal course of business; (ii) the event of default; and (iii) the event of insolvency or bankruptcy of the entity
and all of the counterparties.
Criterion (b) may only be met, if – depending on the settlement mechanism – certain criteria are met (e.g. derivatives with the same currency).
Where no such agreements exist, fair values are recorded on a gross basis.
Exchange traded derivatives or OTC cleared derivatives that are fully margined and for which the daily margin payment consti-tute settlement of the outstanding exposure are not included in the offsetting disclosures because they are not subject to offsetting due to daily settlement. The daily margin payments which are unsettled until the next settlement cycle is conducted are pre-sented in brokerage receivables or brokerage payables.
Under IFRS, the CSi group has elected to account for sub-stantiallyallfinancialinstrumentswithanembeddedderivativethatis not considered closely related to the host contract at fair value. Wherethesehybridfinancialinstrumentsaresubjecttoanenforce-able master netting agreement or similar agreement, they are included in the tables Note 42- Offsetting of Financial Assets and Financial Liabilities.
The following table presents the gross amount of derivative instruments subject to enforceable master netting agreements, the amount of offsetting, the amount of derivatives not subject to enforceable master netting agreements and the net amount pre-sented in the Consolidated Statement of Financial Position.

137Credit Suisse International, Annual Report 2016
Notes to the Financial Statements for the year ended 31 December 2016
Offsetting of derivative instruments
(USD millions) 2016 2015
Group Gross Offsetting Net Gross Offsetting Net
Derivative Assets
Derivative instruments subject to enforceable master netting agreements 215,066 (7,169) 207,897 266,644 (5,831) 260,813
Derivative instruments not subject to enforceable master netting agreements 1 2,201 – 2,201 1,885 – 1,885
Total derivative instruments presented
in the Consolidated Statement of Financial Position 217,267 (7,169) 210,098 268,529 (5,831) 262,698
ofwhichrecordedintradingfinancialassetsatfairvaluethroughprofitorloss 217,267 (7,169) 210,098 268,529 (5,831) 262,698
Derivative Liabilities
Derivative instruments subject to enforceable master netting agreements 215,414 (6,897) 208,517 269,621 (5,596) 264,025
Derivative instruments not subject to enforceable master netting agreements 1 2,071 – 2,071 2,971 – 2,971
Total derivative instruments presented
in the Consolidated Statement of Financial Position 217,485 (6,897) 210,588 272,592 (5,596) 266,996
ofwhichrecordedintradingfinancialliabilitiesatfairvaluethroughprofitorloss 217,485 (6,897) 210,588 272,592 (5,596) 266,996
1 Represents derivative instruments where a legal opinion supporting the enforceability of netting in the event of default or termination under the agreement is not in place.
(USD millions) 2016 2015
Bank Gross Offsetting Net Gross Offsetting Net
Derivative Assets
Derivative instruments subject to enforceable master netting agreements 215,066 (7,169) 207,897 266,644 (5,831) 260,813
Derivative instruments not subject to enforceable master netting agreements 1 2,201 – 2,201 1,903 – 1,903
Total derivative instruments presented in the Statement of Financial Position 217,267 (7,169) 210,098 268,547 (5,831) 262,716
ofwhichrecordedintradingfinancialassetsatfairvaluethroughprofitorloss 217,267 (7,169) 210,098 268,547 (5,831) 262,716
Derivative Liabilities
Derivative instruments subject to enforceable master netting agreements 215,414 (6,897) 208,517 269,621 (5,596) 264,025
Derivative instruments not subject to enforceable master netting agreements 1 2,079 – 2,079 2,979 – 2,979
Total derivative instruments presented in the Statement of Financial Position 217,493 (6,897) 210,596 272,600 (5,596) 267,004
ofwhichrecordedintradingfinancialliabilitiesatfairvaluethroughprofitorloss 217,493 (6,897) 210,596 272,600 (5,596) 267,004
1 Represents derivative instruments where a legal opinion supporting the enforceability of netting in the event of default or termination under the agreement is not in place.
Reverse repurchase and repurchase agreements and securities lending and borrowing transactionsReverse repurchase and repurchase agreements are generally covered by global master repurchase agreements. In certain situ-ations, for example in the event of default, all contracts under the agreements are terminated and are settled net in one single pay-ment. Global master repurchase agreements also include pay-ment or settlement netting provisions in the normal course of busi-ness that state that all amounts in the same currency payable by each party to the other under any transaction or otherwise under the global master repurchase agreement on the same date shall be set off.
Bilateral reverse repurchase and repurchase transactions are netted in the Consolidated Statement of Financial Position if the global master repurchase agreements permit such netting and off-set because CSi group:(a) currently has a legally enforceable right to set off the rec-
ognised amounts; and(b) intends either to settle on a net basis, or to realise the asset
and settle the liability simultaneously.
The net settlement criterion in (b) will also be met, if the CSi group can settle amounts in a manner such that the outcome is, in effect, equivalent to net settlement. This will occur if, and only if, the gross
settlement mechanism has features that eliminate or result in insignificantcreditand liquidity risk,andthatwillprocessreceiv-ables and payables in a single settlement process or cycle.
The amounts offset are measured on the same basis as the underlying transaction (i.e., on an accrual basis or fair value basis).
Securities lending and borrowing transactions are generally executed under global master securities lending agreements with netting terms similar to ISDA Master Agreements. In certain situ-ations, for example in the event of default, all contracts under the agreement are terminated and are settled net in one single pay-ment. Transactions under these similar agreements are not netted in the Consolidated Statement of Financial Positions because most securities lending and borrowing transactions do not meet thecriterionofhavingthesamesettlementdatespecifiedatincep-tion of the transaction, and therefore they are not eligible for net-ting in the Consolidated Statement of Financial Positions apart from the other conditions to be met for netting.
Reverse repurchase and repurchase agreements are collater-alised principally by government securities, money market instru-ments and corporate bonds and have terms ranging from overnight toalongerorunspecifiedperiodoftime.Intheeventofcounter-party default, the reverse repurchase agreement or securities lending agreement provides CSi group with the right to liquidate the collateral held. As is the case in CSi group’s normal course of
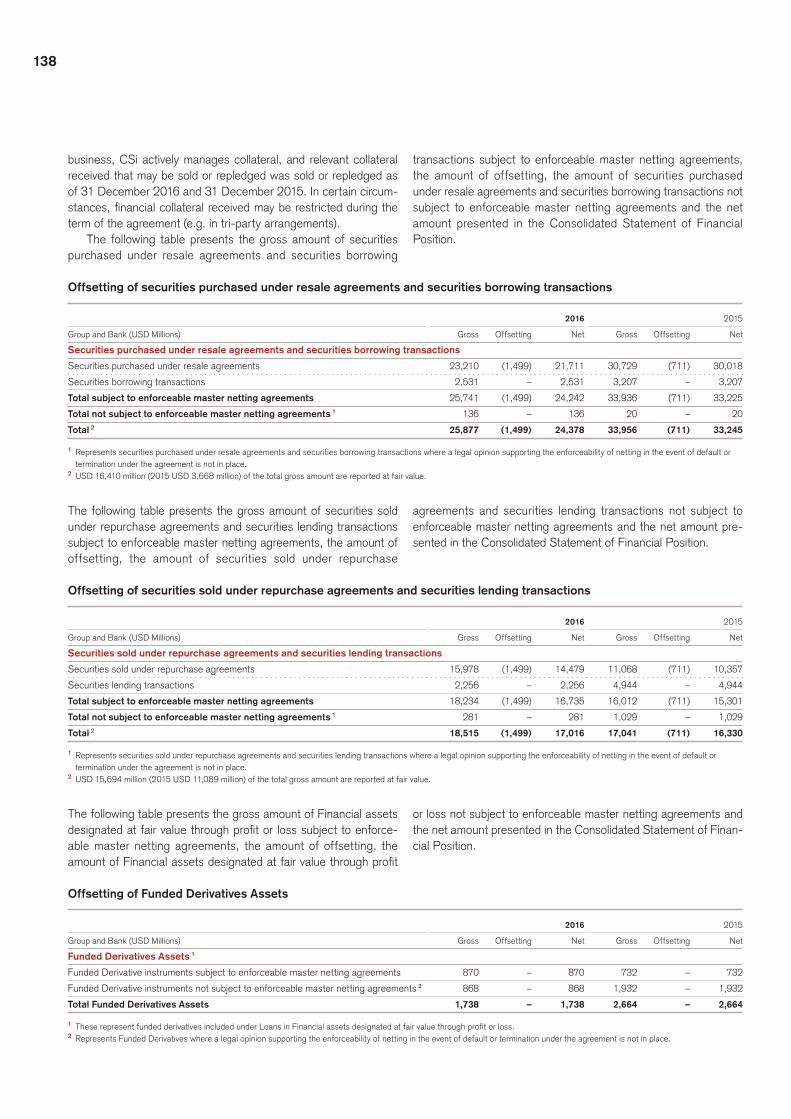
138
business, CSi actively manages collateral, and relevant collateral received that may be sold or repledged was sold or repledged as of 31 December 2016 and 31 December 2015. In certain circum-stances,financialcollateralreceivedmayberestrictedduringtheterm of the agreement (e.g. in tri-party arrangements).
The following table presents the gross amount of securities purchased under resale agreements and securities borrowing
transactions subject to enforceable master netting agreements, the amount of offsetting, the amount of securities purchased under resale agreements and securities borrowing transactions not subject to enforceable master netting agreements and the net amount presented in the Consolidated Statement of Financial Position.
Offsetting of securities purchased under resale agreements and securities borrowing transactions
2016 2015
Group and Bank (USD Millions) Gross Offsetting Net Gross Offsetting Net
Securities purchased under resale agreements and securities borrowing transactions
Securities purchased under resale agreements 23,210 (1,499) 21,711 30,729 (711) 30,018
Securities borrowing transactions 2,531 – 2,531 3,207 – 3,207
Total subject to enforceable master netting agreements 25,741 (1,499) 24,242 33,936 (711) 33,225
Total not subject to enforceable master netting agreements 1 136 – 136 20 – 20
Total 2 25,877 (1,499) 24,378 33,956 (711) 33,245
1 Represents securities purchased under resale agreements and securities borrowing transactions where a legal opinion supporting the enforceability of netting in the event of default or termination under the agreement is not in place.
2 USD 16,410 million (2015 USD 3,668 million) of the total gross amount are reported at fair value.
The following table presents the gross amount of securities sold under repurchase agreements and securities lending transactions subject to enforceable master netting agreements, the amount of offsetting, the amount of securities sold under repurchase
agreements and securities lending transactions not subject to enforceable master netting agreements and the net amount pre-sented in the Consolidated Statement of Financial Position.
Offsetting of securities sold under repurchase agreements and securities lending transactions
2016 2015
Group and Bank (USD Millions) Gross Offsetting Net Gross Offsetting Net
Securities sold under repurchase agreements and securities lending transactions
Securities sold under repurchase agreements 15,978 (1,499) 14,479 11,068 (711) 10,357
Securities lending transactions 2,256 – 2,256 4,944 – 4,944
Total subject to enforceable master netting agreements 18,234 (1,499) 16,735 16,012 (711) 15,301
Total not subject to enforceable master netting agreements 1 281 – 281 1,029 – 1,029
Total 2 18,515 (1,499) 17,016 17,041 (711) 16,330
1 Represents securities sold under repurchase agreements and securities lending transactions where a legal opinion supporting the enforceability of netting in the event of default or termination under the agreement is not in place.
2 USD 15,694 million (2015 USD 11,089 million) of the total gross amount are reported at fair value.
The following table presents the gross amount of Financial assets designatedatfairvaluethroughprofitorlosssubjecttoenforce-able master netting agreements, the amount of offsetting, the amountofFinancialassetsdesignatedatfairvaluethroughprofit
or loss not subject to enforceable master netting agreements and the net amount presented in the Consolidated Statement of Finan-cial Position.
Offsetting of Funded Derivatives Assets
2016 2015
Group and Bank (USD Millions) Gross Offsetting Net Gross Offsetting Net
Funded Derivatives Assets 1
Funded Derivative instruments subject to enforceable master netting agreements 870 – 870 732 – 732
Funded Derivative instruments not subject to enforceable master netting agreements 2 868 – 868 1,932 – 1,932
Total Funded Derivatives Assets 1,738 – 1,738 2,664 – 2,664
1 These represent funded derivatives included under Loans in Financial assets designated at fair value through profit or loss. 2 Represents Funded Derivatives where a legal opinion supporting the enforceability of netting in the event of default or termination under the agreement is not in place.

139Credit Suisse International, Annual Report 2016
Notes to the Financial Statements for the year ended 31 December 2016
The following table presents the gross amount of Financial liabilities designated at fair value through profit or loss subject to enforceable master netting agreements, the amount of offsetting, the amount of
Financial liabilities designated at fair value through profit or loss not subject to enforceable master netting agreements and the net amount presented in the Consolidated Statement of Financial Position.
Offsetting of Funded Derivatives Liabilities
2016 2015
Group and Bank (USD Millions) Gross Offsetting Net Gross Offsetting Net
Funded Derivatives Liabilities 1
Funded Derivative instruments subject to enforceable master netting agreements 1,913 (27) 1,886 2,251 (815) 1,436
Funded Derivative instruments not subject to enforceable master netting agreements 2 855 – 855 3,170 – 3,170
Total Funded Derivatives Liabilities 2,768 (27) 2,741 5,421 (815) 4,606
1 These represent funded derivatives included under structured notes in Financial liabilities designated at fair value through profit or loss. 2 Represents Funded Derivatives where a legal opinion supporting the enforceability of netting in the event of default or termination under the agreement is not in place.
The following table presents the net amount presented in the Consol-idated Statement of Financial Position of financial assets and liabili-ties subject to enforceable master netting agreements and the gross amount of financial instruments and cash collateral not offset in the Consolidated Statement of Financial Position. The gross amount of financial instruments not offset in the Consolidated Statement of Financial Position includes amounts related to recognised financial instruments that do not meet some or all of the offsetting criteria in
IAS 32.42 as well as non-cash financial collateral. The table excludes derivative instruments, reverse repurchase and repurchase agreements, securities lending and borrowing transactions and Financial assets and liabilities designated at fair value through profit or loss not subject to enforceable master netting agreements where a legal opinion supporting the enforceability of netting in the event of default or termination under the agreement is not in place. Net expo-sure reflects risk mitigation in the form of collateral.
Amounts not offset in the Consolidated Statement of Financial Position
2016 2015
Cash Cash collateral collateral Financial received/ Net Financial received/ Net Group and Bank (USD million) Net 1 instruments 2 pledged 2 exposure Net 1 instruments 2 pledged 2 exposure
Financial assets subject to enforceable master netting agreements
Derivative instruments 207,897 (175,552) (21,725) 10,620 260,813 (224,684) (21,526) 14,603
Securities purchased under resale agreements 21,711 (21,711) – – 30,018 (30,018) – –
Securities borrowing transactions 2,531 (2,531) – – 3,207 (2,997) – 210
Funded derivative assets 870 (536) – 334 732 (351) – 381
Total financial assets subject to
enforceable master netting agreements 233,009 (200,330) (21,725) 10,954 294,770 (258,050) (21,526) 15,194
Financial liabilities subject to enforceable master netting agreements
Derivative instruments 208,517 (173,842) (26,695) 7,980 264,025 (222,741) (30,095) 11,189
Securities sold under repurchase agreements 14,479 (14,479) – – 10,357 (10,357) – –
Securities lending transactions 2,256 (2,256) – – 4,944 (4,944) – –
Funded derivative liabilities 1,886 (1,219) – 667 1,436 (294) – 1,142
Total financial liabilities subject to
enforceable master netting agreements 227,138 (191,796) (26,695) 8,647 280,762 (238,336) (30,095) 12,331
1 Net amount presented in the Consolidated Statement of Financial Position and subject to enforceable master netting agreements, as per the preceding tables. 2 The total amount reported in financial instruments and cash collateral is limited to the net amount for the related instruments presented in the Consolidated Statement of Financial Position.
Net exposure is subject to further credit mitigation through the transfer of the exposure to other market counterparties by the general use of CDS’s. Therefore the net exposure presented in the
table above is not representative for the CSi group’s counterparty exposure.

140
43 Capital Adequacy
The Bank’s capital adequacy is managed and monitored based on practices developed by the Basel Committee on Banking Supervi-sion (the ‘Basel Committee’) and governed by European Union regulations as set by the European Banking Authority (‘EBA’). These are set out in the Capital Requirements Regulation (‘CRR’) and the Capital Requirements Directive (‘CRD’), collectively referred to as CRDIV.
TheCSgroupconsidersastrongandefficientcapitalpositionto be a priority. Consistent with this, the Bank closely monitors its capital position on a continuing basis to ensure ongoing stability and support of its business activities. This monitoring takes account of the requirements of the current regulatory regime and any forthcoming changes to the capital framework or to the Bank’s businessmodel.TheCSgroupcontinuestoprovideconfirmationthat it will ensure that the Bank is able to meet its debt obligations andmaintainasoundfinancialpositionovertheforeseeablefuture.
Multi-year business forecasts and capital plans are prepared by CSi, taking into account its business strategy and the impact of known regulatory changes. These plans are subjected to various stresstests,reflectingbothmacroeconomicandspecificrisksce-narios, as part of the ICAAP. Within these stress tests, potential management actions, that are consistent with both the market conditions implied by the stress test and the stress test outcome, are identified. The resultsof thesestress testsandassociatedmanagement actions are updated regularly, as part of the ICAAP, with results documented and reviewed by the Board of Directors.
The ICAAP then forms the basis for any SREP (‘Supervisory Review and Evaluation Process’) review that the PRA conducts when assessing an institution’s level of regulatory capital.
Own FundsOwn Own funds comprise a number of ‘tiers’. Tier 1 capital prin-cipally comprises shareholders’ equity (Common Equity Tier 1 (‘CET1’). This is supplemented by Tier 2 capital, which consists mainly of subordinated debt instruments. Total capital equals the sum of these with adjustments including regulatory deductions and prudentialfilters.
The Bank’s overall capital needs are reviewed to ensure that its own funds can appropriately support the anticipated needs of its businesses. The capital management framework is designed to ensurethatownfundsaresufficienttosupporttheunderlyingrisksof the business activity, to meet the objectives of management and to meet the requirements of regulators, rating agencies and mar-ket participants.
During 2016, USD 2 billion of Tier 2 subordinated debt was repaid to Credit Suisse PSL GmbH. In 2015 the Bank repatriated USD 750 million of share capital, received a capital injection of USD 13 million and repaid USD 263 million of Tier 2 subordinated debt. There was, however, a reorganisation within CET1 compris-ing the conversion of participating shares into ordinary shares in 2015.
Other movements in capital resources were as follows:
2016 2015
Regulatory capital less deductions (USD million)
Total regulatory capital less deductions at 1 January 28,956 30,352
Changes in Tier 1 instruments:
Capitalreduction – (737)
Changes in Tier 2 instruments:
Subordinateddebtrepaid (2,000) (263)
Net movement on Tier 2 capital 1 (2) (5)
Profit and loss and movements in other comprehensive income (179) (340)
Net movement in regulatory deductions and prudential filters (34) (51)
Total regulatory capital less deductions at 31 December 26,741 28,956
1 Net movement on Tier 2 capital includes a repayment, amortisation, currency translation and a general provision.
Under the Basel Committee guidelines, an institution must have a ratio of own funds to aggregate risk-weighted assets of at least 8%. In addition, the EBA requires a CET1 ratio of 4.5% and a Tier 1 ratio of 6% in 2016 (CET1 ratio of 4.5% and a Tier 1 ratio of 6% in2015). The riskweightedassets reflect the credit,market,operational and other risks of the Bank calculated using methodol-ogies set out in the CRR.
The Bank must at all times monitor and demonstrate compli-ance with the relevant own funds requirements of the CRR. The Bank has put in place processes and controls to monitor and man-age its own funds and no breaches were reported to the PRA during the year.
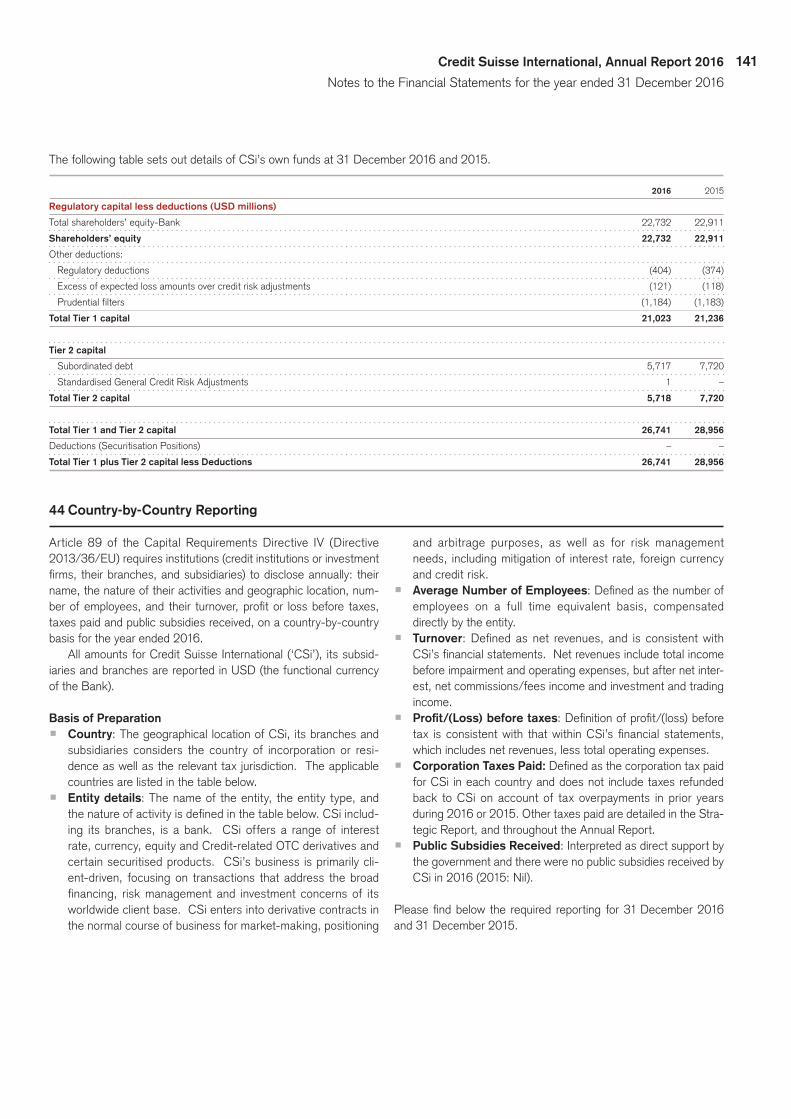
141Credit Suisse International, Annual Report 2016
Notes to the Financial Statements for the year ended 31 December 2016
ThefollowingtablesetsoutdetailsofCSi’sownfundsat31 December2016and2015.
2016 2015
Regulatory capital less deductions (USD millions)
Total shareholders’ equity-Bank 22,732 22,911
Shareholders’ equity 22,732 22,911
Other deductions:
Regulatorydeductions (404) (374)
Excessofexpectedlossamountsovercreditriskadjustments (121) (118)
Prudentialfilters (1,184) (1,183)
Total Tier 1 capital 21,023 21,236
Tier 2 capital
Subordinateddebt 5,717 7,720
StandardisedGeneralCreditRiskAdjustments 1 –
Total Tier 2 capital 5,718 7,720
Total Tier 1 and Tier 2 capital 26,741 28,956
Deductions (Securitisation Positions) – –
Total Tier 1 plus Tier 2 capital less Deductions 26,741 28,956
44 Country-by-Country Reporting
Article 89 of the Capital Requirements Directive IV (Directive 2013/36/EU) requires institutions (credit institutions or investment firms,theirbranches,andsubsidiaries)todiscloseannually: theirname, the nature of their activities and geographic location, num-berofemployees,and their turnover,profitor lossbefore taxes,taxes paid and public subsidies received, on a country-by-country basis for the year ended 2016.
All amounts for Credit Suisse International (‘CSi’), its subsid-iaries and branches are reported in USD (the functional currency of the Bank).
Basis of Preparationp Country: The geographical location of CSi, its branches and
subsidiaries considers the country of incorporation or resi-dence as well as the relevant tax jurisdiction. The applicable countries are listed in the table below.
p Entity details: The name of the entity, the entity type, and thenatureofactivityisdefinedinthetablebelow.CSiinclud-ing its branches, is a bank. CSi offers a range of interest rate, currency, equity and Credit-related OTC derivatives and certain securitised products. CSi’s business is primarily cli-ent-driven, focusing on transactions that address the broad financing, riskmanagementand investment concernsof itsworldwide client base. CSi enters into derivative contracts in the normal course of business for market-making, positioning
and arbitrage purposes, as well as for risk management needs, including mitigation of interest rate, foreign currency and credit risk.
p Average Number of Employees:Definedasthenumberofemployees on a full time equivalent basis, compensated directly by the entity.
p Turnover:Definedasnet revenues, and is consistentwithCSi’sfinancialstatements.Netrevenuesincludetotalincomebefore impairment and operating expenses, but after net inter-est, net commissions/fees income and investment and trading income.
p Profit/(Loss) before taxes:Definitionofprofit/(loss)beforetax is consistentwith thatwithinCSi’sfinancial statements,which includes net revenues, less total operating expenses.
p Corporation Taxes Paid: Definedasthecorporationtaxpaidfor CSi in each country and does not include taxes refunded back to CSi on account of tax overpayments in prior years during 2016 or 2015. Other taxes paid are detailed in the Stra-tegic Report, and throughout the Annual Report.
p Public Subsidies Received: Interpreted as direct support by the government and there were no public subsidies received by CSi in 2016 (2015: Nil).
Pleasefindbelow the required reporting for31December2016and 31 December 2015.

142
Country by Country Reporting for the year ended 31 December 2016
Public Parent, Average Profit/(Loss) Corporation Subsidies Subsidiary Number of Turnover before taxes Taxes Paid Received Name of Entity or Branch Nature of Activity Employees (USD million) (USD million) (USD million) 1 (USD million)
United Kingdom
Credit Suisse International Parent Bank 1,648 1,488 (206) – –
Ireland
Credit Suisse International, Dublin Branch Branch Bank branch 2 – (2) – –
Spain
Credit Suisse International,
Sucursal en Espana Branch Bank Branch 3 6 3 – –
Italy
Credit Suisse International, Italian Branch Branch Bank Branch 23 20 4 1 –
The Netherlands
Credit Suisse International, Amsterdam Branch Branch Bank Branch 14 8 2 – –
Sweden
Credit Suisse International, (UK)
Bank Sweden Branch (filial) Branch Bank Branch 4 4 1 – –
Credit Suisse International Consolidated 2 1,694 1,526 (198) 1 –
1 The Corporation taxes paid above do not include taxes refunded during 2016. Taxes refunded during 2016 for CSi amounted to USD 0.1 million.2 Variable Interest entities are not included in the above reporting. For a full list of other consolidated entities please refer Note 37 – Interest in Other Entities.
Although no Corporation Taxes were paid in the UK, CSi in- curred Bank Levy of USD 32 million, employees social security
of USD 82 million and irrecoverable UK value added tax of USD 13 million.
Country by Country Reporting for the year ended 31 December 2015
Public Parent, Average Profit/(Loss) Corporation Subsidies Subsidiary Number of Turnover before taxes Taxes Paid Received Name of Entity or Branch Nature of Activity Employees (USD million) (USD million) (USD million) 1 (USD million)
United Kingdom
Credit Suisse International Parent Bank 1,167 1,893 (78) – –
Ireland
Credit Suisse International, Dublin Branch Branch Bank branch 21 39 27 11 –
Spain
Credit Suisse International,
Sucursal en Espana Branch Bank Branch 6 5 (2) – –
Italy
Credit Suisse International, Italian Branch Branch Bank Branch 2 2 – – –
The Netherlands
Credit Suisse International, Amsterdam Branch Branch Bank Branch 1 – – – –
Sweden
Credit Suisse International, (UK)
Bank Sweden Branch (filial) Branch Bank Branch 4 3 – – –
Credit Suisse International Consolidated 2 1,201 1,942 (52) 11 –
1 The Corporation taxes paid above do not include taxes refunded during 2015. Taxes refunded during 2015 for CSi amounted to USD 1 million.2 Variable Interest entities are not included in the above reporting. For a full list of other consolidated entities please refer Note 37 – Interest in Other Entities.
Although no Corporation Taxes were paid in the UK, CSi in- curred Bank levy of USD 39 million, employees social security
of USD 71 million and irrecoverable UK value added tax of USD 12 million.

143Credit Suisse International, Annual Report 2016
Notes to the Financial Statements for the year ended 31 December 2016
45 Business Combinations
There were no business combinations in 2016. In 2015, the Bank acquired a number of businesses from a fellow CS group company, CSS(E)L.
The Listed Derivative and OTC clearing businesses (collec-tively the ‘Listed agency’ business) was acquired in September 2015, for a total purchase consideration of USD 52 million was paid in cash. The acquisition of Investment Banking Division busi-ness in London (‘investment banking’ business) was completed on 1 October 2015, for a total purchase consideration of USD 207 million paid in cash. In addition, branches relating to the invest-ment banking business located in Milan (USD 8.4 million consider-ation) and Amsterdam (USD 4.9 million consideration) were
transferred to newly established CSi branches on 1 December 2015 and such acquisitions were both settled with issuance of ordinary shares of CSi.
In accordance with CSi group’s accounting policy described underBasisof consolidation inNote2-SignificantAccountingPolicies, USD 272 million has been recorded as reduction in retained earnings as a result of the above transactions.
The acquisitions were part of a CS group wide legal entity sim-plificationprogram, thestrategicgoalsofwhichare to removeasignificantimpedimentforRecoveryandResolutionPlanningandimprove capital requirements for intergroup exposure under CRD IV.
46 CSi’s Subsidiaries and Associates
In accordance with Section 409 of the Companies Act 2006 a list of CSi’s subsidiaries and associates, the country of incorporation and the effective percentage of equity owned at 31 December 2016 is disclosed below.
Country Security Immediate Parent Ultimate Parent Total (%)
31 December 2016
Subsidiaries
AHL Investment Strategies PCC – Guernsey 2 EUR Class I1 shares AHL Investment Strategies SPC AHL Investment Strategies SPC 100
Class I1 AHL Global Futures 6 EUR Shares
AHL Investment Strategies PCC – Guernsey 2 EUR Participating shares AHL Investment Strategies SPC AHL Investment Strategies SPC 100
Class K1 AHL Global Futures 7 EUR Shares
AHL Investment Strategies PCC – Guernsey 2 EUR Class L1 shares AHL Investment Strategies SPC AHL Investment Strategies SPC 100
Class L1 AHL Global Futures 8 EUR Shares
AI3 Segregated Portfolio Cayman Islands 2 USD 100 Participating shares Xanthos SPC Xanthos SPC 100
Andrea Investments (Jersey) PCC – Jersey 2 EUR Preference shares Andrea Investments (Jersey) PCC Andrea Investments (Jersey) PCC 100
Cell Series 1000 EUR
Andrea Investments (Jersey) PCC – Jersey 2 USD Preference shares Andrea Investments (Jersey) PCC Andrea Investments (Jersey) PCC 100
Cell Series 1000 USD
Brevan Howard Multi-Manager Limited Cayman Islands 2 USD Class E shares Brevan Howard Multi-Manager Brevan Howard Multi-Manager 100
Master Fund Limited Master Fund Limited
Global Bond Fund Ireland, Republic of 2 USD Class 1 shares CSi Credit Suisse Group AG 100
Mistral SPC – Long/Short Equity Cayman Islands 2 Participating limited recourse CSi Credit Suisse Group AG 100
certificates
Simplon Capital Ltd. SPC – Cayman Islands 2 EUR 0.01 Participating shares FLP Direct Investments FLP Direct Investments 100
AlphAlgo Segregated Fund Portfolio
Xanthos Holding – Segregated Portfolio Cayman Islands 2 Participating limited recourse CSi Credit Suisse Group AG 100
certificates
YI Active Spezial ESPA Fund. Austria 2 EUR shares CSi Credit Suisse Group AG 100
HOLT Global Equity Fund Luxembourg 2 USD,EUR & CHF 100 Class CSi Credit Suisse Group AG 90
R1CS, USD 100 Class I2C1
and EUR 100 Class I2CE
shares
LHI Mid Market Buy-Out Europe LP Guernsey 2 EUR shares CSi Credit Suisse Group AG 80
Ajanta Limited Gibraltar 2 No shares CSi Credit Suisse Group AG – 1
Andrea Investments (Jersey) PCC Jersey 2 No shares CSi Credit Suisse Group AG – 1
Andrea Investments (Jersey) PCC – Jersey 2 No shares Andrea Investments (Jersey) PCC Andrea Investments (Jersey) PCC – 1
Cell Series 1000 PCC
Argentum Capital Series 2015-5 Luxembourg 2 No shares Argentum Capital S.A. Argentum Capital S.A. – 1
Arundel (International) Limited Gibraltar 2 No shares CSi Credit Suisse Group AG – 1
Bellingham Properties Limited Gibraltar 2 No shares CSi Credit Suisse Group AG – 1
Boats Investments (Jersey) Ltd Series Jersey 2 No shares Boats Investments (Jersey) Boats Investments (Jersey) – 1
532,546, 548,551,557,561,562,564,565 Limited (Master Vehicle) Limited (Master Vehicle)
Boats Investments (Jersey) Ltd Series Jersey 2 No shares Boats Investments (Jersey) Boats Investments (Jersey) – 1
567,568,569,570,571,572,575,576, Limited (Master Vehicle) Limited (Master Vehicle)
577, 578,579,582,584,585,586,587,
588,589,590

144
Country Security Immediate Parent Ultimate Parent Total (%)
31 December 2016
Subsidiaries
Bondstreet 2 GmbH Germany 2 No shares CSi Credit Suisse Group AG – 1
CARMF Alternative 1 France 2 No shares FLP Direct Investments FLP Direct Investments – 1
Carmil Properties Limited Gibraltar 2 No shares CSi Credit Suisse Group AG – 1
Cepheus Holdings Limited Gibraltar 2 No shares CSi Credit Suisse Group AG – 1
Coxaro Holdings Limited Cyprus 2 No shares AK Bars Bank AK Bars Bank – 1
Credit Suisse Backwardation Fund Ireland, Republic of 2 No shares CSi Credit Suisse Group AG – 1
Credit Suisse Bond Fund Ireland, Republic of 2 No shares Credit Suisse Bond Fund Credit Suisse Bond Fund – 1
Management Company SA Management Company SA
Credit Suisse Global Carry selector Fund II Ireland, Republic of 2 No shares CSi Credit Suisse Group AG – 1
Culross Global SPC Limited – British Virgin Islands 2 No shares Culross Global SPC Limited Culross Global SPC Limited – 1
Culross UCITS Index Segregated Portfolio
Custom Markets QIF PLC Ireland, Republic of 2 No shares CSi Credit Suisse Group AG – 1
Dutch Holding Rembrandt B.V. Netherlands 2 No shares CSi Credit Suisse Group AG – 1
Dutch Property Company Rembrandt BV Netherlands 2 No shares CSi Credit Suisse Group AG – 1
Entities 1 – 9
HOLT Emerging Markets Equity Fund Ireland, Republic of 2 No shares CSi Credit Suisse Group AG – 1
Interleuvenlaan 15 Real Estate Ltd Gibraltar 2 No shares CSi Credit Suisse Group AG – 1
Kaylen Properties Limited Gibraltar 2 No shares CSi Credit Suisse Group AG – 1
Mistral SPC Cayman Islands 2 No shares Credit Suisse Group AG Credit Suisse Group AG – 1
New Jersey S.A. Luxembourg 2 No shares CSi Credit Suisse Group AG – 1
RPM SPC – Global Futures Selection Cayman Islands 2 No shares RPM SPC RPM SPC – 1
Enhanced Risk Segregated Portfolio
SAPIC Global Macro Master Fund Ltd. Cayman Islands 2 No shares CSi Credit Suisse Group AG – 1
Ecureuil Vie – Separate Account Cayman Islands 2 No shares CNP Assurances SA CNP Assurances SA – 1
(EV) Segregated Portfolio
Silver Hake Limited Gibraltar 2 No shares CSi Credit Suisse Group AG – 1
Sontex (International) Limited Gibraltar 2 No shares CSi Credit Suisse Group AG – 1
Weiveldlaan 41 Real Estate Ltd Gibraltar 2 No shares CSi Credit Suisse Group AG – 1
Westwood S.A Portugal 2 No shares CSi Credit Suisse Group AG – 1
Zephyros Limited Cayman Islands 2 No shares Credit Suisse Group AG Credit Suisse Group AG – 1
Associates
AZ Pure China – Equity Strategy Luxembourg 2 USD A shares BNP Paribas Securities BNP Paribas Securities 50
Services SCA Services SCA
1 Subsidiaries included in Note 37 – Interests in Other Entities, where CSi does not hold any share capital. 2 Detailed Registered Office address mentioned in next Table.

145Credit Suisse International, Annual Report 2016
Notes to the Financial Statements for the year ended 31 December 2016
CSi and CSG is the immediate and ultimate parent respectively for the above subsidiaries.
Country Registered Office
31 December 2016
Subsidiaries/Associates
AHL Investment Strategies PCC – Class I1 AHL Guernsey PO Box 128, Glategny Court, Glategny Esplanade, St Peter Port, Guernsey
Global Futures 6 EUR Shares
AHL Investment Strategies PCC – Class K1 AHL Guernsey PO Box 128, Glategny Court, Glategny Esplanade, St Peter Port, Guernsey
Global Futures 7 EUR Shares
AHL Investment Strategies PCC – Class L1 AHL Guernsey PO Box 128, Glategny Court, Glategny Esplanade, St Peter Port, Guernsey
Global Futures 8 EUR Shares
AI3 Segregated Portfolio Cayman Islands WalkersSPVLimited WalkerHouse,MaryStreet POBox908GT GeorgeTown, Grand Cayman, Cayman Islands
Ajanta Limited Gibraltar 124 Irish Town, Gibraltar, Gibraltar
Andrea Investments (Jersey) PCC Jersey 22GrenvilleStreet,StHelier,ChannelIslands JE48PX,Jersey
Andrea Investments (Jersey) PCC – Cell Series 1000 EUR Jersey 22GrenvilleStreet,StHelier,ChannelIslands JE48PX,Jersey
Andrea Investments (Jersey) PCC – Cell Series 1000 PCC Jersey 22GrenvilleStreet,StHelier,ChannelIslands JE48PX,Jersey
Andrea Investments (Jersey) PCC – Cell Series 1000 USD Jersey 22GrenvilleStreet,StHelier,ChannelIslands JE48PX,Jersey
Argentum Capital Series 2015-5 Luxembourg 51,avenueJohnF.Kennedy ,LuxembourgL-1855,Luxembourg
Arundel (International) Limited Gibraltar 124 Irish Town, Gibraltar, Gibraltar
AZ Pure China – Equity Strategy Luxembourg AZ Fund Management S.A. 35 Avenue Monterey, L-2163, Luxembourg
Bellingham Properties Limited Gibraltar 124 Irish Town, Gibraltar, Gibraltar
Boats Investments (Jersey) Ltd Series Jersey 22GrenvilleStreet,StHelier JE24UF,Jersey
532,546,548,551,557,561,562,564,565
Boats Investments (Jersey) Ltd Jersey 22GrenvilleStreet,StHelier JE24UF,Jersey
Series 567,568,569,570, 571,572,575,576,577, 578,
579,582,584,585,586,587,588,589,590
Bondstreet 2 GmbH Germany c/oSalansLLP PlatzderEinheit2,Frankfurt60327,Germany
Brevan Howard Multi-Manager Limited Cayman Islands PO Box 309, George Town, Grand Cayman KY1-1104, Cayman Islands
CARMF Alternative 1 France Aberdeen Asset Management, Gestion 29, rue de Berri, 75008 Paris
Carmil Properties Limited Gibraltar 124 Irish Town, Gibraltar, Gibraltar
Cepheus Holdings Limited Gibraltar 124 Irish Town, Gibraltar, Gibraltar
Coxaro Holdings Limited Cyprus EliaHouse, 77LimassolAvenue,Nicosia 2121,Cyprus
Credit Suisse Backwardation Fund Ireland, Republic of 2ndFloor,BeauxlaneHouse MercerStreet,LowerDublin,Ireland,Republicof
Credit Suisse Bond Fund Ireland, Republic of 2ndFloor,BeauxlaneHouse MercerStreet,LowerDublin,Ireland,Republicof
Credit Suisse Global Carry selector Fund II Ireland, Republic of 2ndFloor,BeauxlaneHouse MercerStreet,LowerDublin,Ireland,Republicof
Culross Global SPC Limited – Culross British Virgin Islands Maitland Luxembourg S.A., 58 rue Charles Martel, L-2134 Luxembourg, UCITS Index Segregated Portfolio Grand-Duchy of Luxembourg
Custom Markets QIF PLC Ireland, Republic of MFDSecretariesLimited, 2ndFloor BeauxLaneHouse, Dublin2,Ireland,Republicof
Dutch Holding Rembrandt B.V. Netherlands SchipholBoulevard,231 torenB,5eLuchthavenSchiphol1118BH,Netherlands
Dutch Property Company Rembrandt BV Entities 1 – 9 Netherlands SchipholBoulevard,231 torenB,5eLuchthavenSchiphol1118BH,Netherlands
Ecureuil Vie – Separate Account (EV) Segregated Portfolio Cayman Islands PO Box 309, George Town, Grand Cayman KY1-1104, Cayman Islands
Global Bond Fund Ireland, Republic of MFDSecretariesLimited, 2ndFloor BeauxLaneHouse, Dublin2,Ireland,Republicof
HOLT Emerging Markets Equity Fund Ireland, Republic of 2ndFloor,BeauxlaneHouse MercerStreet,LowerDublin,Ireland,Republicof
HOLT Global Equity Fund Luxembourg rue Jean Monnet 5,Luxembourg 2180, Luxembourg
Interleuvenlaan 15 Real Estate Ltd Gibraltar 124 Irish Town, Gibraltar, Gibraltar
Kaylen Properties Limited Gibraltar 124 Irish Town, Gibraltar, Gibraltar
LHI Mid Market Buy-Out Europe LP Guernsey 1RoyalPlaza RoyalAvenue, StPeterPort, GY12HL,Guernsey
Mistral SPC Cayman Islands PO Box 309, George Town, Grand Cayman KY1-1104, Cayman Islands
Mistral SPC – Long/Short Equity Cayman Islands PO Box 309, George Town, Grand Cayman KY1-1104, Cayman Islands
New Jersey S.A. Luxembourg 51,avenueJohnF.Kennedy ,LuxembourgL-1855,Luxembourg
RPM SPC – Global Futures Selection Enhanced Risk Cayman Islands c/o Stuarts Corporate Services Ltd., P.O. Box 2510, Grand Cayman KY1-1104, Segregated Portfolio Cayman Islands.
SAPIC Global Macro Master Fund Ltd. Cayman Islands MaplesCorporateServicesLimited P.O.Box309,UglandHouse,GeorgeTown, GrandCayman KY1-1104,CaymanIslands
Silver Hake Limited Gibraltar Suite 7b & 8b, Finsbury Trust, 50 Town Range, PO Box 472, Gibraltar
Simplon Capital Ltd. SPC – AlphAlgo Cayman Islands Cayman Management Ltd. Ground Floor, Harbour Centre, Segregated Fund Portfolio P.O. Box 1569 George Town, Grand Cayman KY1-1110, Cayman Islands
Sontex (International) Limited Gibraltar 124 Irish Town, Gibraltar, Gibraltar
Weiveldlaan 41 Real Estate Ltd Gibraltar 124 Irish Town, Gibraltar, Gibraltar
Westwood S.A Portugal EdificioAtriumSaldanha PracaDuquedeSaldanha, Lisbon 1050094,Portugal
Xanthos Holding – Segregated Portfolio Cayman Islands WalkersSPVLimited WalkerHouse,MaryStreet POBox908GT GeorgeTown, Grand Cayman, Cayman Islands
YI Active Spezial ESPA Fund. Austria Am Belvedere 1, Vienna 1100, Austria
Zephyros Limited Cayman Islands PO Box 1093,GT Queensgate House, South Church Street, George Town, Grand Cayman, Cayman Islands


1440
526
03.2
014
CREDIT SUISSE INTERNATIONALOne Cabot SquareLondon E14 4QJcredit-suisse.com
Credit Suisse is committed to a professional and inclusive work environment where all individuals are treated with respect and dignity.Credit Suisse is an equal opportunity employer. © 2017 CREDIT SUISSE GROUP AG and/or its affiliates. All rights reserved.