credit suisse presentation slides
TRANSCRIPT

QUARTERLY RESULTS 2005 Q3

Slide 1
DISCLAIMER
Cautionary statement regarding forward-looking information
This presentation contains forward-looking statements within the meaning of the Private Securities Litigation Reform Act of 1995.
Forward-looking statements involve inherent risks and uncertainties, andwe might not be able to achieve the predictions, forecasts, projections and other outcomes we describe or imply in forward-looking statements.
A number of important factors could cause results to differ materially from the plans, objectives, expectations, estimates and intentions we express in these forward-looking statements, including those we identify in"Risk Factors" in our Annual Report on Form 20-F for the fiscal yearended December 31, 2004 filed with the US Securities and Exchange Commission, and in other public filings and press releases.
We do not intend to update these forward-looking statements except as may be required by applicable laws.

Slide 2
RESULTS OVERVIEW THIRD QUARTER 2005
Net revenues 15,510 10% 10% 30%
Total operating expenses 6,996 (3%) 13% 18%
Net income 1,918 109% 24% 42%
Return on equity 20.1%
Basic EPS (in CHF) 1.67 104% 22% 44%
in CHF m, except where indicated 3Q05∆ vs
3Q04∆ vs
2Q05∆ vs 2Q05 adjusted1)
1) Excluding a litigation charge of CHF 960 m before tax and CHF 624 m after tax
Slide 3
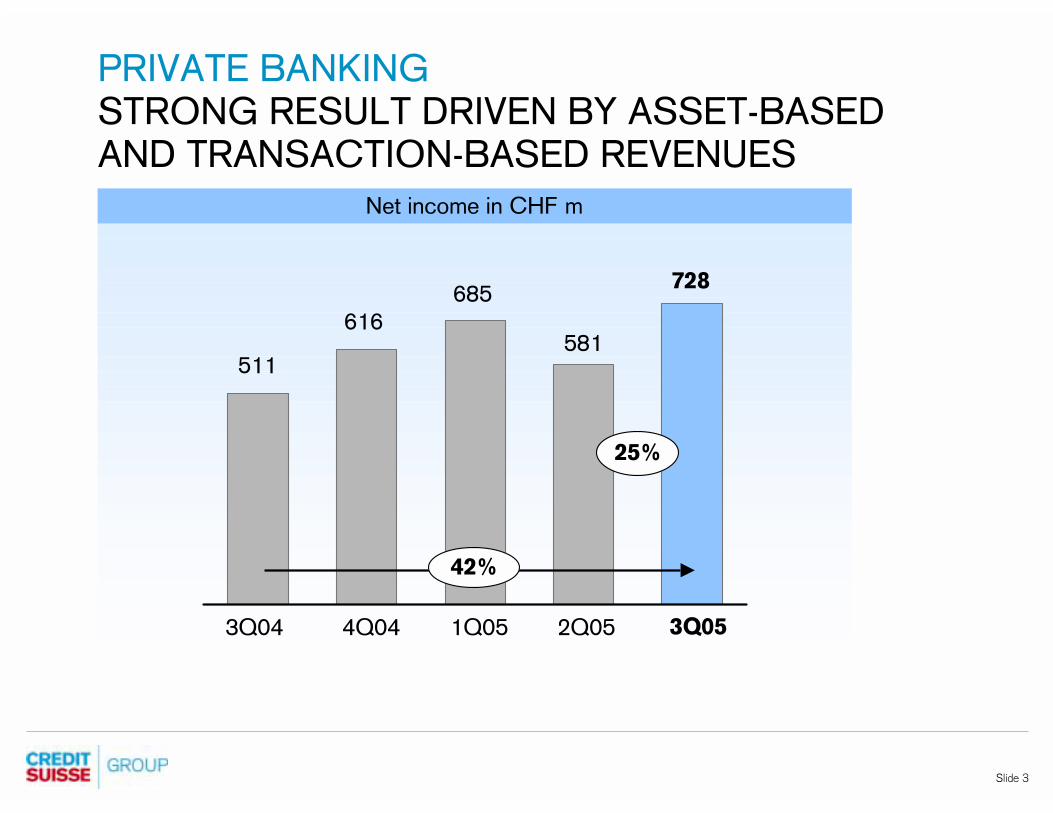
Net income in CHF m
PRIVATE BANKING
STRONG RESULT DRIVEN BY ASSET-BASED
AND TRANSACTION-BASED REVENUES
511
616685
25%
4Q043Q04 1Q05 2Q05 3Q05
42%
581
728

Slide 4
Total operating expenses in CHF mRevenues in CHF m
PRIVATE BANKING
HIGH REVENUES BENEFITING FROM
IMPROVED COMMISSIONS AND FEES
4Q043Q04 1Q05 2Q05 3Q05
994 993 1,060
4Q043Q04 1Q05 2Q05 3Q05
1,644 1,7171,912
Cost/income ratio in %
55.460.5 57.8
491 547 460
503 446 600
Other expenses 1)Compensation and benefits
1,810
59.9
1,084
504
580
Commissions and feesAll other revenues
1,113 1,149 1,209 1,180
531 568703
630
1) Including restructuring charges of CHF (1) m and CHF 1 m in 3Q04 and 4Q04, respectively
2,021
1,306
715
55.7
1,125
524
601
23%
13%

Slide 5
Assets under management in CHF bnNet new assets in CHF bn
7.0
564
3.8 3.9
539544
4Q043Q04 1Q05 2Q05 3Q05 4Q043Q04 1Q05 2Q05 3Q05
6%
12.8 602
Annualizedgrowth rate:
2004: 5.2%
9M05: 8.4%
14.3 637
PRIVATE BANKING
STRONG ASSET INFLOWS SUPPORTED BY
GROWTH IN ASIAN AND EUROPEAN MARKETS
18%
34.1

Slide 6
Net margin in bpGross margin in bp
PRIVATE BANKING
GROSS MARGIN BENEFITED FROM
HIGH LEVEL OF NET REVENUES
122
81
37
4
128
84
5
39
4Q043Q04 1Q05 2Q05 3Q05
138
83
6
49
126
79
3
44
9M05: 131FY2004: 134
131
79
4
4838
46
4Q043Q04 1Q05 2Q05 3Q05
50
41
9M05: 46FY2004: 47
48
Asset-driven Transaction-driven Other

Slide 7
Net income in CHF m
CORPORATE & RETAIL BANKING
GOOD RESULT MAINTAINED DUE TO STRONG NET
REVENUES AND FAVORABLE CREDIT ENVIRONMENT
199
257274
(5%)
33%
4Q043Q04 1Q05 2Q05 3Q05
277264

Slide 8
Total operating expenses in CHF mRevenues in CHF m
CORPORATE & RETAIL BANKING
CONTINUED STRONG REVENUE CONTRIBUTION
AND TIGHTLY MANAGED COSTS
4Q043Q04 1Q05 2Q05 3Q05
527477
529
4Q043Q04 1Q05 2Q05 3Q05
808 803860
Cost/income ratio in %
61.565.2 59.4
2%
9%
266 206 308
261 271221
Other expenses
Compensation and benefits
858
548
63.9
291
257
879 62.7
551
295
256
5%

Slide 9
Net income in CHF m
INSTITUTIONAL SECURITIES
IMPROVED RESULT DUE TO FOCUS ON HIGH-
MARGIN PRODUCTS AND ACTIVE MARKETS
4Q043Q04 1Q05 2Q05 3Q05
292 1) 269
540
(408)
216 2)
1) Including the release of tax contingency accruals of CHF 126 m
2) Excluding the litigation charge of CHF 624 m after tax
612
Slide 10
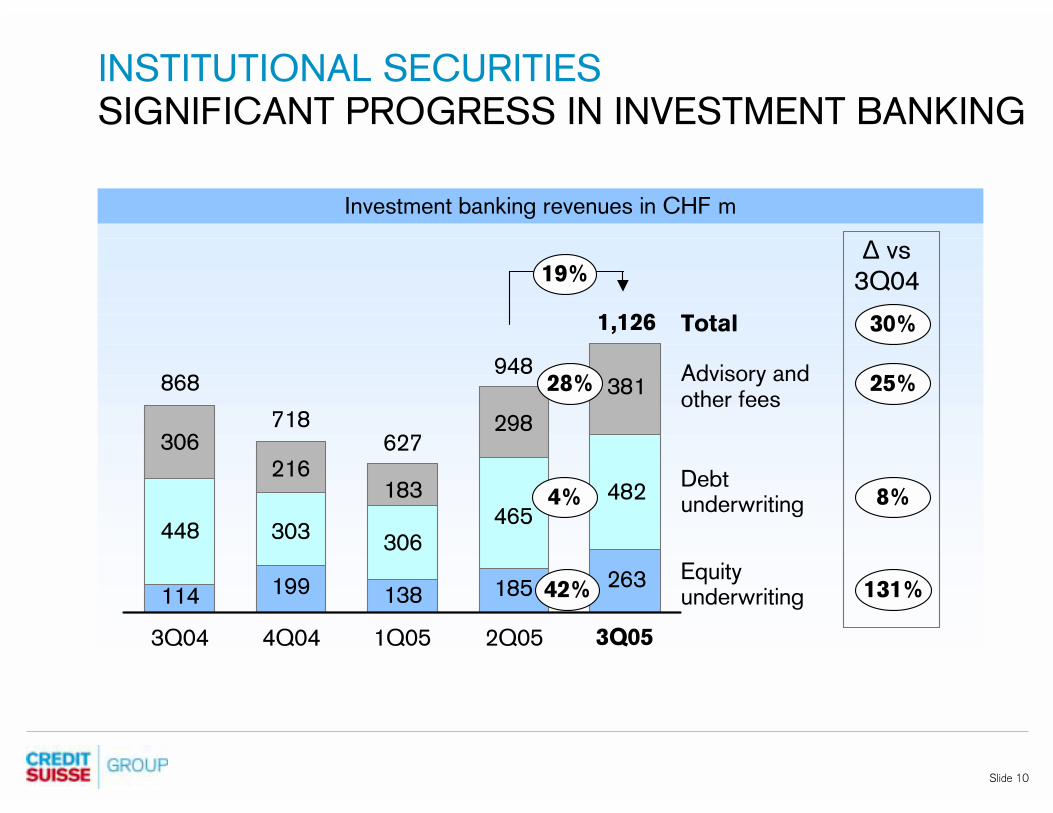
Investment banking revenues in CHF m
868
718627
4Q043Q04 1Q05 2Q05 3Q05
Equityunderwriting
Advisory andother fees
Debtunderwriting4%
42%
25%
8%
131%
30%
∆ vs3Q04
Total
948
185
465
298
138
306
183
199
303
216
114
448
306
28%
1,126
263
482
381
19%
INSTITUTIONAL SECURITIES
SIGNIFICANT PROGRESS IN INVESTMENT BANKING

Slide 11
Fixed income trading revenues in CHF m
1,3481,278
1,926
4Q043Q04 1Q05 2Q05 3Q05
INSTITUTIONAL SECURITIES
TRADING RESULT BENEFITED FROM
PRODUCT FOCUS AND FAVORABLE MARKETS
Equity trading revenues in CHF m
696
828926
4Q043Q04 1Q05 2Q05 3Q05
31%
48% 49%
78%
1,194 834
1,7701,239
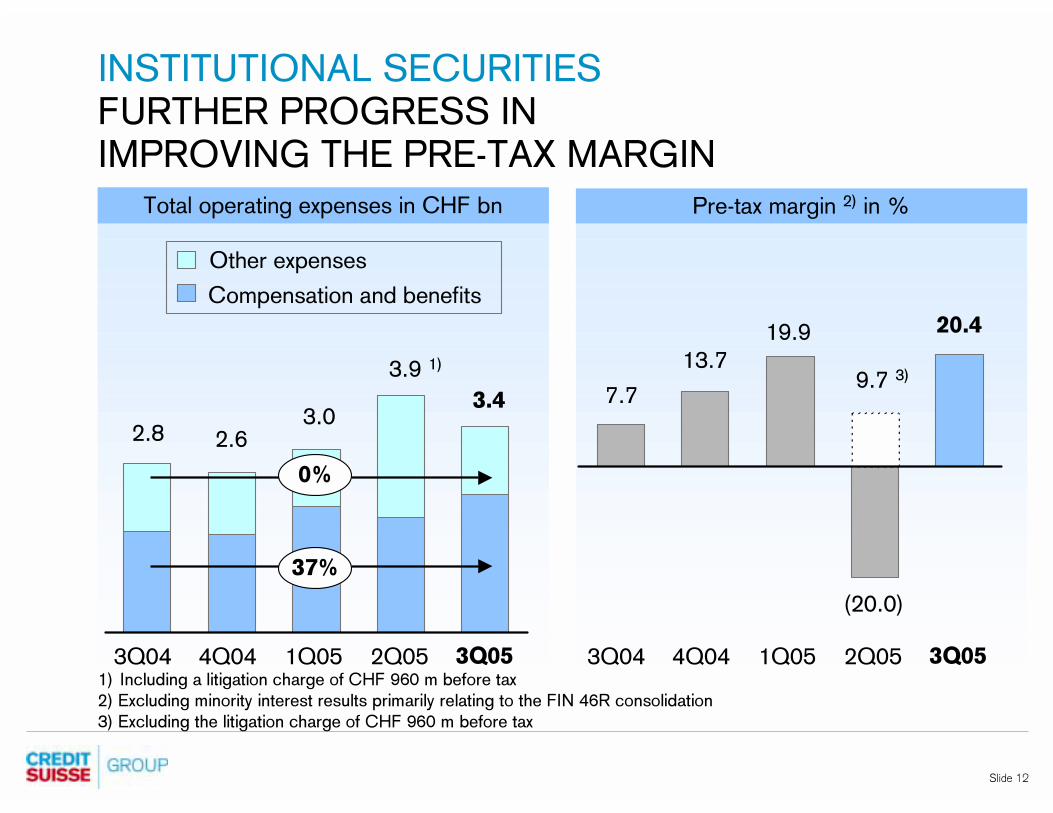
Slide 12
Pre-tax margin 2) in %Total operating expenses in CHF bn
INSTITUTIONAL SECURITIES
FURTHER PROGRESS IN
IMPROVING THE PRE-TAX MARGIN
4Q043Q04 1Q05 2Q05 3Q051) Including a litigation charge of CHF 960 m before tax
2) Excluding minority interest results primarily relating to the FIN 46R consolidation
3) Excluding the litigation charge of CHF 960 m before tax
2.6
7.7
4Q043Q04 1Q05 2Q05 3Q05
13.7
Compensation and benefits
Other expenses
2.83.0
19.9
0%
37%
3.9 1)
3.4
(20.0)
20.4
9.7 3)
Slide 13
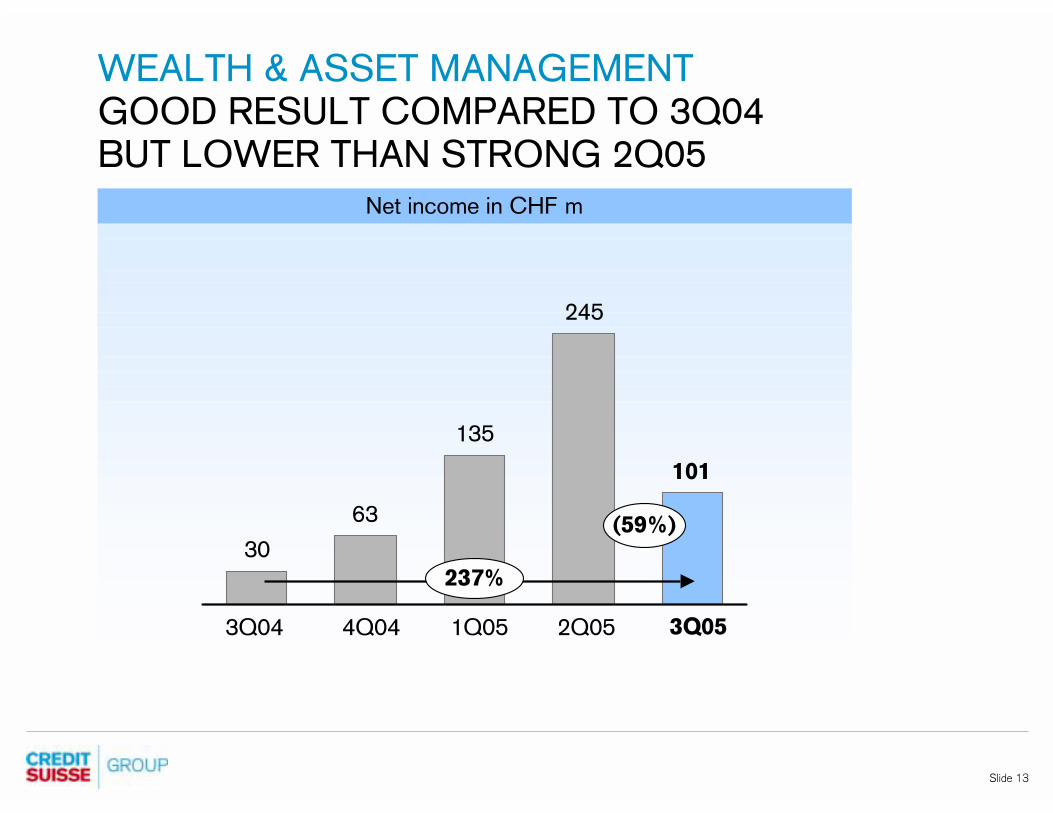
Net income in CHF m
WEALTH & ASSET MANAGEMENT
GOOD RESULT COMPARED TO 3Q04
BUT LOWER THAN STRONG 2Q05
30
63
135
4Q043Q04 1Q05 2Q05 3Q05
(59%)
237%
245
101
Slide 14
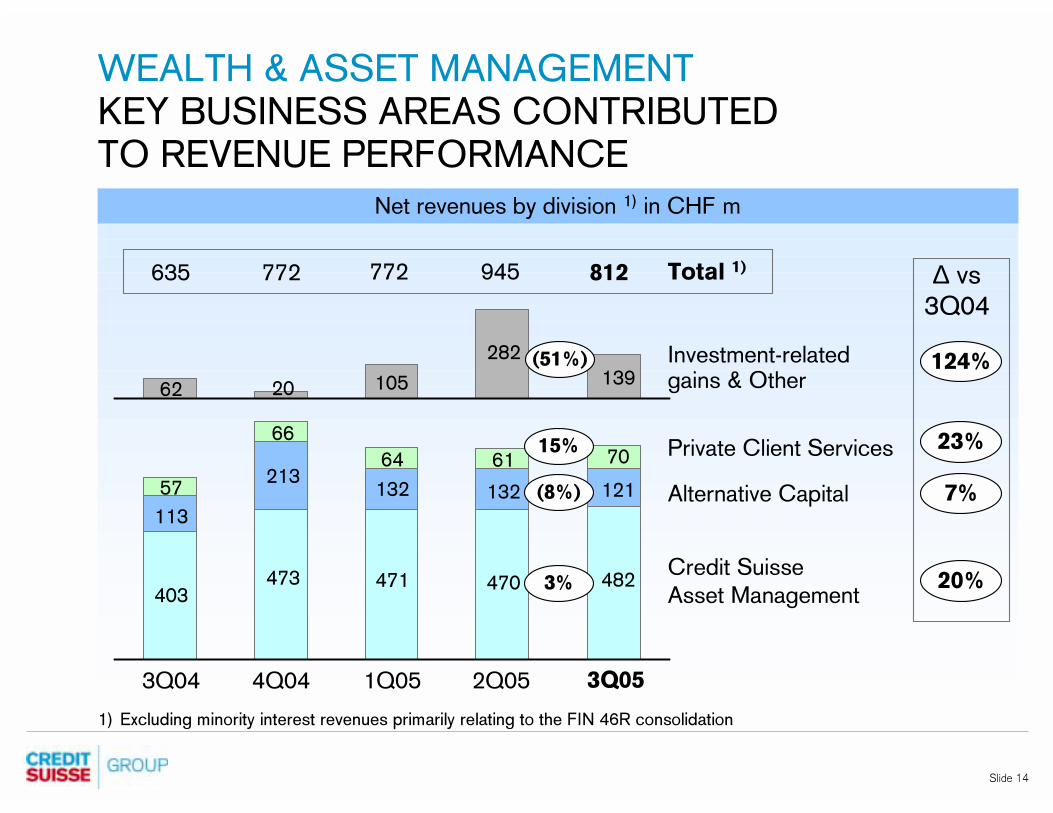
Net revenues by division 1) in CHF m
635 772 772
WEALTH & ASSET MANAGEMENT
KEY BUSINESS AREAS CONTRIBUTED
TO REVENUE PERFORMANCE
4Q043Q04 1Q05 2Q05 3Q05
Credit SuisseAsset Management
Alternative Capital(8%)
3%
1) Excluding minority interest revenues primarily relating to the FIN 46R consolidation
Private Client Services
Total 1)
403473 471
113
21313257
66
6415%
62 20 105
Investment-relatedgains & Other
23%
7%
20%
124%
∆ vs3Q04
945
470
132
61
282 (51%)
812
482
121
70
139

Slide 15
Net new assets 1) in CHF bn
4Q043Q04 1Q05 2Q05 3Q05 4Q043Q04 1Q05 2Q05 3Q05
Private Client Services
Credit SuisseAsset Management
Alternative Capital
5.4 502482488(0.5) (0.2)
1) Includes assets managed on behalf of other entities within Credit Suisse Group
Assets under management 1) in CHF bn
2.8 529
WEALTH & ASSET MANAGEMENT
HIGHER ASSET INFLOWS IN PRIVATE
CLIENT SERVICES AND CSAM
4.1 553
Slide 16
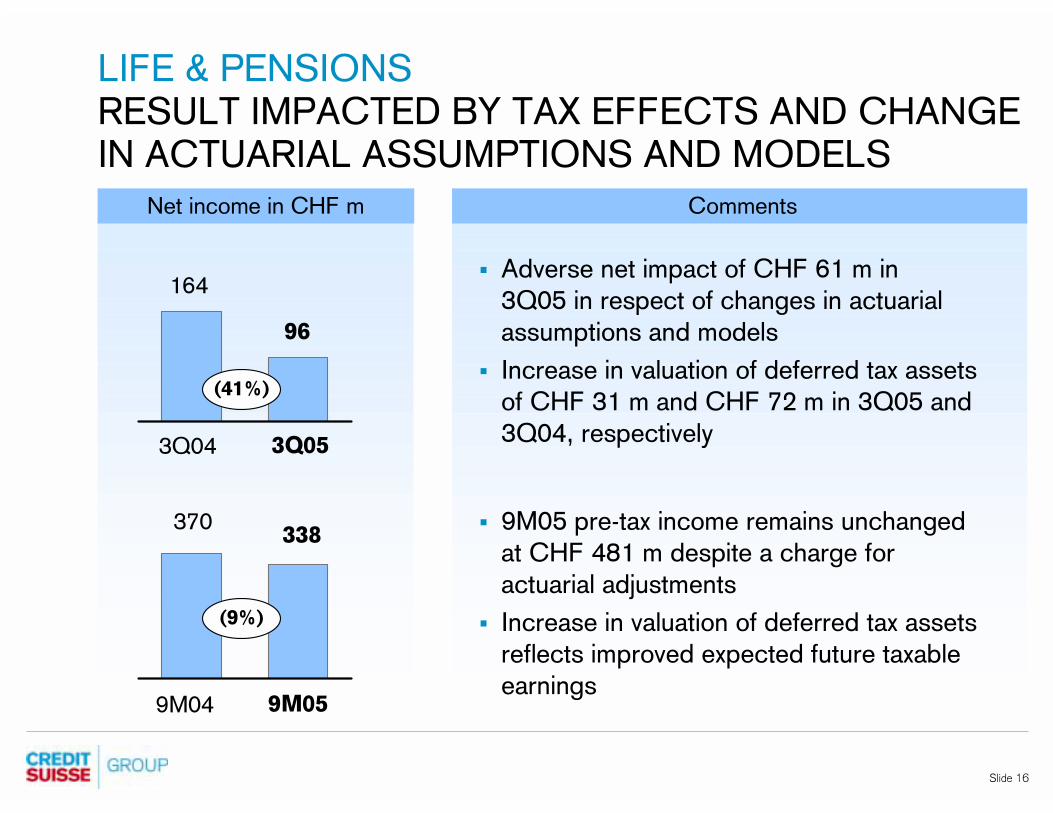
Net income in CHF m
LIFE & PENSIONS
RESULT IMPACTED BY TAX EFFECTS AND CHANGE
IN ACTUARIAL ASSUMPTIONS AND MODELS
164
3Q04 3Q05
9M04 9M05
338
96
Comments
� Adverse net impact of CHF 61 m in 3Q05 in respect of changes in actuarial assumptions and models
� Increase in valuation of deferred tax assets of CHF 31 m and CHF 72 m in 3Q05 and 3Q04, respectively
� 9M05 pre-tax income remains unchanged at CHF 481 m despite a charge for actuarial adjustments
� Increase in valuation of deferred tax assets reflects improved expected future taxable earnings
370
(41%)
(9%)

Slide 17
Total business volume in CHF m
for the quarter
LIFE & PENSIONS
POLICYHOLDER DEPOSITS DRIVE
BUSINESS VOLUME INCREASE
3,2923,728
3Q04 3Q05
Policyholder deposits
Gross premiums
written
16%
10%
13%
12,81913,706
9M04 9M05
Policyholder deposits
Gross premiums
written
13%
4%
7%
Total business volume in CHF m
year-to-date

Slide 18
Net income in CHF m
198
3Q04 3Q05
9M04 9M05
452
190
Comments
� Negative impact of CHF 72 m after tax and net of reinsurance in 3Q05 due to Swiss floods
� No significant impact from hurricanes in the US, following decision to exit certain risk exposures
� Increase in valuation of deferred tax assets of CHF 132 m and CHF 59 m in 3Q05 and 3Q04, respectively
� Increase in valuation of deferred tax assets reflects improved expected future taxable earnings
NON-LIFE
RESULT IMPACTED BY POSITIVE TAX EFFECTS AND
CHF 72 MILLION FOR FLOODS IN SWITZERLAND
383
(4%)
18%
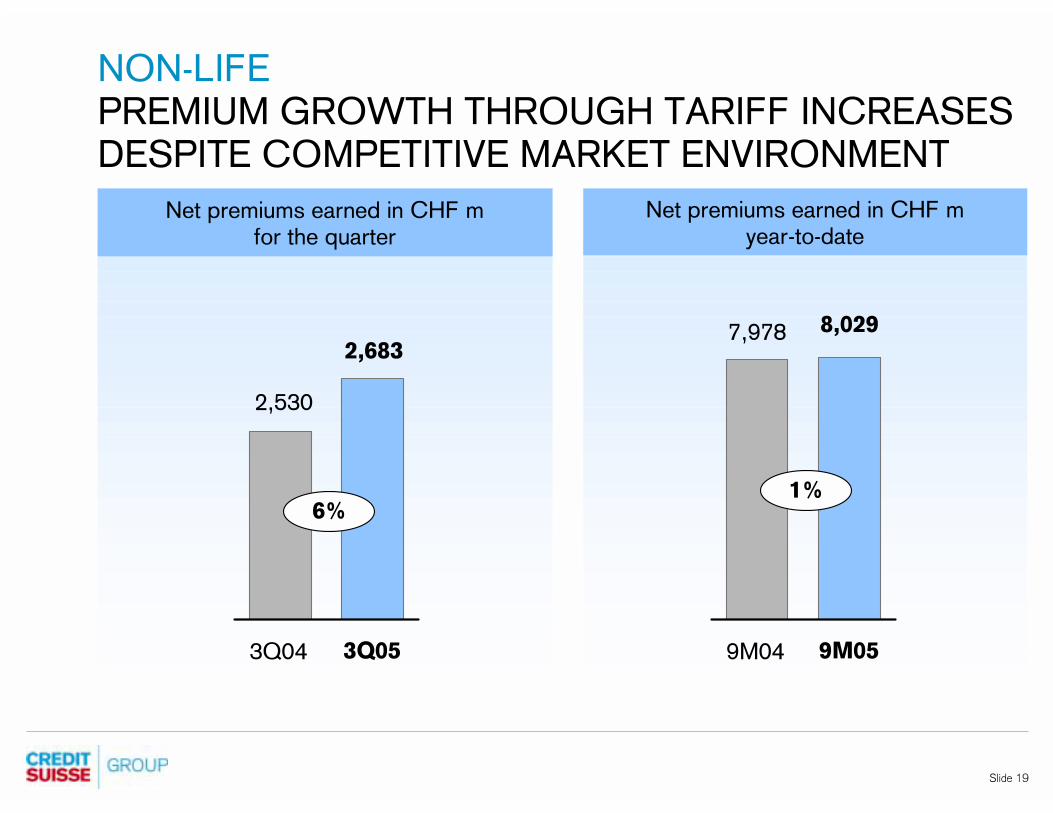
Slide 19
NON-LIFE
PREMIUM GROWTH THROUGH TARIFF INCREASES
DESPITE COMPETITIVE MARKET ENVIRONMENT
Net premiums earned in CHF mfor the quarter
2,530
2,683
3Q04 3Q05
6%
Net premiums earned in CHF myear-to-date
7,978 8,029
9M04 9M05
1%

Slide 20
NON-LIFE
YTD COMBINED RATIO LOWER THAN LAST YEAR
DESPITE FLOODS IN SWITZERLAND
Combined ratio in %
for the quarter
101.8
3Q04 3Q05
101.3
0.5ppts
26.326.7
75.574.6
Combined ratio in %
year-to-date
98.8
9M04 9M05
99.8
-1ppt
25.025.5
73.874.3
Expense ratio
Claims ratio
Expense ratio
Claims ratio

Slide 21
Credit Suisse Group
CAPITAL POSITION STRENGTHENED
4Q043Q04 1Q05 2Q05 3Q05
204 199215
Comments
� Winterthur shareholders’ equity ofCHF 9.7 bn as of September 30, 2005; improvement of CHF 0.3 bn compared to June 30, 2005
11.8 12.3 12.1
BIS tier 1 ratio in %
Risk-weighted assets in CHF bn
10.9
238
� Repurchased 26 million sharesworth CHF 1.4 bn1) since theinitiation of the program
� Risk-weighted assets were held at CHF 240 bn during the quarter
� Tier 1 capital improved as net income was only partially offset by share repurchases of CHF 0.7 bn in 3Q05
11.1
240
1) As at end of October 2005
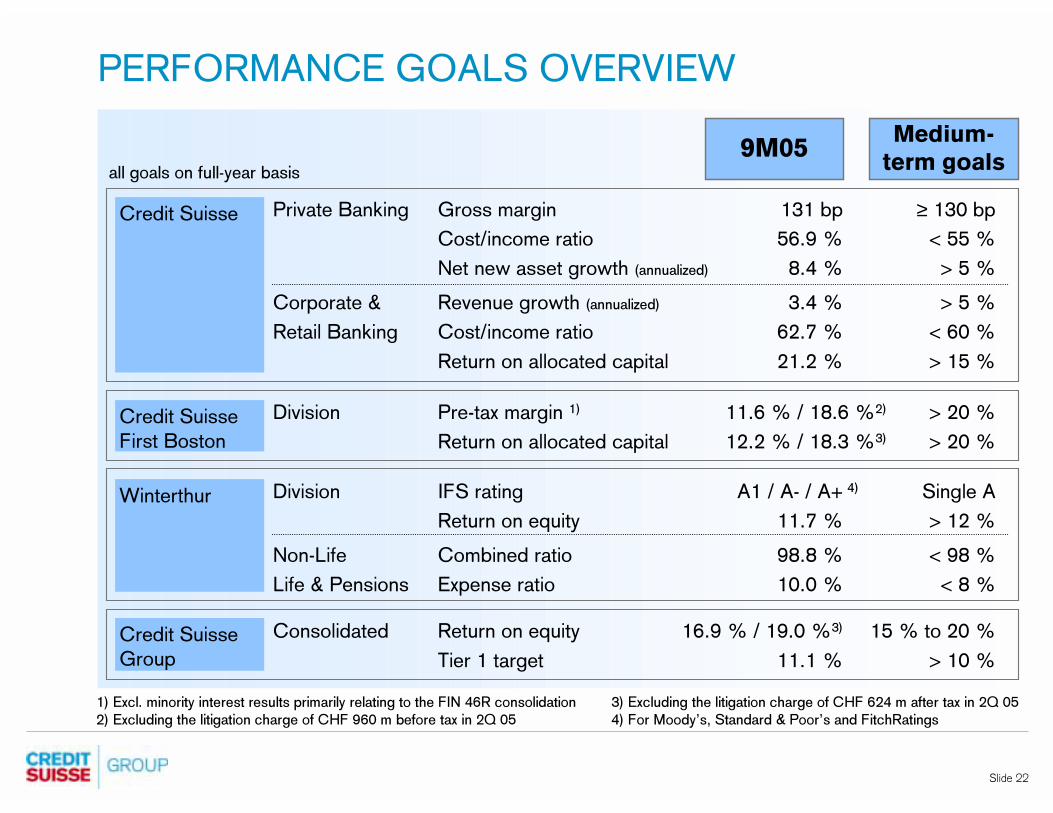
Slide 22
PERFORMANCE GOALS OVERVIEW
Medium-
term goals
Consolidated Return on equity 16.9 % / 19.0 %3) 15 % to 20 %
Tier 1 target 11.1 % > 10 %
Private Banking Gross margin 131 bp ≥ 130 bp
Cost/income ratio 56.9 % < 55 %
Net new asset growth (annualized) 8.4 % > 5 %
Corporate & Revenue growth (annualized) 3.4 % > 5 %
Retail Banking Cost/income ratio 62.7 % < 60 %
Return on allocated capital 21.2 % > 15 %
9M05
Division Pre-tax margin 1) 11.6 % / 18.6 %2) > 20 %
Return on allocated capital 12.2 % / 18.3 %3) > 20 %
Division IFS rating A1 / A- / A+ Single A
Return on equity 11.7 % > 12 %
Non-Life Combined ratio 98.8 % < 98 %
Life & Pensions Expense ratio 10.0 % < 8 %
all goals on full-year basis
1) Excl. minority interest results primarily relating to the FIN 46R consolidation 3) Excluding the litigation charge of CHF 624 m after tax in 2Q 05
2) Excluding the litigation charge of CHF 960 m before tax in 2Q 05 4) For Moody’s, Standard & Poor’s and FitchRatings
Credit Suisse
First Boston
Credit Suisse
Winterthur
Credit Suisse Group
4)
Slide 23
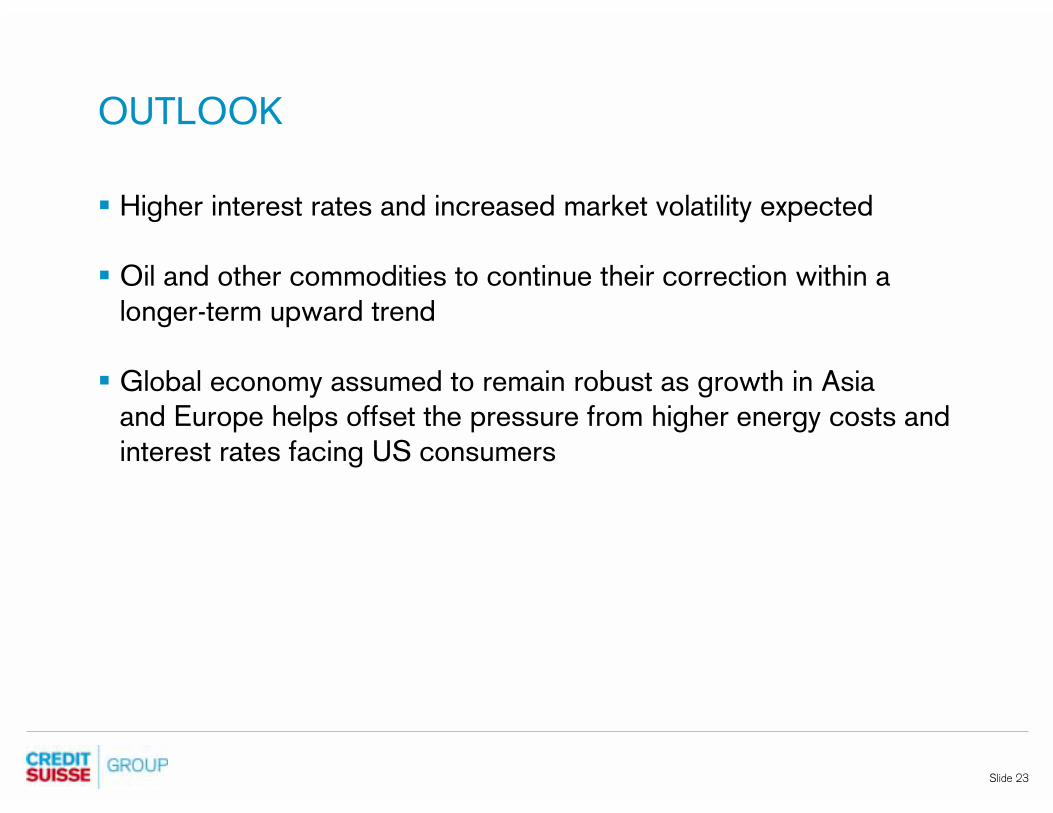
OUTLOOK
� Higher interest rates and increased market volatility expected
� Oil and other commodities to continue their correction within alonger-term upward trend
� Global economy assumed to remain robust as growth in Asiaand Europe helps offset the pressure from higher energy costs and interest rates facing US consumers
Slide 24
Investor Relations contacts
Ian Roundell
+41 44 333 1748
Marc Buchheister
+41 44 333 3169
Manuela Luzio
+41 44 332 6098