credit suisse’s journey from scale to skill suisse’s journey from scale to skill o&o...
TRANSCRIPT

Credit Suisse’s Journey from Scale to SkillO&O Conference
Sharm-el-Sheik, November 14, 2009
Produced by: Jon Theuerkauf – Global Head: Centers of Excellence
Global Head: Operational Excellence
Global Head: Bank Efficiency Management

Slide 1
Key messages
While other companies have been shaken up by the crisis impacting also their
O&O activities, Credit Suisse continues executing on the pre-downturn O&O
strategy
The Centers of Excellence (CoE) initiative has made Credit Suisse one
of the O&O leaders in the banking industry in terms
of FTE offshored and has delivered significant value to the bank
However, opportunities exist to further increase the value extracted from the
O&O platform by moving from a focus
on scale to a focus on skills and competencies
The journey will involve acting on four strategic thrusts
–Drive consolidation of today's activities into competencies
– Focus on two delivery models, captive and outsourced, the latter serving as
the default model
–Optimize the geographic footprint and vendor mix
– Institutionalize the usage of SLAs and KPIs and drive continuous
improvement
This evolution is expected to increase the value of the O&O platform by more
than 10% over the next three years (and significantly more than that in some
areas)
1
2
3
4

Slide 2
While other adapt to the crisis, Credit Suisse continues executing
on the pre-downturn strategy
Source: Press releases, news runs
Nov. 4th 2009:
Credit Suisse opens 5th CoE in Mumbai
(…) “Since establishing the CoE initiative in
2006 we have deployed more than 8,000
roles, or around 15% of our workforce.
With the opening of the Mumbai CoE,
Credit Suisse will have five CoEs providing
support to our operations in more than 50
countries around the world. By 2011, we
hope to have over 9,000 roles deployed to
our CoE network,” said Theuerkauf. (…)
UBS sells Indian BPO arm to Cognizant
Oct. 16th, 2009
Citi Completes Sale of Citigroup Technology Services Ltd. (India) to Wipro
Jan 20th, 2009
BT to cut 2,000 jobs from call centre workforce in India
July 16th, 2009

Slide 3
The CoE initiative has made CS one of the leaders in terms of FTEs
offshored as percentage of total FTEs and has delivered
significant value
FTE ramp-up in CoEs
Geographic footprint Offshoring level competitors, YE 2007
Value contribution to the bank
Other
vendor
sitesPune
Singapore
Raleigh
Wroclaw
FTE Indexed run-rate savings; 100 = YE 2007 savings
7,3875,798
Target
YE 2009
tbc
(+5-10% exp.)
YE 08YE 2007
Cost
avoidance
Real
savings
Target
YE 2009
tbc
tbc
tbc
YE 08
139
54%
46%
YE 2007
100
56%
44%
0
5
10
15
0 5,000 10,000 15,000 20,000 25,000
Percent of total FTEs offshored
Number of FTEs offshored globally
Slide 4
CoE brought new behaviors in the way we work

Slide 5
We now have the opportunity to evolve our initial approach which has
prevented capturing the full potential benefits of the initiative
… which prevented capturing the full
potential of the O&O platform
Difficult to reap scale economies and support
growth
Difficult to leverage skill economies
Current business case mostly around cost
avoidance
Difficult to create and communicate full
transparency on initiative value
Greater fragmentation of operational
processes
Introduction of risk/complexity due to multiple
hand-offs
To launch the program and allow it to scale quickly
a series of implementation decisions were taken …
Limited use of end state design as a guide; to allow
faster migration few end-to-end processes moved,
mostly isolated task/activities
Choice of location deployment largely left to the
business to get their buy-in
Implementation model mainly based on staff
augmentation which was easier to start; limited
responsibility/empowerment of remote center for
service delivery
Limited investment during migration phase on
performance improvements/process optimization;
limited time take to put in place KPIs and SLAs

Slide 6
To extract more value form our O&O platform we have embarked
in a journey from scale to skill along 4 strategic thrusts
Drive the consolidation of activities into competencies, potentially
by relocating services (within regulatory constraints and workflow considerations) to ensure
capture of benefits of skill and scale economies
1
Focus on two delivery models – captive and outsourced – to further reduce complexities
(co-managed serving as a transitional model only):
– The outsourced model to be used as the default model
– The captive model to be used if specific business, strategic
or regulatory requirements exist
2
Optimize geographic footprint of competencies and vendor mix
(also through secondary deployment) by explicitly accounting for tradeoffs between cost vs.
competency and by applying a clear vendor manage-ment strategy to ensure long-term
sustainability of business case
3
Institutionalize the implementation of SLAs and quality, productivity, efficiency and
risk KPIs to baseline the current performance levels of CoE and drive process
reengineering and continuous improvement to ensure CoE delivers value beyond cost
arbitrage
4

Slide 7
Consolidate CoE’s activities into coherent competencies…
CoE competencies – BPO
Clearing and settlement–Cash clearing and settlement–Securities clearing and settlementReconciliations–Settlement reconciliationsReference data–Reference data Fund administration–Fund accounting
Research and analytics –Research–Deal support–Client strategy–Analytics– ...
CoE competencies – ITO
IT application development and support–Applications - IB–Applications - PB–Applications - CS–Applications - AM–Applications - Switzerland IT data center operations–Data center service delivery–Data center technology–Batch management–Data problem management IT end user platforms–End user workplace–…
1
Drive the consolidation of activities by clustering similar activities into coherent competencies characterized by a minimal critical mass, homogeneous set of know-ledge, skills, tools and talent to ensure/increase capture of benefits of skill and scale economies and enable development of distinctive functional and process expertise

Slide 8
… and deploy them across our geographic footprintCaptive FTEs
Co-managed FTEs
Outsourced FTEs
Raleigh (current):
Target
Position valuation and P&L
Presentations
IT Application development
and support
IT end user platforms
894
-
xx
Outsourced
(current):
Target
Administration
Payment processing
Clearing and settlement
Fund administration
Research and analytics
Human resources
IT Application development
and support
IT data center operations
IT end user platforms
IT Infrastructure and
networks
2,073
xx
Wroclaw (current):
Target
Reference data
Asset servicing
Other competencies where
European languages are
required
145
153
xx
Pune (current):
Target
Legal and compliance
Financial/Regulatory
reporting and analysis
Financial planning and
analysis
Data management
910
417
xx
Singapore (current):
Target
Administration
Position valuation and P&L
Payment processing
Risk management
IT Application development
and support
IT data center operations
IT end user platforms
IT Infrastructure and
networks
Mumbai (current):
Target
Research and analytics
Potential for BPO
competencies
3,376
-
xx
-
-
xx
1
Current and target CoE competency footprint

Slide 9
The overall aim is to create a truly integrated model
for rightshoring competencies
1
Slide 10
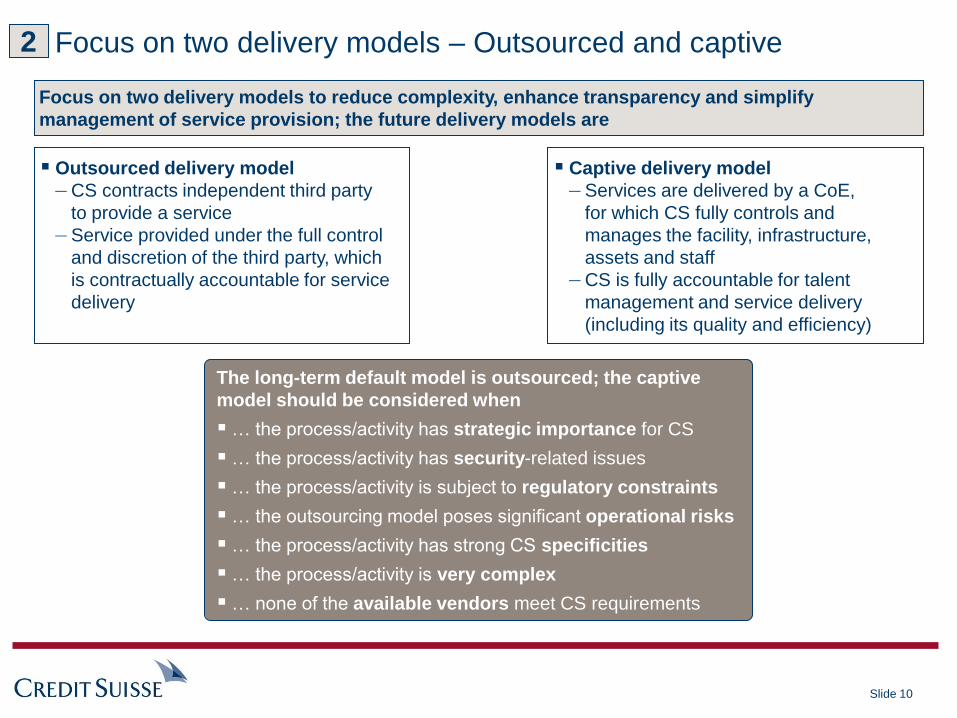
Focus on two delivery models – Outsourced and captive
The long-term default model is outsourced; the captive
model should be considered when
… the process/activity has strategic importance for CS
… the process/activity has security-related issues
… the process/activity is subject to regulatory constraints
… the outsourcing model poses significant operational risks
… the process/activity has strong CS specificities
… the process/activity is very complex
… none of the available vendors meet CS requirements
Focus on two delivery models to reduce complexity, enhance transparency and simplify
management of service provision; the future delivery models are
Outsourced delivery model
– CS contracts independent third party
to provide a service
– Service provided under the full control
and discretion of the third party, which
is contractually accountable for service
delivery
Captive delivery model
– Services are delivered by a CoE,
for which CS fully controls and
manages the facility, infrastructure,
assets and staff
– CS is fully accountable for talent
management and service delivery
(including its quality and efficiency)
2

Slide 11
Optimize geographic footprint by applying clear criteria for location
selection …
Optimize geographic footprint (also through secondary deployment) by explicitly accounting
for tradeoffs between cost vs. competency to ensure long-term sustainability of business case
Key factors driving
CoE location selection
Size, skill level and functional profile of talent pool
Ease of recruitment – projected talent demand vs. availability
Expected attrition rates
Talent
Ability to operate in customer's language when necessary
Understanding/adaptability to foreign working culture
Coverage during customer’s business hours
Interaction with
customer
Infrastructure environment (telecommunications, real estate, transport)
Business environment (government support, regulatory environment, convenience
of doing Business, fiscal performance)
Political environment (political stability, security, data protection, country image)
Environment
Existence of related competencies in an established CoEExisting
competencies
Labor cost and expected wage inflation
Real estate costCost Infrastructure cost
Taxation rate
3

Slide 12
… resulting in a shift towards more value-adding
CoE locations
Changes in geographic footprint (effective FTE figures before productivity improvements and consolidation)
Optimize geographic footprint of competencies (also through secondary deployment) by explicitly accounting
for tradeoffs between cost vs. competency to ensure long-term sustainability of business case
Asia location 1 (captive)North America (captive)
Asia location 2 (captive)Eastern Europe (captive) Outsourcing
Asia location 3 (captive)
201107/2008
BPO/KPO
201107/2008
ITO
201107/2008 201107/2008201107/2008
0
2011
tbc
07/2008
201107/2008 07/2008 2011201107/2008201107/2008 201107/2008 201107/2008
45% -29%
–180% 83% 203%
46% -1%
-100% 100%
3

Slide 13
Institutionalize SLAs, KPIs and continuous improvement
to achieve real CoE excellence
Institutionalize the implementation of SLAs and quality, productivity, efficiency and risk KPIs
to baseline the current performance levels of CoE and drive process re-engineering and continuous
improvement to ensure CoE delivers value beyond cost arbitrage
Characteristics
Enablers for …
… improvement of
cost savings from
currently deployed
resources by
achieving real CoE
excellence
… further sustainable
expansion of CoE
activity
Clear definition of service inputs, service outputs and
interface between service-consumer and service-provider
For outsourced model, definition of service debit/
service credit mechanisms in case of under-achievement or
overachievement of SLA targets
SLAs
Specification of a set of meaningful business-relevant
measure for quality, productivity, efficiency and risk
covering complete scope of service
KPI
Implement usage of standard toolkit and methods to
continuously improve and control processes
Mandate similar methodologies to improve service-quality
levels delivered by outsourcers
Continuous
improvement
4

Slide 14
Target state
176-182
129-130
38
9-14
Improvements
9-14
2009-11 forecast
167-168
129-130
38
YE 2008
139
139
Current CoE
New deployments
Impact of new CoE strategy
7706 9,900
Current CoE forecast and aspirational additional primary deployment
Improvements from new CoE strategy
8900-
9400
-(500-
1,000)Deployed FTEs
Target state
Estimated yearly run rate savings(indexed; 100 =YE 2007 savings)
Through productivity and consolidation, 500-1,000
offshore FTEs can be avoided, and the remaining
8,900-9,400 FTEs will still be able to perform
workload of 10,000 FTEs
The new CoE strategy will increase the value
of our O&O platform by approximately 10%
(much more in selected areas)

Slide 15
Key takeaways
For those starting … For those already advanced …
Start with a corporate target operating
model defining
–What work do you need to do?
–Who needs to do it, where does it need
to be done?
– Is the work optimized or at least stable
in it’s performance?
Use a “fix-then-shift” approach
Be disciplined and standardize the way
you deploy, don't leave it up to individual
organizations
Measure before and after deployments ...
–Cost/efficiency
–Quality
–Productivity
–Capability
–Risk
Understand in detail the work performed
in your offshore locations
Drive consolidation of today’s activities
into competencies
Focus on two delivery models, captive
and outsourced, the latter serving
as the default model
Optimize the geographic footprint
and vendor mix
Determine relevant QP&E1 metrics
to track process and center performance
Institutionalize the usage of SLAs
and KPIs and drive continuous
improvement
Review and optimize migration planning
process
1 Quality, productivity and efficiency