crestwood investor presentation march 2017
TRANSCRIPT
Presentation Title Presentation Subtitle
Crestwood Midstream Partners LP Crestwood Equity Partners LP
Connections for America’s Energy ™
™
Presentation Title Presentation Subtitle
Crestwood Midstream Partners LP Crestwood Equity Partners LP
Connections for America’s Energy ™
™
Presentation Title Presentation Subtitle
Crestwood Midstream Partners LP Crestwood Equity Partners LP
Connections for America’s Energy ™
™
2/26/2017
Presentation Title Presentation Subtitle
Crestwood Midstream Partners LP Crestwood Equity Partners LP
Connections for America’s Energy ™
™
Presentation Title Presentation Subtitle
Crestwood Midstream Partners LP Crestwood Equity Partners LP
Connections for America’s Energy ™
™ Connections for America’s Energy ™
™
Investor Presentation
March 2017
Connections for America’s Energy ™
™ ™
™ ™
™
The statements in this communication regarding future events, occurrences, circumstances, activities, performance,
outcomes and results are forward-looking statements. Although these statements reflect the current views, assumptions
and expectations of Crestwood’s management, the matters addressed herein are subject to numerous risks and
uncertainties which could cause actual activities, performance, outcomes and results to differ materially from those
indicated. Such forward-looking statements include, but are not limited to, statements about the benefits that may result
from the merger and statements about the future financial and operating results, objectives, expectations and intentions
and other statements that are not historical facts. Factors that could result in such differences or otherwise materially affect
Crestwood’s financial condition, results of operations and cash flows include, without limitation, the possibility that
expected cost reductions will not be realized, or will not be realized within the expected timeframe; fluctuations in crude oil,
natural gas and NGL prices (including, without limitation, lower commodity prices for sustained periods of time); the extent
and success of drilling efforts, as well as the extent and quality of natural gas and crude oil volumes produced within
proximity of Crestwood assets; failure or delays by customers in achieving expected production in their oil and gas
projects; competitive conditions in the industry and their impact on our ability to connect supplies to Crestwood gathering,
processing and transportation assets or systems; actions or inactions taken or non-performance by third parties, including
suppliers, contractors, operators, processors, transporters and customers; the ability of Crestwood to consummate
acquisitions, successfully integrate the acquired businesses, realize any cost savings and other synergies from any
acquisition; changes in the availability and cost of capital; operating hazards, natural disasters, weather-related delays,
casualty losses and other matters beyond Crestwood’s control; timely receipt of necessary government approvals and
permits, the ability of Crestwood to control the costs of construction, including costs of materials, labor and right-of-way
and other factors that may impact Crestwood’s ability to complete projects within budget and on schedule; the effects of
existing and future laws and governmental regulations, including environmental and climate change requirements; the
effects of existing and future litigation; and risks related to the substantial indebtedness, of either company, as well as
other factors disclosed in Crestwood’s filings with the U.S. Securities and Exchange Commission. You should read filings
made by Crestwood with the U.S. Securities and Exchange Commission, including Annual Reports on Form 10-K and the
most recent Quarterly Reports and Current Reports for a more extensive list of factors that could affect results. Readers
are cautioned not to place undue reliance on forward-looking statements, which reflect management’s view only as of the
date made. Crestwood does not assume any obligation to update these forward-looking statements.
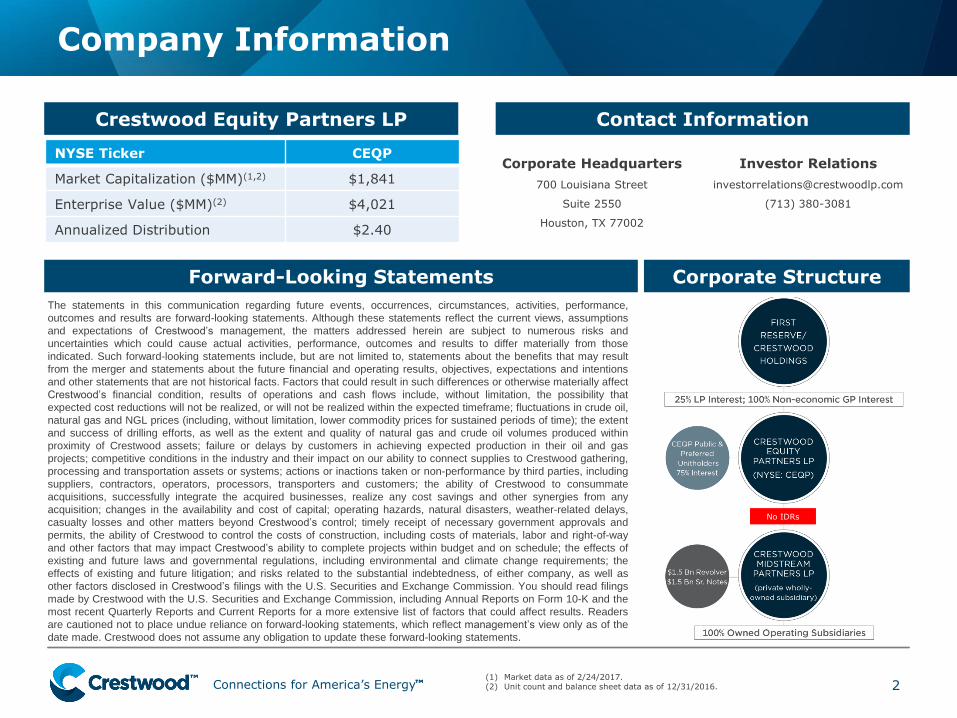
Company Information
2
Forward-Looking Statements
Contact Information
Corporate Headquarters
700 Louisiana Street
Suite 2550
Houston, TX 77002
(1) Market data as of 2/24/2017. (2) Unit count and balance sheet data as of 12/31/2016.
Crestwood Equity Partners LP
NYSE Ticker CEQP
Market Capitalization ($MM)(1,2) $1,841
Enterprise Value ($MM)(2) $4,021
Annualized Distribution $2.40
Investor Relations
(713) 380-3081
No IDRs
Corporate Structure

Connections for America’s Energy ™
™ ™
™ ™
™
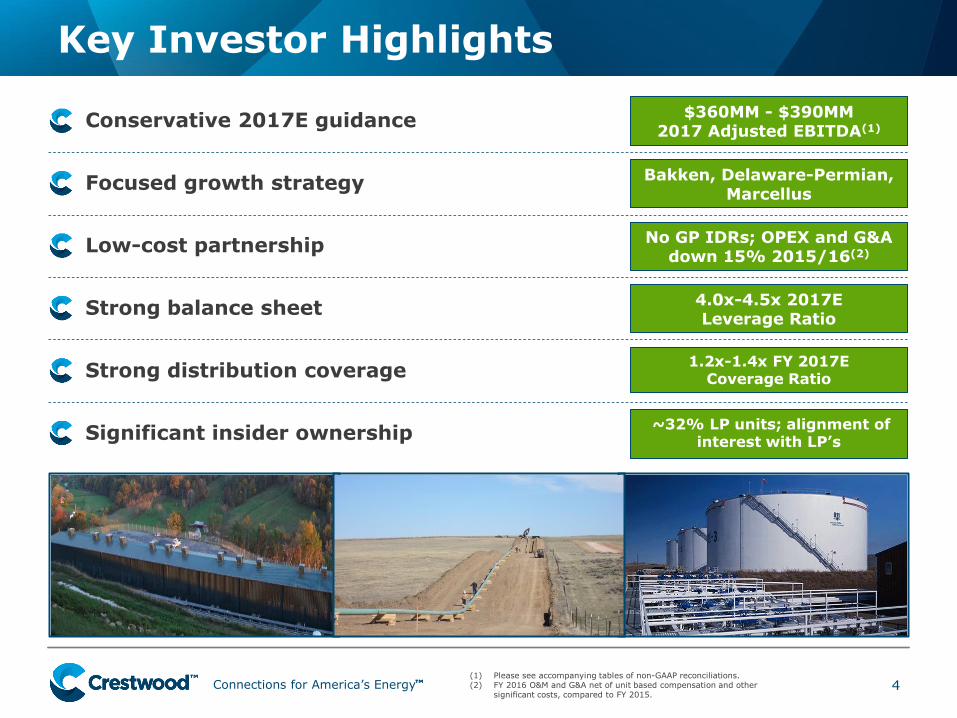
Key Investor Highlights
3
Connections for America’s Energy ™
™ ™
™ ™
™
Key Investor Highlights
4
• Conservative 2017E guidance
• Focused growth strategy
• Low-cost partnership
• Strong balance sheet
• Strong distribution coverage
• Significant insider ownership
$360MM - $390MM 2017 Adjusted EBITDA(1)
4.0x-4.5x 2017E Leverage Ratio
1.2x-1.4x FY 2017E Coverage Ratio
No GP IDRs; OPEX and G&A down 15% 2015/16(2)
~32% LP units; alignment of interest with LP’s
Bakken, Delaware-Permian, Marcellus
(1) Please see accompanying tables of non-GAAP reconciliations. (2) FY 2016 O&M and G&A net of unit based compensation and other
significant costs, compared to FY 2015.
Connections for America’s Energy ™
™ ™
™ ™
™
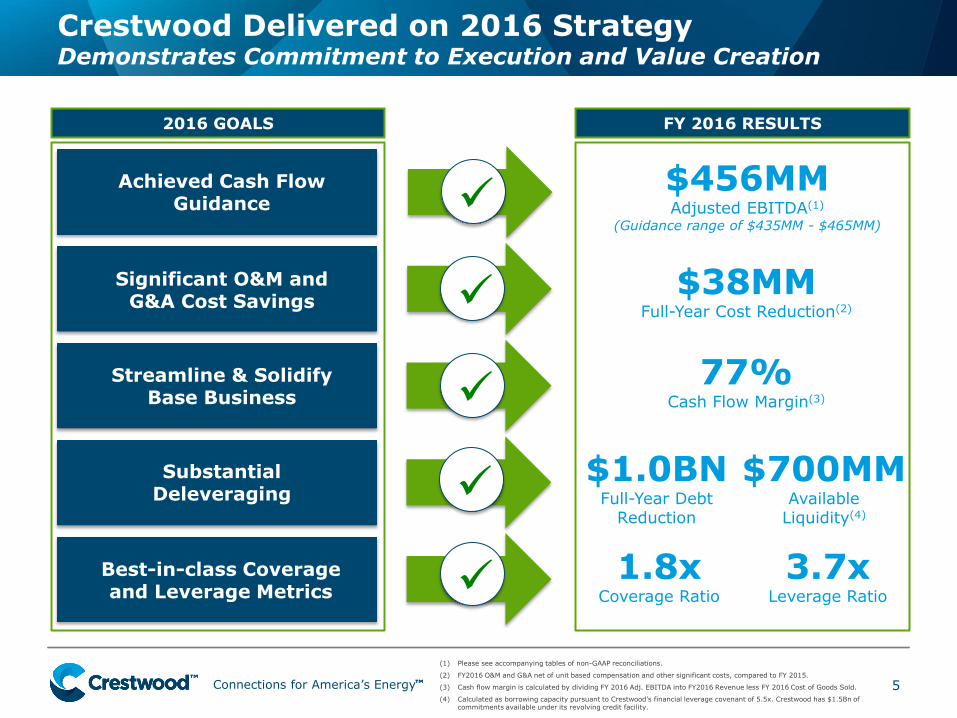
Crestwood Delivered on 2016 Strategy Demonstrates Commitment to Execution and Value Creation
5
Significant O&M and
G&A Cost Savings
Substantial Deleveraging
Best-in-class Coverage and Leverage Metrics
3.7x Leverage Ratio
1.8x Coverage Ratio
$1.0BN Full-Year Debt
Reduction
77% Cash Flow Margin(3)
2016 GOALS
(1) Please see accompanying tables of non-GAAP reconciliations.
(2) FY2016 O&M and G&A net of unit based compensation and other significant costs, compared to FY 2015.
(3) Cash flow margin is calculated by dividing FY 2016 Adj. EBITDA into FY2016 Revenue less FY 2016 Cost of Goods Sold.
(4) Calculated as borrowing capacity pursuant to Crestwood’s financial leverage covenant of 5.5x. Crestwood has $1.5Bn of commitments available under its revolving credit facility.
Streamline & Solidify Base Business
$38MM Full-Year Cost Reduction(2)
FY 2016 RESULTS
Achieved Cash Flow Guidance $456MM
Adjusted EBITDA(1)
(Guidance range of $435MM - $465MM)
$700MM Available
Liquidity(4)

Connections for America’s Energy ™
™ ™
™ ™
™ 6
Long-Term Outlook: Portfolio Positioned for Growth
Stabilized portfolio for 2017; increasing inventory of high quality growth projects drive DCF growth beginning in 2018+
• 2016/2017 execution drives de-risked base portfolio; stable cash flow outlook
– New contracts at Barnett and PRB Niobrara
– Repositioning COLT as long-term crude oil hub
• Focused new investments drive future growth
– Bakken, Delaware Permian and Marcellus
– Strong joint venture relationships with First Reserve and Con Edison
2016 2017 2018
• Deleveraged / de-risked
• Captured new growth projects in DP and Bakken
• Formed strategic joint ventures
• Trough cash flow; Maintain strong distribution coverage
• Execute Delaware Permian and Bakken growth projects under construction
• Northeast expansion (MARC II)
• Increased Stagecoach contribution
• Arrow expansions (Phase 2)
• PRB Niobrara Development
Repositioning
Execution
DCF Growth
2019+
• Nautilus system
• Delaware Ranch Expansion (Willow Lake)
• Increased Stagecoach contribution
• Arrow expansions (Phase 1)
• Improving commodity prices
Connections for America’s Energy ™
™ ™
™ ™
™
Commercial Update
7
Connections for America’s Energy ™
™ ™
™ ™
™
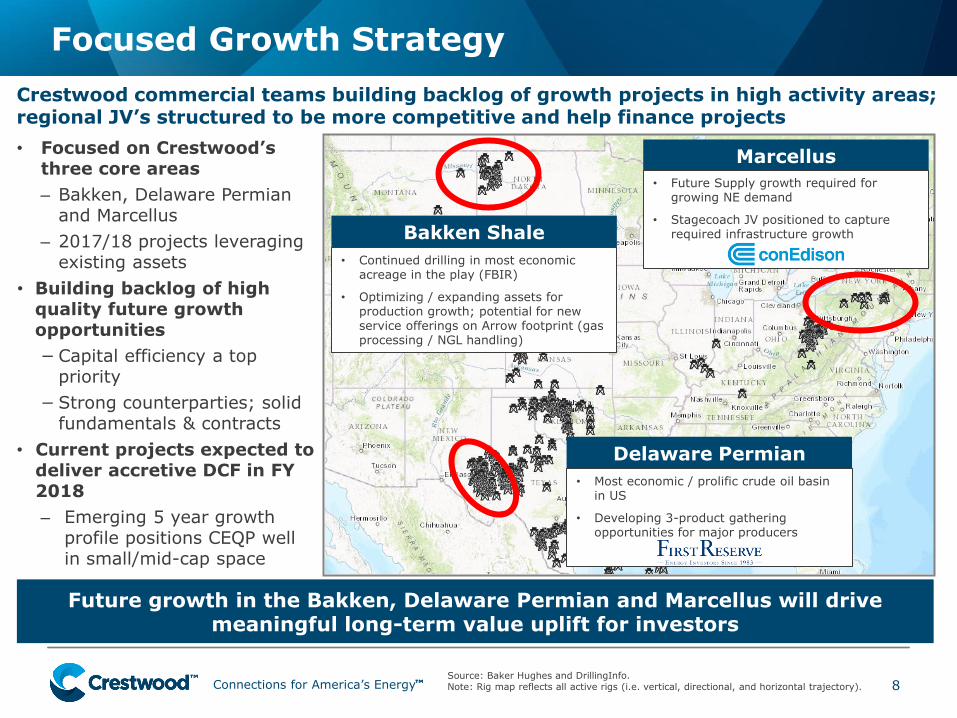
Focused Growth Strategy
8 Source: Baker Hughes and DrillingInfo. Note: Rig map reflects all active rigs (i.e. vertical, directional, and horizontal trajectory).
• Focused on Crestwood’s three core areas
– Bakken, Delaware Permian and Marcellus
– 2017/18 projects leveraging existing assets
• Building backlog of high quality future growth opportunities
− Capital efficiency a top priority
− Strong counterparties; solid fundamentals & contracts
• Current projects expected to deliver accretive DCF in FY 2018
– Emerging 5 year growth profile positions CEQP well in small/mid-cap space
Crestwood commercial teams building backlog of growth projects in high activity areas; regional JV’s structured to be more competitive and help finance projects
Marcellus
• Future Supply growth required for growing NE demand
• Stagecoach JV positioned to capture required infrastructure growth
Delaware Permian
• Most economic / prolific crude oil basin in US
• Developing 3-product gathering opportunities for major producers
Bakken Shale
• Continued drilling in most economic acreage in the play (FBIR)
• Optimizing / expanding assets for production growth; potential for new service offerings on Arrow footprint (gas processing / NGL handling)
Future growth in the Bakken, Delaware Permian and Marcellus will drive meaningful long-term value uplift for investors
Connections for America’s Energy ™
™ ™
™ ™
™
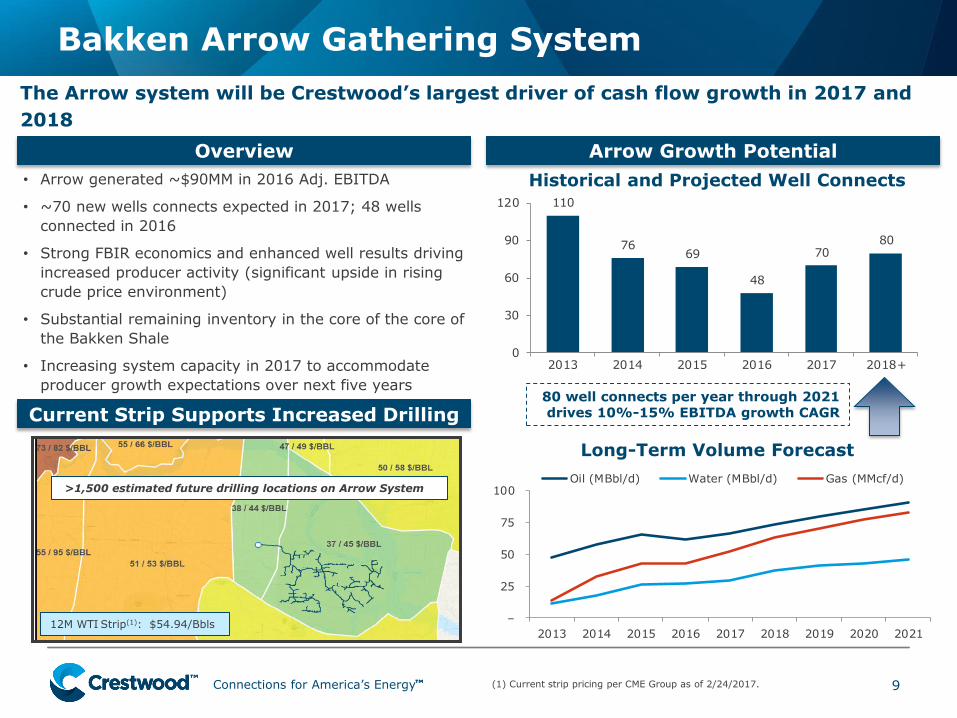
Bakken Arrow Gathering System
9
The Arrow system will be Crestwood’s largest driver of cash flow growth in 2017 and
2018
Overview
• Arrow generated ~$90MM in 2016 Adj. EBITDA
• ~70 new wells connects expected in 2017; 48 wells
connected in 2016
• Strong FBIR economics and enhanced well results driving
increased producer activity (significant upside in rising
crude price environment)
• Substantial remaining inventory in the core of the core of
the Bakken Shale
• Increasing system capacity in 2017 to accommodate
producer growth expectations over next five years
(1) Current strip pricing per CME Group as of 2/24/2017.
Arrow Growth Potential
Current Strip Supports Increased Drilling
12M WTI Strip(1): $54.94/Bbls
80 well connects per year through 2021 drives 10%-15% EBITDA growth CAGR
>1,500 estimated future drilling locations on Arrow System
110
7669
48
7080
0
30
60
90
120
2013 2014 2015 2016 2017 2018+
Long-Term Volume Forecast
Historical and Projected Well Connects
–
25
50
75
100
2013 2014 2015 2016 2017 2018 2019 2020 2021
Oil (MBbl/d) Water (MBbl/d) Gas (MMcf/d)
Connections for America’s Energy ™
™ ™
™ ™
™
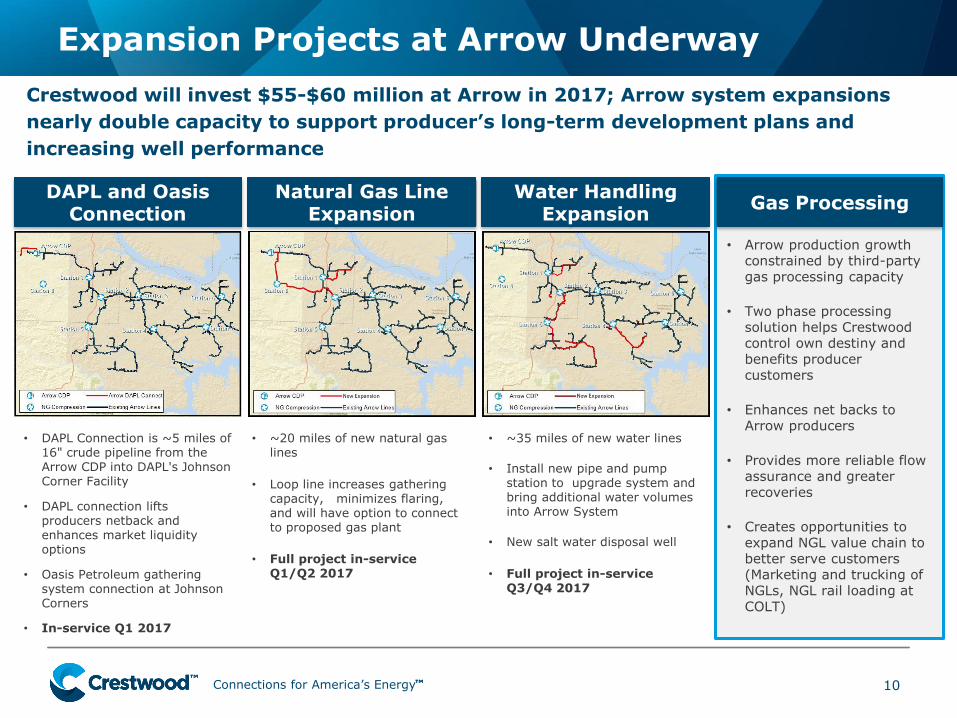
• ~20 miles of new natural gas lines
• Loop line increases gathering capacity, minimizes flaring, and will have option to connect to proposed gas plant
• Full project in-service Q1/Q2 2017
Expansion Projects at Arrow Underway
10
Crestwood will invest $55-$60 million at Arrow in 2017; Arrow system expansions
nearly double capacity to support producer’s long-term development plans and
increasing well performance
DAPL and Oasis Connection
Natural Gas Line Expansion
Water Handling Expansion
Gas Processing
• ~35 miles of new water lines
• Install new pipe and pump station to upgrade system and bring additional water volumes into Arrow System
• New salt water disposal well
• Full project in-service Q3/Q4 2017
• DAPL Connection is ~5 miles of 16" crude pipeline from the Arrow CDP into DAPL's Johnson Corner Facility
• DAPL connection lifts producers netback and enhances market liquidity options
• Oasis Petroleum gathering system connection at Johnson Corners
• In-service Q1 2017
• Arrow production growth constrained by third-party gas processing capacity
• Two phase processing solution helps Crestwood control own destiny and benefits producer customers
• Enhances net backs to Arrow producers
• Provides more reliable flow assurance and greater recoveries
• Creates opportunities to expand NGL value chain to better serve customers (Marketing and trucking of NGLs, NGL rail loading at COLT)
Connections for America’s Energy ™
™ ™
™ ™
™ 11
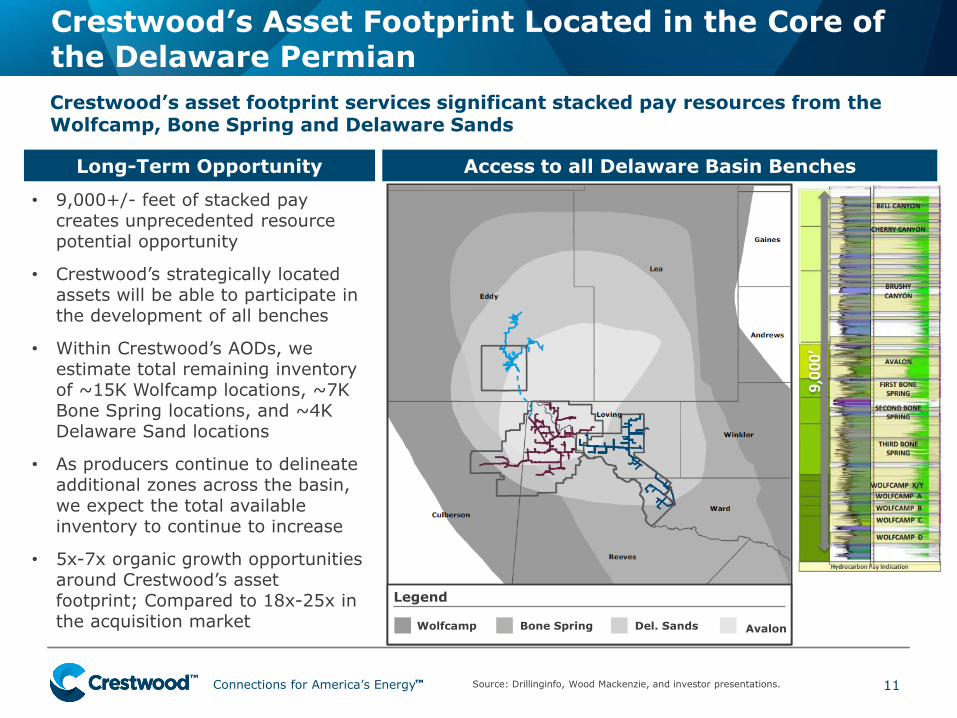
Crestwood’s Asset Footprint Located in the Core of the Delaware Permian
• 9,000+/- feet of stacked pay creates unprecedented resource potential opportunity
• Crestwood’s strategically located assets will be able to participate in the development of all benches
• Within Crestwood’s AODs, we estimate total remaining inventory of ~15K Wolfcamp locations, ~7K Bone Spring locations, and ~4K Delaware Sand locations
• As producers continue to delineate additional zones across the basin, we expect the total available inventory to continue to increase
• 5x-7x organic growth opportunities around Crestwood’s asset footprint; Compared to 18x-25x in the acquisition market
Crestwood’s asset footprint services significant stacked pay resources from the Wolfcamp, Bone Spring and Delaware Sands
Source: Drillinginfo, Wood Mackenzie, and investor presentations.
Long-Term Opportunity Access to all Delaware Basin Benches
Avalon Wolfcamp Bone Spring Del. Sands
Legend
Connections for America’s Energy ™
™ ™
™ ™
™
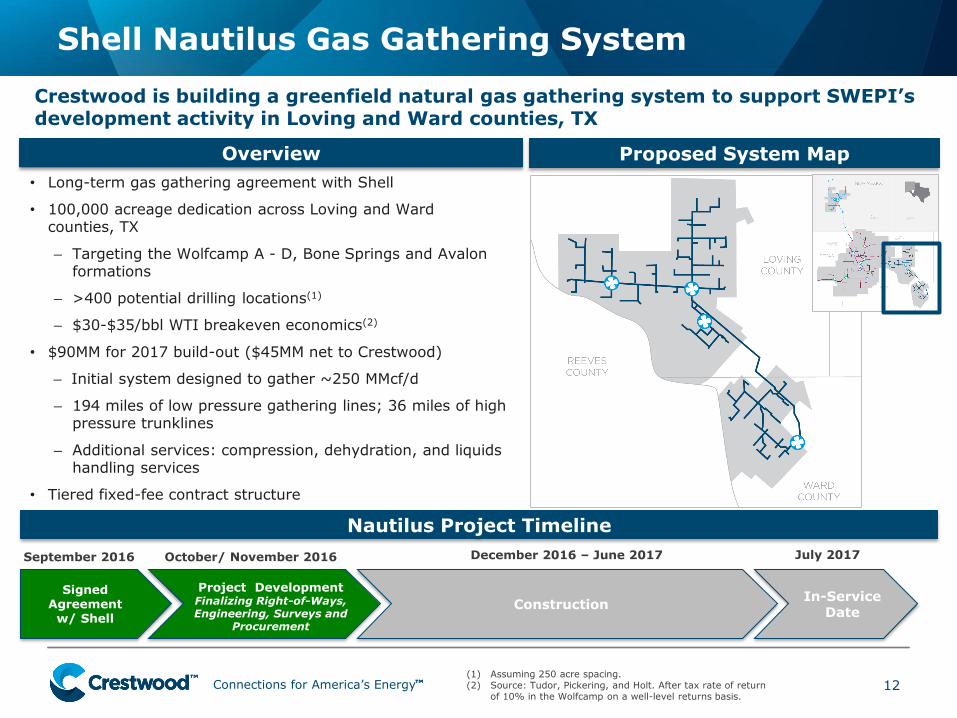
Shell Nautilus Gas Gathering System
12
Crestwood is building a greenfield natural gas gathering system to support SWEPI’s development activity in Loving and Ward counties, TX
Proposed System Map Overview
• Long-term gas gathering agreement with Shell
• 100,000 acreage dedication across Loving and Ward counties, TX
– Targeting the Wolfcamp A - D, Bone Springs and Avalon formations
– >400 potential drilling locations(1)
– $30-$35/bbl WTI breakeven economics(2)
• $90MM for 2017 build-out ($45MM net to Crestwood)
– Initial system designed to gather ~250 MMcf/d
– 194 miles of low pressure gathering lines; 36 miles of high pressure trunklines
– Additional services: compression, dehydration, and liquids handling services
• Tiered fixed-fee contract structure
Nautilus Project Timeline
In-Service Date
Signed Agreement
w/ Shell
Project Development Finalizing Right-of-Ways, Engineering, Surveys and
Procurement
September 2016 October/ November 2016 December 2016 – June 2017 July 2017
(1) Assuming 250 acre spacing. (2) Source: Tudor, Pickering, and Holt. After tax rate of return
of 10% in the Wolfcamp on a well-level returns basis.
Construction
Connections for America’s Energy ™
™ ™
™ ™
™
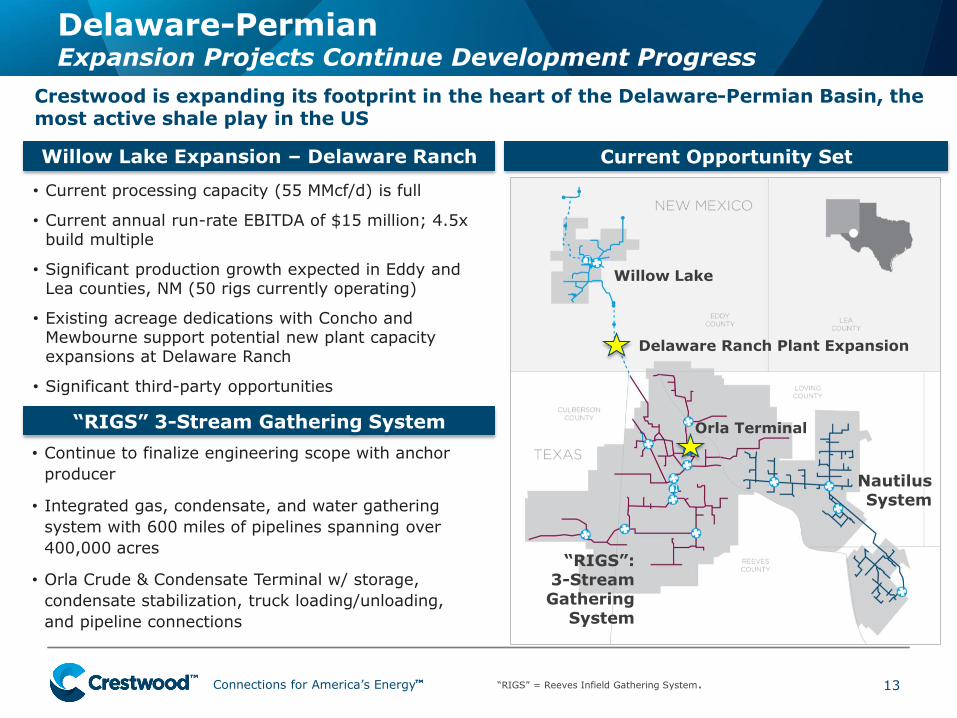
Delaware-Permian Expansion Projects Continue Development Progress
13
Crestwood is expanding its footprint in the heart of the Delaware-Permian Basin, the most active shale play in the US
• Continue to finalize engineering scope with anchor
producer
• Integrated gas, condensate, and water gathering
system with 600 miles of pipelines spanning over
400,000 acres
• Orla Crude & Condensate Terminal w/ storage,
condensate stabilization, truck loading/unloading,
and pipeline connections
“RIGS” 3-Stream Gathering System
Current Opportunity Set Willow Lake Expansion – Delaware Ranch
• Current processing capacity (55 MMcf/d) is full
• Current annual run-rate EBITDA of $15 million; 4.5x build multiple
• Significant production growth expected in Eddy and Lea counties, NM (50 rigs currently operating)
• Existing acreage dedications with Concho and Mewbourne support potential new plant capacity expansions at Delaware Ranch
• Significant third-party opportunities
“RIGS”: 3-Stream Gathering
System
“RIGS” = Reeves Infield Gathering System.
Orla Terminal
Willow Lake
Nautilus System
Delaware Ranch Plant Expansion
Connections for America’s Energy ™
™ ™
™ ™
™ 14
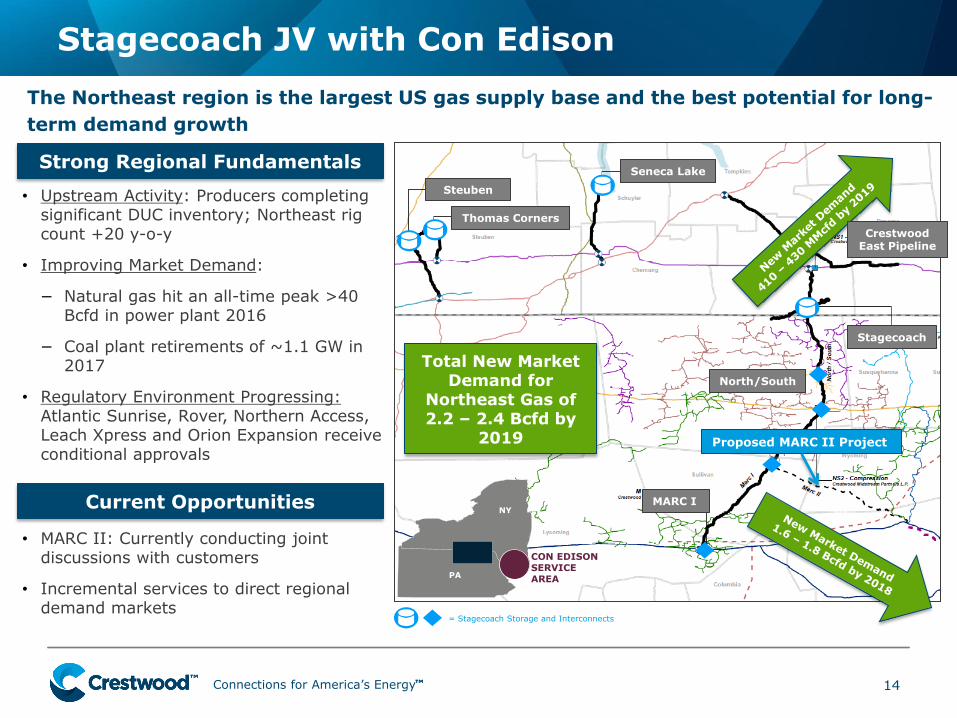
Stagecoach JV with Con Edison
• Upstream Activity: Producers completing significant DUC inventory; Northeast rig count +20 y-o-y
• Improving Market Demand:
− Natural gas hit an all-time peak >40 Bcfd in power plant 2016
− Coal plant retirements of ~1.1 GW in 2017
• Regulatory Environment Progressing: Atlantic Sunrise, Rover, Northern Access, Leach Xpress and Orion Expansion receive conditional approvals
Proposed MARC II Project
Current Opportunities
Strong Regional Fundamentals
• MARC II: Currently conducting joint discussions with customers
• Incremental services to direct regional demand markets
The Northeast region is the largest US gas supply base and the best potential for long-
term demand growth
MARC I
North/South
Steuben
Thomas Corners
Seneca Lake
Crestwood East Pipeline
Stagecoach
Total New Market Demand for
Northeast Gas of 2.2 – 2.4 Bcfd by
2019
= Stagecoach Storage and Interconnects
PA
NY
CON EDISON SERVICE AREA
Connections for America’s Energy ™
™ ™
™ ™
™
Base Portfolio Business Update
15 (1) Take-or-pay volumes contracted through fourth quarter 2018.
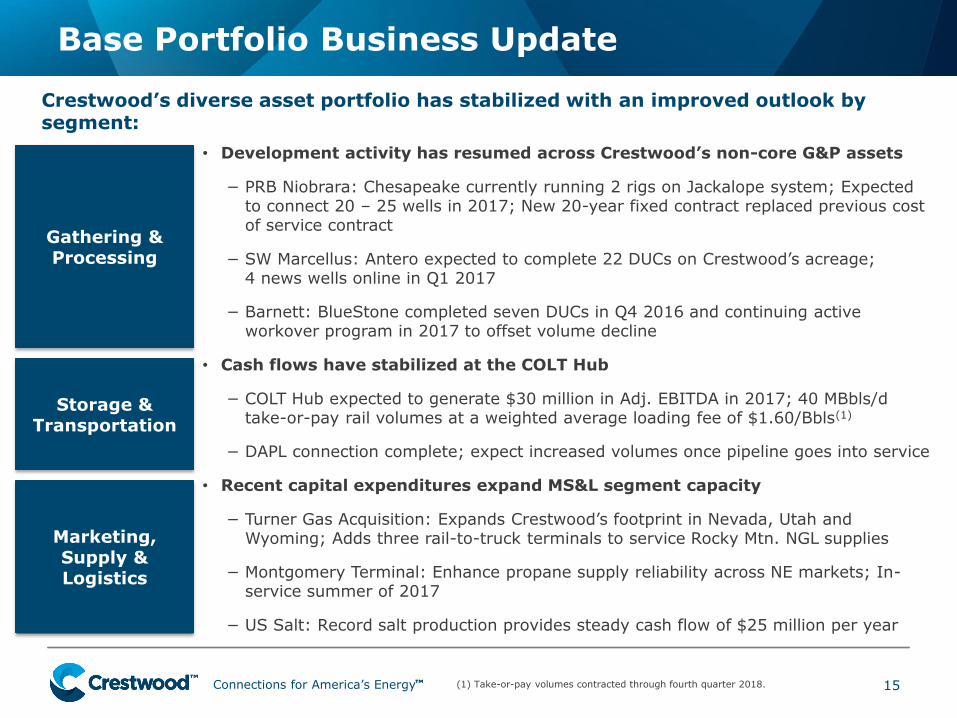
• Development activity has resumed across Crestwood’s non-core G&P assets
− PRB Niobrara: Chesapeake currently running 2 rigs on Jackalope system; Expected to connect 20 – 25 wells in 2017; New 20-year fixed contract replaced previous cost of service contract
− SW Marcellus: Antero expected to complete 22 DUCs on Crestwood’s acreage; 4 news wells online in Q1 2017
− Barnett: BlueStone completed seven DUCs in Q4 2016 and continuing active workover program in 2017 to offset volume decline
• Cash flows have stabilized at the COLT Hub
− COLT Hub expected to generate $30 million in Adj. EBITDA in 2017; 40 MBbls/d take-or-pay rail volumes at a weighted average loading fee of $1.60/Bbls(1)
− DAPL connection complete; expect increased volumes once pipeline goes into service
• Recent capital expenditures expand MS&L segment capacity
− Turner Gas Acquisition: Expands Crestwood’s footprint in Nevada, Utah and Wyoming; Adds three rail-to-truck terminals to service Rocky Mtn. NGL supplies
− Montgomery Terminal: Enhance propane supply reliability across NE markets; In-service summer of 2017
− US Salt: Record salt production provides steady cash flow of $25 million per year
Gathering & Processing
Crestwood’s diverse asset portfolio has stabilized with an improved outlook by segment:
Storage & Transportation
Marketing, Supply & Logistics
Connections for America’s Energy ™
™ ™
™ ™
™
Financial Review
16
Connections for America’s Energy ™
™ ™
™ ™
™
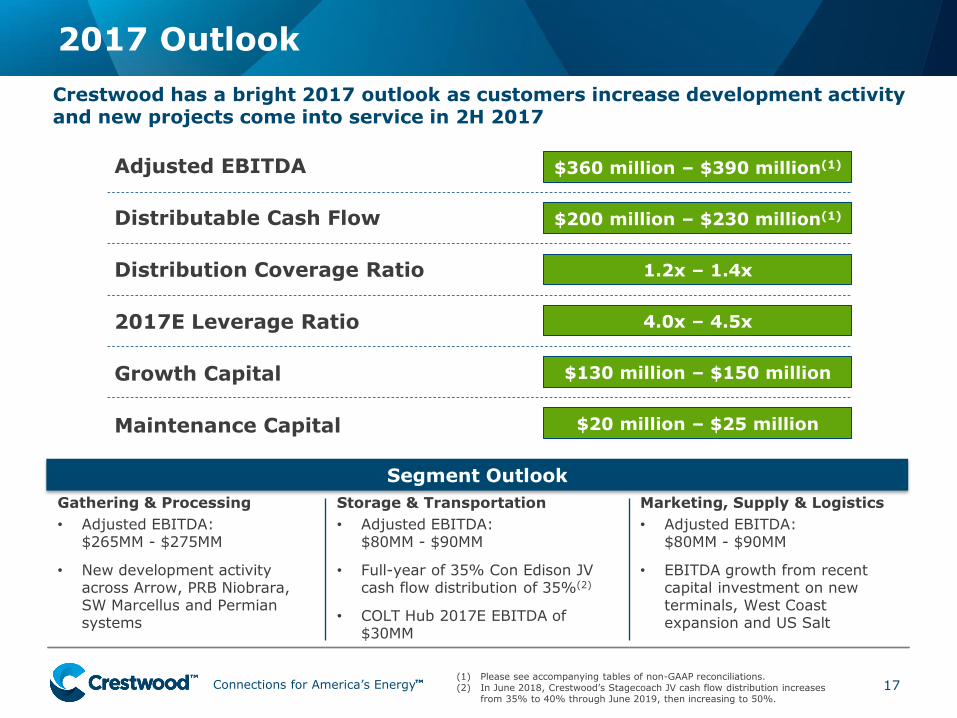
2017 Outlook
17
Marketing, Supply & Logistics
• Adjusted EBITDA: $80MM - $90MM
• EBITDA growth from recent capital investment on new terminals, West Coast expansion and US Salt
Crestwood has a bright 2017 outlook as customers increase development activity and new projects come into service in 2H 2017
Segment Outlook
Storage & Transportation
• Adjusted EBITDA: $80MM - $90MM
• Full-year of 35% Con Edison JV cash flow distribution of 35%(2)
• COLT Hub 2017E EBITDA of $30MM
Gathering & Processing
• Adjusted EBITDA: $265MM - $275MM
• New development activity across Arrow, PRB Niobrara, SW Marcellus and Permian systems
Adjusted EBITDA
Distributable Cash Flow
Distribution Coverage Ratio
2017E Leverage Ratio
Growth Capital
Maintenance Capital
1.2x – 1.4x
4.0x – 4.5x
$130 million – $150 million
$20 million – $25 million
$360 million – $390 million(1)
$200 million – $230 million(1)
(1) Please see accompanying tables of non-GAAP reconciliations. (2) In June 2018, Crestwood’s Stagecoach JV cash flow distribution increases
from 35% to 40% through June 2019, then increasing to 50%.
Connections for America’s Energy ™
™ ™
™ ™
™
$0
$100
$200
$300
2017 DCF 2018 Portfolio CF Incremental Preferred 2018 DCF 2018 Distributions
LP Distributions
@
$2.40 / unit
Excess Coverage
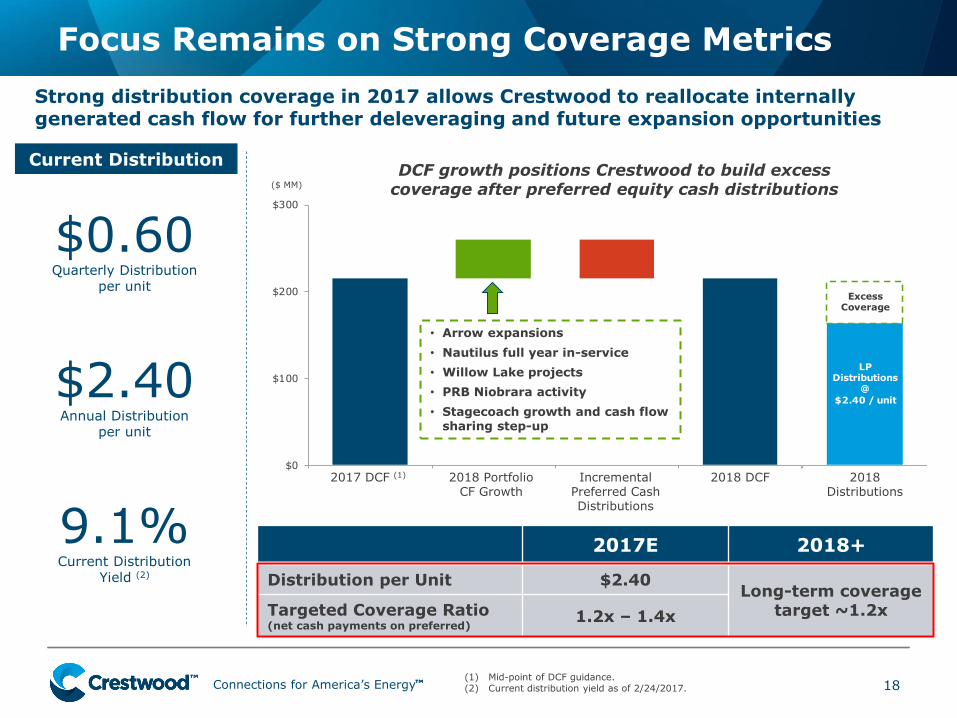
Focus Remains on Strong Coverage Metrics
18
$0.60 Quarterly Distribution
per unit
$2.40 Annual Distribution
per unit
2017E 2018+
Distribution per Unit $2.40 Long-term coverage
target ~1.2x Targeted Coverage Ratio (net cash payments on preferred)
1.2x – 1.4x
Strong distribution coverage in 2017 allows Crestwood to reallocate internally generated cash flow for further deleveraging and future expansion opportunities
9.1% Current Distribution
Yield (2)
(1) Mid-point of DCF guidance. (2) Current distribution yield as of 2/24/2017.
Current Distribution
($ MM)
• Arrow expansions
• Nautilus full year in-service
• Willow Lake projects
• PRB Niobrara activity
• Stagecoach growth and cash flow sharing step-up
DCF growth positions Crestwood to build excess coverage after preferred equity cash distributions
2017 DCF (1) 2018 Portfolio CF Growth
Incremental Preferred Cash Distributions
2018 DCF 2018 Distributions
Connections for America’s Energy ™
™ ™
™ ™
™
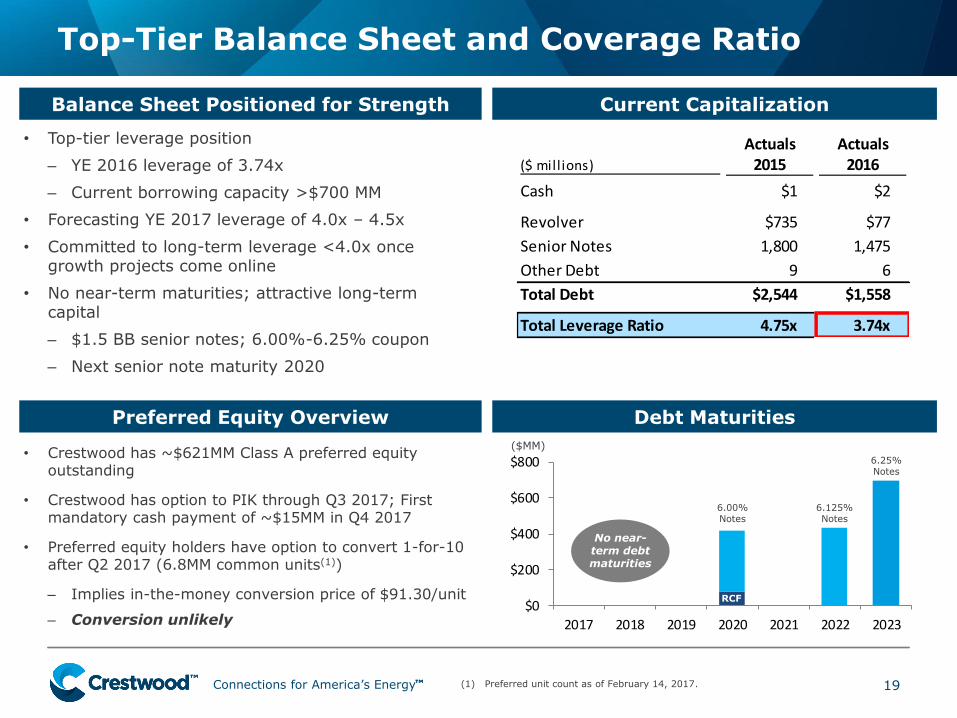
Top-Tier Balance Sheet and Coverage Ratio
19
• Top-tier leverage position
– YE 2016 leverage of 3.74x
– Current borrowing capacity >$700 MM
• Forecasting YE 2017 leverage of 4.0x – 4.5x
• Committed to long-term leverage <4.0x once growth projects come online
• No near-term maturities; attractive long-term capital
– $1.5 BB senior notes; 6.00%-6.25% coupon
– Next senior note maturity 2020
Balance Sheet Positioned for Strength Current Capitalization
Debt Maturities
$0
$200
$400
$600
$800
2017 2018 2019 2020 2021 2022 2023
($MM)
No near- term debt maturities
RCF
6.00% Notes
6.125% Notes
6.25% Notes
Preferred Equity Overview
• Crestwood has ~$621MM Class A preferred equity outstanding
• Crestwood has option to PIK through Q3 2017; First mandatory cash payment of ~$15MM in Q4 2017
• Preferred equity holders have option to convert 1-for-10 after Q2 2017 (6.8MM common units(1))
– Implies in-the-money conversion price of $91.30/unit
– Conversion unlikely
(1) Preferred unit count as of February 14, 2017.
Actuals Actuals($ millions) 2015 2016
Cash $1 $2
Revolver $735 $77
Senior Notes 1,800 1,475
Other Debt 9 6
Total Debt $2,544 $1,558
Total Leverage Ratio 4.75x 3.74x
Connections for America’s Energy ™
™ ™
™ ™
™
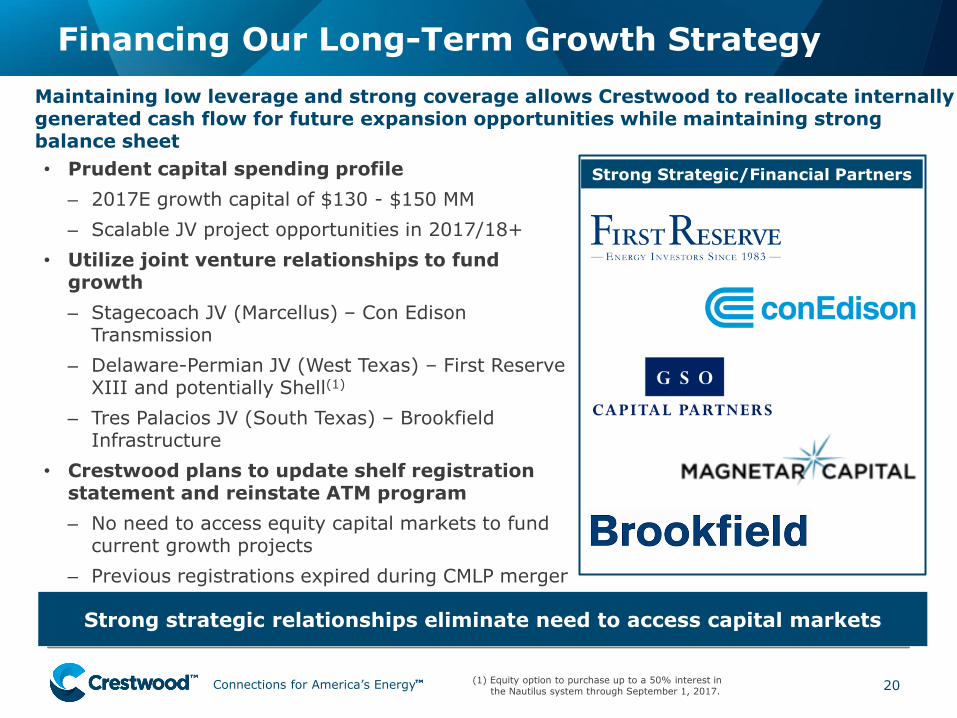
• Prudent capital spending profile
– 2017E growth capital of $130 - $150 MM
– Scalable JV project opportunities in 2017/18+
• Utilize joint venture relationships to fund growth
– Stagecoach JV (Marcellus) – Con Edison Transmission
– Delaware-Permian JV (West Texas) – First Reserve XIII and potentially Shell(1)
– Tres Palacios JV (South Texas) – Brookfield Infrastructure
• Crestwood plans to update shelf registration statement and reinstate ATM program
– No need to access equity capital markets to fund current growth projects
– Previous registrations expired during CMLP merger
Financing Our Long-Term Growth Strategy
20
Maintaining low leverage and strong coverage allows Crestwood to reallocate internally generated cash flow for future expansion opportunities while maintaining strong balance sheet
Strong strategic relationships eliminate need to access capital markets
Strong Strategic/Financial Partners
(1) Equity option to purchase up to a 50% interest in the Nautilus system through September 1, 2017.
Connections for America’s Energy ™
™ ™
™ ™
™
The Crestwood Investment Opportunity
21
Focused on aggressively executing growth opportunities while maintaining financial strength
• Near-term gathering and processing growth opportunities in the Bakken and Delaware-Permian
• Long-term northeast pipeline projects around existing assets with Con Edison
In the meantime…
• Crestwood is well-positioned to deliver attractive yield to investors(1)
– Current Yield = 9.1%; Coverage Ratio = 1.8x; Leverage Ratio = 3.7x
• Diversified business mix and strong contract portfolio
• No incentive distribution rights
• Assets leveraged to volume growth with commodity price improvement
• Reversion to Peer Group / Alerian yield provides significant upside for units
Execution Drives Significant Upside Return Opportunity
(1) Current yield data as of 2/24/2017. Coverage ratio and leverage ratio full-year 2016.

Connections for America’s Energy ™
™ ™
™ ™
™
Appendix
22
Connections for America’s Energy ™
™ ™
™ ™
™
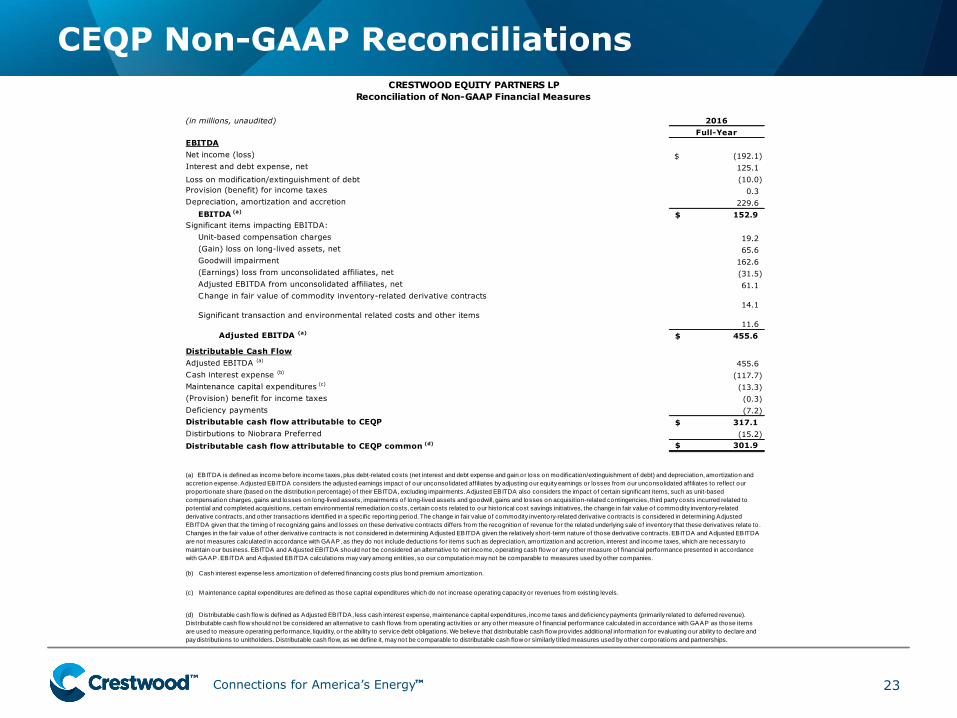
CEQP Non-GAAP Reconciliations
23
(in millions, unaudited) 2016
Full-Year
EBITDA
Net income (loss) (192.1)$
Interest and debt expense, net 125.1
Loss on modification/extinguishment of debt (10.0)
Provision (benefit) for income taxes 0.3
Depreciation, amortization and accretion 229.6
EBITDA (a)152.9$
Significant items impacting EBITDA:
Unit-based compensation charges 19.2
(Gain) loss on long-lived assets, net 65.6
Goodwill impairment 162.6
(Earnings) loss from unconsolidated affiliates, net (31.5)
Adjusted EBITDA from unconsolidated affiliates, net 61.1
Change in fair value of commodity inventory-related derivative contracts14.1
Significant transaction and environmental related costs and other items11.6
Adjusted EBITDA (a)455.6$
Distributable Cash Flow
Adjusted EBITDA (a)455.6
Cash interest expense (b)(117.7)
Maintenance capital expenditures (c)(13.3)
(Provision) benefit for income taxes (0.3)
Deficiency payments (7.2)
Distributable cash flow attributable to CEQP 317.1$
Distirbutions to Niobrara Preferred (15.2)
Distributable cash flow attributable to CEQP common (d) 301.9$
CRESTWOOD EQUITY PARTNERS LP
Reconciliation of Non-GAAP Financial Measures
(a) EBITDA is defined as income before income taxes, plus debt-related costs (net interest and debt expense and gain or loss on modification/extinguishment o f debt) and depreciation, amortization and
accretion expense. Adjusted EBITDA considers the adjusted earnings impact o f our unconsolidated affiliates by adjusting our equity earnings or losses from our unconsolidated affiliates to reflect our
proportionate share (based on the distribution percentage) of their EBITDA, excluding impairments. Adjusted EBITDA also considers the impact o f certain significant items, such as unit-based
compensation charges, gains and losses on long-lived assets, impairments of long-lived assets and goodwill, gains and losses on acquisition-related contingencies, third party costs incurred related to
potential and completed acquisitions, certain environmental remediation costs, certain costs related to our historical cost savings initiatives, the change in fair value of commodity inventory-related
derivative contracts, and other transactions identified in a specific reporting period. The change in fair value of commodity inventory-related derivative contracts is considered in determining Adjusted
EBITDA given that the timing of recognizing gains and losses on these derivative contracts differs from the recognition of revenue for the related underlying sale of inventory that these derivatives relate to .
Changes in the fair value of o ther derivative contracts is not considered in determining Adjusted EBITDA given the relatively short-term nature of those derivative contracts. EBITDA and Adjusted EBITDA
are not measures calculated in accordance with GAAP, as they do not include deductions for items such as depreciation, amortization and accretion, interest and income taxes, which are necessary to
maintain our business. EBITDA and Adjusted EBITDA should not be considered an alternative to net income, operating cash flow or any other measure of financial performance presented in accordance
with GAAP. EBITDA and Adjusted EBITDA calculations may vary among entities, so our computation may not be comparable to measures used by other companies.
(b) Cash interest expense less amortization of deferred financing costs plus bond premium amortization.
(c) M aintenance capital expenditures are defined as those capital expenditures which do not increase operating capacity or revenues from existing levels.
(d) Distributable cash flow is defined as Adjusted EBITDA, less cash interest expense, maintenance capital expenditures, income taxes and deficiency payments (primarily related to deferred revenue).
Distributable cash flow should not be considered an alternative to cash flows from operating activities or any other measure of financial performance calculated in accordance with GAAP as those items
are used to measure operating performance, liquidity, or the ability to service debt obligations. We believe that distributable cash flow provides additional information for evaluating our ability to declare and
pay distributions to unitho lders. Distributable cash flow, as we define it, may not be comparable to distributable cash flow or similarly titled measures used by other corporations and partnerships.
Connections for America’s Energy ™
™ ™
™ ™
™
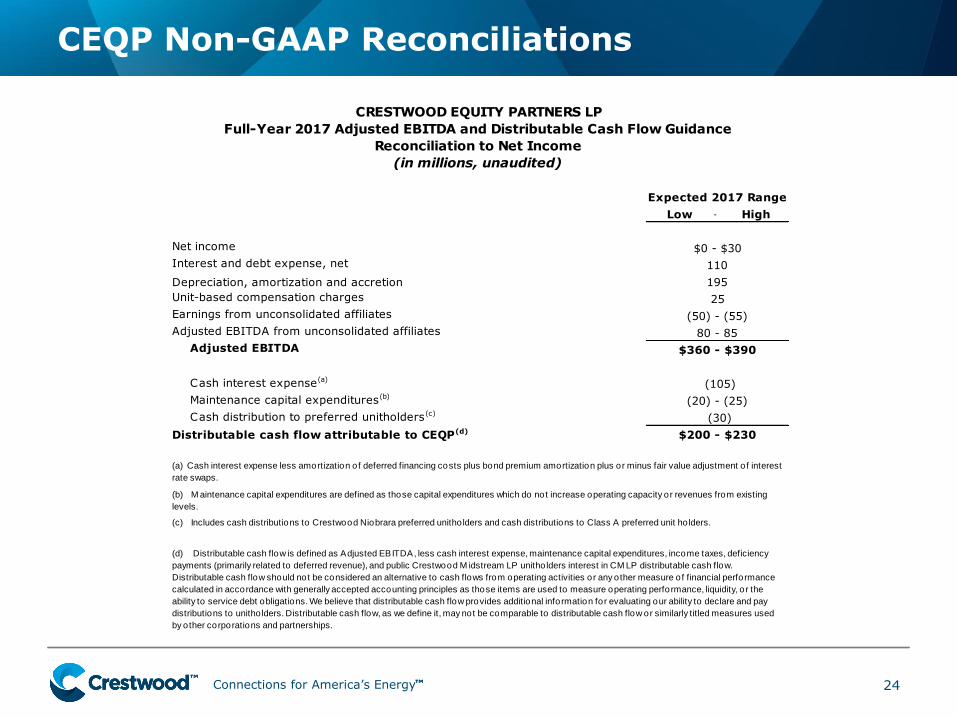
CEQP Non-GAAP Reconciliations
24
Expected 2017 Range
Low - High
Net income
Interest and debt expense, net
Depreciation, amortization and accretion
Unit-based compensation charges
Earnings from unconsolidated affiliates
Adjusted EBITDA from unconsolidated affiliates
Adjusted EBITDA
Cash interest expense(a)
Maintenance capital expenditures(b)
Cash distribution to preferred unitholders(c)
Distributable cash flow attributable to CEQP(d)
(d) Distributable cash flow is defined as Adjusted EBITDA, less cash interest expense, maintenance capital expenditures, income taxes, deficiency
payments (primarily related to deferred revenue), and public Crestwood M idstream LP unitho lders interest in CM LP distributable cash flow.
Distributable cash flow should not be considered an alternative to cash flows from operating activities or any other measure of financial performance
calculated in accordance with generally accepted accounting principles as those items are used to measure operating performance, liquidity, or the
ability to service debt obligations. We believe that distributable cash flow provides additional information for evaluating our ability to declare and pay
distributions to unitho lders. Distributable cash flow, as we define it, may not be comparable to distributable cash flow or similarly titled measures used
by other corporations and partnerships.
$0 - $30
CRESTWOOD EQUITY PARTNERS LP
Full-Year 2017 Adjusted EBITDA and Distributable Cash Flow Guidance
Reconciliation to Net Income
(in millions, unaudited)
(a) Cash interest expense less amortization of deferred financing costs plus bond premium amortization plus or minus fair value adjustment o f interest
rate swaps.
(b) M aintenance capital expenditures are defined as those capital expenditures which do not increase operating capacity or revenues from existing
levels.
(c) Includes cash distributions to Crestwood Niobrara preferred unitho lders and cash distributions to Class A preferred unit ho lders.
25
195
110
(50) - (55)
80 - 85
$360 - $390
$200 - $230
(30)
(105)
(20) - (25)