crime, fear of crime, and the deterioration of urban ... knight deserve commendation for the...
TRANSCRIPT

, 1.
·,.¥~. _e" - ~,>- d ,- ;.-., "-;:- ... H'_.~ _'_~._.' -.--~,,---,.--'-'---- . ·-·~--){ .. ··-~-~-----·.f>-"'-____ "~'~_'''' ____ ~K':''''_''''-''''''''''' ____ ,.
This microfiche was produced from documents received for inclusion in the NCJRS data base. Since NCJRS cannot exercise control over the physical condition of the documents submitted, the individual frame quality will vary. The resolution chart on this frame may be used to evaluate the document quality.
:; 111"2,8 1111/2.5
W IllP,2 22 iii: . w I~ I.l.I
I~ t IJ£ 2.0
II"I~ 111111.4 ~~11.6
MICROCOPY RESOLUTION TEST CHART NATIONAL BUREAU OF STANDARDS-1963-A
Microfilming procedures used to create this fiche comply with the standards set forth in 41CFR 101-11.504.
Points of view or opinions stated in this document are . those of the author(s) and do not represent the official position or policies of the U. S. Department of Justice.
National Institute of Justice United States Department of Justicle
. Washington, D. C. 20531
7-6-82
,. \.
t1?' '" ,. ,', ')i i
"
, t
•• ny ~." ,,'~ lJ. S. Department'of Justice
National Institute of Justice
Crime, Fear of Crime, and the Deterioration of Urban Neighborhoods Executive Summary
a publication of the National Institute of Justice
,
If you have issues viewing or accessing this file contact us at NCJRS.gov.

.v
! tt \\
r ! I t I· I r i
I, . I j' ,
\ I',
iii
,j
···1
\)
U.S. Department of JUStice IIIAlionallnS!ltute of JUstice
80748
This document has been reproduced exactly as received from the person or organization criginating it. Points of view or opinions stated in this document are those of the authors and do not necessarily represent the official position or pOlicies of the National Institute of JUstire.
Permission to reproduce this ~ted material has been granted by
Public Domain -Natj ana] TnsH tllte of .JUstice to the National Criminal JUstice RefEirence Service (NCJRS).
Further reproduction outside of the NCJRS system requires permission of the C~t Owner.
Crime, Fear of Crime, and the Deterioration of Urban Neighborhoods
Executive Summary
AUTHORS
Richard P. Taub and
D. Garth Taylor with
Jan D. Dunham
CONTRIBUTIONS BY
James Lucas Bruce Peterson Patricia Wittberg
. March 1982
U.S. Department of Justice National Institute of Justice
,
<:;;
.; <> ".~----"---,::\,,- -... -.~,-.. :,----~ --.(~-.--.~-....------~---~-~........-.-..--------~----~-~-----.-----------.-,..~-~I,'---"""",~--,,,,,-,-~,,~--,, .~ _____ ~.......2 ____ ._~ ____ ~,~ ___ . ______ '~ __ _
National Institute of Justice James L. Underwood
Acting Director
This project was supported by Grant Number 78-NI-AX-0131, awarded to the National Opinion Research Center, by the National Institute of JUstice, U.S. Department of Justice, under the Omnibus Crime Control and Safe Streets Act of 1968, as amended. Points of view or opinions stated in this document are those of the authors and do not necessarily represent the official position or pOlicies ofthe U. S. Department of Justice.
ACKNOWLEDGEMENTS
A project of this sort involves the efforts of numerous parti~ cipants. Consequently; a list of participants who provided important assistance must inevitably be incompl~te. However, Alene Bycer who served as our initial project coordinator, and played a major role in the development of the survey instrument, should be particularly singled out. The NORC field staff led by Paul Sheatsleyand Shirley Knight deserve commendation for the fielding of a complex and demanding project. Kathi Rose assembled historical materials and played the role of creativE~ gadfly. . Stan Merrill sensitized us to many of the issues in cr.ime research.
Al Hunter, Dan Lewis and Wes Skogan and the staff of the Northwestern University Reactions to Crime project were singularly collegial and helpful, providing support for the view that the community of scholars surmounts institutional barriers. Lewis, Skogan, Barry Wellman, William Wilson, Richard Sander, Debbie Haines of the Chicago Urban League, Robert Johnson of the Wieboldt Foundation, Jonathan Kleinbar.d, and Ron Grzywinski all read the initial draft and provided helpful suggestions.
Alan Wallis, our initial National Institute of Justice project monitor, played a helpful role in the early stages of the' project; and Richard Titus subsequently provided important encouragement, SUppOl:t and guidance.
The students in our Neighborhood Cl~ange seminar provided stimulation and encouragement. Student research assistants Jeff Elton, Steve Garry, David Kendall, Tom Lombardo, Mark Matthews, Valerie Morrow, Erol Ricketts and Tom Reif all provided valuable help. Wendy Guilfoyle, our initial project secretary, did more than merely secretarial tasks as she cheerfully participated in coding, keypunching, checking tables and the like. Sue Tepas, our current secretary, provided valuable editorial assistance as well as put forth an heroic effort in typing the final manuscript. She was assisted in the latter task hy Wendy Guilfoyle and Joan Pederson. We would also like to thank Lisa McIntyre who did the illustrations and Toshi Takahashi and her staff at NORC who typed the draft manuscript.
We were fortunate to find numerous people in our communities who were willing to provide time to talk to us. The .social science enterprise by its very nature requires cooperation freely given. We are grateful that many overcame their distrust of outsiders in order to advance our work. We hope that our fi.ndings merit that trust.
In a real scholarly community, the contributions of one's colleagues and students are important in subtle ways. We gratefully acknowledge their presence.

""-------
. .1
~! I
bAt
CRJ:ME., l"EAR OF CRJ:l1E. .AND THE DETERI:ORATJ:ON OF U~ NEIGHB.oRHOOD~
The Problem
The re.lationsh;i,p between cri.m.e and neighliorhood deteri.o~.atiQn is :; peculiar one .. Ameri.can c1.t;i.es are, rel,atiyelY.' spea,k.;i..ng t ~he lQC~ of serious crl.me problems, We know that WJ.thin these C;L.tl.es ~ crime is not equally d:i.stributed~-there are places which are known as high crime areas and others which are known for Being safe. We know a.s ~.;rell that there has been growing physical deterioration in American cities 1 particularly those in the north~ and that deter",· iorated are:as are often areas of high crime.
Yet, it would be a mis,take to assume' that the relationshi.p between the two is either simple or obvious. To begin with~ correl~ ation is not causation. Second; in some cases, deterioration may itself lead to crime, Arson by property owners is one simple but dramatic example, Third. some areas deteriorate in the absence of high rates of crime .. -they lose economic viability for a whole range of reasons. And fourth~ some areas improve even in the presence of high crime rates.
City Growth and Neighborhood Change
To understand how and why neighborhoods change and the role of crime in that process ,one must begin with the classic thecr:ies of how cities change. Our underlying model of urban social change is derived from the classic theories of Burgess (1925) as refined by large numbers of later theorists.
The Burgess orientation emphasizes that the city is a growing, organic system with the older neighborhoods located near the expand .... ing central business district and the newer neighborhoods further fr~ the center. Underlying the model is the assumption that people want to live as far from the city's center as is feasible, with fea~ sibility defined as some function of cost ,and time to travel to and frOIn the center to work. One reason then for the tree .... ring-like growth of the city is that the waves of people moving further from the center must await transportation innovations which enable them to arrive downtown at roughly the same time .and C!ost as from their previous location. The rich move further and further from the center; they are followed by the poor, who take their spacious homes and apartments and break them into smaller units.
There are several assumptions in this model. The first is that cities would continue to grow. The second is that the growth would be fueled largely by poor immigrants. The third is that transporta~ion systems would continue to function as spokes to a hub. car~ rying the population to and from the central business district.
Although the basic theory has been criticized for a range of reasons, there is a core set of ideas in it that appears to apply
-

broadly. The areas around central business districts often do, in fact, become twilight zones with second~c1ass uses and deteriorated houses. Although some rich people stay in the heart of the city, the wealthy do tend to move away from the city's center. Old neighborhoods deteriorate and become less desirable, and most neighborhoods have a kind of life cycle. Finally, transportation patterns have shaped cities' growth. When we come to focus on particular neighborhoods, we will ~foe examples of these processes at work.
Two subsequent variants on the general theory should be mentioned. Sectoral theory (Hoyt, 1937) suggests that instead "of uses always changing as one moves out from the center of the city, sometimes the same use patterns persist. For example, high income housing may expand along a relatively narrow strip moving northward. Multiple nucleation (Harris and Ullman, 1945) is a second variant. In this theory, nodes may be built up around which distinctive patterns of activity take place. In Chicago, for examp1e p the Ca:dffiet Harbor area, about ten miles south of the central business district, became a center of the steel industry.
The arrival of the automobile changed many of the patterns, although in ways consistent with the general assumptions of the theory. The increased flexibility the automobile provided made it possible for people to move yet further away and to fill in the spaces between rail lines. Commercial and industrial activity followed as well, the large tracts of cheap suburban land being ideal for their needs. At the same time, immigration from abroad auu from the South slowed. Consequently, there was no new popu1a .... tion to fill in the deteriorating areas near the center of the city, and. the center itself, having lost much of its reason for being to the suburbs, no longer grew. The central area became increasingly hollow, and the pattern of deterioration and decay accelerated.
In all of our northern cities, the 1950s, 1960s and the early 1970s saw an overheated succession process as we11. The suburban construction boom enticed whites to the suburbs. Blacks who had been crowded into restricted ghetto areas moved outward, hastening white flight. The final consequence is that many of our cities now appear set in patterns in which a growing proportion of the population is black (or Hispanic), and neighborhood succession is a basic fact of life, although the rate of that succession may have slowed. As we shall see, threatened succession accelerates fear of crime, contributing to behaviors which lead to neighborhood deterioration.
It should be added that there is a new type of succession observable in some cities, one whose significance so far may be exaggerated. Traveling under the name gentrification, it is the process of relatively affluent young professionals moving into neighborhoods and renovating them. As these areas become popular, many more people move into them, raising market values substantially, and, in some cases, driving away the original residents. This process, often takes place in the face of quite high crime rates.
-2-
. __ .. _- .... -.., ... . " ....
Investment and disinvestment, and the decision to move or not to . move , are market decisions bas"ed on complex stimuli of which cr~me and ~ear of crime are but two, Inadequate demand leads to lack of ma~ntenance and related deterioration when residents and landlords perceive that their neighborhood does not have a future Conversely, ~hen the future looks bright, they respond with rein .... · vestm:nt to ~mprove th7ir properties and make them more attractive, and w~th other aggress~ve market behaviors to attract new purchasers and tenants. '
Crime may be one of the forces leading to inadequate demand. Yet, under ma~y COllditions, it does not seem to have the deleterious effects on n:~ghborhoods one would expect it to. As we shall see th7re are ~~~ghborhoo~s i~ Chic~go with fairly high crime rates i~ wh~ch ma~s=!-ve ::enovat~Ol: ~s tak~ng place accompanied by the process of gentr~~~cat~on .. S~m~~arly, there are neighborhoods with relatively low cr~me rates ~n wh~ch det;;;!rioration is beginning to be eviden't adnd whe::e prope::ty values are not.. y.:eeping up with inflation because '
emand ~s re1at~ve1y low.
. The issue of neighborhood attractiveness and its relation to cr~m7 and fear.of crime is c?mp1~cated by the presence and resi~ dent~~l expans~on of 1arge"m~~or~ty populations in many major cities. What ~s c1ea:: ~s that the arr~va1 of blacks in a neighborhood is as~oc~ated w~th processes which often lead to deterioration. White f~~ght leads to an oversupply of housing and to property depreciat~on. It also ~f~en leads to underm~intenance and subdivision by landlords, re~l~n~ng, an~ the re~uct~on of city services. An important quest~on, then, ~s what ~s the impact of the arrival of b~acks on both perceptions and fear of crime and on investment actiV1ty.
. The previou~ discussion suggests the need to select for study ne~ghborhoods wh~~h vary on three crucial dimensions: first, whether cr~~e rates are h~gh or ~OWi second, whethe~ the neighborhoods are rac~ally stable or chang~ng; and third, whether real estate values are appreciating rapidly or slowly.
The c?m~ination ?f all ~hree sets of variables required us to locate a m~n~mum of e~ght ne~ghborhoods. Table 1 illustrates the way the ~ariables are combined and the Chicago neighborhoods we located ~n each category. We shall discuss the neighborhoods subsequently. Let us now turn to our research methods.
... 3-
,

CIl Pel
~ ~ H p::: U
iii 0:;>1
E-I :;>I CIlH
H...:I E-I CIlH H
~~ ...:I H
E-I ~ ~tf)
E-I~ c:I.l
ZH ~ ~~ H
U t!> ~ <X1Q U~
r-I ~ U ~
~ CIl ZPel
~ Hp
...:I
~~ ~:;>I c:I.lE-l .p::: P:::Pel OP-l 1iI~ QP-I ~ E-IZ UH ~ ...:I~ ~t!>
'"':J :~ PelU H E-I H Z
I U
~ H ~
! q tb
METHODS
We have compiled a rather urrasua1 data set, and many consider~ ations went into its construction. These include the selection of our neighborhoods; the conduct of our survey; and the development and fielding of instruments to measure the appearance of deterioration and the condition of shopping strips.
The selection of our neighbo~hoods included two problems. The first was to identify those eight which satisfied the requirements of our underlying dimensions. The second was to satisfy ourselves that the units under study were socially-meaningful.
Crime Rates. Crime rates were determined with the help of. the Chicago Police Department, which maintains a record of verified crimes used for, among other things, allocating manpower. Because none of our communities is coterminous with a police district, the department did special computer runs for us.
The police data provided the number of crimes. To determine the rates, we made use of 1978 population estimates for our areas. The city-wide average for index crimes in 1978 was 65 crimes per thousand population; we decided that we would classify communities with rates above the mean as HhighH crime and those with rates below the mean as "low" crime. Table 2 gives the rates for personal and property index crimes for 1978 .
TABLE 2
1978 INDEX CRIME RATES BY COMMUNITya
Community
Low Crime:
1. East Side
2. Beverly
3. Portage Park
4. Back of the Yards
High Crime:
5. Lincoln Park
6. Austin
7. South Shore
8. Hyde Park/Kenwood
Personal Crimeb Property Crimec Total Index Crime
1. 94
2.30
1. 63
9.13
7.55
15.99
17.42
13.45
... 5 ..
26.22
28.52
33.35
46.25
70,54
67,42
80.48
93,25
28.16
30 .. 82
34.98
55.38
78.09
83.41
97.90
106~70

}"-.,
/:; r
,
r; "
-'-',~-__ ,, _____ -,-,,-~.,_,_~,_, ___ ~,_-,,_, ___ ~ ___ " ___ ~_. __ . ___ ~~. ___ ._~_~..1.(,.:L-_. ___ ~_-.....-.,. .. _____ "" .. _ .... __ , " __ • _ .. __ . _, ~._ .. __ ~'" ....
aRates are per 1,000 popUlation.
bIncludes homicide, rape, assault, and robbery.
cIncludes burglary, index theft, and auto theft,
There is extensive argument in the literature about the valid~ ity of crime reports such as those we have used. Arguments have been made that reporting rates vary systematically among different groups in the population (National Research Council, 1976), and that police deal with crime r.eports differentially (see Silberman, 1978). One check on the validity of this rank order comes from our ovm survey. We asked respondents whether they or anyone in their house~ hold had experienced victimization since January, 1978, across a series of crimes. Readers should bear in mind that these figures are for a period of more than one year (15 to 18 months). In addi~ tion, they represent the occurrence of victimization rather than the actual number of victimizations, and they are not standardized for household size. Table 3 reportu the figures, again listing the communities in rank order.
TABLE 3
HOUSEHOLD VICTIMIZATIONS
(Per 1,000 Respondents by Cormnunity)
Personal Community Personal Property plus
Property
1. Beverly 53.98 160,71 214.69
2. Portage Park 40.82 183.67 224.49
3. East Side 39.41 198.53 237.94
4. ·Hyde Park/Kenwood 92.23 23.0.58 322 .. 81
5. Lincoln Park 72.94 253,52 326.46
6. South Shore 94.69 243.12 337.81
7. Back of the Yards 110.57 235.87 346.44
8. Austin 143.96 246.79 390.75
Although the rank orders c.hange somewhat, for the most part the distinction between high and low crime cormnunities was ma.intained. There was, however, one unanticipated result. Reports of the Back of the Yards residents moved them firmly into the high crime end of our communities. We were particularly surprised at this because
.. 6 ...
the ~orthw:-S:tern Un;i,yers;i.ty .R::C,:I,ct;i..ona·to CriJ.1le ~:roject h~d.pecently stud~ed this area (although. w~th aomewhat n;:tl;t'owe;J;' bO:lmd.;l,r-Lesl a.nd had i.ncluded it as a low cri'Ille a.recL This 'brougnt a. level ot ambigu;i.,ty into our analys;i.s which we ha:ve ·b.een able to convert.:tnto an a.dya,ntage .. The community is undergoing many important changes~ and we. were able to watch them closely,
The other big change ;i.,n rank is H.yde :Park/Kenwood which.. moves from eighth to fourth.. Hyde l?ark/E':enwood is th.e connnuni.ty which reports t.b.e h;tghest proport;i.on of its crime, something we would ex .... pect given that it is a highly mobilized community with an extens~ye amount of pr;i:.vate policing, Thls matter will De discussed in more detail subsequently.
Property Values. To ascertain levels of appreciat;i:.on, we relied on The Realt~ Sales Guide, which lists an unspecified s·ample of sales for di ferent areas of the city. We recorded sales of all structures for the years 1973 through 1978. We used various tech ... , niques,including site visits, to determine whether the buildings sold were single ... family dwellings I multiple .. family dwellings, com .... , mercial, or industrial properties and whether they were of brick or frame construction.
Our findings agree with thos'e of other scholars (see Molotch, 1972) that even though the number of sales is seriously underestimated in The Realty Sales Guide, there does not seem to be any systematic bias concerning what is included or dropped, In addition, we have cI..i..scussed our rates with knowledgeable observers, and have com?ared asking prices as they appear in newspapers.
We decided ";<) limit ourselves to the sale of single family houses because tl e. r seem to be more comparable on average and to represent clearly~defined sub~markets in each of our communities.
Table 4 shows the estimated rates of appreciation for each of the eight neighborhoods. As with the victimization data, there was also an unanticipated departure from our o~iginal classification schema here. South Shore, initially classified as slowly appreciating, and Portage Park, initially classified as rapidly appreciating, in fact show virtually identi.cal rates over the five ... year period. When we selected the neighborhoods for study, we had available to us data for only the first six months of 197'8. Those data clearly showed property values in Portage Park to be ~ppreciating at a more rapid rate than those in South Shore. Data for the entire year, however, just as clearly show their rates to be the same. What we have, then, are two communities with medium rates of appreciation.
The reader should note, however, that housing prices in Portage Park start at a higher level than those in two of our other three high appreciation neighborhoods. Portage Park' s basic housing ~3'cock is the small bungalow which, when set against the grander housirJ . .g of Beverly and the more diverse stock of Lincoln Park~ pales ind~ed. .Because both of the latter neighborhoods had depressed housing prices in the late 1960s, they have had further to travel to reach some-thing more nearly approximating the true value of the housing.
-7 ....
,

1.
2.
3.
4.
5.
6.
7.
8.
TABLE 4
MEDIAN SALE PRICE ~ SINGLE FAMILY HOMES--DETACHED ALL CONSTRUCTION TYPES
(Number of Sales in Parentheses)
Neighborhood 1973 1978
Lincoln Park $23,000 ( 37) $107,250 ( 36)
Hyde fark/Kenwood $42,250 ( 18) $ 95,000 ( 22)
Beverly $27,000 (207) $ 57 1 500 (111)
South Shore $22,900 (129) $ 45,000 ( 29)
Portage'Park $33,000 (249) $ 64,500 ( 61)
East Side $25,000 (142) $ 41,000 ( 24)
Austin $20,000 (236) $ 31,000 ( 47)
Back of the Yards $17,000 ( 91) $ 20 1 250 ( 22}
Percent Increase
366
124
113
96
95
64
55
19
We are confident that the rank orders for the conrrnunities represent the real situation; we are somewhat less confident about the actual rates reported. The city registers sales when the title is transferred. There are other kinds of purchase agreements, however, which may not show up for a long time, such as sales on contract, ~These sorts of sales tend to occur in deteriorating areas where low income purchasers cannot provide the money for downpayment, or where the a'reas are so effectively redlined that mortgage money is not available. If these sales were to be included, the median sale price for those areas would probably be further depressed.
Racial Composition. In this instance, we were again unable to rely on the census. However, we had available to us a report by the Chicago Urban League entitled "Where Blacks Livett (1978). This report identified areas where blacks lived in 1970, and where they lived in 1977. On that basis, we were able to identify communities where change had taken place, Our survey data confirm the Urban League's findings for 1977.
Community as Social Context
Perhaps one of the most perplexing and frustrating problems associated with the study of community is the elusive nature of the concept itself, The literatur.e is crowded with definitional dis-
.. 8 ...
........ ~_.,,' __ .... "~ __ . ....,.~ ______ ~_~.~ ___ ~ ___ ' , ___ '~-~----'~~'~--~-''i' - '-~"--,"- -,_0_-"_,-- .. ~-___ • ' .. -.~._._ . ...--........-__ .,_ ..... ~k .'-' -'--- "-Cr' .~., .. ,--
., . ~ - /
putes, and there are lengthy arguments .:tbout whether conununity has been lost, found,or redefined (see Wellman, 1979, for a good summary) .
We chose to focus on the neighborhood as a social context, Such an approach allows us to explore the ways in which different spatial areas serve as interactional pools for their residents, provide institution~, and become a source of symbolic and senti~ mental attachments. Individuals may vary greatly in the kinds of networks they d~velop in different social settings, but to suggest this is not to suggest that the setting is irrelevant. The connnunity's role as a social environment will vary with the needs and prefer-ences of the individuals who inhabit it.
If 'we make the assumption that a connnunity is a form of social organization having an impact on people" s lives, we can attempt to measure that impact. This brings us to the,task of identifying meaningful social urlits. In this regard, we were fortunate to be conducting the research in Chicago. Through a long history of connnunity research in' the city, areas of the city which fit that requirement have heeh well defined, and have taken on additional significance as they have become "named" areas, used by citizens and city agencies alike. We were able to choose just such areas for our research.
The Survey
Our survey questionnaire was designed to measure victimization experience, fear and perceptions of crime, attitudes toward neighborhood quality and re$ources, attitudes toward the neighborhood as an investment, and density of community involvement, Some items we developed ourselves; others we adapted from other works; and still others we included directly from other surveys such that comparisons would be possible.
After pre-testing and revision, the instrument was administered via the telephone. Respondents were selected by means of random digit dialing, and then, because telephone exchange areas are not coterminous with our neighborhood boundaries, screened for address. In order to avoid apprehension on the part of the .respondent, we did not ask for the exact address, but instead collected information on street name and block number. This helped to reduce anxiety that we were "casing" their houses, since we did ask about what they had for protection, including burglar alarms, dogs, and guns.
Our goal was 400 completed interviews in each neighborhood. Our final total was 3310, with the numbers in each neighborhood listed below. Our refusal rate for the sample as a whole was 29.5 percertt.
-9-
,

! f
Number of completed interviews per community
Portage Park Lincoln Park Austin Back of the Yards Beverly Hyde Park/Kenwood South Shore East Side
Total
395 433 395 418 401 417 441 410
3,310
In addition to the survey questionnaire, we developed two other instruments. The first, designed to measure the appearance of deterioration in residential areas, is d.ivided into three parts. The first part focuses on the level of maintenance of the structurei the second is concerned with the upkeep of the lawn; and the third
. focuses on the parkway, the area between the sidewalk and the street. The blocks of 25 percent of all respondents were measured with this instrument.
The second measured the condition of shopping strips. In addition to levels of maintenance, we recorded the uses to which E?'torefronts were put. Every shopping strip .at least two blocks in length was rated with this instrument.
Finally, we collected field data. We attended important neighborhood events, frequented stores and other places where people gathered, interviewed knowledgeable informants, and perused newspaper clippings. We had available student papers and published works about many of· these communities as well.
o
.. 10 ..
(,0 \1-""",
THE NErGHRQRHOQDS
Because social units have their own distinctive environments and attributes, the sum of the individuals in them is not always an accurate reflection of the whole. Consequently, social scien~ tists have found the relating of individua1.-1eve1 data to larger social units, of which the individuals are a part, to be problematic. The issue is particularly salient in survey data analysis because often the researcher is pushed into social psychological exp1ana~ tions for outcomes which are more comprehensible when the context in which the individuals are rooted is adequately understood.
Social scientists use several strategies to deal with the problem. The most common is to assign to each respondent a generalized version of contextual attributes which are presumably related to something significant about their daily environment and, conse ... quent~y, their experience. For example, respondents may be cate~ gorized as urban, suburban, or rural.
One problem, however, with global categories such as "urban'" or "rural" is that they mask a gr-2at deal of variation within them. When a researcher such as Fischer (1976), for example, examines the impact of "urbanness" on feelings of powerlessness, he is masking two effects. The first is the variation of life styles within cities; the second is differences between cities taken as a whole. Although this global approach is sometimes justified- ... for many matters, there are urban/non-urban differences--it is not sensitive to the fact that there is real structural variation in the settings in which people live, and one must know something about that structural variation at a fairly detailed level if one is to understand why they perceive as they do.
A second approach to the problem has evolved through the lit ... erature on contextual or multi-level analysis (Przeworski and Teune, 1970; Boyd and Iversen, 1979). That literature assumes that member ... ship per se in social groups will influence perceptions and behaviors. The analytic strategy is, thus, to add up the responses of the individuals in a particular group in order to produce a characterization of the group as a whole which then functions as an independent variable itself.
There has been controversy surrounding the methods one uses to measure contextual effects. Critics have, in some cases, argued that these findings are statistically artifactua1 (Hauser, 1970), and, in others, that unexplained variance can not legitimately be identified as "context". But the real problem is that there are other socially meaningful dimensions which can only be determined outside the survey data being collected. One can learn from survey data how people perceive matters or how they respond to particular stimuli, but without adequate knowledge of what the stimuli in fact are, their perceptions and responses are not v.ery i11uminatin6'
An example from our subsequent analysis illustrates thi,s point graphically. Much of our analysis turns on the perception of racial
-11-
,

I .
o __ .. _ ... __ . __ "." __ .. . __ ._.~ __ . _, __ ~_,_~,~,_ .. __ .. _~ ______ ~," __ ",. __ ~_~ __ .,_,_......-._~ ____ ~_N ____ .. __ ~ _______________ . ________ ~ __ .. _". __ ... _ .. __ ~_~~ __ ~ . ______ .. ~ __ .. ~ _" __ "_ .. ____ . _____ , ____ . __ ', _.~_. ___ "._. ____ ~_ ... ~ __ ,.
stability in the respondent~s community. But one cannot know whether those communities are in fact stable, either by looking at the respondent's perceptions or by knowing a few gross facts about the communities. Both Hyde Park/Kenwood and Beverly have substant~al black populations and lie directly in the path o~ ~lack expan~10n) and yet most respondents report that both commun1t1esare rac1all¥ stable. This perception is held directly counter to what percept10ns would be in 99 out of 100 similar settings. Respondents, however, are not dreaming. The stability has been won through the investment activities of key actors in each sector as well as through a range of othe_ strategies. ,The key actors were not ordinary residents. Universities, hospitals, and commercial interests all played impor~ tant and pivctal roles. Without their participation, it is not likely that stability would have been achieved~-no matter what everybody else thought or perceived.
The above addresses problems related to ,the understanding of social processes. When one is also concerned about social policy~ the argument takes on even more weight. People perceive what they do in these instances because of the actions of the key institutional a.ctors--actors who do not turn up in statistically measurable numbers in standard cross-sectional surveys. To learn how to create the state of affairs which results in perceptions which in turn lead to the maintenance of neighborhood quality, one must know what those institutional actors who succeeded did. The only way one can do so is to record through detailed historic and ethnographic information the relevant processes.
Consequently, we intend in the following sections to spend more time discussing the nature of these communities than is commonly done in such reports. This is done not simply to provide a backdrop for the data analysis. Instead, it is to provide the structur.al setting in which our respondents perceive, believe and act. For both the social theorist and the policy maker, this process is essential.
Beverly
The four communities selected because they had low crime rates are all regions with single-family houses as the primary housing type'. Portage Park, East Side, and the whites in Back of the Yards display similar patterns of ethnicity, length of residence and age. Beverly, located in the outermost Burgessian ring, stands in physical contrast to those three--much of its housing is larger and more elegant, its lots are larger, and some of its streets are slightly curving rather than displaying the standard Chicago grid pattern, The literature which promotes Beverly calls it a "Village in the City," Since it has no industry of its own, "Suburb in the City" might be a more accurate characterization. Traveling over its placid, tree ... lined streets, one does have the feeling of being in one of the city·s more prosperous suburbs.
What is not obvious to a newcomer, however, is that this placid~ ity represents a hard won achievement. Despite' its impressive natural amenities and its location far from the city~s center, its
-12-
character is the consequence of substantial intervention by residents and commercial interests. This is not unique to Beverly. With only one exception, all of our successful communities-~i~e. J those in which housing stock is well~maintained, there is little or no abandonment, and there is enough market demand for housing~",are communities in which considerable intervention has been required to prevent deterioration.
As the Burgess theory would suggest, Beverly got its start as a residential community with the arrival of the railroad, It is one of the few Chicago areas with a hill, ,and that amenity became the site of homes for wealthy businessmen. Although some of the housing away from the hill is substantially less elegant, Beverly grew and prospered until some time in the 1960s. However, Beverly stood in the path of south side black expansion. Property values began to decline. A few black residents moved into the community, and knowledgeable observers began to worry that Beverly was "going."
In 1971, an existing community organization, the Beverly Area Planning Association (BAPA), was reinvigorated, and Beverly residents, with financial support ,from a local bank and from commercial interests associated with a nearby shopping center, began a multi-pronged effort to deal with Beverly's "problems," BAPA·s annual budget went from 13,000 dollars to more than 100,000 as it devoted itself to a range of concerns. These included renewed attention to crime and youth problems, efforts to deal with real estate agents who profited from neighborhood change, and attempts to attract middle~class and white people to the area. The last involved, among other things, selling the community through literature, community "walks" and internal morale boosting.
Beverly has returned to the ranks of appreciating, stable com .... munities. However, even though its crime rate is low, and its residents do not report much fear, there are clues that the community focuses much effort on crime and related problems. For example, Beverly residents display an awareness of community anti~crime activity which, among our neighborhoods, is equalled only by Hyde Park/Kenwood, an area with substantially higher crime. The area's beat representative program is unusually well supported, and local newspapers devote much space to lauding police and community efforts to keep crime down.
In short, Beverly residents' responses to the threat of rac:ial change included efforts both to keep the flow of demand and cap1tal up in the area, and to nip potential crime problem~,in the bu~. Be~ cause racial change is seen as crime~connected, cr~me prevent10n activities are strongly encouraged so that residents are not alarmed,
To date, community activities have been remarkably suc~essful. Beverly residents perceive the neighborhood as stable, desp1te an increased number of black residents, and as low in crime.
-13-
1
f

( , . , ,
East Side
East Side is also in the outer Burgessian ring t However~ it is part of a sub~center formed by the steel mills in the south~eastern corner of the city. It grew with the steel industry, and the areas closest to the mills are the oldest and poorest; housing is newer and of better quality as one moves further away,
East Side has clearly defined boundaries including a river and a line of steel mills which set it off from the city, Not only are residents cut off from the city, but there is little reason for outsiders to pass through the community except directly to conduct their business.
In many respects, East Side comes close to being the idea1~ typical community which governs social science thinking, For an urban community, it has unusually high levels of residential stab"", i1ity. Twenty-five percent of our respondents have lived th~re all their lives and the median length of residence for the rest J.S 22 years. Seventy-five percent of the respondents report having re1a~ tives in the corrmmnity. and most of them visit their relatives at least once a week. People visit their neighbors a great deal as well. Thirty-four percent of East Side respondents work in the community, and most have at least one relative involved in the steel industry. What we have, then, is an unusual urban population, Property owners who maintain strong extended family ties, and who work, play, and pray together represent a kind of social ideal for some theorists which is seldom achieved anywhere, much less in city locales.
Although residents are pleased with their community, they do perceive themselves to be faced with tw~ t~reats. The f~rst is directly economic. The steel industry J.S J.n trouble natJ.ona11y, and the problems are exacerbated locally because the age of the plants means that much of the equipment is not efficient. Wisconsin Steel, one of the three major employers in the area, filed for bankruptcy during the period of our study. The others have laid off substantial numbers of workers.
The second threat derives from residents' fear of outsiders in general, and of blacks in particular. Efforts have been made to keep public housing as well as commercial land uses which might attract "outsiders" out of the community.
East Side residents tied for highest on our index of negative feelings toward blacks. They were, along with one racially changing neighborhood of older ethnic stock, most likely to believe that Hwhen a few black families move in, crime goes uptl and "when a few black families move in, property values go down. 1t And a substantial num ..... ber of residents explain that East Side has low crime because there are no blacks around.
East Siders do display a sense of precariousness and worry about crime, even though they are confident that they do not have a crime problem. Residents worked to close a game arcade because
... 14-
it encouraged k~ds to hang out there, They also worked to close a particular bar where it seemed as if too many stabo;i:.ngs· and other violent events took place. .
We see in East Side a staBle community I one which is 10w'in crime and perceives itself to be safe, so far, But it is also a community which feels embattled and that intransigence is what keeps it from disaster. This concern is not simply xenophobia. There is some evidence of undermaintenance in the northern part of the community. More importantly, the high median age of the popUlation coupled with low levels of appreciation leads us to believe that further deterioration is around the corner as residents are unable to recover maintenance money in the market. We predict that if blacks begin to move into that northern edge, the perception of crime will increase.
Portage Park
Like East Side, Portage Park is a low crime, mainly b1ue~ collar community inhabited mostly by ethnic whites, But whereas East Side is characterized by strong community identification, strong social ties, and a sense of hostility toward outsiders, Portage Park displays weak community identification, moderate to weak social ties, and a general sense of indifference to the out~ side world. Portage Park did not get its start as an industrial center, nor is its locale so isolated or c1ear1y~bounded.
Today Portage Park is mainly characterized by block after block of trim brick bungalows mostly built in the 1920s; each well cared for, and each lawn neatly cut and edged.
Residents" social ·ties are weak, The presence of relatives and friends, and visits with them are all relatively low. People in Portage Park do not jOin voluntary associations to deal with problems in the community (11.9 percent compared to 31.3 percent in Beverly), because they do not perceive that they have any problems.
Located in one of the rings distant from the central city, the community is shielded from many of the sources of crime. This is most dramc:Ltica11y illustrated by the fact that only slightly more than a third of respondents--a far lower proportion than in any other neighborhood--say there is an area within a mile where they are afraid to walk at night. (East Side comes next with a little more than half.)
Yet, even in Portage Park concern about race looms fairly large. On the index constructed of the two items "when a few black families move in, crime goes up," and "when a few black families move in, property values go down," Portage Park consist .. ent1y scores among the top four communities. And what is even more astonishing is that with no blacks and a negligible number of Hispanics and Orientals in the commun.ity, one .. third of Portage Park residents say that the neighborhood is racially changing. These are the people most likely to be worried about crime .
-15 ..
--......------.. -...:~,------=-..-:.....---~----~------'-----~-~----'---=---- .---.~. ---~-~., ....
,~
,

"
.. , '.
! t
---~--------~----------------------------------~
In sunnnarYJ then~ we have three low' cr;i:.me :-omm:un;tt;tes: .On some dimensions, they are comparable, Of our e~ght commun~t~es1 residents in these three are most likely to be home owners l long"" time residents older and living in conjugal families. They are less likely to'fear crime and less 1~ke1y to face the difficulties associated with urban life than are the residents of the other communities. They are not the most highly educated, however t nor even the most prosperous. (Three of our high crime communities compare favorab1x on these dimensions,) Two of them seem to be in some respect 'defended,1t
What seems to be the case for Portage Park is tha~ located in an outer ring of the city and on the north side t H natura1"t social forces which work to undermine other commnnities help Portage Park maintain itself.
Back of the Yards
During the course of our study, it became clea:r that B.ack of the Yards' status'as a low crime community was in doubt. The area abutting the famous Union Stockyards has always been a home for the low income workers at the yards and an entry point for immigrant groups coming to the United States, The stockyards, according to our theory, formed ~ mini~node.
Because much of the community resembled the northern section of East Side, both physically (small frame houses on small lots), and demographically (older, European~~orn, b1u~~co11ar ~oman C~tho-1ics) , the appraisal of it as a cohes~ve, ethn~c commun~ty fac~ng racial change made it especially interesting for us. We had not, however, realized the extent to which crime had increased in the area or the high levels of deterioration.
Although people of Polish descent stil~ comprise the.area·s major ethnic group, there are also substant~al concentrat~ons of people of Irish German, Slavic and Lithuanian descent, Mexican Americans now m~ke up 26 percent of the population, and a re~atively new black population accounts for anot~er 20 perc~nt, T~e R7s~ -panics, as Roman Catholics, are, relat~~ely speaJ:c~ng, be~ng ~ncor ..... porated into the life of the older ethn~c commun~ty. The black population is not. This difference is symbolized by two organiza~ tions in the area.
The B~ck of the Yards Council, founded by Saul Alinsky and Joe'Meega~ in 1939, persists in the :-ommunity with Meegan at ~ts helm. The organization has strong t~es to both the churches ~n the area and to the political organization. Its news~aper~ the Back of the Yards Journal, reflects that set of relat~onsh~ps. Most of the news is church-related. No other community newspaper in our sample so completely excludes news on crime, developments in housing and related matters. There are few black faces. In this respect, the Hispanics fare substantially better~
One gets the feeling that the Council is ·operating a holding action of sorts for the declining number of aging whites who live
. ,\-'"
in the area. They are one of the ~ost fearful group~ ;tn our entire study and report an astonishing amount of crime as well. Considering the whites only, Back of the Yards is demograpldcal1r very sim;tlar to East Side, Like East Si,de 'l'es;i:.dents, they are older ~ long~time residents vlith strong' community ties. Unlike East Side 'residents ~ they feel the neighborhood is deteriorating and, i.f they could afford it, many would move away, They ar,e, disproportionately f the trapped.
The relatively new black residents' do not differ substantially from the whites in most of their assessments of the'neighborhood~ They too see it as deteriorating. Their experience with victimiza~ tion is similar as well. Blacks in Back of the Yards are nearly as likely as whites to believe that the arrival of blacks ;tn a community increases crime and reduces property values,
Just as the Back of the Yards Council symbolizes and defines the white world for its constituency, the Organization for New City (ONC) stands for the black world. ONC was founded in 1976 by local black residents who were alarmed at the increasing number of abandoned houses in their area and the HUD contribution to that process. Unlike the Council, the world it pO'rtrays is a world of grim struggle and social disorganization. Where Meegan elicits cooperation from church leaders and political figures, ONC fights) the difference in approach illustrates the fact that one is "on the inside" and the other is not.
Supported at times by community anti~crime funds, ONC has a vigorous anti~crime program. Although ONC believes it must harass agents of criminal justice to get them to perform their duty, it must nevertheless park its bus for transporting the elderly at the police station. When left on the street in front of its offices; the vehicle was severly vandalized,
In counterpoise to both groups, the Hispanics show a more positive orientation to the community, This may reflect the fact that for many of them, Back of the Yards is fulfilling its traditional function as a point of entry for groups newly coming to this country. For such new arrivals, expectations are not necessarily very high. Rather, their current locale is probably better than what they left behind and is perceived as the first step on the ladder of upward mobility. This is in contrast to the whites who feel trapped and to the blacks who see their residential choice as one more in a set of severly restricted opportunities.
What we have here is a neighborhood without a meaningful economic function. The Union Stockyards closed in 1971, and although some industries hav~ located in the old stockyards, most of it is still vacant. There is weak demand. for its housing, In some sections, housing abandonment is as high as in any of our deteriorated neighborhoods, and .a higher proportion of buildings are undermaintained than anywhere else we have studied,
In some sense, then, Back of the Yards stands as a symbol of the precariousness of low-income, inner city neighoorhoods. In a
... 17-:"-,

.,- ---.-------------~---------------
- . __ ... ----.. -.-------- .. -.~--.. -.--.. -----.--.-.-.. -.--... ------... ---.--.. ~ ... --------- .....•• -------------.. -•. _-----.--..... __ ._--_ ..•. __ .----_._---.•. -----_ .. _._._. __ ._-_._-----_ .. -.. __ .
very short t;i..me, ;i.t has.move~ :l;rom be~ng a.s~able, lo~crime! ethn;i..c neighborhood to a d7ter~orat~ng one ~~th ~9her ~evels of cr~me~ But it would be a mJ.stake to lay that deterJ.orat~on on the doorstep of the accompanying high crime rates, In factI crime was' for some time held down while the neighborhood deteriorated,
Austin
Austin stands as a kind of middle America of urban communities, Austin is Chicago ,. s largest community area with a population of 125,000 people. It is part of that sector moving out from the central business district to the west that has succumbed to much deterioration. It is, however, bounded on the west by suburban Oak Park, a city which is still relatively prosperous (see Goodwin~ 1979)~
If one were to pick a community in which the classic racial change scenario was written out, one could scarcely do better (or worse) than Austin. According to Goodwin, blocks changed over from white to black at the rate of 37~ per year between 1966 and 1973. The turnover was accompanied, if not hasten~d,by every~ind of . abuse associated with such changes: panic peddling; racJ.al steerJ.ng; mortgage and insurance redlining; and the whole panoply of pr?blems associated with mal~administered FHA programs, In fact, AUstJ.n was one 0:1; the first communities in the country to make both redlining and FHA programs which accelerated deterioration into effective national political and social issues.
Like Beverly, Austin got its start as both a commuter village and a residence for railroad workers who worked nearby, Although t~~ area itself is still largely residential, there are major in,-.ustrial employers around its periphery. The housing is varied, and its residents have included representatives of a wide range of ethnic groups from the working and middle classes.
By 1940, however, there was some evidence of deterioration. By the time blacks began to move into the community in the 1960s, deterioration was well under way in the southern and eastern sections, Community organizations arose to deal with the changes. Some were Alinskyite in style, using confrontational tactics to gain improved city services or to fight redlining. Others developed a more negotiating orientation, persu~ding the school boar~ to a~low permissive transfers and the lJ.ke. Nonetheles.s, whJ.te flJ.ght progressed in a steady fashion, and the black popUlation moved in behind, aided by FHA mortgages and similar policies.
Today the northern third of Austin is still mainly white, and the southern two-thirds is predominantly black. Austin is among the most deteriorated of our neighborhoqds with high levels of aban~ donment a.s well. It has the worst litter problem and the least satisfactory shopping areas of any of our neighborhoods, It is also high in crime. In personal crime, it is the highest. In fact, Austin has, on occasion, been singled out as a high murder neigh ... borhood.
..
Overall, the patterns of sat;i..sfaction with the neighborhood and anticipation about the future are very similar for the Austin and Back of the Yards residents. Austin residents, however, report more serious neighborhood problems than do Back of the Yards residents. They are also more likely to worry that they will be a victim of a crime, and that their houses will be broken into when they are away.
The crime problem is compounded by an acute sense that the police do not provide much help. In fact, there is a more pervasive sense in Austin than in any of our other neighborhoods that agents of the city have "written them off.n
In ~hn~t, Austin, like Back of the Yards, is an acutely de~ pressed area. High in crime, low on most other measures of neigh ..... borhood quality, it is close to being the very model~ at least in its southern two-thirds, of the deteriorated urban area. Prospects are slightly better in the north where newer single family housing is the predominant type, But Austin is the one example among all of our neighborhoods of fear of crime having driven people deep into their homes, with the result that they make low use of community resources and have trouble banding together for the collective welfare.
South Shore
South Shore is a mostly blac~ high crime community of diverse housing stock whose residents vary widely in terms of income, occupation, and family type, Despite the fact that it displays many of the attributes of the other high crime areas we have discussed so far--high levels of deterioration in its housing stock and shopping strips, a high rating on the list of neighborhood problems~-on other indicators, it fares better. After a period of stagnation, property appreciation rates have begun to improve. And its residents are substantially more optimistic about the future than are the residents in the other high crime areas. A larger proportion perceive i·t: to be a good investment, and, asked how the neighborhood will change in the next two years, the highest proportion in any area except Lincoln Park say it will get better ..
One reason for the appreciation and the optimism is that~ compared to other changing or changed neighborhoods, the flow of investment funds to the area has not been choked off. For reasons too detailed to be discussed here, the neighborhood bank in South Shore has been committed to investing heavily in its own community .. The presence of the bank has also served as a catalyst to potential investors from outside the community. The neighborhood evidenced the familiar processes of deterioration during the period that it underwent racial change, but the renewed flow of investment funds seem to have reversed the process.
Community activists in South Shore helped to ensure that the bank continued to invest in the community. They have also been active on other fronts. They have campaigned with some success
-19 ..
,

; , !
against prostitutioni they organized to vote some pr3cincts dry; and they were able to preserve the buildings of the fine old . country club, after the Park District I having taken the club \' s lands, had decided to replace them. Whereas Back of the Yards and Austin are characterized by discouragement because similar efforts have failed, South Shore's limited optimism is based on a record of past successes which encourages further efforts and subsequent successes.
. South Shore residentsdo.perceive that they have a lot of cr~me. Nonetheless, many bel~eve the community will reassert itself as an attractive, lakefront area not too far from Chicago"s loop.
South Shore provides a hint that high crime and racial change do no~ necessarily.lead to deterioration. Instead, they may have some 1mpact.on att1tudes tow~rd the community and the consequent flow of cap1tal. If the cap1tal flow can be maintained, the picture may be altered. We have already seen another example of that process at work in Beverly.
We will now turn to our final two high crime cases Hyde Park/ Kenwood and Lincoln Park. Both have measurable black p~pulations, and ea~h in its own way is thriving.
Hyde Park/Kenwood
Hyde Park/Kenwood is the home of the University of Chicago. Stab~e and racially integrated, it is also the site of the most mass1v~ ~evel of organized and planned investment of any of our commun1t1es. ~od~y, although a high crime community by most of our measures, 1t 1S among the least deteriorated and best main~ tained.
Althoug.h Hyde Park and Kenwood began as separate suburbs in the second.ha~f of the.nineteenth century, the communities' fortunes have been 1~t1mately l1nked to the growth of the University of Chicago, whose found1ng followed on the heels of the Columbian Exposition.
'By 1942, Hoyt was able to write about Hyde Park/Kenwood,
in the next ring of growth beyond the inner core .of old Chicago . . . a constant struggle is going on to preserve a community form and structure from the infiltration of blight from the broken down and disintegrated sections of the old city (p. 37).
Hyde Park lay in the path of black expansion southward from Chi/cago's historic black belt.; and, in the post World War II period the pat~ern of racial ch~nge we have seen elsewhere began, Between' 1950 a~Q 1956, 20,000 wh1tes left the community and 25,000 blacks moved 1n. The process of undermaintenance and a soft housing mar~ ket ~ubs~quent~y began. However, Hyde Parkers organized to begin cons~der1ng urban renewal for the area. The University, which had
'._~~~_W _______ ~ __ _
----.-------------------------------------------------------------------------
been uncertain as to what its lev·el of involvement should be, ente",="ed into the planning process with energy and commitment following the robbery and attempted rape of a faculty wife,
The University and its community organizational arm, the South East Chicago Commission, played a major role in attracting urban renewal funds to the area and in planning how they should be spent. Ultimately, more than 30 million dollars of federal funds were spent on urban renewal. Although it is difficult to guess how much additional investment was generated by the process, 90 million dollars is one figure that is often given. The area's most blighted buildings and those commercial strips which housed numerous taverns were replaced with town houses and a shopping center.
Other efforts have been made to shore up the housing market. Building codes have been vigorously enforced; there has been some selective purchase of problem buildings; a federal savings and loan association was chartered to avoid the deleterious effects of redlining; and efforts have been made to enrich local schools.
Crime has been an important and continuing concern for every~ one involved in the community. The University supports a security force of 80 .... 90 people which actively patrols the area in marked cars. The University has also ins~alled emergency telephones throughout the area. In addition, it operates a fleet of buses which t~avel around the community both day and night, transporting people who are connected to the institution.
The South East Chicago Commission provides legal assistance for the victims of crimes, offers rewards for information leading to the perpetrators of major crimes, works with witnesses to encourage them to appear in court; and maintains strong rapport with the police.
The Hyde Park/Kenwood Community Conference has organized meetings to discuss what to do a~out crime; organized a Whistlestop program in which citizens blow their whistles when they see a crime in progress; and promoted Operation Identification.
The final consequence of all this activity is that Hyde Park! Kenwood is a strong, stable, racially integrated community. Along with Beverly and Lincoln Park, it undermines the theory that racial succession must inevitably follow from the presence of a black population. Nonetheless, racial stability does not happen by itself"; massive intervention by community leaders and a commitment from residents are required to support integration. Tn our communities, this is born out by the fact that Hyde Park and Beverly residents are the most likely to say they are in racially stable communities.
Hyde Park follows Beverly as the organizationally most active of our communities. High levels of cohesion, optimism, and positive sentiments toward the community continue even though crime levels are high in lIyde Park/Kenwood and the citizens are fearful. Both of these things are true despite the enormous efforts discussed above to reduce crime. Even though they have made a series of decisions
-21-
I

11'
about how they are going to live their lives in such an area-:staying off the streets at night, avoiding public transportat~on, and choosing a safe house--Hyde Parkers still have nagging worries. On only' one measure of fear are Hyde Parkers less fearful than residents in most other communities. They do not worry about their children at school.
In short, we see in Hyde Park massive intervention to prevent a community from deteriorating when faced with racial change and high crime rates. The intervention seems to have succeeded. The community is thriving, property is appreciating, and properties are moderately well-maintained, even though crime continues to be a major problem for its residents.
Lincoln Park
If one were to have observed Lincoln Park in the 1950s, one would have seen an exemplar of the concentric zone theory of growth and deterioration. Lincoln Park was in that rin.g which 'tvas beginning to decline. The older ethnic groups were moving away, fine old houses were being subdivided, and property values were going down. If one were to have observed Lincoln Park in the 1970s, however, one would have found support for the sector theory of gr@wth. Lincoln Park was booming economically, and to the sector~oriented theorist, that t:r't'owth would have appeared inevitable. The wealthy ar,3a on the northern edge of the city was simply continuing its move northward. This explanation, however. is too simp1e--a1though investors in the 1960s chose Lincoln Park because it was adjacent to another upper-middle class area, its development took place, as did Hyde Park/ Kenwood's, because of large-scale planned intervention.
Lincoln Park has also followed the model of the gentrifying area. While it was declining, artists and Bohemians found the area. People who could appreciate housing bargains and were willing to renovate to recover the aesthetic values of the area were the first wave in the process of gentrification.
These people, along with others in the better maintained areas, and leaders of the neighborhoodts major institutions, formed community associations to maintain and "upgrade" the area. The Lincoln Park Conservation Association was formed and, taking a leaf from the University of Chicago book, began working wi.th the Department of Urban Renewal. Ultimately, substantial rene;~ra1 did take place, focusing on the southern boundary of the community and neighborhoods where minorities lived. Subsequently, the city's major developers moved into the a-rea, constructing high-rise buildings with lake and park front views, and lower-rise units elsewhere.
Today, community residents fight the fights of the middle class. Although few residents in Lincoln Park are married or have children (the area is heavily dominated by young professionals, many of whom are single), efforts have been made to upgrade the schools. Residents now also fight the construction of additional high-rise buildings which would, in their view, bring more congestion to an already
Crime continues to be a serious Lincoln Park problem and is one of the matters which concerns community organizations. Lincoln Park ranks highest of all our neighborhoods in property crime; in total crime as determined by victimization reports, it ranks third.
Crime, however, does not interfere with Lincoln Park residents' satisfaction with their neighborhood. With 93 percent reporting satisfaction, Lincoln Park ranks third among our communities. People realize that the area is high in crime, yet that does not deter them from appreciating it. In this regard, they are like Hyde Parkers. However, unlike Hyde Parkers, they do not have the high levels of organizational involvement and social integration based on neighboring which are supposed to alleviate fears and tensions related to crime. Although they do have many friends both inside and outside the community with whom they visit frequently, they do not belong to many organizations. And they are the least likely of the residents of any community to have neighbors they can rely on if they are sick or to keep an eye on their homes if they are away.
Lincoln Park, then, is a vivid example of an appreciating community with high crime and not particularly stron9 social ~ies. Its external amenities, the park and the 1akefront, ~ts locat~ona1 advantages for the large proportion of its residents who work downtown, and the general level of optimism have helped to set a process in motion that grows by its own momentum.
congested area. f
-22~ ~23~

'" 't I
~ !
-~-------~-~------~---.. ~---.-
THE INDIVIDUAL AND NEIGHBORHOOD CHANGE
We have, so far, derived a historical account of the context:_, ~/ and the proeess of change in each of our eight Chicago neighborcJods, We now integrate our different sources of info~ation into a set of formal, comprehensive models for studying the effects of crime and fear of crime on neighborhood change,
For this analysis, we have found it useful to divide our respondents by race/ethnic group (white, black or Hispanic) and by residential status (renters or home owners), Table 5 shows the concentrations of each type of housing market in each neighborhood.
TABLE 5
COMPOSITION OF HOUSING MARKET IN CHICAGO NEIGHBORHOODS: ETHNIC/OWNERSHIP STATUS
White White Black Black Hispanic Hispanic Owner Renter Owner Renter Owner Renter
Portage Park 65% 34% 1%
Lincoln Park 23 62 10 5
Austin 12 8 23 54 2 2
Back of the Yards 23 31 10 10 8 19
Beverly 72 13 12 3 1
Hyde Park/Kenwood 23 40 8 28 1
South Shore 1 5 24 68 1 1
East Side 70 22 1 5 3
TOTAL 36 27 10 22 2 4
~24-
._" - ,~< -'"-- ,-"- -- -- .-,
'.
I
~------~~--~~--------------~---------~~-----------------
--------_._----.-------_.---
We will make use of a range of control variables: measures of victimization; observations of neighborhood housing patterns; observations of neighborhood land use qualitYl respondent reports of neighborhood problems; and other measures of respondent atti~ tudes, neighborhood attachment and neighborhood involvement, The following tables define the variables used in the regression analyses in the next three sections and also show the considerable differences between renters and o~mers in the three racial/ethnic groups on many of these measures,
TABLE 6
MEASURES OF VICTIHlZATION, INCIVILITY, AND FEAR OF AND RESPONSES TO CRIME
Average Score in Each Housing Market
White White Black Black Hispanic Hispanic Characteristic Owner Renter Owner Renter Owner Renter
1) Victimization: Was Respondent or a House-hold Member a Victim or Crime in the Neighborhood in the Last Year
(0) No (1) Yes .24 .27 .28 .. 31 .. 24 .25
2) Vandalism: Was Respon-dent's Building Vandal-ized in the Last Year.
(0) No (1) Yes .12 .20 .14· .27 .13 .16
3) ]nci.vi1ity: Is There a Problem With Bothersome People on the Street and/or Drugs and Drug Users
(2) Neither is a Problem
(6) Both are Big Problems 2.53 2.63 2.74 2.92 2.87 2.79
4) Home Defense:' Has Respondent Installed a Burglar Alarm, Engraved Identification on Valua-bles or Taken Other Home Security Steps
(0) None (3) All Three 1.02 .81 1.21 1..01 .78 .65
.... 25 ...
,

5)
6)
7)
. trt
TABLE 6 CONT~NUED
HE .. ~SURES OF VICTIHIZATION, INCIVILITY, AND FE&R OF AND RESPONSES TO CRIME
. Average Score in Each Housing Mark~t
White White Black Black Hispanic Hispanic Characteristic Owner Renter Owner Renter oJ Owner Renter
Restrict Activi~: Has Respondent Avoided Public Transportation or Refused a Job Because of Fear of Crime
(0) Neither (1) Either or Both .35 .43 .37 .38 .27 .28
PerceEtion of Risk: Assessment of the Amount of Crime in the Neighbor-hood and the Likelihood that Respondent Will be a Victim
(2) Both Low (5) Both High 2.78 2.99 3.04 3.12 2.82 2~75
Satisfaction with Safetl: Satisfaction with Safety and Reputation of Neigh-borhood
(-4) Very Dissatisfied with Both
( 4) Very Satisfied with Both 2.26 1.69 .87 .65 1. 78 1. 72
-26-
TABLE 7
NEIGHBORHOOD HOUSING PATTERNS BY HOUSING MARKET COMPOSITION
Percent of respond~ ents living on a White White Black Black Hispanic Hispanic block face with: Owner Renter Owner Renter Owner Renter TOTAL
1) 9 or more single family dwellings 64% 16% 34% 10% 28% 14% 33%
2) 6 or more two-si.it flats 24 38 38 33 66 71 34
3) 1 or more multiple'I"Unit dwellings 20 56 41 67 07 14 42
,

1 f -, TABLE 8 i
I' I
9 QUALITY OF NEIGHBORHOOD LAND USE BY HOUSING MARKET COMPOSItION TABLE
ATTITUDES AND SOCIAL AND DEHOGRAPHIC CHARACTERISTICS
Percent of respond-11
BY HOUSING MARKET COMPOSITION
ents living on a White White Black Black Hispanic Hispanic block face with: Owner Renter Owner Renter Owner jRenter TOTAL U --- Average Score in Each Housing Market
11
1) 1 or more parks, I White White Black Black Hispanic His.panic alleys or open ~
Characteristic Owner Renter Owner Renter Owner Renter spaces 43% 64% 54% 68% 52% 41% 56%
! 1) Perceived Conseguences
2) 1 or more frame of Integration: Belief flats 30 33 30 21 69 76 32 about Effect of Black
In-migration on Social 3) 1 or more frame Status, Crim~ Rate and
single-family !
Property Va1bes in units 51 42 43 34 69 53 45 Neighborhood'
(-3) Bad Effect on 4) 1 or more commer-
,/ All Three
ci.al or public ( 3) Neutral or 1'osi-buildings 16 39 19 27 48 59 28 t:i.ve All Three ,69 .90 .79 .40 ~.49 -.19
5) 1 or more aban-:j
2) Sa tisfac tion ,,;.n th doned units 01 02 16 07 07 07
1 Qua1ity!AEEearance: 07 il Satisfaction with 6) 1 or more vacant Housing Quality and
lots 06 12 20 18 28 29 13 General Appearance of Neighborhood
7) 2 or more units H (-4) Very Dissat. with visible :1 with Both signs of needed I ( 4) Very Satisfied repair 57 53 62 52 76 79 56
.j with Both 2.13 1.20 .69 ~.17 1.93 1.42 I
8) 1 or more units 3) Psychological Attac~-, being rehabili- ment: Is the Neigh-
tated 22 21 10 12 17 22 18 borhood a Home or Just a Place to Live
9) 1 or more lawns (0) Place to Live with 7 or more (1) Home .82 .55 .69 .44 .49 .45 pieces of litter 25 45 65 69 62 67 46
~ 4) Neighborhood Deterior-10) 1 or more lawns
\\ ation: Are there
with large litter 06 09 14 19 31 18 11 Problems with Garbage,
II Unkept Lawns, Absentee Landlords, Abandoned Romes or Vacant Lots
( 5) No Problems (15) All are Big
Problems 5.90 6.46 7.37 7 .. 94 7.32 7.01
5) Family Income in Thousands 21.26 ],(j.22 20.72 14.41 17.56 14.09
-28 .. .. 29 ..
,
;;
;i,t " .... - .. "- --- -.~- _._--.. -~ ~ ------------- --- .. , ...

i' f
1 ,1
TABLE 9 CONTINUED
ATTITUDES AND SOCIAL AND DEMOGRAPHIC CHARACTERISTICS BY ROUSING MARKET COMPOSITION
Average Score in Each Housing Market
White Owner
White Black Black Hispanic Hispanic Charac terist,ic
6) Family Demography:
(a) Married with Children 4
(b) Married without Children
(c) Single
7) Organiza tional Hembership: Does Respondent Belong to a Homeowner/ Renter; Quality of Community Life; and/or Neighborhood Crime Prevention Group
(0) None
.39
.34
.26
(1) Any or All .43
8) Building Security: Is there a Problem with Building Security
9)
10)
(1) No Problem (3) A Big Problem
Landlord Responsiveness: Did the Landlord Improve the Property in the Last Two Years
(0) No (1) Yes
Housing Deterioration: Is there a Problem with Heating, Rodents, Plumbing, Paint/Plaster, or Broken Hindows
( 5) No Problems (15) All Big Problems
Renter Owner Re~ Owner Renter
.21
.26
.54
.19
1.21
.59
6.28
'""30 ...
.48
.14
.39
.53
.48
.14
.35
.23
1.42
.52
6.90
.69
.24
.07
.20
--
.61
.15
.23
.10
1.23
.48
6.61
I
d ; I : I ! ! ; I , \
II 'l
I
THE SIGNIFICANCE OF RACE IN NEIGHBORHOOD CHANGE
It may seem peculiar to begin the statistical analysis of crime, fear of crime, and neighborhood deterioration with a discussion of perceptions of racial stability. However, these perceptions are a powerful interVening force in how people feel about crime and their community. '
is: The survey question used to measure the perception of stability
"Thinking about the races of the people who live in (NEIGH ... BORHOOD)--that is, whether they're black, white, or hispanic ........ would you say the "racial composition is pretty stable or would you say the racial composition is changing?tt
Some of the responses were surprising. First, substantial numbers report that their neighborhoods are stable when their minority popUlations are measurable and growing and, conversely, numerous respondents tell us that their neighborhoods are changing when no available evidence demonstra.t~s that this is the case.
Second, the relationship between fear of crime and perceptions of racial change held for home owners qf both races, and even in an almost 100 percent minority neighborhood. Wilson (1979) offers one possible explanation for these findings, arguing that the well ..... edu ..... cated and well ..... trained blacks have broken through the barriers of prejudice and are abo'U:t as able as whites with similar levels of education to achieve the good life, Simultaneously, however, there is a large group of une~ucated and untrained blacks who are not entering the labor forc~; they are excluded not because they are black, but rather because they are uneducated and untrained.
Many of the whites who perceive--despite a growing proportion of blacks--that their neighbor.hoods are racially stable live in the middle class neighborhoods whose black residents are also middle class. Although our question asks about race, we hypothesize that for them, the threat of racial change is understood as a threat of social class change. By contrast, those who perceive their neighborhood as changing are more often in lower income communities; for them, the fear of change and the fear of crime is linked to the presence of the underclass, which is what they imagine when blacks are discussed.
The finding that blacks in all-black neighborhoods are also concerned about stability is similarly explicable. A stable black neighborhood is one residents perceive to be able to maintain its middle class character. An unstable one is where a soft housing market leads the neighborhood increasingly to take on the character of the black underclass.
To assess respondents' perceptions of the consequences of racial change, we constructed a scale from the following three survey items,
..31-

- ~ -------
on which we solicited Htrue/falseH responses:
1. When a few black families move into an all white neigh~ borhood, they usually have the same income and education as the people who live there.
2. When a few black families move into an all white neighborhood, c1!'ime rates usual'ly go up.
3. When a few black families move into an all white neigh~ borhood, property values are sure to go down.
Figure 1 shows the relation between the percent white and the average neighborhood score on the scale (Figure la) and the percent saying their neighborhood is stable (Figure Ib) for white home owners in each neighborhoo~. We see that the neighborhoods fall into three categories vis-a-vis white owners: 1. middle class neighborhoods whose residents see them as relatively stable and do not see integration as a source of decline (Hyde Park/Kenwood, Lincoln Park, and Beverly); 2. working class neighborhoods whose residents see them as relatively stable, but do see integration as a source of decline (Portage Park, East Side).; and 3. working class neighborhoods whose residents see them as unstable and see inte~ gration as a source of decline (Austin, Back of the Yards). Among the working cla~s neighborhoods, the perception of instability is strongly related to the percent non-white. For the middle class neighborhoods, there is no such relationship.
The social-class neighborhood difference in perceptions of the inevitability of decline is rooted in the r1.ture of neighborhood experience. Although many neighborhoods in Chicago, both working class and middle class, have declined after racial change, working class neighborhoods appear to be more vulnerable. As we have seen already, middle class community resources, including better quality housing stock and better access to governmental and other institutional resources, bolster the middle class community~s ability to maintain quality in the face of change.
The perception of stability among black home owners further supports the argument thqt class, not race, is the relevant dimension for understanding neighborhood change. A range of data, shown in Figure 2, supports this assertion, but the most trenchant comes from South Shore. Although this neighborhood is 95 percent black, about half of the black hOIne owners say the area is not stable. South Shore is a community struggling against erosive forces to maintain its middle to lower-middle class character.
- ----
:\
\ ,
FIGURE -=-l~a_..:.P:..::e=r:.::c:.:::e::::iv..!..!:::ed::.....:C::.;o::..:n.::.::s:.:::e:.:lg.:::u=en::.;c::.:e::::s=--=o;.;:;f~I=n.=,te;;:Jgoz.:r;:..;:a;;.;;ti:;;;;;·;.;.o=n
Not Threatening 2 ,.Hyde Park
,Lincoln Park ,
1
• Austin
o
-;1.
Beverly
'Portage Park
$East Side • Back of the Yards
Threatening
FIGURE lb Perceptions of Stabi~itI
.Austin
.Hyde Park.Beverly
.Pol'tage Park
.Lincoln Park
·East Side
• Back of the Yards
Percent White t~--+---+---~f---;r~~~~r---r---~~--'~--~II o 50 100
Perceived Consequences of Integration and Perceptions of StabilityWhite Homeowners
-33-

II
~ I
FIGURE 2a Perceived ,.Consequences of Integration
Not Threatening 2
1
o
-1 Threatening
.Beverly
• Hyde Park
• Austin
eBack-of-the-Yards
80 FIGURE 2b Perceptions of Stability
• Hyde Park
70 .. Beverly
.South Shore
~-~ .. -, --.--~---
• South Shore 50
.Austin oBack-of-the-Yards
40
Percent Bl,ack ~. ~ l i o 50 100
FIGURE 2 Perceived Consequences of Integration and Perceptions of St~bilityBlack Homeowners
-34 ...
----...~ --- ........ ---.-..,.-~~- ... 1"\.----'----~-- --------- .. -~.~.~ .. -----~--.~~~ --~,>.,..~ ----1- -, " , 0.;, • (I.. if:' (;Pil) -
\
\ I I l I I
II , l . \
\
SafetYt Social Class, and Perceptions of Neighborhood Stability
A house is the largest investment most people ever make~ and many home owners associate racial change with neighborhood deter~ ioration, Both the literature (e,g" Farley, et al., 1977) and our own findings underscore this set of perceptions. In our work-:ing class neighborhoods, two thirds of the respondents believe that property values decline when a few blacks move into the neighbor", hood; and two thirds believe that when a few black families move in, panic-peddling and block busting realtor~ follow .
Because residents perceive neighborhood stability to be pre~ carious, they interpret small, ambiguous cues as indicators of deterioration. For this reason, victimization, diss'atisfaction with safety, and the presence of visual flaws in the neighborhood all correlate with perceived racial instability.
White Owners and White Renters, Tables 10-13 give the re~ gression results on which the following analyses are based. Each table shows the nonstand~rdized regression slopes, the proportion of explained variance (R ), and the interaction terms (in brackets) for the equation(s) predicting perceived racial stability. However,. to present and interpret our results, we use a method known as test factor standardization or response surface modeling, This method displays the percent estimated to regard the neighborhood as racially stable within each category of the predictor variable under consider~ ation, controlling for the other significant variables in the equation.
Let us show how this works. Controlling for other factors, white home owners who live on blocks that include frame 2- to 6 ... flat buildings are more likely to regard their neighbo: .... hood as racially changing.
Modeled percent perce~v~ng stability for those who do and do not live on a block with frame flats (White Owners)
Presence of Frame Flats
No Yes
71 47
All other things equal, 71 percent of those who live on a block that does not include fram.e flats are expected to view the neighborhood as stable, compared to only 47 percent of those who live on a block that does. Whether this relationship results from the untidy appearance of frame buildings (which show deterioration more easily than do brick buildings) or from an idea that minorities are more likely to occupy these buildings first, '\;¥'e cannot say.
The presence of open space, such as a park, play10t, or alley, similarly lowers the perception of racial stability. I
Modeled percent perceiving stability for those who do and do not live on a block with open space (White Owners)
Open Space
No Yes
... 35 ...
70 57
,

..
In precarious settings, open spaces are seen as places where litter can collect and "problematicn people can loiter. In additiqnf be .... cause of race/ethnic differences in fertility rates and age structure, childr~n using such spaces are likely to be disproportionately non~ white in those neighborhoods where non~whites are present.
The perception of sta~ility is also strongly related to invest~ ment activity. White owuers who are satisfied with neighborhood property values, who would encourage others to invest in their neighborhood, and who have rehabilitation in progress on their block are all more likely to see their neighborhood as stable,
Modeled percent perceiving stability as a fun~tion of: rehabilitation in progress on the block; satisfaction with the trend in property values; and view of neighborhood investment opportu~ nity CWhite Owners)
Rehabilitation in Progress
Yes No
72 62
Satisfaction with Property Values
High 4 75 3 69 2 63
Low 1 57
View of Investment
Encourage 66 Discourage 49
This set of variables is statistically the most important correlate of the perception of stability.
As noted earlier, white home owners who believe that integration does not necessarily lead to decline are in general more likely to view their neighborhood as stable. However, for those who have been the victim of a crime, the i~pact of this belief is wiped out.
Modeled percent perceiving stability as a function of perceived consequences of integration, and victimization (White Owners)
Perceived Consequences of Integration Scale Score
Not threatening 3 2 1 a
Threatening ~l
Victimization
No Yes
71 55 69 57 66 59 63 61 60 63
Like white owners who have not been victimized, white renter~ who believe that deterioration is not an inevitable result of integration are more likely to perceive their neighborhood as stable • White renters' perceptions of stability are also related to satis ... faction with the safety of the neighborhood and with views on the advisability of investment.
Let us tu.rn now to the individual neighborhoods.
-36-
'.
-~--~ ~---------------------------------
I [I
.i ; i
I I 'f
'I , I
, I I
1 I
Working Class Neighbo-:hoods, , East. Side and Portage Par~ exemplify working class ne~ghborhoods w~thtlie co~plex of att~tudes described above. Although neither neighborhood has a measurable black popUlation, East Side is only a bri~ge~length awa¥ from a black neighborhood whereas Portage Park ~s about one m~le away, East Siders exhibit most sharply the connection between deterioration and perceived racial instability. The presence of large la~ litter and flawed housing facades are both related to the percept~on of instability.
Modeled percent perceiving stability as a function of block conditions (East Side White Owners)
Large Litter on Lawns
No Yes
59 31
Visible Flaws in Housing Facades
No Yes
68 51
Conversely, East Siders who perceive that things are going well also perceive the neighborhood to be stable,
Modeled percent perceiving stability as a function of rehab~ ilitation in progress on the block and satisfaction with property values (East Side White Owners)
Rehabilitation in Progress
Satisfaction with Trend in Property Values
Yes No
73 52
High 4 80 3 68 2 56
Low 1 44
Whereas for most people in most neighborhoods, ~he perception of stability is related to a high score on the perce~ved consequences of integration scale, the relations~ip is reversed for,one group in East Side. This group is more l~kely to see the ne~ghborhood as stabl~ if they believe that deterioration is inevit~ble when change takes place. Their interest is in defending the ne~ghborho?d from change. Consequently, they join organizations "concerned w~th the quality of community life", as shown below.
Modeled percent perceiving stability as a function o~ perceiv7d consequences of integration and membership in commun~ty organ~~ zations (East Side White Owners)
Perceived Consequences of Integration Scale Score
Not threatening 1 o
'-1
Organizational Membership
No Yes
65 44 61 48 57 52
~_h ____ ~~ ____ • _____________________ . ____ _ ,----~-----~-~ -"---" -------- -.---"~
,

-.. '.--.-------~~---~~----.~---------~.---.... --~--~~ .. ,-.-.~'.-~~.-----,..~-----,-.--.--~----.. "------.-.-----. -;-;. . ." ,-".. ,,, ~', ~ --_. -~-.~--'-. ···-n~---·-.. ----· .. ···--·-·---------------------·-··-·--'~"''''--'' -, ... -.. "- .-..... -----.. ----.. -....... --....... '-'---'"'-'''-''' .......... _ ... -. -
, (
i . "
: iI i
.1- r', > "-,":_.,.
Since the general issue oe ractal change is less salient in Portage Park, residents there are less likely to look for small cues which might be understood as signs of change, Evidence of ~eteriorat~on, which East Siders interpret as evidence of change, ~s not so ~nterpreted in Portage Park,
There is, however, a relationship between living on a block with frame flats and the perception of racial change, In fact, there is a higher probability that such a block will also contain Hispanic, Filipino, or other non~white residents in Portage Park~
Turning to satisfaction with safety, we see that the orient~( ation of Portage Parkers is much like that of East Siders who belong to organizations.
Modeled percent perceiving stability as a function of perceived consequences of integration and satisfaction with neighborhood safety (Portage Park White Owners)
Perceived Consequences of Integration Scale Score
Not threatening 3 2 1 o
Threatening ~l
Satisfaction Scale
Low 2 3
ie 65 * 66
64 67 62 68 60 69
with Safety Score
High 4
62 66 70 74 78
Right now, Portage Parkers know that the neighborhood is stable and that they do not have much of a crime problem--characteristics that were, in fact, important in their decision to move to Portage Park. They are much like residents in other working class neighborhoods who are prepared to fight integration because they anticipate that negative consequences will follow. They demonstrate the psychology of the defended neighborhood that has not yet been called upon to defend itself,
Middle Class Neighborhoods. Each middle class neighborhood shows a distinctive pattern in relation to perceived racial stab~ ility. In Lincoln Park, open space is at issue; in Hyde Park/Ken~ wood, it is housing quality; and in Beverly, it is property values . Crime and victimization, however, are important to the perception of stability in all three.
In Lincoln Park, the parks and other open spaces have been a selling point in the revitalization of the community. There is a strong positive relationship between the presence of these amenities and the perception of stability when people feel secure enough to enj oy the open areas. When satisfaction with· safety is lo'w, these amenities have a less positive effect on perceptions of neighborhood stability.
... 38-
,~ "
~--------------------~~--.---------------------------------------------;~--~------------------~
11 I 1 ! I I'
I II
I II 1\ )l
rl
I
I
Modeled percent perceiving stability as a eunction of satisfaction with safety and the presence of open space (Lincoln Park White Renters)
Open Space Satisfaction with Safety Scale Score
No Yes
2
49 56
3
46 69
High 4
43 82
In Hyde Park/Kenwood, those who are satisfied with the safety of the area are more likely to see the area as stable. Like East Siders, Hyde Park residents perceive evidence of deteri~ration to be evidence of instability as well,
Modeled percent perceiving stability as a function of' block conditions and satisfaction with safety (Hyde Park/Kenwood White Renters)
Presence of Vacant Lots
No 72 Yes 53
Visible Flaws in Housing Facades
No 74 Yes 60
Satisfaction with Safety Scale Score
High 4 86 3 80 2 74 1 68
Low 0 62
Moving to white home owners ~n Beverly, we find (as with white owners in general) that satisfaction with property values is the strongest correlate of the perception of stability.
Modeled percent perceiving stability as a function of satis~ faction with the trend in property values (Beverly White Owners)
Satisfaction with Trend in Property Values
High 4 89 3 80 2 71
Low 1 62
The victimization experience works two different ways in Beverly. First, those who have been victimized are much less positive about the future of the neighborhood. In addition, victimization undercuts the impact of the belief that integration need not lead to decline.
,

Modeled percent ~erce~y~ng stabil~ty' aa a funct~on of perceived consequences of l.ntegrat;i;on and vi.ctim;i;zat;i;on Cleverly Whl,te Owners)
Perceived Consequences of Integration Scale Sco~e
Not threatening 3 2 1
Threatening 0
Victi.mization
No
94 83 72 61
Yes
75 71 67 63
We have now seen that the perception of racial stabili.ty is an important factor in how people view their neighborhood and that crime influences that perception. We now turn more directly to concerns about crime.
Ii". . Ii ~ u,~ ______________ ~ _______________________ • ________ __ ,/
TABLE 10
REGRESSION SLOPES FOR THE EQUATION PREDICTING PERCEI\~ RACIAL STABILITY FOR WHITE OWNERS
Predictor Variable
1. Perceived Consequences of Integration
2. Victimization
3. Perceived Consequences*Victi~zation
4. View of Neighborhood Investment Opportmllty
5. Satisfaction with Property Values
6. Rehabilitation in Progress
7. Presence of Frame Flats
8. Presence of Parks; Al"ieys or other Open Spaces
R2 = 16 .
TABLE 11
.03
-.02
~ .. 05
017
.06
.10
.24
-.13
REGRESSION SLOPES FOR THE EQUATION PREDICTING PERCEIVED RACIAL STABILITY FOR WHITE RENTERS
Predictor Variable Slope
1. Perceived Consequences of Integration .04
2. View of Neighborhood Investment .14 Opportunity
3. Satisfaction with Neighborhood Safety .05
4. Large Litter on Lawns .....17
'1 R" .... 14
,

i. TABLE 12
REGRESSION SLOPES FOR THE EQUATIONS PREDICTING PERCEIVED RACIAL STABILITY FOR WHITE OWNERS
IN PORTAGE PARI<, BEVERLY AND EAST SIDE
Predictor Variable
1. Education: College v Grade High School v Grade
2. Satisfaction with Property Values
3. Rehaoilitation in Progress
4. Visible Flaws in Housing Facades
5. Large Litter on Lawns
6. Presence of Frame Flats
7. Presence of Flats
8. Perceived Consequences of Integration
9. Victimization
10. Perceived Consequences*Victimization
II. Satisfaction with Neighborhood Safety
12. Perceived Consequences*Satisfaction with Safety
13. Membership in Neighborhood Improvement Organizations
14. Perceived Consequences*Membership
15. Presence of Parks, Alleys, or I)ther Open Spaces
16. Presence of Parks, etc.*Satisfaction with Safety
17. Presence of Parks, etc.*Victimization
Portage Park
.33
.13
-.37
.08}
.26]
'OJ -.03
-.18
-.31 .
.26
Beverly
.16
.25
.09
..... 35
.11
.02
-.07
-.1j -.03
-.6
J .22
.23
-,.~ .. - .'~- -~----. -.~ ~-~-
East Side
.18
.00
.12
.21
- .. 17
..... 28
.04
.10
-.08
-.1J -rOB
-r22
-.44
.24
..
I TABLE 13
REGRESSION SLOPES FOR THE EQUATIONS PREDICTING PERCEIVED RACIAL STABILITY FOR WHITE RENTERS
IN LINCOLN PARK AND HYDE PARK/KENWOOD
I Predictor Variable Lincoln Park Hyde Park/Kenwood
I II ! 11 II f I ,\ I ~
!
t [
f !
I ,~
!
I i
!
1. Education: College v Less
2. Incivility
3. Vacant Lots
4. Visible Flaws in Housing Facades
5. Family Income
6. Perceived Consequences of Integration
7. Satisfaction wj,th Neighborhood Safety
8. Perceived Consequences* Satisfaction with, Safety
9. Presence of Parks, Alleys or other Open Spaces
10. Presence of Parks, etc.* Satisfaction with Safety
i] -43~ :~ '" ! ! , f -.1
-0"10
-.35
.007
.10
-.03
-.03
-.25
.16
.15
},j---,:: ., -, ---, ---"--~-----;i--::~--I~ri~f-'--lr-'~"------~:-' -. '--:I-'-'.'-~'----.--:,:--"~:-' -- ., . -~_~___ __"_,"
.22
-.19
..... 14
.06
~22
I

1 , \
1 ",1 Ii ,I]
II~"" . "'-"---",,,
~ (
THE IMPACT OF CRIME I PERCEPT~ONS OF R!SK AND SAT!SFACTION WITH SAFETY
Here we focus on two different dimensions of the crime problem-~ the perception of risk in the neighborhood and satisfaction with the safety of the neighborhood.
The measure of the perception of risk is based on the following two questions:
"How much crime would you say there is in your own immediate neighborhood,..-a lotI some 1 or only a little?"
"Would you say that the likelihood you will be a victim of a crime in your neighborhood during the coming year is highl moderate or lOvl?"
The perceived risk measure was chosen for the analysis because it has many desirable measurement properties and also correlates very highly with many of our other measures of fear and perceptions of crime.
The scale of satisfaction with the level of safety in the neigh-borhood was based on the following two items:
"we'd like to know how satisfied you are right now with various things in your neighborhood, . . Are you very satisfied 1 some~ what satisfied) somewhat dissatisfied or very dissatisfied with:
The reputation of your neighborhood The safety of the neighborhood"
The difference between satisfaction reports and objective re~ ports of environmental circumstances is that:
Satisfaction implies an act of judgment, a comparison of what people have to what they think they deserve 1 expect or may reasonably aspire to. If this discrepancy is small. the result is satisfaction; if it is large 1 there is dissatisfaction (Campbell, 1981. p. 22).
Thus. satisfaction with the safety of a neighborhood can be quite high even though the perceived risk is also quite high, because other neighborhood amenities make living in the neighborhood worth it.
Figure 3 illustrates the relationship between perceived level of risk and satisfaction with safety in our eight neighborhoods, Although the low risk neighborhoods--BeverlYI Portage Park. and East Side--are all relatively high on the satisfaction scale, the middle and high risk neighborhoods show little systematic relationship with satisfaction.
, , '.
t~"~ ,., '
--~ --~ -
~"------------~------~------------~----~----~-
I :\
\
I ; I
1 I
; ! i I
i , , I I I I !
1 t
\ \ 1 "
LJ
FIGURE 3
Perceived Risk of Victimization in the Neighborhood and Satisfaction with the Safety and Reputation of the Neighborhood
Satisfaction with Safety
3
2
1
.Lincoln Park
• Hyde Park/Kenwood
Back of the Yards.
.Austin
3 4
Perceived Risk
,

~ I
----~-~------------,------'-----
There are strong black .... white raci.al differences in r;i..sk and satisfaction with neighborhood safety when we pool the data for all eight neighBorhoods. However, within neighborhoods, there is gener .... ally very little difference between blacks and whites in responses to crime. With precise contextual measures and controls f the race differences in our sample 4isappear.
We see, then, that the neighborhood is of primary importance in explaining the variation in survey responses to questions of perceived risk arid satisfaction with neighborhood safety. We now turn from the relationship between these two measures to the cor .... relates of each within each neighborhood.
Table 14 shows the nonstandardized regression slopes for the equations predicting the perceived level of risk within'each neigh .... borhood, The most important single factor is the presence of botherGome people and/or drug users on the streets. These findings are similar to those which concern levels of "incivility" reported by the Center for Urban Affairs at Northwestern University. The effect of incivility on perceived risk is greatest among renters, and especially among renters in Hyde Park/Kenwood, Lincoln Park, and Austin.
In addition, the experience of victimization has a fairly consistent, large effect on the perception of risk in the:neigh .... borhood. And finally, for home owners, there is a relation between the presence of visible signs of neighborhood deterioration and the perception of greater risk of victimization.
Table 15 shows the regression slopes for the equations predicting scores on the scale of satisfaction with safety within each neighborhood. Once again, the presence of bothersome people is an important correlate of satisfaction in almost every neighborhood, The direct experience of victimization is also an important correlate of dissatisfaction in some neighborhoods. On the other hand, there are a few neighborhoods where victimization predicts risk, but not satisfaction.
Signs of deterioration come into full playas a predictor of dissatisfaction with safety in almost every neighborhood. The evi~ dence of disorder from garbage and neglect affects both renters and owners in the level of satisfaction with the safety of the neighborhood.
The perception of stability is correlated with satisfaction with safety for black home owners as well as for whites. As discussed earlier, the issue of stability includes not only the race component, but also a social class component. In both cases, then, the perception of stability reflects one·s assessment about the future of the n.eighborhood. In the absence of the sense of precariousness generated by uncertainty about stability, people are satisfied with the safety of the neighborhood in spite of high per~ ceived risk.
. ,
0\ ..;t-
o
U) ('f') ('f') ('f')
• 0
" r-I · co ('f') ·
" r-I · NON 0 r-! N \0 ('I") . . " "
~ o or!
"t:I.I-J o ro o 1-1
,.c: 0 1-1 or! o 1-1
,.0 (\) ,.c:.I-J CO(\) Qjt:l Z
-47-
0'\ N
@ tr.I
. t
\0 r-! .
0'\ ('f') ..;t- N . .
M ..;t-• I ..;t-. . N 0 ..;t- r-! .. .
. CJ .I-J (\)
r-! r-! · 0'\ N ·
N N · 00 N ·
00 r-!
f

\
' .",-,=~,'
, ~l~ I ; " 'I
".'"
r, :
.,
I I
,~
0-
):;.:
t .po 00 I
J .po \0 I
..
.:
'. t,
TABLE 15
REGRESSION SLOPES FOR THE EQUATIONS PREDICTING SATISFACTION WlTH SAFETY WITHIN EACH NEIGHBORHOOD
Beverly Portage East Lincoln Hyde Park! South Austin Park Side Park Kenwood Shore
White White White White Hhite Black Black Black Black Black Owner Owner Owner Renter Renter Renter Qwner Renter Owner Renter
Incivility ~.30 -.20 -.99 -.47 -.90 -.93 -.33 -.43 -.92
Neighborhood Deterioration -.28 -. ~~2 .-.58 -.42 -.23 -.37 -.25
Perceived Stability .82 .802 1.28 1.05 .46 .26
Victimization -.55 -.84 -.33 -1.00
Vandalism -",
Presence of Flats -.40
Abandoned Units
Avoid Public Transp ortation -1.36
Psychological Attachment .41 .43 1.48
R2 .15 .15 .27 .35 .14 .40 .27 .30 .20 .36
i r
,~"""~====--=-~~~~---,-----------. -~--------~-"-- --.. -.~-------.----~'it ----~I
III ::: rt CJJ '0 tr .... OIllIi o rt rt 1-" ~ ;::r 0.. .1-" a rt 1-'" I'll III
I'll Hl Hlli ~ rt III Hll» 1-'. ::rHlCDOf-l CD CD Ii rt '< rt
rtCD .... '0 "4 ::s 0 tr ~ Ii ,rt::S~ CD CD .... I'll I'll 0.. ~ ..... tf.I CD CD .... ::sCD ::s III 00 rt 0 CD rt f-l Ii po'.I-" ~
1'IlCl) <: OOCDtf.l1-'-rt Ii ~ I'll l» f-l;::r
J-bJ40CD Hlpo'lllCDrt::S ~ 0 ::s rt"4 ~ rt ~ o..-<.c;: -~ (I) }"'.-Ii <: .1-" .1-1" < I'll CD CD ::s I'll 1-"
Ii Ort ..0 ~ I'll III rt po' r;:; 0 f-l /::0 jl) IllIllSI'll~rt f-l J-b (I) 0 ]-I. I-"Hl~ 'Nrt rt (I) t::f4 jl) III t:r'
"4 0 llJ J-b rt [D rt rt J-b 1-'"
OCD CDO'O Hl Pdl. 0 ::s CD
1-'" rt- li rtotJ-bCD 0 po' '< J-b 0.. III CD CD CD ::1'"0
Slioto..rt ::s 0 CD '< 1-'" CilIi::S CDO ]-10 CD rt rt ::s ::s 00 P"' <: ::roo ~ CD ]-I .. 0 trf-lIl5rJ)IiHl OO"4CDO Ii 0" m ::f Ji ::r Ill" rt S 1-'-o f-l ::r CD I'll o 1-'..0 ::S?i" o..lllCJJ::Srt ~ I'll III 00 III 1-'0
rJ) rt rJ) f-! I'll CD 1-"'" co rn I-b III ~ Hl III CD J-b p III f-l Ib J-b CDOrtrtCD ::s rt ::r c:: 0 rt 1-'0 0 Ii rt 1'Il0C::CD(I)
::s O'Q rn 0.. ::r ,0
I
I I'
l I
I r I . i; " I I' Ii I,
II! ~
Ii I I I, , Ii I'
~ I; I . I: i, " Ii , ' ; , I, I
! ,

LA
, .. , I
IY·
} i ·1
i
RACE ~ CRnm AND NEIGHBORHOOD INVESTMENT
The final app't'oach to the qu ti f . . mu!;!t be economic ........ how. d~ social fes on 0, ne~ghbo't'hood maintenance or discourage investment in urbanorc7sh~11.~n themselves to encourage nel.guoruoods?
To address this question ~atisfaction scale as the pri~a:e ~on8t~u~ted a two item investment ~n this section. The sc.ale is m~de e~penofetLt variable for the analysis
the following two items: "We'd like to know how s t' f' d v~rious things in your n:i~hb~~ho~~u are right ~ with f~ed, somewhat satisfied '.' . Are you very satis~ dissatisfied with th ' somewhat dl.ssatisfied or very
e way property values are going?n "s Uppose a family had saved 't buying a house in your neight shmo~ey and was thinking about would they be makin ~r 00 .. In your opinion, they be better off rn~e~~~~gf~~a~Cl.al inV7stment~ or would borhood?" el,r money ~n another neigh~
Each item was scored -2 to +2 f The avera . hb ' or as.cale ranging from ~4 to +4 ge ne~g orhood scores on th 1 . shown in Table 16. ~s sca e for home owners are
TABLE 16
AVERAGE NEIGHBORHOOD SCORES ON INVESTMENT SATISFACTION SCALE FOR HOME OWNERS
Neighborhood
Portage Park
Lincoln Park
AUstin
Back of the Yards
Beverly
Hyde Park/Kenwood
South Shore
East Side
TOTAL OWNERS
White Owners
2.6
3.1
.3
-.1
3.2
2.1
2.0
2.3
-so ...
Black Owners
.1
-.7
2.9
2.5
1.1
1,0
Hispanic Owners
.8
2.2
1.1
I
1
I I I J 'T
I .1 \ ;
t i
f 1
! i
1
t ! 1
We also constructed a scale f~om. ques·t;tonsask;tng how satis~ fied people were with "the quality of housing for the money" and. I'tne general appearance of the streets, grounds-? ana buildings in the area," Although having an economic overtone, these latter measures are more inclusive assessmerits of the quality of the neigh ... borhood.
Figure 4 shows the average scores on the perceived risk and investment satisfaction scales for white, black and Hispanic owners. rhe pattern is similar to that between perceived risk and satis~ faction with safety we examined earlier, At the aggregate neighborhood l~vel, there is no relationship between perception of risk and investment satisfaction. This does not mean that crime and/or fear of crime are unrelated to neighborhood investment, but rather that this particular reaction to crime is not the component of the "crime problem" that is most directly discouraging to neighborhood investment.
Crime is discouraging to neighborhood investment when it changes the level of satisfaction people have with the safety and reputation of the neighborhood. The neighborhood scores for investment satisfaction as a function of the satisfaction with safety scale are graphed in Figure 5. The relationship between these two factors at the neighborhood level is quite strong.
Similarly, as Table 17 shows, satisfaction with housing quality and neighborhood appearance is also related to investment satisfaction. In every neighborhood but Beverly, it is one of the strong~ est predictors of investment satisfaction. At every given level of satisfaction, whites report they are more willing to invest than are blacks and Hispanics.
TABLE 17
STANDARDIZED SCALE SCORES FOR TrlE RELATIONSHIP BETWEEN SATISFACTION WITH ROUSING QUALITY AND NEIGHBORHOOD APPEARANCE, AND INVESTMENT
SATISFACTION FOR RACE/ETHNIC GROUPS POOLED AND BY NEIGHBORHOOD
Satisfaction with Quality/Appearance
Low -1 0 1 2 3
H.i.gh 4
White owners Pooled Portage East Beverly
Park Side
* * * * 1.6 1.5 1.5 1.9 2.0 1.8 2.3 2.4 2.0 2.6 2.8 2.3 2.9 3.3 2.6
* too few cases to predic·t 'ac'C'urate1y
-51 ..
Hispanic Owners Pooled ----
* .0 .6
1.1 1.7 2.2
Black Owners Pooled South Austin
Shore
.4 .3 -.4
.8 .9 .0 1.2 1..5 .4 1.6 2.1 .8 2.0 2.7 1.1
* * *

It
FIGURE 4
Investment Satisfaction
2
1
Perceived Risk of Victimization in the Neighborhood and Neighborhood Investment Satisfaction for Home Owners
• White
II Black
'* Hispanic
Beverly
.1~incoln Park
Portage Park •
East Sid~ Hyde Park
.South Shore
Back of the Yards
~Austin o
-1
2 3
4
Perceived Risk
-52-
f , I . I
, 1 ; t i ! : !
t 1
I
~'----,----,
FIGURE S
Investment Satisfaction
3
2
1
o
-1
-1
Satisfaction with the Safety and Reputation of the Neighborhood and Neighborhood Investment Satisfaction for Home Owners
.. White
• Black
*' Hispanic
Lincoln Park. ~ Be~erly
• Portage Park
Hyde Park
• South Shore
Austin~ Back of the Yards
o 1 2 3 4 Satisfaction with Safety
... 53-
Side
,

Just as white flight is mainly responsible for soft housing markets in the city, it is the decision of whites to stay and invest in their neighborhood which will most often determine the nature of neighborhood housing markets in the near future. Consequently, we want to look particularly closely at white home owners,
When we compare white owners, pooling over neighborhoods and using a number of control variables, we see that perceptions of risk, fear of crime, and other subjective responses to crime do not directly affect investment satisfactioll~ However, dissatisfaction with safety, avoiding public transportation because of crime, and vandalism are all factors that lead white owners to be less certain that investment is worthwhile.
Modeled scores for the relation between reactions to crime and investment satisfaction (White Owners)
Satisfaction Low 0 1.9 Avoid Public No 2.4 Vandalism No 2.4 with Safetv 1 2.1 Transport Yes l.l Yes 1.9 Scale Score 2 2.3 3 2.4
High 4 2.6
When we examine the responses in each particular neighborhood, we find that only in areas having a significant black population do the crime measures further differentiate white owners on the extent of investment satisfaction. Within Portage Park and East Side, there is no relation between victimization or any measure of reaction to crime and investment satisfaction. But in Beverly, there is a strong relation between satisfaction with safety and investment satisfaction, but primarily among those who believe the neighborhood is racially unstable. . .
Modeled scores for the effect of satisfaction with safety and perception of racial stability on investment satisfaction (Beverly White Owners)
Stable
Satisfaction with Safety Scale Score
No Yes
2 1.5 3.2
3 2.4 3.6
4 3.2 3.9
We conclude that in neighborhoods having no black residents, victimization and reactions to crime do not feed the fears of neighborhood change that provide part of the justification for thinking that the neighborhood is not a good investment. In racially heterogeneous areas, however, a kind of multiplier effect is at work: people who are dissatisfied with safety are less likely to support neighborhood investment if they also believe the neighborhood is racially unstable.
In fact, one's perception of the racial situation is, in general an important factor influencing neighborhood investment satisfaction.
.. h er we must first discuss how the To understand.~ts ~mpafct. ~w~~ hood affect investment satisfaction. physical attr~butes 0 a ne~g or
C trolling for the level of satisfaction.with.neighborhood on . '11 ignificant relat~onsh~p between a~p7aranc7' the~ed1~e~~~rat~0~ and lower investment satisfaction.
v1s~ble s1gns 0 e there is yet another strong Controllin~ for both o~ the~e.~~a:u~~:~ded_uP building on the block relationsh~p between t ere e~. )nd investment satisfaction. (measured by our fieldh~bserrat~o~he~e is about a 2 point difference Controlling.for.everyt ~ng et~ef tion scale between those who live on the 8-po~nt ~nvestment sa ~s ac on blocks having this feature and those who do not.
The perception of racial instability changes the way thatns~~: h sical features are interpreted. For example, open sp~ces 0
bl~ck reduce investment satisfaction for those who perce~ve the neighborhood. as unstable.
Modeled scores for the effect of o~en sp~ce and.percep;~~n of racial stability on investment sat~sfact~on (Wh~te Own )
Stable
Open Space No Yes
No 2.3 Yes 2.3
1.9 2.6
f 2 6-flats on the block lowers Similarly, the presence 0 - to see the neighborhood as unstable. investment satisfaction for those who
Modeled scores for the effect of flats on t~e bloc~ and pe~ception ;nvestment satisfact10n (Wh~te Owne4s) of racial stability on •
Stable
Presence of Flats No Yes
No 2.4 Yes 2.4
1.8 2.5
th block is also related to The prese~ce of. open space~ on iceand black 0wners, although investment sat~sfact~on among H~~p~n~hites For Hispanics, the in somewhat different ways !=han °the levei of satisfaction with presence of open spaces hdech:cease~een victimiz.ed. For those who have . estment among those w 0 ave . ~~~ been victimized, the open spaces are an amen~ty.
Modeled scores for the effect.of v~ctimization and open space on investment satisfaction (H~span~c Owners)
Victimization
Open Space No Yes
No 1. 0 Yes 1. 4
-55-
1.8 -2.2 ,
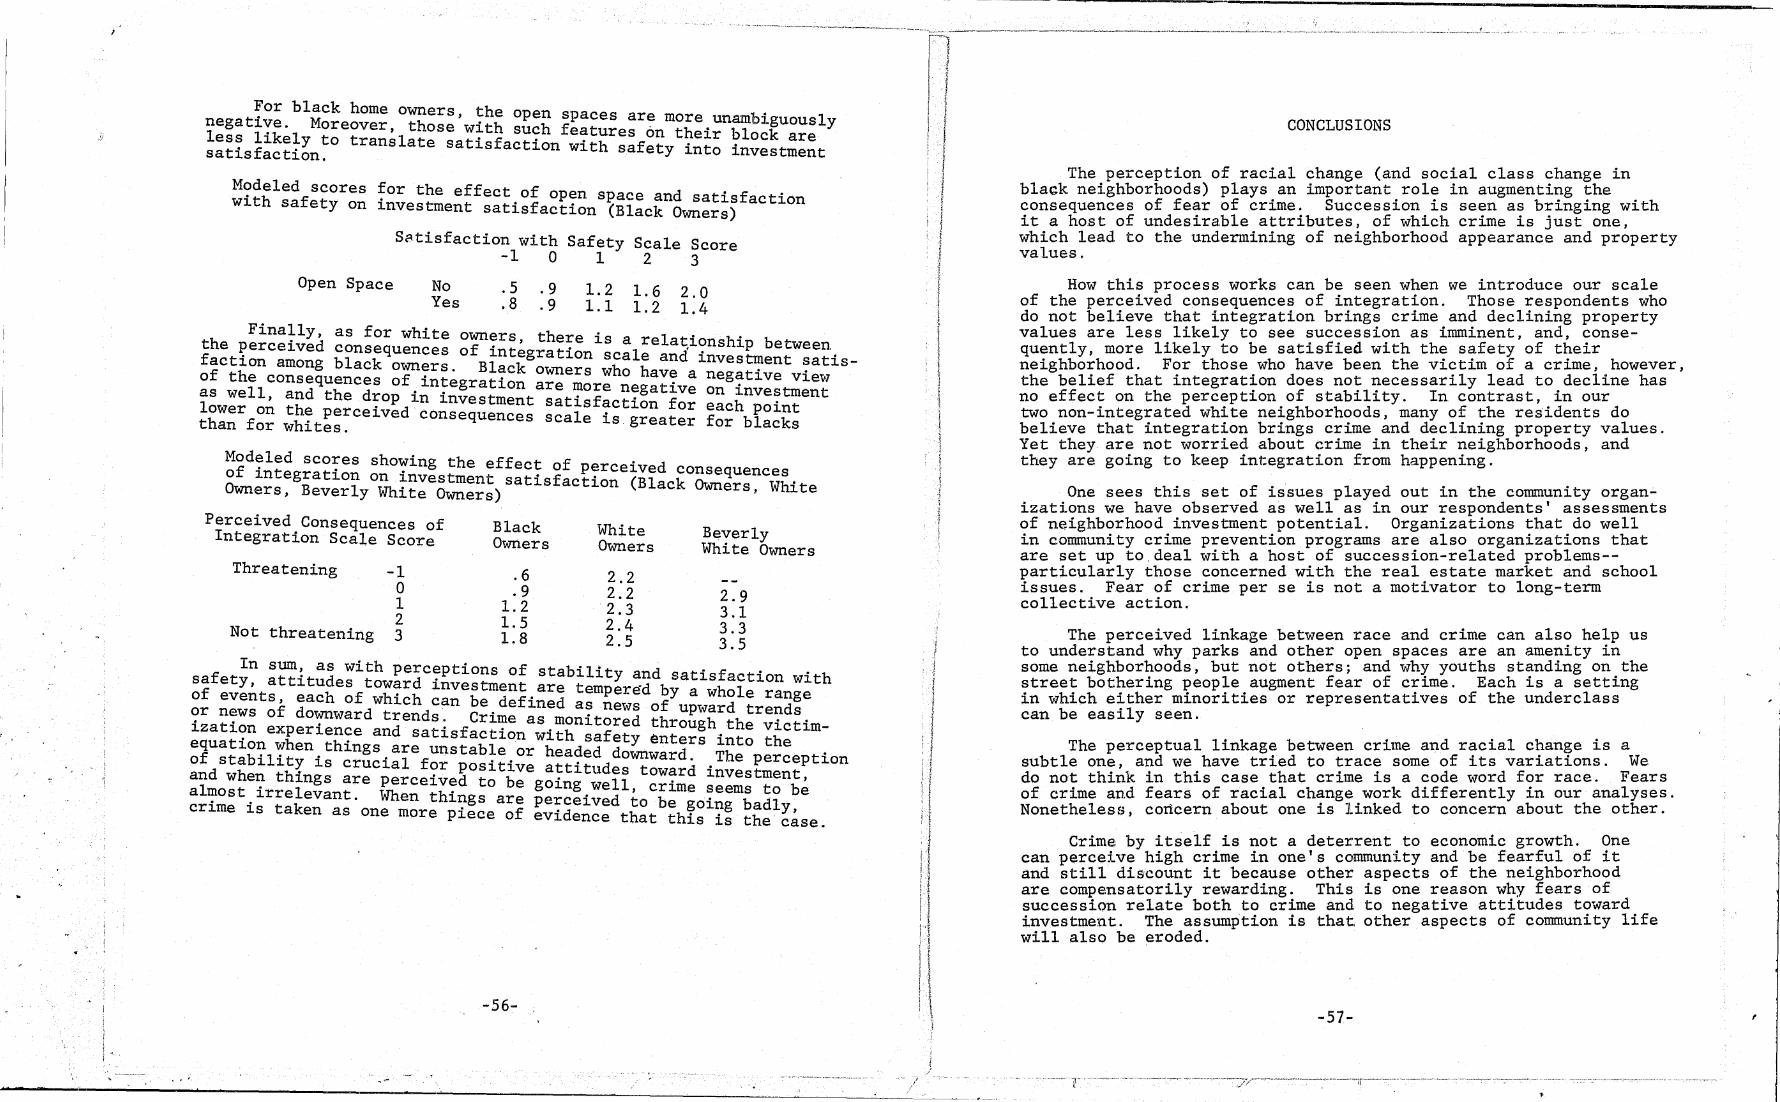
,'/
t'
Modeled scores ~or the effect of open space and satisfaction with safety on Lnvestment satisfaction (Black Owners)
Satisfaction with Safety Scale Score -1 0 1 2 3
Open Space No .5 .9 1.2 1.6 2.0 Yes .8 . 9 1.1 1.2 1.4
the p!~~:~!~d ~~n;~ru:~~te own7rs, the:e is a re1a~ionship between. faction among b1ack
qowne:: OfBtnt~gratLon shca1e and investment satis-
of the f· ac owners w 0 have a negative vie'tr1 11consequences 0 integration are more negative on investment
~s we ,and the d:op in investment satisfaction for each point t~:~rf~~ !~~t~:~ceLved consequences scale is greater for blacks
Mod71ed sco:es showing the effect of perceived con gf LntegratLon on ~nvestment satisfaction (Black ~~~:nc:~.t wners, Beverly WhLte Owners) , L e
Perceived Consequences of Integration Scale Score
Threatening -1 o 1 2
Not threatening 3
Black Owners
.6
.9 1.2 1.5 1.8
White Beverly Owners White Owners
2.2 2.2 2.9 2.3 3.1 2.4 3.3 2.5 3.5
In sum a . t' . safety, attitu~e:Lt~~:~C~~;~~~!e~~ stability ~nd satisfaction with of events, each of which can be defi~~~ ~:m~:~~do~y a wh~le randge or news of downward trends Crime . upwar tren s izati~n experien~e and satisfactiona!i~~n~~~~~~ ;~~~~~hi~~~ ~~ctim-equatLon when thLngs are unstable or h d d d e ~~ds;~~;l~~~ is crucial for positive a~~i~ude~~~:~~d i~e:s~:~~~Ption almost irret~~!n~re ~rce~~7d to be going.we11, crime seems to b~ .. . en Lngs are perceLved to be going bad1
crLme LS taken as one more piece of evidence that this is the ~~se.
-56-
.. .~ .... '.
CONCLUSIONS
The perception of racial change (and social class change in black neighborhoods) plays an important role in augmenting the consequences of fear of crime. Succession is seen as bringing with it a host of undesirable attributes, of which crime is just one, which lead to the undermining of neighborhood appearance and property values.
How this process works can be seen when we introduce our scale of the perceived consequences of integration. Those respondents who do not believe that integration brings crime and declining property values are less likely to see succession as imminent, and, consequently, more likely to be satisfied with the safety of their neighborhood. For those who have been the victim of a crime, however, the belief that integration does not necessarily lead to decline has no effect on the perception of stability. In contrast, in our two non-integrated white neighborhoods, many of the residents do believe that integration brings crime and declining property values. Yet they are not worried about crime in their neighborhoods, and they are going to keep integration from happening.
One sees this set of issues played out in the community organ.;. izations we have observed as well as in our respondents' assessments of neighborhood investment potential. Organizations that do well in community crime prevention programs are also organizations that are set up to , deal with a host of succession-related problems-particularly those concerned with the real estate market and school issues. Fear of crime per se is not a motivator to long-term collective action.
The perceived linkage between race and crime can also help us to understand why parks and other open spaces are an amenity in some neighborhoods, but not others; and why youths standing on the street bothering people augment fear of crime. Each is a setting in which either minorities or representatives of the underclass can be easily seen.
The perceptual linkage between crime and racial change is a subtle one, and we have tried to trace some of its variations. We do not think in this case that crime is a code word for race. Fears of crime an.d fears of racial chang(~ work differently in our analyses. Nonetheless, coticern about one is linked to concern about the other.
Crime; by itself is not a deterrent to economic growth. One can perceive high crime in one's community and be fearful of it and still discount it because other aspects of the neighborhood are compe,nsatori1y rewarding. This is one reason why fears of successic)n relate both to crime and to negative attitudes toward investment. The assumption is that other aspects of community life will also be eroded.
-57- I

L t
In addition, dense community organization is not, by itself, protection for the community against those consequences of crime which will lead to reduced demand. Under certain conditions, organizations with a full-time paid staff, adequate resources, and connections to the external world may be more effective than grass roots participation.
And it seems to be the case that once development patterns are set in motion, many other forces come into play, redefining the past and generating new positive meanings for physical features in the community. When deterioration sets in, the opposite is more nearly true. We have already discussed the role of open spaces in this regard.
Implications for Policy
Some of the policies which flow from our observations are long-range and massive. Recommendations (which we support) have been made before to reduce the size of the underclass by providing training and jobs for the poor. And it seems simplistic in 1981 to promote the virtues of racial integration and to deplore the harmful effects of prejudice.
There are, however, recommendations which can be made within a more limi.ted framework. First, our findings suggest that policing and community crime prevention activities may be most successful at arresting deterioration in low 'crime areas into which the movement of minorities is likely to occur. For residents' sense of security must be nurtured if crime is not to become linked to racial fears. In such settings, racially-integrated activities such as "salt and pepper" police teams, inter-racial sporting activities for youth, and community-based organizations for adults become import2nt. For community crime prevention activities to have positive consequences, they should be connected to organizations which have neighborhood maintenance and development as their primary goals.
Second, we have seen the way open spaces work to increase fear in unstable communities. Welln·meaning efforts to develop small parks in such neighborhoods as a first step toward development are, consequently, likely to backfire unless they are linked to visible and self-conscious security arrangements.
The role of litter in exacerbating anxiety argues for concentration of city services in such area to prevent litter build-up. Similarly, we have seen that boarded-up and abandoned houses also have negative consequences for how people view their safety. Our findings argue for getting these buildings back into the user stream rather than tearing them down. (To leave them standing vacant is inexcusable.) , .
In short, one is involved ina broad-gauge effort to build community confidence. And communities find it difficult to do this by themselves. High crime rates can easily be connected in people's minds with the broader sources of neighborhood deterioration; when .this happens, it is not easy to reverse the pattern without massive resources.
-58-
Boyd, Lawrence 1979
REFERENCES
H., Jr. and Gudmund R. Iversen Contextual Analysis: Con7epts.and Techniques. Belmont, Callfornla: Publishing Co.
Statistical Wadsworth
Burgess Ernest W. . "I 1925 "The Growth of the Clty. r;: Robert E. Park,
D. McKinzi.e (eds.), of Chicago Press. Ernest W. Burgess, and ~oder:ck
The City. Chicago: Unlverslty
campb!~~i AngusThe Sense of Well-Being in America. 't-~cGraw-Hill.
New York:
Chicago Urban League 1978 Where Blacks Live. Chicago: Urban League.
B· h' Diane Colasanto, R lds Howard Schuman, Suzanne lanc l, Farley, eyno ,
Shirley Hatc~ett V '11 Suburbs: Will the Trend "Chocolate.Clty, anl a Communities Continue?" Toward RaclallY
d sep~~at!eetings of the American
1977
Paper presente at e . Sociological Association, Chlcago.
Fischer, Claude S. . New York: Harcourt, Brace, 1976 The Urb~n Experlence.
Jovanovlch.
GOOdwt~79caroleThe Oak Park Strategy. Chicago: University of Chicago Press.
Harris Chauncy P. and Edward L: ~llm~n In: Paul K. Hatt (ed.), 1945 "~h~ Natu~eS~~i~~~~esThe Revised Reader in Urban
Clt:es an Y 'k' The Free Press, 1957. Soclology. New or .
Hauser, Robert a Cautionary Tale," American 70 "Context and Consex: 64
19 Journal of Sociology, 75: 645-6 .
Hoyt, Homer 1942
1937
d 0 kl nd" in Forty-four "Hyde P~rk, Ken~bod'fa~hic:gO~ Chicago: The Cities In the Clt¥ o. -Chicago Plan Commlss lon .
d M t ge Risk." Insured Mortgage "City Growth an or ga Portfolio. 1: 6-10.
-59-
~ i
Molotch, Harvey 1972 Managed Integration:
the City. Berkeley: Pre'ss.
Dilemmas of Doin! Good in University of Ca ifornia
National Research Council 1976 Surveying Crime. Final report of the Panel for
the Evaluation of Crime Surveys, of the Committee on National Statistics, Washington, D.C.: National Academy of Sciences.
Przeworski, Adam and Henry Teune . 1970 The Logic of Comparative Social Inquiry. New
York: John Wiley.
Silberma.n, Charles E. 1978 Criminal Violence, Criminal Justice. New York:
Random House.
Wellman, Barry 1979 "The Community Question: The Intimate Networks
of East Yorkers." American Journal of Sociology. 84: 1201-31.
Wilson, William J. 1979 The Declining Significance of Race. Chicago:
University of Chicago Press.
* u. S. GOVERNMENT PRINTING OFFICE 1982361-233/1828
-60-
j ~
I
,