crime in the us stats, rates, and reports. what is criminal?
TRANSCRIPT

CRIME IN THE US
Stats, Rates, and Reports
What is criminal?

Create a crime continuum like this:
More Serious
Less Serious

Using the person’s name, rank the following from most to least serious:
A. Robert pushes crack cocaine and uses the money to support his mother
B. Lilly approaches a man for prostitutionC. Ted robs a liquor store at gunpointD. Pat kills a child while driving drunk
through a school zoneE. Company pollutes a river with waste
from its factoryF. Ellen leaves a store with change for a
$10, even though she gave the cashier a $5

Factors that influence criminal laws
Increases severity: Repeat offender Lack of remorse;
Intent State of the victim
(how badly they are hurt, etc.)
Weapons Multiplicity of acts State of mind of the
actor Deliberation/
Premeditation
Decreases severity: Ability to reform Mental retardation Addiction Past good deeds Attempting to pay
back the victim (restitution)
Age Extreme
emotional/mental distress
Aggravating Factors Mitigating Factors
National Crime Data

Rank these 10 cities from largest to smallest
Pueblo, CO Colorado Springs, CO St. Louis, MO Pittsburgh, PA Minneapolis, MN Oakland, CA New Orleans, LA Honolulu, HI Salt Lake City, UT Miami, FL
1. Colorado Springs, CO
2. Miami, FL
3. Oakland, CA
4. Minneapolis, MN
5. New Orleans, LA
6. Honolulu, HI
7. St. Louis, MO
8. Pittsburgh, PA
9. Salt Lake City, UT
10. Pueblo, CO

How much crime happens in the US?
Every year, the FBI releases a “crime clock,” which takes the number of certain criminal incidents and divides them by time.
FBI Crime Clock 2009

What cities have high crime rates?
Per 100,000 people, the following are violent crime rates from 2007:
Source: FBI Uniform Crime Reports, and US Census Bureau
St. L
ouis
Detro
it
Mem
phis
Oakla
nd, C
A
Color
ado
Spr..
.0
500
1000
1500
2000
2500
Total VCMurderRapeRobberyAg. Assault

Cities with the highest murder rates:
Per 100,000 people
Source: FBI Uniform Crime Reports, and US Census Bureau
New O
rlean
s
Detro
it
Balti
mor
e
St. L
ouis
Newar
kDC
Color
ado
Sprin
gs0
20
40
60
80
100
Murder Rate
Murder Rate

Large cities with the lowest murder rates:
Per 100,000 people
Source: FBI Uniform Crime Reports, and US Census Bureau
Plan
o, T
X
Honol
ulu
El P
aso,
TX
San
Jose
, CA
Arlin
gton
00.5
11.5
22.5
33.5
4
Murder Rate
Murder Rate

Murder Victims and Offenders by Age
2003 Data
What groups are most at risk of being victimized?
Source: FBI Uniform Crime Reports
Infa
nt
Age
5-8
13-1
6
20-2
4
30-3
4
40-4
4
50-5
4
60-6
4
70-7
40
500
1000
1500
2000
2500
3000
VictimsOffenders

Murder Weapons of Choice
What conclusions can you draw from this data?
Source: FBI Uniform Crime Reports
Weapons
Firearms KnivesBlunt Objects Personal weaponsPoison ExplosivesFire Narcotics, Drowning,
Strangulation, Asphyxia-tion
Other

Murder Circumstances by Relationship
What observations do you make about victim/ offender relationships?
Source: FBI Uniform Crime Reports
Victims By RelationshipHusbandsWivesMothersFathersSonsDaughtersBrothersSistersOther FamilyAcquaintanceFriendBoyfriendGirlfriendNeighborsEmployeesEmployersStrangers

COLORADO SPRINGS
Recent Crime Trends

http://www.springsgov.com/Page.aspx?NavID=887

Calls for Service
What is the trend over time?
Source: springsgov.com

Response Times for Serious Crimes
Source: springsgov.com

Murder Rates in Colorado Springs
What might account for the drop in 2005?
Source: springsgov.com

CSPD Murder Clearance Rates
Many clearances are the result of so-called “murder-suicides.”
Source: springsgov.com

Juvenile Arrests in Colorado Springs
What tends to the juvenile crime of choice?
Source: springsgov.com

Violent Crime and Population
What happens to the violent crime rate as population increases?
Source: springsgov.com

Violent Crime Rates in Colorado Springs
How does Colorado Springs rate? Do we live in a “safe” city?
Source: springsgov.com

Meth Lab Seizures
Why the drop in 2005?
Source: springsgov.com

http://www.springsgov.com/Page.aspx?NavID=52
Weekly Crime Maps
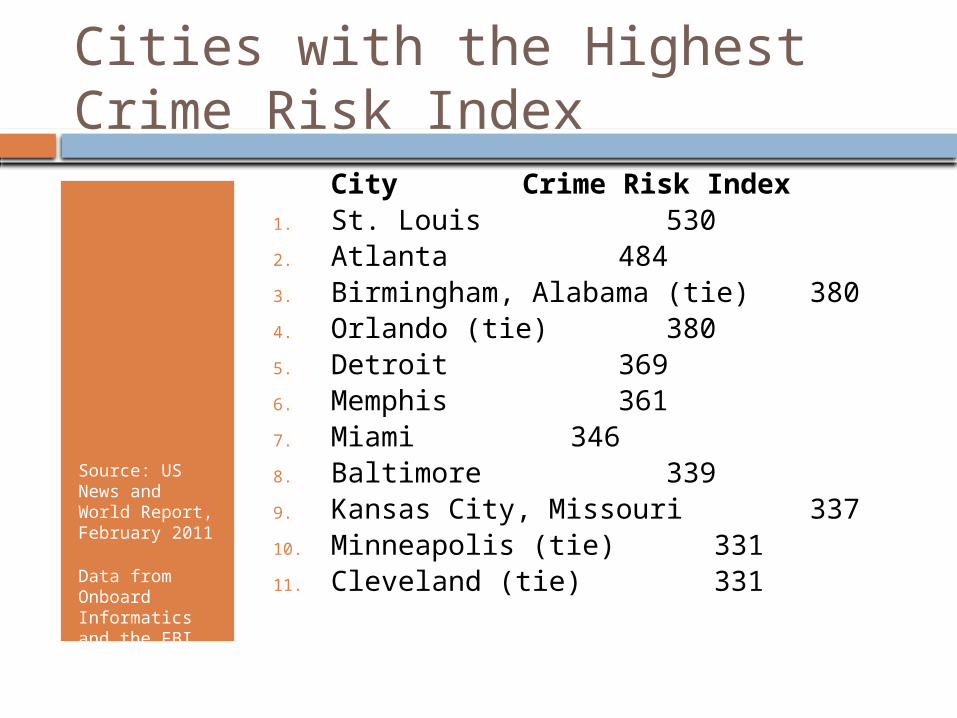
Cities with the Highest Crime Risk Index
City Crime Risk Index1. St. Louis 5302. Atlanta 4843. Birmingham, Alabama (tie) 3804. Orlando (tie) 3805. Detroit 3696. Memphis 3617. Miami 3468. Baltimore 3399. Kansas City, Missouri
33710. Minneapolis (tie) 33111. Cleveland (tie) 331
Source: US News and World Report, February 2011
Data from Onboard Informatics and the FBI