crime mapping using time series analysis in … · crime mapping using time series analysis in...
TRANSCRIPT

European Journal of Basic and Applied Sciences Vol. 2 No. 2, 2015 ISSN 2059-3058
Progressive Academic Publishing, UK Page 52 www.idpublications.org
CRIME MAPPING USING TIME SERIES ANALYSIS IN ASABA, DELTA STATE,
NIGERIA: A REMOTE SENSING AND GIS APPROACH
EJEMEYOVWI, Danny Ochuko (PhD)
Snr. Lecturer, Department of Geography & Regional Planning
Delta State University Abraka, NIGERIA
ABSTRACT
This study primarily focus on the potential of using remote sensing and geographic
information systems (GIS) techniques for crime mapping and attendant management in
enhancement of tight security. Without adequate security as in advanced countries fin an
enabling peaceful environment to achieve the eight point agenda of millennium development
goal (MDG) adopted by the government, is a nullity It has been observed that a large portion
of the men in the Nigerian police can hardly ascertain the area of jurisdiction within their
station or could define the shortest distance en-route station to specific crime areas in Asaba,
Delta state capital the study area. Thus, the police are far from being well and evenly
distributed according to geographic spread, population characteristics or crime incidence. The
research method involved primary and secondary data for two sections of time series years
(A) 2000 – 2006 and (B) year 2004 – 2010 which are the most potent crime related years
since the history of state creation are involved. Primary data involve the use of high spatial
resolution remotely sensed satellite digital data Landsat TM -2010 image, base maps and
crime data from police headquarter. For secondary data, in section A 200 questionnaires were
also administered for detailed information. This involved random sampling using 40
questionnaires for each of the five divided zones namely: 1. Nnebesiroa,, 2. Cable
point/traffic light area, 3. DBS/government house area, 4.Ezeneiavenue and 5. Dennis
Osadebe way, For the year 2000 – 2006 the analysis and interpretation were carried out using
Arc View 3.2 GIS software to present the extent of crime rate in the area. Section B involved
collection of crime data for the year 2004 -2010 and analysed with ArcGIS, version 9.3
developed by ESRI. Here, four classified zones namely (1) Okpananm road areas,Nnebisi
road, West – End and Asaba- Onitsha express; (2)EzeneiAvenue and Cable point, (3) Umaje,
Umuagu, Ibusa road and Isieke area and lastly, (4) Direct Labour Road (DLA), and Summit
junctions. These areas classified in the two analyses using their current base maps, are
denoted as high, medium and low crime rate zones using crime maps of the two sectional
time periods. Thus, five and four zones of major crime incident areas were identified for
sections A and B respectively based on the integration of crime rate data superimposed on the
base maps generated for crime detection, prevention and control.
Keywords: Security, Crime, Remote Sensing, Geographic Information Systems, Mapping,
Management, Detection, Prevention and Control.
INTRODUCTION
Smith and Hogen (1996) defined crime as a wrong which the judges have upheld or
parliament has from time laid down that are sufficiently injurious to the public to warrant
application of criminal procedure to deal with them. Thus, David (1985) stated that crime is
an act or omission which is prohibited by theState and therefore attracts punishment. Crime is
a social problem and according to Fitzegard et al, (1981) is universal and has varying forms
in all cultures and societies at all stages of organization.

European Journal of Basic and Applied Sciences Vol. 2 No. 2, 2015 ISSN 2059-3058
Progressive Academic Publishing, UK Page 53 www.idpublications.org
The international crime victims survey (ICVS) data carried out on 55 countries that spread
over major continents (Africa, Asia, Central and Eastern Europe, Latin America and Western
Europe) showed that between 1989 – 1996 period, more than half of the urban respondents
reported that they have been victimized at least once regardless of where inhabited in any part
of the world (Ackerman and Murray, 2004). It was also observed that high crime rates are
not exclusive reserve of few nations, but a unique activity and there is need to explain the
geographic variation in the weight and type of crimes. In this line of thought, a lot of
researches were carried out on integrating remote sensing and GIS applications for crime
prevention and control through crime mapping. Criminal activities are a deterrent as such,
places are unattractive to local and foreign investors and this situation prevails in Nigeria and
the Niger Delta in particular. The Nigeria security agencies (police, state security service,
military intelligence,etc) are charged with the responsibility of combating crimes.The
corpsareineffective in combating these crimes in terms of where and when specific crimes are
committed.
World distribution of crime across the landscape is geographically random because, it’s a
human phenomenon. For crime to occur, there are offenders, their target (victims) and
properties located at a point in a given period of time. The conventional system of
intelligence and crime record has failed to live up to expectations of the existing crime
scenario. These are deficient of effective information technology for accurate, reliable and
comprehensive data required for prediction and decision support system for maximum
productivity and effective utilization of materials and manpower. On remote sensing, the
synoptic views and time series offered by aerial photography and satellite data are eminently
suitable as a source of information. Apart from the qualitative approaches in image
interpretation, the various sensors provide data that are quantitative nature. Earth resources
satellite image data are still not widely used for lack of knowledge and insufficient
experience in imageinterpretation still hampers the proper use of these important data today.
It uses satellite positioning system, reproductive and provide limited visual analysis
GIS involve the use of array of computer hardware and software, for the purpose of data
collection, storage, structuring, manipulating, analyzing and visualizing spatial data
referenced by geographic coordinates (Kirmerling, 1994).These tools can be adopted by
crime officers to effectively plan an emergency response, determine migration priorities,
analyzed historical events and accurately predict future events to help identify potential
suspects for increased investigation where no leads are evident.
STUDY BACKGROUND
Crime is as old as man himself and efforts have been directed for ways to combat and reduce
it. Criminal activities are in the form of robbery, assaults, theft, internet fraud, alteration of
documents, impersonation, advance fee fraud, homicides, kidnapping, etc are everyday
occurrence in all parts of the world. The alarming increase in rate of criminal activities in
Nigeria is reported in local and international media (print and electronic) in reflection of the
index for measured status. This is aggravated by the harsh economy coupled with the rush for
quick wealth among youths, account for increased crimes. There is a means of attaining an
ideal society where individual status are institutionalized to bring about genuine creation of
wealth based on high moral standard and conscience. Response capabilities often rely on
varieties of data from multiple agencies data sources. This is critical for adequate information
for emergency response dispatch, en-route to an incident spot in terms of corps assistance, in
technical planning and response. This will also access quickly and process information on

European Journal of Basic and Applied Sciences Vol. 2 No. 2, 2015 ISSN 2059-3058
Progressive Academic Publishing, UK Page 54 www.idpublications.org
display relatively to location in space to allow for allocation of resources (human and
finance) much more quickly and effectively. In “critical mission” by law enforcement
agencies, information about the location of incident suspect or victim in crime is often crucial
to determination of the manner and size of the response.
Available softwares can help to co-ordinate broad locations using multiple data sources to
create layers and view the data that is most critical to the particular crime. With this
information, crime officers could determine potential crime sites (by examining complex but
seemingly related criteria) and displaying them as overlay spatial interface or maps.
Furthermore, mapping of the entire population, human and equipment, fixture to provide for
safety of citizens by classifying areas as hazardous locationsidentified into high, medium and
low risk zones. This reduces the potentials for internal violence by providing better command
and control. This approach could be used as an investigative methodology with locations of
connected series of crime committed,to determine the most probable areas of the residence of
recipients and offenders. It can serve as the melting points for fast reference on suspects and
top priority on searches of crime records, patrol saturation and surveillance, neighbourhood
input as carried out for crime mapping in Lima and Columbus (Ohio).This technological
input allow officers to be better informed on decision making about which area of the city
needed additional police power. But the satellite data and GIS tool are not yet used for crime
control and management in Nigeria despite benefits offered by the technology.
STATEMENT OF RESEARCH PROBLEM
Soneye (2002) estimated that a large portion of men of the Nigerian police can hardly
ascertain the area under the jurisdiction of their station or define the shortest route from their
influence to specific crime zones. In his study on Ikeja LGA, Lagos State using remote
sensing and geographic information systems. Like Asaba, he concluded that the police are far
from being evenly distributed according to geographic spread, population characteristics or
crime incidence.
Asaba bounded by Onitsha, Anambra State is noted for high criminal activities. The Delta
State capital is also associated with high crime rate and this is a threat to socio-economic
development and the livelihood of the people in the area. The crime incidents include:
kidnapping, armed robbery, theft, burglaries, rituals, etc, take place on daily bases in the area.
Due to the menace, people and business organizations relocated to the neighbouring abode
such as Ibusa, Ogwashu-uku, Okpanam, and Benin City. As a result of increased crime rate,
GIS technique could be applied to reduce high crime rate in the area.In the city feast the
security outfits (private and government) have tried to improve the state security but to no
avail. The increased wave of crime and general insecurity make the people to take extra
precaution by spending a huge part of their income on personal security such as erecting high
fences, (equipped with barbwire or electrocuting devices), security monitors and dogs, fixing
of alarm gadgets in cars and residence.
The Nigeria security agencies appear to be ill equipped with the task of maintaining law and
order through crime detection, prosecution, prevention and control. This is as a result of poor
information flow between the agencies and the public as well as collective mobilization in
their respective spatial location. In the developed nations, the automated systems are used by
law enforcement agencies. There is automated vehicle system which Skomas (1981)
described as an assemblage of technologies and equipment which permits centralized and
automatic determination, display and control of the position and movement of multiple

European Journal of Basic and Applied Sciences Vol. 2 No. 2, 2015 ISSN 2059-3058
Progressive Academic Publishing, UK Page 55 www.idpublications.org
vehicles throughout an appropriately instrumented area. In a similar system described by
Froise (1986) is capable of storing up to 30,000 maps per disk and uses satellite positioning
system, reproductive and provide limited visual analysis. The traditional method of fixing
many pins stuck into the map at “hot spots” allows for crime map, is prevented. Geographic
Information Systems (GIS) involves crime mapping on computer i.e. providing data that can
be used to produce cost effective and timely varieties of maps. The use of GIS methodology
facilitates various tactical and technical operations that would assist the security agencies, to
effectively implement their conventional roles of crime detection, prevention and control.
AIM AND OBJECTIVES
The aim of this study is to examine the effectiveness ofremote sensing and GIS in crime
detection, prevention and control. The objectives include to:
1) examine the nature and types of crimes and adduce reasons responsible for
crimescommitted in the area using two data sets of time variation.
2) appraise the awareness and importance of these tools application in crime mapping
and management.
3) ascertain the effects of crime rate on the economy of Asaba and
4) proffer solutions on the problems of high crime rate in the area.
LIMITATION OF STUDY
To obtain crime data from the Nigerian police is not an easy task as there is no efficient and
consistent method of keeping and retrieving data. The conventional methods employed in
keeping records make it very difficult to retrieve information needed. Also, some of these
records cannot be said to be reliable. There are instances where police officers find it difficult
to give phone numbers of their station to the public and related data. Some information are
not given (based on security reasons) which are not relayed to the public and therefore, the
data collected are supported by the questionnaires.
RESEARCH METHOD
The data collected for this study using two data sets (A and B) of different time periods are
from both primary (direct observation, oral interviews and the use of questionnaire) and
secondary sources (textbooks, journals, internet, government publications, etc). 200
questionnaires were administered to randomly cover the entire area section A to retrieve data
that is representative.
STUDY AREA
Location and Size
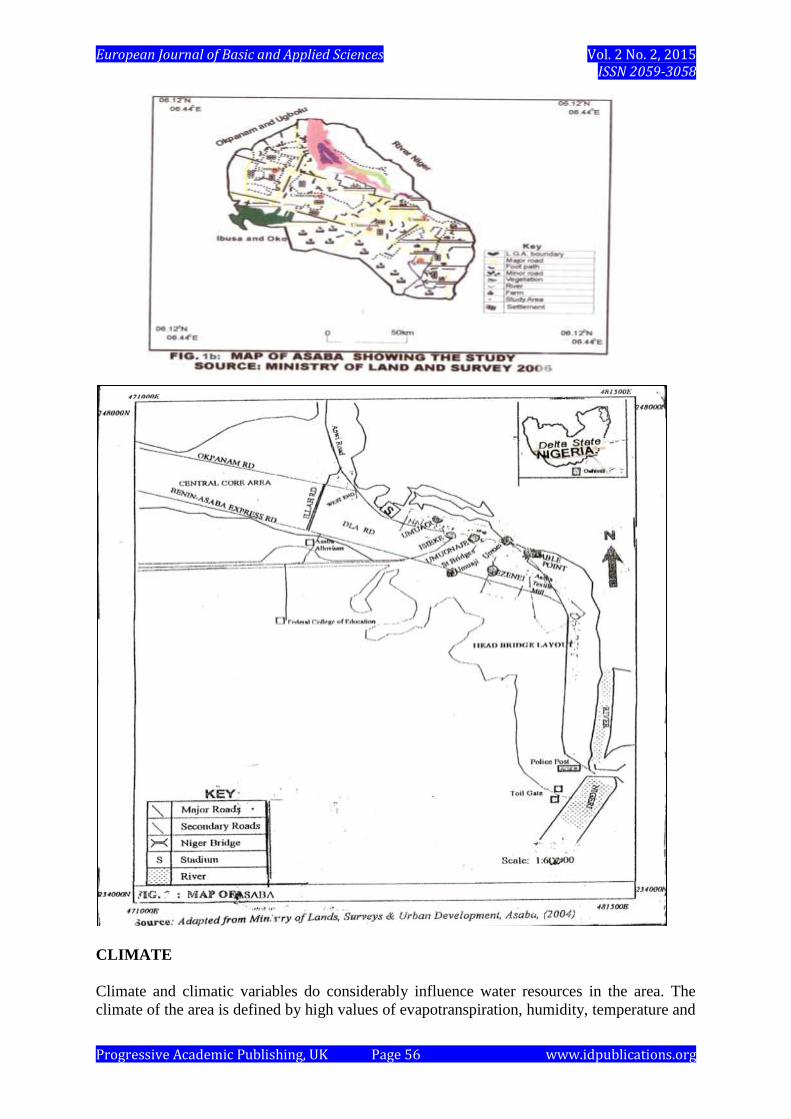
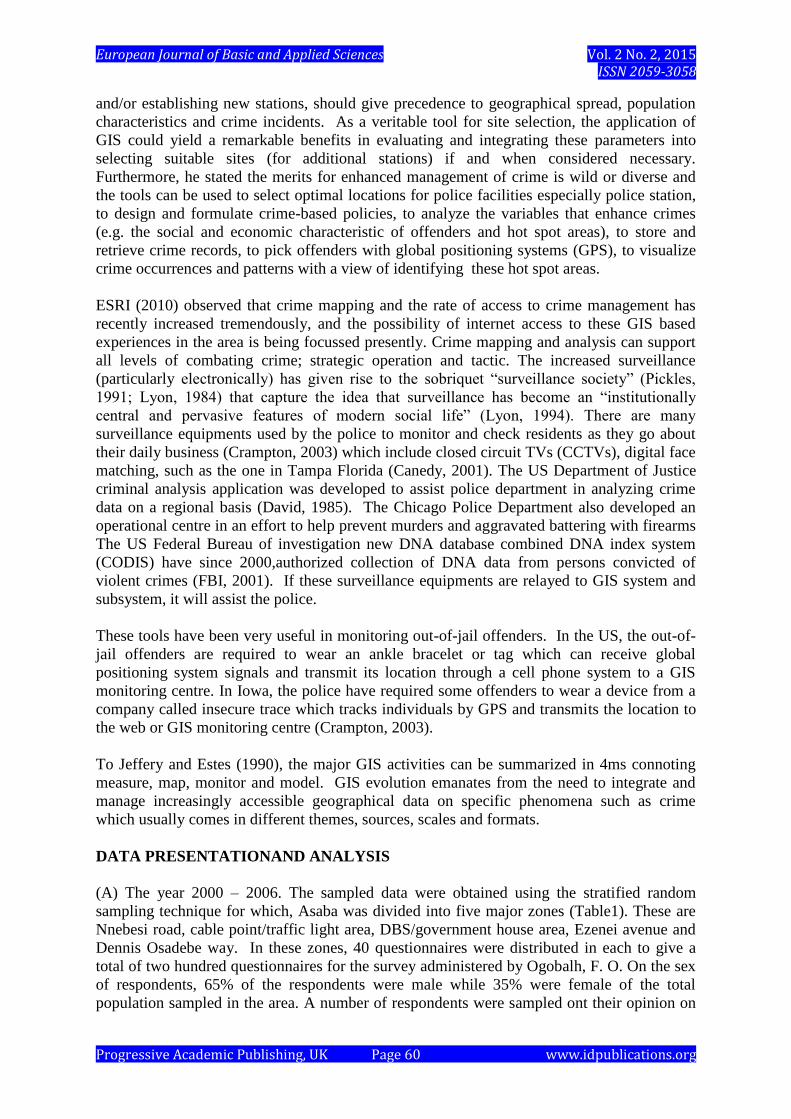
Asaba is the capital city of Delta State and was created in August 27th
1991 out of the former
Bendel State. It also serves as the Local Government headquarter of the Oshimilli South
Local Government Area (Fig 1a &1b due to the need of their current base maps for the
study). The town is located on the bank of the Niger River. Geographic references indicate
that, it is located on latitude 6o30
i and longitude 6
o45
iE with estimated area extent of about
200 square kilometres. Asaba is made up of few villages that include: Oko-Anala, Oko-
Ogbele and Okwe to mention but few them. The main town has a network of good roads,
standard hotels and communication facilities. The Niger Bridge connects Asaba to Onitsha in
Anambra State but separated by the River Niger.
European Journal of Basic and Applied Sciences Vol. 2 No. 2, 2015 ISSN 2059-3058
Progressive Academic Publishing, UK Page 56 www.idpublications.org
CLIMATE
Climate and climatic variables do considerably influence water resources in the area. The
climate of the area is defined by high values of evapotranspiration, humidity, temperature and

European Journal of Basic and Applied Sciences Vol. 2 No. 2, 2015 ISSN 2059-3058
Progressive Academic Publishing, UK Page 57 www.idpublications.org
rainfall that characterized humid tropical equatorial climate of the deltaic environment. The
rainfall is mostly conventional and usually falls at any time of the day resulting from the
effects of conventional rainfall and blown land and sea breezes
Asaba experiences a humid tropical equatorial climate with fluctuations from humid in the
south due to permanent Local influence of the River Niger to the sub humid in the northeast.
The two seasonal winds of NE topical continental air mass that blows from October to
February and the SW tropical maritime airmass blows from March to September maintains an
average tropical temperature during the dry season and an average rainfall during the rainy
season. The mean annual rainfall is 1254–3032mm and temperature of 26.70C with relative
humidity of about 69-80% and sunshine of 4.8 bars (Asaba Meteorological Bulletin, 2007).
GEOLOGY, RELIEF, DRAINAGE AND VEGETATION
The vegetation is tropical evergreen rainforest with tall trees and undergrowth. This has been
interfered by anthropogenic activities such as farming, bush burning, grazing and rapid
development in the area. Due to these effects, the vegetation of the study area has been
observed as mainly of secondary type with patches of trees in grassland.
River Niger and its tributaries drainage system is characterized by very low velocity of flow
due to its low elevation together with very high capacity discharge of sediments. This results
in features such as braided channels, lagoons, canals, bars, creeks, meanders as shown in the
Nigeria Surveys topographical sheet of the area.map of that result from alternative flooding
and exposure episodes of a long rainy season with short dry season accompanied with tidal
movements. In the rainy season, high rainfall and poorly drained soil of low retention
capacity results in wide spread flooding and erosion. Thus, 80% of the entire area is flooded
with the rivers overflowing their banks at the peak of wet season as the coastline is buffeted
throughout the year by tidal current (tides) of the Atlantic Ocean (Ejemeyovwi ,2008).
Most of the area lies below sea level (bsl) with only few places of 20mm height above sea
level (asl) (Odemero and Ejemeyovwi, 2008). This result in marshy and waterlogged
condition of the entire landscape,a poorly drained environment coupled with several
tributaries and distributaries that empty waters into the River Niger,
The surface geology of the study area is made up of Ameki and Ogwashi- Asaba formations
in the northeast of Delta state and the coastal plain sands (Benin formation) that astride the
northern boundary with Edo State and beyond. The Ogwashi-Asaba formation is made up of
coarse grained sands containing lignite and peaty clay seams. It is poor of ground water and
characterized by the widespread occurrence of lost circulation (Rayment, 1965). Both the
Ameki and Ogwashi-Asaba formations are richly endowed with kaolinites, while the latter
formation also contains lignite seams Ejemeyovwi (2008).Three geologic formations are
recognizable form the distinct attributes of depositional circles of sediments since early
cretaceous (135my ± 65) in the area. They are upper Benin sands, middle
Agbadaofinterbedded sands/marine shales and lower Akata made up of massive and
regressive marine shales and clays deposits (Nwachukwu and Odjegba, 2001).
POPULATION OF THE AREA
The area is naturally made up mainly of the Igbo (Delta) ethnic group and as a state capital,
large population of Urhobo, Itsekiri, Ijaw, Isokos are residents. The total population the area

European Journal of Basic and Applied Sciences Vol. 2 No. 2, 2015 ISSN 2059-3058
Progressive Academic Publishing, UK Page 58 www.idpublications.org
was estimated to be 49,725 in 1991,123,746 in 2006 (NPC,2006) and a population of
1,723,745 due to influx of migrants especially as a state capital.
HUMAN ACTIVITIES
Asaba is mainly an administrative town with high commercial activities carried out. The
banking industry has about twenty commercial banks in Asaba, located along the Nnebisi
road. There is only one major market in the area, (Ogbogonogo market) which is also located
along the Nnebisi road. The State government and the private investors have contributed in
no small measure to the development of the place e.g. the Ogbogonogo market was
reconstructed by the state government with modern facilities to enhance maximum
commercial activities in the area. A small market is alsolocated along the cable point area.
There are also high commercial activities in areas of transportation industry with Delta line
and private ownership. There are notable companies and hotels in Asaba. These
includeindustries such as textile, aluminium industry along the Agbor- Benin expressway,
general steel mills (GSM) in Ibusa road and hotels like grand, sunrise, Nairese,
etcLumbering activity with saw mills located in the area. The traffic light area have
wood/furniture works, due to presence of hard wood of the humid tropical trees with various
species such as Opepe, mahogany, matsonia, Iroko, etc.
Agricultural activities in the form of farming, animal husbandry (poultry and rearing of
animals) are carried out in the area. When the river Niger overflows its bank, it enriches the
soil fertility for the cultivation of crops e.g. cassava, yam, maize in the area. A lot of fishing
activities is also carried out along the river Niger and its tributaries. The river Niger beach is
a tourist area that is a hospitable place for tourism.
SETTLEMENT PATTERN
The settlement pattern of Asaba is a nucleated type of settlement though with some linear
disposition. The major road is the Nnebisi road and the river Niger by the town, makes for
nucleated pattern of settlement and the houses are closely built but houses across the Onitsha
– Asaba expressway are dispersed in a linear pattern.
CONCEPTUAL FRAMEWORK
The conceptual framework of geographic profiling is used to explain how to track and locate
crime offenders based on the techniques of GIS in crime detection, prevention and control.
Geographic profiling theory was developed by a Vancouver police officer, Detective
Inspector Kim Rossmo in 1991 at Simon Frazer University after seven years of research
study. The research tool predicts most likely location of offenders (i.e. home, work, social
arena, travel outs, etc). It could also be employed in cases involving serious crimes such as
kidnapping, sexual assault, homicide, arson, robbery, break and entry, bombing, predatory
assault times (sexual, homicide, child molesting), multiple crimes location (telephone calls,
credit cards, internet fraud and missing persons). A minimum of five crimes or related sites
are required for a complete profile. However, some forms of analysis can be done with fewer
sites. The practical display of GIS technique in 1991 was called “Criminal Geographic
Targeting”. The profiling assisted design is an investigative support technique in violent
crimes. It helped prioritize the array of detailed information of crime cases generated as
information management strategy. The process is based on software analysis of the various
locations of a connected series of offences, neighbourhood characteristics in which they

European Journal of Basic and Applied Sciences Vol. 2 No. 2, 2015 ISSN 2059-3058
Progressive Academic Publishing, UK Page 59 www.idpublications.org
occurred and the psychological profile of criminals to determine the most probable areas in
which the offenders reside or work.
Geographical profiling involve information management strategy that can be used in
focussing criminals for adequate investigation with Its result help in prioritizing suspects and
their locations to develop investigative tactics suitable for an area defined by the
“geoprofile”. The strategy has provided a geographic focus that optimizes the research for the
offender (Rossmo, 2000). The geographic profiling is an effective tool to hit upon the most
probable location of the offender and it cannot “solve” cases. It enables crime officers and
analysts to focus their investigation on a small part of the community, rather than on the
entire city. This means, it reduces the amount of time and resources required for a major
investigator. The analysts also determine how sophisticated and organized an offender is,
whether the crime was planned or opportune and whether the offenders approach a high or
low risk victim. Furthermore, there can be an objective measurement to pinpoint as precisely
as possible the locus of points of criminal activities.
The construction of geographic profile in Asaba, Delta State involves complete familiarity
with case files, examination of the crime scenes, interview of investigators and witnesses and
possession of study area maps and analysis of neighbourhood demographics for both the
abduction site and body dumpsite for computerized analysis. The geographical coordinates of
incident are determined and the physical addresses of where the victim was last seen or
abducted from are noted. Best measures are made by visiting the crime locations and
obtaining coordinates with a global positioning system device. Maps produced can indicate
the exact location of the incidents and the physical address of the victim and they are
amenable to spatial analysis. Most offenders have certain associated places where experience
has taught them that suitable victim(s) could be found. The area of interest can be reduced to
a great extent for focus on high crime rate areas for detection chances of criminals to
increase, since GIS can produce results of spatial queries in specific areas of interest.
LITERATURE REVIEW
Remote sensing/GIS has great potential in crime management and has been applied in many
places experiencing high crime rate. Below is a brief review of related literatures. Rilwani
and Eguabor (2000) carried out a research on the need for remote sensing and GIS in crime
prevention, detection and control in Edo State Police Command. They came out among other
things with the following conclusions: These tools can conventionally used in improving the
efficiency of the traditional methods employed by the Edo state Police in fighting of crime
and Information including photographs on missing persons especially wanted criminals
stored in a GIS environment can be used to locate and rescue missing persons, or detect and
apprehend wanted persons for subsequent detention.
Also, the role of remote sensing and GIS in crime management has been given attention by
Pickles (1991); Smith (1992); Curry (1998); Monmonier (2001); Crampton (2002), and
Cutter et al (2003). The continuous changes in global environment in which large array of
data are generated are the inherent limitation posed by processes of conventional analytical
technique and the opportunities offered by automation, have all combined to give rise to
emergence the techniques in crime management. Sonoye (2002) carried out a research on
Remote Sensing/GIS based evaluation of the adequacy of “police stations in Ikeja LGA,
Lagos State” and considered a direct relationship between propensity to commit crime and
distance away from a police station. Thus, he opined that efforts at mobilizing police facilities
European Journal of Basic and Applied Sciences Vol. 2 No. 2, 2015 ISSN 2059-3058
Progressive Academic Publishing, UK Page 60 www.idpublications.org
and/or establishing new stations, should give precedence to geographical spread, population
characteristics and crime incidents. As a veritable tool for site selection, the application of
GIS could yield a remarkable benefits in evaluating and integrating these parameters into
selecting suitable sites (for additional stations) if and when considered necessary.
Furthermore, he stated the merits for enhanced management of crime is wild or diverse and
the tools can be used to select optimal locations for police facilities especially police station,
to design and formulate crime-based policies, to analyze the variables that enhance crimes
(e.g. the social and economic characteristic of offenders and hot spot areas), to store and
retrieve crime records, to pick offenders with global positioning systems (GPS), to visualize
crime occurrences and patterns with a view of identifying these hot spot areas.
ESRI (2010) observed that crime mapping and the rate of access to crime management has
recently increased tremendously, and the possibility of internet access to these GIS based
experiences in the area is being focussed presently. Crime mapping and analysis can support
all levels of combating crime; strategic operation and tactic. The increased surveillance
(particularly electronically) has given rise to the sobriquet “surveillance society” (Pickles,
1991; Lyon, 1984) that capture the idea that surveillance has become an “institutionally
central and pervasive features of modern social life” (Lyon, 1994). There are many
surveillance equipments used by the police to monitor and check residents as they go about
their daily business (Crampton, 2003) which include closed circuit TVs (CCTVs), digital face
matching, such as the one in Tampa Florida (Canedy, 2001). The US Department of Justice
criminal analysis application was developed to assist police department in analyzing crime
data on a regional basis (David, 1985). The Chicago Police Department also developed an
operational centre in an effort to help prevent murders and aggravated battering with firearms
The US Federal Bureau of investigation new DNA database combined DNA index system
(CODIS) have since 2000,authorized collection of DNA data from persons convicted of
violent crimes (FBI, 2001). If these surveillance equipments are relayed to GIS system and
subsystem, it will assist the police.
These tools have been very useful in monitoring out-of-jail offenders. In the US, the out-of-
jail offenders are required to wear an ankle bracelet or tag which can receive global
positioning system signals and transmit its location through a cell phone system to a GIS
monitoring centre. In Iowa, the police have required some offenders to wear a device from a
company called insecure trace which tracks individuals by GPS and transmits the location to
the web or GIS monitoring centre (Crampton, 2003).
To Jeffery and Estes (1990), the major GIS activities can be summarized in 4ms connoting
measure, map, monitor and model. GIS evolution emanates from the need to integrate and
manage increasingly accessible geographical data on specific phenomena such as crime
which usually comes in different themes, sources, scales and formats.
DATA PRESENTATIONAND ANALYSIS
(A) The year 2000 – 2006. The sampled data were obtained using the stratified random
sampling technique for which, Asaba was divided into five major zones (Table1). These are
Nnebesi road, cable point/traffic light area, DBS/government house area, Ezenei avenue and
Dennis Osadebe way. In these zones, 40 questionnaires were distributed in each to give a
total of two hundred questionnaires for the survey administered by Ogobalh, F. O. On the sex
of respondents, 65% of the respondents were male while 35% were female of the total
population sampled in the area. A number of respondents were sampled ont their opinion on
European Journal of Basic and Applied Sciences Vol. 2 No. 2, 2015 ISSN 2059-3058
Progressive Academic Publishing, UK Page 61 www.idpublications.org
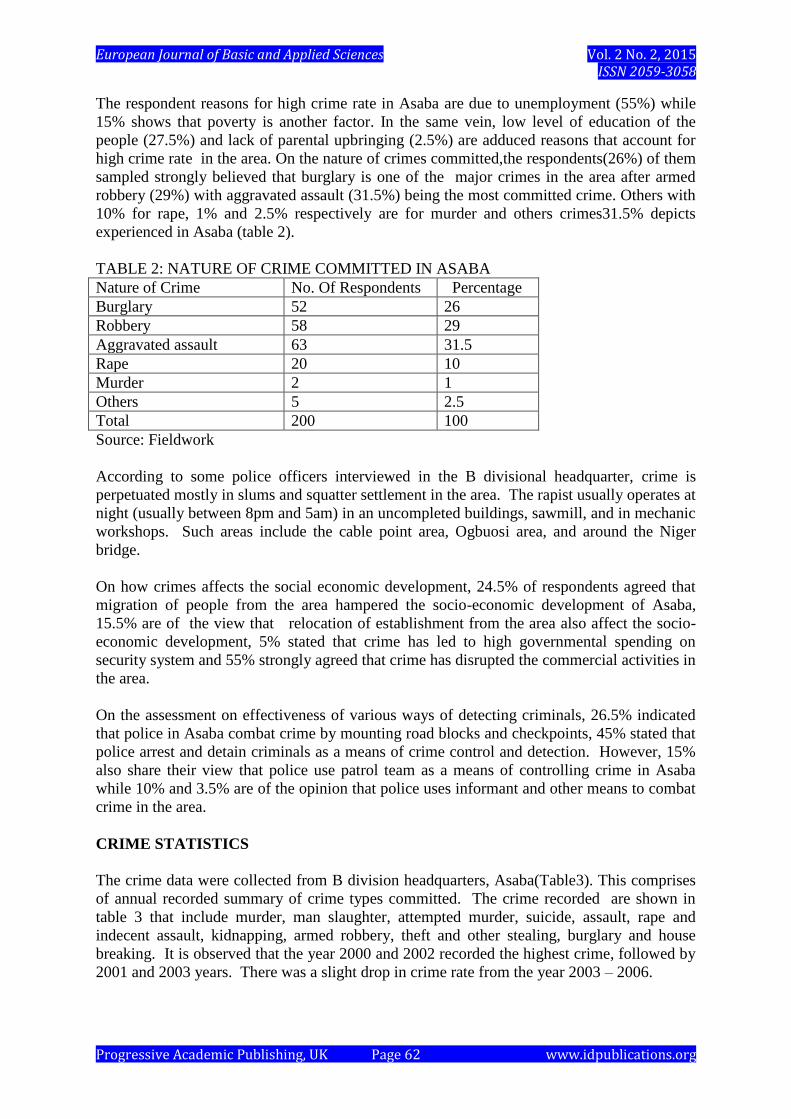
crime rate in each of the five zones,the respondents are of the opinion that Asabi is noted for
(high),crime rate with 123,70 (medium) and 7 (low) in the areas as shown below (table 1).
TABLE 1: AREAS OF CRIME IN ASABA
High Medium Low
Nnebesi Road 18 11 1
Cable/traffic light 45 20 3
DBSgovt house area 15 10 1
Ezenei avenue 20 14 1
Dennis Osadebe 25 15 1
Total 123 70 7
Source: Fieldwork
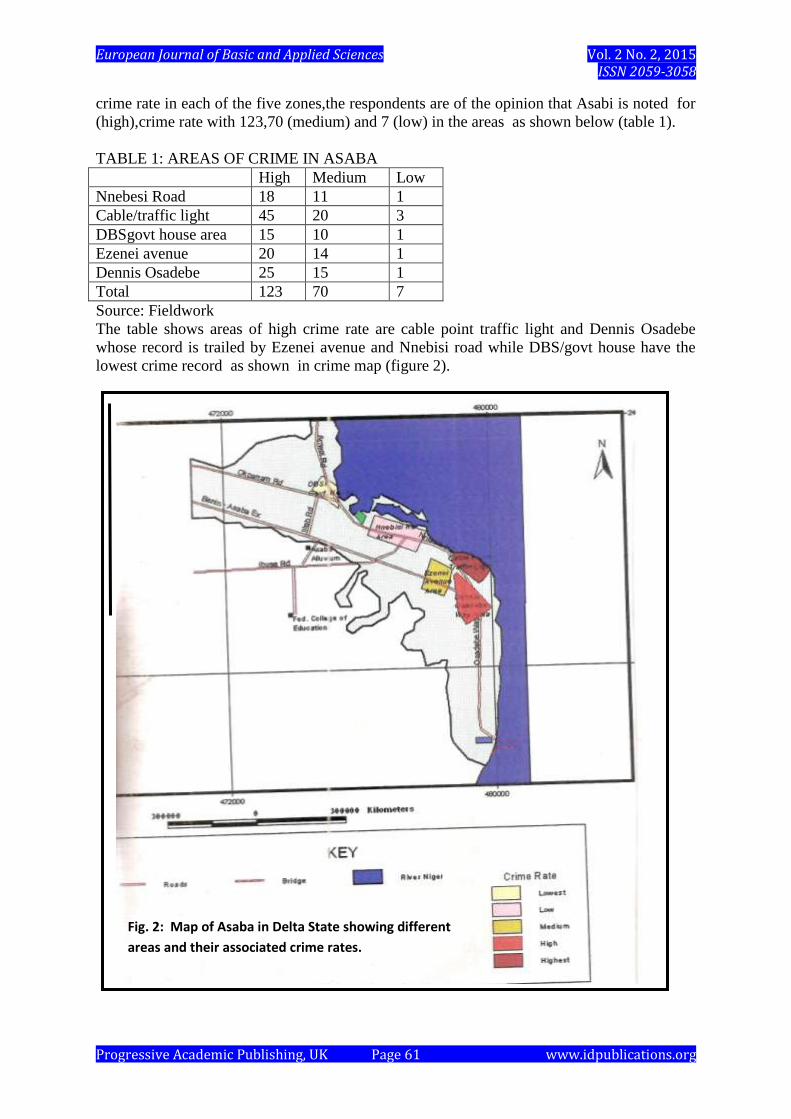
The table shows areas of high crime rate are cable point traffic light and Dennis Osadebe
whose record is trailed by Ezenei avenue and Nnebisi road while DBS/govt house have the
lowest crime record as shown in crime map (figure 2).
Fig. 2: Map of Asaba in Delta State showing different
areas and their associated crime rates.
European Journal of Basic and Applied Sciences Vol. 2 No. 2, 2015 ISSN 2059-3058
Progressive Academic Publishing, UK Page 62 www.idpublications.org
The respondent reasons for high crime rate in Asaba are due to unemployment (55%) while
15% shows that poverty is another factor. In the same vein, low level of education of the
people (27.5%) and lack of parental upbringing (2.5%) are adduced reasons that account for
high crime rate in the area. On the nature of crimes committed,the respondents(26%) of them
sampled strongly believed that burglary is one of the major crimes in the area after armed
robbery (29%) with aggravated assault (31.5%) being the most committed crime. Others with
10% for rape, 1% and 2.5% respectively are for murder and others crimes31.5% depicts
experienced in Asaba (table 2).
TABLE 2: NATURE OF CRIME COMMITTED IN ASABA
Nature of Crime No. Of Respondents Percentage
Burglary 52 26
Robbery 58 29
Aggravated assault 63 31.5
Rape 20 10
Murder 2 1
Others 5 2.5
Total 200 100
Source: Fieldwork
According to some police officers interviewed in the B divisional headquarter, crime is
perpetuated mostly in slums and squatter settlement in the area. The rapist usually operates at
night (usually between 8pm and 5am) in an uncompleted buildings, sawmill, and in mechanic
workshops. Such areas include the cable point area, Ogbuosi area, and around the Niger
bridge.
On how crimes affects the social economic development, 24.5% of respondents agreed that
migration of people from the area hampered the socio-economic development of Asaba,
15.5% are of the view that relocation of establishment from the area also affect the socio-
economic development, 5% stated that crime has led to high governmental spending on
security system and 55% strongly agreed that crime has disrupted the commercial activities in
the area.
On the assessment on effectiveness of various ways of detecting criminals, 26.5% indicated
that police in Asaba combat crime by mounting road blocks and checkpoints, 45% stated that
police arrest and detain criminals as a means of crime control and detection. However, 15%
also share their view that police use patrol team as a means of controlling crime in Asaba
while 10% and 3.5% are of the opinion that police uses informant and other means to combat
crime in the area.
CRIME STATISTICS
The crime data were collected from B division headquarters, Asaba(Table3). This comprises
of annual recorded summary of crime types committed. The crime recorded are shown in
table 3 that include murder, man slaughter, attempted murder, suicide, assault, rape and
indecent assault, kidnapping, armed robbery, theft and other stealing, burglary and house
breaking. It is observed that the year 2000 and 2002 recorded the highest crime, followed by
2001 and 2003 years. There was a slight drop in crime rate from the year 2003 – 2006.

European Journal of Basic and Applied Sciences Vol. 2 No. 2, 2015 ISSN 2059-3058
Progressive Academic Publishing, UK Page 63 www.idpublications.org
TABLE 3: CRIME STATISTICS RETURNED FROM THE YEAR 2000 – 2006.
Types of Crime Years
20
00
20
01
20
02
20
03
20
04
20
05
20
06
Murder 15 10 20 3 5 6 4
Slaughter 12 7 15 1 1 2 -
Attempted murder 25 20 40 8 6 3 1
Suicide 1 - - - - 1 -
Assault 35 40 50 25 30 20 17
Rape and indecent
assault
4 5 - 4 3 4 2
Robbery 3 3 1 2 1 3 -
Armed Robbery 38 45 35 30 22 20 17
Theft and other stealing 40 33 30 22 30 40 38
Burglary 21 17 15 12 10 7 2
House Breaking 17 18 17 20 15 20 10
Annual total crime
committed
211 197 223 127 123 126 91
Source: B Division Crime Statistics Return.
There is a graphical fluctuation of crime record between the 2003, 2004, and 2005 years
corresponding with 127, 123 and 126 to a drop of 91 in 2006 respectively. This is illustrated
with line graph in figure 3 below.
Years
Fig. 3: A line graph showing crime statistic of the year 2000 to 2006.
The reduction in crime according police resulted from improved new methods of crime
prevention and control as well as effective training of officers for crime detection in the area.
These include installation of car gadgets, effective communication system and situational
report in the police department. He explained further the reasons for high crime rate recorded
0
50
100
150
200
250
300
2000 2001 2002 2003 2004 2005 2006
Nu
mb
er o
f C
rim
e
Y
European Journal of Basic and Applied Sciences Vol. 2 No. 2, 2015 ISSN 2059-3058
Progressive Academic Publishing, UK Page 64 www.idpublications.org
in the year 2002 resulted from political atrocities committed amongst politicians and their
opponents during the election period. AThe trend is illustrated with line graph above.
The public interviews observed that most crimes were not detected or reported for
documentation as there is no love lost between the police and public. The police are not
friendly, as most information volunteered end up in hands of criminal and the people with
their families live in danger.
(A) SUMMARY OF FINDINGS
The crime rate in Asaba and indeed all parts of the Niger Delta have increased over the years
with perfection and sophistication. The security agencies are ill equipped in effective
handling of array of data that justify high technology and sufficient manpower. To define the
jurisdiction of specific police stations adequately is still a problem for both the force and the
populace. Indeed, citizens hardly know which specific station to go to when they are victims
of any crime occurrences. GIS could be used to embark on vigorous enlightenment
campaigns and education of all concerned. That, GIS can go a long way in achieving this
justifies the need for the usel of the tool in the basic training and skill development
programmes of the force at all levels (Sonoye, 2002). These have not been able to effectively
tackle the issue of crime particularly Asaba and generally in Nigeria. Based on the study, the
crime rate in Asaba and all parts of the Niger is high, due to the high level of unemployment
and low level of education. GIS could be used in improving the conventional method used
by the police in fighting crime rather road blocks to locate and apprehend wanted person.
GIS can also be used for 24 hours surveillance of high crime areas for control and prevention
as shown in this research work
B) The year 2004 – 2010
This section is aimed at presenting and discussing the findings of the study of the use of
geographical information system (GIS) in crime trends in Asaba between 2004 and 2010 is
presented in survey carried out by Mr Osu Micheal. The findings based on analysed data
collected are as follows:.
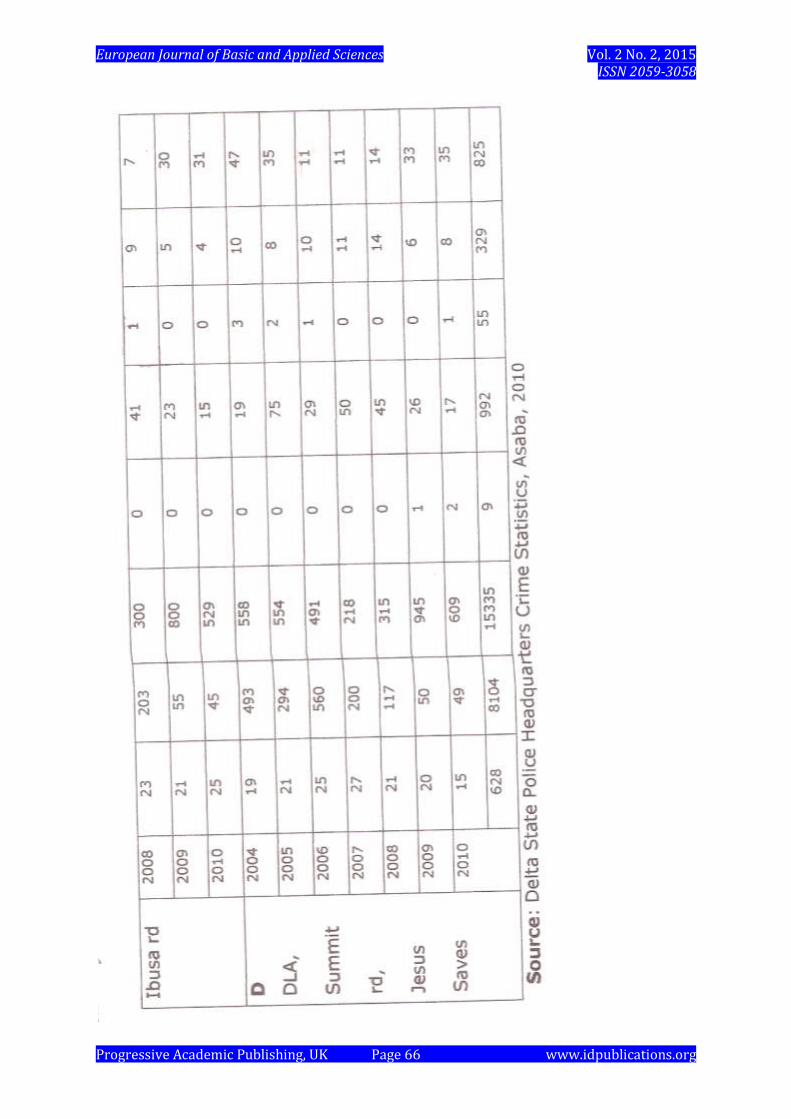
TYPES OF CRIMES REPORTED IN ASABA
The various types of crime committed in Asaba as reported by the Nigeria Police Force for
the period 2004 -2010 showed that a total of six hundred and twenty eight (628) cases of
armed robbery, Eight thousand, one hundred and four (8104) cases of assault on persons,
Fifteen thousand, three hundred and thirty five (15,335) cases of stealing, Nine (9) cases of
kidnapping, Nine hundred and ninety two (992) cases of malicious damages, fifty five (55)
cases of murder. While the rape cases were three hundred and twenty nine (329), other minor
crime were eight hundred and twenty five(825) (see Table 4 and Fig 3 for details.

European Journal of Basic and Applied Sciences Vol. 2 No. 2, 2015 ISSN 2059-3058
Progressive Academic Publishing, UK Page 65 www.idpublications.org
European Journal of Basic and Applied Sciences Vol. 2 No. 2, 2015 ISSN 2059-3058
Progressive Academic Publishing, UK Page 66 www.idpublications.org

European Journal of Basic and Applied Sciences Vol. 2 No. 2, 2015 ISSN 2059-3058
Progressive Academic Publishing, UK Page 67 www.idpublications.org
Fig 3: crimes committed in Asaba
ROLE OF THE NIGERIA POLICE IN CRIME DETECTIONS AND CONTROL
The Nigeria Police Force is charged with the responsibility of the maintaining law and order
and protection of lives and properties of the Nigeria citizenry. In a bid to carry out these
statutory duties, the law enforcement agent of the Government ensures that there is peace,
decorum and sanity in their areas of operation. This is done by routine checks of vehicles on
the roads/ street as well as periodic and scheduled patrols by men of the police forces to
forestall peace, to scare, monitor or arrest criminal and other offenders of the law. To
effectively carrying out their patrol activities in Asaba, Geographical information system
could be used to map the patrol line (GIS produced map) for several patrol vans/ teams for
effective crime control and monitoring in the area. (see Fig 4)
ROLE OF GIS AS A TOOL FOR CRIME MONITORING (HOT SPOT
DELINEATION)
Geographical information system is an effective tool in crime monitory through the mapping
of the crime hot spots in Asaba (Fig.5 and Fig.6).
Fig .4. Major Police Zones
ofAsaba

European Journal of Basic and Applied Sciences Vol. 2 No. 2, 2015 ISSN 2059-3058
Progressive Academic Publishing, UK Page 68 www.idpublications.org
INTEGRATED GIS WITH TRADITIONAL POLICE METHOD
Geographic Information System (GIS) tools are expensive although it could be used in
improving the efficiency of the conventional method employed by the police in fighting
crime. To define the jurisdiction of specific police stations adequately is still a problem to
both the force and the populace. Indeed, citizens hardly know which specific station to go to
when they are victims of any crime occurrences. GIS could be used to embark on vigorous
enlightenment campaigns and education of all concerned.Remote sensing and GIS can go a
long way in achieving this feat but it justifies the need for the appraisal of the tools in basic
training and skill development programmes(reference level) of the security forces at all
levels,The effectiveness of GIS has to do with scientific and timely information management
and communication that are essential for security agencies operation. This compliment men
on patrol based on geographical data on areas of high crime rate, commercial areas, areas of
government institutions as well as areas with sensitive installation can be used by police on
duty (Rilwani and Eguabor, 2000)
B). SUMMARY OF FINDINGS
The following are the major findings
Figure 5: Crime
Hot-spot of Asaba
Figure 6: Significant Local Getis-Ord
Statistic of Asaba for crime hot-spot

European Journal of Basic and Applied Sciences Vol. 2 No. 2, 2015 ISSN 2059-3058
Progressive Academic Publishing, UK Page 69 www.idpublications.org
Crimes of various types increased over the years from (2004- 2010) in Asaba as result of
political activities but had a unique features in each of the zones. The political hub areas in
zone A and B had started to experience kidnapping which was alien to the areas, the
traditional zones had fewer crimes reported.
This study revealed one striking reality necessary for consideration which is that, the areas of
high crimes for the period of 2004- 2010 were Okpananm road areas, Nnebisi road, West –
End and Asaba- Onitsha express. These are areas of high socio- economic activities as well as
the political hub of the town while Direct Labour Road (DLA), Cable point, Umueze, Jesus
saves, Agiri Street, Ezenei Avenue as well as Summit junction roads are areas of moderate
crimes. These are areas with markets and other moderate economic activities. In the low
crime category are areas such as Umaje, Umuagu, Ibusa Road, and Isieke area which are
highly traditional buildings harbouring the indigenes of Asaba.
CONCLUSION
The study involved understanding pertinent locations and spatial pattern of crime monitoring
over a tine series period of seven years of two data sets (2000-2006) and (2004 -2010) in
Asaba, Delta State. The results have far reaching implication of security planning and
management. Also, the findings have far reaching implications for road monitoring and road
patrol in the country especially when similar studies are conducted in other parts of Nigeria.
It can form the basis for generating regional or national empirical modals based on the
peculiar crime factors identified in this study. Therefore, to stem crimes in Asaba, the Nigeria
police and other security agencies should intensify more efforts and opt for the application of
GIS in the quest for effective policing and crime management.
RECOMMENDATIONS
The following recommendations are made based on this research study.
The government, (Federal, State and Local Government) should set up remote sensing
and GIS departments for security agencies to provide timely spatial analysis of crime
location, human and resource allocation for administrative planning.
The patrol units should be equipped with GIS facilities and relay with remote sensing
equipment such that human and financial allocations could be known for timely
intervention by for response.
Crime data should be pasted on web sites to facilitate data sharing, in upsetting some
security and privacy concern.
Government should provide more employment skill acquisition and grantand micro
credits to youths in the area.
Furthermore, an enabling peaceful environment be created with this methodology
already adopted by developed countries for foreigninvestors into the area.
These will go a long way in minimizing high crime rate in Nigeriafornational security,
political stability for economic development.
REFERENCES
Ackerman, W. V. & Murray, A. T. (2004). Assessing spatial pattern of crime, Lima
Ohio.Elservier Ltd, Great Britain,PPI-50.
Allen, J. R. L. (1963). Late Quaternary Niger Delta. Geol.Enmajubu.Journal.,Vol. 5, pp. 1-
12.

European Journal of Basic and Applied Sciences Vol. 2 No. 2, 2015 ISSN 2059-3058
Progressive Academic Publishing, UK Page 70 www.idpublications.org
Anne, C. (2004). GIS fight crime. Chicago Week.GM Enterprise, U.S.A.
Canedy, D. (2001). Tampa scans the face in its crowd for criminal. New York Times, July 4,
U.S.A.
Chabrow, E. (2002). Every move you make, every breath you take.Information Week, August
30.
Crampton, J. W. (2002). The risk of security, environment and planning.Society and Space.
Vol. 20, Pp. 631 – 635.
Curry, M. R. (1998).Digital Places: Living with Geographic Information
Technologies,Routledge, P. 12. London and New York, pp..10-15.
Cutter, S. L.; Richardson, D. &Wilbank, T. (2003).The geographical dimension of
Terrorism;Action Items and Research Properties.Routledge, P. 23. London and New
York.
Clinnard, M. B. & Abbot, D. J. (1973). Crime in developing countries: A comparative
perspective: John Wiley and Sons, London, 8p.
David, J. S. (1985). Police and People. John Wiley Publication, London. Pp. 21-42.
Ejemeyovwi, D.O. (2008). The environment of the Niger Delta. A contribution in G, Ojie
(ed.) reversed Man and his Environment. A publication of GST, Delta State
University. In Press..
Odemerho, F &Ejemeyovwi, D. O.(2008The physiographic and drainage system of Delta
State, Nigeria. In Odemerho, F.(ed.). Delta State in maps. A publication of
Geography and Regional Planning Delta State university, Abraka.,vol.1.pp1-10
Emeji,M.J .&Obinna, V. C. (2002). An environmental management framework for the Niger
Delta Issues, Forms and Challenges. African Jour. of Environmental Studies, vol. 3,
no. 12, pp. 172-181.
Evamy, B.O.; Horemboure, J.; Kamerling, P.; knoap, W.A.L,; Molloy. F.A. &Rowkinds,
P.R. (1978).Hydrocarbon habitat of tertiary Niger Delta.InAAPGBulls;vol 622, no.1,
pp 1-3.
ESRI, (2010), ARC Views Vol. 3, September 15.
Fitzegard, M. G., Molennar, O. A. &Panson, J. (1981).Crime and Society.Routledge and K.
Paul Ltd. London. . 348 p.
Friedman, A. R. (2000), Advanced Statistic for Economists, New York, Routledge,.Pp 272.
Hacking, A. (1990). Space of surveillant stimulation, New York, Routledge, pp. 131 – 148.
Jeffery, S. & Estes, J. (1990). Geographic Information System: An Introduction Prentice Hall,
New Jersey, 13 p.
Kimerling, J. A. (1994). Geographic Information System and Cartography.Proceedings of the
Seminar and Teaching Conventional Digital Line.Istanbul Technical University,
Istanbul, Turkey, Pp. 35 – 47.
Kartik, K. (2004). Application of GIS in crime analysis and geographic profiling, India Indus
Corp Pub Ltd.
Laboratory, (2000) U.S. Department of Justice Washington, D.CPsp.1-17.
Lyon, D. (1994). The electronic eye, the rise surveillance society. University of Minneapolis
Press, P. 259.
Monmornier, M. K. (2002). Spying and maps, Chicago University Press, USA; P. 242.
Murray, O. (2001). Explanatory spatial data analysis techniques for examining urban
crime.Britt. 1. Criminol. Vol. 4, Pp. 308 – 329.
Nwachukwu, J. J. &Odjegba, E.T. (2001), Compaction in a reservoir Sandstone of the Niger
Delta. Nigeria Jour. of Mining and Geology, vol. 37, No.2pp208-307.
Odemerho, F. (2008).The geology of Delta Sate. In Odemerho, F. (ed.) Delta State in maps.
A publication of Geography and Regional Planning Department, Delta State
University press.Abraka.
European Journal of Basic and Applied Sciences Vol. 2 No. 2, 2015 ISSN 2059-3058
Progressive Academic Publishing, UK Page 71 www.idpublications.org
Odemerho, F &Ejemeyovwi, D. O.(2008). The physiographic and drainage system of Delta
State, Nigeria. In Odemerho, F. (ed.). Delta State in maps. A publication of
Geography and Regional Planning, Delta State university, Abraka.
Pickle,J. (1991). Geography, GIS and the surveillantsociety.Papers and processing of applied
Geography Conference, Vol. 14, Pp. 80 – 90.
Rilwani, M. I. &Eguabor, D. (2000).The need for GIS in crime prevention, detection and
control.A case study of Edo State Police Command, Journal of the Nigeria
Cartographic Association, pp. 86 -95.
Reijers, T.J.A. (1996). Selected chapters in Niger Delta geology, Lagos: SPDC Publication,
Lagos, Nigeria.
Skomal, E. N. (1981). Automatic Vehicle Locating System. Van Nostrand Reinhold, New
York. Pp. 3 – 4.
Smith, N. (1992), Progress in Human Geography, New York University Press, Pp. 257 – 271.
Smith, R. S. &Hogen, O. J. (1996).The Justice System.New York University Press, 123p.
Sonoye, A. S. O. (2002). A GIS – based evaluation of the adequacy of Police Station
IkejaLGA, Lagos State. The Nigeria Cartographic Association, Pp. 50 – 59.