crime-specific .anal¥sis.:- i
TRANSCRIPT

~,
Crime-Specific .Anal¥sis.:...-Th e Characteristics I [i' ~, ry 1';~ r;:"l(Fi) !;lg'W-~ I\b" (S'
~ I'. '.' ,~ ; 1 '"',,jef '" 'w \~;.:::..' i.;I ~:; ,J •• :l- ti ~ L.1/:".iI
of Burglary Incidents I " ......... fli'.~~& .... , ,...... ................,..,...
------------
7 !'r . '. '~ ,
.., ~ .' . , /
. . rr)
,
...L... DEPARTMENT OF JUSTICE Law Enforcement Assistance Administration ~ - nal Criminal Justice Information and Statistics Service UTILIZATION OF CRIMINAL JUSTICE STATISTICS ANALYTIC REPORT 10
"
If you have issues viewing or accessing this file contact us at NCJRS.gov.
National Criminal Justice Information and Statistics Service Reports
Utili'zation of Criminal Justice Statistics Project: Sourcebook of Criminal Justice Statistics 1976 (annual) Public Opinion Regarding Crime, Criminal
Justice, and Related Topics New Directions in Processing of Juvenile Offenders:
The Denver Model Who Gets Detained? An Empirical Analysis of the
Pre-Adjudicatory D~tention of Juveniles in Denver
Juvenile Dispositions: Social and Legal Factors Related to the Processing of Denver Delinquency Cases
Offender-Based Transaction Statistics: New Directions in Data Collection and Reporting
Sentencing of California Felony Offenders The Judicial Processing of Assault aod Burglary
Offenders in Selected California Counties Pre·Adjudicatory Detention in Three Juvenile
Courts Delinquency Dispositions: An Empirical Analysis
of Processing Decisions in Three Juvenile Courts The Patterns and Distribution of Assault Incident
Characteristics Among Social Areas Patterns of Robbery Characteristics and Their
Occurrence Among Social Areas Crime·Specific Analysis:
The Characteristics of Burglary Incidents An Empirical Examination of Burglary Offender . Characteristics
An Empirical Examinatiol) of Burglary Offense and Offender Characteristics
Victimization Surveys: Criminal Victimization in the United States (annual):
A Comparison of 1974 and 1975 Findings A Comparison of 1973 and 1974 Findings 1974 (final report) 1973 (final report)
Criminal Victimization Surveys in 13 American Cities: National Crime Panel Surveys in Boston, Buffalo, Cincinnati, Houston, Miami, Milwaukee, Minneapolis, New Orleans, Oakland, Pittsburgh, San Diego, San FI'ancisco, and Washington, D.C. (summary report)
Criminal Victimization Surveys in Chicago, Detroit, Los Angeles, New York, and Philadelphia: A Comparison of 1972 and 1974 Findings
Criminal Victimization Surveys in the Nation's Five Largest Cities: National Crime Panel Survey in Chicago, Detroit, Los Angeles, New York, and Philadelphia, 1972
Criminal Victimization Surveys in Eight American Cities: A Comparison of 1971/72 and 1974/75 Findings-National Crime Surveys in Atlanta, Baltimore, Cleveland, Dallas, Denver, Newark, Portland, and St. Louis
Crime in Eight American Cities: National Crime Panel Surveys in Atlanta, Baltimore, Cleveland, Dallas, Denver, Newark, Portland, and St. LouisAdvance Report, 1971/72
Crimes and Victims: A Report on the Dayton·San Jose Pilot Survey of Victimization
Applications of the National Crime Survey Victimization and Attitude Data:
Public Opinion About Crime: The Attitudes of Victims and Nonvictims in Selected Cities tocal Victim Surveys: A Review of the Issues The Police and Public Opinion: An Analysis of Victimization and Attitude Data from 13 American Cities
National Prisoner Statistics: Capital Punishment (annual):
1976 Advance Report 1975 (final report)
Prisoners in State and Federal Institutions (annual): December 31, 1976: Advance Report December 31, 1975 (final report)
Census of State Correctional Facilities, 1974: Advance Report
Survey of Inmates of State Correctional Facilities, 1974: Advance Report
Census of Prisoners in State Correctional Facilities, 1973
The Nation's Jails: A report on the census of jails from the 1972 Survey of Inmates of Local Jails
Survey of Inmates of Local Jails 1972: Advance Report
Children in Custody: Juvenile Detention and Correctional Facility Census
Advance Report, 1974 Census Advance Report, 1972·73 Census Final Report, 1971, Census
State and Local Probation and Parole ~.l(stems
State and local Prosecution and Civil Attorney Systems
National Survey of Court Organization: 1977 Supplement to State Judicial Systems 1975 Supplement to State Judicial Systems 1971 (full report)
Criminal Justice Agencies in Regions 1·10 (10 volumes)
Trends in Expenditure and Employment Data for the Criminal Justice System, 1971·75 (annual)
Expenditure and Employment Data for the Criminal Justice System: 1975 (annual)
Dictionary of Criminal.Justice Data Terminology: Terms and Definitions Proposed for Interstate and National Data Collection and Exchange
Program Plan for Statistics, 1977·81
IMPORTANT
We have provided an evaluation form at the end of this publication. It will ass~st us in improving future reports if you complete and return it at your " convenience. It is a self-mailing form and needs n~ stamp. L-__ ~ ________________ ~ ____ • ____ ~, ~__
Single copies are available at no charge from the NationJ! Criminal Justice Reference Service, Box 6Q{,l(}, P!oakwWoMd. 20850. Multiple copies are for sale bV trJi~ $UPf:i'i· intendent of Documents, U.S. GovernmGi1~, Printing Office, Washington, D.C. 20402.

il I' if
1/
Utilization of Criminal Justice Statistics Project
ANALYTIC REPORT 10
CRIME-SPECIFIC ANALYSIS: The Characteriistics of Burglary Incidents
by CARLE. POPE Research Analyst
CRIMINAL JUSTICE RESEARCH CENTER Albany, New York
This project was supported by Grant No. 75-SS-99-6001, awarded to the Criminal Justice Research Center, Albany, New York by the Statistics Division, National Criminal Justice I nformation and Statistics Service, Law Enforcement Assistance Administration, U.S. Department of Justice, under the Omnibus Crime Control and Safe Streets Act of 1968, 11S amended; the project, entitled "Utilization of Criminal Justice Statist~cs," is being directed for the Criminal Justice Research Center by Michael J. Hindelang and monitored for LEAA by Sue A. Lindgren. Points of view or opinions stated in this document are those of the author(s) and do not necessarily represent the official position or policies of the U.S. Department of Justice.
LEAA authorizes any person to reproduce, publish, translate, or otherwise use all or any part of the copyrighted material in this publication, with the exception of those items indicating that they are copyrighted by or reprinted by permission of any source other than the Criminal Justice 'Research Centsr.
Copyright 1977 by Criminal Justice Research Center
NCJRS
OCT 251971
ACQUISITIONS
S[}-AR-10 1977
U.S. DEPARTMENT OF JUSTICE
LaVlr Enforcement Assistance Administration
National Criminal Justice Information and Statistics Service

U.S. DEPARTMENT OF JUSTICE Law Enforcement Assistance Administration
James M.H. Gregg, Acting Administrator
Harry Bratt, Assistant Administrator National Criminal Justice Information and Statistics ~ervice
Benjamin H. Renshaw, Director Statistics Divisi,on
Library of Congress Cataloging in Publication Data
Pope, Carl E. Crime-specific analysis, the characteristics of
burglary incidents.
(Analytic report-Utilization of Criminal Justice Statistics Project; 10)
"SD-AR-10 1977." Bibliography: p.47 1. Burglary-United States. I. Title. II. S£.ries:
Criminal Justice Research Center. Utilization of Criminal Justice Statistics Project. Analytic report - Utilization of Criminal Justice Statistics Project; 10. HV6658.P6722 364.1'62 76-50131
For sale by the Superintendent or Documents, U.S. Government Printing Office WnshlngtOll, D.O. 20402
Stook No. 027-000-00582-9 .;

."l ',.
THE UTILIZATION OF CRIMINAL JUSTICE STATISTICS Project was funded initially in 1972 by the National Criminal Justice Information ana Statistics Service of the Law Enforcement Assistance Administration. One primary aim of the project is the production of annual editions of the Sourcebook of Criminal Justice Statistics, a compilation of available nationwide criminal justice statistical data. A second aim has been and continues to be an examination of the utility that a variety of criminal justice statistical data bases have for addressing questions of practical and theoretical interest in the field.
One product of that examination is a series of analytic reports, of which this volume is one. These reports, written by research staff members of the Utilization of Criminal Justice Statistics Project, all have a common theme: the discussion of a central criminal justice topic using an exemplary or innovative criminal justice data base. Each report in the series not only discusses substantive findings in regard to particular issues, but also considers the qualities and limitations of the data, as well as techniques and problems of analysis, in relation to the substantive findings.
At a time when criminal justice statistics development is extensive, and often expensive, these analytic reports focus attention on one often overlooked function of criminal justice statistics-the analysis of current· issues and questions based on available data. In fact, the utilization issue is perhaps as important as any in the area of criminal justice statistics. It often happens that data are collected-usually at great expense-without subsequent efforts to utilize such data to address the pressing problems that confront criminal justice. This series of Analytic Reports explores the problems and prospects inherent in the application of various sources of criminal justice statistical data to issues of interest and concern to agency personnel, planners, researchers, and the public alike.
MICHAEL J. HINDELANG Project Director

UTILIZATION OF CRIMINAL JUSTltE STATISTICS
Project Staff
Michael J. Hindelang, Project Co-Director Michael R. Gottfredson, Project Co-Director
I\Jicolette Parisi~ Project Coordinator Christopher S. Dunn, Project Coordinator
lawrence E. Cohen, Research Analyst Timothy J. Flanagan, Research Analyst John S. Goldkamp, Research Analyst Carl E. Pope, Research Analyst l. Paul Sutton, Research Analyst
Ann l. Pastore, Editorial Assistant Barbara Robarge, Editorial Specialist Maria Casapini, Production Assistant Erna Kelly, Editor
Mary Ann Hammond, Secretary Carol A. Rammo, Secretary Sharleen Saxe, Secretl3ry
Amy R. Herling, Clerical Marjorie J. Jones, CI€lrical Connie Rowe, Clericlal
I'
ACKNOWLEDGMENTS THIS STUDY could not have been undertaken without access to the burglary data base generously supplied by the Californi.!¥ Bureau of Criminal Statistics. I would like to express ~ppr(}dation to Bureau Chief Wil1ard Hutchins and Crime Studies Analyst Quinton Hegne( for patiently answering my many questions concerning these data. Interpretation of the data is the responsibility of the author m'ld opinions expressed here do not ne(',\~sarily represent the official position or policieti.>f the California Bureau t)f Criminal Statistics.
/l


PREFACE THIS SERIES of analytic reports constitute an empirical investigation of one specific criminal offense, burglary, exploring patterns and characteristics associated with both the offense and offender. Generally, criminologists have centered their attention on specific types (or categories) of crime and criminal offenders to gain a deeper understanding of the nature of crime. The aim of such undertakings has often been the identification, classification, and description of various types of criminal behavior. As a result, the literature is replete with numerous crime-specific studies ranging from shoplifting (Cameron, 1964) to homicide (Wolfgang, 1958). A notable exception, however, has been the lack of substantive quantitative research devoted to the crime of burglary. This is indeed paradoxical, considering the fact that burglary offenses constitute a substantial portion of all criminal activi ty.
Although some studies have explored the legal and social psychological aspects of burglary, few studies have undertaken comprehensive investigations of the patterning of burglary incidrmts. Furthermore, of those that have explored the correlates of burglary, most have focused upon an analysis of the rate and frequency of burgl!\'ry in conjunction with the distribution of census characteristics, such as median family income, median years of education completed (Dunn, 1974; Scarr, 19(3). Although such studies are valuable in describing the relationship of burglary incidents to social area attributes and changes occurring over time, an examination of individual burglary characteristics and their interrelationships has not been adequately pursued. For example, most investigations have reported upon offense characteristics only and have virtually ignored the criminal offender. As a result much less is known about burglary offenders than about other offender groups. Only recently have attempts been made to examine the link between burglary offenders and the crimes that they commit.
The need for an empirical investigation of burglary is further underscored by the seriousness of this offense in relation to the general crime problem. Since its inception, the Uniform Crime Reports (UCR) has consistently noted the high proportion of burglary offenses known to police across the country. In 1971, for example, an estimated 2,368,400 occurrences of burglary, 46 percent of all known property offenses, were reported to law enforce men t agencies (Gray, 1972: 10). In addition, crimes of burglary account for a SUbstantial proportion of all economic loss occurring as a result of crimiJlal
enterprise. Statistics for 1971 also.show that the average dollar loss reported per burglary Was $,312 and reveal.al1 overall economic loss of $739 million (Gray, 19n~21). Losses due to residential burglary ($457 million) were proportionately higher than nonresidential losses ($282 million) (Gray, 1972:21). Victimization data collected in 1972 for eight cities (LEAA, 1974) showed that reported losses for household and business burglaries were quite similar (Hindelang, 1976). Twenty-four percent of those household burglaries sampled involved losses of $250 or more, compared with 28 percent for bUSiness burglaries (Hindelang, 1976:459). Iii 1969, business losses from burglary totaled $950 million (Small Business Administration, 1969:2). Small business organizations alone accoun ted for 71 percent of these losses or $677 million (Small Business Administration, 1969:2).
Although most studies indicate that the bulk of burglaries involve losses of moderate value (Scarr, 1973), the frequency of burglary creates a multi-million dollar problem in terms of aggregate loss.
A major goal of this series of reports, therefore, is to examine the patterning of burglary incidents including both offense and offender characteristics. Accepting the premise that crime is a structured event, burglary is viewed as a pro(,~ss or sequence of events in which certain phenomena are related to other phenomena. The questions these reports seek to answer are of the follOWing type: How, for example, are burglaries distributed in space and time? Are there certain times of the day, week, or month when burglaries are most likely to occur? With regard to target characteristics, the inquiry focuses upon the types of structures most likely to be burglarized including various aspects of burglary inciden ts, such as the means used to gain en try, the type and value of the merchandise stolen, and the amount of property damage.
Nllmerou~ "target-Ilurdening" characteristics sllch as artificial lighting and alarm systems are also examined, especially how they relate to burglaries cleared by arrest arld attempted or completed burglaries.
Currently little information about the characteristics of apprehended burglary offenders is available. The UCR, at present our best source of national arrest data, provides sparse information on those individuals arrested for the commission of burglary. In 1971, for example, the UCR reported that males constituted 95.1 percent and females 4.9 percent of all burglary arrestees (Gray, 1972:125), and that 83.3 percent of all burglary arres tees were under 25 years of age (Gray I 1972: 124). No
7

data are provided, however, on the combined characteristics of apprehended burglary offenders. What differences exist, for example, between male and female offenders with respect to legal (e.g., prior record) or demographic (e.g., race) characteristics? Because females constitute such a low percentage of all apprehended burglary offenders, it could be valuable to compare them with their male counterparts or with those females arrested for other criminal acts. Similar comparisons could be made between adult and juvenile burglary arrestees in terms of both offender and offense characteristics. The object of this research then is to report on specific traits of burglary arrestees, including age, sex, race, prior criminal history, and similar factors in order to increase our substantive knowledge about the burglary offender group.
Although the separate analysis of both offense and arrestee characteristics is certainly a worthwhile endeavor, much more useful data are obtained when analysis focuses upon their joint relationship. Therefore, a major goal of this undertaking is to examine the link between arrested burglary offenders and the crimes for which they were apprehended. The research question, put simply, is whether and to what extent specific types of apprehended off~nders are associated with specific types of offenses.
Similar investigations in other areas have proven informative. For example, analysis of specific violent and personal crimes have produced 80me significant findings about the relationship between the offender and his victim. Briefly, studies by WoJfgang (1958), Amir (1971) and Normandeau (1968) have demonstrated the
8
existenc,e of distinctive and recurrent patterns in victimoffende.r relationships. Instead of being randomly distributed, such events were found to be higllly consistent phenomena. These findings lent empirical support to von Hentig's (1948) notion of victim-precipitated crime. That is, the criminal's victim is often a direct precipitator of the crime by contributing to the genesis of his own victimization. Furthermore, the characteristics of thos1e offenders frequently apprehended for homicide and rape led to a new theory of crime focusing upon the subcultural attributes of violent offenders. Similar studies, however j have yet to be undertaken for many property offenses, including burglary. Thus, it is still uncertain if patterns discovered for violent offenses do exist for crimes against property. This study attempts to bridge this gap in knowledge by examining the relationship between the arrested burglar and the crime in which he engages.
This first report of the series begins with an examination of various characteristics associated with the commission of burglary. The second report builds upon the first by providing an analysis of the social and legal characteristics of those arrested for the crime of burglary. The third and final report attempts to link the first two by exploring the interrelationship between offense and offender characteristics.
Carl E. Pope School of Social Welfare Criminal Justice Program University of Wisconsin Milwaukee, Wisconsin, 1976

-CONTENTS
Preface ..••.....••..............•........ " •.•.•... 7
Highlights of the Findings ..........................•.. 11
Introduction ........•.•......•............•........ 13
Trends in the Incidence of Burglary ..................... 13
Previous Research Findings .......•............•.... ..14
Data Source. . . . . . . . . . . . . . . . . • . . . . . . . . • . . . . . . . . . .. ; 18
Level of Analysis .•................•...........•..... 19
Measurement ....................................•.• 22
Characteristics of Reported Burglary Incidents ............. 22 . Structural Characteristics of Burglary Incidents ......... 22
Temporal Characteristics of Burglary Incidents ...•..•.. 24
Offense Characteristics of Burglary Incidents ........... 25
Deterrent Characteristics of Burglary Incidents .••..•.•. 27
Method of Analysis ....•.. , ................•......... 27
Patterning of Burglary Incidents ........................ 29
Burglary Clearances ...........................•.•.... 34
Deterrent Characteristics of Reported Burglary Incidents .•... 39
Summary and Conclusions .........•..........•.....•. 43
References ..................•.........•........•... 47
9
'))

TABLES AND FIGURES
Table Sample characteristics of target areas ... 20
Table 2 Intercorrelations among census indicators (pearson's r) .....•........... 22
Table 3 Type of structure burglarized ...•.... 23
Table 4 Financial loss resulting from burglary .. 23
Table 5 Types of property taken during burglary . 24
Table 6 Time of day during which burglary oc-curred ..•..•...........•... 2S
Table 7 Day of the week during which burglary occurred ................... 2S
Table 8 Method by which burglaries were cleared. 26
Table 9 Method by which burglaries were de-tected ..................... 26
Table 10 Target area in which burglaries occurred . 26
Table 11 Distribution of burglary incidents by census characteristics ............• 27
Table 12 Deterrent characteristics of burglary in-cidents ..•...............•..... 28
Table 13 Financial losses due to burglaries. by type of structure burglarized .•......... 30
10
Table 14 Type of property stolen, by type of struc-ture burglarized ................. 31
Table 15 Methods employed in burglary incidents, by type of structure burglarized .... n
Table 16 Temporal characteristics of burglaries, by type of structure burglarized ....... 33
Table 17 Whether or not burglary was cleared, by type of structure burglarized ....... 34
Table 18 Whether or not offense was cleared, by whether or not a loss occurred during the burglary .... ,............... 34
Table 19 Whether or not offense was cleared, by the amount of loss occurring during the burglary •................... 35
Figure 1 PAA results for burglary offenses cleared 3·8
Table 20 Summary of the PAA results for burglary offenses cleared ................. 37
Table 21 Deterrent characteristics, by type of structure burglarized .......•..... 39
Table 22 Deterrent characteristics, by attempted and completed burglaries •......... 41 .
Table 23 Attempted and completed burglaries, by type of structure burglarized ....... 43
Figure 2 PAA results for attempted burglaries ... 44
Highlights of the Findings IN THIS REPORT\ the characteristics of burglary incidents that occurred in six separate police jurisdiotions over a I-year period were examined. A total of 8,137 incidents were analy~ed in order to investigate recurrent patterns associated with the crime of burglary. ',Burglary losses were generally found to be of moderate value and included goods easily converted into cash. Although most burglaries involved some degree of forcible entry, such entries were mOre likeiy to occur in nonresidential rather than in residential structures. With regard to temporal factors, residential burglaries were most likely to occur during the week and during the day; nonresidential burglaries were most likely to occur on weekdays and at night. Deterrent features such as artificial lighting did not affect the probab1lity or a crime being cleared nor whethel' a burglary was completed or resulted in only an attempt. The characteristics of burglary incidents were found to be similar to those found in other studies of burglary regard. less of geographic region.
11
()


CRIME-SPECIFIC ANALYSIS:
The Characteristics of Burglary Incidents
Introduction
UNDER EARLY COMMON LAW, burglary was defined as the breaking and entering .of the dwelling of another, in the nighttime, with intent to commit a fe.!ony therein. This offense category evolved under the basic premise that a man's home is his castle, and thus security of habitation is a predominant concern. Under COIlH'nOnlaw definition, a burglary could not be consummated unless each element listed above existed simultaneously with the others. The act had to occur in the nighttime with an accompanying break and trespass against an existing dwelling with prior intent to commit a felony. If any element was lacking, the crime of burglary had not occurred. The development of statutory burglary laws, however, has been marked by a redefining or elimination of these traditional elements, thus extending the scope of the crime beyond its historic limits. Under most State statutes, for example, there is no requirement that an . actual break occur because forcible entry is no longer considered an element of the crime. Further, the concept of dwelling has been enlarged to include a wide variety of structures ranging .from telephone booths to automobiles. Variations in degrees of seriousness have also been provided along with corresponding differential penalty structures. Altogether there has been a shift in emphasis from common-law concerns regarding protection of habitation toward a more basic concern with protection of individual property (Cocke, 1969; Schultz, 1970). The fundamental thrust of current burglary statutes toward protection of ~foperty is evidenced by the classification of burglary in the general category of crime against property. For many years the Uniform Crime Reports (UCR) , in reporting on offenses known to the
police, has dichotomized index offenses into two dIstinct cla~ses-crimes of violence and,crimes of property (Gray, 1972). Traditionally, burglary has been included in the latter class, because the crime generally involves the unlawful entrance of a structure for the purpose of theft. Although legal definitions of burglary vary from State to State, most could be included under that general definition provided in the UCR, which defines bur.glary as "... the unlawful entry of a structure to commit a felony or theft, even when no force was used to gain entry" (Gray, 1972:18).
Trends· in the Incidence of B~rglary
()-
Overall, the number of burglaries known to the police in the United States increased 70 percent during the 5-year period from 1966 to 1971 (Gray, 1972: 18). Standardizing for population increase, the number of burglary offenses per 100,000 inhabitants increased by 62 percent (Gray, 1972:18). For a I-year period, from 1970 to 1971, the rate increase was 7 percent. In California alone, 36,522 felony arrests were made for burglary during 1971 (California Department of Justice, 1971 :5). Here the burglary rate per 100,000 inhabit~nts increased by 9 percent from 1970 to 1971 (California Departmen t of Justice, 1971: 5). Coupled with this sharp rise is the fact that burglary exhibits one of the lowest clearanc!;' rates of any criminal offense. In 1971 only 19 percent of all burglary offenses known to the police were cleared by arrest (Gray, 1972:21).
The UCR also presents some interesting figures con, cerning the nature of burglary. In 1971, for example, 77 percent of all reported burglaries involved forcible entry; 17 percent involved unlawful entry only; 6 percent in-
13

valved attempts to commit forcible entry (Gray, 1972:J8). The high percentage of forcible.entry burglaries is not surprising, because they are more likely to be noted and hence reported to the police. The low percentage of attempted burglaries is also expected, since victim survey results have shown that attempted burglaries were those most likely to go unreported (Hindeiang, 1976). Residential and nonresidential burglary accounted for 60 percent and 40 percent, respec· tively, of all burglaries reported to the police in 1971 (Gray, 1972:21). From 1966 to 1971 the incidence of daytime residential burglaries increased by 108 percent while nighttime residential burglaries went up 89 percent (Gray, 1972:20). For the same 5·year pedod, non· residential burglaries occurring during the daytime in· creased by 82 percent compared with a 29 percent increase in nonresidential nighttime burglaries (Gray, 1972:20). These figures lend support to the contention that burglary is a serious offense affecting millions of Americans throughout the country.
Aside from the personal impact on the victims of burglary, the increase in the incidence of burglary creates a severe strain on criminal justice resources. AI· thougb only one out of every five reported burglaries results in an arrest, the number of burglary offenders handled by the criminal justice system is quite substan· tial and continues to increase each year. In 1971, for example, the VCR reported that burglary arrests were up 7 percen t over the previous year, and from 1966 to 1971 burglary arrests increased by 42 percent (Gray, 1972:21). Persons under 25 alone accounted for 83 per· cent of all burglary arrests in 1971, and juvenile offend· ers under 18 constituted 51 percent of all burglary arrests (Gray, 1972:21). Females were infrequently arrested for burglary, being involved in about 5 out of every 100 burglary arrests (Gray, 1972 :21). Although white offenders arrested for burglary outnumbered black offenders two to on~, black offenders were still dis· proportiOJ1ately rept'eJsented (with respect to their popu· lation base) in burglary arrest statistics (Gray, 1972:21).
, The VCR further reported that of those arrested for burglary, 72 percen t were eventually prosecuted (Gray, 1972:21). Of those prosecuted, 51 percent were found guilty as charged; 18 percent were convicted of lesser charges; and 31 percent were freed through acquittal or dismissal of the charges (Gray, 1972:21).
The followJing disposition of burglary offenders occurred in o.1fifornia during 1971: of the 11,112 ar· restees handled at the superior court level, 8.8 percent were either acqUitted or had the charges against them dismissed; 75 percent were c~mvicted on a plea of guilty;
14
and 16.2 percent were convicted by trial (judge or jury) (California Department of Justice, 1971 :45). As with many other offenses, few burglary offenders went to trial, the substantial majority pleading guilty. Of those burglary defendants convicted at the superior court level, 65.3 percent received probation terms, 14.7 per· cent jail, 8.3 percent prison and 11.7 percent "other" sentences (California Department of Justice, 1971a:25). The following characteristics of those disposed of by the superior court were also noted: 15.1 percent had no prior record; 45.0 percent were under some form of supervision (e.g., probation) at the time of arrest; 56.2 percent were under 25 years of age; 53.0 percent were white; and 29.6 percent were black (California Depart· ment of Justiqe, 1971a:30).
Previous Research Findings Although empirical research focusing on the crime
of burglary is quite sparse, some studies have attempted to examine incident characteristics. It is instructive at this point to briefly review some of these studies and summarize their major findings. Such a summary pro· vides a basis for comparing present research results and an initial starting point for our analysis. Each study will be reviewed and, in turn, followed by a general synthesis of major recurring conclusions.
Scarr
Scarr analyzed burglary offenses in three separate police jurisdictions, reporting on characteristics of the offense (both residential and nonresidential) and the relationship between social factors and the occurrence of burglary.! Scarr also included the results of interviews with both victims and nonvictims, a profile of the typi· cal burglar, and scenarios illustrating the processing of burglary offenders through the court system. Like crime· specific studies in other areas, Scarr's study relied heav· ily on tabular and correlational analysis.2 By classifying
I The three jurisdictions Included In the study were (1) Fairfax County, Virginia, (2) Washington, D.C.: and (3) Prince George's County, Maryland. A major contribution of Scarr's work is an analysis of differential patterning of residential and nonresidential burglaries across geographic units over the period for which data were available. Scarr's ecological analVsis, how· ever, is not directly relevant to the present undertaking and, therefore, will not be discussed.
2 Scarr utilized correlation analysis to assess the degree of association between burglary indices (frequency and rates of residential and nonresidential offenses) and selected demographic characteristics of census areas. As noted earlier. however, an investigation of the ecological correlates of burglary has been done elsewhere (Scarr I -1973; Dunn, 1974) and is outside the scope of this study.

--------------
bur~laries as r~sidential and nonresidential, Scarr noted distinct differences between the two types. Residential burglaries occurred more frequently than nonresidential burglaries and were also increasing in the frequency of their occurrence (Scarr, 1973:32-35). Nonresidential burglaries were most likely to occur at night an~ on weekends, whereas residential burglaries generally occurred during the day on weekdays (Scarr, 1973:104). Most burglaries involved thefts of moderate value (generally in the $100 to $499 range) and included merchandise easily converted into cash (e.g., home entertainment equipment) (Scarr, 1973:28, 29)
Clarke A more limited study is Clarke's investigation
(1972) of burglary and larceny patterns in Charlotte and Mecklenburg County (North Carolina). Using census tracts as the unit of analysis, Clarke's findings proved quite similar to those of Scarr. Burglary' losses were generally of moderate value, usually consisting of easily salable items such as radios, televisions, and phonographs (Clarke, 1972:9). Clarke also found that residential burglaries were most likely to occur during a weekday at daytime; this was followed by weekend nights, weekday nights, and weekend daytime, respectively (1972:8). Nonresidential burglaries exhibited a different pattern and were most likely to occur during the weekday at nighttime followed by weekend nighttime, weekday daytime, and weekend daytime, in that order (l972:11). Residential burglary was found to be mostly a lowerclass phenomenon, occurring predominantly in areas that were classified through the measurement of median family income, as low in socioeconomic status (Clarke, 1972:6-7).
Clearance rates were relatively low, about 11 percent for all reported residential burglaries (Clarke, 1972: 10). Clarke further observed a relationship between the value of the merchandise stolen and the clearance rate: "The clearance rate is relatively high for low values, drops well below the mean for intermediate values, and reaches a relatively high level again for the highest property values" (Clarke, 1972: 10). Clarke's explanation of this relationship centers both upon the professionalism associated with different types of burglaries and upon police response. According to Clarke, low-value burglaries are committed by inexperienced -and incompetent burglars, thereby facilitating apprehension. Intermediate-value burglaries are harder to solve, because they are committed by more competent burglars. High value burglaries command more polic~ -jattention, and therefore, arrests are- most likely to occur. This assess-
ment, however, is based on information provided by police informants and thus may be questionable.
I
San~a Clara Criminal Justice Pilot Program (SCCJPP) \
A less methodologically sophisticated study of bur-glary was undertaken by the Santa Clara Criminal Justice Pilot Program (SCCJPP, 1972). The study incltlded offenses reported to the police for a 4-month pedod-January 1 to April 22, 1971. This report provides data on the characteristics of burglary offenses, their distribution across census tracts, and some information regarding the social correlates of apprehended offenders.
During this 4-month period, baseline data were collected on all offenses reported to the police. Approximately70percent of these baseline offenses were property crimes, and more than half of these were burglaries that accounted for half a million dollars worth of stolen pro" perty (SCCJPP, 1972:7). Again, losses were generally of moderate value (63 percent under $500), involving goods easily converted into cash (televiSions, stereos, etc.) (SCCJPP, 1972:9). Most burglaries occurred on Friday, Sunday, or Monday, with Friday alone accounting for 41 percent of all burglary incidents (SCCJPP, 1972 :9). In about three-fourths of all reported burglaries, force was used to gain entry, and a substantial proportion occurred between noon and midnigllt (SCCJPP, 1972:9). Most burglaries involved residential targets that were 1110re often homes than apartments (SCCJPP, 1972:23). Finally, in more than three-fifths of the burglaries reported, the owner/resident discovered the offense; the police were responsible for only 3 percent of all discoveries (SCCJPP, 1972:97).
Conklin and Bittner
-Conkiin and Bittner (1973), restricting their analysis to suburban burglaries, reported on 945 burglary incidents for a I-year period. According to the authors, ". . . efforts were directed towards the assembly of a relatively detailed cumulative picture of the crime over a significant period of time in a fairly typical suburban community" (Conklin and Bittner, 1973:209). Although
\\ these data were geographically limited, overall findings II were similar to those reported in other studies. The '\number of residential burglaries was two-thirds that of
non residential burglaries, but nonresidential targets faced a greater probability of being burglarized with'regard to potential targets at risk. The residential burglary rate Was found to b~ 22 per 1,000 structures, compared with a nonresidential rate of 217 per 1,000 structures (Conklin and Bittner, 1973:212). Like Scarr, Conklin
15

and Bittner noted little fluctuation in burglaries from month to month; seasonal variation was not evident for either residential or nonresidential burglaries (Conklin and Bittner, 1973:214-215). Three-quarters of all cases involved losses of less than $1,000; however, losses were found to be higher for residential burglaries than for nonresidential burglaries (Conklin and Bittner, 1973:217). Sixty percent of all suburb all burglaries coming to the attention of the police were reported by victims. Of those ,'\tructures burglarized, 5.6 percent had an alarm system of some kind; 39 percent of these systems failed to function (Conklin and Bittner, 1973:223-224). Time of occurrence was based on estimates 'Tlade within 3-hour limits and was included in only 298 of the 945 cases. Nonetheless, three-quarters of these 298 reported burglaries occurred at night, and 59 percent of all 298 reported burglaries occurred on weekends (Conklin and Bittner, 1973:213-215). Nonresidential burglaries (75 percent) were more likely to occur at night than residential burglaries (61 percent) (Conklin and Bittner, 1973:215).
Investigating the police response to burglary incidents, in terms of the number of personnel working on each case, led Conklin and Bittner to observe that burglaries involving greater losses elicited more police re-sponse.
Residential burglaries led to more police contacts than did commercial burglaries, half of the residential burglaries and only a fifth of the commercial offenses producing two or more contacts between the police and the victim
.... {~?nklin and. Bittner, 1973 :225-226). Conklin and Bittner further examined the relationship between police response and social class of victims. (The latter was measured by the assessed value of target homes.) They concluded that "_ .; police seem to be responding to the amount of loss in the burglary, not the influence of those who have highly assessed houses" (Conklin and Bittner, 1973:227). The overall clearance rate was quite low j 4.55 percent for all reported burglaries (Conklin and Bittner, 1973:228), and was hig4er for commercial burglaries (7.1 percent) than for residential burglaries (3.7 percent) (Conklin and Bittner, 1973:229). The amount of time between the occurrence of and reporting of a burglary to the police was related to the clearance rate: th~ longer the lapse before reporting, the less likely the cas~ would be solved (Conklin and Bittner, 1973:229).
Chimbos ... , An additional study of burglary based on offenses reported to the police was that of Chimbos (1973), who
16
examined burglary incidents occurring over a 6-year period in a northwestern Ontario city. Breaking and entering offenses were most likely to occur on weekends, and were more frequently residential than nonresiden tial offenses (Chimbos, 1973: 323). Furthermore, these offenses tended to rise during the summer months and to decline during the winter (Chimbos, 1973:323). Forty-one percent of all residential offenses occurred during the summer months compared to 35 percent for nonresidential offenses (Chimbos, 1973:324). Eightyfive percent of all offenses occurred at night, with a higher proportion among nonresidential (92 percent) than residential burglaries (70 percent) (Chimbos, 1973:324).
Reppetto
Another study relying on police inc,ident reports is Reppetto's (1974) investigation into patterns of both residential burglary and robbery in the greater Boston metropolitan area. Its overall goal was" .. : to identify, describe, and, where possible, explain in a systematic and quantitative manner the rates and patterns of these crimes and their correlation to key variables" (Reppetto, 1974:6). Data were derived from a variety of sources including burglary incident reports from 39 representative police reporting areas, surveys of both victims and nonvictims of burglary, field observations of building security features, and interviews with 97 adjudicated burglars .
Most reported burglaries were found to occur during the daytime and more often during the week than on weekends (Reppetto, 1974:19). As in other studies, losses were generally found to be of moderate value ($100 to $300 range) consisting of goods easily converted into cash (Reppetto, 1974:20).
Data on those reporting burglary victimizations revealed some interesting trends. Victimization rates tended to rise with income among both whites and nonwhites (Reppetto, 1974:57). Although nQ significant differences in victimization existed between blacks and whites, blacks were more likely to suffer multiple victimitation (Reppetto, 1974:59). Those most likely to report burglary victimizations were young, single, educated, and those whose homes were more frequently left unoccupied (Reppetto, 1974:61). Victimization experience did seem to have some effect upon security measures; those who had been burglarized were more likely to install additional locks, alarm systems, and the like (Reppetto, 1974:64).
i I
I I
()
flindelang
A limited victim survey (Reppetto, 1974) produced information not generally available in official data sources, information that may provide a comparative base from which to gauge the characteristics of those burglaries most often reported to the police. On a larger scale, the Law Enforcement Assistance Administration, in cooperation with the U.s. Bureau of the Census, con~ ducted surveys of crime victims in eight cities in 1972: Atlanta, Baltimore, Cleveland, Dallas, Denver, Newark, P9rtland, and St. Louis (LEAA, 1974). In this study, a representative sample of respondents were interviewed and asked to report on victimizations occurring within the previous 12-month period. Analysis of the survey data showed that, for residential burglaries, the victimization rate of renters exceeded that of homeowners (Hindelang, 1976:280). Furthermore, over three-quarters of those burglaries occurring in residences were completed rather than attempted regardless of the race of household members and their income level, with the ex- , ception of those with an annual income of over $25,000. --- . 'FOr'both whites and black/others, rates of
completion for burglary were very similar for all income groups under $25,000"':'ranging from 73 percent to 79 percent; however, in both racial groups, the rates for those with family incomes of $25,000 and over were slightly higher-84 percent for the whites and 83 p€fr-cent for the black/others (Hindelang, 1976:286).
.-. -The following patteri1'Sappeariicnorresident'ial burglaries: 39 percent occurred between 6 a.m. and 6 p.m., 46 percent between 6 p.m. and 6 a.m., and in 15 percent of the cases time of occurrence could not be determined (Hindelang, 1976:294). Again, losses were generally moderate and tended to be higher in black/other households than in white households (Hinde lang, 1976:300). Damage to property during burglaries was also more likely to occur in black/other households (94 percent) than in white households (74 percent) (Hindelang, 1976:301). Some recovery of property was realized in only 24 percent of the burglaries, a figure that tended to increase with the value of the property stolen (Hindelang, 1976:305).
Data for nonresidential burglaries also revealed some interesting trends. Like residential burglaries, three-quarters of all nonresidential burglaries were completed (Hindelang, 1976:325). Four out of five business burglaries occurred during the night, sometime between 6 p.m. and 6 a.m. (Hindelang, 1976:333). For those businesses located within the eight cities, 59 percent report-
ed that they had some type of security measure, yet, surprisingly, those businesses with security measures were more likely to be victimized.
For total businesses, 31 percent of all businesses with security measures, but only 20 percent of those without security meas(lres were victims of burglary and robbery. This pattern generally maintains when the data are further subdivided according to type of bllsiness (Hindelang, 1976:344).
A majority of business burglaries (53 percent) restillted in loss of merchandise or other ma terial (Hin~lelang, 1976:355). Business losses from burglary were fOlimd to be moderate; only lout of 10 business burglaries lfesulted in losses of $1,000 or more. The aggregate median loss was generally in the $50 to $249 range (Hind(llang, 1976:359). As the value of the loss increased, so did the proportion of businesses recovering some of their losses through insurance (Hindelang, 1976:363). For the 1110St part, the findings of victimization studies such as this one differ very little from findings of burglary studies fOCUSing on offenses reported to the police.
Summary
The following is a synthesis of the major findings regarding the characteristics of burglary. Only those correlates most consistently noted in the previous studies are listed, because many findings are limited by the respective methodology of each particular study. Unfortunately, the results of many studies are not completely consistent. For example, neitheJ;' Scarr (1973) nor Conklin and Bittner (1973) found a relationship between different seasons of the year and the occurrence of burglary. Chimbos (1973), however, reporte,d that residential burglaries were more likely to occur during the summer months. These divergent findings, however, may partially be accounted for by the nature of each study. Scarr reported on aggregate burglary offenses in relation to seilsonal fluctuation for three separate jurisdictions, while Conklin and Bittner dichotomizeo burglary incidents into suburban residential, and nonresidential burglaries.
Chimbos' study was undertaken in northeastern Canada, an area with a population composition and climate quite different from that found in many parts of the
. United States. Iil addition, Canada's statutes regarding breaking and entering offenses are not strictly comparable with those of the United States. Nonethele&s, the degree to which similar findings are reported across divergent studies is rather surprising. These m~jor con-
17
()

sistent findings are highlighted as a point of departure for the present investigation:
(1) The clearance rate for burglary is generally quite low and seems to be related to reporting time. The longer the lapse between the occurrence of a burglary and its reporting to the police, the less likely the crime will be cleared by arrest.
(2) Residential burglaries occur more frequently than nonresidential burglaries. However, when burglary rates are computed with respect to potential targets at risk (the number of potential or nonresidential targets), nonresidential structures are found to have a greater probability of being burglarized.
(3) Most burglary losses are of moderate value and include goods that are easily converted into cash.
(4) Residential burglaries are mostly daytime phenomena, but nonresidential burglaries occur most often during the hours of darkness. Similarly, residential burglaries are more likely to occur during the week, but nonresidential burglaries usualIy occur on weekends.
(5) Most burglaries involve some degree of forcible entry, usually breaking glass, forcing a lock, or a similar means. A substantial proportion of entries are effected through available windows and doors, which are frequently left unsecured.
(6) Most reported and unreported burglaries are completed. Attempted burglaries generally account for only about a fifth of all burglaries reported to the police.
(7) In those structures employing some type of alarm system, a surprisingly high percentage of alarms failed to function or were defeated. Establishments that used an alarm system were more likely to be burglarized than those that did not.
Data Source To a large extent, the lack of adequate research on
burglary can be attributed to the inadequacy of available data sources. Police agencies, like other criminal justice organiiJtions, do not generally record and report statistics in a form amenable to social research. Burglary data, for example, are often incomplete and are not compiled 1n a manner that easily links the offender with offense information. It is not surprising that earlier investigations of burglary centered attention on offense characteristics and virtually ignored the criminal offender, because such data were difficult, if not impossible, to obtain. Although new and improved methods of data collecting and reporting are currently evolving,3 much of today's criminal justice statistics cannot be applied to current research issues. Occasionally, however, specific
18
projects are undertaken that provide a raw data source not generally available. The data used herein are a case in point.
The data base for the present study was derived from a crime-specific burglary program, sponsored by the California Council on Criminal Justice, which extended from April 1972 to May 1973.4 During this 1-year period, data were compiled on (1) burglaries and (2) burglaries in which an offender was matched to a specific offense. The overall aim of the project was to assess the impact of various measures employed to reduce the incidence of burglary in the target areas. Six law enforcement agencies were involved in the study: two from northern California (the San Francisco anc,l Oakland Police Departments) and four from southel1) California (the Los Angeles and San Diego Police Departments plus the Los Angeles and Orange County Sheriffs' Offices). A specific geographic section consisting of various census tracts from within each jurisdiction was selected by the respective law enforcement agencies for inclusion in the study. AlthOUgll the criteria used for selection were left up to each individual agency, it would seem from Table 1 that each target section is a high crime area (the increasing incidence of burglary offenses buttresses this contention). Characteristics of the popUlation and their distribution were found to vary across target areas (Table 1). Similarly, burglary prevention measures differed by agency but generally included specific enforcement plans (e.g., team policing or saturation' patrols) and
3 For a review and discussion of some of the more interesting and innovative data collection techniques, see Michael J. Hindelang and Carl E. Pope, "Sources of Research Data in Criminal Justice" in Emilio Viano (ed.), Role of Research in diminal Justice, 1975)_
4This study employs a legal definition of burglary quite similar to that provided in the Uniform Crime Reports. Under California law, burglary is defined as follows:
Every person who enters any house, room, apartment, tenement, shop, warehouse, store, mill, barn, stable, outhouse, or other building, tent, vessel, railroad car, trailer, coach as defined by the Vehicle Code, vehicle as defined by said code when the doors of such vehicle are locked, aircraft as defined by the Harbors and Navigation Code, mine or any underground portion thereof, with intent to commit grand or petit larceny, or any felony. is guilty of burglary (California Penal Code, 1960:32). In conjunction with the use of a legal definition of burglary,
it should also be emphasized that data used herein reflect burglary offenses coming to the attention of police agencies and arrests resulting from these offenses_ This, of course, excludes a wide spectrum of criminal activity that, for one reason or another, never comes to the attention of police authorities. Both victim surveys and self-report studies have generally shown that substantially more crime exists than that uncovered by official police ~esources.

.. ,-
community involvement (e.g., elements of public awareness).
-- Overa'll, the California data contain much valuable information about both burglary offenses and offenders'
. that has not been available heretofore. Information on offenders includes both demographic (age, race, sex) and criminal history (prior record, criminal status) data. Data on the distance from the offense occurrence to the offender's residence is also provided, thus permitting an analysis of spatial mobility patterns. Offense information includes traditional factors su,ch as means of entry, amount st01en, tinie of occurrence, and type of premise entered. Attempted burglaries are distinguished from completed ones. Deterrent characteristics are also reported and include the availability of artificiailighting, presence of a dog, use of alarm systems, and the like.
Before a tliscussion of the specific variables included in the data set and their measurement, a few comments about the overall reliability of the data are in order. When utilizing official data sources, one is often plagued by doubts about their accuracy. A recent paper on juvenile arrests by Malcolm Klein et aJ. (1974) highlights this problem. Klein and his associates note, for example, that the criteria for recording juvenile arrests in California vary from one police agency to another throughout the State. Some record arrests that are based on initial police contact in the street, yet others use stationhouse detention. Furthermore, disparate definitions of arrest may be employed by different juvenile officers within the same department. Some departments even maintain separate juvenile arrest records: one for internal usage, one for the Uniform Crime Reports, and one for compilation by the California Bureau of Criminal Statistics. As Klein notes It ••• the accuracy of the state's juvenile arrest statistics, since they mirror county and city reports, should be questioned. At a minimum, they lack
, uniformitYi at a maximum, they lack meaning" (Klein et a1.,1974:13). .
Questions about the reliability 'of data are frequently overlooked at the initial collection stage. Hence, whereas thOse findings reported may be reliable, they may not accurately reflect the phenomena that the researcher o(iginally intended to study. Although there is no direct way of assessing the reliability of the California burglary data, some general observations can be made. The data used herein were part of an intensive burglary data collection program, so more faith can be placed in their accuracy than might otherwise be the case. Much effort went into the provision of special cheCKlist forms for recording those characteristics of burglary incidents that are not usually compiled and into monitoring
proper use of the checklists. Furthermore; the California Bureau of Criminal Statistics (BCS), which served as a central clearinghouse for th~se data, is highly rega)'ded for ensuring the accuracy of data Submitted to them. When information is missing or when inconsistencies occur, it is not unusual for BCS to investigate the matter by initiating a field reliability check. The crime-sp~cific burglary program was closely· monitored by BCS, which assigned a senior researcher the responsibility for supervising compilation of the data. Although random errors are bound to OCeUI', these data are thQught to be quitg reliable and to reflect accurately the characteristics of known burglaries that occurred during the project period.
Level of ~nalysis Problems of aggregation occurred quite early in the
analysis of the California burglary data. The basic question was whether the data should be grouped together for analysis or broken down according to some ctiterion such as target area or census tract. The solution, based on both empirical and theoretical grounds,s was not to conduct separate analysis based on distinct criteria, but rather to include possible breakdowns (for example, variations across census tracts) as variables in the analysis. Separate analysis showed that although each of the target areas exhibited some differences, those located in southern California were quite' similar, as were those located in northern California. That is, the four southern California jurisdictions exhibited characteristics that were similar to each other's but distinct from the two agencies located in northern California. For example, a quick perusal· bf the areal characteristics for each jurisdiction contained in Table 1 shows that the northern California 0 agencies generally selected target sites that were, on the average, more socially disadvantaged than those located in southern California. Henq,e, for many of the analytic techniques used, the northern/southern California designation was included as a variable in the analysis. .
Also included in the California burglary data was information pertaining to the census tract in which the offense occurred. Although an investigation of the ecolo-
. 5 Separate analysis for the six agencies revealed patterns that were. on the average, quite similar to our overall results when the data were combined. FUrthermore, in most instances. any attempt to divide the data would hinder much of the analYsis because of case attenuatto!'i'(;l1d would Increase the complexity.';' of the presentation with few resulting advantages.
19

TABLE 1 Sample characteristics of target areasa
Target Area
Population:
Makeup:
Burglary crime rate:
Measures to reduce burglary:
Los Angeles County Sheriff's
Department
Bellflower
51,797
Homeowners, commuters, retail trade centers and commercial establishments
Up 40% in last 7 years.
Burglary profile. Expert advice by sheriff's personnel to citizens on preventive methods. Publicity campaign. Burglary prevention seminars for deputies. More than 20,000 inspections of residential and commercial buildings identifying security deficiencies. "Neighborhood car" program (same deputiessame beat for 1 year).
gica16 correlates of burglary is beyond the scope of the present study, area data about census characteristics can· not be completely ignored. For each of the 120 census tracts included in the study, various demographic characteristics reported in the 1970 census were compiled. Of these characteristics, four were selected as general indicators of socioecon'omic status. These included median
6 Ecological analysis generally focuses on the characteristics of the geographic area in relation to a certain phenomenon, such as crime.
20
Los Angeles Police
Department
Palms-Mar Vista
26,256
MostlY residential
In period 1969-1971 burglaries increased 14.6% a year.
Team policing. 1 citizen per block acts as liaison with police on daily basis. Discussions with community on police-community problems with burglary. Security inspections of residences and businesses.
70,000
Oakland PGlice
Department
Patrol District 5 (12 square miles)
76% black, 10% Mexican American and 14% white. Many deteriorating residential and commercial buildings. Large percentage highschool drop-outs and family incomes below poverty level. In 1970 there were 3,429 burglaries. During 5-year period there was an ·increase of 65% in burglaries of . commercial establishments and an increase of 493% in burglaries of homes.
Intensifying pubi!ic education and citizen involvement. Stressing burglary pravention and control. Intensive training of selected police personnel on burglary prevention and control. Have commercial security inspection. Initiating residential security inspection (training 10 local residents to inspect under department supervision). Saturation patrols, stakeouts, and surveillance. Burglary Prevention and Control Coordination Groupcommun ity-police effort to coordinate anti-burglary, project.
family lllcome, median years of education completed, percent of homes that were owner-occupied, and percent population that was black. Also included was census information pertaining to the percentage of females in the labor force. 7 The above census information was then
? Percentage of females in the labor force may provide a relative indicator of the opportunities that exist for the commission of burglary. It may be that the higher the percentage of females in the labor force, the more likely it Is that dwellings would be unoccupied during the daytime, thus increasing the proportion of vulnerable targets.

Otange County Sheriff's
Department
Southern Orapge County
72,000
Unincorporated, upper middle·class community in large housing tracts. Median per capita income above national average (1970 new home cost $33,800). In 1970 there were 2,200 burglaries compared to 1,800 in surrounding similar areas.
Special anti·burglary night police patrols. Inspections of residential and commercial buildings. Publicity campaign to increase public knowledge. Local insurance companies, architects and builders groups contacted to assist in recommending security standards and devices through architectural design,and improved construction practices.
San Diego Police
Department
Northeastern San Diego (25 square
miles)
129,546
Predominantly white middle class. 44,545 family residential units. 794 bUsinesses.
Burglaries increased by 34 percent in past
I)
year. 794 resideMial burglaries, 408 commercial burglaries (only 23% rise in rest of city).
(1) Task FOrce Operation: Surveillance of known burglars and stolen property fences. Saturation patrol. Burglary profile. (2) Public awareness: Education about burglary and its prevention and control (use' of media, seminars, meetings, securitY inspections). Citywide property identification pr,ogram. Radio alert program.
90,000
TABLE 1 concluded
San Francisllo Police
Department
Mission District
Broad cultural, ethnic and economic spectrum.
Highest in city in past 1 a months. 60 to 70% burglaries committed during daytime.
Utilizing specially trained officers in undercover and investigative work. Selective saturation of most burglarized 'areas in district. Stakeouts of known burglary suspects and known fences to increase likelihood of catching them in the act. Development of community participation and awareneSs (media distribution of litel'ature, speeches in Spanish and English).
8'These characteristics were reported by the California Council on Criminal Justice in an article published in Police Chief lentitled, "Crime Specific-An Answer" by J.W. Rockwell.
keypunched and added to the original data set. As might be expected, wlthirl each target area certain census tracts were more disadvantaged than others in terms of socioeconomic status. Median family income, for example, ranged from a low of $4,716 to a high of $23,762, and median years of edtlcatf{jll completed range from 9.6 to 16.2. It is not unreasonable to assume that burglary patterns and characteristics are likely to differ between areas of more favorable and less favorable socioeconolllic status. Reppetto (1974), for example, found that whit'
\
burglary offenders were disinclined to work in pre. dominantly black areas; however. the converse did not follow. Black offenders, In fact, favored predominantly wbite areas in which lucrative burglary opportunities were thought more likely to exist.
Rather than aggregate the data according to census characteristics (i.e., low, medium, and high socio· economic status areas), each burglary incident was placed in one of four quartiles based upon the five census indicators. With the exception of the percent of
21
the population that was black, each of five census variables was scaled from lowest to highest. Thus, for median family Income, quartile one contained those Incidents loca ted in census tracts with the lowest median family Income, and quartile four contained those incidents located In census tracts with the highest median family Income. For the percent of the population that was black the order was reversed-quartile one contained those incidents located in tracts with the highest percent of black population, and quartile four contained those incidents located in tracts with the low~st.
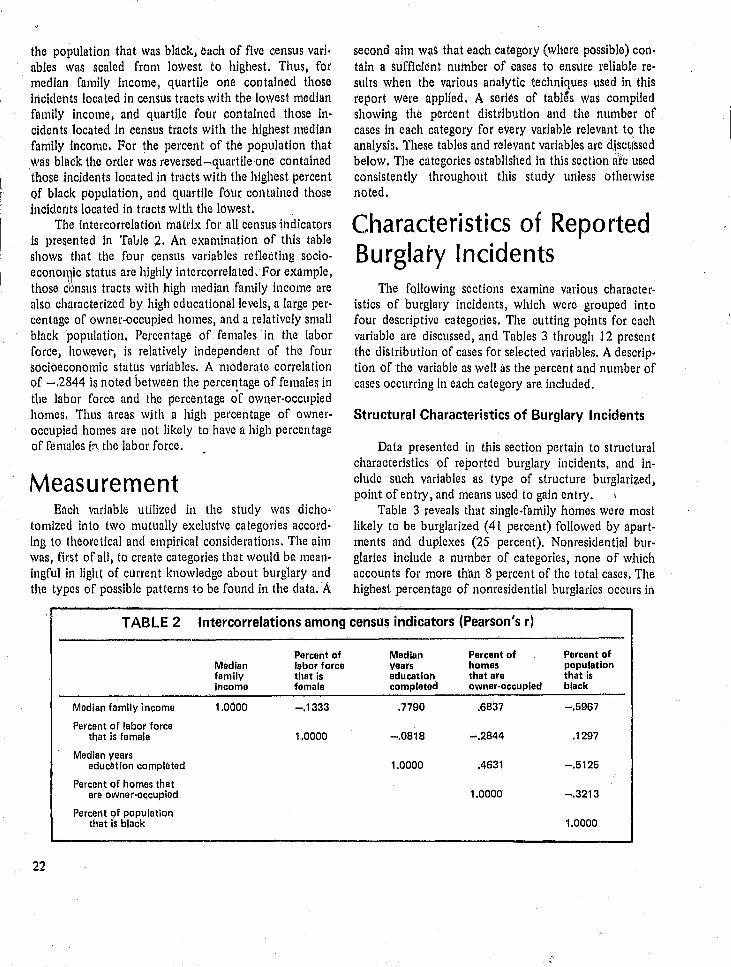
The intercorrelation matrix fol' all census indicators is presented in Table 2. An examination of this table shows that the four censlIs variables reflecting socioecono1\1ic status are highly intercorrelated. For example, those dnsus tracts with high median family income are also characterized by high educational levels, a large percentage of owner-occupied homes, and a relatively small black population. Percentage of females in the labor force, however, is relatively independp.nt of the four socioeconomic status variables. A moderate correlation of -.2844 is noted between the percentage of females in the labor force and the percentage of owner-occupied homes. Thus areas with a high percentage of owneroccupied homes are not likely to have a high percentage of females l:\ the labor force.
Measurement Each variable utilized in the study was dicho
tomized into two mutually exclusive categories according to theoretical and empirical considerations. The aim was, first of all, to create categories that would be meaningful in light of current knowledge about burglary and the types of possible patterns to be found in the data. A
second aim was that each category (where possible) contain a sufficient number of cases to ensure rellable results when the various analytic techniques used in this report were applied. A series of tabl~s was compiled showing the percent distribution and the number of cases in each category for every variable relevant to the analysis. These tables and relevant variables are dJsc~rssed below. The categories established in this section lite used consistently throughout this study unless otherwise noted.
Characteristics of Reported Burglary Incidents
The fQllowing sections examine various characteristics of burglary incidents, which were grouped into four descriptive categories. The cutting points for each variable are discussed, and Tables 3 through 12 present the distribution of cases for selected v,ariables. A descrip· tion of the variable as well as the percent and number of cases occurring in each category are included.
Structural Characteristics Qf Burglary Incidents
Data presented in this section pertain to structural characteristics of reported burglary incidents, and include such variables as type of structure burglarized, point of entry, and means used to gain entry.
Table 3 reveals that single. family homes were most likely to be burglarjzed (41 percent) followed by apartments and duplexes (25 percent). Nonresidential burglaries include a number of categories, none of which accounts for more than 8 percent of the total cases. The highest percentage of nonresidential burglaries occurs in
TABLE 2 Intercorrelations among census indicators (Pearson's r)
Percent of Median Percent of Percent of Median lobar force years homes population family that is education that are that is income female completed owner-occupied black
Modlan family income 1.0000 -.1333 .7790 .6837 -.5967
Percent of labor force that is female 1.0000 -.0818 -.2844 .1297
Median years education completed 1.0000 .4631 -.5125
Percent of homes that are owner-occupied 1.0000 -.3213
Percent of population that is black 1.0000
22

TABLE 3 Type of structure burglarized
(Percent)
Tvpe of structuro '- Case distribution
Residential: Sln9Ie-t',~n1ily structure ~1.3 (3,357)
Apartments/duplexes :25.0 (2,032)
All other residence and associated buildihgs 3.6 (291)
Nonresidential: Commercial lodging 0.9 (75)
Retail business-services 7.7 (623)
Retail business-commodities 6,4 (519)
Automobile dealers 0.5 (40)
Private offices 2.1 (167)
UnoccupieJ hotellmotel fooms 0.2 (18)
Medical offices 1.1 (89)
Recreational facilities 1,0 (83)
Warehouse and storage 1.7 (136)
Industrial, manufacturing, construction companies 3.6 (294)
Financial Institutions 0,1 (8)
Government buildings 0.3 (23)
Schools 3.0 (245)
Churches 0.9 (71) ,
All other 0.7 (58)
Totala 100.1 (8,135)
--aTotal does not add to 100.0 percent because of rounding.
the two categories of retail business, which include both businesses that deal in services and those that deal in commodities. All nonresidential burglaries amount to 30 percent, or approximately one-third of all reported burglaries. These data were then dichotomized into two mutually exclusive categories consisting of residential and nonreside,ntial targets. Residential targets constituted 70 percent (5,686) of the cases studied, nonresidential targets accounting for the remaining 30 percent (2,449) of the cases.
Table 4, extent of property loss, shows that the most frequent burghlry losses fell into the $200 to $499 range. In 65 percent of all reported burglaries, monetary loss, was valued at less than $500. Losses in excess of
$5,000 were reported in less than 1 percent of aU burglaries. In 1,424 cases, monetary loss was not determined, and these cases were eliminated when the remaining cases were dichotomized into no loss (e.g.! offender apprehet1ded at the scene) and loss of some type. Eighty· two percent (5,534) of those cases for which information was provided involved a financial loss, and 18 percent (1,179) involved no financial loss. Similar findings have been reported elsewhere: in 24 percent of the burglary incidents analyzed by Chimbos, the apprehended offender did not take anything (1971 :319); approximately 18 percent of those burglary incidents examined in San Jose involved no reported financial loss (SCCJPP, 1972:67).
Doors and windows were the most frequent points of entry, accoun ting for 94 percent of all megal trespasses. The residual category of "other" contained only 6 percent of the cases, too few to warrant separate analysis. Hence, point of entry was dichotomized into either door or window. Doors were the more favored means, accounting for 63 percent (4,792) of all entries. Windows were used in only 37 percent (2,839) of the cases. Data reported by Scarr produced similar findings, showing a substantial proportion of all entries as occur-
TABLE 4 Financial loss resulting from burglary
(Percent)
Extent of loss Case distribution .. Unl<nown-not reported 17,5 (1,424)
No los~ 14.4 (1,179)
Loss: $9 or less 2.7 (222)
$10 to $49 8.6 (696)
$50 to $99 8.0 (651)
$100 to $199 11.8 (958)
$200 to $499 19.2 (1.666)
$500 to $999 10.2 (828)
$1,000 to $4,999 7.2 (583)
$5.000 to $9,999 0.2 (20)
$10,000 or more 0.1 (10)
Totala 99.9 (8,137)
STatal does not add to 100.0 percent because of rounding.
23

ring through elther doors or windows (1973:135). Furthermore, doors alone accounted for more than half of all illegal entries in Scarr's study (1973: 135).
Nonforcible entries included incidents in which doors or windows were left unlocked or screens were removed, or in which passkeys, picks, or other similar devices were used. Excluded were entries occurring by means of prying, jimmying, cutting, and the like, which were grouped under forcible entries. In 5 percent of the cases (427), no entry was made; these cases were excluded.
Forcible entries were about twice as likely to occur as non forcible entries. (Force was used in 62 percent or 4,825 of the cases and was absent in 38 percent or 3,012 of the cases.) Scarr also found the percentage of forcible entries to be quite high, accounting for more than half of all entries (1973:138). Approximately 30 percent of all reported burglaries in San Jose occurring over a 4-month period did not involve the use of force to gain entry (SCCJPP, 1972:80). Although the percentage of forcible entries reported by Clarke was also high, more l1onforcible entries occurred in residential burglaries (28 percent) than in nonresidential burglaries (17 percent) (Clarke, 1972:12),
In 63 percent (4,859) of the cases, a tool of some type (e.g., screwdriver, prybar, drill, knife) was used to effect entry. In the remaining 2,844 cases, entry was gained by the use of bodily force. The percent distributions for both means of entry and for type of tool are quite similar) because they reflect a similar modus operandi. Generally, if a tool is used to gain en try, then evidence of forcible entry would most likely be found along with an imcreased likelihood of property damage occurring. Forty percent of the cases involved no damage, but 60 percent involved some damage to property.
'The type of property stolen during burglaries generally includes a wide range of commodities, as Table 5 indicates. The theft of drugs and firearms was quite rare, accounting for less than 5 percent of the total merchandise stolen. By far the largest proportion of stolen
• property (48 percent) included items of the hard sale variety, such as televisions and stereo equipment, followed by thqft of currency (I3 percent). Type of property taken was dichotomized into two categories: money and hard snlabh~ items, and a residual category of all other. The fbrmer accounted for 76 percent (4,934) of the cases, the latter for 24 percent (1,558) of the cases.
Findings reported in other burglary studies are generally similar to those noted here. That is, items such as home entertainment equipment and currency are
24
TABLE 5 Type of property taken during burglary
[Percent] ,
Type of property Case distribution ,
Unknown 20.2 (1,645)
Money 13.1 (1.062)
Negotiable items (e.g., credit cards) 0.5 (43)
Jewelry!furs 6.3 (509)
Soft salable items (423) (e.g., clothing, furniture) 5.2
Hard salable items (3,872) (e.g., televisions, stereos) 47.6
Drugs 0.4 (29)
Firearms 2.7 (220)
Items from inside safe 0.3 (24)
All other 3.8 (310)
Totala 100.1 (8,137)
"Total does not add to 100.0 percent because of rounding.
those most frequently reported as stolen (Scarr, 1973; SCCJPP, 1972; Clarke, 1972; Reppetto) 1974). For suburban burglaries, however, Conklin and Bittner found that jewelry, furs, and silver accounted for 52 percent of all reported losses, followed by theft of currency and home entertainment equipment (I973:219).
Temporal Characteristics of Burglary Incidents
Temporal characteristics include the day of the week, time of the day, and season of the year during which the reported burglaries occurred. The distribution of cases in Table 6 shows the period from 5 p.m. to midnight as the most likely time for burglaries to occur. Unfortunately, some of the categories are not mutually exclusive, and others cover too broad a range. For example, although in 15 percent of the cases the time during which the burglary occurred was reported as unknown, in 10 percent of the cases the burglary occurred some time during a 24-hour period-a relatively useless bit of information. Furthermore, some categories (midnight to noon) include others (midnight to 7 a.m.). In light of these problems, time of day was dichotomized into a range within which most of the original categories could be included. Thus, the period from 7 a.m. to 5 p.m. (daytime) also includesfrom 12 noon to 5 p.m. and from 7 a.m. to 12 noon, accounting for 44 percent

TABLE 6 Time of day during which burglary occurred
[Percentl
Time occurred Case distribution
Unknown 15.2 (1,237)
1 a.m. to 12 nO!)n 5.B (471)
12 noon to 5 p.m. 13.4 (1,OB9)
5 p.m. to midnight 16.B (1,370)
Midnight to 7 a.m. B.O (653)
5 p.m. to 7 a.m. 13.5 (1,102)
7 a.m. to 5 p.m. 11.6 (946)
Midnight to noon 1.0 (7B) •
5 p.m. to 12 noon 4.3 (34B)
24-hour period lOA (B43)
Total 100.0 (B,137)
(2,506) of the cases. Conversely, the period from 5 p.m. to 7 a.m. (nighttime) includes from 5 p.m. to rrtidnight and from midnight to 7 a.m. and contains 56· percent (3,125) of the cases. In using this criterion, however, 31 percent of the odginnl cases had to be excluded from the analysis because they could not be classified in this dichotomy.
On the whole, the days of tr 'leek during which the bUrglaries occurred produced no patterns (Table 7). Data were collapsed to include those burglaries occurring on weekdays (Monday through Friday) and those occurring on weekends (Saturday and Sunday). Reported burglaries were more likely to occur on weekdays (67 pel'cent or 5,030) than on weekends (33 percent or 2,528).
The month during which/the burglary was reported to the police was trichotomized into the three seasons of winter, spring-autumn, and summer. Winter included the months of November, December, January, and February. Spring:autumn included the months of Mnrch, April, September, and October. Summer included the months of May, June, July, and AugOst. The data revealed little seasonal variation in the incidence of reported burglaries: 2,623 cases (32 percent) were reported during winter, 2,701 Cases (33 percent) in spring-autumn l
and 2,812 (35 percent) in summer.s This finding is
81nformation was also available about the month during which the burglary occllrred. Generally, these variables proved to be quite similar, in that burglaries were reported to the police on the same dates they were said to have occurred. The distribution
,
TABLE 7 Day of the week during whieh burglary occurred
[Percent]
Day Case distribution
Unknown 7.1 (579)
Sunday 7.9 (640)
Monday 9.7 (79;3)
Tuesday B.7 (710)
Wednesday 9.0 (736)
Thursday 9.2 (746)
Friday 9.9 (B08)
Saturday 7.7 (625)
Weekday 15.2 (1,23B)
Weekend 15.5 (1,263)
Totala 99.9 (8,137)
aTotal does not add to 100.0 ercent because of roundin .
similar to that of Scarr who, using aggregate burglary data, discovered no seasonal fluctuation in the incidence of burglary (1973:141).
Offense Characteristics of Burglary Incidents Other characteristics of reported burglary incidents
refer to sllch variables as the manner in which the offense was cleared and whether the burglary was completed or only attempted. As Table 8 shows, over fourfifths of all reported burglaries remained unsolved at the end of the project period. Of those cases solved, . the highest proportion was cleared by the arrest of a suspect. Relatively few cases were unfounded, that is, the police determined that a bllrglary had not actually occurred. Data were broken down into those burglary cases that were cleared (18 percent or 1,465 cases) by any means and those that still remained unsolved (82 percent or
, 6,669 cases). A substantial proportion of all reported burglaries were completed. In this data set completed burglaries occurred 95 percent (7,710) Qf the time, com· pared with 5 percent (427) for attempted burglaries.
Means of detectfon'refers to' ihe'lllann~r -ill which the burglary was discovered. Table 9 reveals that a substantial proportion of all reported burglaries (57.2 perceM) were dtscovered upon the return of the victim after ___ ---.1.'
of cases for the season during Which the burglary occurred was similar to that for the season during which tho ourglary was actually reported.
25

TABLE 8 Method by which burglaries were clear~d
[Percent]
Method of clearance Case distribution
Not specified (a) (3)
Not cleared-still open 82.0 (6,669)
Cleared eXceptionally 1.1 (89)
Arrest at suspect 14.9 (1,211 )
Arrest in other jurisdiction 0.3 (25)
Death of suspect (a) (1 )
Case unfounded 1.5 (124)
Classification changed 0.2 (14)
Aif other (a) (1 )
Total 100.0 (8,137)
aLess than one-tenth percent.
TABLE 9 Method by which burglaries were detected
[Percent]
Method of detection Case distributi!;m
Unknown 0.1 (10)
Return of victim 57.2 (4,656)
Other than victim 6.1 (498) , Next working day (commercial) 17.5 (1,420)
Citizen complaint (e,g., passing citizen) 4.7 (384)
Victim returns-burglary in progress 1.5 (119)
Victim present during burglary '. 7.4 (600) \
Passing patrolman 2.1 (168)
Burglary alarm 3.3 (266)
All other 0.2 (16)
Totala 100.1 (8,137)
aTotal does not add to 100.0 percent because of rounding.
26
a household burglary had been completed. The next most frequent category was the next working day for commercial burglaries (17.5 percent). Relatively few burglaries, however, were originally uncovered by the police. Findings here closely parallel those in San Jose, where burglaries were most likely to be discovered by the owner or resident, and next by witnesses or passing citizens. In only 3 percent of the cases did the police discover the burglary (SCCJPP, 1972:97). Data were divided into two categories: (1) return of the victim (66 percent or 5,375 cases), and (2) other (34 percent or 2,752 cases). The former category includes those burglaries in which the victim returns either while the crime is in progress or after completion, but excludes those discovered the next working day (commercial only).
Table 10 presents data pertaining to the target area in which the offense was conmlitted. It is apparent from Table 10 that Oakland accounted for the highest percentage of burglary incidents (28.1 percent), San Francisco the second highest (24.1 percent). The fewest burglary incidents occurred in Los Angeles (5.4 percent). Target area data were dichotomized in to northern and southern California. Northern California includes both the Oakland ,and San Francisco Police Departments, and southern California includes the Los Angeles and San Diego Police Departments, plus the Los Angeles and Orange County Sheriffs' Gffices. The northe.rn/southern California split was utilized, because tar~et characteristics were found to be quite similar., ;ihin each area and, in addition, such a dichotomy followed naturally within State boundaries. Fifty.two percent (4,252) of all reported burglaries occurred in northern California and 48 percent (3,885) in southern California.
TABLE 10 Target area in which burglaries occurred
[Percent]
Target area
San Francisco Police Department
Oakland Police DepartmC.nt
Los Angeles Police Department
Los Angeles Sheriff's Office
Orange County Sheriff's Office
San Diego Police Department - -
Case distribution
24.1 (1,965)
28.1 (2,287)
5.4 (441)
12.1 (986)
14.6 (1,191 )
15.6 (1,267)
99.9 (8,137)
aTotal does not add. to 100.0 percent because of rounding.

Table 11 presents data reflecting the distribution of reported burglary incidents accQrding to the five census indicator .. variables. Most reported burglarv ___ incidents
'-'::::--:' '!'.; .'
occurred. in areas that were relatively socially and econo-mically disadvantaged. Approximately two-fifths of all incidents, for example, occurred in areas characterized as "low" in median family income and median educational level. Similarly, two-fifths of all reported burglaries were committed in areas wl).ere a high percentage of the population was black. Burglaries were also more likely to occur in areas with a lower percentage of owner-occupied homes. It is interesting that reported burglaries were less likely to occur in areas with a low percentage of females in the labor force-regions Ulat may not provide the most optimal opportunities for burglars h.ecause residences are probably more likely to be occupied during the day.
Deterrent Characteristics of Burglary Incidents
As noted above, the primary'ntent of the California project was the reduction of burglary by the application of various abatement programs. Therefore, interest focused on, deterrent aspects of burglary targets~ such as ligllting, alarm systems, and security checks.
Most of the data elements included here and the categories are self-explanatory, as seen in Table 12. Most of those premises burglarized had street lights within 100 feet (65 percent), but only 31 percent had lighting at the point where entry Was made. Furthermore, most entry points were not visible (70 percent), because they W()re concealed by fences, shrubbery,&!nd the like. Not surprisingly, few premises were protected by alarms. Of those that had alarms, the system failed to function in D
half ilie cases. Again, few premises (12 percent) Were inspected for security before the burglary, and few premises (9 percent) had a dog present. In only 9 percent of the cases were identifying serial numbers etched on property within the burglarized premise.
Method of Ana,lysis The univariate distriDutions for burglary incident
characteristics have been examined, now a more detailed analysis will be undertaken of the correlates of burgfary as they occur across time and space, of the methods or techniques used in the commission of burglary, of the nature of those deterren t features designed to preven t or impede the occurrence of burglary, and similar c~ar-" acteristics. Such data provide a basis for comparison
TABLE 11 Distribution of burglary incidents by census characteristics
[Percent]
Census Case distribution
\' characteristic Low Low·medium Medium·high High Totala
Median family 39.7 27.8 r-71 .3 11.2 100,0
incollle (3,198) (2,241) (1";713) II (898) (8,050),
Percent of labor force 13.2 35.4 26.6 24.9 100.0 that is female ,(1,064) (2,847) (2,131) (2,007) (8,049)
Median. eClucationai 40.5 31.8 18.8 8.8 99.9 level (3,145) (2,470) (1,461) (682) (7,758)
Percent of population 13.3 20.5 22.7 43.4 99:9 that Is black (1.074) (1,654) (1,829) (3,493) (8,050)
0
Percent of homes, that are \ 34.6 30.5 20.5 14.4 100.0 owner-occupied (2,711) (2,392) (1,606) (1.133) (7,842)
-:' aTotels may not add to 100.0 percent because of rounding.
27" '] ! ,
(J

TABLE 12 Datel'rent characteristics of burglary incidents
[Percentl
Characteristics
Extent of lighting: Street lights within 100 feet No street lights with in 100 feet
Lighting with respect to the point of entry: Lighted Not lighted
VisibilitY of point of entry: Visible Not visible
Extent of alarm systems: Premises without alarms Premises with alarms
FUnctioning of alarm systems: Alarm operated Alarm did not operate
Security inspection conducted: SecuritY inspection No securitY inspection
Dog on premises: Dog present Dog not present
Serial numbers etched on propertY: Identifying serial numbers No identifying serial numbers
Case distributiona
65 (5,214) 35 (2,776)
31 (2,435) 69 (5,360)
30 (2,405) 70 (5,472)
93 (7,578) 7 (559)
50 (274) 50 (274)
1.2 (920) 88 (7,104)
9 (435) 91 (4,457)
9 (431) 91 (4,392)
aTotal number of cases for each variable may vary because of missing cases.
with the findings of other studies and also lay a foundation for exploration of the interrelat.ionship among offense and offender characteristics, which will be undertaken in a subsequent report. In order that findings may be easily compared with previous resemch, type of structure burglarized is used as a variable for much of the analysis reported herein. A series 'of tables depict the relationship between selected offense variables (e.g., time of day, amount of loss) and both residential and nonresidential target sites. This and subsequent analysis is conducted in accordance with those categories established above except in those instances in which more detailed information WaS desired.
28
Two methods of analysis were selected to examine the in terrelationship of burglary offense variables. These were tabular analysis and predictive attribute analysis (PAA). Tabular analysis was employed because of the ease with which tables can be presented and interpreted. ,A particular problem in presenting tabular results, howt:.v;er, is that of evaluating the magnitude of observed percent differences. It is often difficult to determine how much weight should be given to findings showing differences among categories of 5, 10, or 15 percent points. Even in those instances in which tests of significance are applied to percent differences, the actual relationships may be quite trivial although the resultant

" I
statistic is "significant" at a specified probability leve1.9
Flirthermore, a fundamental requirement of virtually all statistical tests is that of independent random sampling, a condition not met in this study, because a total population was used (Blalock, 1972). Additionally, signifi· cance tests are directly influenced by sample size: as the absolute number of cases increases, so ,does the probabil· ity of finding a significant relationship (Hagan, 1974). Because the number of reported burglary incidents is rather large (8,137), one would expect statistical sig· nificance to occur even when only a slight relationship actually exists. Because of such problems, tests of significance were not employed in this analysis, thus necessitating some alternative method for specifying substantial relationships.
The solution decided upon was to use percents and frequency counts specifying a 10 percent point difference as a criterion for evaluating the magnitude of observed relationships. Thus, if a percent difference is equal to or greater than 10 p~rcent, then the relationships will be considered substalHial. If the difference is less than 10 percent, the relationship is considered not substantial.lo In certain instances, however, cases in
9 Hagan (1974). in a recent review of sentencing research, notes that the meaning of substantive significance is often confused with that of statistical significance. As he states:
A relationsh ip is considered statistically sign ificant when we have established, subject to an accepted risk of error, that there is a relationsh ip between two vari· abies. Separate from the issue of whether or not a relationship exists is the question of how strong the relationship is. The strength of a relationship is indicated by a measure of association. Tests of significance are inappropriate for this purpose because they are markedly influenced by the size of the sample involved. For example, when the sample size is large, as is usually the case in studies of sentencing. it is generally quite easy to establish statistical significance for even a very small relationship. Within the context of large samples, then, one says very little by indicating that a relationship is "statistically significant" (Hagan, 1974:361).
10 Although the designation of a 10 percent difference as indicative of substantial relationships is arbitrary, differences of this magnitude hal/e been used successfully in previous research endeavors. As G laser and Strauss state:
In place of making tests of significance, the socia· logist can establish working rules to fit his particular situation. For example, two rules for establishing 'an acceptable percentage difference level are not to consider any relationsh ip of, say, less than 10 percent difference; or any relationship in which three people's changing their minds or being misclassified would change the percentage to below an established level (Glaser and Strauss, 1967:201·202).
See also Cohen (1974).
",'
categories of some variables are so few iIi number that a 1 0 percent difference could not occur. Burglaries, for example, include two mutually exclusive categories consisting of com.pleted and attempted burglaries. Because the latter category contains only about 5 percent of the cases, a difference of 10 or more percent points acros~ categories of a second variable would be precluded. In such circumstances, when the cases are too few to support a 10 percent difference criterion, the relationship will be considered substantial if the percent figure occur· ring in one cell is twice that of its adjoining cell (a "proportionate difference" criterion).
Consideration was given to dividing the '~ata into two distinct sets based on whether or not the case was cleared, either through arrest of the perpetrator or by other means. It would not be unreasonable to assume that the characteristics of burglary incidents may differ on this criterion. For example, those cases that were cleared may be characterized by substantially different frequency distributions across the offense variables than those cases that were not cleared. Although some differences were noted between crimes c1~ared and those not cleared, these were not large enough to justify undertaking separate analYSis for both sets of data. Preliminary analysis revealed few differences when the data were dichotomized on the basis of cases cleared or were left as a complete set. With few exceptions, the distribution of burglary incident characteristics was quite similar regardless of how the data were broken down. In light of these findings, results were reported based on all the burglary incident data collected during the l-year life span of the project.
Patterning of Burglary Incidents
If Tables 13 to 17 prilsent bivariate relationships for -:: the structural correlates of reported burglary incidents.
Table 13 cross-tabula~es the nature and amqunt of financial loss and the type of structure burglarized, either residential or n<)ilresidential. Eighty-five percent of all reported residerttial burglaries and 75 percent of all re- , ported nonresidential burglaries resulted,; in monetary loss of some type. This 10 percent diffei~ce meets the criterion indicating a substantial relationship. Thus,. residential structures wer'e substantially ,Illore likely than nonresidential structures to suffer a loss resulting from a burglary. However, when amount of loss was examined, no substantial differences were noted between residential and nonresidential structures. That is, both fypes of
29
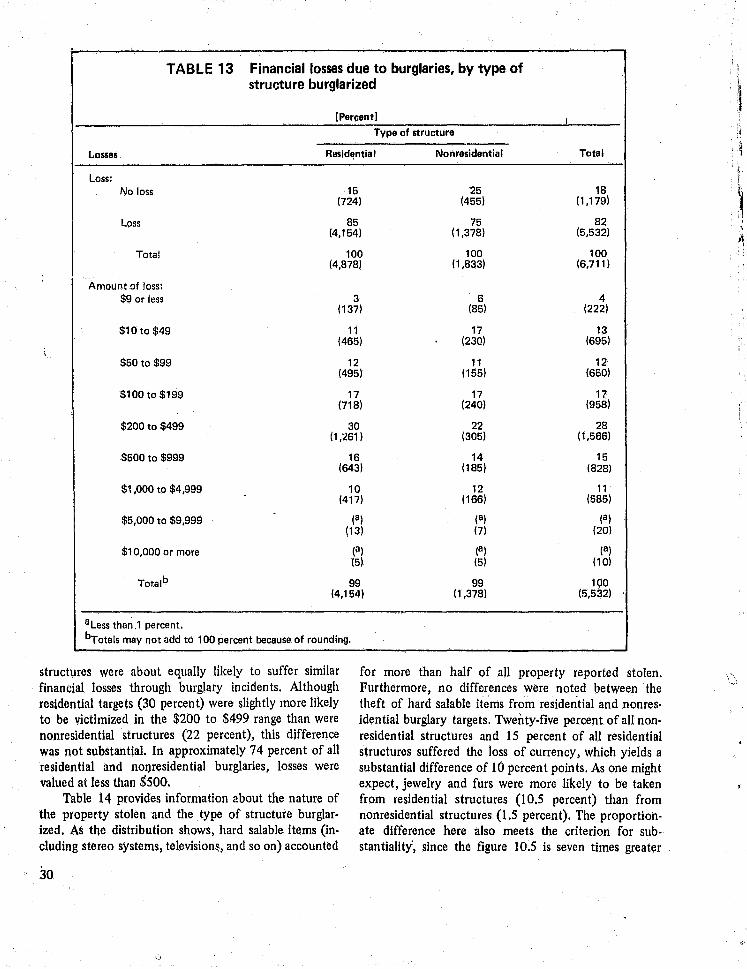
· TABLE 13 Financial losses due to burglaries, by type of
structure burglarized
[Percent) I
Type of structure
Losses Residentia I Nonresidential Total
Loss: No loss 15 25 18
(724) (455) (1,179)
Loss 85 75 82 (4,154) (1,378) (5,532)
Total 100 100 100 (4,878) (1,833) (6,711)
Amount of loss: $9 or less 3 6 4
(137) (85) (222)
$10 to $49 11 17 13 (465) (230) (695)
$50 to $99 12 11 12 (495) (155) (650)
$100 to $199 17 17 17 (718) (240) (958)
$200 to $499 30 22 28 (1,261 ) (305) (1,566)
$500 to $999 16 14 15 (643) (185) (828)
$1,000 to $4,999 10 12 11 (417) (166) (585)
$5,000 to $9,999 (8) (a) (8) (13) (7) (20)
$10,000 or more (a) (8) (8) (5) (5) (10)
Totalb 99 99 100 (4,154) (1,378) (5,532)
aLess tha~.1 percent. brotals may not add to 100 percent because of rounding.
structures were about equally likely to suffer similar financial losses through burglary incidents. Although residential targets (30 percent) were slightly more likely to be victimized in the $200 to $499 range than were nonresidential structures (22 percent), this difference was not substantial. In approximately 74 percent of all residential and nOl).residential burglaries, losses were valued at less than $500.
Table 14 provides information about the nature of the property stolen and the type of structure burglar. ized. As the distribution shows, hard salable items (in. cluding stereo systems, televisions, and so on) accounted
for more than half of all property reported stolen. Furthermore, no differences were noted between the theft of hard salable items from residential and nonres· idential burglary targets. Twenty.five percent of all non· residential structures and 15 percent of all residential structures suffered the loss of currency, which yields a substantial difference of 10 percent points. As one might expect, jewelry and furs were more likely to be taken from residential structures (10.5 percent) than from nonresidential structures (1.5 percent). The proportion· ate difference here also meets the criterion for sub· stantiality', since the figure 10.5 is seven times greater
30
I.

TABLE 14 Type of property stolen, by type of structure burglarized
[Percent]
Tvpe of structure
Property Residential Nonresidential Total
Money 15.0 25.0 17.2 (672) (390) (1,062)
Negotiable items 0.6 0.7 0.7 (30) (13) (43)
Jewelry/furs 10.5 1.5 8.2 (484) (25) (509)
Soft salable items 6.6 7.4 6.8 (306) (117) (423)
Hard salable items 63.0 61.6 62.6 (2,897) (974) (3,871)
Drugs 0.1 1.5 0.5 (5) (24) (29)
Firearms 4.3 1.2 3.6 (201) (19) (220)
Items from inside safe . 0.1 1.2 0.4 (5) (19) (24)
Totala 100.2 100.1 100.0 (4,600) (1,581 ) (6,H31) -----
aTotals may not add to 100.0 percent because of rounding.
than the figure 1.5. Similarly, firearms were more than twice as likely to be stolen from residential structures (4.3 percent) than nonresidential structures (1.2 percent). For residential structures only, few differences in type of property stolen were noted between single family dwellings and apartments/duplexes. (Table not presented.)
Methods used in burglaries are .examined in Table 15. The category "method" includes means used to gain entry (either door or window), whether or not force or a tobl was used to gain entry, and whether property damage occurred as a result of the burglary .. Little difference was found between the means used for entering residential structures and the means used for entering nonresiden tial structures (Table 15). Sixty-five percent of all nonresidential burglaries were made tlirough doors, compared with 62 percent for all residential burglaries. Residential structures were further dichotomized into single family dwellings and apartments/duplexes to determine if differences might exist between them in the means used to gain entry. Althougll single family dwell-
ings were somewhat male likely than apartmen ts/duplexes to be entered through the door (42 II percent versus 36 percent, respectively), the percent differences did not meet the criterion for SUbstantiality. (Table not presented.)
Although no relationship was found between point of entry and type of structure burglarized, a substantial relationship was found between force used to effect entry and type of structure; nonresidential structures were far more likely than residential structures to be subject to forcible entries. Seventy-three percent of all nonresidential entries involved force of some type, compared with 57 percent of all residential entries. This finding is similar to that of Clarke, who also reported that nonresidential burglaries were more likely to be effected by means of force than were residential burglaries (1972:9, 12). In only two instances were explosives used to gain entrance, once to enter a single family dwelling and once to enter a service:priented business. Tools were more likely to be involved in nonresidential burglaries (72 percent) than in residential burglaries (59 percent).
31

The data were also broken down according to single- . family dwelJi,ngs and apartments/duplexes and crosstabulated with the use of tools. Although burglaries of single-family dwellings were less likely to be effected by a tool than were apartment/duplex bUrglaries, the relationship, with a difference of approximately 5 percent points, was not substantial. (Table not presented.) Property damage data found in Table 15 reveal that nonresidential burglaries (72 percent) were substantially more likely to result in damage to property than were residential burglaries (55 percent).
These data thus show th~t nonresidential burglaries are frequently characterized by forcible entries, the use
of tools, and property damage. That these variables are interrelated is not surprising; if force is used to gain entry one would also expect a tool to be used and the probability of r.esulting property damage to increase. It is interesting trJ note, however, that these variables are correlates of nonresidential rather than residential burglaries. This finding may be suggestive of a general lack of attention given to security measures by those residing in residential areas. Clarke, for example, found that illegal trespasses gained through unlocked edoors and windows were more likely to occur in residential than in nonresidential buildings (1972:9, 12).
TABLE 15 Methods employed in burglary incidents, by type of structure burglarized
[Percent)
Tvpe of structure
Method Residential Nonresidential Totala
Door 62 65 63 (3,390) (1,402) (4,792)
Window 38 35 37 (2,075) (764) (2,839)
Total 100 100 100 (5,465) (2,166) (7,631)
No force 43 27 38 (2,370) (642) (3,012)
Force 57 73 62 (3,097) (1,727) (4,824)
Total 100 100 100 (5,467) (2,369) (7,836)
No tool 41 28 37 (2,198) (646) (2,844)
Tool 59 72 63 (3,178) (1,681) (4,859)
Total 100 100 100 (5,376) (2,327) (7,703)
No damage 45 28 40 (2,544) (682) (3,226)
Damage 55 72 60 (3,044) (1,735) (4,779)
Total 100 100 100 (5,588) (2,417) (8,005)
aTotal number of cases for each variable may vary because of missing cases.
32

! Table 16,. which shows temporal characteristics' of
reported burglary incidents, indicates that residential burglaries were more likely to occur during the day (56 percent) and on weekdays (70 percent). Forty-four percent of all reported residential burglaries and 85 percent of nonresidential burglaries occurred during nightime hours. Table 16 reveals few seasonal differences in the reporting of residential and nonresidential burglaries.
\ Thirty-three percent and 32 percent of all residential and nonresidential burglaries, respectively, occurred during the winter months. Similar distributions were ptesent when the data were tabulated by month of occurrence rather than month of reporting. (Table not presented.)
Table 17 presents the joint relatiolJ.ship between whether or not the burglary was cleared and whether the target was a residential or nonresidential structure. Both, residential and nonresidential burglaries were about equally likely to be cleared during the I-year span of the project. Nineteen percent of all residential burglaries were cleared compared with 16 percent of all nonresidential burglaries. Burglaries of medical offices in which drugs were taken were among those most likely to· be cleared by the arrest of an offender. Also included here were burglaries occurring in financial il1stitutions and business sales offices. Interestingly, none of the 18 burglaries occurring in hotels or motels were cleared.
TABLE 16 Temporal characteristics of burglaries, by type of structure burglarized
[Percentl
Type of structure
Temporal characteristics Residential Nonresidential Totala
Time: Day 56 15 45
(2,274) (232) (2,506)
Night 44 85 55 (1,812) (1,313) (3,125)
Total 100 100 100 (4,086) (1,545) (5,631) .
Day: Weekday 70 58 67
(3,681) (1,348) (5,029)
Weekend 30 42 33 (1,568) (959) (2,527)
Total 100 100 100 (5,249) (2,307) (7,556)
Season:
Winter 33 32 32 (1,858) (765) (2,623)
Spring·autumn 33 33 33 (1,883) (818) (2,701)
Summer 34 35 35 (1,945) (866) (2,811)
Total 100 100 100 , (5,68(!) (2,449) (8,133)
:'.')
aTotal number of cases for each variable may vary because of missing cases.
33

Other burglaries less likely to be cleared included those of vehicle sales offices and industrial bUildings. Although reSidential and nonresidential burglaries are about equally likely to be cleared by arrest, it is quite possible that other incident characteristics may differ between crimes cleared and crimes not cleared. The following section', therefore, provides a more in tensive examination of
. tlie' correlates of crimes that were cleared during the course of the burglary project.
Burglary Clearances This section focuses on whether and to what exten t
the incident characteristics of burglaries cleared by arrest differ. As a starting point, the relationship between reported financial losses occurring during the burglary and whether or not the crime was cleared is examined. Earlier it was noted that Clarke (1972) discovered a relationship between the amount of finan'dal loss occurring
. during a burglary and the probability of the crime being cleared. Briefly, the clearance rate for offenses involving little financial loss was relatively high, dropping for burglaries involving medium value losses and increasing again for the highest property losses (Clarke, 1972: 10). Furtliermore, Conklin and Bittner discovered that, for suburban burglaries, crimes involving higher property losses commanded mOre police attention (1973 :227). The duta presented here lend some support to these previous findings.
Table 18 reveals that burglaries involving no reported financial losses were more likely to be cleared than those resulting in a financial loss. Thirty-four percent reporting no financial loss were cleared compared with 15 percent reporting financial losses, a substantial difference of 19 percent points.
TABLE 17 Whether or not burglary was cleared, by type of structure burglarized
[Percent]
Tvpe of structure
Clearance Residential Nonresidential Total
Not cleared 81 84 82 (4,616) (2,052) (6,668)
Cleared 19 16 18 (1,069) (395) (1,4134)
Total 100 100 100 (5,685) (2,447) (8,132)
34
TABLE 18 Whether or not offense was cleared, by whether or not a loss occurred ' during the burglary
[Percent]
Loss
Clearance No loss Loss Total
Not cleared 66 85 81 (779) (4,672) (5,451 )
Cleared 34 15 19 (400) (895) (1,259)
Total 100 100 100 (1,179) (5,531) (6,710)
Table 19 examines the relationship bctweel) the amount of financial loss and whether or not burglaries were solved. This table reveals a trend similar to that noted by Clarke. That is, for those burglaries reporting less financial loss the percent of crimes cleared is mther high, Approximately 34 percent of those burglaries with losses in the $0 to $9 range were cleared, followed by 21 percent in the $10 to $49 range, and 16 percent in the $50 to $99 range. The figures cOfltinue to decline until reaching the $500 to $999 range, where a slight upswing is noted. Of those burglaries with reported losses of $5,000 to $9,999 and $10,000 or more, 25 percent and 10 percent, respectively, were cleared by arrest. It is interesting to note that those burglaries in the $200 to $499 range, the most frequently reported category of financial loss, are those least likely to be cleared (12.3 percent) with the one exception of a burglary involving a loss of $} 0,000 or more.
In order to examine the extent to which other inci dent characteristic variables were related to the frequency of burglaries being cleared, predictive attribute analysis (PAA) was employed. The primary concern is with two mutually exclusive outcomes'(either the case was cleared or it was not); therefore, PAA was considered an effective analytic technique, because it identifies those variables most highly associated with the criterion being inve.stigated. According to Turner:
PAA is best used when there are many vari;\11[es in which nonlinear effects are present or
.• :.pected and in which unanticipated interactions may exist. Furthermore, it deals with the problem of interrelatedness of items. PAA analysis prevents one from using as predictors variables that are related to the criterion, but do not add anything to predictive power when used in conjunction with other variables (1969:37).
f.
1 j
i
. I

PAA was developed by MacNaughton·Smith in an attempt to predict outcomes of selected variables by dividing the subjects into hierarchical groupings (Wilkins, et al., 1964; Wilbanks, 1972). In its final form, it identi" fies clusters of variables, presented as a brunching net· work, that are associated with the criterion variable under consideration. The procedure is strarghtforward and developed by successively splitting the predictor variables based on the degree of their relationship tv the criterion. First, the data are broken down into dichot· omies. The outcome (criterion) variable is then deter· mined, for example, whether or not a defendant is sentenced to prison. The correlation coefficients of each predictor with sentence outcome are examined, and the split is made on the variable that evidences the highest degree of correlation. For example, if age were most highly correlated with the decision to incarcerate, the split would be made there. Then within each category of age, for example, under 30 and 30 and older, the next variable having the highest degree of association with the criterion would be selected. In one category of age, under 30, it might be sex, and in the other, prior record may show the highest correlation. The next split is then made and the process continues until the cases are exhausted or some stopping point has been determined. This process results in a specific pattern (or grouping) of variables that best accounts for differences in the specified outcome under consideration.
PAA is a clustering technique; it groups variables based upon their degree of association with the criterion. In any clusteting program one must carefully avoid including those variables that are logically related by necessity, bec~use the inclusion of such variables is likel~
associated because of some logical connection between them (e.g., sex and motherhood; a high degree of association arises becau~e no man is a mother). Secondly, although the attributes are not logically connecteq. there may be a strong empirical association between them which is so well knowrt as to be totally uninteresting to the researcher (e.g., shortness and childhood). In either case the classification will be distorted, in the sense that it will partly' be based on information which is deducible or well·known; in other words, the object of a descriptive classification is to summarize compactly as much information ,. as possible which concerns us; thus information which we could deduce from logic or from past experi. ence without bothering about classification should not be included in the analysis (1965:21).
A number of attribute variables contained in the burglary data ,are "logically necessitated': because the absence of one precludes the presence of the other. For example, if a burglary were only attempted and no~ completed, one would expect no financial or property loss to have occurred. Relationships of this type, therefore, have been excluded from the clustering process both here and in subsequent reports.
PAA branching networks are depicted in Figure 1 for those burglary incidents cleared during the California project. In each instance both the criterion variable and each predictor variable were dichotomized according to those cutting points established earlier. The ordinal measure of association, Somers' d, was used to interpret the strength of the relationship between the criterion variable and each predictor, thus specifying where each PAA split should be made" 1 [n each figure, the number
, to play havoc with the dustering process. T~le problem 1.S
concisely summarized by MacNaughton.Smlth: I I Somers' d is extremely sensitive to percentage differences ... two sources of association can be a. nui· in two-by-two tables. Although the measure normally requires sance. Firstly, two attributes may be hll~l:t __ ly.,o ~rdj.nal data. _ ~d __ I_C~h __ o_to_m_i~ze~d_n_o_m_in_a_1 d_a_ta_m_ay_s_a_fe_IY_be_l_lse_d_,_
~-------------~---------~.'.~----------------------~~~. I TABLE 19 Whether o{not offense was cleared, by the amount of loss
occurring during the burglary
[Percent] $100 $200 $500 $1000 $5000 $10,000
$9 or $10to $50 to to to to to. to or $9,999 Total Clearance less 49 99 $199 $499 $999 $4,999 more ,
Not cleared 66.2 79.2 83.9 85.7 87.7 85.4 86.8 75.0 90.0 84.5 (147) (551 ).' (546) (819) (1,372j (707) (506) (15) (9) (4,664)
33.8 20.8 16.1 14.3 12".3 14.6 13.2 25.0 10.0 15.0 Cleared (105) (137) (193) (121) (77) (5) (1) (8591 (75) (145)
100.0 100.0 100.0 100.0 100.0 100.0 100.0 100.0 100.0 ~!J Total 100.0 (583) (201 (10) (5,523) (222) (696) (651) (956) (1,565) (828)
35
.,

of cases reported (N) represents the base on which the percentage of those cases cleared (clearance rate) was derived. Three criteria were employed as It stopping rule in order to determine when each branching networ;l~ should be terminated. These criteria included a 5 percent difference between branches, a minimum of at least 50 cases in each branch, and four successive splits. Thus, each PAA network would continue until a difference of 5 percent or less existed between, branches, the number of cases in each branch was 50 or less, or four successive splits (branches) had occurred. While some branches could logically have been carried out beyond four successive splits, tlus criterion was thought sufficient to determine any patterning that might exist in the data.
The incident characteristics of those burglaries cleared by arrest ace graphically illustrated by Figure 1. As noted above, the PAA results show the importance of financial loss in that the first split occurs on that variable. Thirty-four percent of those burglary incidents with no financial loss were cleared compared with 15 percent of those incidents involving a financia110ss. In the no-loss category, property damage is most highly correlated with the criterion variable (percent cleared): 49 percent of those burglaries involving no property damage were cleared compared with 28 percent invOlving property damage of some type. For those cleared burglaries involving a financial loss, the next split includes type of structure burglarized (residential or nonresidential). Of those residential structures burglarized (for which a financial loss also occurred) the clearance rate is 17 percent, and for nonresidential structures the clearance rate is 11 percent. Both branching networks continue until one of the stopping rules has been encountered.
Those variables producing branches in the no-loss category include property damage, type of structure, attempted or completed burglary, usc of tools to gain entry, time of day, and presence of alarm system. In the loss category the following variables produced splits: type of structUt'e, visibility of entrance point, time of day, use of tools to gain entry, point of entry, and type of p,roperty stolen. Three of these variables refer to the different types of methods used to gain entry. These include the manner in which entry is effected (through either door or window), usc of tools to gain entry, and occurrence of property damage. The burglaries less likely to be cleared are tho'se in which a tool was used to gain entry and in which property damage resulted. Two of the deterrent cllQl'~cteristic variables, visibility of entry point and presence or absence of an alarm system, also appeared in the branchiltg network. In completed bur-
36
glaries in which there was damage but no loss, if the structure had an alarm system of some type the burglary was more likely to be cleared than if it did not. Those residential premises that incurred loss and where the point of entry was not visible, however, were more likely to be cleared than those where the point of entry was visible.
Numbers in parentheses (Figure I Ilnd Table 20) define distinct clusters of variables each related to the criterion variable under consideration. The clearance rate for group 1 is 44 percent and includes the following characteristics: no financial loss, no property damage, residential targets, and no tool used to gain entry. Group 15 has a clearance rate of 10 percent and subsumes those burglaries characterized by financial loss, nonresidential structures, and nighttime occurrence.
PAA results are summarized in Table 20 and reveal a rather wide range of clearance rates. For example, those nonresidential burglaries occurring in the nightime that resulted in financial loss evidenced a clearance rate of only 10 percent (group 15). On the other hand, group 3 included those daytime nonresidential bUrglaries in which neither financial loss nor property damage was reported. For these, the clearance rate was 82 percent, a rate substatHially higher than that of any other group. It is possible that offenders committing burglaries with the latter characteristics were more likely to be apprehended at the scene or shortly thereafter than were others.
Table 20 provides some interesting, if not unusual, findings. Groups 13 and 14, for example, have sub· stantially different clearance rates yet differ on only one defining characteristic. Both groups include burglaries of nonresidential structures committed in the daytime [or which a financial loss was reported. In group 13, however, monr-y or hard salable items were taken; in group 14 othe.r< property was the object of the theft. It is possible that Ilother property" consisted of unusual items, items that were difficult to dispose of or easily traced to the offender, thus leading to an apprehension.
Earlier, the type of structure was found to be unrelated to whether or not the offense was cleared. That is, reSidential and nOl11'esidential burglaries were about equally likely to result in clearances. In combination with other cha~cteristics, however, burglary clearances do differ by target structure. Residential burglaries characterized by no reported financial loss, no tool used to gain entry, and no property damage (group 1) were less likely to be cleared than nonresidential burglaries occurring dUring the nighttime and involving no damage or no financial loss (group 4); the clearance rates were 44 percent a1:tel 58 percent, respeC'tively. Two groups had
,

, I
FIGURE 1 PAA results for burglary offenses cleared
Total Cases Loss Nonresidential
N=5,531
N=4,153
No loss Damage ~-----,
':'
aCases reported in subcells may not add to the total number of cases because of missing values.
(10)
(9)
__ ~---"'-.:-:-",...,. (8)
(7)
,.....;.r;m..-~~ (2)
L-tI-C::::J (1)
37

38
TABLE 20 Summary of the PAA results for burglary offenses cleared
Group number Group characteristics
Percent Number Cleared
(16) Burglary reSUlted In loss 676 10 Nonresidential structure Burglary occurred during
nighttime
( 11) Burglary reSUlted In loss 791 '1 Residential structure Point of entry visible Entry made through door
(10) Burglary reSUlted In loss 1,676 16 Residential structure Point of entry not visible Tool used to gain entry
(12) Burglary resulted In loss 261 17 Residential structure Point of entry visible Entry made through window
(6) Burglary resulted in no lo~ 300 18
Damage to premises Burglary attempted Tool used to gain entry
(13) Burgiary resulted in loss 93 20 Nonresidential structure Burglary occurred dUrir,'lg
daytime Money, or hard salable items
taken
(9) Burglary resulted in loss 1,132 23 Resldentia I structure Point of entry not visible No tool used to gain en try
(7) Burglllry resulted in no loss 400 30 Damage to premises Burglary completed No alarm on premises
(6) Burglary reSUlted in no loss 36 33 Damage to premises Burglary attempted No tool used to gain entry
(2) Burglary resulted in no loss 48 33 No damage to premises Residantlsl structure Tool used to gain entry
(14) Burglary resulted in loss 32 41 Nonresidential structure Burglary occurred during
daytime Other property taken
TABLE 20 concluded
Group number Group characteristlos
(8)
(4)
(3)
Burglary resulted In no loss No damage to premises ReSidential structure No tool used to gain entry
Bu rglary resu Hed in no loss Damage to premises !3urglary completed Alarm on premises
BUI'glarY resulted In no loss No damage to premises Nonresidential structure Burglary occurred during
nighttime
Burglary resulted in no loss No damage to premises Nonresidential structure Burglary occurred dUring
daytime
Percent Number Cleared
188 44
74 63
67 58
28 82
the same clearance rate. Both group 5 (attempted bur· glaries in which no loss was reported and no tool was used to gain entry but damage did occur) and group 2 (reSidential burglaries in which no loss was reported and n tool was used to gain entry with no resulting property damage) had clearance rates of 33 percent.
ConSidering the incident characteristics and the associated clearance rates of all groups, the lack of any overall pattern is quite striking. Although clearance rates vary by more than 70 percent points. the characteristics .pf those groups with high rates are remarkably similar to ,Ihe characteristics of those groups with low rates. Only two rather consistent relationships seem to be present. As noted above in Table 18, burglaries resulting in no financial loss are substantially more likely to be cleared than burglaries resulting in a financial loss.
The PAA network also shows that those burglaries exhibiting the highest clearance rates are consistently characterized by no financial loss. Furthermore, in those groups that exhibit similar characteristics, burglaries in which no tool was used to gain entry and in which no damage to property Occurred were most likely to be cleared. These relationship~ were more pronounced when targets were nonresidential structures than when they were residential structures. The lack of a consistent pattern suggests that clearance rates of burglaries differ little among single incident characteristic variables but do evidence some variability among combined character·
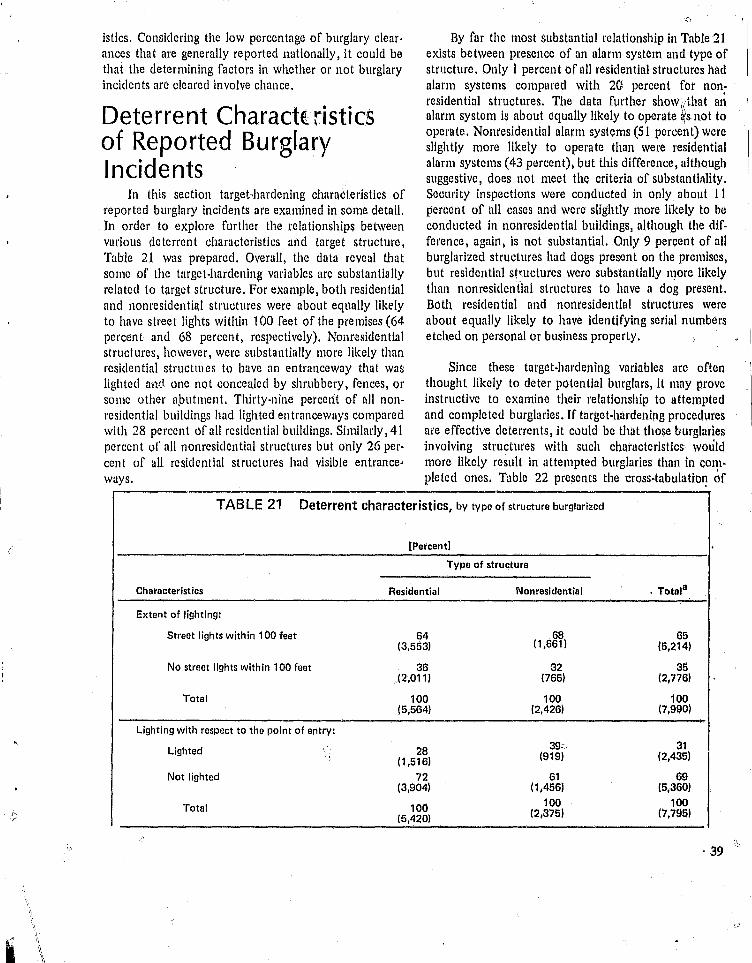
istics. Considering the low percentage of burglary clearances that are generally reported nationally, it could be that the determining factors in whether or not burglary incidents arc c1em'ed involve chance.
Deterrent CharactE: ristics of Reported Burglary Incidents
In this section target,hardening characteristics of reported burglary incidents are examined in some detail. Tn order to explore further the relationships between various de terrent characteristics and target structure, Table 21 was pl·epared. Overall, the data reveal that some of the target-hardening variables are substantially related to target structure. For example, both residential and nonresidential structures were about equally likt1ly to have street lights within 100 feet of the premises (64 percent and 68 percent, respectively). Nonresidential structures, however, were substantially more likely than residential structUles to have an entranceway that waS lighted a!1(l one not concealed by shrubbery, fences, or some other (lhutment. Thirty-nine percerit of all nonresidential buildings had lighted entranceways compared with 28 percent of all residential buildings. Similarly, 41 percent of all nonresidential structures but only 26 percent of all residential structures had visible entranceways. ,-
By far the Illost substantial relationship in Table 21 exists between presence of an alarm system and type of structure. Only 1 percent of all residential structures had alarm systems compured with 20 percent for nonresidential structures. The data further show{that an alarm system is about equally likely to operate ~\s not to operate. Nonresidential alarm systems (S 1 percent) were slightly more likely to operate than were residential alarm systems (43 percent), but this difference, although suggestive, does not meet the criteria of substantillUty. Security inspections were conducted in ollly about 11 percent of all cases and were slightly more likely to be conducted in nonresidential buildings, although the difference, again, is not substantial. Only 9 percen t of all burglarized structures had dogs present on the premises, but residential st~uctures were substantially n}orc likely than nonresidential structures to have a dog present. Both residential and nonresidential structures were about equally likely to have identifying serial numbers etched on personal or business property.
Since these target-hardening variables ace often thought likely to deter potential burglars, it may prove instructive to examine their relationship to attempted and completed burglaries. If target-hardening procedures are effective deterrents, it could be that those burglaries involving structures with such characteristics wOlild more likely result in attempted burglaries than in completed ones. Table 22 presents the cross-tabuJatio~ of
TABLE 21 Deterrent characteristics, by type of structure burglarized
[Percent)
Typo of structure
Characteristics Residential Nonresidential • TotalO
Extent of lighting:
Street lights within 100 feet 64 68 65 (3.553) (1.661) (5.214)
No street lights within 100 feet 36 32 35 ;,(2.011) (765) (2,776)
Total 100 100 100 (5,564) (2,426) (7,990)
Lighting with respect to the point of entry:
Lighted I: 28 39': 31 (1,516) (919) (2,435)
Not lighted 72 61 69 (3,904) (1,456) (5,360)
Total 100 100 100 (5,420) (2,375) (7,795)
. 39 '.':,

TABLE 21 Deterrent characteristics, by type of structure burglarized· continued
"' Type of structure
Characteristics Residential Nonresidential Totala
Visibility of point of entry:
Visible 26 41 30 (1,432) (973) (2,405)
Not visible 74 59 70 (4,091) (1,380) (5,471 )
Total 100 100 100 (5,523) (2,353) (7,876)
Extent of alarm systems:
Premises with alarms 1 20 7 (57) (501) (558)
Premises without alarms 99 80 93 (5,629) (1,948) (7,577)
Total 100 100 100 (5,686) (2,449) (8;135)
Functioning of alarm systems:
Alarm operated 43 51 50 (23) (250) (273)
Alarm did not operate 57 49 , 50 (31) (242) (273)
Total 100 100 100 (54) (492) (546)
I Security inspection conducted: 1 Security inspection 9 17 11 . (512) (407) (919)
No security inspection 91 • 83 89 (5,117) (1/987) -",104)
Total 100 100 100 (5,629) (2,394) (8,023)
;"\
Dog on premises:
Dog present 12 2 9 (402) (33) (435)
Dog not present 88 98 91 (3,071) (1,386) (4,457)
Total 100 , 100 100 (3,473) (1,419) (4,892)
, Serial numbers etched on property:
Identifying serial numbers 9 10 9 (299) (132) (2,131 )
No identil'ying serial numbers 91 90 91 (3,129) (1/263) , (4,392)
Total 100 100 100 , (3,428) (1,395) (4,823)
aTotal number of cases for each variable may vary because of missing cases.
40

I I' I
eight deterreht characteristic variables with attempted and completed burglaries. Few of the relationships observed here could be considered substantial. Of those burglaries that were attempted but not completed, 11 percent occurred on premises having alarms, and 5 percent on premises with no alarm systems; this is a substantial relationship according to the "proportionate difference" criterion. Attempted burglaries were also more likely to occur on premises with no identifying serial numbers (5 percent) than on premises with identifying serial numbers etched on property (1 percent). The remaining relationships are not substantial and show few differences between deterrent characteristic variables and attempted burglaries. For example, attempted burglaries are as likely to occur on those premises in which a dog is present as on those in which there is no dog.
However, examining relationships for attempted and completed burglaries creates a major problem: there is no valid way of determining the actual number of potential burglaries that were thwarted. In other words, it may be that certain characteristics of target structures deterred potential offenders from even attempting an illegal entry. Attempted burglaries, for example, would most likely be reported to the police if someone (e .g., the victim or 11 neighbor) either observed the illegal trespass or if there were some physical evidence that an attempt had actually been made (e.g., presence bf a broken window). Even with this limitation, it was noneth~less thought worthwhile to examine in further detail
q
the characteristics of attempted and glaries.
bm-
Table 23 examines the relationship b~tween attempted and completed burglaries and the type of structure burglarized. Its data show that attempted burglaries are about equally likely to occur in residential and nonresidential structures. Five percent of all residential burglaries were attempted compared with 6 percent of all nonresidential burglaries. ..
-Because two mutually exc1usiVeOUtcomes were"I;}volved (either the burglary was attempted or it was completed), PAA would seem to be an efficient method for exploring these possible relationships. The data, however, did not fully support a PAA solution. First, only about 5 percent of all cases reported herein resulted in attempted burglaries; thus, the data were quite skewed. Because there were onlY 427 attempted cases, case attenuation quickly IHnited the number ofPAA branches. Furthermore, a number of relationships were "logically necessitated," and, therefore, these variables had to be excluded from the analysis. For example, tlnancial loss exhibited a substantial relationship with attempted burglaries, for if a burglary was only attempted, then no financial loss could occur. The data showed that all
. attempted burglaries were characterized by no financial loss. A similar relationship was also evident for forcible and nonforcible entries. All attempted burglaries were characterized by a forcible en try, thus supporting the earlier supposition that unless some physical traces of an
TABLE 22 Deterrent characteristics, by attempted and completed burglaries
Characteristics
Extent of lighting:
Street lights within 100 feet
No street lights within 100 feet
lighting with respect to point of entry:
lighted
Not lighted
[Pertent]
Attempted
5 (285)
5 (137)
6 (147)
5 (263)
Completed
95 (4,929)
95 (2,639)
94 /2,288)
95 (5,097)
Tota,a
100 (5,214)
100 (2,7761
100 /2,435)
100 (5,360)
41

TABLE 22 Deterrent characteristics, by attempted and completed burglaries - continued 1 [Percent]
Characteristics Attempted Completed Totala
Visibility of point of entry:
Visible 6 94 100 (155) (2,250) (2,405) "
Not visible 5 95 100 (262) (5,210) (5,472)
Extent of alarm systems:
Premises with alarm systems 11 89 100 (59) (500) (559)
Premises without alarms 5 95 100 (368) (7,210) (7,678i
Functioning of alarm systems:
Alarm operated 12 88 100 (34) (240) (274)
Alarm did not operate "- 9 91 100 (25) (249) (274)
Security inspection conducted:
Security inspection 6 94 100 (51) (869) (920)
No security inspection 5 95 100 (369) (6,735) (7,104)
Dog on premises:
Dog present 5 95 100 (20) (415) (435)
Dog not present 5 9ll 100 (223) (4,234) (4,457)
Serial numbers etched 01) property:
Identifying serial numbers 1 99 100 (3) (428) (431)
No identifying serial numbers 5 95 100 (228) (4,164) (4,392)
aTotal number of cases for each variable may vary because of missing cases,
42

TABLE 23 Attempted and completed burglaries, by type of structure burglarized
[Percent] ,'~
Type of structure -- ,
Residential Nonresidential Total
Attempted 5 6 5 (273) (153) (426)
Completed 95 94 96 (5,413) (2,296) (7,709)
Total 100 100 100 (5,686) (2,449) (8,136)
attempted burglary were preS{"ut, it was unlikely to be discovered and subsequently re'porteq to the police.
Figure 2 presents the initial PAA branches obtained for those burglaries that were attempted. The first split occurred on the variable property damage. Those instances in which no damage resulted (2.0 percent) were less likely to be attempted burglaries than those in which property was damaged (7.0 percent). Under the category "no damage" the next split included the Vitriable time of day. One and two-tenths percent of all daytime burglaries were attempts compared with 3.8 percent of those burglaries occurring at night. For those burglaries characterized by property damage, attempted burglaries were more likely to occur in structures that had alarm systems (13.9 percent) than in structures having no alarm system (6.8 percent). The rate of attempted hurglaries was highest for incidents characterized by alarm systems and damage to property, and lowest for burglaries occurring during the daytime with no property damage: the respective figures are 13.9 percent and 1.2 percent. These findings, however, must be viewed cautiouslY because of the small number of cases included in Figure 2.
Summary and ConclusionS The examination of burglary incident data under-
• taken in this report has focu~ed upon the correlates of burglary as distributed across space and time. Although the orginal goal of the California project was an assessment of the relative reduction of burglary over a I-year period, the data serve many other areas of inquiry as well. Accepting the premise that crime is a structured event and that patterned variation could be discovered in the commission of burglary, the analysis sought to uncover the relationships among various incident characteristics. For example, burglary losses were found to
.'
be of moderate value and included goods easily converted into cash. Although residential burglaries were more likely than nonresidential burglaries to result in a financial loss, the amount of loss reported was similar for both types of structures. Currency was more likely to be stolen from nonresidential than from residential structures. Jewelry and furs, however, were more frequerltly the object of residential _burglaries. Most burglaries involved some degree of forcible entry that was more likely to be associated with nonresidential than 'with residential burglaries. Furthermore, nonresidential burglaries were frequently characterized by forcible entries in which tools were utilized and property was damaged.
Residential burglaries occurred predominantly during the week and in the daytime, with nonresidential burglaries occurring more frequently on weekdays and during the hours of darkness. No seasonal fluctuation in burglaries was found to exist (for either residential or nonresidential burglary), and with the exception of alarm systems, deterrent characteristics bore little relationship to whether or not a burglary was completed. Attempted burglaries were more likely to be reported for those premises that had alarm systems. 0
PAA Singled out those variables most closely associated with the percent of burglaries cl!~ared. Financialldss was found to be substantially related to whether or not a burglary was cleared. Burglaries in which no financial losses were reported were more likely to b~: cleared than those resulting in a financial loss. To a less~r extent, the use of tools and property damage were also associated with the percentage of burglaries cleared. Within those groups exhibiting similar characteristics, burglaries were more likely to be cleared if no tool was used, if no proper.ty d,amage resulted, and if (he burglary occurred in a nonresidential structure.
It is interesting to note the extent to Which the correlates of burglary incidents are similar across widelY;
43
I ,I

FIGURE 2 PAA results for attempted burglaries
Total Cases No Damage Daytime
~ 1.2% i
2.0% N=1,127
Nighttime
5.2% N=3,226 y,.8%
Percent Attempted N=1,091
Damage No alarm ~'r
~: ,.8% -- .0%
N=8,136 a
_. N=4,371
N=4,780 ,Alarm "'""-1.118'9%
N=409
aCases, reported In subcells may not add to the total number of cases because of missing values,
44

divergent geographic areas. That is, research focusing on burglary conducted in different settings has produced similar findings, indicating that similar types of burglaries are being committed across various geographic regions 0 f the country. Furthermore, victimization studies have also shown quite consistent results in that the characteristics of burglary incidents reported in victimization studies are quite similar to those reported to the police.
The data further show that burglaries are most likely to be committed when residents or employees are absent. Thus, residences are mOre likely to be burglarized during the daylight hours when many people are at work or away from home for other reasons (e.g., shopping). On the other hand, commercial establishments face a higher probability of being burglarized at nighttime when employees have left for the day. These findings, coupled with the relatively high percentage of nonforcible burglaries, may underscore a lack of attention to simple security precautions by many victims of burglary.
Although the analysis of deterrent characteristic features was problematic in some respects, the data do, at least, question the utility of employing such meaSUles on a wide scale and underscore the need for evaluative research on prevention programs. For example, the more expensive or difficult to implement the deterrent char-
I \
t \
acteristic, the less likely it was to be in general use. Although approximately 6S percent of all reported burglaries included structures with street lights within 100 feet of the premises, fewer than 10 percent had alarm systems.
Analysis of various deterrent characteristics also revealed few differences between attempted and completed burglaries. A higher percentage of attlrmpted burglaries might be expected to occur for those structures employing preventive techniques of some type, but this was not the case. Only where alarm systems were present were attempted burglaries more likely to be reported to the police. Although it is possible that protected properties may be the targets of few attempts, these findings nonetheless suggest that use of various burglary abatement techniques requires closer scrutiny than it has previously received.
The second report in this series continues the line of inquiry initiated above. Just as certain incident characteristics were found to be associated, so too may the ... ~~ characteristics of burglary offenders. Hence, the subsequent report examines the social correlates of those apprehended for burglary, including age, race, sex, and previous criminal history of burglary offenders; number of crime partners; and distance traveled to commit the offense.
()
45

...

REFERENCES
Amir, Menachem 1971 Patterns in Forcible Rape. Chicago:
The University of Chicago Press.
Blalock, Hubert M., Jr. 1964 Causal Inferences in Nonexperimental
Research. Chapel Hill: The University of North Carolina Press.
California Department of Justice 1971 Crimes and Arrests. Sacramento: Divi·
sion of Law Enforcement, Bureau of Criminal Statistics.
1971a Felony Defendants Disposed of in California Courts 1971. Sacramento: Division of Law Enforcement, Bureau of Criminal Statistics.
Cameron, Mary Owen 1964 The Booster and the Snitch: Depart·
ment Store Shoplifting. New York: The Free Press.
Chimbos, Peter D. 1973 "A Study of Breaking and Entering
Offenses in 'Northern City,' Ontario." Canadian Journal of Criminology and Corrections 15: 316·25.
Clarke, Steven H. 1972 Burglary and Larceny in Charlotte·
Mecklenburg: A Description Based on Police Data. The Mecklenburg Crimi· nal Justice Planning Council.
Cocke, Susan B. 1969 "Reformation of Burglary." William
and Mary Law Review, II (Fall): 211·25
Cohen, Lawrence E. 1974 Conferring the Delinquent Label: The
Relative Importance of Social Characteristics and Legal Factors in the Pro· cessing of Juvenile Offenders. Ph.D. Dissertation, University of Washington.
Conklin, John E., and Egon Bittner 1973 "Burglary in a Suburb." Criminology
11 (August): 206·32.
Dunn, Christopher S. 1974 The Analysis of Environmental Attri·
b u te / Crime Incident Charllcteristic Interrelationships. Ph.D. Dissertation. State University of New York at Albany,
Glaser, Barney G. and Anselm T. Strauss 1967 The Discovery of Grounded Theo
ry. Chicago: Aldine.
Gray, Patrick 1. 1972
Hagan, John 1974
Crime ill the United States: Uniform Crime Reports. Washington, D.C.: U.S. Government Printing Office.
"Extra Legal Attributes and Criminal Sentencing: An Assessment of a SociolOgical Viewpoint." Law and Society Review 8 (Spring): 357·83.
Hindelang, Michael J. 1976 An Analysis of Victimization Survey
Results from the Eight Impact Cities. U.S. Department of Justice, Law
Enforcemen t Assistance Administration, National Criminal Justice Information and Statistics Service. Washing. ton, D.C.: U.S. Government Printing Office.
Hindelang, Michael J. and Carl E. Pope 1975 "Sources of Research Data in Criminal
Justice," in Emilio Viano (ed.) Role of Research in Criminal Justice. Boston: D.C. Heath and Company.
Klein, Malcolm, et at. 1974 "The Ambiguous Juvenile Arrest."
Paper- presented at the annual meeting of the Society for the Study of Social Problems, Montreal, Canada.
Law Enforce men t Assistance Administration 1974 Crime in Eight American Cities: Na
tional Crime Panel Surveys of Atlanta, Baltimore, Cleveland, Dallas, Denver, Newark, Portland, and St. Louis -Advance Report. National Criminal Justice Information and Statistics Service. Washington, D.C.: U.S. Government Printing Office.
47

MacNaughton,Sqtith, P. 1965 Some Statistical and Ot~r Numerical
Techniques for Classifying Indivi· duals. London: Hom~ Office.
Normandeau, Andre 1968 Trends alJfl/ Patterns in Crime$ of
Robbery. Ph.D. Oissertation, Univer· sity of Pennsylvania.
Pope, Carl E. 1977
1977a
Crime·Specific Analysis: An Empirical Examination of Burglary Offender Characteristics. An/llytic Report SD·AR·l1. U.S. Department of Jus. tice, Law Enfof\:ement As~i$tance Administration, Nation;.l Criminal Jus. tice Information and Statistics Service. Washington, D.C.: U.S. Government Printing Office.
Crime.Specific Analysis: An Empirical E~amination of Burglary Offense and Offender Characteristics. Analytic Re· port SD.AR·12. U.S. Pepartment of Justice, Law Enforcement Assistance Administration, National Criminal Jus. tice Information and Statistics Service. Washington, D.C.: U.S. Government {lrinting Office.
Reppetto, Thomas A. 1974 Residential Crime. Cambridge, Mass.:
Rockwell, J.W. 1972
Ballinger Publlllhing Co.
I'Crime Specific-An Answer." Police Chief 39 (September): 38·43.
Santa Clara Criminal Justice Pilot Program "', 1972 Burglary in San Jose. Springfield, V~.:
U.S. Department of Commerce.
48
SCarr j Harry A. 1973 Patterns of Burglary (2nd Edition).
Wasqington, D.C.: U.S. Government Printing Office.
Schultz, Thomas A. 1970 "Criminal Law - Burglary ..,. A Sum·
mer Home is an Uninhabited Dwelling During the Time When It's Unoccu· pied." University of Cincinnati Law Review 39 (Spring): 421-26
Small Business Administration 1969 Crime Against Small Business. Report
submitted to the U.S. Senate Select Committee on Small Business. Wash· ington, D.C.: U.S. Government Print·
.ing Office.
Turner, Stanley 1969 I'The Ecology of Delinquency," in
Thorsten Sellin and Marvin E. Wolf· gang (eds.), Delinquency: Selected Studies. New York: John Wiley and Sons.
Wilbanks, William L. 1972 The Predictive Efficiency of Alterna·
tive Methods of Construction of Parole Tables. Master's Thesis, State Univer· sity of New York at Albany.
Wilkins, Leslie T. arid P. MacNaughton.Smith 1964 "New Prediction and Classification
Methods in Criminology." Journal of Research in Crime and Delinquency 1 (January): 19·~2.
Wolfgang, M~rvin E. 1958 Patterns in Criminal Homicide. New
York: John Wiley and Sons.

I I I I I I I I I I I I I I I I I I I, I I I I I I I I I I I I I
Dear Reader:
U.S. DEPARTMENT OF JUSTICE LAW ENFORCEMENT ASSISTANCE ADMINISTRATION
USER EVALUATION QUESTIONNAIRE
Crime.Specific Analysis: The Characteristics of Burglary Incidents
Analytic Report No. 10
The Criminal Justice Research Center and the Law Enforcement Assistance Administration are interested in your comments and suggestions about this report, produced under the Utiliz. ation of Criminal Justice Statistics pfoject. We have provided this form for whatever opinions you wish to express about this report. Please cut out both of these p!lges, staple them to~ gether on one corne!, and fold so that the Law Enforcement Assistance Administration address appears on the outside. After folding, use tape to seal closed. No postage stamp is necessary.
Thank you for your help.
1. For whllt purpose did you use this report?
2. For that purpose, the report- 0 Met most of my needsDMet some of my needsDMet none of my needs
3. How will this report be useful to you?
o Data source o Other (please specify)
o Teaching material
o Re.ference for arti:cle or report o Will DB.! be useful to me (please explain)
o General information -----------------------~--------------o Criminal justice program plannin9;~_j
4. Are there any other data sources you could suggest to}!~l!{ress the topic of this report? ,//
f/ (i-/
;/
5. Would you like to see any other analyses of the data contained in this report?
Page 1

6. Which parts of the report, if any, were difficult to understand or use? How could they be improved?
7. Can you point out specific parts of the text or table notes that ure not clear or terms that need to be defined?
8. Can you point out any specific statistical techniques or terminology used in this report that you feel should be more adequately explained? How could these be better explained?
9. Are the,;-;ays this report could be improved that you h~ve not mentioned?
10. Please suggest other topics you would like to see addressed in future analytic r~-po-r-ts-.• ----".-
~~~:----------------~-----~----~--~------------~------~---~-------.. --11. Please suggest any specific criminal justice data bases or sources of criminal justice data that c1l)uld be explored In future analytic reports. (Please give as full a citation as possible.)
Page 2

I I I I I I I
~ .,J ."
~ ~ .,J 'l1li: ... a I I I I I I I I I I I I I I I I I I I I I t I I I I I I I I I I I I I I I I t I I r I I I I I I .
12.
13.
14.
15 •
16.
In what capacity did you use this report?
0 Researcher
o Educator
o Student \!
o Criminal justice agency employee
.0 Government employee other than criminal jUl!itlce • Specify
o Other· Specify
If you used this report as a governmental employee, please indicate the level of government.
o Federal o City
o State o Other· Specify ,
o County "--
If you used this report as a criminal justice agency employee, please indicate the sector in which you work.
0 Law enforcement (pollee) o Corrections 0 Legal services and prosecution o Parole
0 Public or private defense services o Criminal fustice planning agency 0 Courts or court administration o Other criminal justice agency· Specify type
0 Probation
If you used !his report as a criminal justice employee, please indicate the type of position you hold.
Mark all that apply
o Agency or Institution administrator o Program or project manager
o General program planner/evaluator/analyst o Statistician
o Budget planner/evaluator/analyst o Other· Specify
[.J Operations or management planner/evaluator/analyst
Additional comments
'-,'
;~t
~> <::::
.:-
Page 3 c"',

~CJRS REGISTRATION SD.AR·l0
The Hatlonal Criminal Justice Reference Service (HCJRS) abstracts documents published in the criminal jus. tice field. Persons who are registered with the Reference Service receive announcements of documents in their stated fields of interest and order forms for free copies of LEAA and HCJISS publications. If you are not registered with the Reference Service, and wish to be, please provtde your name and mailing address below and check the appropriate box.
Home
o Pleale send me a NCJRS Humber and slreel reglslratlon torm.
o Pleoso send me Ihe reports City Stale ZIP Codo listed below.
(Fold here) I _________________________ ... _ ... __________ ~-------------
U.S. DEP ... RTMENT OF JUSTICE Law Enforcement ..... I.tan.::., Admlnl.tratlon Washington, D.C. 20531
Director, Statistics DivisiDn
POSTAGE AND FEES PAID U.S. DEPARTMENT OF JUSTICE
JUS·436
National Criminal Justice Information and Statistics Service Law Enforcement Assistance Administration U.S. Department of Justice Washington, D.C. 20531
,
~-------------------~--~--~-----------~------~-~----(Fold here)
If you Wish to receive copies of any of Ihe Notional Criminal Justice Information and Statistics Service reports listed Inside the front cover, please list them below and include your nome and address in thf;l space prOVided above.
~~,.------------------------------------------------------------------I.
*U.S. GOVE~NWIT PRINTING OFFICEI 24\'u90/ll4

U.S. DEPARTMENT OF JUSTICE LAl" ENFORCEMENT ASSISTANCE AOMINISTRATION
WASHING'·ON. D.C. 201131
\\ II \:
\: \\
I: 1\
OFFICIAL BUSINESS PENALTY FOR PRIVA,'E USE. $300
~I
POSTAGE AND FEES PAlO U.S. DEPARTMENT OF JUSitCE
JUS-436
THIRD CLASS