crime: victims, suspects, and arrests 2009-2014
DESCRIPTION
A preliminary report released last week by the Minneapolis Police Department found that nearly two-thirds of those arrested by police over the past six years were blacks, who make up less than 20 percent of the city’s population.TRANSCRIPT

Minneapolis Police Department
INITIAL DATA ASSESSMENT
Crime: Victims, Suspects, and Arrests
2009-2014
2009-2014

Table of Contents
1. Crime and Enforcement Map: Part I, Violent Crime, and Enforcement 2. Violent Crime: Victims, suspects, arrests-2009-2014 3. Homicides with a Firearm: Victims, suspects, arrests 2009-2014 4. Non-fatal Shootings: Victims, suspects, arrests 2009-2014 5. Part I Crime: Victims, suspects, arrests 2009-2014 6. Map of UCR Marijuana Possession arrests, 2012-2014 7. UCR Marijuana Possession Arrests 2009-2014 8. Map of UCR Disorderly Conduct Arrests 2012-2014 9. Categories of Disorderly Conduct by UCR Code 10. UCR Disorderly Conduct Arrests: Victims, Suspects, Arrests 2009-2014 11. Map of UCR Vagrancy Arrests: 2012-2014 12. UCR Vagrancy Arrests: 2009-2014 13. UCR Juvenile Curfew and Loitering: 2009-2014 14. Graph of Juvenile Victims of Homicide: 2009-2014
Due to a common report management system, arrest data includes police efforts by the Minneapolis Police Department, Park Police, MTPD, and in certain events, UMPD.

Crime and Enforcement 2014
2014 Citywide Part I Crime 2014 Enforcement and arrests 2014 Citywide Violent Crime

Violent Crime: 2009-2014
Victim race is determined by reporting officer, Suspect race in determined by the crime victim, Arrestee race is determined by arresting officer
Homicide, Rape, Robbery, and Aggravated Assault
Arrests Victims Suspects
Asian 2%
Black 46%
Native American
5%
Other 15%
Pacific Islander
0%
Unknown 2%
White 30%
Asian 1%
Black 74%
Native American
5%
Other 6%
Pacific Islander
0%
Unknown 7%
White 7%
Asian 2%
Black 69%
Native American
8%
Other 5%
Unknown 1%
White 15%

Homicides with a Firearm 2009-2014
Arrests
Asian 1%
Black 79%
Native American
7%
Other 3%
Unknown 4%
White 6%
Asian 1%
Black 79%
Native American
2%
Other 3%
White 15%
Victims
Asian 1%
Black 57%
Native American
8%
Other 5%
Unknown 26%
White 3%
Suspects
Victim race is determined by reporting officer, Suspect race in determined by the crime victim, Arrestee race is determined by arresting officer
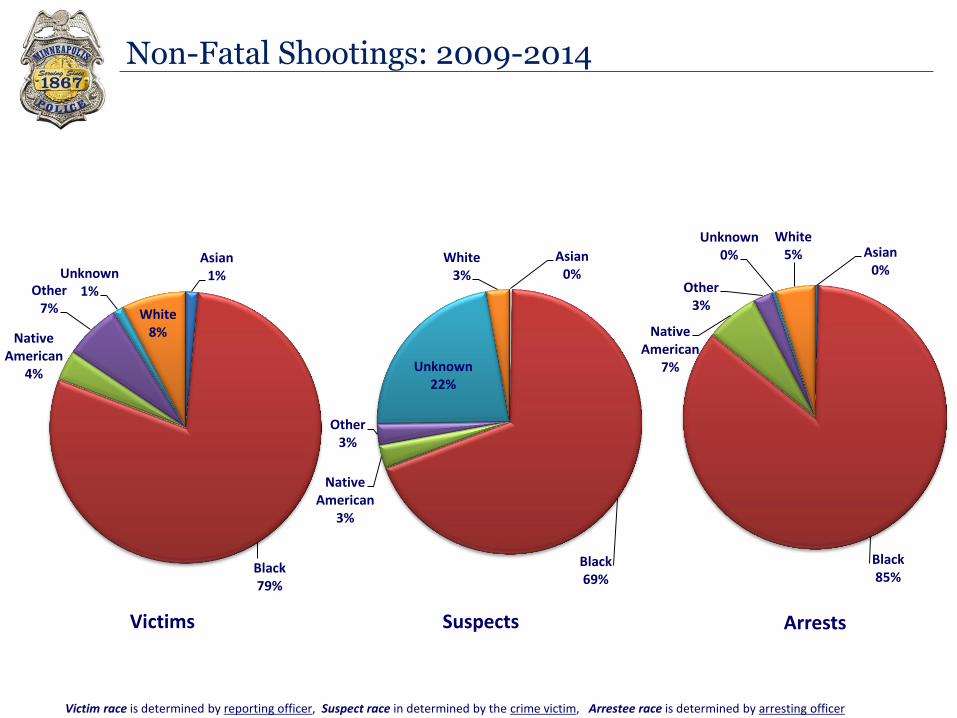
Non-Fatal Shootings: 2009-2014
Asian 0%
Black 85%
Native American
7%
Other 3%
Unknown 0%
White 5% Asian
0%
Black 69%
Native American
3%
Other 3%
Unknown 22%
White 3%
Asian 1%
Black 79%
Native American
4%
Other 7%
Unknown 1%
White 8%
Arrests Victims Suspects
Victim race is determined by reporting officer, Suspect race in determined by the crime victim, Arrestee race is determined by arresting officer

Part I Crime: 2009-2014
Part I Crime is Homicide, Rape, Robbery, Aggravated Assault, Burglary, Larceny, Auto Theft, and Arson
Arrests Victims Suspects
Asian 1%
Black 62%
Native American
9%
Other 6%
Pacific Islander
0%
Unknown 1%
White 21%
Asian 1%
Black 52%
Native American
4%
Other 5%
Pacific Islander
0%
Unknown 27%
White 11%
Asian 3%
Black 23%
Native American
2%
Other 10%
Pacific Islander
0% Unknown
6%
White 56%

UCR Arrests for Marijuana Possession Marijuana Possession Arrests Maps display arrests for UCR Marijuana
Possession (black dots)
2012 2013 2014

Arrests under UCR “Marijuana Possession” Index
Arrests for Marijuana Possession
1.94%
Other Minneapolis
arrests:
98%
Arrests for Marijuana Possession are approximately 1.94% of all arrests made in Minneapolis in a given year
(Races not shown Asian, Native American, and Pacific Islander)
This arrest category includes: • Narcotics violations • Marijuana in Motor Vehicle • Possession of Prescription Drugs • Sell Simulated Narcotics
Year Total Arrest White Black Other %White %Black %Other
2009 1209 255 810 76 21.09% 67.00% 6.29%
2010 1161 230 798 93 19.81% 68.73% 8.01%
2011 897 218 590 49 24.30% 65.77% 5.46%
2012 967 239 629 66 24.72% 65.05% 6.83%
2013 863 201 561 74 23.29% 65.01% 8.57%
2014 1809 411 1182 116 22.72% 65.34% 6.41%

UCR “Disorderly Conduct” Arrests Disorderly Conduct Arrests
Maps display arrests for UCR Disorderly Conduct Categories (blue dots)
2014 2012 2013
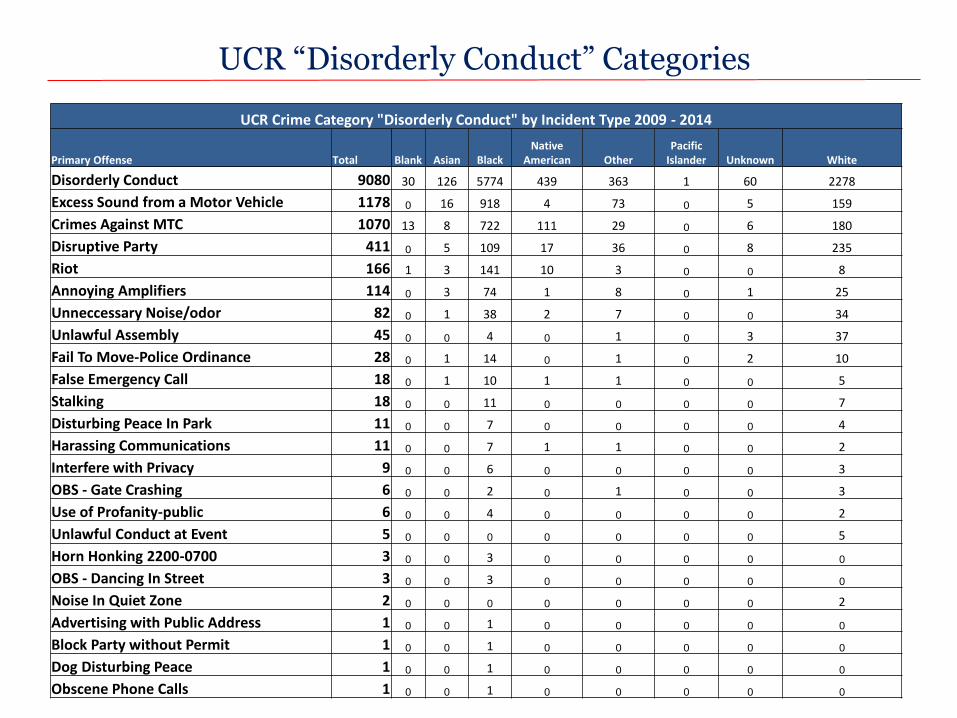
UCR “Disorderly Conduct” Categories
UCR Crime Category "Disorderly Conduct" by Incident Type 2009 - 2014
Primary Offense Total Blank Asian Black Native
American Other Pacific
Islander Unknown White
Disorderly Conduct 9080 30 126 5774 439 363 1 60 2278
Excess Sound from a Motor Vehicle 1178 0 16 918 4 73 0 5 159
Crimes Against MTC 1070 13 8 722 111 29 0 6 180
Disruptive Party 411 0 5 109 17 36 0 8 235
Riot 166 1 3 141 10 3 0 0 8
Annoying Amplifiers 114 0 3 74 1 8 0 1 25
Unneccessary Noise/odor 82 0 1 38 2 7 0 0 34
Unlawful Assembly 45 0 0 4 0 1 0 3 37
Fail To Move-Police Ordinance 28 0 1 14 0 1 0 2 10
False Emergency Call 18 0 1 10 1 1 0 0 5
Stalking 18 0 0 11 0 0 0 0 7
Disturbing Peace In Park 11 0 0 7 0 0 0 0 4
Harassing Communications 11 0 0 7 1 1 0 0 2
Interfere with Privacy 9 0 0 6 0 0 0 0 3
OBS - Gate Crashing 6 0 0 2 0 1 0 0 3
Use of Profanity-public 6 0 0 4 0 0 0 0 2
Unlawful Conduct at Event 5 0 0 0 0 0 0 0 5
Horn Honking 2200-0700 3 0 0 3 0 0 0 0 0
OBS - Dancing In Street 3 0 0 3 0 0 0 0 0
Noise In Quiet Zone 2 0 0 0 0 0 0 0 2
Advertising with Public Address 1 0 0 1 0 0 0 0 0
Block Party without Permit 1 0 0 1 0 0 0 0 0
Dog Disturbing Peace 1 0 0 1 0 0 0 0 0
Obscene Phone Calls 1 0 0 1 0 0 0 0 0
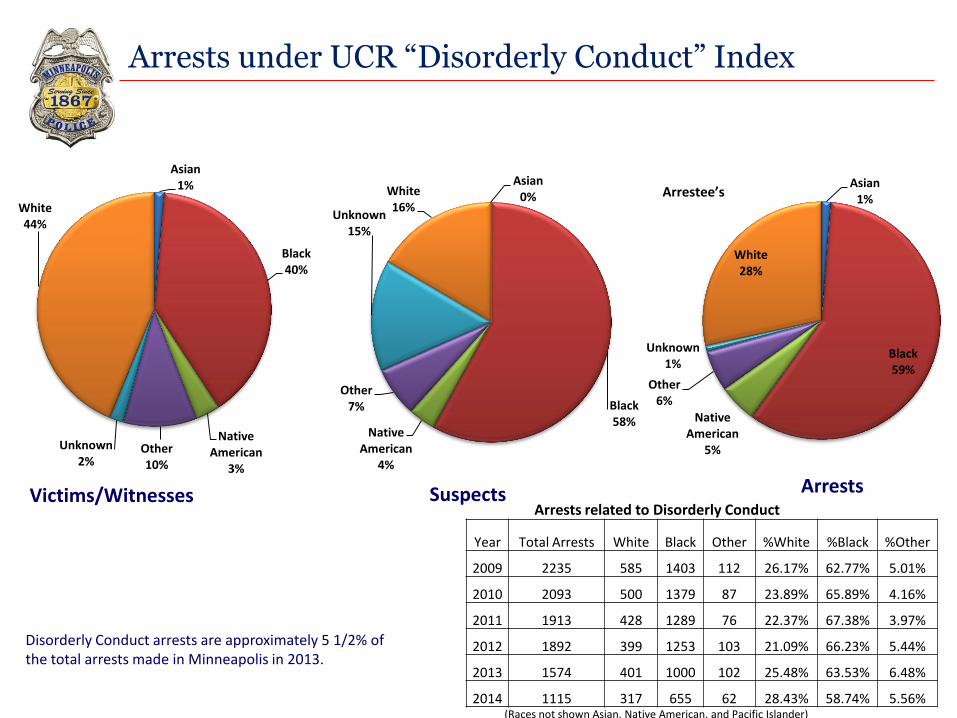
Arrests under UCR “Disorderly Conduct” Index
Disorderly Conduct arrests are approximately 5 1/2% of the total arrests made in Minneapolis in 2013.
(Races not shown Asian, Native American, and Pacific Islander)
Arrests related to Disorderly Conduct
Arrests Victims/Witnesses Suspects
Asian 1%
Black 40%
Native American
3%
Other 10%
Unknown 2%
White 44%
Asian 0%
Black 58%
Native American
4%
Other 7%
Unknown 15%
White 16%
Asian 1%
Black 59%
Native American
5%
Other 6%
Unknown 1%
White 28%
Arrestee’s
Year Total Arrests White Black Other %White %Black %Other
2009 2235 585 1403 112 26.17% 62.77% 5.01%
2010 2093 500 1379 87 23.89% 65.89% 4.16%
2011 1913 428 1289 76 22.37% 67.38% 3.97%
2012 1892 399 1253 103 21.09% 66.23% 5.44%
2013 1574 401 1000 102 25.48% 63.53% 6.48%
2014 1115 317 655 62 28.43% 58.74% 5.56%

UCR “Vagrancy” Arrests Vagrancy Arrests
Maps display arrests for UCR Vagrancy Categories (blue dots) most of these
offenses are coded BEGGAR
2014 2012 2013

Arrests under Uniform Crime Report “Vagrancy”
Vagrancy constitutes aggressive panhandling and begging. Vagrancy arrests amount to approximately 0.57% of the total arrests in Minneapolis.
“Vagrancy” Arrests: 0.57%
Other Minneapolis arrests 99%
Totals by year of arrests for vagrancy with a breakdown by race, for White, Black, and Other as shown in Minneapolis’s Report Management System (CAPRS). (Races not shown Asian, Native American, and Pacific Islander.)
Year Total Arrests White Black Other %White %Black %Other
2009 353 80 233 10 22.66% 66.01% 2.83%
2010 404 92 26 9 22.77% 6.44% 2.23%
2011 383 89 248 9 23.24% 64.75% 2.35%
2012 380 109 187 10 28.68% 49.21% 2.63%
2013 255 65 154 12 25.49% 60.39% 4.71%
2014 114 35 56 5 30.70% 49.12% 4.39%

Arrests under UCR “Curfew and Loitering” Index
Juvenile Curfew Arrests Year Total Arrests White Black Other %White %Black %Other
2009 1974 206 1302 185 10.44% 65.96% 9.37%
2010 1529 159 938 183 10.40% 61.35% 11.97%
2011 2099 291 1138 293 13.86% 54.22% 13.96%
2012 2211 356 1242 304 16.10% 56.17% 13.75%
2013 1854 359 985 254 19.36% 53.13% 13.70%
2014 1291 160 781 177 12.39% 60.50% 13.71%
7%
93%
Year Total Arrests White Black Other %White %Black %Other
2009 152 4 138 3 2.63% 90.79% 1.97%
2010 77 6 62 7 7.79% 80.52% 9.09%
2011 63 2 57 1 3.17% 90.48% 1.59%
2012 62 5 55 1 8.06% 88.71% 1.61%
2013 64 2 57 1 3.13% 89.06% 1.56%
2014 28 1 25 2 3.57% 89.29% 7.14%
0%
100%
Juvenile Loitering Arrests
Juvenile Loitering as a percent of total arrests Juvenile Curfew as a percent of total arrests
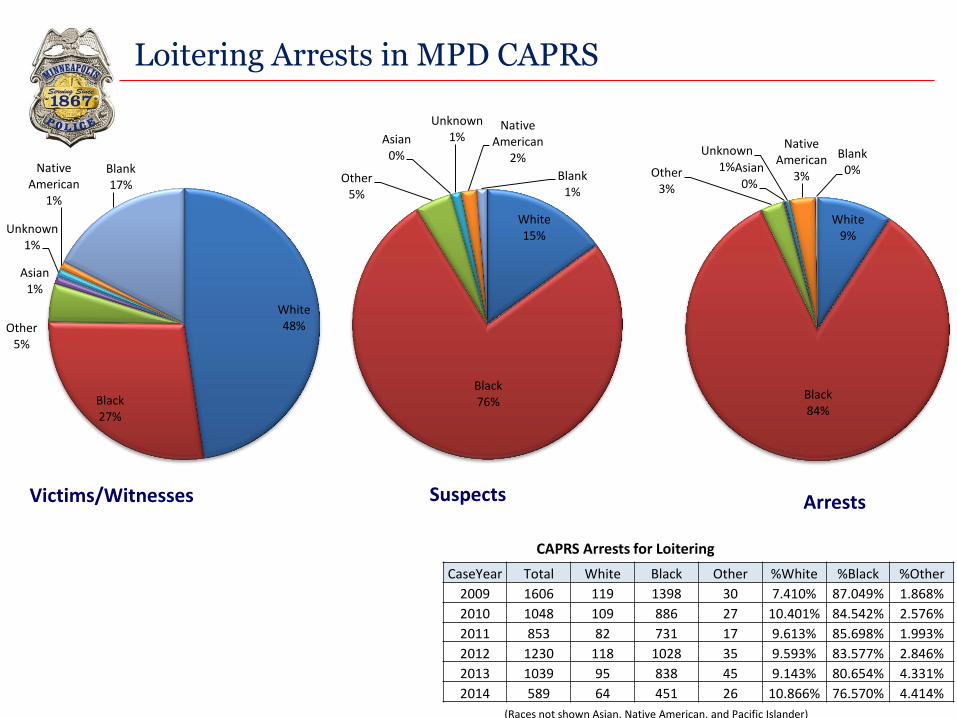
Loitering Arrests in MPD CAPRS
(Races not shown Asian, Native American, and Pacific Islander)
Arrests Victims/Witnesses Suspects
CAPRS Arrests for Loitering
White 48%
Black 27%
Other 5%
Asian 1%
Unknown 1%
Native American
1%
Blank 17%
White 15%
Black 76%
Other 5%
Asian 0%
Unknown 1%
Native American
2%
Blank 1%
White 9%
Black 84%
Other 3%
Asian 0%
Unknown 1%
Native American
3%
Blank 0%
CaseYear Total White Black Other %White %Black %Other
2009 1606 119 1398 30 7.410% 87.049% 1.868%
2010 1048 109 886 27 10.401% 84.542% 2.576%
2011 853 82 731 17 9.613% 85.698% 1.993%
2012 1230 118 1028 35 9.593% 83.577% 2.846%
2013 1039 95 838 45 9.143% 80.654% 4.331%
2014 589 64 451 26 10.866% 76.570% 4.414%

Lurking Arrests in MPD CAPRS
(Races not shown Asian, Native American, and Pacific Islander)
Arrests Victims/Witnesses Suspects
White 69%
Black 12%
Other 7%
Asian 2%
Unknown 7%
Native American
2%
Blank 1%
White 20%
Black 60%
Other 13%
Asian 2%
Unknown 3%
Native American
2%
Blank 0%
White 24%
Black 59%
Other 6%
Asian 1%
Unknown 2%
Native American
8% Blank 0%
CaseYear Total White Black Other %White %Black %Other
2009 55 12 39 1 21.8% 70.9% 1.8%
2010 58 18 30 4 31.0% 51.7% 6.9%
2011 87 16 54 12 18.4% 62.1% 13.8%
2012 66 23 30 2 34.8% 45.5% 3.0%
2013 70 15 46 3 21.4% 65.7% 4.3%
2014 56 11 34 0 19.6% 60.7% 0.0%
CAPRS Arrests for Lurking

• Weaknesses in MPD records management system pertaining to traffic violations and enforcement.
• Data collection is inconsistent throughout
• 38 nature codes for traffic incidents and arrests
• TLE is a miscellaneous category where 3089 incidents become 5379 charges. – 22% were categories relating to no driver’s license
– 22% no insurance or no proof.
• 2014 CAPRS traffic offenses and arrests are 71% MPD, 17% Transit Police, 7% Park Police, and 5% UMPD
• District Court Citation Database has 17,463 citations for 2014
– 52% of citations have no racial demographic data
– Jaywalking, a slang term for Pedestrian Crossing Between Adjacent Semaphores shows 7 violations since 2011, 5 black and 2 white violators.
– Spitting on the Sidewalk is used sporadically but 28 citations in the database since 2011 with 0 reported in 2014. Thirteen (13) have no racial data. But the justification for the stop is in the citation data and its reasonable.
– Vehicle tail light equipment violations fall in different definitions and categories • 15 citations since 2011 with 7 citations lacking race data .
•
Traffic and other Low Level Stops

TLE Arrests in MPD CAPRS
(Races not shown Asian, Native American, and Pacific Islander)
Arrests Victims/Witnesses Suspects
CAPRS Arrests for TLE
CaseYear Total White Black Other %White %Black %Other
2009 746 220 375 109 29.5% 50.3% 14.6%
2010 661 148 372 101 22.4% 56.3% 15.3%
2011 555 140 328 65 25.2% 59.1% 11.7%
2012 540 135 299 69 25.0% 55.4% 12.8%
2013 516 141 259 75 27.3% 50.2% 14.5%
2014 521 120 293 65 23.0% 56.2% 12.5%
White 64%
Black 20%
Other 4%
Asian 1%
Unknown 2%
Blank 9%
White 40%
Black 40%
Other 0%
Asian 0%
Unknown 10%
Blank 0%
Native American
10% White 26%
Black 55%
Other 14%
Asian 2%
Unknown 2%
Blank 0%
Native American
1%
Pacific Islander
0%

Juvenile Victims of Homicide 2009-2014
Black 87 ½%
Native American 12 1/2%
Year Black Native American
2009 2 1
2010 4 1
2011 3
2012 2
2013 0
2014 3
• 12 were the result of handguns, 3 from Child Abuse, 1 from Knife
Juvenile Homicide Victims