crisil risk and infrastructure solutions limited vision for ner - draft for... · directorate...
TRANSCRIPT

Directorate General of Hydrocarbons (DGH)
Hydrocarbon Vision 2030 for Northeast India
Final Report
November 2015
CRISIL Risk and Infrastructure Solutions Limited

[iii]
Contents
Executive Summary ........................................................................................................................ 3
Background ................................................................................................................................... 23
Introduction ........................................................................................................................... 23
Content of this Report ........................................................................................................... 24
Brief Description of Northeast India .............................................................................................. 25
Demographic Profile of Northeast India ................................................................................ 26
Projected Population Growth in Northeast India ................................................................... 34
Macroeconomic Profile of Northeast India ............................................................................ 34
Assam ...................................................................................................................... 34
Arunachal Pradesh .................................................................................................. 35
Manipur .................................................................................................................... 36
Meghalaya ............................................................................................................... 37
Tripura ..................................................................................................................... 37
Mizoram ................................................................................................................... 38
Nagaland ................................................................................................................. 39
Sikkim ...................................................................................................................... 39
Comparison of Per Capita Income in with National average ................................... 40
Financial Inclusion in Northeast India ................................................................................... 40
Oil & Gas Sector Outlook in Northeast India ................................................................................ 42
Sedimentary Basins .............................................................................................................. 42
Hydrocarbon Resources ....................................................................................................... 42
Crude Oil & Gas Discoveries in Northeast India ................................................................... 43
Blocks awarded under Nomination regime .............................................................. 44
Blocks awarded under PSC regime......................................................................... 45
Hydrocarbon Value Chain – North East India ....................................................................... 51
Upstream ................................................................................................................. 52
Midstream ................................................................................................................ 53
Downstream ............................................................................................................. 53
Upstream ...................................................................................................................................... 55
Crude Oil & Natural Gas Production in NER ........................................................................ 55
Current Scenario...................................................................................................... 55
Future Outlook- Expected Production ..................................................................... 57

[iv]
Key Issues in upstream sector ................................................................................ 62
Action Areas for Upstream Sector ........................................................................... 63
Zero Phase of Exploration ..................................................................................... 100
Midstream ................................................................................................................................... 102
Crude Oil Pipeline ............................................................................................................... 102
Existing Crude Oil Pipeline Network in Northeast India ........................................ 102
Upcoming Crude Oil Pipeline Network in Northeast India ..................................... 103
Natural Gas Pipelines Network in Northeast India ............................................................. 103
Exiting Natural Gas Pipelines Network in Northeast India .................................... 103
Planned Natural Gas Pipelines Network in Northeast India .................................. 105
Product Pipelines in Northeast India................................................................................... 106
Existing Product Pipelines in Northeast India ........................................................ 106
Upcoming Product Pipelines in Northeast India .................................................... 107
LPG Pipeline network in Northeast India ............................................................... 108
Issues and Challenges ....................................................................................................... 108
Capacity of Pipelines ............................................................................................. 108
Policy Issues .......................................................................................................... 111
Key Action Areas ................................................................................................................ 111
Increase pipeline capacity ..................................................................................... 112
Policy Level Action Areas ...................................................................................... 117
Action Plan .......................................................................................................................... 119
Proposed Energy Corridor .................................................................................................. 123
Suggestions for VGF Model ................................................................................................ 124
Case Study –Public Private Partnership (PPP) Model for Pipelines .................................. 125
Downstream Infrastructure ......................................................................................................... 127
Refining Capacity ................................................................................................................ 127
Existing Refining Capacity in Northeast India ....................................................... 127
Future outlook - expansion of refining capacity in Northeast India ....................... 127
Assessment of future refining capacity in Northeast India .................................... 128
Demand-Supply Assessment of POL Products in Northeast India .................................... 130
Existing demand of POL products in Northeast India............................................ 130
Existing Supply and Consumption of POL products in NER ................................. 131
Future outlook- Demand of POL products by 2030 ............................................... 133
Mapping demand-supply of POL products in Northeast India ............................... 141
[v]
Special Products in NER refineries ....................................................................... 143
Storage of POL Products in Northeast India ......................................................... 147
Demand-Supply Assessment of Natural Gas ..................................................................... 151
Existing Consumption of natural gas in Northeast India ....................................... 151
Future outlook - Gas Demand Estimation ............................................................. 152
Natural Gas Demand-Supply Scenario in Northeast India .................................... 157
Key Issues/ Concerns ......................................................................................................... 157
Refining Capacity and POL Products .................................................................... 157
Natural Gas ............................................................................................................ 160
Key Action Areas ................................................................................................................ 161
Refining Capacity................................................................................................... 161
Increasing consumption of POL Products ............................................................. 162
Increase Demand of Natural Gas .......................................................................... 172
Action Plan .......................................................................................................................... 174
Skill Development ....................................................................................................................... 183
Background ......................................................................................................................... 183
Educational Set up/Facilities available in NER ................................................................... 184
Team composition for E&P Activities .................................................................................. 185
Course wise detail............................................................................................................... 188
Manpower requirement in NER by ONGC & OIL ............................................................... 192
Supply of Manpower .............................................................................................. 193
Demand and Supply analysis ................................................................................ 194
Initiatives by Central Government/State Government ........................................................ 195
Setting up of premier institutes to cater to Oil & Gas Human resource ................. 195
Setting up of National Skill Development Corporation .......................................... 196
Key Issues .......................................................................................................................... 196
Action Plan for Skill Development....................................................................................... 197
Key action areas .................................................................................................... 197
Action Plan ............................................................................................................. 197
Infrastructure Gaps ..................................................................................................................... 199
Key Action Areas ................................................................................................................ 199
Manipur .................................................................................................................. 199
Tripura ................................................................................................................... 200
Arunachal Pradesh ................................................................................................ 200

[vi]
Mizoram ................................................................................................................. 201
Assam .................................................................................................................... 201
Action Plan .......................................................................................................................... 202
Law and Order ............................................................................................................................ 206
Key Action Areas ................................................................................................................ 206
Action Plan .......................................................................................................................... 206
Trade Opportunity with Neighbouring Countries ........................................................................ 208
Myanmar ............................................................................................................................. 208
Refining Capacity................................................................................................... 208
Crude Oil ................................................................................................................ 209
Natural Gas ............................................................................................................ 209
Bangladesh ......................................................................................................................... 209
Refining Capacity................................................................................................... 209
Crude Oil ................................................................................................................ 209
Natural Gas ............................................................................................................ 210
Nepal 210
Bhutan 210
Sri Lanka ............................................................................................................................. 211
Refining Capacity................................................................................................... 211
Crude Oil ................................................................................................................ 211
Natural Gas ............................................................................................................ 211
Trade Opportunity ............................................................................................................... 212
Petroleum Products ............................................................................................... 212
Natural Gas ............................................................................................................ 213
Make in India ............................................................................................................................... 214
Key sectors ......................................................................................................................... 214
Make in India – Oil & Gas Sector ........................................................................................ 214
Make in India – NER focus .................................................................................... 215
Upstream ............................................................................................................... 215
Midstream .............................................................................................................. 215
Downstream ........................................................................................................... 215
Other Industries around oil and Gas...................................................................... 216
Imports in NER ...................................................................................................... 216
Action Plan .......................................................................................................................... 216
[vii]
Health/Medical services .............................................................................................................. 219
Objectives of National Health Mission: ............................................................................... 219
Initiatives under NHM ......................................................................................................... 219
Action Plan .......................................................................................................................... 220
Development of Vision 2030 ....................................................................................................... 221
Vision Statement ................................................................................................................. 221
Appendix ..................................................................................................................................... 223
Power Transmission Infrastructure in Northeast India........................................................ 223
Need for Power Transmission network in Northeast India .................................... 223
Existing Transmission Infrastructure in Northeast India ........................................ 223
State specific issues ........................................................................................................... 224
Assam .................................................................................................................... 224
Manipur .................................................................................................................. 225
Nagaland ............................................................................................................... 226
Tripura ................................................................................................................... 227
Meghalaya ............................................................................................................. 227
Mizoram ................................................................................................................. 228
Arunachal Pradesh ................................................................................................ 228
Annexure I: Abbreviation ..................................................................................................................... 229
Annexure II: Demographic and Macroeconomic Indicators of NER ................................................... 233
Annexure III: Tax Structure in existing PSCs ...................................................................................... 234
Annexure IV: Service Hubs ................................................................................................................. 235
Annexure V: OTPC Power Plant, Tripura ........................................................................................... 236
Annexure VI: National Gas Grid .......................................................................................................... 238
Annexure VII: Kharsang Block ............................................................................................................ 239
Annexure VIII: Major Projects/Schemes Underway ............................................................................ 242
Annexure IX: Cash Flow analysis for 7 and 12 years Tax Holiday .................................................... 245
Annexure X: Details of Oil & Gas resource conversion in NER .......................................................... 247
Annexure XI: Analysis of Revenue to states for increased Production of Oil & Gas .......................... 249

[viii]
List of Tables
Table 1: Demographic profile of Assam ................................................................................................ 26
Table 2: Demographic profile of Arunachal Pradesh ............................................................................ 27
Table 3: Demographic profile of Manipur .............................................................................................. 28
Table 4: Demographic profile of Meghalaya ......................................................................................... 29
Table 5: Demographic profile of Mizoram ............................................................................................. 30
Table 6: Demographic profile of Nagaland ........................................................................................... 31
Table 7: Demographic profile of Tripura ............................................................................................... 32
Table 8: Demographic profile of Sikkim ................................................................................................ 33
Table 9: Demographic profile of Northeast India .................................................................................. 33
Table 10: Projected Population in Northeast India ............................................................................... 34
Table 11: Macroeconomic Indicators of Assam .................................................................................... 35
Table 12: Macroeconomic Indicators of Arunachal Pradesh ................................................................ 36
Table 13: Macroeconomic Indicators of Manipur .................................................................................. 36
Table 14: Macroeconomic Indicators of Meghalaya ............................................................................. 37
Table 15: Macroeconomic Indicators of Tripura.................................................................................... 38
Table 16: Macroeconomic Indicators of Mizoram ................................................................................. 38
Table 17: Macroeconomic Indicators of Nagaland ............................................................................... 39
Table 18: Macroeconomic Indicators of Sikkim .................................................................................... 39
Table 19: Per Capita Net State Domestic Product at Constant (2004-05) Prices ................................ 40
Table 20: Financial Inclusion Indicators in Northeast India .................................................................. 41
Table 21: Prognosticated hydrocarbon resources in Northeast India ................................................... 43
Table 22: Status of Oil & Gas exploration in Northeast India ............................................................... 44
Table 23: Status of PEL blocks under Nomination regime ................................................................... 45
Table 24: Status of PML of Nomination blocks ..................................................................................... 45
Table 25: Status of pre-NELP operated blocks in Northeast India ....................................................... 46
Table 26: Status of NELP blocks operated by OIL in Northeast India .................................................. 46
Table 27: Status of NELP blocks operated by ONGC in Northeast India ............................................. 47
Table 28: Status of NELP blocks operated by private operators in Northeast India............................. 48
Table 29: Hydrocarbon discoveries under PSC in NER as on May, 2015 ........................................... 50
Table 30: Oil and Gas Production in NER ............................................................................................ 55
Table 31 : Historical Crude oil production from North East Region (in MMTPA) .................................. 55
Table 32: Historical Gas Production from North East (in MMSCM) ...................................................... 56

[ix]
Table 33: Production Forecast for Crude Oil in NER (in MMTPA) (without indicative)......................... 59
Table 34: Production Forecast for Crude Oil in NER (in MMTPA) (with indicative) .............................. 59
Table 35: Production Forecast for Natural Gas in NER (in MMSCMD) (without indicative) ................. 61
Table 36: Production Forecast for Natural Gas in NER (in MMSCMD) (with Indicative) ...................... 61
Table 37: Action plan for PEC ............................................................................................................... 68
Table 38: Total Prognosticated, Established & recoverable Reserves in NER in MMTOE for ONGC and
OIL ......................................................................................................................................................... 73
Table 39: Conversion percentage of Prognosticated to Recoverable .................................................. 74
Table 40: Action Plan for increasing production from NER .................................................................. 74
Table 41: Blocks in Nagaland and DAB area ........................................................................................ 79
Table 42: Action plan for disputed area between Nagaland and Assam .............................................. 80
Table 43: Indicative Capital Cost for hydrocarbon blocks in India (USD/BOE) .................................... 82
Table 44: Indicative average operating cost for hydrocarbon blocks in India in USD/BOE .................. 83
Table 45: Key Issues in terms of Capital and Operating expenditure in Northeast India ..................... 84
Table 46: Challenging blocks of Oil India .............................................................................................. 85
Table 47: Nomination blocks of ONGC ................................................................................................. 86
Table 48: Action Plan for Special Category challenging blocks in NER ............................................... 86
Table 49: Key Assumptions for cost comparison .................................................................................. 87
Table 50: Key Issues/ Concerns related to service providers in Northeast India ................................. 88
Table 51: Service Hub Identification Matrix for NER ........................................................................... 90
Table 52: Action Plan for promoting availability of service providers in Northeast India ...................... 91
Table 53: Relinquished area which may be useful for OIL ................................................................... 95
Table 54: Relinquished areas of ONGC under the nomination regime ................................................ 96
Table 55: Details of blocks relinquished under PSC regime ................................................................. 98
Table 56: Action Plan for Policy framework and approvals .................................................................. 98
Table 57: Action Plan for Zero phase of exploration ........................................................................... 101
Table 58 Advantages/ Disadvantage of Pipeline Transport ................................................................ 102
Table 59: Capital and operating cost of different Modes .................................................................... 102
Table 61 Crude Oil Pipelines in NER .................................................................................................. 103
Table 62: Existing natural gas pipelines in Northeast India ................................................................ 104
Table 63: Existing Product and LPG Pipelines in Northeast India ...................................................... 106
Table 64: Transportation of petroleum products using various modes in Northeast India ................. 106
Table 65: Proposed POL pipelines in NER ......................................................................................... 107
Table 66: Gas Flare in Northeast India in MMSCMD ......................................................................... 110
Table 67: Location of Flare of Gas in Northeast India ........................................................................ 110

[x]
Table 68: Proposed LPG pipelines ..................................................................................................... 116
Table 69: Details of the proposed pipelines in Northeast India .......................................................... 118
Table 70: Action Plan for Midstream sector in Northeast India ........................................................... 119
Table 71: Map of Proposed Energy Corridor in Northeast India ......................................................... 123
Table 72: Pipelines proposed under VGF Model ................................................................................ 124
Table 73: Pipeline routes having common Right of Way (RoW) ......................................................... 125
Table 74: Refining Capacity of NER as on 31.03.2015 ...................................................................... 127
Table 75: Consumption of POL in NER States in 2014-15 (TMTPA) ................................................. 128
Table 76: POL product consumption in NER vis-à-vis India (MMTPA) .............................................. 130
Table 77: Existing Consumption of POL products in Northeast India (TMMTPA) .............................. 130
Table 78: Existing Supply and Consumption of POL products in Northeast India (TMTPA) .............. 131
Table 79: State-wise historical Consumption of POL products in Northeast India (TMTPA) ............. 134
Table 80: Growth in consumption of POL products in Northeast India (CAGR 5Y 2009-10 to 2014-15)
............................................................................................................................................................ 135
Table 81: Growth in consumption of POL products in Northeast India (MMTPA) .............................. 138
Table 82: Demand in TMTPA for POL products in Assam ................................................................. 138
Table 83: Demand in TMTPA for POL products in Arunachal Pradesh ............................................. 138
Table 84: Demand in TMTPA for POL products in Manipur ............................................................... 139
Table 85: Demand in TMTPA for POL products in Meghalaya ........................................................... 139
Table 86: Demand in TMTPA for POL products in Mizoram .............................................................. 139
Table 87: Demand in TMTPA for POL products in Nagaland ............................................................. 140
Table 88: Demand in TMTPA for POL products in Tripura ................................................................. 140
Table 89: Demand in TMTPA for POL products in Sikkim .................................................................. 140
Table 90: Total demand in NER in TMTPA ......................................................................................... 141
Table 91: Demand- Supply gap at product level (MMTPA) ................................................................ 142
Table 92: LPG production in northeast India ...................................................................................... 143
Table 93: Cost for setting up of bio-refinery at Numaligarh ................................................................ 145
Table 94: Feedstock requirement and planned production of ethanol and other products ................ 145
Table 95: MS Production from NRL refinery ( TMTPA) ...................................................................... 145
Table 96: Storage Facilities in Northeast India as on April, 2015 ....................................................... 147
Table 97: existing bottling Plants in Northeast India ........................................................................... 147
Table 98: Product wise tankage capacity in Northeast India .............................................................. 149
Table 99: Aviation Fuel Stations in Northeast India ............................................................................ 149
Table 100: Initiatives undertaken by IOCL to increase the penetration/supply in NER Areas ........... 151
Table 101: Demand of Natural Gas in Northeast India (MMSCMD) in 2014-15 ................................. 152

[xi]
Table 102: Projected Demand from CGD Sector (MMSCMD) ........................................................... 154
Table 103: Projected Demand from Power Sector (MMSCMD) ......................................................... 154
Table 104: Projected Demand from Refinery and related Sector (MMSCMD) ................................... 155
Table 105: Projected Demand from Industrial Consumers (MMSCMD) ............................................. 155
Table 106: Projected Demand from Cracker Plants and plastic units (MMSCMD) ............................ 156
Table 107: Projected Demand from Fertilizer Plants (MMSCMD) ...................................................... 156
Table 108: Total projected demand of Natural Gas in Northeast India (MMSCMD) .......................... 156
Table 109: Natural Gas demand-supply scenario in Northeast India (MMSCMD) ............................. 157
Table 110: Issues with refining capacity and production of POL products in Northeast India ............ 157
Table 111: Issues with Natural Gas market in Northeast India ........................................................... 160
Table 112: LPG Balance in 2030 ........................................................................................................ 165
Table 113: Port handling facilities at Chittagong Port ......................................................................... 166
Table 114: Cargo Storage space available at Chittagong Port........................................................... 166
Table 115: Production forecast of Naptha in Northeast India (TMTPA) ............................................. 167
Table 116: Quantity of gas which is flared in NER (mmscmd) ........................................................... 169
Table 117: Evacuation Arrangement Proposed for Flared Gas .......................................................... 169
Table 118: Demand potential of POL products in neighbouring countries (MMTPA) ......................... 171
Table 119: Quantity of Gas required (MMSCMD) to offset LPG Requirement ................................... 172
Table 120: List of cities identified for CGD in future ........................................................................... 173
Table 121: Action Plan for Downstream segment .............................................................................. 174
Table 122: Sample list of major skill set requirement for E&P industry .............................................. 183
Table 123: List of Educational institutes in NER ................................................................................. 184
Table 124: Team Composition during Exploratory Drilling (Acquisition phase) .................................. 185
Table 125: Team Composition during Exploratory Drilling (Subsurface) ............................................ 186
Table 126: Team Composition during Development Drilling .............................................................. 187
Table 127: Team Composition during Production/Processing ........................................................... 187
Table 128 List of courses for ITI and Diploma in Arunachal Pradesh................................................. 188
Table 129: List of courses for ITI and Diploma in Meghalaya............................................................ 189
Table 130: List of courses for ITI and Diploma in Manipur ................................................................. 190
Table 131: List of courses for ITI and Diploma in Tripura ................................................................... 190
Table 132: List of courses for ITI and Diploma in Nagaland ............................................................... 191
Table 133: List of courses for ITI and Diploma in Assam ................................................................... 191
Table 134: List of courses for ITI and Diploma in Mizoram ................................................................ 192
Table 135: Manpower requirement by ONGC & OIL .......................................................................... 193
[xii]
Table 136: Manpower requirement by ONGC & OIL (yearly) ............................................................. 193
Table 137: Supply of technical Manpower .......................................................................................... 194
Table 138: Demand Supply of Technical Manpower .......................................................................... 194
Table 139: Action plan for Skill development ...................................................................................... 197
Table 140: Action plan for Infrastructure Development ...................................................................... 202
Table 141: Action Plan for law and order issues in Northeast India ................................................... 206
Table 142: Petroleum product import Requirement for Myanmar (MMTPA) ...................................... 208
Table 143: Petroleum product import Requirement for Bangladesh (MMTPA) .................................. 209
Table 144: Petroleum product import Requirement for Nepal (MMTPA) ............................................ 210
Table 145: Petroleum product import Requirement for Myanmar (MMTPA) ...................................... 211
Table 146: Action Plan for Make in India program in NER ................................................................. 217
Table 147: Action Plan for Health /medical services .......................................................................... 220
Table 148: Existing Power transmission network in Northeast India .................................................. 223
Table 149: Advantages of Onne Oil and Gas Free Zone ................................................................... 235

[xiii]
List of Figures
Figure 1: Map of Northeast India .......................................................................................................... 25
Figure 2: Geographical Map of Assam ................................................................................................. 26
Figure 3: Geographical Map of Arunachal Pradesh .............................................................................. 27
Figure 4: Geographical Map of Manipur ............................................................................................... 28
Figure 5: Geographical Map of Meghalaya ........................................................................................... 29
Figure 6: Geographical Map of Mizoram ............................................................................................... 30
Figure 7: Geographical Map of Nagaland ............................................................................................. 31
Figure 8: Geographical Map of Tripura ................................................................................................. 32
Figure 9: Geographical Map of Sikkim .................................................................................................. 33
Figure 10: Sedimentary Basins in Northeast India ............................................................................... 42
Figure 11: Prognosticated vs. Established (MMTOE) ........................................................................... 43
Figure 12: Hydrocarbon value chain in Northeast India ........................................................................ 51
Figure 13: Trend of Crude Oil and Natural Gas Production in Northeast India .................................... 57
Figure 14: Methodology for Production Forecast of Crude Oil in NER ................................................. 58
Figure 15: Production Forecast for Crude Oil in NER (in MMTPA) (Without Indicative) ...................... 58
Figure 16: Production Forecast for Crude Oil in NER (in MMTPA) (With Indicative) ........................... 59
Figure 17: Methodology for Production Forecast of Gas in NER .......................................................... 60
Figure 18: Production Forecast for Natural Gas in NER (in MMSCMD) without Indicative .................. 60
Figure 19: Production Forecast for Natural Gas in NER (in MMSCMD) (with indicative) ..................... 61
Figure 20: Production Enhancement Model.......................................................................................... 64
Figure 21: Structure of PEC Model ....................................................................................................... 65
Figure 22: Base Profile and Incremental Profile ................................................................................... 66
Figure 23: Stages for signing off the Production Enhancement Contract ............................................. 66
Figure 24: Detail Stages for signing off the Production Enhancement Contract .................................. 67
Figure 25: Map of Nagaland and DAB Area blocks .............................................................................. 79
Figure 26: Hydrocarbon resource area in Nagaland ............................................................................. 80
Figure 27: Average Capital Cost for hydrocarbon blocks in India (USD/ BOE) .................................... 83
Figure 28: Average Operating Cost for hydrocarbon blocks in India (in USD/BOE) ............................ 84
Figure 29: Geographical Map of Barauni- Siliguri-Bongaigon-Guwahati pipeline .............................. 105
Figure 30: LPG Shortage in Northeast India (TMTPA) ....................................................................... 111
Figure 31: Proposed Numaligarh-Siliguri-Parbatipur product pipeline ............................................... 113
Figure 32: Proposed Guwahati-Silchar-Imphal product pipeline ........................................................ 114
[xiv]
Figure 33: Map of proposed pipelines in NER ................................................................................... 117
Figure 37: Proposed Natural Gas pipelines in India under PPP mode ............................................... 126
Figure 35: Break-up of refinery capacity from 2015-16 to 2029-30 in NER in MMTPA ...................... 129
Figure 36: Refining capacity vis-à-vis crude oil production in Northeast India (MMTPA) ................... 129
Figure 37: Major POL products, demand supply balance in NER in 2014-15 (TMTPA) .................... 131
Figure 38: Shortage of LPG Trend in North Eastern States (TMTPA)................................................ 132
Figure 39: LPG Connection (Domestic) in Northeast India ................................................................. 133
Figure 40: Demand estimation for POL products in Northeast India .................................................. 134
Figure 41: Per Capita Consumption of POL products by north eastern states in India (in KG) ......... 135
Figure 42: Projection of demand o POL products in Northeast India (MMTPA) ................................. 136
Figure 43: Projection of demand of POL products in Northeast India (MMTPA) ................................ 137
Figure 44: Projection of demand of POL products in Northeast India (MMTPA) ................................ 137
Figure 45: Demand-supply mapping of POL products in NER (MMTPA) (Avg of CAGR 5Y & 9Y) ... 141
Figure 46: Historical LPG production trends as % of POL production in northeast India vis-à-vis India
............................................................................................................................................................ 142
Figure 47: Fuel Ethanol production in million gallons ......................................................................... 144
Figure 48: LPG bottling plants in northeast India ................................................................................ 148
Figure 49: LPG storage capacity in days in Northeast India ............................................................... 150
Figure 50: LPG coverage in Northeast India in terms of percentage of population ............................ 151
Figure 51: National Waterways- 2 ....................................................................................................... 168
Figure 52: Cascading of Gas .............................................................................................................. 170
Figure 53: Flared Gas transportation by using LNG Skid Mounting trucks ........................................ 171
Figure 54: Map of future CGD cities Phase I, II & III and CNG Highway ............................................ 173
Figure 55: Demand Potential in neighbouring countries (MMTPA) .................................................... 212
Figure 56: Guiding principles - Vision Statement ................................................................................ 221

Directorate General of Hydrocarbons (DGH)
[1] Hydrocarbon Vision 2030 for Northeast India- Final Report
Preface
The Ministry of Petroleum & Natural Gas (MoPNG), Government of India, has constituted a committee
to prepare Hydrocarbon Vision 2030 for Northeast India. The committee was formed under the
chairmanship of Shri Ajay Sawhney, Additional Secretary, MoPNG, and comprises of representatives
from Oil and Natural Gas Corporation (ONGC), Oil India Ltd (OIL), Directorate General of Hydrocarbon
(DGH), GAIL India Ltd (GAIL), Indian Oil Corporation Ltd (IOCL), Numaligarh Refinery Ltd (NRL),
Petroleum Planning & Analysis Cell (PPAC), Oil Industry Development Board (OIDB) and Engineers
India Ltd (EIL). The committee was constituted in March 2015 with the objective of preparing the vision
document for Hydrocarbons in North East.
CRISIL Risk and Infrastructure Solutions Limited (CRIS) was appointed by the Directorate General of
Hydrocarbons (DGH-MoPNG) as a knowledge partner to assist the committee in preparing the vision
document. CRIS has held discussions with various stakeholders including private /public sector
exploration & production companies, industry bodies, service providers, and domain experts
representing different segments of the hydrocarbon value chain as a part of the consultation process.
The committee members provided inputs and perespectives on operations, production and plans for
the region. Also, CRIS team visited the north-eastern region, held interactions with stakeholders and
players in Oil & Gas value chain in the region. Based on the review and analysis of respective segments,
CRIS deliberated with committee members on the possible solutions and roadmap for the region.
The committee held several meetings to review and discuss the Vision document. CRIS facilitated these
meetings with presentation and submissions. Committee members have provided data, inputs and
detailing on their respective segments to contribute to the Vision document. Following meetings of the
committee were during the period:
Particulars Date
First meeting regarding committee formation April 27, 2015
Meeting to discuss approach for Vision and issues in North East June 11, 2015
Presentation on Vision Document June 23, 2015
Discussion on status of progress with MoPNG July 01, 2015
Presentation on Draft Report by CRIS and discussions on draft
Report July 17, 2015
Presentation and discussion with Shri Dhramendra Pradhan (MoS-
MoPNG) July 28, 2015
Presentation on Final Report by CRIS and discussions on Final
Report 7th Sep, 2015

Directorate General of Hydrocarbons (DGH)
[2] Hydrocarbon Vision 2030 for Northeast India - Final Report
Accordingly, CRIS submitted its report on 31st July 2015 and had discussion along with presentation on
7th Sep 2015. After detailed deliberations with respective committee members revised version of Report
has been prepared, covering key action areas and action plan. This report is the result of analysis and
assessments based on the inputs from the committee and active coordination by DGH team. The report
captures the recommendations based on detailed discussions and reviews with the Committee
members. This report is confidential and for limited circulation to select recipients under the guidance
of MoPNG and DGH.
.

Directorate General of Hydrocarbons (DGH)
[3] Hydrocarbon Vision 2030 for Northeast India- Final Report
Executive Summary
Given its geo-strategic positioning, the North East region is an important part of India’s growth story.
The region has certain distinct advantages. It is strategically located with proximity to the major states
in the east and adjacent countries such as Bangladesh, Bhutan, China and Myanmar. The resource-
abundant north east with its expanses of farmland and a huge talent pool makes it a strategic element
for India’s development to take a leap in the 21st century. However, in spite of being endowed with
natural resources the region has lagged in leveraging its full potential with challenges on terrain and
weather conditions. The states comprising the North East region, while unique, have similar
developmental needs that merit special public and private sector interventions. While the region has
been above all India average of literacy rate, it has lagged as compared to national average in per
capita income and consequently has had lower per capita energy consumption. Energy and
hydrocarbon resources and its development hold an imporkant key for unlocking the potential of the
region.
India’s economic progress is closely linked to energy demand; therefore, as the economy expands, the
need for oil and gas is expected to grow considerably. Government of India has taken several steps in
recent months to drive investments and growth across the country. A number of nation wide initiatives
have been announced including Make in India, Swachh Bharat, Smart Cities, RuUrban to name a few.
All of these would add to spur the growth of economic activities in the country and attracting investments
in focus sectors. Government of India has also embraced several policies towards energy security.
100% Foreign Direct Investment (FDI) in many segments of the sector, including natural gas, petroleum
products, and refineries has been allowed. Further, a series of reforms have been initiated which include
new methodology for calculation of domestic gas price, Marginal Filed Policy, Give It UP, Pratyaksh
Hanstantrit Labh (PaHaL) and LPG connection to rural areas under Rajiv Gandhi Gramin Vitaran Yojana
to accelerate the overall growth of the sector and thereby promoting economic development of the
country. Moreover, recently launched ‘Give It Up' campaign to promote voluntary giving up of LPG
subsidy by domestic consumers is expected to bring down the subsidy burden of the Government of
India.
On the consumption front, there have been sustained efforts towards managing the demand of
petroleum products and ensuring availability of affordable fuel to the common people. Further, the
Ministry of Petroleum and Natural Gas has rolled out an elaborate plan to reassess hydrocarbon
resources in India’s sedimentary basins by March 2016 even as it aggressively pursues assets and
supplies overseas. It aims to construct strategic crude oil reserves of 5.33 million metric tons (MMT),
pursue transnational oil and gas pipeline projects, and enhance oil and gas production with the
assistance of exploration and production (E&P) companies, among other things.
The history of oil and gas exploration in India dates back to 19th century when production started at
Digboi in Assam. Even today, Assam contributes for about 10% of the country’s total crude oil and
natural gas production. Since then, both the national oil companies – Oil India Limited (OIL) and Oil and
Natural Gas Corporation (ONGC) – have added substantial reserves of producible hydrocarbons and
have acquired technical know-how of producing and made large investments managing complex
reservoirs with current contribution (2014-15) of around 8.5 MMT of oil plus oil-equivalent of gas
(O+OEG) from their producing assets in the north-eastern region.
The region under coverage of the current report, consists of eight states, comprising ~8% of the
country’s total geographical area and ~3% of the total population (1,210 million). The region contributed
around 2.65% to the national gross domestic product during 2014-15. The region, predominantly rural,
has over 84% of the population living in the countryside. Agriculture provides livelihood to 70% of the
Directorate General of Hydrocarbons (DGH)
[4] Hydrocarbon Vision 2030 for Northeast India - Final Report
region’s population. However, the states continue to be net importers of food grains even for their own
consumption. Significant part of the region is covered with forest, and is bestowed with abundant natural
resources.
Driven by expanding global trade and investment, the north-eastern region was in the forefront of
development almost 150 years ago. Global trade was carried out through the sea, a network of inland
waterways, and through roads and railways. However, currently, the region lags behind on several
development indicators. The region accounts for a shortfall of 8% of its power generation requirement,
and its per capita power consumption, at 258 kWh, is less than one-third of the national average (883
kWh). Literacy rate in the region is high; however the slow pace of industrialisation has led to high
unemployment rates. Further, shortage of adequate skill development infrastructure in the region has
adversely impacted the employability of the labour force, especially for the technical jobs. This is an
alarming situation for a region that holds large reserves of petroleum and natural gas, constituting one-
fifth of the country’s total potential.
The purpose of this vision document is to prepare a roadmap for the next decade-and-a-half to increase
the production of oil and gas in the Northeast India and outline the necessary investment in the
hydrocarbon sector in the region to increase exploration activities, expand the piped natural gas (PNG)
network and ensure availability of petroleum products, including liquefied petroleum gas (LPG), in the
remotest corners of the region. Northeast India will have to play an important role in achieving this target
as it is endowed with huge untapped natural resources and is acknowledged as the eastern gateway
of India’s Look-East Policy.
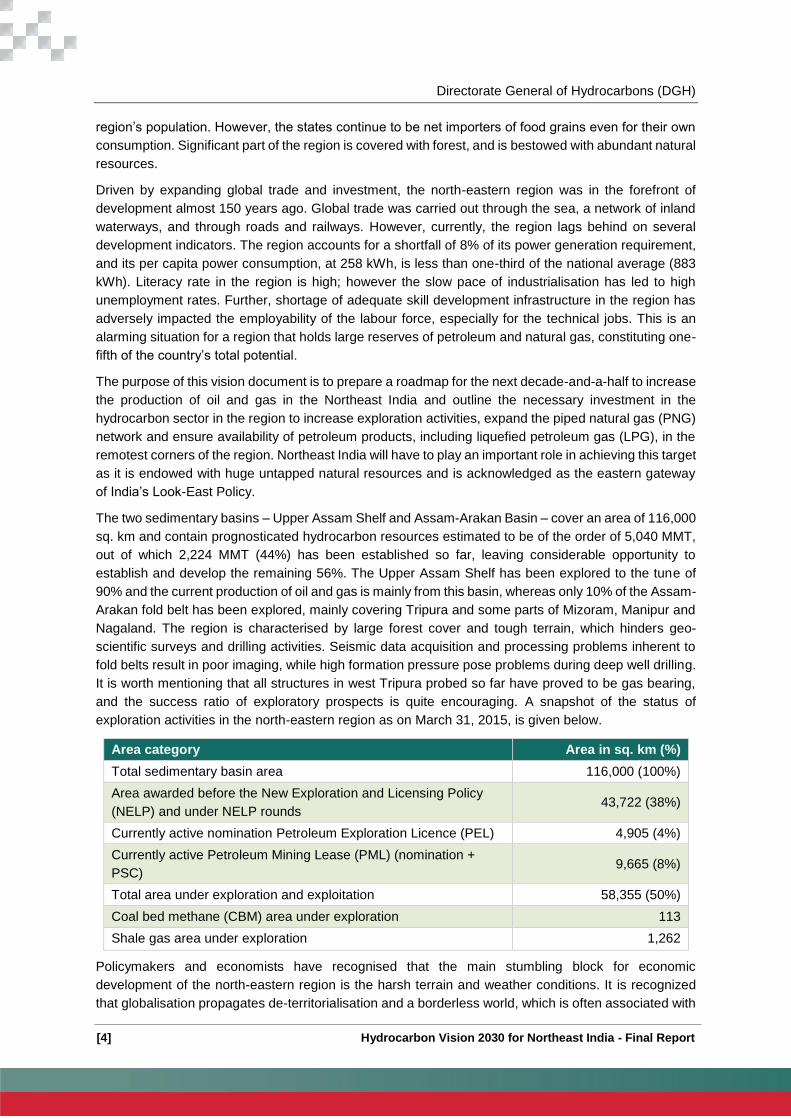
The two sedimentary basins – Upper Assam Shelf and Assam-Arakan Basin – cover an area of 116,000
sq. km and contain prognosticated hydrocarbon resources estimated to be of the order of 5,040 MMT,
out of which 2,224 MMT (44%) has been established so far, leaving considerable opportunity to
establish and develop the remaining 56%. The Upper Assam Shelf has been explored to the tune of
90% and the current production of oil and gas is mainly from this basin, whereas only 10% of the Assam-
Arakan fold belt has been explored, mainly covering Tripura and some parts of Mizoram, Manipur and
Nagaland. The region is characterised by large forest cover and tough terrain, which hinders geo-
scientific surveys and drilling activities. Seismic data acquisition and processing problems inherent to
fold belts result in poor imaging, while high formation pressure pose problems during deep well drilling.
It is worth mentioning that all structures in west Tripura probed so far have proved to be gas bearing,
and the success ratio of exploratory prospects is quite encouraging. A snapshot of the status of
exploration activities in the north-eastern region as on March 31, 2015, is given below.
Area category Area in sq. km (%)
Total sedimentary basin area 116,000 (100%)
Area awarded before the New Exploration and Licensing Policy
(NELP) and under NELP rounds 43,722 (38%)
Currently active nomination Petroleum Exploration Licence (PEL) 4,905 (4%)
Currently active Petroleum Mining Lease (PML) (nomination +
PSC) 9,665 (8%)
Total area under exploration and exploitation 58,355 (50%)
Coal bed methane (CBM) area under exploration 113
Shale gas area under exploration 1,262
Policymakers and economists have recognised that the main stumbling block for economic
development of the north-eastern region is the harsh terrain and weather conditions. It is recognized
that globalisation propagates de-territorialisation and a borderless world, which is often associated with

Directorate General of Hydrocarbons (DGH)
[5] Hydrocarbon Vision 2030 for Northeast India- Final Report
economic integration. Thus, with 98% of its borders with China, Myanmar, Bhutan, Bangladesh and
Nepal, north-eastern India appears to have a better scope for development in the era of globalisation.
In view of this, the region must look at economic integration with rest of Asia, with East and Southeast
Asia in particular.
Hydrocarbon demand-supply Snapshot
Crude oil
The present demand for crude oil for the refineries in Northeast India is around 7 million tonne per
annum (MMTPA) and is expected to increase up to 16 MMTPA by 2023-24 after the expansion of IOCL
Guwahati, IOCL Bongaigaon and Numaligarh Refinery Limited (NRL). Current supply of crude oil is
4.54 MMTPA from OIL, ONGC and other fields (2014-15) and is expected to remain at similar level
(~4.6 MMTPA) without including indicative production. However, the production including the indicative
production projection stands at 5.7 MMTPA by 2030.
Source: ONGC, OIL
Natural gas
The current supply of natural gas is around 11.3 MMSCMD (2014-15) from the north-eastern region
(OIL, ONGC and others) and is expected to increase to 15.3 MMSCMD by 2029-30. However, if
indicative production figures are also considered, the overall production can increase to 20.6 MMSCMD
over the same period. The demand for natural gas, in the north-eastern region, is expected to increase
more than two fold over the same period of time. Potential for CGD network and industrial development
could drive the demand for natural gas in northeast India to be around 29 MMSCMD by 2029-30. The
industrial development consists of proposed power projects, cracker plants, fertilizer plants, cement
industries and other industrial projects.
7.0 7.0 7.0 7.0 7.7 7.7
13.7 13.714.4
15.9 15.9 15.9 15.9 15.9 15.9 15.9
4.5 4.5 5.0 5.3 5.7 5.7 5.8 5.9 5.9 5.9 5.9 5.9 5.8 5.8 5.8 5.7
0.0
2.0
4.0
6.0
8.0
10.0
12.0
14.0
16.0
18.0
1 2 3 4 5 6 7 8 9 10 11 12 13 14 15 16
Demand and supply of crude in NER
Refinery capacity Supply from NER Blocks (with indicative)

Directorate General of Hydrocarbons (DGH)
[6] Hydrocarbon Vision 2030 for Northeast India - Final Report
Source: CRIS Analysis
Petroleum, oil and lubricant (POL) product
The overall production of POL products in the north-eastern region is at surplus as consumption in
2014-15 was around 3.2 MMTPA against the production of 6.5 MMTPA. The production is expected to
increase to 14.3 MMTPA by 2029-30 after the expansion of NRL and IOCL Guwahati/Bongaigaon
refineries and maintain a surplus with the consumption forecast of 7.3 MMTPA. However, an exception
is LPG, which currently faces a shortage and the trend is expected to continue even in 2029-30.
Source: PPAC, CRIS Analysis
Liquefied Petroleum Gas (LPG)
The production of LPG in 2014-15 was 157 thousand metric tons (TMT) as compared to the
consumption of 402 TMTPA. The consumption is expected to further increase, as LPG penetration rates
improves in the region. By 2029-30, LPG consumption in the region is expected to be around 957
TMTPA. However, LPG production is expected to be around 806 TMTPA only, which leaves a gap of
around 150 TMTPA Considering the LPG penetration target to be 80%, shortage shall be around 400
TMTPA and with 100% access target shortage shall be around 800 TMTPA in 2029-30
11.3 12.6
16.7 17.7 18.6 19.2 19.7 19.9 20.1 20.3 20.6 20.7 20.6 20.7 20.8 20.7 11.2
18.4 19.4 20.0 20.8 23.0
26.1 26.3 26.8 27.1 27.3 27.9 28.3 29.1 29.3 29.4
-
5.0
10.0
15.0
20.0
25.0
30.0
35.02
01
4-1
5
201
5-1
6
201
6-1
7
201
7-1
8
201
8-1
9
201
9-2
0
202
0-2
1
202
1-2
2
202
2-2
3
202
3-2
4
202
4-2
5
202
5-2
6
202
6-2
7
202
7-2
8
202
8-2
9
202
9-3
0
Demand-Supply of Natural Gas in NER
Supply Demand
0.0
2.0
4.0
6.0
8.0
10.0
12.0
14.0
16.0
200
5-0
6
200
6-0
7
200
7-0
8
200
8-0
9
200
9-1
0
201
0-1
1
201
1-1
2
201
2-1
3
201
3-1
4
201
4-1
5
201
5-1
6
201
6-1
7
201
7-1
8
201
8-1
9
201
9-2
0
202
0-2
1
202
1-2
2
202
2-2
3
202
3-2
4
202
4-2
5
202
5-2
6
202
6-2
7
202
7-2
8
202
8-2
9
202
9-3
0
POL demand-supply
Production Consumption

Directorate General of Hydrocarbons (DGH)
[7] Hydrocarbon Vision 2030 for Northeast India- Final Report
Source: PPAC, CRIS
Challenges in the north-eastern region
Key constraints to the growth of oil and gas industry, especially the exploration and production sector
within the industry, have been poor infrastructure and limited connectivity, both within the region as well
as with rest of the country. Today, exploration activities in the region are being carried out in hilly and
mountainous areas which pose logistical as well as environmental challenges. Moreover, the region,
connected to rest of India by a narrow stretch of land called ‘Chicken’s Neck’, needs infrastructure to
support and ensure significant investments and developmental aids. The creation of connectivity
infrastructure to aid the exploration and development activities will have far reaching impact on the
overall development of region, as it will help in unlocking larger economic potential by removing
accessibility constraints that have held back the economic development of the region.
However, the development of any kind, particularly infrastructure, in this part of India will be challenging
to say the least as infrastructure development encompasses socio-political issues such as land
acquisition and displacement of people. Therefore, to address these issues, aid from the central as well
as state governments will be vital form time to time to accelerate the completion of developmental
projects. Though a lot of improvement has taken place over the years, challenges still remain. Some of
the challenges encountered while carrying out exploration activities, particularly in the ‘New Exploration
Licensing Policy’ (NELP) blocks, include law and order issues, infrastructure gaps, unavailability of
service providers, unavailability of adequate evacuation infrastructure and lower local demand from
industry. All such issues need to be resolved at the earliest to make the investment climate of the region
more attractive for E&P companies.
Exploration and Production (E&P)
Crude oil production declined from 4.84 MMT in 2010-11 to 4.54 MMT in 2014-15 on account of
maturing fields and limitations to explore and produce oil from yet-to-find areas, coupled with no major
oil and gas discoveries over the past few years. Further, if present situation prevails, crude oil production
is likely to remain at the same level even in 2029-30. To improve oil production from matured fields,
national oil companies (NOCs) need to involve technology partners through production enhancement
contracts. New discoveries of oil and gas in the North East are critical for increasing production. This
will need pursuing new petroleum plays, leads and field growth possibilities in logistically difficult and
geologically complex areas; targeting the Frontal Belt Corridor; pursuing exploration for structural and
strati-structural prospects and improving sub-surface imaging and G&G understanding through
technology induction and reprocessing.
0
200
400
600
800
1000
12002
00
5-0
6
200
6-0
7
200
7-0
8
200
8-0
9
200
9-1
0
201
0-1
1
201
1-1
2
201
2-1
3
201
3-1
4
201
4-1
5
201
5-1
6
201
6-1
7
201
7-1
8
201
8-1
9
201
9-2
0
202
0-2
1
202
1-2
2
202
2-2
3
202
3-2
4
202
4-2
5
202
5-2
6
202
6-2
7
202
7-2
8
202
8-2
9
202
9-3
0
LPG demand-supply scenario in NER
Production of LPG Consumption of LPG
Directorate General of Hydrocarbons (DGH)
[8] Hydrocarbon Vision 2030 for Northeast India - Final Report
However, natural gas production scenario in the region has been positive over the last few years. The
production is expected to reach 20.61 MMSCMD by 2030 (includes gas production upside from Tripura),
growing at a CAGR of 4 % from current levels of 11.3 MMSCMD (2014-15). Moreover, there can be
significant increase in natural gas production in future, particularly through exploration in Manipur,
Tripura and Mizoram, which are yet to be explored.
Service providers are the backbone of any industry, more specifically for the exploration and production
industry, as spends on work outsourced to service providers are more than 60% of the total E&P costs,
which highlights the significance of service providers. This reliance is expected to continue in the future
if the country targets to explore and produce hydrocarbon resources from its vast sedimentary areas of
3.14 million sq. km. The service providers in the north-eastern region provide limited service offerings
as compared to the complete service portfolio offered elsewhere in India. The reasons for such limited
service are primarily lower business potential, inadequate connectivity infrastructure and lack of
incentives considering the high risks in the region. This is further aggravated by the law and order
problem in the region, resulting in reputed service providers and developers keeping away from the
region. This situation does not affect large NOCs as much as the small players and private E&P
operators.
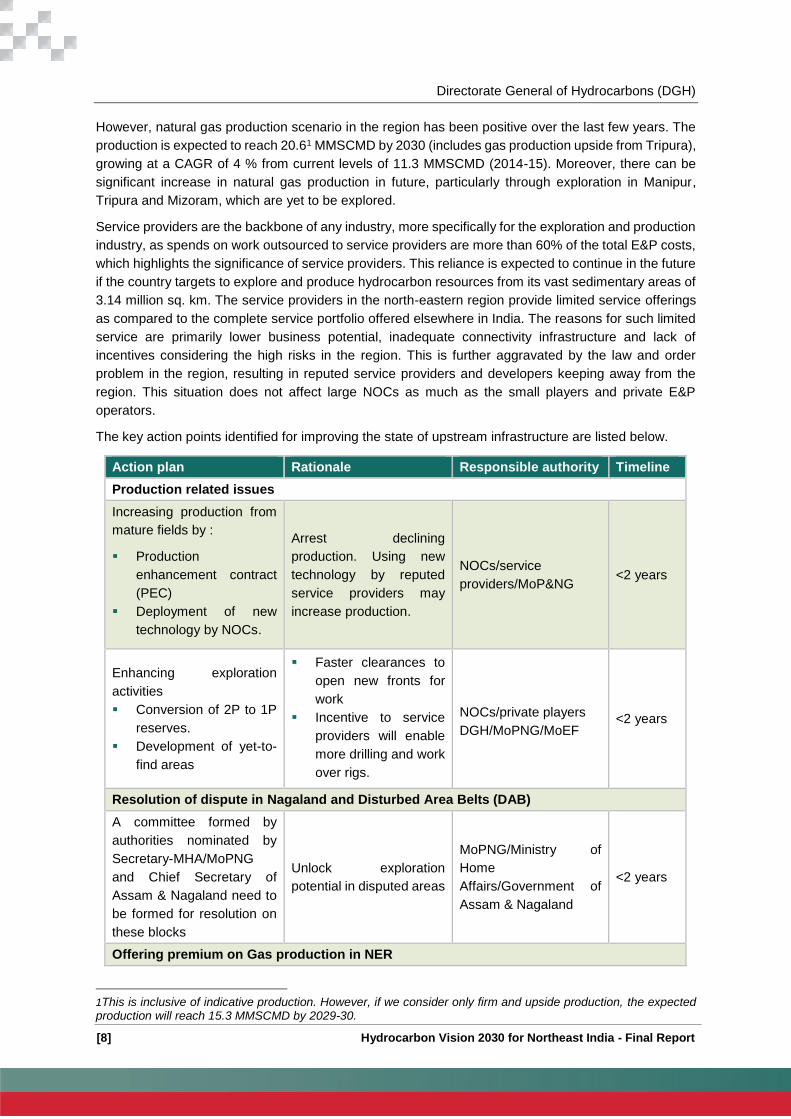
The key action points identified for improving the state of upstream infrastructure are listed below.
Action plan Rationale Responsible authority Timeline
Production related issues
Increasing production from
mature fields by :
Production
enhancement contract
(PEC)
Deployment of new
technology by NOCs.
Arrest declining
production. Using new
technology by reputed
service providers may
increase production.
NOCs/service
providers/MoP&NG <2 years
Enhancing exploration
activities
Conversion of 2P to 1P
reserves.
Development of yet-to-
find areas
Faster clearances to
open new fronts for
work
Incentive to service
providers will enable
more drilling and work
over rigs.
NOCs/private players
DGH/MoPNG/MoEF <2 years
Resolution of dispute in Nagaland and Disturbed Area Belts (DAB)
A committee formed by
authorities nominated by
Secretary-MHA/MoPNG
and Chief Secretary of
Assam & Nagaland need to
be formed for resolution on
these blocks
Unlock exploration
potential in disputed areas
MoPNG/Ministry of
Home
Affairs/Government of
Assam & Nagaland
<2 years
Offering premium on Gas production in NER
1This is inclusive of indicative production. However, if we consider only firm and upside production, the expected production will reach 15.3 MMSCMD by 2029-30.

Directorate General of Hydrocarbons (DGH)
[9] Hydrocarbon Vision 2030 for Northeast India- Final Report
Action plan Rationale Responsible authority Timeline
Provide premium on Gas
price for Gas produced from
NER Areas (Challenging
Blocks) considering high
capital cost & operational
cost. (Detailed analysis
given in section 5.1.4.4)
Incentivise gas production
and reduce dependence
on LPG
MoPNG/DGH <2 Years
Availability of service providers
NOCs to extend services to
third parties on chargeable
basis
Compensate for
unavailability of service
providers
ONGC & OIL <2 years
Development of service
provider hubs in NER area
(Jorhat & Agartala)
Achieve sustainable
increase in exploration
activity
MoPNG/Ministry of
Finance/Ministry of
Commerce
2-5 years
State policy support
Development of free
industrial zones (FIZ) or
special economic zones
(SEZ)
Develop and promote
presence of service
providers
Ministry of Commerce &
Industry/state govt. 2-5 years
Introduction of fiscal
incentives that may include
income tax holidays for 10
years for service providers
having base in the north-
eastern region
Develop and promote
presence of service
providers
MoPNG/Ministry of
Finance <2 years
Sector policy framework
Challenging blocks in the
north-eastern region to be
considered at par with deep-
water blocks in terms of
increased timelines.
Incentivise exploration
and avoid relinquishment MoPNG/DGH <2 years
Timeline needs to be
extended as 8 + 4 years (for
challenging blocks) instead
of existing 4 + 3 years (for
onshore) and 5 + 3 years
(for frontier blocks) due to
limited working cycle.
Incentivise exploration
and avoid relinquishment MoPNG/DGH <2 years
Tax holiday to be increased
to 12 years from current 7
years.
Incentivise exploration
and avoid relinquishment MoPNG/DGH <2 years
Clearance and approvals

Directorate General of Hydrocarbons (DGH)
[10] Hydrocarbon Vision 2030 for Northeast India - Final Report
Action plan Rationale Responsible authority Timeline
Single-window clearance for
environment and forest
Avoid environmental
delays and increase
investor confidence
MoEF/State
government/
MoPNG/DGH
<2 years
Exemption from
environment and forest
clearances for exploratory
drilling.
Avoid environmental
delays and increase
investor confidence
MoEF/ State
government
MoPNG/DGH
<2 years
Batch clearances for
exploratory wells.
Avoid environmental
delays and increase
investor confidence
MoEF/State
government
MoPNG/DGH
<2 years
Inclusion of policy on giving
flexibilities to operator on
carrying out outstanding
MWP on similar blocks
where operator holds an
exploratory license, in PSC
Avoid efforts in areas with
lower or no potential for
E&P
DGH/MoP&NG <2 years
Availability of data - topo/revenue maps
Boundary demarcation of
forest and non-forest area in
land records.
Avoid environmental
delays and increase
investor confidence
MoEF
State government
MoPNG/DGH
<2 years
Time-bound approval of
appraisal plans, Field
Development Plans (FDPs)
and Declaration of
Commerciality (DOC)
Avoid delays and increase
investor confidence MoPNG/DGH <2 years
Relinquished Area
Offering of relinquished
areas to NOCs on a
nomination basis for
Exploration and Production
with first refusal to NOC
operating near that area
MoPNG/DGH <2 Years
Zero phase of exploration
Concept of zero phase
exploration period to be
included in the PSC,
wherein the E&P company
and the local community
develop a platform for
interaction
Increasing confidence in
the local community
before start of E&P activity
in the area
DGH/MoPNG <2 years
Midstream

Directorate General of Hydrocarbons (DGH)
[11] Hydrocarbon Vision 2030 for Northeast India- Final Report
Limited pipeline connectivity in the region has adversely impacted the development of the local market
as well as import and export of oil and gas in the north-eastern region. The Digboi-Guwahati segment
of the trunk pipeline of OIL transports crude from ONGC and OIL to refineries. Apart from OIL pipeline,
ONGC also owns three short-distance pipelines which are used to transport crude oil from ONGC oil
fields to Moran and Jorhat. The crude oil is then either pumped into the OIL trunk pipeline or stored and
transported to the refineries through other modes of transportation.
The current capacity of crude pipeline suffices the production forecast from the existing oilfields and
recent discoveries. However, the capacity augmentation, planned for Numaligarh, Guwahati and
Bongaigaon Refinery, would warrant capacity addition/new pipelines from Paradip to Numaligarh. On
the other hand, the unavailability of pipeline within the region has discouraged gas production in the
region. Gas produced from ONGC fields in Tripura is transported through pipeline only to the power
plants of ONGC Tripura Power Company Ltd (OTPC), North Eastern Electric Power Corporation Limited
(NEEPCO) and Tripura State Electricity Corporation Limited (TSEB). However, going forward, gas
demand from the local market is expected to surpass local supply. DNP Limited’s (joint venture of
Assam Gas Company Ltd (AGCL), NRL and OIL) 192 km pipeline for gas from Duliajan to Numaligarh
is a progressive step in this direction. Gas pipeline from Agartala to Bongaigaon via Silchar & Guwahati,
extension of Duliajan-Numaligarh pipeline to Guwahati and further connection of Bongaigaon to the
national gas grid in Barauni should be envisaged.
However, these developments are likely to face challenges such as right of way, land acquisition and
high capital costs. Therefore, both the central and state governments would need to extend in providing
necessary support to such developmental activities in order to ensure timely implementation of these
projects. The limited capacity of product pipelines in the region, transporting only about 61% of the
products from the refineries, has forced the refineries to use alternate transportation mechanisms such
as road and rail networks, which are costlier than pipeline transportation. Moreover, the region does not
have any LPG pipeline network, which has adversely affected the LPG penetration scenario for most
of the states in the region.
Another important issue that needs to be addressed is the effective utilization of the oil & gas resources
available in the region. An energy corridor needs to be developed in the north-eastern region for
utilisation of resources available, producing POL products and exporting to the rest of India and other
countries such as Bangladesh, Myanmar and Nepal. This will fuel overall growth in the region, which is
lagging behind the country in terms of per capita income. A corridor is envisaged to connect Paradip to
the north-eastern region for imported crude oil in Phase I and to connect Chittagong to the north-eastern
region for export of products in Phase II. This would facilitate uninterrupted and economic transportation
of hydrocarbons.
The key action points identified for improving the state of midstream infrastructure are listed below.
Action plan Rationale Responsible authority Timeline
Increase crude oil pipeline capacity
Paradip-Siliguri-Numaligarh
Imported crude oil
refinery in the north-
eastern region
NRL <2 years
Barauni-Bongaigaon Pipeline:
OIL to maintain the same
capacity of pipeline as per
requirement of NER refineries.
OIL to consider capacity
Need to enhance
capacity of this pipeline
in future according to
expansion plans of NER
refineries.
OIL/IOCL/NRL 2-5 Years
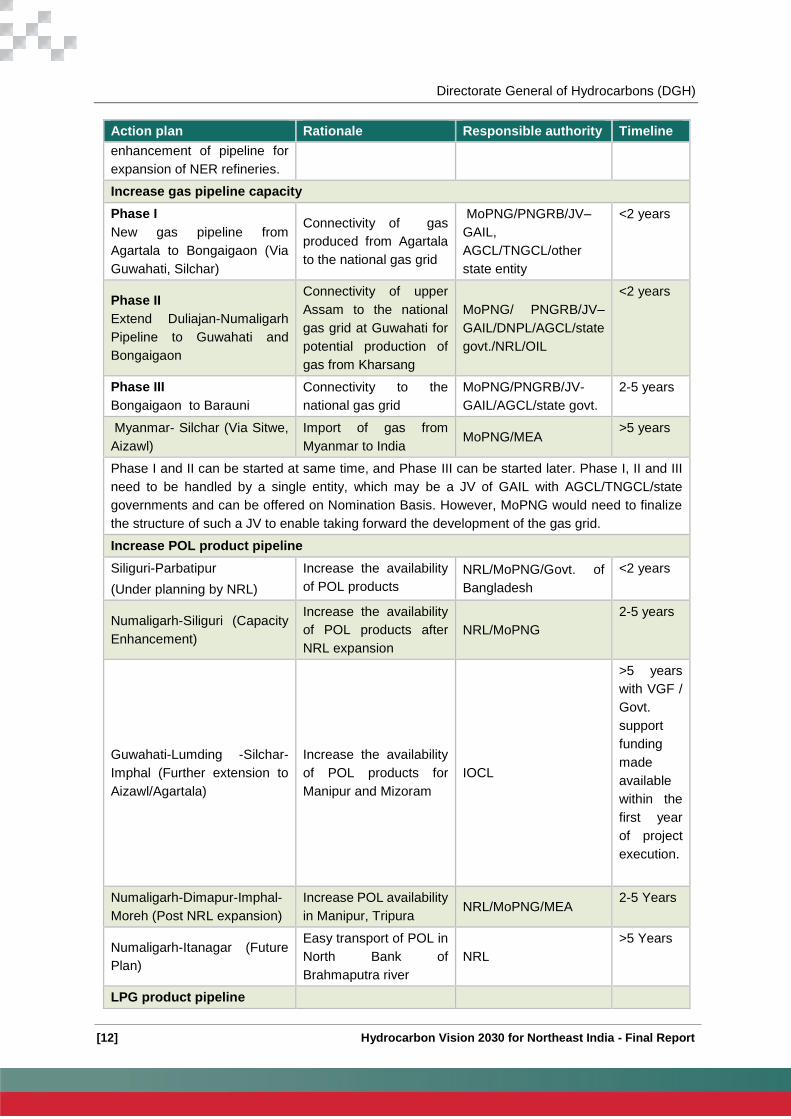
Directorate General of Hydrocarbons (DGH)
[12] Hydrocarbon Vision 2030 for Northeast India - Final Report
Action plan Rationale Responsible authority Timeline
enhancement of pipeline for
expansion of NER refineries.
Increase gas pipeline capacity
Phase I
New gas pipeline from
Agartala to Bongaigaon (Via
Guwahati, Silchar)
Connectivity of gas
produced from Agartala
to the national gas grid
MoPNG/PNGRB/JV–
GAIL,
AGCL/TNGCL/other
state entity
<2 years
Phase II
Extend Duliajan-Numaligarh
Pipeline to Guwahati and
Bongaigaon
Connectivity of upper
Assam to the national
gas grid at Guwahati for
potential production of
gas from Kharsang
MoPNG/ PNGRB/JV–
GAIL/DNPL/AGCL/state
govt./NRL/OIL
<2 years
Phase III
Bongaigaon to Barauni
Connectivity to the
national gas grid
MoPNG/PNGRB/JV-
GAIL/AGCL/state govt.
2-5 years
Myanmar- Silchar (Via Sitwe,
Aizawl)
Import of gas from
Myanmar to India MoPNG/MEA
>5 years
Phase I and II can be started at same time, and Phase III can be started later. Phase I, II and III
need to be handled by a single entity, which may be a JV of GAIL with AGCL/TNGCL/state
governments and can be offered on Nomination Basis. However, MoPNG would need to finalize
the structure of such a JV to enable taking forward the development of the gas grid.
Increase POL product pipeline
Siliguri-Parbatipur
(Under planning by NRL)
Increase the availability
of POL products
NRL/MoPNG/Govt. of
Bangladesh
<2 years
Numaligarh-Siliguri (Capacity
Enhancement)
Increase the availability
of POL products after
NRL expansion
NRL/MoPNG
2-5 years
Guwahati-Lumding -Silchar-
Imphal (Further extension to
Aizawl/Agartala)
Increase the availability
of POL products for
Manipur and Mizoram
IOCL
>5 years
with VGF /
Govt.
support
funding
made
available
within the
first year
of project
execution.
Numaligarh-Dimapur-Imphal-
Moreh (Post NRL expansion)
Increase POL availability
in Manipur, Tripura NRL/MoPNG/MEA
2-5 Years
Numaligarh-Itanagar (Future
Plan)
Easy transport of POL in
North Bank of
Brahmaputra river
NRL
>5 Years
LPG product pipeline
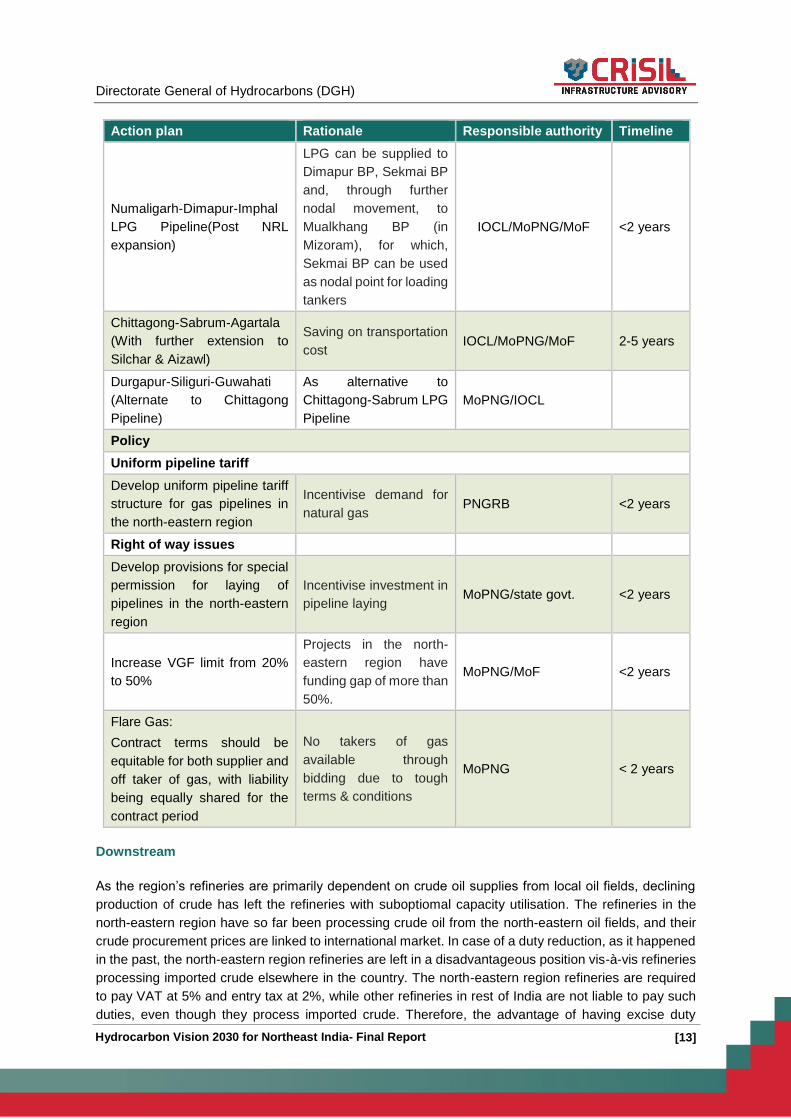
Directorate General of Hydrocarbons (DGH)
[13] Hydrocarbon Vision 2030 for Northeast India- Final Report
Action plan Rationale Responsible authority Timeline
Numaligarh-Dimapur-Imphal
LPG Pipeline(Post NRL
expansion)
LPG can be supplied to
Dimapur BP, Sekmai BP
and, through further
nodal movement, to
Mualkhang BP (in
Mizoram), for which,
Sekmai BP can be used
as nodal point for loading
tankers
IOCL/MoPNG/MoF <2 years
Chittagong-Sabrum-Agartala
(With further extension to
Silchar & Aizawl)
Saving on transportation
cost IOCL/MoPNG/MoF 2-5 years
Durgapur-Siliguri-Guwahati
(Alternate to Chittagong
Pipeline)
As alternative to
Chittagong-Sabrum LPG
Pipeline
MoPNG/IOCL
Policy
Uniform pipeline tariff
Develop uniform pipeline tariff
structure for gas pipelines in
the north-eastern region
Incentivise demand for
natural gas PNGRB <2 years
Right of way issues
Develop provisions for special
permission for laying of
pipelines in the north-eastern
region
Incentivise investment in
pipeline laying MoPNG/state govt. <2 years
Increase VGF limit from 20%
to 50%
Projects in the north-
eastern region have
funding gap of more than
50%.
MoPNG/MoF <2 years
Flare Gas:
Contract terms should be
equitable for both supplier and
off taker of gas, with liability
being equally shared for the
contract period
No takers of gas
available through
bidding due to tough
terms & conditions
MoPNG < 2 years
Downstream
As the region’s refineries are primarily dependent on crude oil supplies from local oil fields, declining
production of crude has left the refineries with suboptiomal capacity utilisation. The refineries in the
north-eastern region have so far been processing crude oil from the north-eastern oil fields, and their
crude procurement prices are linked to international market. In case of a duty reduction, as it happened
in the past, the north-eastern region refineries are left in a disadvantageous position vis-à-vis refineries
processing imported crude elsewhere in the country. The north-eastern region refineries are required
to pay VAT at 5% and entry tax at 2%, while other refineries in rest of India are not liable to pay such
duties, even though they process imported crude. Therefore, the advantage of having excise duty

Directorate General of Hydrocarbons (DGH)
[14] Hydrocarbon Vision 2030 for Northeast India - Final Report
concession, in view of the sub-economic size and geographically disadvantageous location, is also lost
because of imposition of VAT and entry tax. Facing challenges of surplus capacity, NRL has mooted a
plan to process imported crude oil and expand its refinery from 3 to 9 million metric ton per annum
(MMTPA) to achieve economic viability. Along with refinery expansion, NRL is planning a crude pipeline
of around 6 MMTPA from Paradip to Numaligarh.
Except for LPG, all other POL products produced by the refineries in the region are in excess of the
demand from the region. Expansion of refinery capacity will further increase the surplus capacity.
Therefore, finding a market for the surplus capacity will be critical. The refineries in the region have not
been able to produce enough LPG to meet the local demand. Moreover, the LPG storage capacity in
the region is not very encouraging. States such as Arunachal Pradesh, Nagaland, Meghalaya, Tripura
and Mizoram have 0-2 days’ storage capacity. Owing to such challenges, the LPG coverage in the
north-eastern region is less than 60% at present.
In terms of the demand for natural gas, most of the towns/cities in northeast India have individual
houses, very few small and medium scale industries in Tripura, resulting into very low business
opportunity for any city gas distribution (CGD) entity. In addition, there are no utility corridors to lay
pipelines in most of the areas.
The key action points identified for improving the state of downstream demand centres and access are
listed below.
Action plan Rationale Responsible authority Timeline
Refinery capacity augmentation
Undertake expansion of
NRL/IOCL Guwahati/IOCL
Bongaigaon
(Under planning by
NRL/IOCL)
Cater to POL demands of the
north-eastern region as well as
other regions of India
NRL/IOCL 2-5
years
Enhancement of LPG
production using INDMAX
technology
Increase LPG production IOCL <2 Years
Export of POL to countries under South Asian Association for Regional Cooperation (SAARC)
MoPNG to form a
committee to evaluate
possibility of export of POL
products to neighbouring
countries- Bangladesh,
Myanmar, Nepal, Bhutan,
Sri Lanka as these are net
importers of Crude Oil &
POL
Excess capacity of POL from the
north-eastern region will lead to
catering to demand of SAARC
countries
NRL/IOCL/MoPNG/MEA <2 years
Increase in consumption of POL products
CGD Development (Phase
I, II, III) [Phase I- Agartala-
Bongaigaon, Phase II-
Guwahati-Duliajan, Phase
III- Bongaigaon-Barauni)
GAIL/PNGRB/AGCL/TNGCL/State
Governments
Phase I
& II <2
Years

Directorate General of Hydrocarbons (DGH)
[15] Hydrocarbon Vision 2030 for Northeast India- Final Report
Action plan Rationale Responsible authority Timeline
Phase III
2-5
Years
Incentives for CGD
Development (PPP route or
Nomination Basis to PSUs)
Cities in NER may not be
financially viable for CGD
development
MoPNG/MoF/PNGRB 2-5
years
Increase per capita
consumption by laying
product pipeline network
and LPG pipeline, e.g.,
Numaligarh-Imphal and
Guwahati-Silchar Imphal
pipelines, and imported
LPG pipeline Chittagong-
Sabrum-Agartala
Will improve availability of POL at
remote locations MoPNG/IOCL/NRL <2 years
Re-instate North East
Industrial and Investment
Promotion Policy (NEIIPP)
Will lead to industrialisation and
hence increase consumption
Department of Industrial
Policy & Promotion
(DIPP)
<2 years
Development of small scale
industries like Wax,
Bamboo Based industries,
Candle manufacturing,
Tyre, Rubber based
industry etc
Will lead to industrialisation and
hence increase consumption DIPP/MoPNG <2 years
Connectivity
4 Laning of NH 37 and
2 Laning of NH 150
Connectivity to
Agartala via NH-44
needs to be upgraded
to 2 lane.
Upgrade Silchar,
Shillong, Dimapur,
Jorhat civilian airports
to improve connectivity
and promote Tourism
Improve connectivity to increase
industrial development and hence
more consumption of POL
products
Ministry of Road
Transport and
Highways/MoPNG/AAI
<2 years
Evaluate using National
Waterway-2 for
transportation of POL and
other goods
Capitalise on existing and
proposed refinery capacity
Inland Waterways
Authority of India (IWAI)
/MEA/MoPNG
2-5
years
Development of Common
User Facilities (CUF)
Development of common
marketing facilities in NER which
can be shared by all of the
individual OMCs.
MoPNG, IOCL, NRL,
BPCL
2- 5
years

Directorate General of Hydrocarbons (DGH)
[16] Hydrocarbon Vision 2030 for Northeast India - Final Report
Action plan Rationale Responsible authority Timeline
Ancillary industries
Setting up of ancillary industries
like fertilizer and petrochemical
plants around refineries in NER
which can utilize Naphtha
produced from the refineries as a
Feedstock
DIPP, MOCI, MSME 2-5
years
Increase natural gas demand
Identified key target cities in
the region along with Phase
I, II, III of Gas pipelines for
CGD bidding and evaluate
incentive schemes such as
tax benefit and subsidy for
initial years, to make CGDs
viable.
Increase natural gas demand MoPNG/PNGRB 2-5
years
Silchar needs to be
considered for CGD on
immediate basis as gas
from ONGC is available
ONGC Barrack Valley Block has
gas available ONGC/AGCL <2 Years
Evaluate utilisation of flared
gas by using cascades of
gas and LNG skid-mounted
trucks
Use flared gas GAIL <2 years
Develop small Power
Plants (Modular) if flare gas
profile is for more than 10
years
Use of flared Gas OIL/ONGC/APGCL <2 Years
Develop end consumer
segments like power plants
and fertiliser plants
Develop end consumer segments
like Chambal Fertilisers Plant and
expansion of OTPC Power Plant
for export of surplus power to
Bangladesh
ONGC/ Chambal
Fertilisers Ltd
/MoPNG/MEA
<2 years
Industrial development
Re-instate NEIIPP Policy
with increased budget
allocation
Include medium-scale
industries in the policy as
well.
Promote local
manufacturing of ancillary
parts related to the
hydrocarbon industry in
Tripura/Guwahati/Dibrugarh
Promote industries to ensure
overall economic growth of the
region and capitalise on the
hydrocarbon potential in the region
DIPP/MoF/state govt. <2 years
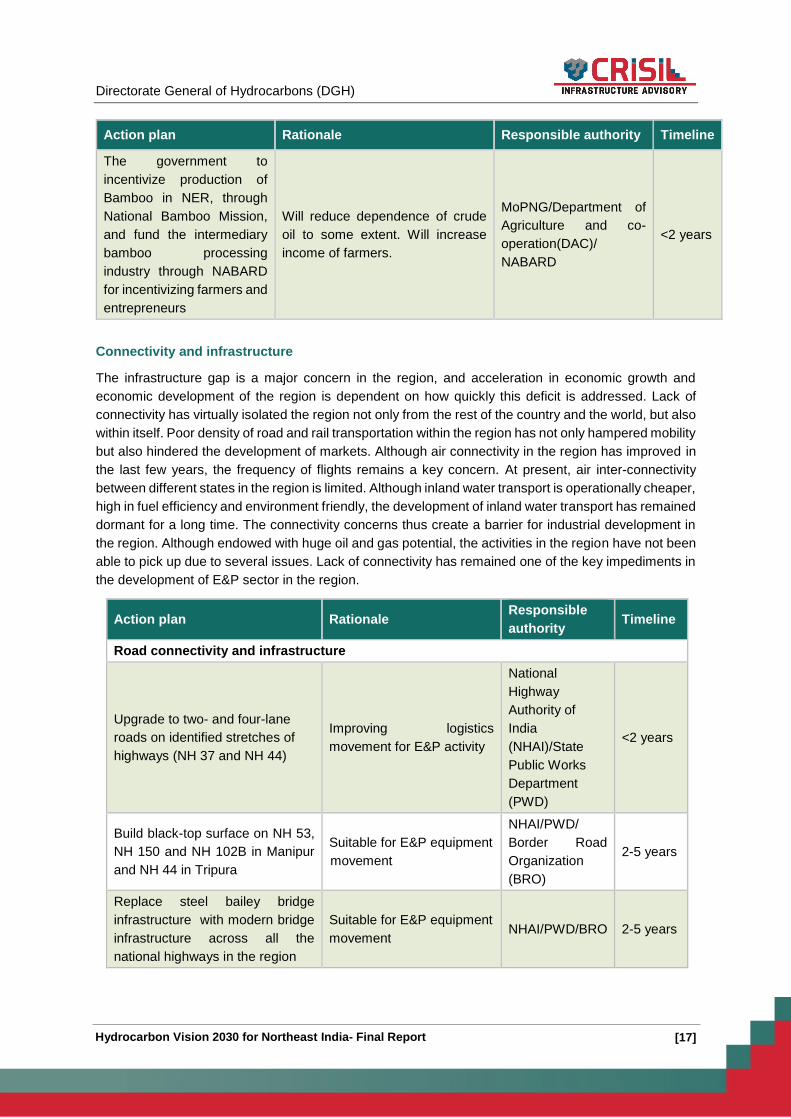
Directorate General of Hydrocarbons (DGH)
[17] Hydrocarbon Vision 2030 for Northeast India- Final Report
Action plan Rationale Responsible authority Timeline
The government to
incentivize production of
Bamboo in NER, through
National Bamboo Mission,
and fund the intermediary
bamboo processing
industry through NABARD
for incentivizing farmers and
entrepreneurs
Will reduce dependence of crude
oil to some extent. Will increase
income of farmers.
MoPNG/Department of
Agriculture and co-
operation(DAC)/
NABARD
<2 years
Connectivity and infrastructure
The infrastructure gap is a major concern in the region, and acceleration in economic growth and
economic development of the region is dependent on how quickly this deficit is addressed. Lack of
connectivity has virtually isolated the region not only from the rest of the country and the world, but also
within itself. Poor density of road and rail transportation within the region has not only hampered mobility
but also hindered the development of markets. Although air connectivity in the region has improved in
the last few years, the frequency of flights remains a key concern. At present, air inter-connectivity
between different states in the region is limited. Although inland water transport is operationally cheaper,
high in fuel efficiency and environment friendly, the development of inland water transport has remained
dormant for a long time. The connectivity concerns thus create a barrier for industrial development in
the region. Although endowed with huge oil and gas potential, the activities in the region have not been
able to pick up due to several issues. Lack of connectivity has remained one of the key impediments in
the development of E&P sector in the region.
Action plan Rationale Responsible
authority Timeline
Road connectivity and infrastructure
Upgrade to two- and four-lane
roads on identified stretches of
highways (NH 37 and NH 44)
Improving logistics
movement for E&P activity
National
Highway
Authority of
India
(NHAI)/State
Public Works
Department
(PWD)
<2 years
Build black-top surface on NH 53,
NH 150 and NH 102B in Manipur
and NH 44 in Tripura
Suitable for E&P equipment
movement
NHAI/PWD/
Border Road
Organization
(BRO)
2-5 years
Replace steel bailey bridge
infrastructure with modern bridge
infrastructure across all the
national highways in the region
Suitable for E&P equipment
movement NHAI/PWD/BRO 2-5 years

Directorate General of Hydrocarbons (DGH)
[18] Hydrocarbon Vision 2030 for Northeast India - Final Report
Action plan Rationale Responsible
authority Timeline
Build intra-region connectivity
infrastructure along the identified
routes
Enhance movement of
product and enhance trade NHAI/PWD 2-5 years
Develop proposed Asian
highways through Manipur
Capitalise on opportunities
in international trade
NHAI/BRO/
MEA/ MHA >5 years
Rail connectivity and infrastructure
Strengthen existing infrastructure
and increase coverage in the
region
Enhance trade by
connectivity to markets Ministry of
Railways 2- 5 years
Develop rail connectivity to
Bangladesh
Enhance trade by
connectivity to markets
Ministry of
Railways >5 years
Air connectivity and infrastructure
Develop civilian airports in Jorhat,
Aizawl, Dimapur and Silchar
Create a business
conducive environment
Ministry of
Aviation/Airport
Authority of India
(AAI)
2-5 years
Law and order
The instability in northeast India is characterised by two distinct factors: ethnic clashes among the
indigenous groups and political movement. The conflicting dynamics in the North East ranges, from
terrorism to ethnic clashes, from problems of continuous inflow of migrants to the fight over resources.
Moreover, vested interests and inter-tribal and inter-factional rivalry have led militant groups to
continually clash among themselves, plunging the region in a vicious cycle of militancy, social violence
and lack of economic growth.
Over the years, both the state and central governments have undertaken efforts to enhance stability in
the region. The government introduced the institution of autonomous district councils to give the region’s
tribal groups a limited self-rule by providing them greater control over local resources and protection of
cultural identity. The key action points identified for improving the law and order scenario and support
the development of oil and gas industry in northeast India are listed below.
Action plan Rationale Responsible
authority Timeline
Appoint central coordination
committee to resolve the boundary
issues between Assam-Nagaland,
Manipur-Nagaland and Assam-
Arunachal Pradesh
Revival of exploration
activity in the affected
regions and increased drive
for states to participate in a
mutually rewarding manner
Central and
state
governments
<2 years
Trade opportunity with neighbouring nations
Demand for all the petroleum products is around 3.2 MMTPA in the north-eastern region. Considering
the expansion proposed along with the existing refinery capacity, the north-eastern region will have
excess capacity against the demand. Already a net exporter of petroleum products, India can capitalise
such excess capacity to cater the demand from neighbouring nations of Bangladesh, Myanmar, Sri
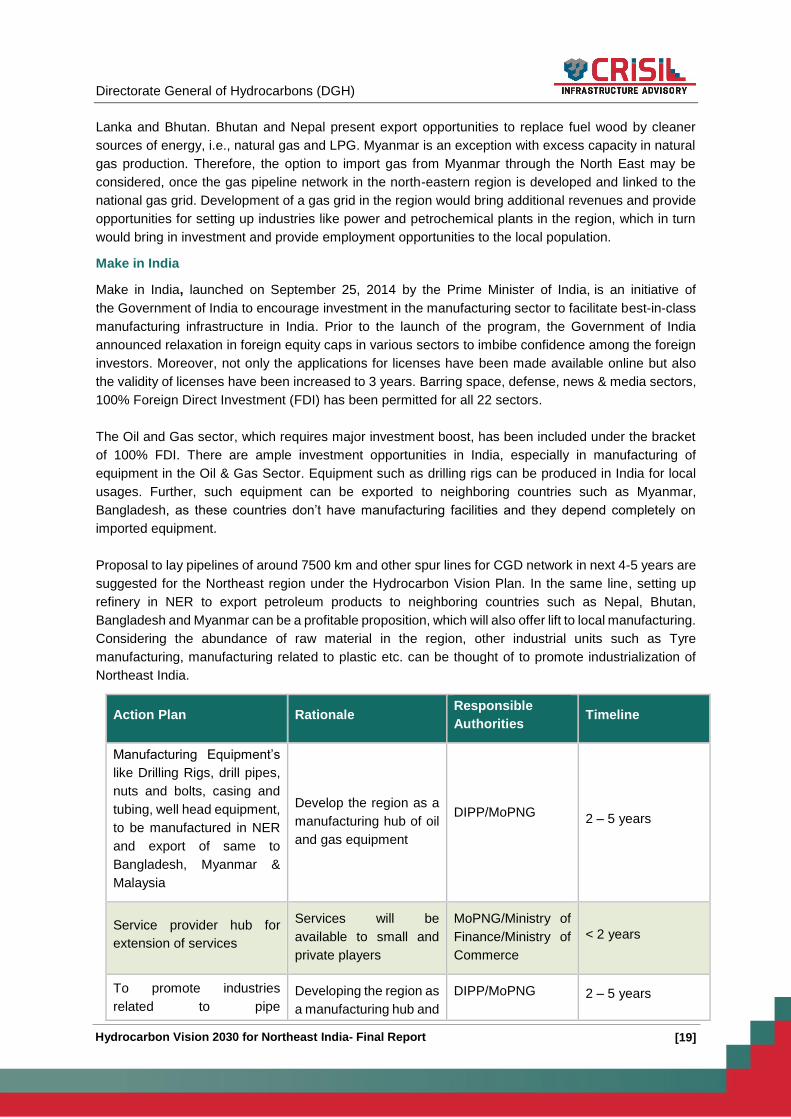
Directorate General of Hydrocarbons (DGH)
[19] Hydrocarbon Vision 2030 for Northeast India- Final Report
Lanka and Bhutan. Bhutan and Nepal present export opportunities to replace fuel wood by cleaner
sources of energy, i.e., natural gas and LPG. Myanmar is an exception with excess capacity in natural
gas production. Therefore, the option to import gas from Myanmar through the North East may be
considered, once the gas pipeline network in the north-eastern region is developed and linked to the
national gas grid. Development of a gas grid in the region would bring additional revenues and provide
opportunities for setting up industries like power and petrochemical plants in the region, which in turn
would bring in investment and provide employment opportunities to the local population.
Make in India
Make in India, launched on September 25, 2014 by the Prime Minister of India, is an initiative of
the Government of India to encourage investment in the manufacturing sector to facilitate best-in-class
manufacturing infrastructure in India. Prior to the launch of the program, the Government of India
announced relaxation in foreign equity caps in various sectors to imbibe confidence among the foreign
investors. Moreover, not only the applications for licenses have been made available online but also
the validity of licenses have been increased to 3 years. Barring space, defense, news & media sectors,
100% Foreign Direct Investment (FDI) has been permitted for all 22 sectors.
The Oil and Gas sector, which requires major investment boost, has been included under the bracket
of 100% FDI. There are ample investment opportunities in India, especially in manufacturing of
equipment in the Oil & Gas Sector. Equipment such as drilling rigs can be produced in India for local
usages. Further, such equipment can be exported to neighboring countries such as Myanmar,
Bangladesh, as these countries don’t have manufacturing facilities and they depend completely on
imported equipment.
Proposal to lay pipelines of around 7500 km and other spur lines for CGD network in next 4-5 years are
suggested for the Northeast region under the Hydrocarbon Vision Plan. In the same line, setting up
refinery in NER to export petroleum products to neighboring countries such as Nepal, Bhutan,
Bangladesh and Myanmar can be a profitable proposition, which will also offer lift to local manufacturing.
Considering the abundance of raw material in the region, other industrial units such as Tyre
manufacturing, manufacturing related to plastic etc. can be thought of to promote industrialization of
Northeast India.
Action Plan Rationale Responsible
Authorities Timeline
Manufacturing Equipment’s
like Drilling Rigs, drill pipes,
nuts and bolts, casing and
tubing, well head equipment,
to be manufactured in NER
and export of same to
Bangladesh, Myanmar &
Malaysia
Develop the region as a
manufacturing hub of oil
and gas equipment
DIPP/MoPNG 2 – 5 years
Service provider hub for
extension of services
Services will be
available to small and
private players
MoPNG/Ministry of
Finance/Ministry of
Commerce
< 2 years
To promote industries
related to pipe
Developing the region as
a manufacturing hub and
DIPP/MoPNG 2 – 5 years

Directorate General of Hydrocarbons (DGH)
[20] Hydrocarbon Vision 2030 for Northeast India - Final Report
Action Plan Rationale Responsible
Authorities Timeline
manufacturing/Steel in NER
as potential is for
development of pipeline of
1000-1200 KM per year
would cater to
midstream oil and gas
sector
Expansion of refineries in
NER
Cater to the increasing
demand in the country
and export of surplus
products
NRL/IOCL
> 5 years
Development of concomitant
infrastructure to facilitate
production and evacuation
of finished products from
hydrocarbon related
industries
Promotion of ancillary
industries around oil and
gas sector
MoPNG/Ministry of
Finance/Ministry of
Commerce/Ministry
of power 2 – 5 years
To promote industries
related to decorative items
based on Wax.
Will promote small scale
industries like candle
manufacturing in the
region
DIPP
< 2 years
To promote Bio ethanol
production in NER as large
quantity of raw material
(Bamboo) is available.
Will promote usage of
clean fuels in the region
MNRE/MoPNG
2 – 5 years
Health/Medical services
National Health Mission has been setup with a vision of ‘Attainment of Universal Access to Equitable,
Affordable and Quality health care services, accountable and responsive to people’s needs, with
effective inter-sectoral convergent action to address the wider social determinants of health’.The
National Rural Health Mission (NRHM) is a National effort at ensuring effective healthcare through a
range of interventions at individual, household, community, and most critically at the health system
levels. A number of States in North Eastern parts of the country have stagnant health indicators and
continue to grapple with significant morbidity and mortality.
In order to address the premature deaths caused by household air pollution each year, effective
strategies can be thought of to scale up the dissemination of cleaner burning fuels and efficient stoves
for household cooking. The further propagation of cleaner fuels, such as LPG and natural gas, in the
northeast region can help in reducing the pollution related deaths, thereby aiding the objectives of the
National Health Mission.
Financing

Directorate General of Hydrocarbons (DGH)
[21] Hydrocarbon Vision 2030 for Northeast India- Final Report
Across all segments of the oil and gas sector, opportunities exist to optimize financing to increase both
its availability and reduce its cost. However, compared with other infrastructure intensive sectors, such
as power and utilities, project finance has been less widely used by the oil and gas industry. The industry
is inherently long term in nature which can be a challenge when trying to arrange project financing on
acceptable terms. The exploration and production sector of northeast India could benefit from lower
cost of capital, especially debt capital and long term financing.
VGF is a grant, one-time or deferred, provided to support infrastructure projects that are economically
justified but fall short of financial viability. VGF is designed to make projects that are economically
unviable over the long term, commercially viable for investors. It helps mobilise private sector
investment for development projects, while ensuring that the private sector still shares in the risks of
infrastructure delivery and operation. The VGF mechanism for pipeline connectivity should be
considered as development mechanism to establish evacuation systems for the oil & gas sector. Also,
other options such as following need to be considered for effective development of the oil & gas industry
in the region:
Provision of soft loans
Issue of tax-free infrastructure bonds from public sector undertakings – GAIL, IOCL, ONGC
Development cess on petrol/diesel or Aviation turbine fuel (ATF) at national level for projects
related to the north-eastern region for a limited period
Increasing budget allocation from the central pool for North Eastern Council (NEC)
Increasing the minimum limit for VGF eligibility of projects
VGF funding should be made available for PSUs
Also, considering the quantum of funds required to build projects in northeast India, the existing VGF
limits may not be sufficient to make projects financially viable. Therefore, such limits needs to be suitably
increased to make the projects viable.
Hydrocarbon Vision for North East Region for 2030
Developing the North East Region as a dominant hub at forefront of Indian Energy map by
utilizing its Hydrocarbon potential - increasing the oil and gas production (O+OEG in MMTOE)
from the region by two times through employment of latest technological methods and
equipment.
Target access of clean fuel (LPG / PNG) to 100% households in the region.
Bolster development of the hydrocarbon sector in the region through creation of service
provider hubs and concomitant improvement of infrastructure in the region.
Providing pipeline connectivity by installing 5 new petroleum products pipeline and 3 LPG
pipelines for connecting major supply and demand centres.
Transition towards usage of sustainable forms of energy by development of natural gas grid
and CNG highways connecting the states in the region and also to the national gas grid to
increase consumption of natural gas as a fuel of choice.
Develop the manufacturing industry in the region by focusing on the hydrocarbon sector
related products like drill pipes, nuts and bolts, casing and tubing and other spare parts.
Facilitating the consumption of petroleum products in the region through industrial development
and improvement in the pipeline transport infrastructure.
Increase the production of bio fuels in the region towards providing access to clean fuels for
all in the north east region.
Directorate General of Hydrocarbons (DGH)
[22] Hydrocarbon Vision 2030 for Northeast India - Final Report
Development of employment opportunities in region through skill development and by
promoting industries in the Hydrocarbon and allied sectors like Power, Fertilizer, Plastic
industries and realizing the potential of the region as an export hub for petroleum products to
neighbouring countries like Bangladesh and Myanmar.
Encourage hydrocarbons trade with SAARC countries surrounding the region to cohesively
work towards developing the hydrocarbon potential of the north east for regional as well as
national good.
Implementation approach
Implementation of the action plans will be complex and multi-layered. Some actions may require policy
or organisational changes, whereas some would require review of on-going activities and refocusing
efforts. Others may require a set of fresh initiatives. An executive council may be appointed for the
overall implementation of the recommended action plans for the first five years. The council chairman
will be nominated by Ministry of Petroleum & Natural Gas (MoPNG), and will consist of representatives
from national oil companies, state governments and industry bodies. The committee then may appoint
sub-committees and implementation teams for different action areas that require coordination from
other ministries or external stakeholders.
The executive council will be responsible for:
(i) Guiding the implementation of the recommended action plan
(ii) Establishing sub-committees and implementation teams to work on one or more action areas
(iii) Reviewing, adapting or refocusing the recommended action areas as appropriate
(iv) Reporting on a regular basis to MoPNG on implementation progress
In addition to serving on the council, the members may serve as co-chairs of individual sub-committees
and implementation teams.
Some action plans will have set deadlines, while others will be less specific. These performance
objectives and deadlines may be adjusted upon approval by the council. Each implementation team
would be expected to complete the implementation within the set timetables. Also, each team would be
expected to develop and institutionalise monitoring metrics and protocols that will provide an objective
record of how well the goals are achieved. Appropriate members from the sub-committees will review
these results and report to the executive council twice in a year. The council will be responsible for
providing quarterly progress reports to MoPNG and stakeholders. Prior to the sunset of the council
(2020), a final report on implementation actions will be prepared and submitted to MoPNG

Directorate General of Hydrocarbons (DGH)
[23] Hydrocarbon Vision 2030 for Northeast India- Final Report
Background
Introduction
Energy security is one of the most critical issues facing the Indian economy. India today faces the
daunting challenge of meeting its growing need for energy resources in a cost effective, sustainable
and environment-friendly manner. However, the impact of successfully addressing this challenge is not
trivial. Currently close to 80% of domestic crude oil requirement is met through imports. With the growing
need for energy in the future, the situation is to worsen, if steps are not taken to increase domestic
supply. It is possible to reduce the annual energy import bill substantially from USD 120 – 130 billion in
FY 2014-15, through focussed implementation of the proposed policy reforms and institutional
measures. The fossil fuels are expected to continue fuelling country’s economic growth. It is necessary
to recognise that India’s growing dependence on energy imports exposes its import bill to external price
shocks. For India, it is not a question of choosing among alternative domestic energy resources but of
exploiting all available domestic energy resources to the maximum as long as they are competitive. The
most critical elements of our energy security, however, remain the measures to increase efficiency,
reduce requirements and augment the domestic energy resource base.
The Northeast of India is endowed with huge untapped natural resources and is acknowledged as the
eastern gateway of India’s Look-East Policy. National Oil Companies (NOCs), ONGC & OIL, have a
long history of E & P activities in this region. Subsequently, the area was opened for exploration to the
Private/ JV & Foreign Companies through Pre-NELP and NELP rounds of biddings. There was an
encouraging response from private sectors.
In this context, development of the Northeast is a top priority for the Government of India as a vital link
in the development of economic relations with neighbouring countries. The possibility of energy trading
among the countries of the East and South East Asia has opened new vistas of cooperation. Cross
border energy trade could lead to effective utilization of natural resources, increase in reliability of power
supply, economy of scale in operation, mutual support during contingencies, large scale transformation
in the sectors contributing to economic growth and act as the single most effective confidence building
measure through the participation of multiple stakeholders. This will substantially promote market
integration in energy related goods and services.
Regional energy integration has long been a major thrust in the context of SAARC. India holds the key
to the strategy of regional energy integration. The Northeast, as the vital link to the South East Asian
countries, could be the most significant region of the country in this regard. And hence, development of
power and energy through proper utilization of the resources is the need of the hour. India’s pivotal role
in regional energy integration is consistent with its growing aspiration to be a global energy processing
hub. An integrated South Asian energy market, with India as the hub, could offer member countries the
opportunity to be more ambitious in their energy planning. Today, the new geopolitics makes it likely
that India’s status as the forerunner will make it easier for other countries to connect with it during the
process of regional energy integration.
Directorate General of Hydrocarbons (DGH)
[24] Hydrocarbon Vision 2030 for Northeast India - Final Report
Content of this Report
This report contains the following sections:
Executive Summary
Background
Brief Description of Northeast India
Oil & Gas Sector Outlook in Northeast India
Upstream Infrastructure
Midstream Infrastructure
Downstream Infrastructure
Skill Development
Infrastructure Gaps
Law and Order
Trade opportunity with neighbouring countries
Make in India
Health Mission
Development of Vision 2030
Appendix /Annexures
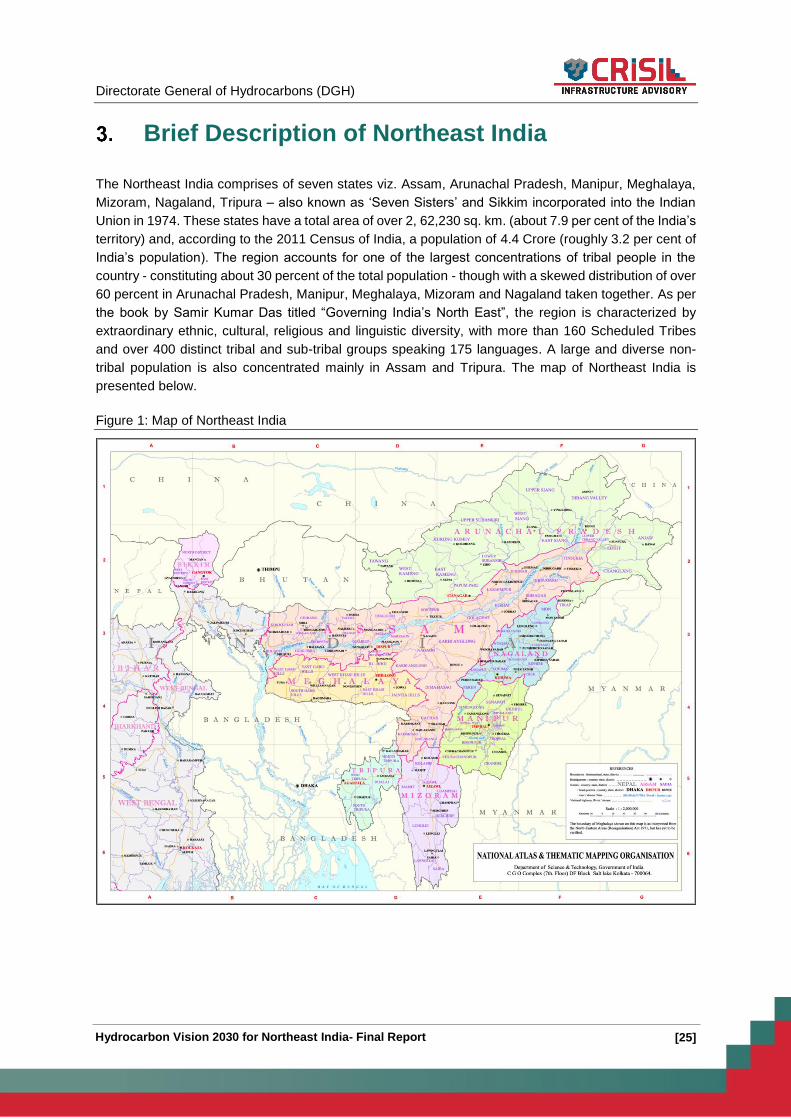
Directorate General of Hydrocarbons (DGH)
[25] Hydrocarbon Vision 2030 for Northeast India- Final Report
Brief Description of Northeast India
The Northeast India comprises of seven states viz. Assam, Arunachal Pradesh, Manipur, Meghalaya,
Mizoram, Nagaland, Tripura – also known as ‘Seven Sisters’ and Sikkim incorporated into the Indian
Union in 1974. These states have a total area of over 2, 62,230 sq. km. (about 7.9 per cent of the India’s
territory) and, according to the 2011 Census of India, a population of 4.4 Crore (roughly 3.2 per cent of
India’s population). The region accounts for one of the largest concentrations of tribal people in the
country - constituting about 30 percent of the total population - though with a skewed distribution of over
60 percent in Arunachal Pradesh, Manipur, Meghalaya, Mizoram and Nagaland taken together. As per
the book by Samir Kumar Das titled “Governing India’s North East”, the region is characterized by
extraordinary ethnic, cultural, religious and linguistic diversity, with more than 160 Scheduled Tribes
and over 400 distinct tribal and sub-tribal groups speaking 175 languages. A large and diverse non-
tribal population is also concentrated mainly in Assam and Tripura. The map of Northeast India is
presented below.
Figure 1: Map of Northeast India

Directorate General of Hydrocarbons (DGH)
[26] Hydrocarbon Vision 2030 for Northeast India - Final Report
Demographic Profile of Northeast India
Assam
The State of Assam, popularly known as the land of the red river and blue hills is the gateway to the
North East India. The state is bordered in the North by Bhutan and in the East by Arunachal Pradesh.
Along the south lie Nagaland, Manipur and Mizoram. Meghalaya lies to the South-West, West Bengal
and Bangladesh to the West. The State is divided into 27 administrative districts. With an area of 78,438
square kilometers, the state can be broadly divided into three (3) physiographic domains viz.
Brahmaputra valley, Central Assam Hills comprising of Mikir Hill in Karbi Anglong and North Cachar Hill
districts and Barak valley covering the Cachar and Karimganj districts in the Barak valley.
Figure 2: Geographical Map of Assam
According to the Census of India, 2011, the total population of Assam is 31.17 million, population density
stands as 396.8/km2 and literacy rate is 73.18%. During the last decade 2001-11, the population grew
at 16.93% which is slightly below the national growth rate. The number of females per 1000 males in
the state shows an improvement from 935 in 2001 to 954 in 2011 which is better than the national
average. Further, the density of population per square kilometer has gone up to 397 as against 340 in
2001. The effective literacy rate for Assam as per 2011 Census comes to 73.18% while it is 78.81% for
males and 67.27% for females. In 2001 Census, literacy rate for the total population was 63.25% with
71.28% for males and 54.61% for females.
Table 1: Demographic profile of Assam
States Population
Area
(Square
km)
Decadal
Population
growth rate
(%)
Sex-Ratio
(Number of
Females
per 1000
Males)
Population
density
(per Sq.
Km.)
Literacy
Rate (%)
Assam 31,169,272 78438 16.9% 954 397 73%
Source: Census of India
Arunachal Pradesh
Arunachal Pradesh is situated on the North-East extreme part of India with an area of 83,743 km2 and
has a long international border with Bhutan, China and Myanmar. There are sixteen districts in the state
of Arunachal Pradesh.

Directorate General of Hydrocarbons (DGH)
[27] Hydrocarbon Vision 2030 for Northeast India- Final Report
Figure 3: Geographical Map of Arunachal Pradesh
The state has registered population growth rate of 25.92% during the last decade 2001-11 as compared
to 27% in 1991-01. This indicates that the growth rate has gone down as compared to the previous
decade. Compared to the national growth rate of 17.64% this rate seems to be high. Sex ratio in
Arunachal Pradesh has considerably improved in 2011 with 920 as against 893 in 2001. The population
density per square kilometer in the state is only 17 which is far below the national average of 382. The
percentage of literates in Arunachal Pradesh is 66.95% for total, 73.69% for males and 59.57% for
females.
Table 2: Demographic profile of Arunachal Pradesh
States Population
Area
(Square
km)
Decadal
Population
growth rate
(%)
Sex-Ratio
(Number of
Females
per 1000
Males)
Populatio
n density
(per Sq.
Km.)
Literacy
Rate (%)
Arunachal
Pradesh 1,382,611 83743 25.9% 920 17 67%
Source: Census of India
Manipur
Manipur can be geographically divided in two regions-the hills comprising of five districts and the plains
with four districts. The state is bound by the states of Nagaland in the north, Mizoram in the south,
Assam in the west, and by the country Myanmar in the east as well as in the south with its capital
Imphal. The state which comprises of 9 districts is known for its forest wealth, with over 17,384 square
kilometer of its area is under forest cover. The main language spoken in the Manipur state is Manipuri.

Directorate General of Hydrocarbons (DGH)
[28] Hydrocarbon Vision 2030 for Northeast India - Final Report
Figure 4: Geographical Map of Manipur
The state has registered the population growth rate of 18.7% during the last decade 2001-11 as
compared to 24.9% in 1991-01. This indicates that the growth rate has gone down as compared to the
previous decade. Compared to the national growth rate of 17.64% this rate seems to be high. Sex ratio
in Manipur has improved slightly in 2011 with 987 as against 978 in 2001. The population density per
square kilometer in the state is only 122 which is far below the national average of 382. The percentage
of literates in Manipur is 80% for total, 86% for males and 73% for females.
Table 3: Demographic profile of Manipur
States Population
Area
(Square
km)
Decadal
Population
growth rate
(%)
Sex-Ratio
(Number of
Females
per 1000
Males)
Populatio
n density
(per Sq.
Km.)
Literacy
Rate (%)
Manipur 2,721,756 22327 18.7% 987 122 80%
Source: Census of India
Meghalaya
Meghalaya, literally meaning the abode of clouds, is one of the most beautiful states of the country. The
state is sandwiched between Bangladesh and Assam, with Shillong being the capital of the state. The
Khashi and Jaintia hills occupy the central and eastern parts of the state and are at a higher elevation
than the Garo hills. Meghalaya is the land of Khashi, Jaintias and Garo tribes.
About 70-80% population lives in the rural area while only a small portion has moved to the urban land.
Another important part of Meghalaya is Cherapunjee, which boasts a grand rainfall every year, making
it the rainiest place. The culture of Meghalaya possesses a nice blend of folktales, the khasi language,
colorful festivities and ethnic dance forms and equally colorful attires.

Directorate General of Hydrocarbons (DGH)
[29] Hydrocarbon Vision 2030 for Northeast India- Final Report
Figure 5: Geographical Map of Meghalaya
The state has registered the population growth rate of 27.8% during the last decade 2001-11 as
compared to 30.7% in 1991-01. This indicates that the growth rate has gone down as compared to the
previous decade. Compared to the national growth rate of 17.64% this rate seems to be very high. Sex
ratio in Meghalaya has improved slightly in 2011 with 986 as against 972 in 2001. The population density
per square kilometer in the state is only 132 which are far below the national average of 382. The
percentage of literates in Meghalaya is 75% for total, 77% for males and 74% for females.
Table 4: Demographic profile of Meghalaya
States Population
Area
(Square
km)
Decadal
Population
growth rate
(%)
Sex-Ratio
(Number of
Females
per 1000
Males)
Population
density
(per Sq.
Km.)
Literacy
Rate
(%)
Meghalaya 2,964,007 22479 27.8% 986 132 75%
Source: Census of India
Mizoram
Mizoram is rich in every aspect of nature and culture. Mizoram shares international border with
Myanmar in east and south and Bangladesh in the west. To its north are the states of Tripura, Assam
and Manipur. The distribution of population is equal in rural and urban areas. In urban areas, the gender
ratio has a perfect a score, which means there are as many females as males. Literacy in urban areas
is naturally high. The official language Mizo is widely spoken along with English, as is the case with
most north eastern states of India. Aizawl is the main city & state capital of Mizoram.

Directorate General of Hydrocarbons (DGH)
[30] Hydrocarbon Vision 2030 for Northeast India - Final Report
Figure 6: Geographical Map of Mizoram
The state has registered the population growth rate of 22.8% during the last decade 2001-11 as
compared to 28.8% in 1991-01. This indicates that the growth rate has gone down as compared to the
previous decade. Compared to the national growth rate of 17.64% this rate seems to be quite high. Sex
ratio in Mizoram has improved in 2011 with 975 as against 935 in 2001. The population density per
square kilometer in the state is only 52 which is far below the national average of 382. The percentage
of literates in Mizoram is 92% for total, 94% for males and 89% for females.
Table 5: Demographic profile of Mizoram
States Population
Area
(Square
km)
Decadal
Population
growth rate
(%)
Sex-Ratio
(Number of
Females per
1000 Males)
Population
density
(per Sq.
Km.)
Literac
y Rate
(%)
Mizoram 1,091,014 21087 22.8% 975 52 92%
Source: Census of India
Nagaland
Nagaland is called so because the people residing there are called Nagas. Its population is widely
diverse, and has 16 tribes living in the state. What really sets the state apart from others in India is the
growth rate of population in Nagaland. Where, many other states have fallen prey to the population
explosion, Nagaland has not only reduced the previous growth rate of above 60%, but it has also
brought it to less than zero. The sex ratio is greater in the rural population as compared to urban.
Literacy in Nagaland has undergone an extremely positive improvement in the last decade. From the
initial literacy of only 60%, it has risen to about 80% according to census 2011. The state has only one
airport in its biggest city, Dimapur.which is around 74 Kms from the state capital Kohima. It is one of
the few states in India to have English as its official language. Due to the variation in its culture, about
20 languages are spoken in the state, Nagamese being the widely used one.

Directorate General of Hydrocarbons (DGH)
[31] Hydrocarbon Vision 2030 for Northeast India- Final Report
Figure 7: Geographical Map of Nagaland
The state has registered negative growth rate of population of -0.5% during the last decade 2001-11 as
compared to 64.5% in 1991-01.
Sex ratio in Nagaland has improved in 2011 with 931 as against 900 in 2001. The population density
per square kilometer in the state is only 119 which is far below the national average of 382. The
percentage of literates in Nagaland is 80% for total, 83% for males and 77% for females.
Table 6: Demographic profile of Nagaland
States Population
Area
(Square
km)
Decadal
Population
growth rate
(%)
Sex-Ratio
(Number of
Females
per 1000
Males)
Population
density
(per Sq.
Km.)
Literacy
Rate
(%)
Nagaland 1,980,602 16579 -0.5% 931 119 80%
Source: Census of India
Tripura
The state of Tripura is at the far north-eastern corner of India. It is spread over a small expanse of about
10,000 kilometer square, which makes it one of the smallest states in India. Although small in area, its
population density of about 300 ranks medium as compared to other states. Also the population is
growing at satisfactory rate according to 2011 Tripura census, which is great for the state progress. The
remote state has also shown rapid growth in its literacy rate since the previous census. Although
females are comparatively less in number as compared to the male count, efforts are being taken to
balance the gender ratio, which is currently above 900. Due to Lack of urbanization, the population
residing in rural area is more as compared to the urban land. About 3/4th of population lives in villages.
Agartala is the state capital of Tripura, and also one of the very few urban regions. Dharmanagar,
Udaipur, Badharghat are some other popular towns of Tripura. The culture of Tripura is a mix of
numerous other civilizations, including Bengali and Manipuri. The language widely spoken is Bengali.
The people of Tripura are famous for their attires, which include vibrant combination of red, white and
green complemented with bold ethnic jewelry.

Directorate General of Hydrocarbons (DGH)
[32] Hydrocarbon Vision 2030 for Northeast India - Final Report
Figure 8: Geographical Map of Tripura
The state has registered the population growth rate of 14.8% during the last decade 2001-11 as
compared to 16% in 1991-01. This indicates that the growth rate has gone down as compared to the
previous decade. Compared to the national growth rate of 17.64% this rate is lower. Sex ratio in Tripura
has improved slightly in 2011 with 961 as against 948 in 2001. The population density per square
kilometer in the state is 350 which is almost at par with national average of 382. The percentage of
literates in Tripura is 88% for total, 92% for males and 83% for females.
Table 7: Demographic profile of Tripura
States Population
Area
(Square
km)
Decadal
Population
growth rate
(%)
Sex-Ratio
(Number of
Females per
1000 Males)
Populatio
n density
(per Sq.
Km.)
Literacy
Rate (%)
Tripura 3,671,032 10492 14.8% 961 350 88%
Source: Census of India
Sikkim
The state of Sikkim, enveloped by the Himalayas, is a home to one of the world's highest peaks,
Kanchenjunga, and as with most of the Himalayan region, Sikkim is rich in life, variety and natural
beauty, making it a sought after tourist destination. Sikkim draws its culture from its fellow neighbors
which are Nepal, Bhutan, and Tibet, and so many dialects are spoken here. The cuisine, music and
other recreational activities like festivals are also influenced by Sikkim's border-mates. The population
density is less than 100 in Sikkim, and has undergone significant increment. In Sikkim, the growth rate
of population has considerably reduced to just above 10%. Percentage of literates however, has
increased by about 20%, which is a huge leap toward progress. Increase in female literacy also tells an
optimistic story. Hence, only over 20% of the population of Sikkim lives in cities. Sikkim comprises of 4
districts with Gangtok being the capital. Population growths in urban and rural areas shows too contrast
a picture. While, city population is growing at an alarming rate of above 150%, the rural population isn't
growing at all, but is decreasing.The languages spoken in the Sikkim state includes Nepali, Bhutia,
Lepcha, Limbu, Newari, Kulung, Gurung, Manggar, Sherpa, Tamang and Sunwar.

Directorate General of Hydrocarbons (DGH)
[33] Hydrocarbon Vision 2030 for Northeast India- Final Report
Figure 9: Geographical Map of Sikkim
The state has registered the population growth rate of 12.4% during the last decade 2001-11 as
compared to 33.1% in 1991-01. This indicates that the growth rate has gone down significantly as
compared to the previous decade. The state has done tremendously well in curbing the population
growth rate. Sex ratio in Sikkim has improved slightly in 2011 with 889 as against 875 in 2001. The
population density per square kilometer in the state is 86 which is far below the national average of 382.
The percentage of literates in Sikkim is 82% for total, 87% for males and 76% for females.
Table 8: Demographic profile of Sikkim
States Population
Area
(Square
km)
Decadal
Population
growth rate
(%)
Sex-Ratio
(Number of
Females
per 1000
Males)
Population
density
(per Sq.
Km.)
Literacy
Rate
(%)
Sikkim 607,688 7096 12.4% 889 86 82%
Source: Census of India
The table below provides summary of demographic profiles of Northeast India.
Table 9: Demographic profile of Northeast India
States Population
Area
(Square
km)
Decadal
Population
growth rate (%)
Sex-Ratio
(Number of
Females
per 1000
Males)
Population
density
(per Sq.
Km.)
Literac
y Rate
(%)
Sikkim 607,688 7096 33.06% 12.36% 875 889 76 86 82%
Arunachal
Pradesh 1,382,611 83743 27.00% 25.92% 893 920 13 17 67%
Nagaland 1,980,602 16579 64.53% -0.47% 900 931 120 119 80%
Manipur 2,721,756 22327 24.86% 18.65% 978 987 103 122 80%
Mizoram 1,091,014 21087 28.82% 22.78% 935 975 42 52 92%
Tripura 3,671,032 10492 16.03% 14.75% 948 961 305 350 88%

Directorate General of Hydrocarbons (DGH)
[34] Hydrocarbon Vision 2030 for Northeast India - Final Report
States Population
Area
(Square
km)
Decadal
Population
growth rate (%)
Sex-Ratio
(Number of
Females
per 1000
Males)
Population
density
(per Sq.
Km.)
Literac
y Rate
(%)
Meghalaya 2,964,007 22479 30.65% 27.82% 972 986 103 132 75%
Assam 31,169,272 78438 18.92% 16.93% 935 954 340 397 73%
Source: Census of India, 2011
Projected Population Growth in Northeast India
The population growth of the Northeast India has been estimated as per the trends identified over the
last two decades. It has been observed that the decadal growth rate in 2001-11 has been lower than
that of 1991-2001. Therefore, it is assumed that in the coming decades the population growth rate will
reduce further. The expected annual growth rate has been estimated as 1.7% till 2031. The table below
provides the estimated population in Northeast India in the next two decades.
Table 10: Projected Population in Northeast India
States Population
in 2001
Population
in 2011 Population in 2021 Population in 2031
Assam 26,656,000 31,169,272 35,825,961 3,9781147
Arunachal Pradesh 1,098,000 1,382,611 1,726,052 2,087,487
Manipur 2,167,000 2,721,756 3,060,342 3,321,696
Meghalaya 2,319,000 2,964,007 3,704,712 4,486,036
Mizoram 889,000 1,091,014 1,273,650 1,437,186
Nagaland 1,990,000 1,980,602 2,252,737 2,474,406
Tripura 3,199,000 3,671,032 4,165,520 4,564,160
Sikkim 541,000 607,688 659,098 714,858
Source: Census of India, CRIS Analysis
Macroeconomic Profile of Northeast India
Assam
The state of economy in terms of Rupee value of Gross State Domestic Product (GSDP) at constant
(2004-05) prices for the year 2013-14 was at around Rs. 88537.17 crore as against Rs. 83630.23 crore
for 2012-13 reflecting a growth of 5.87%. The Per Capita Income of Rs. 28383 in 2009-10 has gone up
to Rs. 46354 at current prices in 2013-14. Further, the per capita income has been growing at a CAGR
of 14.43% over the last 4-5 years, which indicates the positive development scenario in the state.
An analysis of sectoral percentage contribution to GSDP at constant (2004-05) prices from 2004-05 to
2013-14 indicate that other than service sector, the percentage contribution of agriculture and allied
activities and industry sector recorded steady decline. The agricultural sector, although the major
contributor towards the state economy, has been declining steadily and reached a level of 21.3% in
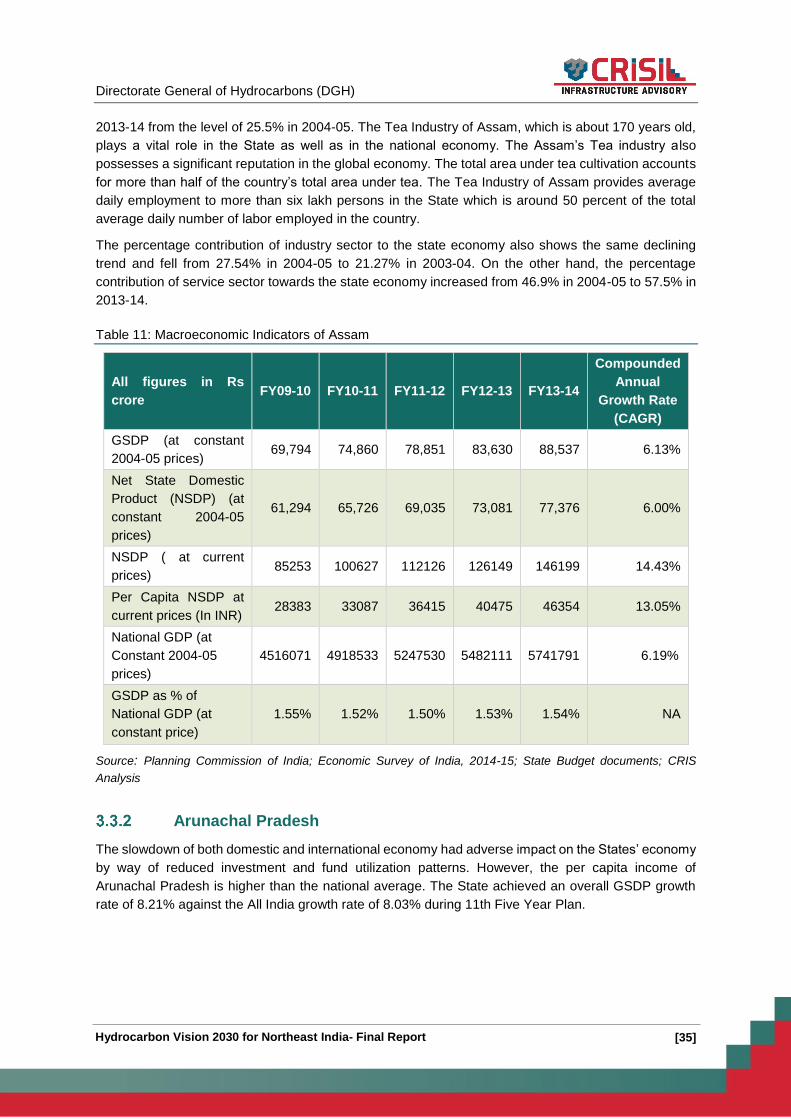
Directorate General of Hydrocarbons (DGH)
[35] Hydrocarbon Vision 2030 for Northeast India- Final Report
2013-14 from the level of 25.5% in 2004-05. The Tea Industry of Assam, which is about 170 years old,
plays a vital role in the State as well as in the national economy. The Assam’s Tea industry also
possesses a significant reputation in the global economy. The total area under tea cultivation accounts
for more than half of the country’s total area under tea. The Tea Industry of Assam provides average
daily employment to more than six lakh persons in the State which is around 50 percent of the total
average daily number of labor employed in the country.
The percentage contribution of industry sector to the state economy also shows the same declining
trend and fell from 27.54% in 2004-05 to 21.27% in 2003-04. On the other hand, the percentage
contribution of service sector towards the state economy increased from 46.9% in 2004-05 to 57.5% in
2013-14.
Table 11: Macroeconomic Indicators of Assam
All figures in Rs
crore FY09-10 FY10-11 FY11-12 FY12-13 FY13-14
Compounded
Annual
Growth Rate
(CAGR)
GSDP (at constant
2004-05 prices) 69,794 74,860 78,851 83,630 88,537 6.13%
Net State Domestic
Product (NSDP) (at
constant 2004-05
prices)
61,294 65,726 69,035 73,081 77,376 6.00%
NSDP ( at current
prices) 85253 100627 112126 126149 146199 14.43%
Per Capita NSDP at
current prices (In INR) 28383 33087 36415 40475 46354 13.05%
National GDP (at
Constant 2004-05
prices)
4516071 4918533 5247530 5482111 5741791 6.19%
GSDP as % of
National GDP (at
constant price)
1.55% 1.52% 1.50% 1.53% 1.54% NA
Source: Planning Commission of India; Economic Survey of India, 2014-15; State Budget documents; CRIS
Analysis
Arunachal Pradesh
The slowdown of both domestic and international economy had adverse impact on the States’ economy
by way of reduced investment and fund utilization patterns. However, the per capita income of
Arunachal Pradesh is higher than the national average. The State achieved an overall GSDP growth
rate of 8.21% against the All India growth rate of 8.03% during 11th Five Year Plan.

Directorate General of Hydrocarbons (DGH)
[36] Hydrocarbon Vision 2030 for Northeast India - Final Report
Table 12: Macroeconomic Indicators of Arunachal Pradesh
All figures in Rs crore FY09-10 FY10-11 FY11-12 FY12-13 FY13-14
Growth
Rate
(CAGR)
GSDP (at constant
2004-05 prices) 5,020 5,210 5,588 5,878 6,171 5.30%
NSDP (at constant
2004-05 prices) 4,530 4,725 5,063 5,319 5,582 5.36%
NSDP ( at current
prices) 6840 8352 9632 10941 12468 16.19%
Per Capita NSDP at
current prices (In INR) 51068 60935 68667 76218 84869 13.54%
National GDP (at
Constant 2004-05
prices)
4516071 4918533 5247530 5482111 5741791 6.19%
GSDP as % of National
GDP (at constant price) 0.11% 0.11% 0.11% 0.11% 0.11% NA
Source: Planning Commission of India; Economic Survey of India, 2014-15; State Budget documents; CRIS
Analysis
Manipur
The Gross State Domestic Product (GSDP) of Manipur for 2012-13 at constant prices is Rs.7892 crores
as against Rs.7231 crores for the year 2011-12 registering an increase of 9.14%. The Net State
Domestic Product (NSDP) at current prices for the year 2012-13 is Rs. 10919 crores as compared to
Rs.9746 crores for 2011-12 registering an increase of 12% over the previous year. Per capita income
at current prices is worked out to be Rs. 36937 in 2012-13 as compared to Rs. 34518 in 2010-11
indicating an increase of 7%.
Table 13: Macroeconomic Indicators of Manipur
All figures in Rs crore FY09-10 FY10-11 FY11-12 FY12-13
Growth
Rate
(CAGR)
GSDP (at constant 2004-05
prices) 6,720 6,681 7,231 7,892 5.50%
NSDP (at constant 2004-05
prices) 6,039 5,862 6,340 6,901 4.55%
NSDP ( at current prices) 7372 8020 9746 10919 13.99%
Per Capita NSDP at current
prices (in INR) 27093 28931 34518 36937 10.88%
National GDP (at Constant
2004-05 prices) 4516071 4918533 5247530 5482111 6.19%
GSDP as % of National GDP
(at constant price) 0.15% 0.14% 0.14% 0.14% NA

Directorate General of Hydrocarbons (DGH)
[37] Hydrocarbon Vision 2030 for Northeast India- Final Report
Source: Planning Commission of India; Economic Survey of India, 2014-15; State Budget documents; CRIS
Analysis
Meghalaya
At constant prices, Meghalaya's gross state domestic product (GSDP) was Rs. 13,215 crores in 2013-
14. The GSDP expanded at a compound annual growth rate (CAGR) of 13.7 per cent between 2004-
05 and 2013-14. However, the growth rate (CAGR) in GSDP at constant prices has been 8.34% over
the last 4-5 years have been 8.34% owing to slowdown in national as well as international economies.
Further, the per capita income has been growing at a CAGR of 7.92% over the last 4-5 years, which
indicates the positive development scenario in the state.
Table 14: Macroeconomic Indicators of Meghalaya
All figures in Rs crore FY09-10 FY10-11 FY11-12 FY12-13 FY13-14
Growth
Rate
(CAGR)
GSDP (at constant
2004-05 prices) 9,591 10,413 11,243 11,958 13,215 8.34%
NSDP (at constant
2004-05 prices) 8,396 9,226 9,748 10,309 11,466 8.10%
NSDP ( at current
prices) 11122 12852 15144 16070 18504 13.57%
Per Capita NSDP at
current prices (In INR) 43142 49261 50316 52090 58522 7.92%
National GDP (at
Constant 2004-05
prices)
4516071 4918533 5247530 5482111 5741791 6.19%
GSDP as % of National
GDP (at constant price) 0.21% 0.21% 0.21% 0.22% 0.23% NA
Source: Planning Commission of India; Economic Survey of India, 2014-15; State Budget documents; CRIS
Analysis
Tripura
Economy of Tripura is majorly agrarian with vast forest coverage. More than 42 percent of its population
now directly depends on agriculture & allied activities and its contribution to the Gross State Domestic
Product (GSDP) is about 25 percent in 2013-14.The land available for agricultural cultivation is relatively
restricted. Terrain and forest cover are such that only 27 percent of geographical area is cultivable in
the State, which is quite low comparing to the All India average of 43 percent. This creates further
challenges for the additional expansion of agriculture.
The average annual growth rate in real terms of Gross State Domestic Product (GSDP) at 2004-05
prices or in real terms for 2012-13 was 8.6%. The per capita income of the State also rose steadily from
Rs.24, 394 in 2004-05 to Rs.60,963 in 2012-13.

Directorate General of Hydrocarbons (DGH)
[38] Hydrocarbon Vision 2030 for Northeast India - Final Report
Table 15: Macroeconomic Indicators of Tripura
All figures in Rs crore FY09-10 FY10-11 FY11-12 FY12-13
Growth
Rate
(CAGR)
GSDP (at constant 2004-05
prices) 13,306 14,387 15,637 16,997 8.60%
NSDP (at constant 2004-05
prices) 12,287 13,215 14,339 15,585 8.25%
NSDP ( at current prices) 14162 16573 19690 22453 16.60%
Per Capita NSDP at current
prices (In INR) 39815 46050 54077 60963 15.03%
National GDP (at Constant
2004-05 prices) 4516071 4918533 5247530 5482111 6.19%
GSDP as % of National GDP
(at constant price) 0.29% 0.29% 0.30% 0.31% NA
Source: Planning Commission of India; Economic Survey of India, 2014-15; State Budget documents; CRIS
Analysis
Mizoram
The State economy is poised to grow at an impressive rate during 2012-13. Services dominate the
economy in terms of contribution to the Gross State Domestic Product (GSDP) at 57.68% of the total
GSDP (2013-14). The Industry Sector contributed 26.05% of GSDP during 2013-2014. The main driving
force of the sector is Construction Sector with a contribution of 21.91% to the GSDP in 2013-2014. The
Primary Sector comprising agriculture & allied activities contributed 16.26% (2013-2014) to the GSDP.
Table 16: Macroeconomic Indicators of Mizoram
All figures in Rs crore FY09-10 FY10-11 FY11-12 FY12-13 Growth Rate
(CAGR)
GSDP (at constant 2004-05
prices) 4,249 4,979 5,158 5,370 7.18%
NSDP (at constant 2004-05
prices) 3,832 4,539 4,692 4,877 8.37%
NSDP ( at current prices) 4717 5772 6230 7556 17.01%
Per Capita NSDP at current
prices (In INR) 42715 50956 53624 63413 14.08%
National GDP (at Constant
2004-05 prices) 4516071 4918533 5247530 5482111 6.19%
GSDP as % of National GDP
(at constant price) 0.09% 0.10% 0.10% 0.10% NA
Source: Planning Commission of India; Economic Survey of India, 2014-15; State Budget documents; CRIS
Analysis
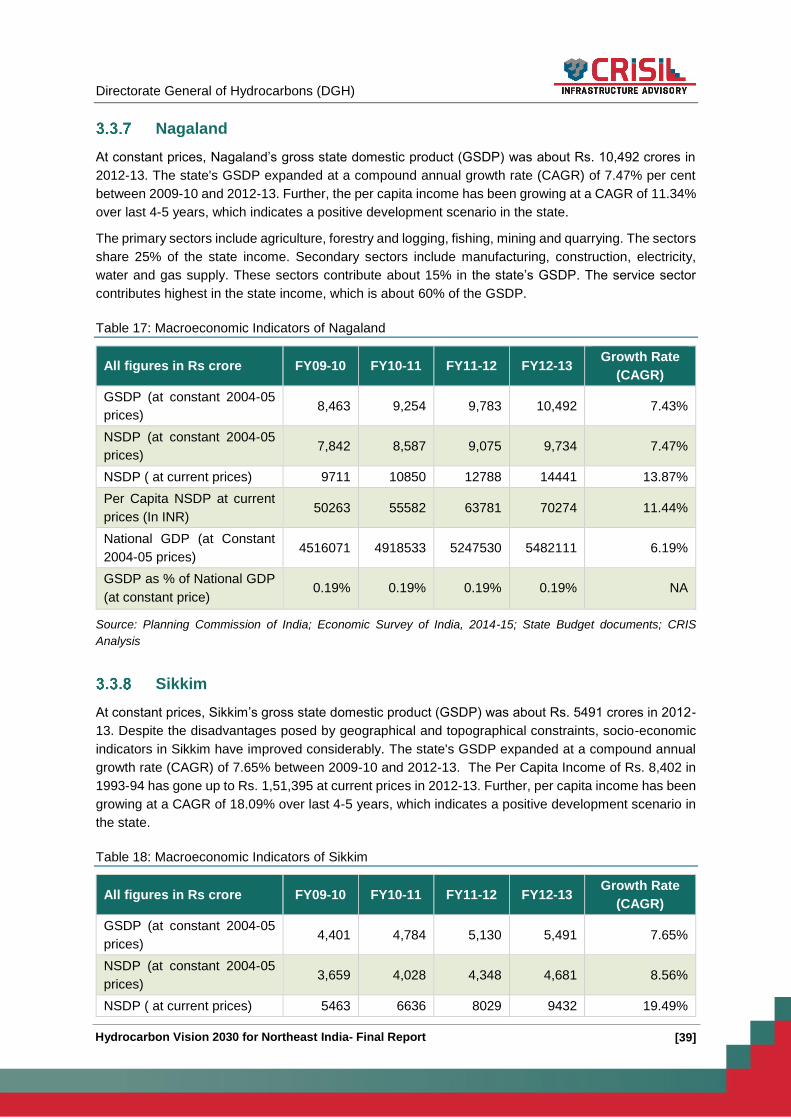
Directorate General of Hydrocarbons (DGH)
[39] Hydrocarbon Vision 2030 for Northeast India- Final Report
Nagaland
At constant prices, Nagaland’s gross state domestic product (GSDP) was about Rs. 10,492 crores in
2012-13. The state's GSDP expanded at a compound annual growth rate (CAGR) of 7.47% per cent
between 2009-10 and 2012-13. Further, the per capita income has been growing at a CAGR of 11.34%
over last 4-5 years, which indicates a positive development scenario in the state.
The primary sectors include agriculture, forestry and logging, fishing, mining and quarrying. The sectors
share 25% of the state income. Secondary sectors include manufacturing, construction, electricity,
water and gas supply. These sectors contribute about 15% in the state’s GSDP. The service sector
contributes highest in the state income, which is about 60% of the GSDP.
Table 17: Macroeconomic Indicators of Nagaland
All figures in Rs crore FY09-10 FY10-11 FY11-12 FY12-13 Growth Rate
(CAGR)
GSDP (at constant 2004-05
prices) 8,463 9,254 9,783 10,492 7.43%
NSDP (at constant 2004-05
prices) 7,842 8,587 9,075 9,734 7.47%
NSDP ( at current prices) 9711 10850 12788 14441 13.87%
Per Capita NSDP at current
prices (In INR) 50263 55582 63781 70274 11.44%
National GDP (at Constant
2004-05 prices) 4516071 4918533 5247530 5482111 6.19%
GSDP as % of National GDP
(at constant price) 0.19% 0.19% 0.19% 0.19% NA
Source: Planning Commission of India; Economic Survey of India, 2014-15; State Budget documents; CRIS
Analysis
Sikkim
At constant prices, Sikkim’s gross state domestic product (GSDP) was about Rs. 5491 crores in 2012-
13. Despite the disadvantages posed by geographical and topographical constraints, socio-economic
indicators in Sikkim have improved considerably. The state's GSDP expanded at a compound annual
growth rate (CAGR) of 7.65% between 2009-10 and 2012-13. The Per Capita Income of Rs. 8,402 in
1993-94 has gone up to Rs. 1,51,395 at current prices in 2012-13. Further, per capita income has been
growing at a CAGR of 18.09% over last 4-5 years, which indicates a positive development scenario in
the state.
Table 18: Macroeconomic Indicators of Sikkim
All figures in Rs crore FY09-10 FY10-11 FY11-12 FY12-13 Growth Rate
(CAGR)
GSDP (at constant 2004-05
prices) 4,401 4,784 5,130 5,491 7.65%
NSDP (at constant 2004-05
prices) 3,659 4,028 4,348 4,681 8.56%
NSDP ( at current prices) 5463 6636 8029 9432 19.49%
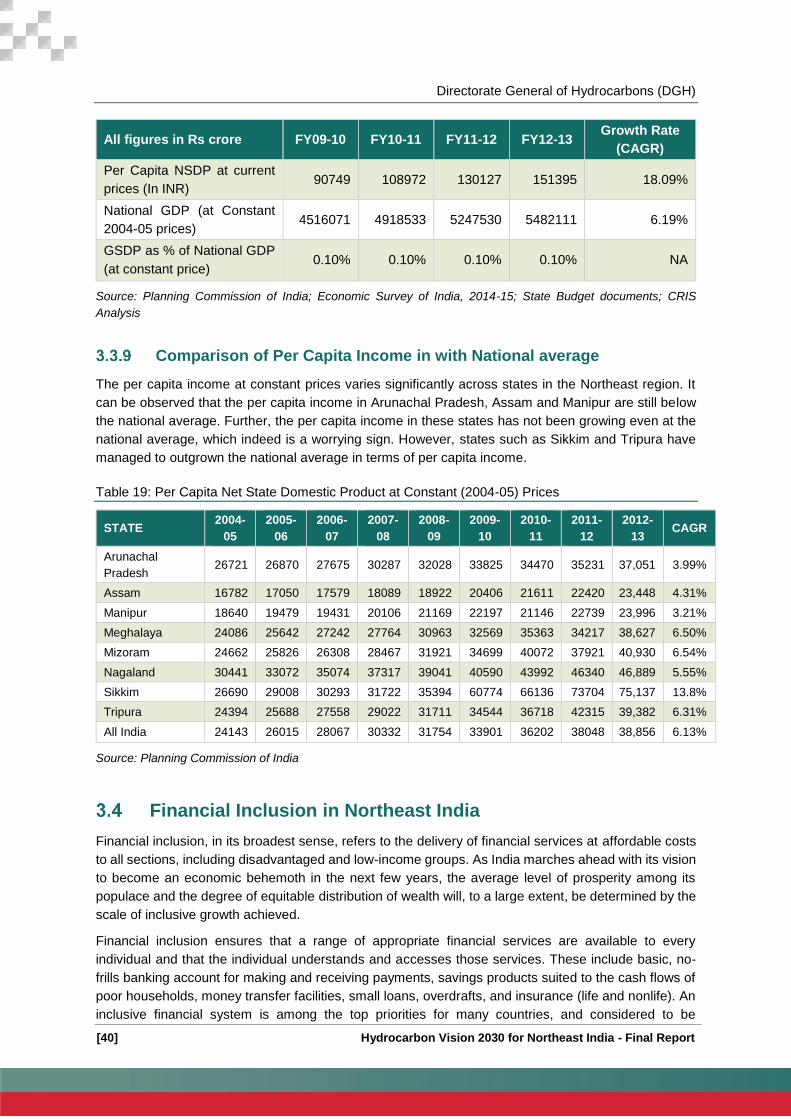
Directorate General of Hydrocarbons (DGH)
[40] Hydrocarbon Vision 2030 for Northeast India - Final Report
All figures in Rs crore FY09-10 FY10-11 FY11-12 FY12-13 Growth Rate
(CAGR)
Per Capita NSDP at current
prices (In INR) 90749 108972 130127 151395 18.09%
National GDP (at Constant
2004-05 prices) 4516071 4918533 5247530 5482111 6.19%
GSDP as % of National GDP
(at constant price) 0.10% 0.10% 0.10% 0.10% NA
Source: Planning Commission of India; Economic Survey of India, 2014-15; State Budget documents; CRIS
Analysis
Comparison of Per Capita Income in with National average
The per capita income at constant prices varies significantly across states in the Northeast region. It
can be observed that the per capita income in Arunachal Pradesh, Assam and Manipur are still below
the national average. Further, the per capita income in these states has not been growing even at the
national average, which indeed is a worrying sign. However, states such as Sikkim and Tripura have
managed to outgrown the national average in terms of per capita income.
Table 19: Per Capita Net State Domestic Product at Constant (2004-05) Prices
STATE 2004-
05
2005-
06
2006-
07
2007-
08
2008-
09
2009-
10
2010-
11
2011-
12
2012-
13 CAGR
Arunachal
Pradesh 26721 26870 27675 30287 32028 33825 34470 35231 37,051 3.99%
Assam 16782 17050 17579 18089 18922 20406 21611 22420 23,448 4.31%
Manipur 18640 19479 19431 20106 21169 22197 21146 22739 23,996 3.21%
Meghalaya 24086 25642 27242 27764 30963 32569 35363 34217 38,627 6.50%
Mizoram 24662 25826 26308 28467 31921 34699 40072 37921 40,930 6.54%
Nagaland 30441 33072 35074 37317 39041 40590 43992 46340 46,889 5.55%
Sikkim 26690 29008 30293 31722 35394 60774 66136 73704 75,137 13.8%
Tripura 24394 25688 27558 29022 31711 34544 36718 42315 39,382 6.31%
All India 24143 26015 28067 30332 31754 33901 36202 38048 38,856 6.13%
Source: Planning Commission of India
Financial Inclusion in Northeast India
Financial inclusion, in its broadest sense, refers to the delivery of financial services at affordable costs
to all sections, including disadvantaged and low-income groups. As India marches ahead with its vision
to become an economic behemoth in the next few years, the average level of prosperity among its
populace and the degree of equitable distribution of wealth will, to a large extent, be determined by the
scale of inclusive growth achieved.
Financial inclusion ensures that a range of appropriate financial services are available to every
individual and that the individual understands and accesses those services. These include basic, no-
frills banking account for making and receiving payments, savings products suited to the cash flows of
poor households, money transfer facilities, small loans, overdrafts, and insurance (life and nonlife). An
inclusive financial system is among the top priorities for many countries, and considered to be

Directorate General of Hydrocarbons (DGH)
[41] Hydrocarbon Vision 2030 for Northeast India- Final Report
instrumental in achieving equitable growth in several. Although India has adopted several measures to
advance financial inclusion, an estimated 40 per cent of its population is still without access even to
basic financial services. Financial inclusion, therefore, isn’t just an economic imperative for India, but
also a socio-political one. Financial inclusion indicators which include Branch penetration (BP), Credit
penetration (CP), and Deposit penetration (DP) provide holistic assessment on financial inclusion in
India.
Financial inclusion in Northeast India continues to be the lower than rest of the region in the country
owning to geographical as well as socio economic problems. As many as 27 of the bottom 50 districts
belong to the north-east, mainly Manipur, Arunachal Pradesh, and Nagaland, which indeed is a matter
of concern. However, states such as Tripura and Assam have been able to improve their financial
inclusion indexes owing to the presence of large micro finance institutions (MFIs). Although Northeast
India has registered improvement in macroeconomic parameters over the last few years, the
improvement has not been sufficient to catch the national average, which necessities policy makers to
further push the development agenda for the region. The table below provides state wise financial
inclusion indicators and relative rankings for the region.
Table 20: Financial Inclusion Indicators in Northeast India2
State CRISIL Inclusix Scores CRISIL Inclusix Ranks
2013 2012 2013 2012
Assam 39.6 30.4 27 30
Arunachal
Pradesh 30.5 28.4 32 32
Manipur 21.6 17.8 35 35
Meghalaya 36.4 31.6 30 28
Mizoram 42.6 39.3 24 22
Nagaland 28.9 26.1 34 33
Sikkim 46.8 41.4 18 17
Tripura 63.8 44.1 10 15
India 50.1 42.8 NA NA
Source: CRISIL Inclusix Volume III
It can be observed from the table above that except for Tripura, the rest of the states in the Northeast
India are still far below the national average as far as financial inclusion is concerned. Although the
central government has recently come up with ‘Pradhan Mantri Jan-Dhan Yojana’ for the entire country
to facilitate access to financial services to the excluded sections of society, the implementation of such
schemes needs to be monitored carefully especially for the region such as Northeast India which has
been constrained by factors such as physical connectivity, social issues, awareness etc. These
challenges compounded the penetration of every scheme that has been adopted previously. Therefore,
a Northeast focused planning and execution guideline is required to bring the region at par with rest of
the country as far as financial inclusion is concerned.
2 CRISIL Inclusix is measured on a scale of 0 to 100, with 100 indicating the maximum score achievable

Directorate General of Hydrocarbons (DGH)
[42] Hydrocarbon Vision 2030 for Northeast India - Final Report
Oil & Gas Sector Outlook in Northeast India
Sedimentary Basins
In the Northeast India, there are two sedimentary basins namely Upper Assam Shelf and Assam-Arakan
Basin. The Assam Arakan basins cover an area of 1,16,000 square kilometers and comprises of the
states of Assam, Tripura, Arunachal Pradesh, Meghalaya, Mizoram, Manipur and Nagaland.
The Upper Assam Shelf basin covers the plains of Upper Assam and part of Arunachal Pradesh
whereas Assam Arakan Fold Belt basin covers the hilly terrains of Assam, Arunachal Pradesh,
Nagaland, Manipur, Mizoram and Tripura. The Upper Assam shelf covers an approximate area of
56,000 sq. km whereas the Assam - Arakan Fold Belt covers an area of 60,000 sq.km. Upper Assam
Basin is well explored (to the tune of 90%) and the current production of oil and gas is mainly from this
basin. Assam Arakan Fold belt is a well-established Gas province. The major gas production is obtained
from Tripura. The map below shows the location of Assam-Arakan Fold belt and Assam shelf.
Figure 10: Sedimentary Basins in Northeast India
The Assam - Arakan Fold Belt has been explored till only 10% of the total area. The major part of Assam
- Arakan Fold Belt falls between the prolific hydrocarbon producing regions of Bangladesh and Myanmar
- in both these countries gas is the main producing hydrocarbon and oil production is very low. Huge
yet to find gas potential is envisaged from unexplored Assam & Assam Arakan fold belt regions in
Manipur & Mizoram , whereas Tripura would continue to add additional volumes through on-going
exploration activities that are directed to realize the potential for OTPC as well as conceptualized
fertilizer plant in the state.
Hydrocarbon Resources
The prognosticated hydrocarbon resources in Northeast India is around 18% of the national figure which
is quite significant, considering the fact that vast expanse of the region are yet to be surveyed. Till now

Directorate General of Hydrocarbons (DGH)
[43] Hydrocarbon Vision 2030 for Northeast India- Final Report
as a result of exploratory efforts by ONGC, OIL & Private companies 2224 MMt (O+OEG) inplace
hydrocarbon volumes have been established in north east. In terms of resource conversion it
corresponds to 44%. Therefore huge yet to find potential still exists in north east for exploration &
exploitation, leaving considerable opportunities to establish the remaining 56% of the hydrocarbon and
to discover, develop and produce the same. The table below provides details of prognosticated
hydrocarbon resources in Northeast India.
Table 21: Prognosticated hydrocarbon resources in Northeast India
Basin Offshore (MMT) Onland (MMT) Total (MMT) % of Total
Assam-Arakan Fold Belt 0 1860 1860 7%
Upper Assam Shelf 0 3180 3180 11%
Total NER 0 5040 5040 18%
India 18815 9270 28085 100%
Source: DGH
Further, till now in-place (established reserve) hydrocarbon volume of 2,224 MT of oil and oil equivalent
gas could be established through exploration by ONGC, OIL and Private/JV companies. Therefore,
about 56% of resources are under ‘yet to find category’ (still to be established) which clearly indicates
deficiencies/difficulties in exploration activities in the region.
Figure 11: Prognosticated vs. Established (MMTOE)
State wise recoverable reserves are given in the table below:
State
Recoverable
Reserves of Oil
in MMT
Recoverable
reserves of natural
gas in BCM
Assam 173.08 142.19
Arunachal Pradesh 2.95 0.72
Nagaland 2.69 0.12
Tripura 0.07 41.28
Source: DGH
Crude Oil & Gas Discoveries in Northeast India
Although the exploration for hydrocarbons began as early as 1866, with the country's first discovery
made at the Digboi oilfield in 1890, the level of exploration conducted till now is not very encouraging.
Only 50% of the total sedimentary basins have been explored till now, leaving out a vast expanse of
the region which is yet to be explored. The table below provides details about the area under oil & gas
exploration in the Northeast region.
5,040
2,224
2,816
-
1,000
2,000
3,000
4,000
5,000
6,000
Prognosticated reserve(MMTOE)
Established reserve (MMTOE) Still to be established (MMTOE)
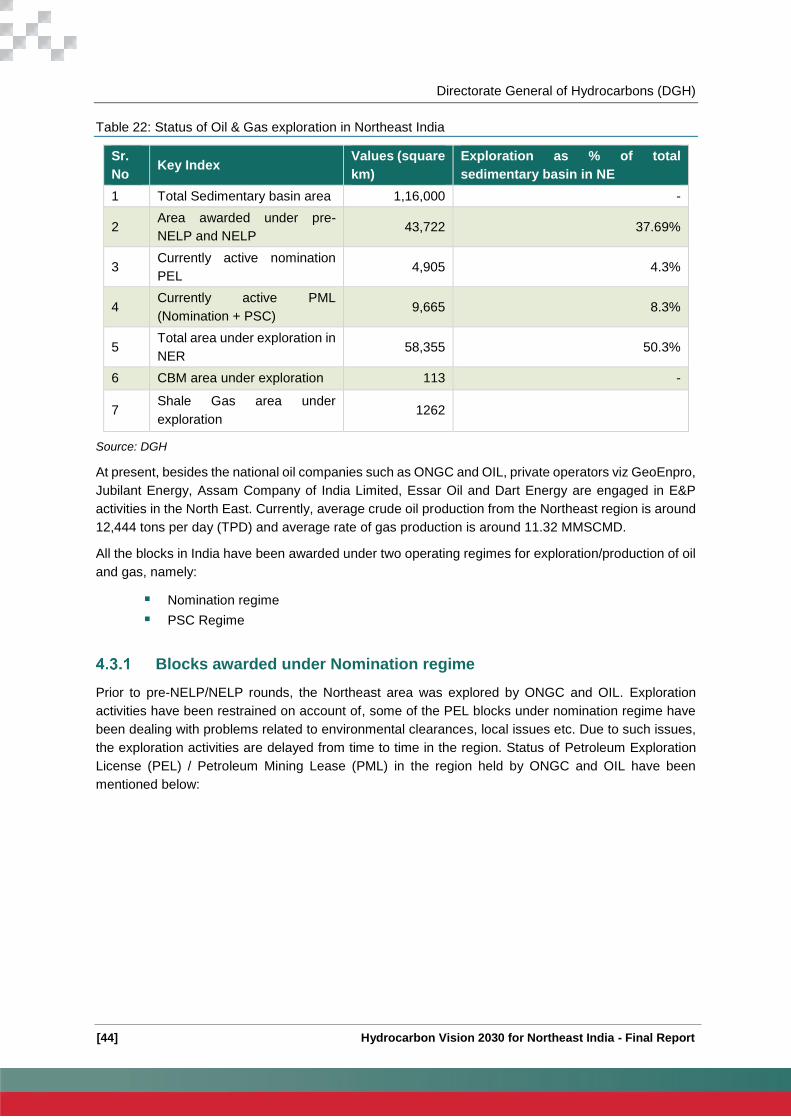
Directorate General of Hydrocarbons (DGH)
[44] Hydrocarbon Vision 2030 for Northeast India - Final Report
Table 22: Status of Oil & Gas exploration in Northeast India
Sr.
No Key Index
Values (square
km)
Exploration as % of total
sedimentary basin in NE
1 Total Sedimentary basin area 1,16,000 -
2 Area awarded under pre-
NELP and NELP 43,722 37.69%
3 Currently active nomination
PEL 4,905 4.3%
4 Currently active PML
(Nomination + PSC) 9,665 8.3%
5 Total area under exploration in
NER 58,355 50.3%
6 CBM area under exploration 113 -
7 Shale Gas area under
exploration 1262
Source: DGH
At present, besides the national oil companies such as ONGC and OIL, private operators viz GeoEnpro,
Jubilant Energy, Assam Company of India Limited, Essar Oil and Dart Energy are engaged in E&P
activities in the North East. Currently, average crude oil production from the Northeast region is around
12,444 tons per day (TPD) and average rate of gas production is around 11.32 MMSCMD.
All the blocks in India have been awarded under two operating regimes for exploration/production of oil
and gas, namely:
Nomination regime
PSC Regime
Blocks awarded under Nomination regime
Prior to pre-NELP/NELP rounds, the Northeast area was explored by ONGC and OIL. Exploration
activities have been restrained on account of, some of the PEL blocks under nomination regime have
been dealing with problems related to environmental clearances, local issues etc. Due to such issues,
the exploration activities are delayed from time to time in the region. Status of Petroleum Exploration
License (PEL) / Petroleum Mining Lease (PML) in the region held by ONGC and OIL have been
mentioned below:

Directorate General of Hydrocarbons (DGH)
[45] Hydrocarbon Vision 2030 for Northeast India- Final Report
Table 23: Status of PEL blocks under Nomination regime
Company No of
PELs
Area
(km2) Present Status
ONGC 5 1731
Out of total 1731 sq.km of PEL area held by ONGC
activities are underway in only Golaghat district PEL ( 54.4
sq.km) in Dhansiri valley area of Upper Assam
Exploration activities in one PEL block in Assam namely
Sivasagar District (84 sq.km) are constrained on account
of area falling under eco-fragile zone of Panidihing bird
sanctuary).
Exploration activities in 3 PELs in Nagaland (1590 sq.km)
are also constrained on account of non-signing of MOU
by Nagaland Govt.
OIL 5 1229 Exploratory activities are ongoing in all PELs
Source: DGH
The table below provides status of ‘Nomination’ blocks that have been in operation in Northeast India.
Table 24: Status of PML of Nomination blocks
Company No of
PMLs Area (km2) Present Status
ONGC 61
6012 besides ONGC has
also applied for 20 sq. km
area as Nambar extension
PML in South Assam shelf
Total production in FY 14-15 is
around 1.06 MMT
OIL 20 4546.01 Total production in FY 14-15 is
around 3.412 MMT
Source: DGH
The PML blocks awarded under nomination regime are the major oil and gas producing blocks in
Northeast India. However, production from these blocks is moving towards decline phase and thereby
needs to be supplemented by blocks under PSC regime.
Blocks awarded under PSC regime
4.3.2.1 Discovered field round
The following table provides status of blocks awarded in the pre-NELP regime in Northeast India.
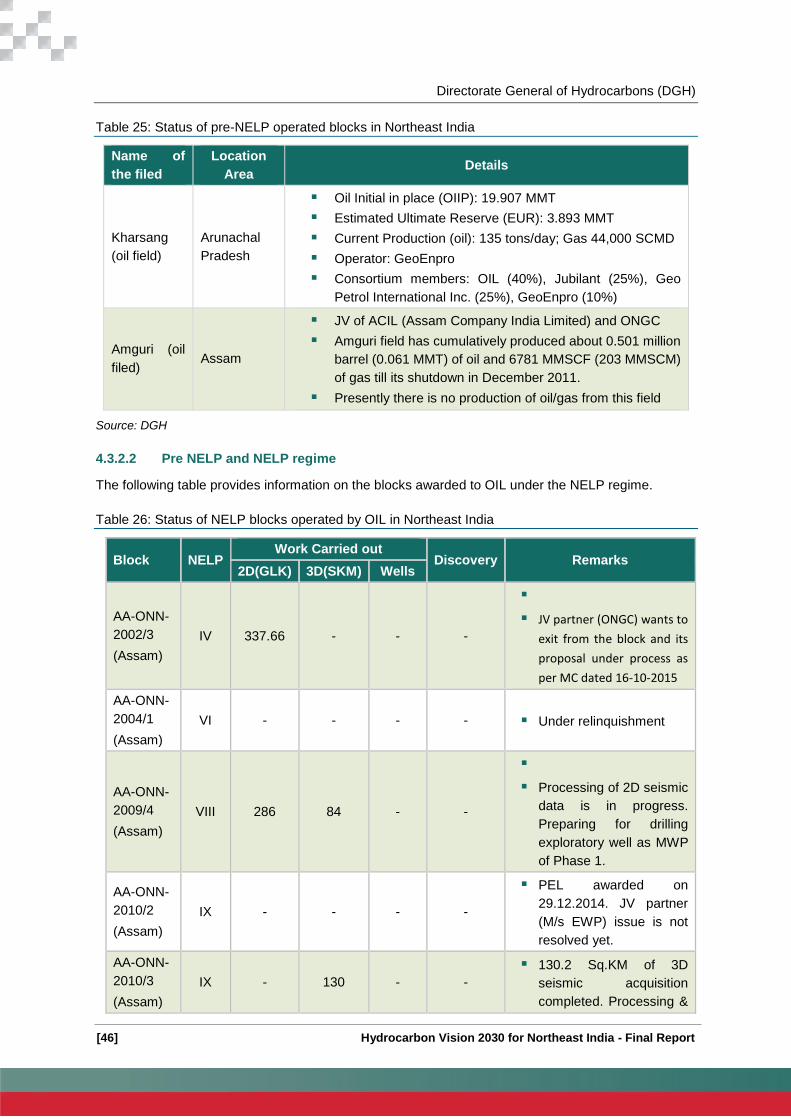
Directorate General of Hydrocarbons (DGH)
[46] Hydrocarbon Vision 2030 for Northeast India - Final Report
Table 25: Status of pre-NELP operated blocks in Northeast India
Name of
the filed
Location
Area Details
Kharsang
(oil field)
Arunachal
Pradesh
Oil Initial in place (OIIP): 19.907 MMT
Estimated Ultimate Reserve (EUR): 3.893 MMT
Current Production (oil): 135 tons/day; Gas 44,000 SCMD
Operator: GeoEnpro
Consortium members: OIL (40%), Jubilant (25%), Geo
Petrol International Inc. (25%), GeoEnpro (10%)
Amguri (oil
filed) Assam
JV of ACIL (Assam Company India Limited) and ONGC
Amguri field has cumulatively produced about 0.501 million
barrel (0.061 MMT) of oil and 6781 MMSCF (203 MMSCM)
of gas till its shutdown in December 2011.
Presently there is no production of oil/gas from this field
Source: DGH
4.3.2.2 Pre NELP and NELP regime
The following table provides information on the blocks awarded to OIL under the NELP regime.
Table 26: Status of NELP blocks operated by OIL in Northeast India
Block NELP Work Carried out
Discovery Remarks 2D(GLK) 3D(SKM) Wells
AA-ONN-
2002/3
(Assam)
IV 337.66 - - -
JV partner (ONGC) wants to
exit from the block and its
proposal under process as
per MC dated 16-10-2015
AA-ONN-
2004/1
(Assam)
VI - - - - Under relinquishment
AA-ONN-
2009/4
(Assam)
VIII 286 84 - -
Processing of 2D seismic
data is in progress.
Preparing for drilling
exploratory well as MWP
of Phase 1.
AA-ONN-
2010/2
(Assam)
IX - - - -
PEL awarded on
29.12.2014. JV partner
(M/s EWP) issue is not
resolved yet.
AA-ONN-
2010/3
(Assam)
IX - 130 - -
130.2 Sq.KM of 3D
seismic acquisition
completed. Processing &
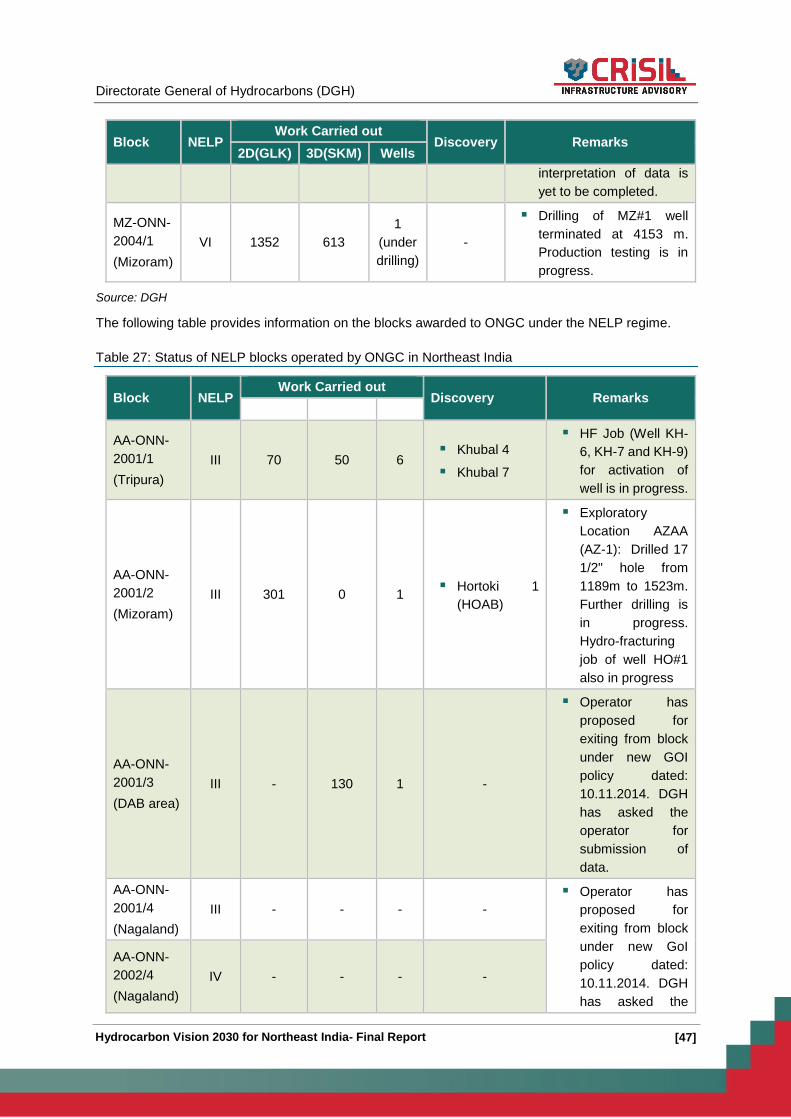
Directorate General of Hydrocarbons (DGH)
[47] Hydrocarbon Vision 2030 for Northeast India- Final Report
Block NELP Work Carried out
Discovery Remarks 2D(GLK) 3D(SKM) Wells
interpretation of data is
yet to be completed.
MZ-ONN-
2004/1
(Mizoram)
VI 1352 613
1
(under
drilling)
-
Drilling of MZ#1 well
terminated at 4153 m.
Production testing is in
progress.
Source: DGH
The following table provides information on the blocks awarded to ONGC under the NELP regime.
Table 27: Status of NELP blocks operated by ONGC in Northeast India
Block NELP Work Carried out
Discovery Remarks 2D(GLK) 3D(SKM) Wells
AA-ONN-
2001/1
(Tripura)
III 70 50 6 Khubal 4
Khubal 7
HF Job (Well KH-
6, KH-7 and KH-9)
for activation of
well is in progress.
AA-ONN-
2001/2
(Mizoram)
III 301 0 1 Hortoki 1
(HOAB)
Exploratory
Location AZAA
(AZ-1): Drilled 17
1/2" hole from
1189m to 1523m.
Further drilling is
in progress.
Hydro-fracturing
job of well HO#1
also in progress
AA-ONN-
2001/3
(DAB area)
III - 130 1 -
Operator has
proposed for
exiting from block
under new GOI
policy dated:
10.11.2014. DGH
has asked the
operator for
submission of
data.
AA-ONN-
2001/4
(Nagaland)
III - - - -
Operator has
proposed for
exiting from block
under new GoI
policy dated:
10.11.2014. DGH
has asked the
AA-ONN-
2002/4
(Nagaland)
IV - - - -

Directorate General of Hydrocarbons (DGH)
[48] Hydrocarbon Vision 2030 for Northeast India - Final Report
Block NELP Work Carried out
Discovery Remarks 2D(GLK) 3D(SKM) Wells
operator for
submission of
data.
AA-ONN-
2005/1
(DAB area)
VII - - - -
Disputed area belt
issues, under
relinquishment
AA-ONN-
2009/3
(Assam)
VIII 146 84 - -
Applied for
clearances to drill
MWP well Also
applied for
excusable delay to
MOPNG.
AA-ONJ/2
Acquisition of
104.5 LKM
completed.
Processing of 100
LKM (4.5 LKM in
the month of
September 2015)
of 2D seismic data
completed.
Source: DGH
The following table provides information on the blocks awarded to private operators under the NELP
regime.
Table 28: Status of NELP blocks operated by private operators in Northeast India
Block Operator NELP
Work Carried out
Discovery Remarks 2D
(GLK)
3D
(SKM) Wells
AA-ONN-
2004/3
(Assam)
EOL
(Essar
Energy,
Essar Oil)
VI 412 95 - -
The block
has been
relinquished.
AA-ONN-
2003/1
(Assam)
Jubilant
(JOGP,
JSPL,GS
PC, GAIL)
V 123.80 - -
Operator has
proposed for
exiting from
block under
new GOI
policy dated:
10.11.2014.
Exit from
PSC, is
under DGH

Directorate General of Hydrocarbons (DGH)
[49] Hydrocarbon Vision 2030 for Northeast India- Final Report
Block Operator NELP
Work Carried out
Discovery Remarks 2D
(GLK)
3D
(SKM) Wells
consideratio
n.
AA-ONN-
2004/5
(Assam)
EOL
(Essar
Energy,
Essar Oil)
VI 183 69 - -
Operator
proposed for
relinquishme
nt due to
delay in
Environment
al clearance.
Cost of
UMWP has
been
approved by
the MoPNG.
AA-ONN-
2009/1
(Manipur)
Jubilant
(JOGPL,
JEKPL,
JOPDL)
VIII 130.63 - - -
Environment
al clearance /
forest
clearance
awaited from
MoEF.
AA-ONN-
2002/1
(Tripura)
Jubilant
(JOGPL,
GAIL)
IV 206 - -
2
(Katharcha
ri,
Athamura)
MC has
approved
FDP on
05.08.15.
AAP-
ONN-94/1
(R-VIII)
(Assam)
HOEC
(HOEC,
OIL, IOC)
Pre-
NELP - - 3 1 (Dirok)
FDP has
been
approved on
28.03.15
AA-ON/7
(Assam/
Nagaland
)
ACL
Assam part
of the Block
relinquished
the on
27.03.2008.
Operator
requested for
additional
period for
Nagaland
part because
of delay in
obtaining

Directorate General of Hydrocarbons (DGH)
[50] Hydrocarbon Vision 2030 for Northeast India - Final Report
Block Operator NELP
Work Carried out
Discovery Remarks 2D
(GLK)
3D
(SKM) Wells
PEL for
Nagaland.
Source: DGH
The table below summarizes hydrocarbon discoveries made under PSC regime in Northeast India.
Table 29: Hydrocarbon discoveries under PSC in NER as on May, 2015
BLOCK
NAME Operator State
Discovery
Name
Time of
Discovery Status
AAP-ON-
94/1 HOEC Assam Dirok-1 Jan 2008
FDP approved
GIIP-244.5 BCF
EUR-134.09 BCF
AA-ONN-
2001/1 ONGC Tripura
Khubal-4 Dec 2013
Discoveries in early stage
Under Appraisal by
Operator
KH-07 Feb 2009
New discoveries for which
appraisal programme is to
be submitted.
AA-ONN-
2001/2 ONGC Mizoram HOAB Dec 2011
New discoveries for which
appraisal programme is to
be submitted
AA-ONN-
2002/1 JOGPL Tripura
Kathalchari-1 Feb 2010 FDP has been approved
Atharamura-
1 Jul 2013
MC vide MCR dated
05.08.2015 reviewed the
FDP of Kathalchari-1
Discovery.
N Ambassa Nov 2009 Discovery not pursued as
commercially not viable
Source: DGH

Directorate General of Hydrocarbons (DGH)
[51] Hydrocarbon Vision 2030 for Northeast India- Final Report
Hydrocarbon Value Chain – North East India
Figure 12: Hydrocarbon value chain in Northeast India

Directorate General of Hydrocarbons (DGH)
[52] Hydrocarbon Vision 2030 for Northeast India - Final Report
Upstream
The upstream oil sector is also commonly known as the exploration and production (E&P) sector. The
upstream sector includes searching for potential underground or underwater crude oil and natural gas
fields, drilling of exploratory wells, and subsequently drilling and operating the wells that recover and
bring the crude oil and/or raw natural gas to the surface. Brief profiles of key entities operating in this
segment in the North East have been presented below.
Entity Name Profile
ONGC
55 discoveries at Assam and drilled about 1225 wells with offices at
Nazira,Sivasagar, Jorhat and Silchar, 17 discoveries in Tripura, 3
discoveries in Nagaland and 1 in Mizoram.
Owns a network of 230 Kms of trunk pipelines and 2000 kms of flow lines.
More than 200 wells are planned in next five years.
Produces around 1.0 MMTPA of crude oil and 4.3 mmscmd of Gas from
NER
OIL
Owns the country’s oldest oil field, Digboi.
Owns longest crude oil pipeline in NER of around 1157 KM from Duliajan
to Barauni.
Produces 3.4 MMTPA of crude oil, 7 MMSCMD of Natural Gas and over
50,000 Tonnes of LPG annually from NER.
JUBILANT
ENERGY
Emerging private sector oil and gas player in India engaged in hydrocarbon
exploration and production since 1995.
Exploration licensee for AA-ONN-2002/1 (Tripura Sub Basin in Assam-
Arakam Basin) and AA-ONN-2003/1 (Assam-Arakam Basin).
ESSAR OIL
Horizontally integrated enterprise with capabilities including drilling rigs,
services equipment, engineering and construction, etc.
Essar Oil also has two on-land gas blocks in Assam, located in the prolific
Assam-Arakan frontier basin in the north-eastern part of India; it has
completed 2D seismic analysis of both the blocks.
HOEC
First private company in India to enter oil and gas exploration sector
Owns exploration share of 40 % and production share of 26 % in AAP-ON-
94/1, Assam as an operator.
GeoEnpro
GeoEnpro Petroleum Limited, a registered Indian company and a 50:50
joint venture between Jubilant Enpro Pvt. Ltd and Geopetrol Mauritus Ltd,
is the operating company for the Kharsang Oil Field, Arunachal Pradesh,
India. GeoEnpro became a Consortium partner & operator of the Kharsang
Production Sharing Contract (PSC), the first ever medium sized onshore
oilfield awarded by the Indian government for private participation in the
year 1995
Assam Oil
Company
Limited (ACIL)
Assam Company India Limited is an operator for Amguri Block.
Directorate General of Hydrocarbons (DGH)
[53] Hydrocarbon Vision 2030 for Northeast India- Final Report
Midstream
The midstream sector involves the transportation (by pipeline, rail, barge, oil tanker or truck), storage,
and wholesale marketing of crude or refined petroleum products. Pipelines and other transport systems
can be used to move crude oil from production sites to refineries and deliver various refined products
to downstream distributors. Natural gas pipeline networks aggregate gas from natural gas purification
plants and deliver it to downstream customers, such as local utilities. Brief profiles of key entities
operating in this segment in the North East have been presented below.
Entity
Name Presence in NER
Oil
Own and operates 1157 kilometers long fully automated telemetric pipeline with
212 kilometers of looping having a total capacity to transport over 5.38 MMTPA.
This pipeline is partially used for transportation of imported crude from Barauni
to Bongaigaon Refinery (Reverse section) and partially for transportation of
crude from Duliajan to Guwahati refinery (Forward section)
Owns and operates 35 KM crude pipeline from Duliajan to Digboi.
Also operates gas pipeline Duliajan-Numaligarh through a JV company DNP
Limited (JV of AGCL, NRL and OIL)
Also own and operate Numaligarh-Siliguri product pipeline (NSPL).
GAIL
Owns and operate 2 pipelines in Lakwa and Tripura for gas transportation.
Has stake in TNGCL (Tripura Natural Gas company Limited) which is a CGD
operator in Tripura
IOCL
Mainly operates product pipeline from Refinery to major cities.
Guwahati-Siliguri (GSPL) and Digboi-Tinsukia (DTPL) product pipelines are
operated by IOCL.
ONGC Operates 3 pipelines of distance around 45 KM in Johrat Area.
Downstream
The downstream sector commonly refers to the refining of crude oil processing and purification of raw
natural gas, as well as the marketing and distribution of products derived from crude oil and natural gas.
The downstream sector touches consumers through products such as gasoline or petrol, kerosene, jet
fuel, diesel oil, heating oil, fuel oil, lubricants, waxes, asphalt, natural gas, and liquefied petroleum gas
(LPG) as well as hundreds of petrochemicals. Brief profiles of key entities operating in this segment in
the North East have been presented below.
Entity Name Presence in NER
Digboi Refinery
(IOCL)
India's oldest refinery commissioned in 1901
Current capacity of the refinery is 0.65 MMTPA
Guwahati Refinery
(IOCL) Current refining capacity is 1.0 MMTPA
Bongaigaon
Refinery (IOCL)
Formed by the amalgamation of Bongaigaon Refinery &
Petrochemicals Limited (BRPL) with Indian Oil on March 25. 2009,
Bongaigaon refinery is situated at Dhaligaon in Chirang district of
Assam, 200 km west of Guwahati.
The present capacity of the Refinery is 2.35 MMTPA.

Directorate General of Hydrocarbons (DGH)
[54] Hydrocarbon Vision 2030 for Northeast India - Final Report
Entity Name Presence in NER
Numaligarh
Refinery Limited
(BPCL)
Set up in accordance with the provisions made in the historic Assam
Accord was commissioned in October 2000, and is popularly known
as “Assam Accord Refinery”
The present capacity of the Refinery is 3.00 MMTPA.
BCPL
A joint venture of GAIL, OIL, NRL & Govt of Assam, Brahmaputra
Cracker and Polymer Limited (BCPL), is set up to construct a
Greenfield petrochemical plant in Dibrugarh, Assam with a nameplate
capacity of 220 KTA of HDPE & LLDPE and 60 KTA of PP.
BVFCL
The Namrup Fertilizer Complex, renamed as Brahmaputra Valley
Fertilizer Corporation Limited after bi-furcation from erstwhile
Hindustan Fertilizer Corporation Limited is the first factory of its kind
in India to use associated natural gas as basic raw material for
producing nitrogenous fertilizer
Power Plants
Gas based Power Plants has been set up by
NEEPCO
Assam State Govt (ASEB)
Tripura State Govt (TSECL)
ONGC Tripura Power Corporation (OTPC)
Assam Gas
Company Ltd
(AGCL)
First gas transportation business started in the year 1967
Network of underground natural gas trunk and distribution pipelines
that serves about 380 tea estates, 900 commercial establishments,
about 27,500 domestic consumers and several big industrial
consumers in the districts of Dibrugarh, Tinsukia, Sivasagar, Jorhat,
Golaghat and Cachar in Assam.
Tripura Natural
Gas Company
Limited (TNGCL)
Incorporated in July 1990 and restructured on February 2005, with
joining of GAIL as a major shareholder in order to facilitate the
introduction of CNG in the transport sector of Tripura.
Supplies gas to around 20,000 domestic, 300 commercial and 47
small industrial consumers and has set up 5 CNG station in Agartala,
which is catering to more than 11,000 vehicles.
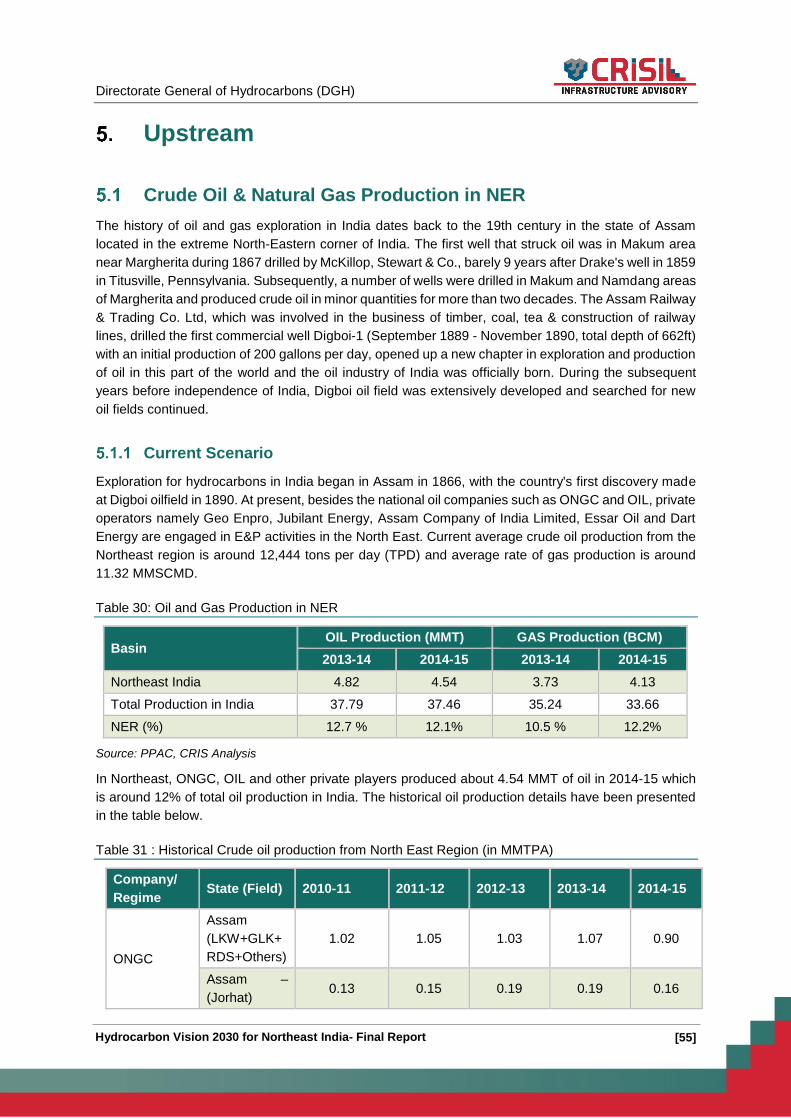
Directorate General of Hydrocarbons (DGH)
[55] Hydrocarbon Vision 2030 for Northeast India- Final Report
Upstream
Crude Oil & Natural Gas Production in NER
The history of oil and gas exploration in India dates back to the 19th century in the state of Assam
located in the extreme North-Eastern corner of India. The first well that struck oil was in Makum area
near Margherita during 1867 drilled by McKillop, Stewart & Co., barely 9 years after Drake's well in 1859
in Titusville, Pennsylvania. Subsequently, a number of wells were drilled in Makum and Namdang areas
of Margherita and produced crude oil in minor quantities for more than two decades. The Assam Railway
& Trading Co. Ltd, which was involved in the business of timber, coal, tea & construction of railway
lines, drilled the first commercial well Digboi-1 (September 1889 - November 1890, total depth of 662ft)
with an initial production of 200 gallons per day, opened up a new chapter in exploration and production
of oil in this part of the world and the oil industry of India was officially born. During the subsequent
years before independence of India, Digboi oil field was extensively developed and searched for new
oil fields continued.
Current Scenario
Exploration for hydrocarbons in India began in Assam in 1866, with the country's first discovery made
at Digboi oilfield in 1890. At present, besides the national oil companies such as ONGC and OIL, private
operators namely Geo Enpro, Jubilant Energy, Assam Company of India Limited, Essar Oil and Dart
Energy are engaged in E&P activities in the North East. Current average crude oil production from the
Northeast region is around 12,444 tons per day (TPD) and average rate of gas production is around
11.32 MMSCMD.
Table 30: Oil and Gas Production in NER
Basin OIL Production (MMT) GAS Production (BCM)
2013-14 2014-15 2013-14 2014-15
Northeast India 4.82 4.54 3.73 4.13
Total Production in India 37.79 37.46 35.24 33.66
NER (%) 12.7 % 12.1% 10.5 % 12.2%
Source: PPAC, CRIS Analysis
In Northeast, ONGC, OIL and other private players produced about 4.54 MMT of oil in 2014-15 which
is around 12% of total oil production in India. The historical oil production details have been presented
in the table below.
Table 31 : Historical Crude oil production from North East Region (in MMTPA)
Company/
Regime State (Field) 2010-11 2011-12 2012-13 2013-14 2014-15
ONGC
Assam
(LKW+GLK+
RDS+Others)
1.02 1.05 1.03 1.07 0.90
Assam –
(Jorhat) 0.13 0.15 0.19 0.19 0.16

Directorate General of Hydrocarbons (DGH)
[56] Hydrocarbon Vision 2030 for Northeast India - Final Report
Company/
Regime State (Field) 2010-11 2011-12 2012-13 2013-14 2014-15
Tripura 0 0 0.00 0.00 0.00
Total
Production by
ONGC
1.15 1.21 1.23 1.27 1.06
OIL
Assam 3.56 3.82 3.64 3.45 3.41
Arunachal
Pradesh 0.02 0.03 0.02 0.02 0.01
Total
Production by
OIL
3.59 3.85 3.66 3.47 3.41
Others/PSC
(Kharsang_D
irok)
0.10 0.09 0.10 0.09 0.07
Total 4.84 5.14 4.98 4.82 4.54
Source: DGH/ONGC/OIL
The historical gas production details from Northeast India have been presented in the table below.
Table 32: Historical Gas Production from North East (in MMSCM)
Company/
Regime Field (State) 2010-11
2011-
12 2012-13 2013-14 2014-15
ONGC
Assam
(LKW+GLK+RDS+Others) 394 428 418 404 399
Assam (Jorhat) 42 55 54 54 49
Assam (Silchar) 27 22 13 1 1
Tripura 610 644 647 822 1140
Total Production by ONGC 1073 1149 1132 1281 1589
OIL
Assam 2178 2392 2425 2409 2510
Arunachal Pradesh 17 18 19 19 12
Total Production by OIL 2195 2410 2444 2428 2522
PSC/Others 70 30 22 22 22
Total 3,338 3,589 3,598 3,731 4,132
Total Gas (
MMSCMD) 9.15 9.83 9.86 10.22 11.32
Source: DGH/ONGC/OIL
5.1.1.1 Trend of Crude Oil and Natural Gas Production in Northeast India
Crude oil production has witnessed a declining trend over the past 5 five years on account of decline in
production from already matured fields and inability to start production from new areas. Since the
existing fields are already matured, the key to ramping up production lies inability of companies to
develop and produce from yet to find areas (YTF). The table above shows the past 5 year field and
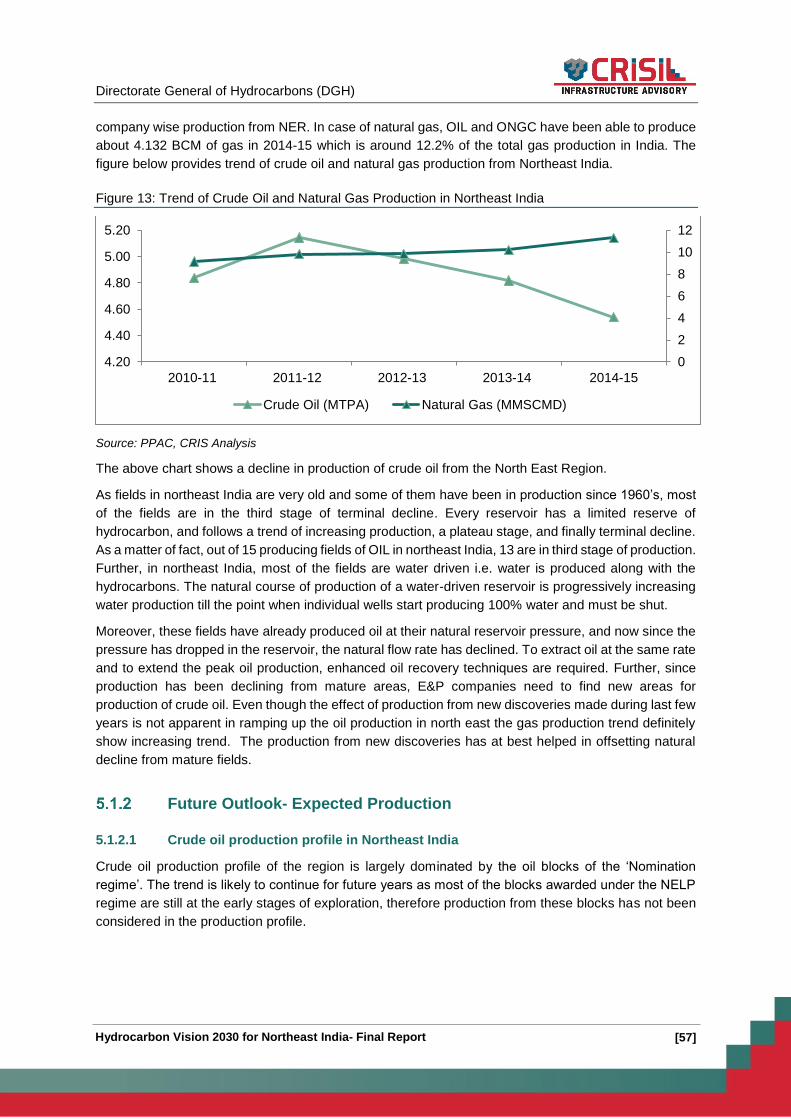
Directorate General of Hydrocarbons (DGH)
[57] Hydrocarbon Vision 2030 for Northeast India- Final Report
company wise production from NER. In case of natural gas, OIL and ONGC have been able to produce
about 4.132 BCM of gas in 2014-15 which is around 12.2% of the total gas production in India. The
figure below provides trend of crude oil and natural gas production from Northeast India.
Figure 13: Trend of Crude Oil and Natural Gas Production in Northeast India
Source: PPAC, CRIS Analysis
The above chart shows a decline in production of crude oil from the North East Region.
As fields in northeast India are very old and some of them have been in production since 1960’s, most
of the fields are in the third stage of terminal decline. Every reservoir has a limited reserve of
hydrocarbon, and follows a trend of increasing production, a plateau stage, and finally terminal decline.
As a matter of fact, out of 15 producing fields of OIL in northeast India, 13 are in third stage of production.
Further, in northeast India, most of the fields are water driven i.e. water is produced along with the
hydrocarbons. The natural course of production of a water-driven reservoir is progressively increasing
water production till the point when individual wells start producing 100% water and must be shut.
Moreover, these fields have already produced oil at their natural reservoir pressure, and now since the
pressure has dropped in the reservoir, the natural flow rate has declined. To extract oil at the same rate
and to extend the peak oil production, enhanced oil recovery techniques are required. Further, since
production has been declining from mature areas, E&P companies need to find new areas for
production of crude oil. Even though the effect of production from new discoveries made during last few
years is not apparent in ramping up the oil production in north east the gas production trend definitely
show increasing trend. The production from new discoveries has at best helped in offsetting natural
decline from mature fields.
Future Outlook- Expected Production
5.1.2.1 Crude oil production profile in Northeast India
Crude oil production profile of the region is largely dominated by the oil blocks of the ‘Nomination
regime’. The trend is likely to continue for future years as most of the blocks awarded under the NELP
regime are still at the early stages of exploration, therefore production from these blocks has not been
considered in the production profile.
0
2
4
6
8
10
12
4.20
4.40
4.60
4.80
5.00
5.20
2010-11 2011-12 2012-13 2013-14 2014-15
Crude Oil (MTPA) Natural Gas (MMSCMD)

Directorate General of Hydrocarbons (DGH)
[58] Hydrocarbon Vision 2030 for Northeast India - Final Report
Figure 14: Methodology for Production Forecast of Crude Oil in NER
Based on the above methodology the estimated Crude Oil production in North East Region has been
presented below – with Indicative and without indicative Firm production profile of Crude Oil from 2021-
22 onwards has been considered at same level. However there may be reduction in production due to
matured fields.
Figure 15: Production Forecast for Crude Oil in NER (in MMTPA) (Without Indicative)
Source: ONGC, OIL, DGH, CRIS Analysis
Production from currently producing Nomination blocks of all assets of ONGC, OIL and PSC blocks
Estimating Growth rates across different assets for all the producing fields in NER
Forecasting overall indicative production for Northeast Region
4.5
5.11 5.0 5.1 5.0 4.9 4.86 4.8 4.7 4.7 4.6 4.6
0
1
2
3
4
5
6
201
4-1
5
201
9-2
0
202
0-2
1
202
1-2
2
202
2-2
3
202
3-2
4
202
4-2
5
202
5-2
6
202
6-2
7
202
7-2
8
202
8-2
9
202
9-3
0
ONGC OIL Others Total
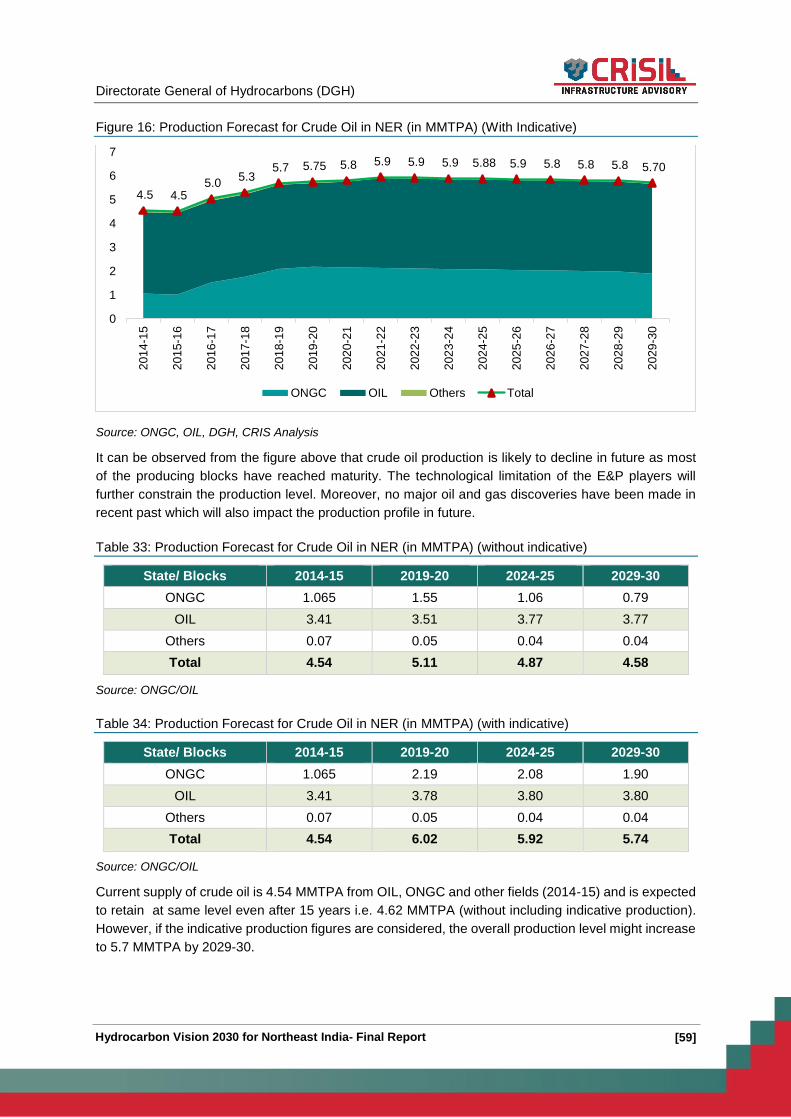
Directorate General of Hydrocarbons (DGH)
[59] Hydrocarbon Vision 2030 for Northeast India- Final Report
Figure 16: Production Forecast for Crude Oil in NER (in MMTPA) (With Indicative)
Source: ONGC, OIL, DGH, CRIS Analysis
It can be observed from the figure above that crude oil production is likely to decline in future as most
of the producing blocks have reached maturity. The technological limitation of the E&P players will
further constrain the production level. Moreover, no major oil and gas discoveries have been made in
recent past which will also impact the production profile in future.
Table 33: Production Forecast for Crude Oil in NER (in MMTPA) (without indicative)
State/ Blocks 2014-15 2019-20 2024-25 2029-30
ONGC 1.065 1.55 1.06 0.79
OIL 3.41 3.51 3.77 3.77
Others 0.07 0.05 0.04 0.04
Total 4.54 5.11 4.87 4.58
Source: ONGC/OIL
Table 34: Production Forecast for Crude Oil in NER (in MMTPA) (with indicative)
State/ Blocks 2014-15 2019-20 2024-25 2029-30
ONGC 1.065 2.19 2.08 1.90
OIL 3.41 3.78 3.80 3.80
Others 0.07 0.05 0.04 0.04
Total 4.54 6.02 5.92 5.74
Source: ONGC/OIL
Current supply of crude oil is 4.54 MMTPA from OIL, ONGC and other fields (2014-15) and is expected
to retain at same level even after 15 years i.e. 4.62 MMTPA (without including indicative production).
However, if the indicative production figures are considered, the overall production level might increase
to 5.7 MMTPA by 2029-30.
4.5 4.5 5.0
5.3 5.7 5.75 5.8 5.9 5.9 5.9 5.88 5.9 5.8 5.8 5.8 5.70
0
1
2
3
4
5
6
72
01
4-1
5
201
5-1
6
201
6-1
7
201
7-1
8
201
8-1
9
201
9-2
0
202
0-2
1
202
1-2
2
202
2-2
3
202
3-2
4
202
4-2
5
202
5-2
6
202
6-2
7
202
7-2
8
202
8-2
9
202
9-3
0
ONGC OIL Others Total

Directorate General of Hydrocarbons (DGH)
[60] Hydrocarbon Vision 2030 for Northeast India - Final Report
5.1.2.2 Natural gas production profile in North East India
Under the PSC (JV) regime, two discovered fields were awarded under Medium and ‘Small Sized
Discovered Fields’ rounds of bidding. The Medium Sized field ‘Kharsang’ in Arunachal Pradesh,
covering an area of 11 Sq. Km was awarded in 1995 and the Small Sized field Amguri in Assam,
covering an area of about 52.57 Sq. Km was awarded in 2001.
Figure 17: Methodology for Production Forecast of Gas in NER
The production profile from both Kharsang and Amguri blocks has been considered for forecasting gas
production profile. Further, gas production from Tripura asset is likely to provide much needed boost for
the region. Moreover, there can be significant increase in the gas production from this region,
particularly through exploration in Arunachal Pradesh and Mizoram.
Natural gas production profile for the coming years from the northeast region has been presented below.
Figure 18: Production Forecast for Natural Gas in NER (in MMSCMD) without Indicative
Source: ONGC, OIL, DGH, CRIS Analysis
Firm production profile of gas from 2021-22 onwards has been considered at same level. However there
may be increase in firm production of gas.
Production from currently producing Nomination blocks of ONGC and OIL and PSC blocks of Kharsang, Dirok, Kathalchari and Amguri
Estimating Growth rates across the producing fields in NER
Indicative production from recently discovered Mizoram, Kharsang and Manipur blocks
Forecasting overall indicative production for Northeast Region
9.1 11.3
16.2 17.2
16.0 15.8 15.4 15.3
- 2.0 4.0 6.0 8.0
10.0 12.0 14.0 16.0 18.0 20.0
201
0-1
1
201
1-1
2
201
2-1
3
201
3-1
4
201
4-1
5
201
5-1
6
201
6-1
7
201
7-1
8
201
8-1
9
201
9-2
0
202
0-2
1
202
1-2
2
202
2-2
3
202
3-2
4
202
4-2
5
202
5-2
6
202
6-2
7
202
7-2
8
202
8-2
9
202
9-3
0
ONGC OIL Others Total
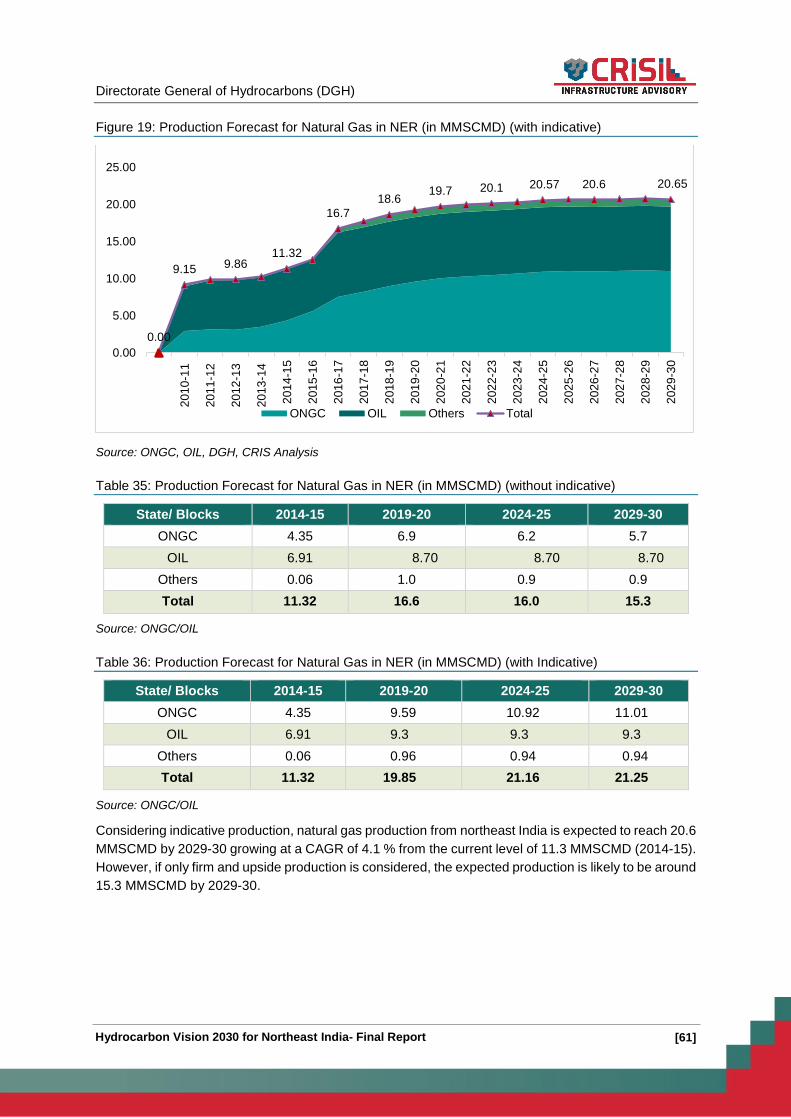
Directorate General of Hydrocarbons (DGH)
[61] Hydrocarbon Vision 2030 for Northeast India- Final Report
Figure 19: Production Forecast for Natural Gas in NER (in MMSCMD) (with indicative)
Source: ONGC, OIL, DGH, CRIS Analysis
Table 35: Production Forecast for Natural Gas in NER (in MMSCMD) (without indicative)
State/ Blocks 2014-15 2019-20 2024-25 2029-30
ONGC 4.35 6.9 6.2 5.7
OIL 6.91 8.70 8.70 8.70
Others 0.06 1.0 0.9 0.9
Total 11.32 16.6 16.0 15.3
Source: ONGC/OIL
Table 36: Production Forecast for Natural Gas in NER (in MMSCMD) (with Indicative)
State/ Blocks 2014-15 2019-20 2024-25 2029-30
ONGC 4.35 9.59 10.92 11.01
OIL 6.91 9.3 9.3 9.3
Others 0.06 0.96 0.94 0.94
Total 11.32 19.85 21.16 21.25
Source: ONGC/OIL
Considering indicative production, natural gas production from northeast India is expected to reach 20.6
MMSCMD by 2029-30 growing at a CAGR of 4.1 % from the current level of 11.3 MMSCMD (2014-15).
However, if only firm and upside production is considered, the expected production is likely to be around
15.3 MMSCMD by 2029-30.
0.00
9.15 9.8611.32
16.7
18.619.7 20.1 20.57 20.6 20.65
0.00
5.00
10.00
15.00
20.00
25.00
201
0-1
1
201
1-1
2
201
2-1
3
201
3-1
4
201
4-1
5
201
5-1
6
201
6-1
7
201
7-1
8
201
8-1
9
201
9-2
0
202
0-2
1
202
1-2
2
202
2-2
3
202
3-2
4
202
4-2
5
202
5-2
6
202
6-2
7
202
7-2
8
202
8-2
9
202
9-3
0
ONGC OIL Others Total

Directorate General of Hydrocarbons (DGH)
[62] Hydrocarbon Vision 2030 for Northeast India - Final Report
Key Issues in upstream sector
Key Issues Descriptions
Production Related Issues
Declining
Production of Oil
For both ONGC and OIL, crude oil production has declined at the rate
of 4% over the past 4 years.
There have been no major oil and gas discoveries over the past few
years to supplement the decline in current production levels.
Hindrance to adoption of new technology due to limited availability and
cost factors.
Low acreages
Pre-NELP (PEL & PML Acreages)
As the nomination acreages were nearing its phase of initial 7 years and
NELP process had already started in 1998, the nomination acreage was
either converted as PML on exploration success or the area was
surrendered. This has resulted into acreage relinquishment for the
NOCs in the region as they could not convert it into PML due to issues
ranging from difficult geographical terrain, environmental clearance and
infrastructure constraints.
The combined number of PML and PEL acreages for ONGC shrunk
from approximately 15,000 km2 to 1731 km2 (PEL) & 6012 km2 (PML)
as on date. In addition to this, PEL area available for expending
exploratory inputs is confined to Assam, half of which falls in eco-fragile
zone which has further constrained the E&P activities in the region.
PMLs are outcome of successful exploratory efforts, and are concerned
primarily with obtaining production. However, some blocks being offered
had either been relinquished or recycled since these were too small to
effectively discharge exploration activities.
NELP Acreages
Many blocks awarded in Assam & Nagaland are under process of
relinquishment and very few acreages have been offered in Arunachal
Pradesh, Meghalaya & Sikkim. In case blocks in Mizoram, limited
exploratory inputs can be expended in tune with PSC & Committed
program. In Assam, approx. 80% of the blocks fall under Wild life
sanctuary wherein exploration is constrained.
Other Issues
Acreages on offer are much lower than the actual potential in terms of
volume and spread across geographical area.
Most of the acreages are land locked consisting of private property.
Low acreages leading to limited presence of operators and low
momentum. The limited number of acreages deprives service providers
of the continuity of the business thus making the investment to set up
base unviable for the region.
Inadequate Crude
Availability
Though region’s refineries are primarily dependent on crude oil supplies
from local oil fields, production of crude has been inadequate to meet
requirements of the four units in the region. Extra efforts put by OIL and
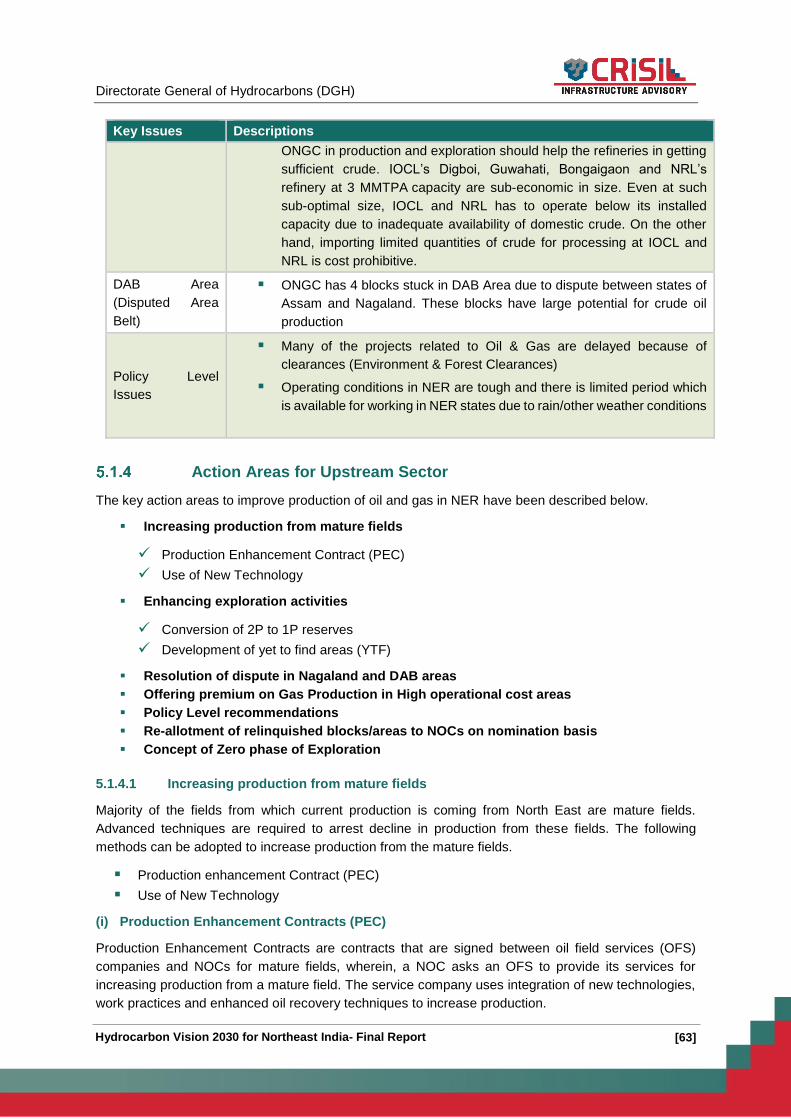
Directorate General of Hydrocarbons (DGH)
[63] Hydrocarbon Vision 2030 for Northeast India- Final Report
Key Issues Descriptions
ONGC in production and exploration should help the refineries in getting
sufficient crude. IOCL’s Digboi, Guwahati, Bongaigaon and NRL’s
refinery at 3 MMTPA capacity are sub-economic in size. Even at such
sub-optimal size, IOCL and NRL has to operate below its installed
capacity due to inadequate availability of domestic crude. On the other
hand, importing limited quantities of crude for processing at IOCL and
NRL is cost prohibitive.
DAB Area
(Disputed Area
Belt)
ONGC has 4 blocks stuck in DAB Area due to dispute between states of
Assam and Nagaland. These blocks have large potential for crude oil
production
Policy Level
Issues
Many of the projects related to Oil & Gas are delayed because of
clearances (Environment & Forest Clearances)
Operating conditions in NER are tough and there is limited period which
is available for working in NER states due to rain/other weather conditions
Action Areas for Upstream Sector
The key action areas to improve production of oil and gas in NER have been described below.
Increasing production from mature fields
Production Enhancement Contract (PEC)
Use of New Technology
Enhancing exploration activities
Conversion of 2P to 1P reserves
Development of yet to find areas (YTF)
Resolution of dispute in Nagaland and DAB areas
Offering premium on Gas Production in High operational cost areas
Policy Level recommendations
Re-allotment of relinquished blocks/areas to NOCs on nomination basis
Concept of Zero phase of Exploration
5.1.4.1 Increasing production from mature fields
Majority of the fields from which current production is coming from North East are mature fields.
Advanced techniques are required to arrest decline in production from these fields. The following
methods can be adopted to increase production from the mature fields.
Production enhancement Contract (PEC)
Use of New Technology
(i) Production Enhancement Contracts (PEC)
Production Enhancement Contracts are contracts that are signed between oil field services (OFS)
companies and NOCs for mature fields, wherein, a NOC asks an OFS to provide its services for
increasing production from a mature field. The service company uses integration of new technologies,
work practices and enhanced oil recovery techniques to increase production.
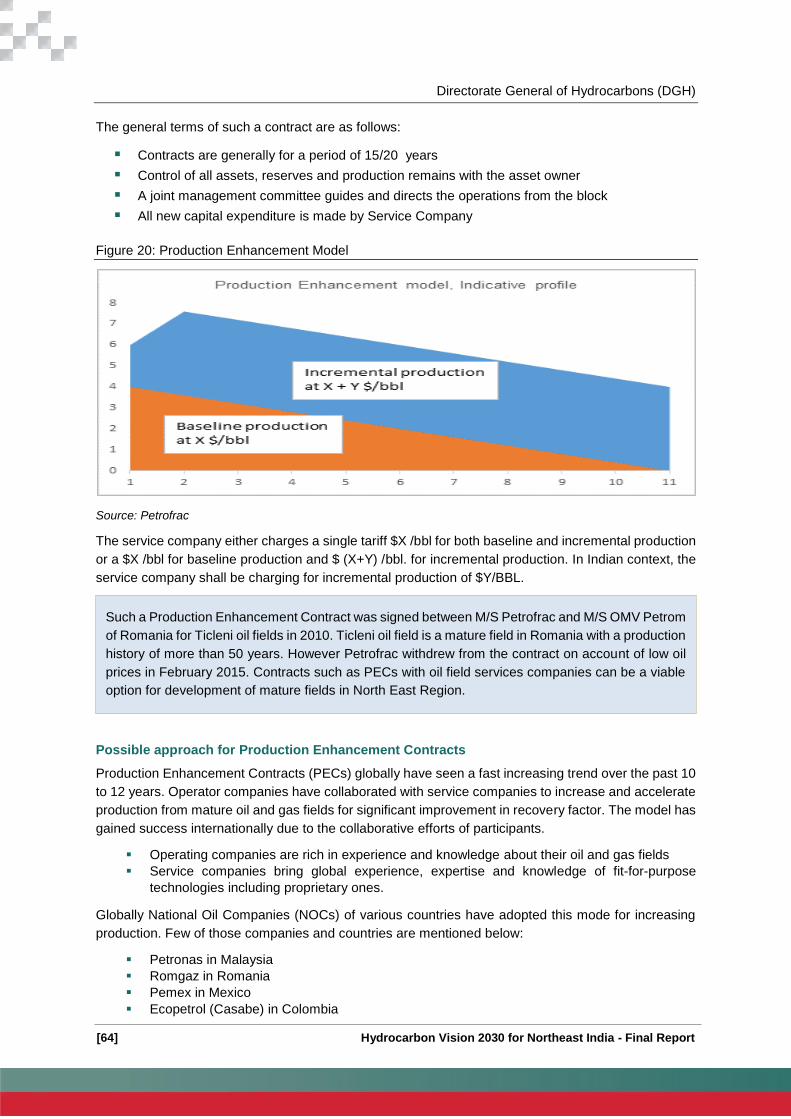
Directorate General of Hydrocarbons (DGH)
[64] Hydrocarbon Vision 2030 for Northeast India - Final Report
The general terms of such a contract are as follows:
Contracts are generally for a period of 15/20 years
Control of all assets, reserves and production remains with the asset owner
A joint management committee guides and directs the operations from the block
All new capital expenditure is made by Service Company
Figure 20: Production Enhancement Model
Source: Petrofrac
The service company either charges a single tariff $X /bbl for both baseline and incremental production
or a $X /bbl for baseline production and $ (X+Y) /bbl. for incremental production. In Indian context, the
service company shall be charging for incremental production of $Y/BBL.
Possible approach for Production Enhancement Contracts
Production Enhancement Contracts (PECs) globally have seen a fast increasing trend over the past 10
to 12 years. Operator companies have collaborated with service companies to increase and accelerate
production from mature oil and gas fields for significant improvement in recovery factor. The model has
gained success internationally due to the collaborative efforts of participants.
Operating companies are rich in experience and knowledge about their oil and gas fields
Service companies bring global experience, expertise and knowledge of fit-for-purpose
technologies including proprietary ones.
Globally National Oil Companies (NOCs) of various countries have adopted this mode for increasing
production. Few of those companies and countries are mentioned below:
Petronas in Malaysia
Romgaz in Romania
Pemex in Mexico
Ecopetrol (Casabe) in Colombia
Such a Production Enhancement Contract was signed between M/S Petrofrac and M/S OMV Petrom
of Romania for Ticleni oil fields in 2010. Ticleni oil field is a mature field in Romania with a production
history of more than 50 years. However Petrofrac withdrew from the contract on account of low oil
prices in February 2015. Contracts such as PECs with oil field services companies can be a viable
option for development of mature fields in North East Region.

Directorate General of Hydrocarbons (DGH)
[65] Hydrocarbon Vision 2030 for Northeast India- Final Report
PetroEcuador in Ecuador
KOC in Kuwait
Various NOCs in China
The fiscal structure of different types of production enhancement contracts has been analyzed to
understand the potential benefits that it may generate. In the context of India, especially of northeast
India, it has been observed that the contract with fee in USD per barrel for incremental production above
the base production profile of the field can become a feasible proposition for the oil and gas industry.
The contractual and fiscal structure of the contract for a fixed (USD/bbl) fee for service Company has
been described in the block diagram below:
Figure 21: Structure of PEC Model
A management committee with representatives from both operator and Service Company needs to be
formulated for providing governance to the project. These contracts work best when companies form
alliances for a longer period of time e.g. 15 to 20 years. Further, base production profile of oil and gas
for a particular block is mutually agreed on by the service company and the operator/Owner.
The following figure provides illustration of base production profile vis-à-vis production profile with PEC.
The operator has to pay a fixed (USD per barrel) fee for production above the base profile, which has
been shown in shaded grey in the figure below.
MoP&NG
Issue a policy guideline for PEC
model
NOC (ONGC/OIL)
Selection of Block for offer
Tender for PEC & Stakeholder consultation
Selection of Service Provider
Vetting of Baseline production
Payment of $/bbl for incremental Production
NOCs to get differential of crude price and $/bbl fee paid to service provider
Will get increased Production
Service Provider
To provide technology
CAPEX and OPEX infusion for incremental
production
Will get $/bbl on incremental production

Directorate General of Hydrocarbons (DGH)
[66] Hydrocarbon Vision 2030 for Northeast India - Final Report
Figure 22: Base Profile and Incremental Profile
All costs incurred, except for surface facility cost, for production above the base profile needs to be
borne by the service company. Operator/owner will be responsible for the investments, required to
maintain production up to the base profile. Service companies will receive a fixed fee, in USD per barrel,
for each barrel of oil equivalent of oil and gas produced above the base production profile.
This structure provides an incentive to the service companies to produce more since its revenue stream
is linked to incremental production.
Stages for signing off the Production Enhancement Contract
In the flow chart below we have shown the step wise procedure, right from initiation of formulation of
the contract to the signing of the contract between the operator and selected service company after the
bidding process for entering into PEC:
Figure 23: Stages for signing off the Production Enhancement Contract
0
1
2
3
4
5
6
7
Year 1 Year 2 Year 3 Year 4 Year 5 Year 6 Year 7 Year 8
Profile with incremental production Base profile
Formulation of draft PEC contract by
NOC
NOCs to identify blocks to be offered
on PEC model
Service Companies to be invited for
studying the block characteristics
Bidding on the fixed $/bbl fee to be carried out for
selection of Service Company
Base production profile is to be jointly agreed
/Biddable (Depending upon
Options)
A data room to be setup, where both
Operator and service companies carry out a study on the block
A contractual agreement to be
signed for a fixed $/bbl fee for
production above base profile
Monitoring of the field and new production by Management
Committee (Operator & Service Provd.)
Directorate General of Hydrocarbons (DGH)
[67] Hydrocarbon Vision 2030 for Northeast India- Final Report
Figure 24: Detail Stages for signing off the Production Enhancement Contract
Interested service providers shall give their interest for PEC
Expression of Interest (EOI) to be floated by NOCs for PEC Contracts
Consultation with Stakeholder (Service Providers) by NOCs on PEC
Blocks Identified by NOCs (ONGC/OIL) to be offered for Bidding.
Bids called for a particular Block or combination of 2 or more blocks.
Service providers purchase bid documents (Let’s say 3 parties purchased
Data room set up for these 3 parties for analyses.
Evaluation of Stage 1 (Base Line profile) – H1, H2, H3 (for next 10/15Y).
Service providers submit Stage 1 bid (Base Line) by Electronic Bid
Bids evaluation done based on Stage 1 (Base Line) bid.
NOCs Technical committee to accept the base line given by H1 bidder based on their
internal estimation of base line.
Committee Accepts H1 base line
Base line of H1 shall be finalized
Base line H1 shall be freezed and H1 baseline shall made open to all parties.
Stage 2 bid based on H1 Base line. Bidders will quote $/bbl for base production and
$/bbl for incremental production.
Invite fresh Bids
Bidder offering lowest charge of $/bbl for increment production shall be winner
Bidders will quote $/bbl for incremental production (Electronic Auction)
Stage 1
Stage 2
Policy guidelines for PEC model to be issued by MoP&NG

Directorate General of Hydrocarbons (DGH)
[68] Hydrocarbon Vision 2030 for Northeast India - Final Report
5.1.4.1.1 Action Area
The table below provides an action plan that needs to be carried out for improving production in NER.
Table 37: Action plan for PEC
Action Items Concerned
Authorities
Timeline
Short Term
(0-2 Years)
Medium Term
(2-5 Years)
Long
Term
(> 5
Years)
Increasing production from mature fields
Production
enhancement
Contract (PEC)
NOCs
NOC to finalize the
Structure/Formulation of
PEC after consultation
with Stakeholders-
Service Providers
MoPNG
MoPNG to review and
accept the same for
implementation.
NOCs
NOCs to identify and offer
blocks for PEC which can
be included in Contracts.
NOCs
NOCs to float tenders
related to PEC in NER
Blocks and Appoint a
Service Provider.
NOCs Implementation
of PEC

Directorate General of Hydrocarbons (DGH)
[69] Hydrocarbon Vision 2030 for Northeast India- Final Report
Case Study- Nigeria
Oil was first discovered in commercial quantities in Nigeria in 1956. The discovery was made by Shell
D’Arcy, a company of Anglo/Dutch origins. The company began production in 1958 with an average
production of 6000 barrels of oil per day (BOPD). Before this time, almost the entire country was covered
by a concession granted to the company to explore for petroleum resources since November 1938.
Shell was a dominant player in Nigerian oil and gas industry until Nigeria became a member of OPEC
in 1971. To promote development of oil and gas sector across the value chain, Nigerian National
Petroleum Corporation (NNPC), the state oil corporation was established in 1977. In 1988, the NNPC
was commercialized into 12 strategic business units, covering the entire spectrum of oil industry
operations: exploration and production, gas development, refining, distribution, petrochemicals,
engineering, and commercial investments.
The upstream oil sector is the single most important sector in the economy, accounting for over 90% of
the country’s exports and about 80% of the Federal Government (FG’s) revenue. Crude Oil is currently
produced from three different basins: the onshore Anambra, the offshore Benin/Dahomey (deep-water
and ultra-deep-water) and the Niger Delta (shallow and deep offshore basins). The Niger Delta and
Benin basins are known to be the richest basins and hold the vast majority of reserves, and the source
of a large portion of current production. During the late 1990s, exploration focus turned to high risk
ventures in the frontier basins of deep water offshore, with encouraging success. These ventures are
becoming increasingly attractive, with developments in deep-water exploration and production
technology.
Since 1993, gas production has grown eight folds, while significant amount of oil production has
commenced from deep water blocks which was earlier restricted to shallow water and marshy areas.
The graph below shows the oil and gas production from Nigeria since 1993, i.e. the beginning of PSC
era in Nigeria.
Source: BP Statistical Review, 2014

Directorate General of Hydrocarbons (DGH)
[70] Hydrocarbon Vision 2030 for Northeast India - Final Report
Case Study- Nigeria
Prior to 1993, mostly Joint Operator Agreements (JOA) were in place in the E&P space. However in 1993, the
Federal Government of Nigeria opened up E&P activities to be carried out in offshore blocks and replaced JOAs
with PSCs. During this period, NNPC entered into PSCs with eight IOCs and Nigeria was able to attract much
needed additional foreign investment. We have described briefly below the type of agreements prevalent in
upstream sector in Nigeria.
Types of agreements prevalent upstream sector
A. Joint Ventures
This is the standard agreement between the national oil company i.e. the Nigerian National Petroleum Corporation
(NNPC) and an International oil company (IOC). Under this arrangement, both NNPC and the IOC contribute to
funding oil operations in the proportion of their JV equity holdings, and generally receive crude oil produced in the
same ratio.
Companies engaged in this form of arrangement are assessed to tax under the Profit Petroleum Tax Act (PPTA) at
the rate of 65.75% of chargeable profits for the first five years of operation (when the company is yet to fully recover
its capitalized pre-production cost), and 85% thereafter. The tax payable is modified by the provisions of the
Memorandum of Understanding (MOU) between the parties.
The JV model is currently being phased out in Nigeria, mainly due to the inability of NNPC to fund its share of JV
costs.
B. Production Sharing Contract
As a result of the increasing funding pressure from the JVs, the Federal Government of Nigeria, adopted the PSC
model in 1993 as the preferred petroleum arrangement with IOCs. Under the PSC contract, NNPC engages a
competent contractor to carry out petroleum operations on NNPC’s wholly held acreage. Under this arrangement,
the concession is held by NNPC. NNPC engages the IOC or the indigenous company as Contractor to conduct
petroleum operations on behalf of itself and NNPC. The Contractor takes on the financing risk. If the exploration is
successful, the Contractor is entitled to recover its costs on commencement of commercial production. If the
operation is not successful, the Contractor bears the loss.
The first set of PSCs was signed in 1993, followed by those executed in 2001, after the 2000 licensing rounds.
Several other models of PSCs have been signed since then. The principles in the PSCs remain largely the same,
except for variation in the profit oil sharing formula and cost oil recovery cap. The Profit Petroleum Tax (PPT) rate
applicable to PSC companies is 50% of chargeable profits for the contract area.
C. Service Contract
Under this model, the Contractor undertakes exploration, development and production activities for, and on behalf
of, NNPC or the concession holder, at its own risk. The concession ownership remains entirely with the NNPC/
holder, and the Contractor has no title to the oil produced. The Contractor is reimbursed cost incurred only from
proceeds of oil sold and is paid periodical remuneration in accordance with the formulae stipulated in the contract.
The Contractor has the first option to buy back the crude oil produced from the concession.
The Contractor is assessed to tax on its service fees under the Companies Income Tax Act as amended (CITA) at
30%; while the concession holder (or the NNPC) is assessed to tax under the PPTA.
D. Marginal Field Concession
The Federal Government, in furtherance of its Nigerian Content agenda, encourages MOCs to surrender their
marginal fields for assignment to indigenous concession holders. To provide special incentives to marginal field
operators, the federal government promulgated the Petroleum (Amendment) Act No. 23 and the Marginal Field
Operations (Fiscal Regime) Regulations 2005 on the development of marginal fields.
Generally, a Marginal Field is defined as any field that has reserves booked and reported annually to the DPR and
has remained unproduced for a period of over 10 years.
Directorate General of Hydrocarbons (DGH)
[71] Hydrocarbon Vision 2030 for Northeast India- Final Report
(ii) Use of New Technology
Incentivise use of new technology to promote usage of new technology by NOCs in Nomination
blocks Compulsory phase out of old technology used by NOCs and inclusion of latest technology
which can increase production.
Joint industry project initiatives with technology partners need to be identified to induct the right
technology and prepare a clear road map for addressing the problem. Further, advanced
technologies in the areas of electromagnetic telemetry, 3D micro seismic imaging and geological
mapping shall be explored for recovery of production from matured fields.
Following technologies which have seen successful results in OIL/ONGC fields are listed below:
Improved Oil Recovery (IOR) / Enhanced Oil Recovery (EOR) technology needs to be promoted
to enhance recovery and optimize production from the existing and matured oil and gas fields in
NE. Some of the IOR / EOR techniques are as follows:
Miscible gas injection, Thermal Injection methods such as steam flooding, cyclic steam
injection methods used to heat the crude oil, Chemical Injection used to aid mobility etc.
Horizontal Drilling and J-bend deviated well;
Stimulation services like hydraulic fracturing and matrix acidization
Polymer flooding and Microbial Technology
Advanced drilling methods like Radial Drilling, extended Reach Drilling, and Multilaterals
etc. should also be examined/explored to drain hydrocarbon potential from the
inaccessible reserves. Oil India has carried out joint industry projects with Herriot Watt
University, UK, on carbonated Water Injection, Polymer and Microbial Flooding.
Assam Arakan Fold Belt covers seismically challenging and logistically difficult areas falling in the states
of Assam, Manipur, Mizoram and Tripura. In order to address technical challenges pertaining to
improved image of subsurface, induction of new technologies like Airborne Gravity Gradiometry, AEM-
PTP Passive Source Electromagnetic Method and Passive seismic tomography are being planned in
NER by ONGC. The objective is to improve the subsurface imaging so that structural configuration/
geometries can be meaningfully interpreted. This would also effectively address logistic difficulties and
save time. (Passive Seismic Tomography) has already been deployed in Sector VC in Cachar.
The details of these technologies are given below:
Airborne Gravity Gradiometry
Airborne Gravity Gradiometry is gaining interest of the exploration community these days, as this
method provides quick and effective solutions such as mapping lineaments & gravity based reservoir
limits associated with structural, stratigraphic & fluid based changes in logistically tough terrains. Gravity
Gradiometry is basically based on variation of gravity gradient information or known as Tensor
components of gravity field. Gravity Gradiometry is known in the industry by trade names of FTG, Falcon
etc. In industry, vendors CGG, ARKeX, Bell Geospace and MacPhar are capable of conducting such
gradiometry surveys. Following areas have been identified for Airborne Gravity Gradiometry and
Gravity, Magnetic studies (AGG & GM) for hydrocarbon exploration with an objective to provide
estimation of sediment thickness, sub-surface structural disposition and basement configuration in the
Survey Area.
The Survey Area mainly comprises of three blocks, namely, Block-1, 2 and 3. The area includes the
acreages held by ONGC as well as adjoining open acreages. The details about the blocks are as
follows:

Directorate General of Hydrocarbons (DGH)
[72] Hydrocarbon Vision 2030 for Northeast India - Final Report
Block Name of the area Approx. LKM
1
Sector-VC:
Banaskandi ML, Cachar Dist. PML and AA-94/1 (Assam, Manipur & Mizoram)
7351LKM
Grid: 500m x 5000m
2 AA-ONN-2001/2 (Assam, Mizoram) 4722 LKM
Grid: 500m x 5000m
3 ML areas- Namti, Geleki, Geleki-Extn, SE-Geleki, and SE-Geleki Extension (Assam,
Nagaland)
322 LKM
Grid: 500m x 2500m
Total LKM 12395
The above areas are largely mountainous, typical elevations from mountain top to valley ranges from
50 to 1,000m, rugged terrain with jungle cover & sparsely populated.
The above areas are largely mountainous, typical elevations from mountain top to valley ranges from
50 to 1,000m, rugged terrain with jungle cover & sparsely populated.
AEM-PTP Passive Source Electromagnetic Method
Electromagnetic methods provide cheaper means of supplementing the seismic data. These methods
respond to resistivity contrast of the formations unlike seismic which respond to acoustic impedance
contrast. FTB regimes often have thin high velocity near surface layers which acts as an acoustic barrier
whereas EM methods yield better results. "Audio Electro Magnetic Passive Transient Impulse (AEM-
PTP) is a passive source Transient Electromagnetic prospecting technique based on detection of
transients of secondary electromagnetic field associated with upward fluid flow associated with REDOX
activity. It is a proprietary technology of Pinemont, a subsidiary of McPhar International Ltd. In June
2015, representatives from Mcphar international presented the Pinemont AEM-PTP survey techniques
at ONGC, Jorhat. Following positive feedback and subsequent discussions, McPhar have put proposal
to undertake a test survey over small block, covering approximately 100 SKM is being planned.
Passive Seismic Tomography
Passive seismic tomography involves listening to the earth passively over time and using it to derive
subsurface information. P and S-wave travel times helps in understanding structural configuration of
the subsurface and Vp/Vs provides lithological information. Passive Seismic Tomography has already
been deployed in Sector VC and survey completed in Nov, 2011 and data delivered as per the
deliverables by M/S Land Tech Enterprises. The survey resulted in:
1. Vp/Vs values that helped in demarcating sand prone areas
2. PST velocity field, which were used in reprocessing of few 2D lines and 3D volume in the area to see
any possible improvement.
5.1.4.2 Enhancing exploration activities
(i) Conversion of 2P to 1P reserves
The term 2P is used to denote the sum of proved and probable reserves and 1P is frequently
used to denote proved reserves. The best estimate of recovery from committed projects is

Directorate General of Hydrocarbons (DGH)
[73] Hydrocarbon Vision 2030 for Northeast India- Final Report
generally considered to be the 2P (sum of proved and probable reserves). However, probable
reserves are lower categories of reserves, commonly combined and referred to as “unproved
reserves,” with decreasing levels of technical certainty. Probable reserves are volumes that are
defined as “less likely to be recovered than proved, but more certain to be recovered than
possible reserves”.
Increased drilling efforts are required for conversion of 2P reserves to 1P reserves. This action
will help in increasing oil and gas production from the existing fields. In order to increase drilling
activity for exploration and production, more drilling and work over rigs should be inducted by
way of acquisition as well as charter hiring to mitigate time overruns.
(ii) Development of yet to find areas (YTF)
Based on the experience of past five decades in context of different tectonic style & logistical
challenges, authorities need to
Pursue new petroleum plays, leads and field growth possibilities in logistically difficult and
geologically complex areas in Assam, Arunachal Pradesh and Mizoram.
Targeting frontal belt corridor and pursue exploration for structural & strati-structural plays.
Improve subsurface imaging and G&G understanding through technology induction &
reprocessing.
Analysis of latent potential in NER
Both ONGC and OIL hold large number of PEL, PML areas in NER. As per data available below is the
estimated conversion due to drilling efforts made by both companies. Assam’s area has maximum
conversion factor in tune of 65% for prognosticated to established category whereas Nagaland area
has only 3%.
Table 38: Total Prognosticated, Established & recoverable Reserves in NER in MMTOE for ONGC and OIL
Sector/
Area
Prognosticated
Resources
In MMTOE
Established
In-place
In MMTOE
Recoverable reserves
OIL ONGC Total OIL ONGC Total Oil Gas Total
State Area
Assam
Shelf
(Nazira
& Jorhat
sector)
1180 785
173 142 315
Assam Cachar
Fold Belt 435 9
Tripura Fold Belt 590 100 0.07 41 41
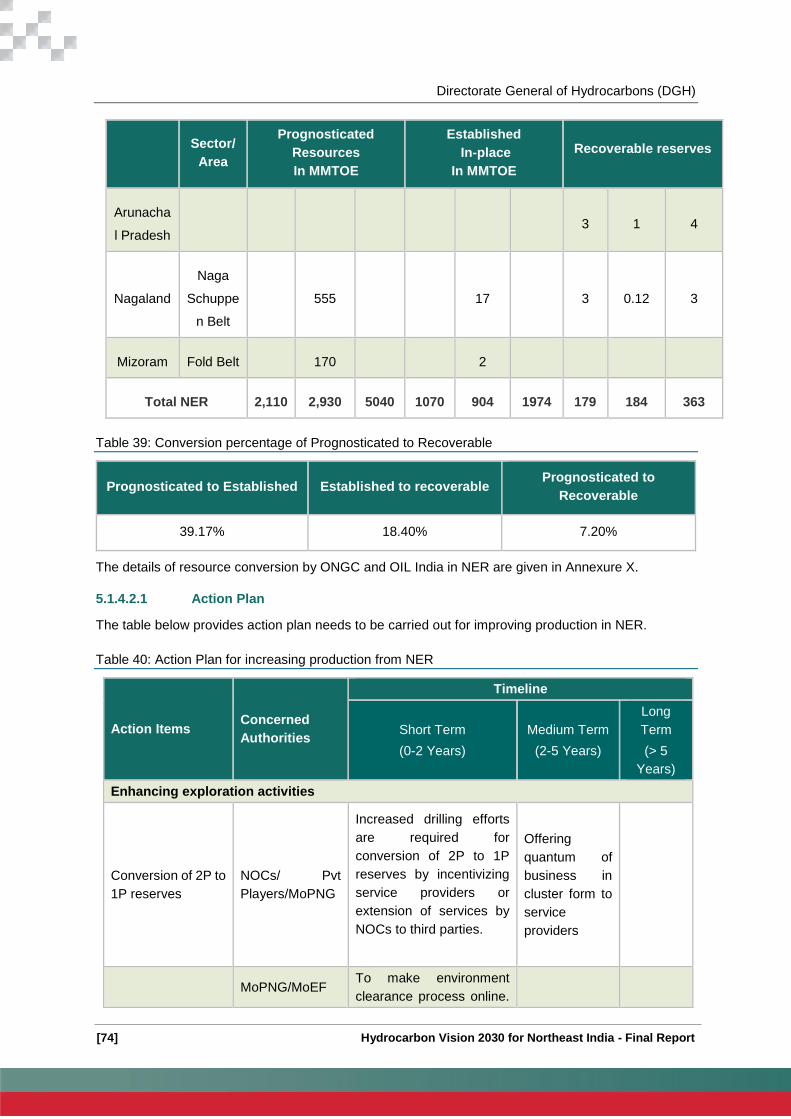
Directorate General of Hydrocarbons (DGH)
[74] Hydrocarbon Vision 2030 for Northeast India - Final Report
Sector/
Area
Prognosticated
Resources
In MMTOE
Established
In-place
In MMTOE
Recoverable reserves
Arunacha
l Pradesh 3 1 4
Nagaland
Naga
Schuppe
n Belt
555 17 3 0.12 3
Mizoram Fold Belt 170 2
Total NER 2,110 2,930 5040 1070 904 1974 179 184 363
Table 39: Conversion percentage of Prognosticated to Recoverable
Prognosticated to Established Established to recoverable Prognosticated to
Recoverable
39.17% 18.40% 7.20%
The details of resource conversion by ONGC and OIL India in NER are given in Annexure X.
5.1.4.2.1 Action Plan
The table below provides action plan needs to be carried out for improving production in NER.
Table 40: Action Plan for increasing production from NER
Action Items Concerned
Authorities
Timeline
Short Term
(0-2 Years)
Medium Term
(2-5 Years)
Long
Term
(> 5
Years)
Enhancing exploration activities
Conversion of 2P to
1P reserves
NOCs/ Pvt
Players/MoPNG
Increased drilling efforts
are required for
conversion of 2P to 1P
reserves by incentivizing
service providers or
extension of services by
NOCs to third parties.
Offering
quantum of
business in
cluster form to
service
providers
MoPNG/MoEF To make environment
clearance process online.
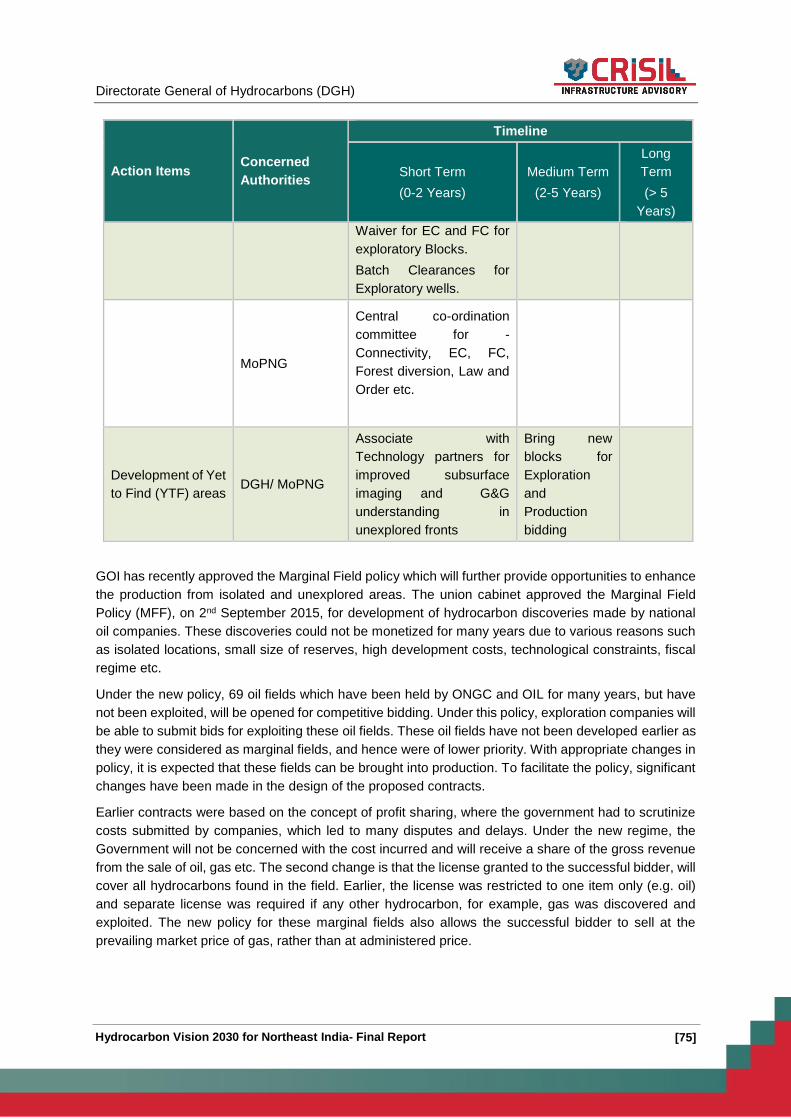
Directorate General of Hydrocarbons (DGH)
[75] Hydrocarbon Vision 2030 for Northeast India- Final Report
Action Items Concerned
Authorities
Timeline
Short Term
(0-2 Years)
Medium Term
(2-5 Years)
Long
Term
(> 5
Years)
Waiver for EC and FC for
exploratory Blocks.
Batch Clearances for
Exploratory wells.
MoPNG
Central co-ordination
committee for -
Connectivity, EC, FC,
Forest diversion, Law and
Order etc.
Development of Yet
to Find (YTF) areas DGH/ MoPNG
Associate with
Technology partners for
improved subsurface
imaging and G&G
understanding in
unexplored fronts
Bring new
blocks for
Exploration
and
Production
bidding
GOI has recently approved the Marginal Field policy which will further provide opportunities to enhance
the production from isolated and unexplored areas. The union cabinet approved the Marginal Field
Policy (MFF), on 2nd September 2015, for development of hydrocarbon discoveries made by national
oil companies. These discoveries could not be monetized for many years due to various reasons such
as isolated locations, small size of reserves, high development costs, technological constraints, fiscal
regime etc.
Under the new policy, 69 oil fields which have been held by ONGC and OIL for many years, but have
not been exploited, will be opened for competitive bidding. Under this policy, exploration companies will
be able to submit bids for exploiting these oil fields. These oil fields have not been developed earlier as
they were considered as marginal fields, and hence were of lower priority. With appropriate changes in
policy, it is expected that these fields can be brought into production. To facilitate the policy, significant
changes have been made in the design of the proposed contracts.
Earlier contracts were based on the concept of profit sharing, where the government had to scrutinize
costs submitted by companies, which led to many disputes and delays. Under the new regime, the
Government will not be concerned with the cost incurred and will receive a share of the gross revenue
from the sale of oil, gas etc. The second change is that the license granted to the successful bidder, will
cover all hydrocarbons found in the field. Earlier, the license was restricted to one item only (e.g. oil)
and separate license was required if any other hydrocarbon, for example, gas was discovered and
exploited. The new policy for these marginal fields also allows the successful bidder to sell at the
prevailing market price of gas, rather than at administered price.

Directorate General of Hydrocarbons (DGH)
[76] Hydrocarbon Vision 2030 for Northeast India - Final Report
5.1.4.3 Resolution of dispute in Nagaland and DAB areas
5.1.4.3.1 Background
DAB Area (Assam Nagaland Border): The border dispute over the disputed Assam-Nagaland
border belt, called the Disturbed Area Belt (DAB), between the two states is awaiting a solution
from the Supreme Court after Assam filed a petition in 1988, seeking a settlement. The Assam
government wants no change in the current border demarcation. However, Nagaland refuses
to accept the same and instead wants to follow the historical boundary which was demarcated
before the colonial rule. This area has problem related to border dispute between Nagaland
and Assam. Blocks of ONGC are falling in this area. Exploration and Production has not
progressed in these blocks due to law and order problem in DAB Area.
Nagaland government passed the Nagaland Petroleum & Natural Gas (NPNG) regulations and
the NPNG rules in 2012, under the powers of Article 371 A (1)(a)(iv) of the constitution which
states that “Ownership and transfer of land and natural resources shall apply to the state of
Nagaland unless the legislative assembly of Nagaland by a resolution so decides”. A NPNG
Board was also set up to monitor all activities related to oil and natural gas mining. The NPNG
regulations stipulated a three-level committee: the first comprising of state ministers; the second
with senior bureaucrats; and the third with junior government officers, advisers and others.
After the notification of the legislation in 2012, the government floated an Expression of Interest
(EOI) for 11 oil and gas zones, including the Wokha oil zone in Wokha district. A ministerial
group gave the permit for the oil zones at Wokha and Peren to a company called Metropolitan
Oil & Gas Private Limited (MOGPL). This included the Changpang oil field in Wokha, which
was abandoned by ONGC in 1994. As per information available, a contract between Nagaland
state and MOGPL has been signed on 18% revenue sharing basis with state, for production of
oil and natural gas from the awarded blocks.
Some of the possible resolutions on Nagaland issue
The recommmended solutions of the outstanding issues could be planned on following lines:
i. The difference of state government from ‘Revenue Share’ and ‘Royalty’ could be taken care of
in two ways:
a. Enhance the rates of royalty for the NELP blocks to match the minimum returns as
prescribed by the State Government in their Revenue Sharing Model, and
b. Request the State Government to nominate a State PSU to partner E&P operations in
the state. This will allow them access to Profit Petroleum which the state can share as
per their own arrangement.
ii. The arrangement proposed by the State Government for sharing of revenue with the land
owners etc. can continue.
iii. The process proposed by the State Government for making available land for E&P activities
can continue. The State Government shall facilitate the process of taking necessary
permissions from the land owners, village councils, Tribal Hoho etc.

Directorate General of Hydrocarbons (DGH)
[77] Hydrocarbon Vision 2030 for Northeast India- Final Report
iv. State Govt. of Nagaland may repeal their PNG Regulation and Rules and operate within the
ambit of the Oilfields (Regulation and Development) Amendment Act, 1969 and Petroleum and
Natural Gas Rules, 1959 of Government of India.
The salient features of the State Govt. of Nagaland Revenue Sharing Model and comparison with
PSC are given as under:
S.
No. Govt. of Nagaland Model MoP&NG PSC
1. Award Zone for 10 years Renewable every
10 years
8 years exploration period for frontier blocks
with 20 years mining period (10 years
exploration has been proposed under
MRSC)
2. Separate Permit for pre-production,
production and post production activities.
PEL and PML recommended to State
Governments for issue for On land blocks.
3. Land Access Fee to land owners as per
uniform rates decided by State Govt. Lease money as per State Govt. rates.
4. Land Access Fee paid annually As per State Govt. lease rules.
5.
Revenue Share – not less than 16 % for
oil and 12 % for natural gas of total value
produced. This shall be shared as follows:
a. With individual land owner who own oil/gas well in the zone –not less than 2%.
b. Other individual land owners who do not own oil or gas wells in the zone-not less than 4% and 2% respectively for oil and gas.
c. With District Development Board of the zone-not less than 2% for both oil and gas.
d. With the State Government- not less than 8% and 6% respectively for oil and gas.
a. Nomination Block (4 blocks) cum-royalty to the State Approximately 16% for oil and 9% of gas.
b. Pre-NELP (1 block) cum royalty approximately 16% for oil and 9% for gas.
c. NELP (4 blocks) Ex-Royalty 12.5% for oil and 10% for gas.
As per Gazette Notification of 17.03.2003
of MoP&NG (Para 2 (ix), a special grant @
2% over and above the applicable rate of
royalty will be paid to Govt. of Nagaland
on crude oil production from the State.
6. No permit issued to a company shall be
transferable PI can be transferred with permission of GoI
7. Valuation of Petroleum- International Price
Index.
Crude- International Price Index Gas- Fixed
by Government of India
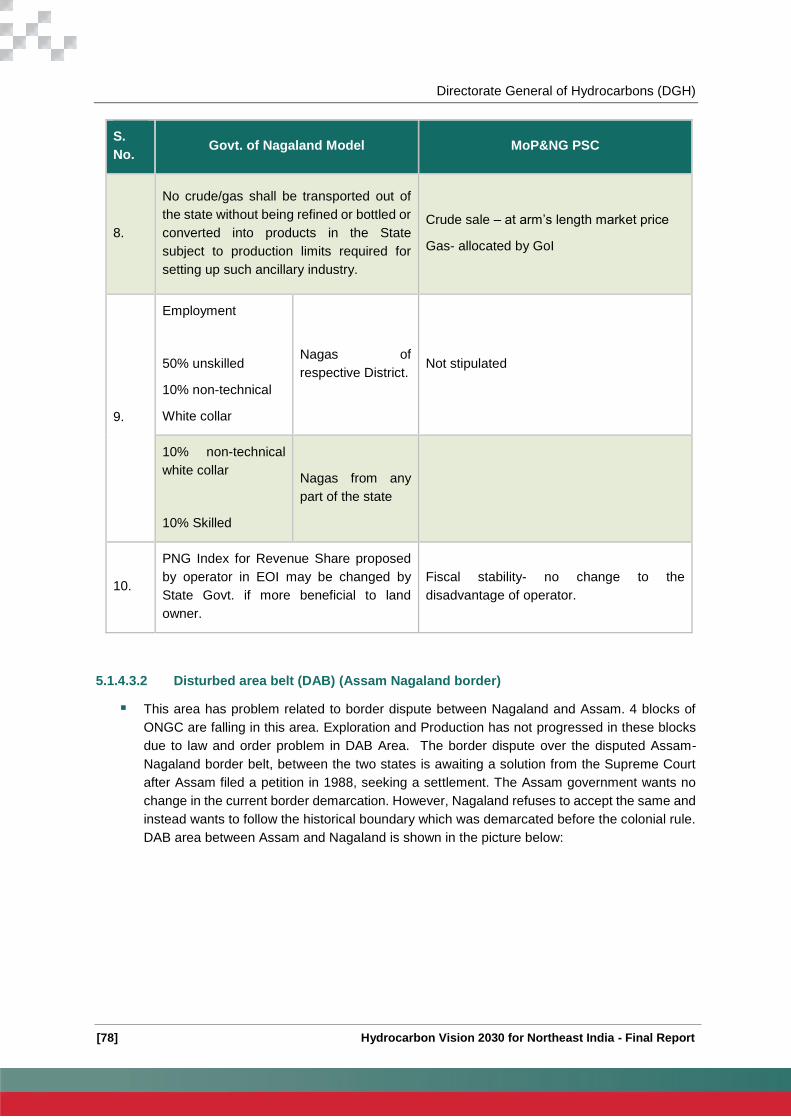
Directorate General of Hydrocarbons (DGH)
[78] Hydrocarbon Vision 2030 for Northeast India - Final Report
S.
No. Govt. of Nagaland Model MoP&NG PSC
8.
No crude/gas shall be transported out of
the state without being refined or bottled or
converted into products in the State
subject to production limits required for
setting up such ancillary industry.
Crude sale – at arm’s length market price
Gas- allocated by GoI
9.
Employment
50% unskilled
10% non-technical
White collar
Nagas of
respective District. Not stipulated
10% non-technical
white collar
10% Skilled
Nagas from any
part of the state
10.
PNG Index for Revenue Share proposed
by operator in EOI may be changed by
State Govt. if more beneficial to land
owner.
Fiscal stability- no change to the
disadvantage of operator.
5.1.4.3.2 Disturbed area belt (DAB) (Assam Nagaland border)
This area has problem related to border dispute between Nagaland and Assam. 4 blocks of
ONGC are falling in this area. Exploration and Production has not progressed in these blocks
due to law and order problem in DAB Area. The border dispute over the disputed Assam-
Nagaland border belt, between the two states is awaiting a solution from the Supreme Court
after Assam filed a petition in 1988, seeking a settlement. The Assam government wants no
change in the current border demarcation. However, Nagaland refuses to accept the same and
instead wants to follow the historical boundary which was demarcated before the colonial rule.
DAB area between Assam and Nagaland is shown in the picture below:
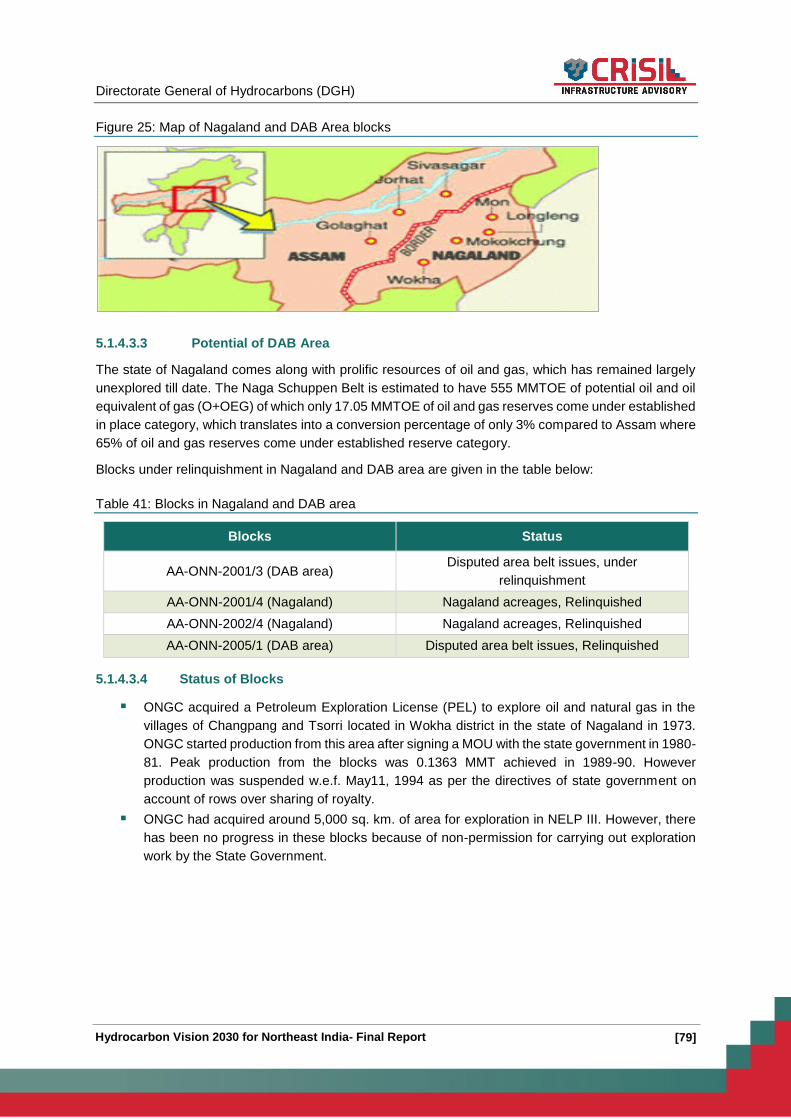
Directorate General of Hydrocarbons (DGH)
[79] Hydrocarbon Vision 2030 for Northeast India- Final Report
Figure 25: Map of Nagaland and DAB Area blocks
5.1.4.3.3 Potential of DAB Area
The state of Nagaland comes along with prolific resources of oil and gas, which has remained largely
unexplored till date. The Naga Schuppen Belt is estimated to have 555 MMTOE of potential oil and oil
equivalent of gas (O+OEG) of which only 17.05 MMTOE of oil and gas reserves come under established
in place category, which translates into a conversion percentage of only 3% compared to Assam where
65% of oil and gas reserves come under established reserve category.
Blocks under relinquishment in Nagaland and DAB area are given in the table below:
Table 41: Blocks in Nagaland and DAB area
Blocks Status
AA-ONN-2001/3 (DAB area) Disputed area belt issues, under
relinquishment
AA-ONN-2001/4 (Nagaland) Nagaland acreages, Relinquished
AA-ONN-2002/4 (Nagaland) Nagaland acreages, Relinquished
AA-ONN-2005/1 (DAB area) Disputed area belt issues, Relinquished
5.1.4.3.4 Status of Blocks
ONGC acquired a Petroleum Exploration License (PEL) to explore oil and natural gas in the
villages of Changpang and Tsorri located in Wokha district in the state of Nagaland in 1973.
ONGC started production from this area after signing a MOU with the state government in 1980-
81. Peak production from the blocks was 0.1363 MMT achieved in 1989-90. However
production was suspended w.e.f. May11, 1994 as per the directives of state government on
account of rows over sharing of royalty.
ONGC had acquired around 5,000 sq. km. of area for exploration in NELP III. However, there
has been no progress in these blocks because of non-permission for carrying out exploration
work by the State Government.
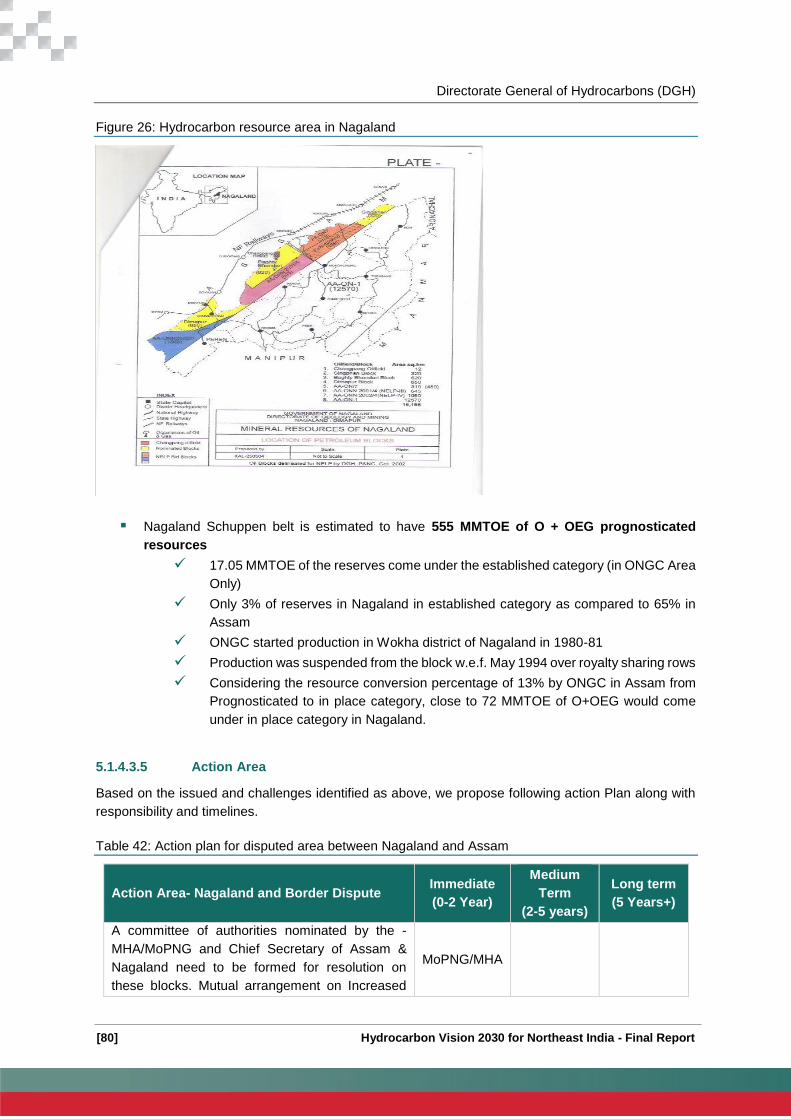
Directorate General of Hydrocarbons (DGH)
[80] Hydrocarbon Vision 2030 for Northeast India - Final Report
Figure 26: Hydrocarbon resource area in Nagaland
Nagaland Schuppen belt is estimated to have 555 MMTOE of O + OEG prognosticated
resources
17.05 MMTOE of the reserves come under the established category (in ONGC Area
Only)
Only 3% of reserves in Nagaland in established category as compared to 65% in
Assam
ONGC started production in Wokha district of Nagaland in 1980-81
Production was suspended from the block w.e.f. May 1994 over royalty sharing rows
Considering the resource conversion percentage of 13% by ONGC in Assam from
Prognosticated to in place category, close to 72 MMTOE of O+OEG would come
under in place category in Nagaland.
5.1.4.3.5 Action Area
Based on the issued and challenges identified as above, we propose following action Plan along with
responsibility and timelines.
Table 42: Action plan for disputed area between Nagaland and Assam
Action Area- Nagaland and Border Dispute Immediate
(0-2 Year)
Medium
Term
(2-5 years)
Long term
(5 Years+)
A committee of authorities nominated by the -
MHA/MoPNG and Chief Secretary of Assam &
Nagaland need to be formed for resolution on
these blocks. Mutual arrangement on Increased
MoPNG/MHA

Directorate General of Hydrocarbons (DGH)
[81] Hydrocarbon Vision 2030 for Northeast India- Final Report
Action Area- Nagaland and Border Dispute Immediate
(0-2 Year)
Medium
Term
(2-5 years)
Long term
(5 Years+)
Royalty to 16%/18% for the nomination level
blocks so that work can be started immediately.
Similar resolution under provision of existing laws
for mutual agreement on starting of production
from NELP/PSC regime and share of royalty
between both the states.
MoPNG/MH
A
MoPNG to support ONGC in case of financial
burden for increased royalty under PSC
agreement. ONGC to submit the proposal to DGH
for the same
ONGC/DGH
The central and state governments need to initiate
action to resolve the boundary issues within states
as boundary issues between Assam-Nagaland,
Manipur-Nagaland and Assam-Arunachal Pradesh
have been instrumental in delaying exploration
activities and in some cases the issue has led to
abandonment of exploration activities by the E&P
operator.
Chief
Secretary-
Government
of India/
Assam/Nagal
and/
5.1.4.4 Cost of Exploration and Production in NER
The capital and operating cost of production of oil and gas plays a significant role in the momentum of
E&P activity in a region. The section compares capital and operating costs in NER with rest of India –
onshore and offshore blocks.
5.1.4.4.1 Exploration cost
Exploration costs contribute for about 20% of the overall cost incurred for development of an oil and
gas field. Exploration cost is the initial cost that is incurred in an oil and gas field, which helps in
ascertaining the resource potential of the field. Based on inputs provided by DGH, we have analyzed
the exploration costs in NER and compared it with exploration cost in KG Basin. Major cost items
incurred in the exploration phase are:
Survey costs
Exploratory well drilling costs
General & Administrative (G&A) costs
The analysis of these cost items revealed that exploratory well drilling costs in NER are typically higher
by 20-25% while G&A costs were higher by close to 220%. Survey and exploration study costs were
lower in NER by 28% than that in KG basin. The % higher/(lower) costs have been computed by
calculating the average of costs provided by DGH in NER and the % by which this cost is higher/(lower)
from the other block in rest of India.

Directorate General of Hydrocarbons (DGH)
[82] Hydrocarbon Vision 2030 for Northeast India - Final Report
Cost item
Exploratory well
drilling and testing
cost per meter
G&A cost per well Survey and
Exploration studies
% higher or (%) lower
than in NER 23% 220% (28%)
Source: DHG, CRIS Analysis
5.1.4.4.2 Capital Cost
After exploration phase has been completed, the oil and gas blocks enter the development phase, which
requires drilling of development wells for production of oil and gas and creation of surface facilities for
processing, collection, transportation of the produced crude oil and natural gas. Hence broadly the
capital cost can be classified as:
a) Well cost: Well cost includes, costs related to hiring of rigs, well construction (including well and
completion design), procurement of casings, tubulars, well head and X-mas tree, packers, line
hangers, procurement of cementing services, additives, mud services, mud chemicals etc. Rig
hiring charges are the most significant component of well cost, which makes the capital cost
highly sensitive to operating day rate of rigs and number of days taken to drill a well.
b) Facility cost: For treatment and processing, collection, storage and distribution of produced
crude oil and natural gas, various facilities such as flow lines, oil tanks, separators, electric
lines, generators, effluent treatment plants, gas dehydration units, crude processing units,
pipelines etc. needs to be constructed. This cost component is generally much smaller when
compared to well cost.
For the purpose of analysis, the capital costs of more than 30 blocks across India have been considered
and have been grouped into offshore, onshore (rest of India) and North East category. Based on limited
data review, it appears that indicative capital cost is similar in Northeast India with rest of the country
as far as onshore blocks are concerned.
Table 43: Indicative Capital Cost for hydrocarbon blocks in India (USD/BOE)
In USD/BOE* Onshore (Rest of India) Onshore(North East)
Indicative Average Value 9-10 9-10
Source: DGH

Directorate General of Hydrocarbons (DGH)
[83] Hydrocarbon Vision 2030 for Northeast India- Final Report
Figure 27: Average Capital Cost for hydrocarbon blocks in India (USD/ BOE)
Source: CRIS Analysis
5.1.4.4.3 Operating Cost
Once the development activities have been completed, production of oil and gas begins from the wells.
The cost incurred to carry out the day to day activities in the blocks come under the operating cost head.
Some of the key costs in an oil and gas field that are clubbed together to form the operating costs are:
Workover of wells cost
Staff expenditure
Produced water treatment cost
Land lease expense
Stores and spares
Pollution control
Insurance cost
Repair and Maintenance
Costs related to transport of oil and gas
Contractual payments
Power and Fuel expense
HSE related costs
The operating costs in USD/boe considered for this analysis is the same sample as that considered for
capital cost analysis. Based on limited data review, , it appears that indicative operating cost significantly
higher in Northeast India as compared to onshore blocks in rest of India. The indicative operating cost
in Northeast India has been found to be at par with the offshore blocks. The results of our analysis
have been presented in the table below:
Table 44: Indicative average operating cost for hydrocarbon blocks in India in USD/BOE
In USD/BOE* Offshore Blocks Onshore (Rest of India) Onshore(North East)
Average value 10-11 6-7 10-11
Source: CRIS Analysis
9-109-10
18-20
0
2
4
6
8
10
12
14
16
18
20
Onshore (Rest of India) On shore (NER) Offshore

Directorate General of Hydrocarbons (DGH)
[84] Hydrocarbon Vision 2030 for Northeast India - Final Report
It can be observed from the figure below that the operational expenditure post development activities
of blocks in NER are 50% higher compared to the operational expenditure requirement for other
onshore blocks in India.
Figure 28: Average Operating Cost for hydrocarbon blocks in India (in USD/BOE)
Source: CRIS Analysis
5.1.4.4.4 Key Issues/ Concerns
The table below provides key issues related to capital and operating cost in Northeast India.
Table 45: Key Issues in terms of Capital and Operating expenditure in Northeast India
Key Issues Illustration
Issues related to cost of Exploration and Production
Exploration
cost
Exploration cost in NER are higher than in rest of India, exploratory well drilling
costs in NER are typically higher by 20-25% while G&A costs were higher by
close to 220%. Survey and exploration study costs were lower in NER by 28%
than that in KG basin.
Capital
Cost
Capital cost for offshore projects are much higher than projects implemented
in onshore areas, and we observed a wide variability in their range, starting
from USD 9.7/ boe to USD 42.2/ boe. Higher costs in offshore areas are due
to higher complexity and higher drilling and facility costs in offshore regions.
Generally offshore drilling day rates are more than double the drilling day rates
for land rigs.
Capital cost for projects implemented in the North East region is quite similar
to other onshore projects implemented in rest of India.
Onshore projects also have a high variability in costs depending upon the
location of their implementation, complexity of the project and its development
plan. For mature blocks, enhanced oil recovery (EOR) techniques are
implemented which lead to a significant increase in project cost.
Operating
Cost
Operating costs in NER are close to 50% higher than operating costs in other
onshore projects implemented across India. Operating costs in NER are
comparable to operating costs of offshore projects.
6-7
10-11 10-11
0
2
4
6
8
10
12
Onshore (Rest of India) On shore (NER) Offshore

Directorate General of Hydrocarbons (DGH)
[85] Hydrocarbon Vision 2030 for Northeast India- Final Report
Key Issues Illustration
Operating cost are higher in NER, because of intermittent production, due to
which the facilities are lying idle, bandhs and blockades, higher stores and
spares and consumables costs due to lack of availability of service provides
in the region.
5.1.4.4.5 Action Areas
The high exploratory, capital and operating costs in the region can be clearly attributed to the
infrastructure constraints in the region similar to the case of “difficult deep water blocks” category
which incur higher capital costs owing to technical constraints (higher complexity and higher
drilling costs).
Such blocks shall be categorized under a new category “Challenging Blocks” to be treated at
par with deep water blocks in terms of timelines, minimum works, and royalty share and tax
incidence.
The new discoveries in such challenging blocks may be treated differently and command a graded
premium over and above the existing price of natural gas based on the level of difficulty
encounter for extracting gas.
5.1.4.4.6 Challenging blocks
According to Oil India, NER blocks falling in the hilly regions and Brahmaputra River bed areas
can be termed as challenging blocks. This will cover entire states of Mizoram, Manipur, Tripura,
Nagaland, Meghalaya, Arunachal Pradesh and parts of Assam (Karbi Anglong, Dima Hasau,
Sadiya, Brahmaputra Riverbed area etc.). Blocks considered by Oil India, which are considered
challenging are given in table below:
Table 46: Challenging blocks of Oil India
Name of Block States
Nomination
Tinsukia PEL Assam
Lakhimpur PEL Assam
Murkongselek PEL Assam
Ningru PML Arunachal Pradesh
Ningru Extn PML Arunachal Pradesh
Jairampur PEL Arunachal Pradesh
Jairampur Extn PEL Arunachal Pradesh
Namchik PEL Arunachal Pradesh
Deomali PEL Arunachal Pradesh
Namsai PEL Arunachal Pradesh
NELP Blocks in challenging category
AA-ONN-2002/3 Assam
AA-ONN-2010/2 Assam
AA-ONN-2010/3 Assam
MZ-ONN-2004/1 Mizoram

Directorate General of Hydrocarbons (DGH)
[86] Hydrocarbon Vision 2030 for Northeast India - Final Report
Similarly, list of challenging blocks identified by ONGC are given below:
Table 47: Nomination blocks of ONGC
Block/Sector State/Area Rationale for being in
Challenging category
SE-Geleki ML North Assam shelf-Sivasagar Lying in DAB areas
Disangmukh-Panidihing
sector
North Assam shelf-Sivasagar Environmental challenges-
Lying within the eco-fragile
zone
Teok Area North Assam shelf-Sivasagar Environmental constraints,
difficulty in getting EC
AA-ONN-2001/3 South Assam Shelf – Dhansari
valley sector Lying in DAB areas
AA-ONN-2005/1 South Assam Shelf – Dhansari
valley sector Lying in DAB areas
Karbi-Anglong and North
Kachar hills Souther part of South Assam
Shelf
Logistically difficult, tectonically
complex area with
environmental concerns
Cachar Assam Logistically difficult area
Eastern Tripura Tripura Logistically difficult area
Tichna field Tripura
Obtaining environmental
clearance is constraint
Khubal Tripura Environmental constraints
Nagaland Nagaland MOU signing awaited with
state Government
Source: ONGC
5.1.4.4.7 Action Plan
The table below provides action plan needed to devise a different model for special category fields in
North Eastern region
Table 48: Action Plan for Special Category challenging blocks in NER
Action Items Concerned
Authorities
Timelines
Short Term
(0-2 years)
Medium Term
(2-5 Years)
Long Term
(More than 5
Years)
Offering premium on Gas production in NER
Categorize special
category “Challenging
blocks”
MoPNG/
DGH
Conduct studies
to identify the
criterion for
special category
blocks in NER
Declare special
category and
devise modified
conditions in
terms of timelines,

Directorate General of Hydrocarbons (DGH)
[87] Hydrocarbon Vision 2030 for Northeast India- Final Report
Action Items Concerned
Authorities
Timelines
Short Term
(0-2 years)
Medium Term
(2-5 Years)
Long Term
(More than 5
Years)
royalty, price and
tax incidence
Focus shift from revenue
maximization to
production maximization
by Government of
India/MoPNG through
paying Premium on
current prevailing Gas
Prices produced from
Challenging Blocks
which may make many
blocks commercially
viable. Premium needs
to be paid till northeast
region is connected to
National Gas Grid.
MoPNG Review for
implementation
5.1.4.4.8 Analysis of life cycle cost in NER vs other parts of India
As has been described in the above sections of the report, exploration, development and production
activities in the northeastern region pose a challenge to the developer, which escalates the overall cost
of production. Such escalation of cost discourages further investment in the region, thereby limiting the
exploration activity to certain extent. Therefore, in order to improve the overall investment sentiment in
oil and natural gas exploration activities in the region, a pertinent incentive mechanism needs to be
incorporated. We have carried out our analysis based on Data provided by DGH which is depicted in
the table below:
Table 49: Key Assumptions for cost comparison
Description Average cost in NER
blocks ($/mmboe)
Cost in a block in
Cauvery basin % higher/ (lower)
Unit Explorartion capital 7.60 1.70 348%
Unit Developmental
capital cost 4.92 3.57 38%
Unit Production costs 3.37 9.12 -63%
Unit Life Cycle Costs 15.88 14.39 10%
As can be observed from the table above, the overall cost of production i.e. the life cycle cost is 10%
higher for blocks in NER than in the rest of country. Based on our analysis an appropriate premium

Directorate General of Hydrocarbons (DGH)
[88] Hydrocarbon Vision 2030 for Northeast India - Final Report
may be given on production of natural gas from the region. Crude oil prices are already linked to
international market prices; hence there is no requirement of offering incentive on oil production.
5.1.4.5 Service Providers
Service providers are the backbone of any industry that is capital intensive in nature. The typical spends
of E&P operators on outsourced work to service providers is more than 60% of their total E&P costs
which highlights the significance of service providers. The E&P service providers have played a key
role in the success of E&P operators worldwide. India too relies heavily on the oilfield service providers.
This reliance is expected to continue in the future if the country targets to explore and produce
hydrocarbon resources from its vast sedimentary areas of 3.14 million square km.
Although significant oil and gas potential exists in the Northeast region, the exploration and
development of such potential have been stalled by various issues. The presences of service providers
are also limited in the Northeast region due to issues such as law and order problems, inadequate
connectivity infrastructures, lower business potential etc. The service providers who are present in the
region provide limited service offerings instead of their entire service portfolio they offer elsewhere in
India due to economic viability and other issues. Further, the NOCs operating in the region have
developed significant in-house service capacities to cope up with the challenges posed by such
unavailability of reputed service providers. However, the small players as well as other private E&P
operators are facing full brunt of such unavailability, as they could neither develop in-house services in
a short span of time nor they could hire reputed service providers due to financial constraints. Moreover,
the local service providers are not technologically and financially sound enough to fulfill the
requirements of E&P operators. Therefore, the E&P activities in Northeast India are constantly being
confronted by the unavailability of service providers.
Oilfield services cover a wide range of activities which originate from exploration and continue at every
stage till the final delivery of crude to refineries. The E&P companies utilize the specialized services
and latest technology offerings of the service providers to reduce the underground risks, thereby
improving chances of success in E&P operations. The current oil and gas services market in India is
dominated by foreign players such as Transocean, Schlumberger, Halliburton, Baker Hughes,
Weatherford etc. The majority of the consumables and equipment or tools required in the different E&P
activities are also imported. The Indian service providers and suppliers have a lot of catching up to do
with their foreign counterparts in terms of technology, quality and skilled manpower.
Due to lack of service providers in the region, the cost of service is considerably higher in NER, than in
rest of India. This also leads to a delay in E&P activities since the material/service procurement has a
longer lead time due to lack of service providers in the region. Large service providers (both domestic
and international) are reluctant to enter Northeast India owing to the concerns mentioned below.
5.1.4.5.1 Key Issues/ Concerns
Key Issues related to service providers in Northeast India have been presented below.
Table 50: Key Issues/ Concerns related to service providers in Northeast India
Issue Descriptions
Limited
presence/
Unavailability
of Service
Providers
Low acreages and lack of marketing the true E&P potential in the region
leading to lower business
No assurance of continuous business thus increasing the mobilization
cost which in turn deters the service providers to enter into such market
Directorate General of Hydrocarbons (DGH)
[89] Hydrocarbon Vision 2030 for Northeast India- Final Report
Issue Descriptions
Unfavorable policy regarding essentiality certificate. Approvals are
obtained specific to individual end use and contract duration only for
moving the equipment into the region. Such approval is automatically
revoked and the service provider has to move the equipment back to a
SEZ / other geography and re-export for subsequent contracts.
The SEZ Act and Rules thereto do not include E&P services. Therefore,
the participants aren’t eligible for any benefits under SEZ Act.
Law and order problem creating a hostile geo-political scenario.
Poor connectivity infrastructure hindering mobilization of resources which
include heavy equipment
Absence of ancillary fabricating and manufacturing industries
5.1.4.5.2 Action Areas
a) NOCs as service providers
NOCs can offer their services to other operators in the region on a chargeable basis creating a win-win
situation for the country as well as individual organizations. This can be beneficial for NOCs as well as
other operators who require such services at an affordable cost. NOCs need to extend their services
to third parties as well as to private operators in Oil and Gas sector in NER. NOCs can turn around their
service centre from being a cost centre into a revenue center. This will ease the availability of services
in remote areas as both the NOCs have large base, experienced manpower and presence in remote
locations. Government need to facilitate the NOCs.
List of service which NOCs are providing currently:
Seismic equipment’s for exploration,
Drilling services,
Workover services,
Well completion services,
Rigs for drilling,
Services for technical challenges while production or remedial action to be taken in case of blowouts.
b) Service Providers Hub
Considering the challenges discussed above, it is important to establish service hubs in suitable
locations in the region so that the E&P operators including the NOCs can avail such services at a
reasonable price. This will encourage the exploration activities in Northeast India as project economics
will be viable for the E&P operators. Once created, such hubs can accelerate development of other
industries as well. Further, such hub can cater to the demands of other countries like Bangladesh and
Myanmar due to proximity of location.
Key criteria for setting up of service hubs could be:
Strategic location to cater to the blocks spread across the region.
Connectivity with mainland and other hubs in the country
Land availability for creation of such hub
Good Infrastructure with scope for creating common facilities like accommodation, medical,
educational facilities etc.
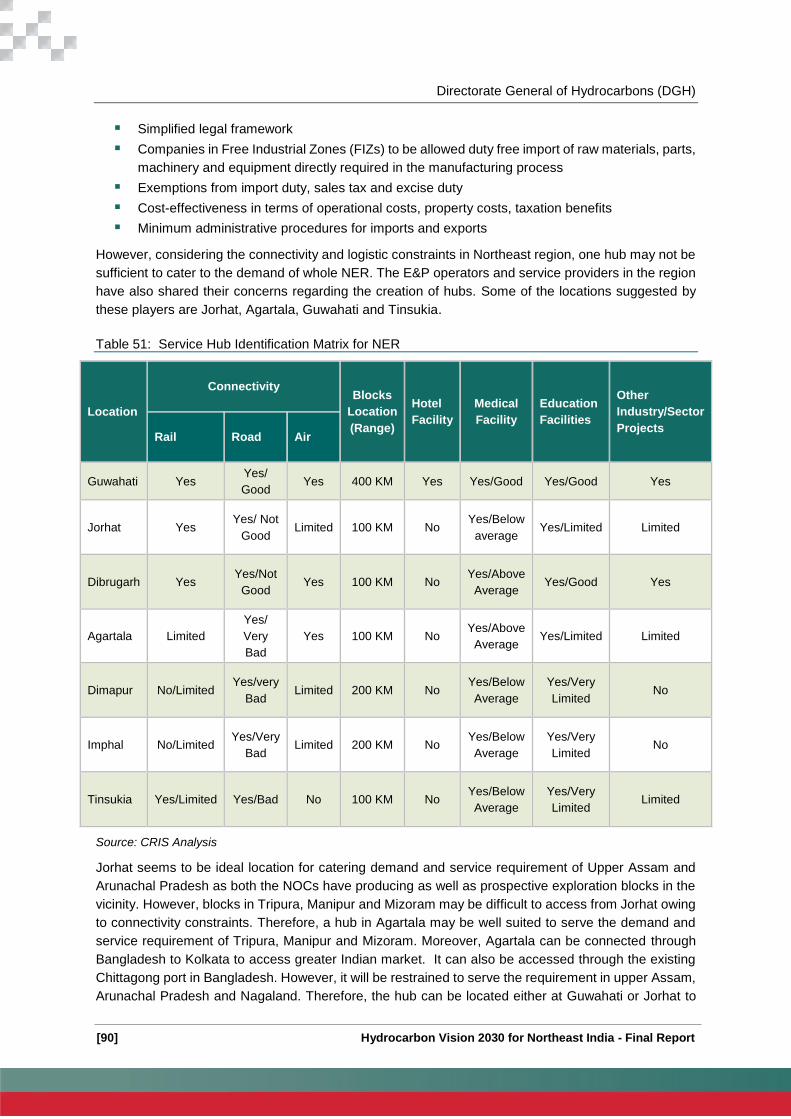
Directorate General of Hydrocarbons (DGH)
[90] Hydrocarbon Vision 2030 for Northeast India - Final Report
Simplified legal framework
Companies in Free Industrial Zones (FIZs) to be allowed duty free import of raw materials, parts,
machinery and equipment directly required in the manufacturing process
Exemptions from import duty, sales tax and excise duty
Cost-effectiveness in terms of operational costs, property costs, taxation benefits
Minimum administrative procedures for imports and exports
However, considering the connectivity and logistic constraints in Northeast region, one hub may not be
sufficient to cater to the demand of whole NER. The E&P operators and service providers in the region
have also shared their concerns regarding the creation of hubs. Some of the locations suggested by
these players are Jorhat, Agartala, Guwahati and Tinsukia.
Table 51: Service Hub Identification Matrix for NER
Location
Connectivity Blocks
Location
(Range)
Hotel
Facility
Medical
Facility
Education
Facilities
Other
Industry/Sector
Projects Rail Road Air
Guwahati Yes Yes/
Good Yes 400 KM Yes Yes/Good Yes/Good Yes
Jorhat Yes Yes/ Not
Good Limited 100 KM No
Yes/Below
average Yes/Limited Limited
Dibrugarh Yes Yes/Not
Good Yes 100 KM No
Yes/Above
Average Yes/Good Yes
Agartala Limited
Yes/
Very
Bad
Yes 100 KM No Yes/Above
Average Yes/Limited Limited
Dimapur No/Limited Yes/very
Bad Limited 200 KM No
Yes/Below
Average
Yes/Very
Limited No
Imphal No/Limited Yes/Very
Bad Limited 200 KM No
Yes/Below
Average
Yes/Very
Limited No
Tinsukia Yes/Limited Yes/Bad No 100 KM No Yes/Below
Average
Yes/Very
Limited Limited
Source: CRIS Analysis
Jorhat seems to be ideal location for catering demand and service requirement of Upper Assam and
Arunachal Pradesh as both the NOCs have producing as well as prospective exploration blocks in the
vicinity. However, blocks in Tripura, Manipur and Mizoram may be difficult to access from Jorhat owing
to connectivity constraints. Therefore, a hub in Agartala may be well suited to serve the demand and
service requirement of Tripura, Manipur and Mizoram. Moreover, Agartala can be connected through
Bangladesh to Kolkata to access greater Indian market. It can also be accessed through the existing
Chittagong port in Bangladesh. However, it will be restrained to serve the requirement in upper Assam,
Arunachal Pradesh and Nagaland. Therefore, the hub can be located either at Guwahati or Jorhat to

Directorate General of Hydrocarbons (DGH)
[91] Hydrocarbon Vision 2030 for Northeast India- Final Report
service the requirement of the E&P developers. Further, a hub in Agartala can also be thought of in
future as well.
Some of the incentives that would promote such a hub are as follows:
Identification of land in Jorhat and Agartala for Service Providers Hub by MoPNG along with
State Governments.
Notification for SEZ in line with other Hubs operating in Area- SEZ and extension of all benefits
available in other SEZs.
Benefit to companies and their employees in terms of Medical Insurance re-imbursement for
employees posted in these area and hubs
Favorable tax benefits that may include Income tax Holidays for service providers having base
in NER.
Setting up of medium and small scale ancillary fabricating and manufacturing industries to
promote oilfield services sector
5.1.4.5.3 Action Plan
The table below provides action plan that needs to be carried out for improving service providers
availability in Northeast India.
Table 52: Action Plan for promoting availability of service providers in Northeast India
Action Items Concerned
Authorities
Timeline
Short Term
(Less than 2 Years)
Medium Term
(2 -5 Years)
Long Term
(>5 Years)
NOCs as
Service
Providers
ONGC & OIL
NOCs need to extend their
services to third parties on
a chargeable basis
Extension of
services by ONGC
& OIL.
New hub
MoPNG/
Ministry of
Finance
Study strategic utility of
Jorhat and Agartala as hub
Development of
service hubs in
Northeast India
State/Policy Support
Fiscal
Incentives
MoPNG/
Ministry of
Finance
Favorable tax benefits that
may include Income tax
Holidays for service
providers having base in
NER for 10 years
Offer fiscal
benefits to service
providers willing
to participate in
such hubs
Industrial
Policy
Promotion
Ministry of
Commerce &
Industry/ State
Govt
Explore various models
most suitable for Oil and
Gas sector
Develop Free
Industrial Zones
(FIZs) or Special
Economic Zones
(SEZs)
Directorate General of Hydrocarbons (DGH)
[92] Hydrocarbon Vision 2030 for Northeast India - Final Report
5.1.4.6 Policy Environment
5.1.4.6.1 Current Scenario
The Northeast of India is endowed with huge untapped natural resources and is acknowledged as the
eastern gateway of India’s Look-East Policy. Nonetheless, the region is cited as a conflict-stricken
remote corner of India, witnessing a series of insurgencies. The ambiguity related to the economic
potential has added fuel to the turmoil.
Despite a robust production-sharing contract (PSC) regime, Indian oil and gas block auctions have not
been able to attract big players such as Exxon, Chevron etc. The reason could be attributed to
uncertainty in policy implementation and government interference.
The North East Industrial and Investment Promotion Policy 2007 of the Government of India has laid
down a number of fiscal incentives for investors in North East India. The provisions of the NEIIPP, 2007
had requisite incentives as well as an enabling environment to speed up the industrialization of the
region. The highlights of the incentives for all industrial units, new as well as existing units & on their
substantial expansion, located anywhere in the North East included excise duty exemption, subsidy on
capital investment, subsidy on plants and machinery, power subsidy and transport subsidy. The
Department of Industrial Policy and Promotion, Ministry of Commerce and Industry, Government of
India, issued a circular to all the eight North-eastern States to convey that registration under the
schemes of NEIIPP, 2007 had been suspended with effect from December 1, 2014.
Oil & gas industry was never included in NEIIPP due to budget limitations, but NEIIPP has been able
to lure small as well as large business establishments to set up their business in the state.
State governments play an important role in facilitating E&P activities, for both on-land and offshore
blocks. One of the major bottlenecks facing E&P operators is the delay in awarding requisite approvals
and clearances by the centre and state governments. This not only adversely affects the investor
sentiment, but also results in significant project delays and financial losses for operators. As per current
rules, the Union government issues PELs/MLs in consultation with the state governments. State
governments play a vital role in supporting environment approvals, facilitating land acquisitions etc. This
indicates the criticality of support from state governments for E&P activities. In the case of offshore
blocks, issues such as siting of on-shore terminals, provision of support services and creation of
pipelines for evacuation of hydrocarbons require significant state government support.
5.1.4.6.2 Latest Developments
Exploration Licensing Policy
OALP: To make India a favorable destination globally for exploration of Oil and natural gas,
government plans to move to the OALP regime soon. This will enable upstream companies to
bid for any oil and gas block without waiting for the announcement of bidding under the new
exploration licensing policy (NELP) regime.
The proposed Uniform Licensing Policy for award of hydrocarbon acreages under a new
contractual system and fiscal model will lift all restrictions on explorers hunting for hydrocarbons.
In keeping with what the explorers have been seeking for long, they can hunt for all kinds of
resources: oil, gas, coal-bed methane and shale gas. Launch of Open Acreage Licensing Policy
(OALP) regime to explore hydrocarbons depends upon the readiness of the national data
repository (NDR). The contract has been awarded to M/S Halliburton on 28.02.2014. Currently
initial data population phase of the NDR project is going on. The NDR centre is likely to be open
for public in March 2016 once initial data population is over. However, for setting up the
infrastructure to feed the data in the system is bound to take some time. DGH is the coordinating

Directorate General of Hydrocarbons (DGH)
[93] Hydrocarbon Vision 2030 for Northeast India- Final Report
body for NDR. The NDR would be hosted at the DGH office in Noida. The government had
amended Rule 19 of the petroleum and natural gas rules to enable DGH to obtain all the data
from various operators or licensees, which could be disclosed to prospective bidders as and
when required under the open acreage system.
Open acreage will enable bidders to bid for blocks on offer at any time of the year. Data for the
blocks will be made available to bidders through NDR. Pakistan also has such a system in place.
The NDR is expected to play a much larger and significant role in the exploration and production
scenario in the years to come. The NDR will also facilitate gathering of all geo-scientific data
available in India under one roof so that it is easily available to the agencies that require it.
GOI has recently approved the Marginal Field policy which will further provide opportunities to
enhance the production from isolated and unexplored areas. The union cabinet approved the
Marginal Field Policy (MFF), on 2nd September 2015, for development of hydrocarbon
discoveries made by national oil companies. These discoveries could not be monetized for many
years due to various reasons such as isolated locations, small size of reserves, high
development costs, technological constraints, fiscal regime etc.
Survery of unexplored areas in NER will enable further resource conversion from the
prognosticated to established reserve category. The advent of new technology for exploration in
oil and gas segment which is described in the section on resource conversion from yet to find
areas, will lead to significant increase in oil and gas resource potential from the region.
5.1.4.6.3 Action Areas
Sector Policy Framework
Identification of High risk areas considering the tough conditions and connectivity issues to be
put in separate category i.e. challenging Blocks. According to Oil India, NER blocks falling in the
hilly regions and Brahmaputra River bed areas can be termed as challenging blocks. This will
cover entire states of Mizoram, Manipur, Tripura, Nagaland, Meghalaya, Arunachal Pradesh and
parts of Assam (Karbi Anglong, Dima Hasau, Sadiya, Brahmaputra Riverbed area etc.).
Shifting of focus from revenue maximization to production maximization by Government through
paying Premium on Gas Prices produced from Challenging Blocks which may make many blocks
commercially viable.
Review for implementation of OALP and identify larger acreages
Only those blocks for which clearances related to Environment and Forest are available should
be made available for bidding (from earlier process of In-principal approval) as it reduces the
risk for bidder and will increase competition in attractive blocks.
Revenue maps/Forest land demarcation maps should be made available to private parties along
with bidding documents.
Timeline and penalty in challenging blocks needs to be relaxed as compared to rest of India
blocks.
Build the National Geo Data Repository and launch Open Acreage License Policy — this allows
prospective bidders to look at the data any time and offer a bid to explore in the most transparent
manner.
To encourage participation of operators in the appraisal of Indian basins, companies should be
authorized to carry out seismic surveys in chosen blocks and should be given the Right of First
Refusal (ROFR) when the acreage is subsequently put up for bidding.
Announce the PSC extension policy to remove uncertainty over the production sharing contracts
of few producing fields due for extension.

Directorate General of Hydrocarbons (DGH)
[94] Hydrocarbon Vision 2030 for Northeast India - Final Report
Flexibility to be given in completion of MWP on alternate blocks: As per bids submitted under
NELP, companies have to bid for minimum work program (MWP) to be carried out, consisting of
2D and 3D seismic surveys and drilling of exploratory wells. The operator has to carry out the
committed MWP, else face penalties. However, incase additional exploration activity leads to no
incremental value, the operator should be given the flexibility of carrying out the outstanding
MWP on a different block with similar characteristics where operator holds a valid exploration
license.
Clearance and approvals
Provide safety and security to goods and services of operators
The process of attaining approvals and clearances should be streamlined such that 'in-principle'
approval or clearances that are granted should be honored and not warranted-approval'. 'In-
principle' clearances must be carefully evaluated prior to award and may highlight 'exceptions'
or 'no-go areas'. Also, approvals not received within the set timeframe should be deemed as
obtained.
Single window clearance/Approval should be provided for such projects. This will reduce the procedural
delay in exploration and production activities.
Exploratory drilling should be exempted from EC and FC. Exploratory drilling is usually a short
duration temporary activity lasting a few months (~ 6 months). However the present policy
mandates obtaining of Environmental Clearance (EC) for Exploratory drilling activities equating
it with any other industry. Therefore intervention is sought for dispensation to exempt Exploratory
drilling from the purview of EC.
Batch clearances should be operational for certain areas with certain timeline say (2 years)
irrespective of number of wells in that area. This will reduce the time of getting clearances in
case of drilling an alternate well due to land availability and other issues. For example, MoEF
can grant EC to 50 wells to be explored in area of 5km2 radius of particular location.
State governments have a stake in oil and gas exploration and are entitled to royalty accrual for
on-land production and 50% share in profit of petroleum. State governments should be made
aware of their potential financial interests from E&P operations-which extend beyond royalty,
profit share and sales tax receipts, and could arise from the downstream activities undertaken
within the state.
5.1.4.7 Re-allotment of relinquished blocks to NOCs
In the PSC regime, the contractor has an option to relinquish Contract Area after completion of Minimum
Work Program or proceed to the Subsequent Exploration Period and retain the Contract Area by
committing to carry out drilling of one well per year in Contract Area (in case of on-land and shallow
water blocks) / one well in 3 years in contract Area (in case of deep water blocks). At the end of the
exploration period the contractor retains only the development and discovery areas and, all contract
area except development and discovery areas have to be relinquished.
Therefore the followings suggestions can be evaluated to ensure all possibility of oil& gas production in
northeast India.
Such relinquished areas in NER, should be given back to NOCs on a nomination basis for
exploration and production.
These areas were previously relinquished due to inability of companies to make any discoveries
in these areas. However, since that time, technologies have improved and further exploration in
such areas may lead to newer oil and gas finds.
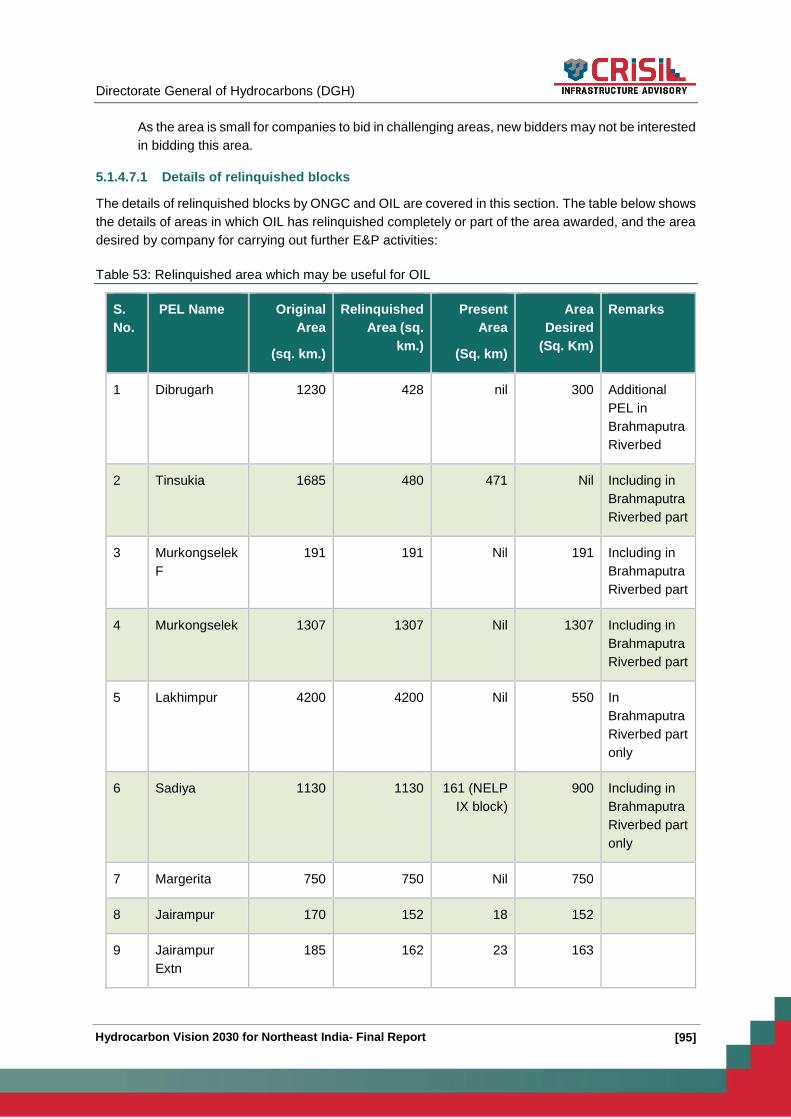
Directorate General of Hydrocarbons (DGH)
[95] Hydrocarbon Vision 2030 for Northeast India- Final Report
As the area is small for companies to bid in challenging areas, new bidders may not be interested
in bidding this area.
5.1.4.7.1 Details of relinquished blocks
The details of relinquished blocks by ONGC and OIL are covered in this section. The table below shows
the details of areas in which OIL has relinquished completely or part of the area awarded, and the area
desired by company for carrying out further E&P activities:
Table 53: Relinquished area which may be useful for OIL
S.
No.
PEL Name Original
Area
(sq. km.)
Relinquished
Area (sq.
km.)
Present
Area
(Sq. km)
Area
Desired
(Sq. Km)
Remarks
1 Dibrugarh 1230 428 nil 300 Additional
PEL in
Brahmaputra
Riverbed
2 Tinsukia 1685 480 471 Nil Including in
Brahmaputra
Riverbed part
3 Murkongselek
F
191 191 Nil 191 Including in
Brahmaputra
Riverbed part
4 Murkongselek 1307 1307 Nil 1307 Including in
Brahmaputra
Riverbed part
5 Lakhimpur 4200 4200 Nil 550 In
Brahmaputra
Riverbed part
only
6 Sadiya 1130 1130 161 (NELP
IX block)
900 Including in
Brahmaputra
Riverbed part
only
7 Margerita 750 750 Nil 750
8 Jairampur 170 152 18 152
9 Jairampur
Extn
185 162 23 163
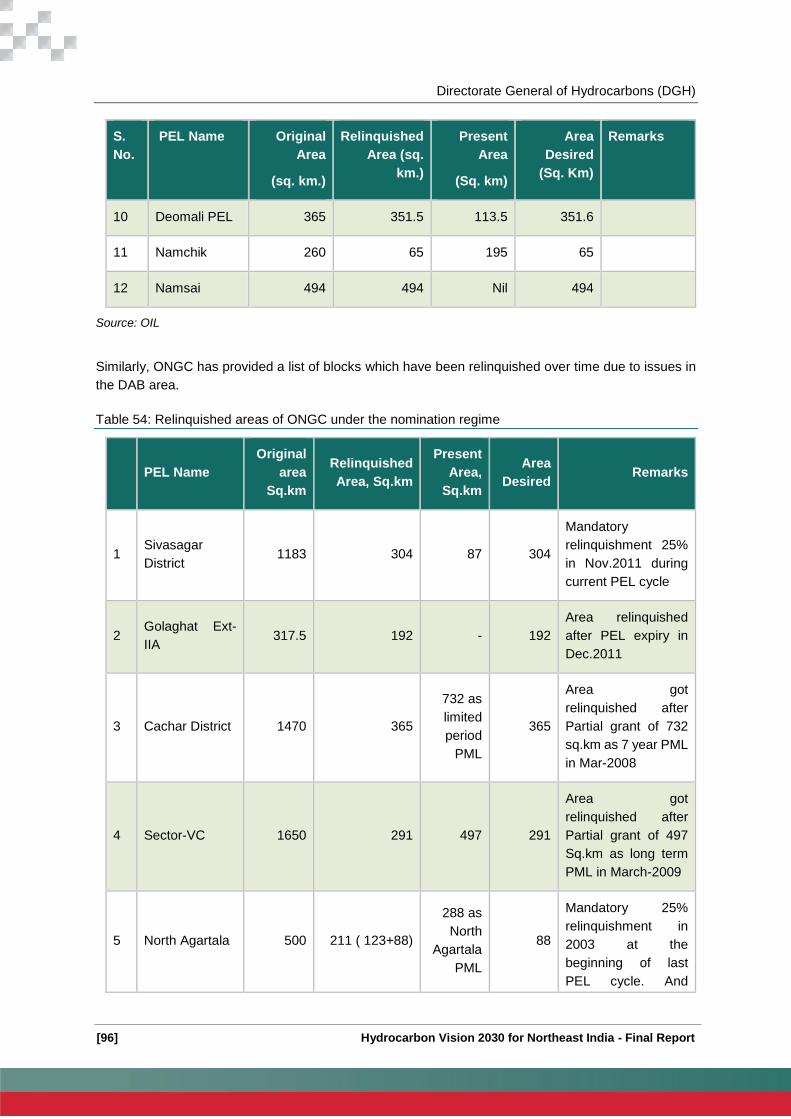
Directorate General of Hydrocarbons (DGH)
[96] Hydrocarbon Vision 2030 for Northeast India - Final Report
S.
No.
PEL Name Original
Area
(sq. km.)
Relinquished
Area (sq.
km.)
Present
Area
(Sq. km)
Area
Desired
(Sq. Km)
Remarks
10 Deomali PEL 365 351.5 113.5 351.6
11 Namchik 260 65 195 65
12 Namsai 494 494 Nil 494
Source: OIL
Similarly, ONGC has provided a list of blocks which have been relinquished over time due to issues in
the DAB area.
Table 54: Relinquished areas of ONGC under the nomination regime
PEL Name
Original
area
Sq.km
Relinquished
Area, Sq.km
Present
Area,
Sq.km
Area
Desired Remarks
1 Sivasagar
District 1183 304 87 304
Mandatory
relinquishment 25%
in Nov.2011 during
current PEL cycle
2 Golaghat Ext-
IIA 317.5 192 - 192
Area relinquished
after PEL expiry in
Dec.2011
3 Cachar District 1470 365
732 as
limited
period
PML
365
Area got
relinquished after
Partial grant of 732
sq.km as 7 year PML
in Mar-2008
4 Sector-VC 1650 291 497 291
Area got
relinquished after
Partial grant of 497
Sq.km as long term
PML in March-2009
5 North Agartala 500 211 ( 123+88)
288 as
North
Agartala
PML
88
Mandatory 25%
relinquishment in
2003 at the
beginning of last
PEL cycle. And

Directorate General of Hydrocarbons (DGH)
[97] Hydrocarbon Vision 2030 for Northeast India- Final Report
PEL Name
Original
area
Sq.km
Relinquished
Area, Sq.km
Present
Area,
Sq.km
Area
Desired Remarks
88sq.km after PEL
expiry in Jan-2011
6 Large Area in
Tripura 1260 151 1012.71 151
Mandatory
relinquishment 25%
in DEC-2003
7 West Tripura 3100 364
1327
sq.km as
PML
- In Sept-2008
8 Merapani 160 40 - -
At the beginning of
last PEL Cycle in
2003
9 Golaghat
district 245 30 - -
At the beginning of
last PEL Cycle in
2003
10 Karbi-Anglong 620 155 - -
At the beginning of
last PEL Cycle in
2003
11 Kopili Valley 5330 2025 - -
At the beginning of
last PEL Cycle in
2003
Sector-IX 3820 Total - - Could not expend
any input in PEL
cycle. Issue with
State Govt. Sector-X 3168 Total - -
Source: ONGC
Initially ONGC held close to 10,612 sq.km of area in NER, after relinquishment, currently the area
available with ONGC is around 3,704 sq. km (relinquished around 6,908 sq. km). However out of this,
2660 Sq. Km (72%) is in Mizoram State wherein limited exploratory inputs can be expended in tune with
PSC & Committed program.
A rough estimation is that offering of relinquished area to OIL may increase production of around 0.2-0.3
MMTPA in another 3-5 years.
Details of blocks relinquished under the PSC regime has been given in the table below:

Directorate General of Hydrocarbons (DGH)
[98] Hydrocarbon Vision 2030 for Northeast India - Final Report
Table 55: Details of blocks relinquished under PSC regime
S. No. Block Operator Bidding Round
1 AA-ON/3 Okland Pre-NELP
2 AA-ONN-2003/2 Geo-Petrol NELP V
3 AA-ONN-2003/3 OIL NELP V
4 AA-ONN-2004/1 OIL NELP VI
5 AA-ONN-2004/2 OIL NELP VI
6 AA-ONN-2004/3 EOL NELP VI
7 AA-ONN-2004/4 Naftogaz NELP VI
8 AA-ONN-2005/1 ONGC NELP VII
9 AA-ONN-2010/1 PPCL NELP IX
10 AS-ONN-2000/1 RIL NELP II
11 CR-ON-90/1 Premier Oil Pre-NELP
12 MZ-ONN-2004/2 Naftogaz NELP VI
5.1.4.7.2 Action Plan
The table below provides action plan that needs to be carried out for improving policy environment in
Northeast India.
Table 56: Action Plan for Policy framework and approvals
Action Items Concerned
Authorities
Timeline
Short Term
(Less than 2 Years)
Medium Term
(2- 5 Years)
Long
Term (> 5
Years)
Sector Policy Framework
Identification of High risk
areas/Challenging Areas in
NER by DGH as per past
records and experience
and categorize this areas
as “Challenging Areas”.
DGH/MoPNG Review for
implementation
Relaxation in timelines for
challenging blocks to be
revised to 12 years (8+4)
from current 7 years (4+3)
available for NER Blocks
considering only 6-7
months are available for
survey and exploration.
MoPNG/DGH
Review for
implementation

Directorate General of Hydrocarbons (DGH)
[99] Hydrocarbon Vision 2030 for Northeast India- Final Report
Action Items Concerned
Authorities
Timeline
Short Term
(Less than 2 Years)
Medium Term
(2- 5 Years)
Long
Term (> 5
Years)
Extension of Tax holiday
from 7 years to 12 years for
challenging areas in future
contracts to make blocks
economically viable and
attract bidders’ interest in
future.
MoPNG/DGH
Review for
implementation
Making data and Revenue
maps available in NER
Area to bidders during
bidding.
DGH
Review for
implementation
Clear extension policy of
PSC agreement to facilitate
more investment
DGH/MoPNG Implementation
Inclusion of policy on giving
flexibilities to operator on
carrying out outstanding
MWP on similar blocks
where operator holds an
exploratory license, in PSC
DGH/MoP&N
G
Review for
implementation
Clearance and Approvals
Single Window clearance
to all Oil & Gas Projects MoEF
Review of single window
clearance
mechanisms for oil
and gas projects in
Northeast region
Exemption from
Environment Clearance for
exploratory drilling
MoEF
Review Review of
implementation of
mechanisms for
the exemption
Batch Clearance to Drilling
Wells (Within specified
area)
MoEF
Review Review of
implementation of
such mechanism
so that operator
can get batch
clearances
Boundary Demarcation of
Forest and Non Forest
Area in Land Records
State
Government/
MoEF
Start updating
land records so
that type of land
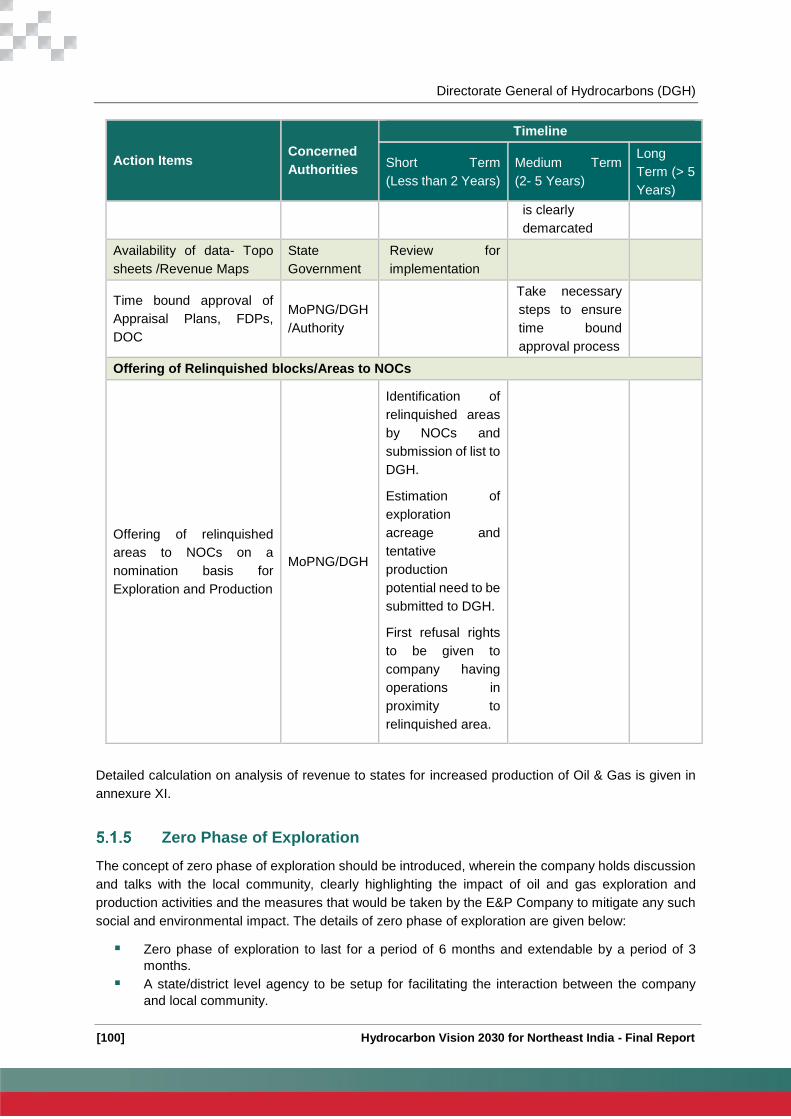
Directorate General of Hydrocarbons (DGH)
[100] Hydrocarbon Vision 2030 for Northeast India - Final Report
Action Items Concerned
Authorities
Timeline
Short Term
(Less than 2 Years)
Medium Term
(2- 5 Years)
Long
Term (> 5
Years)
is clearly
demarcated
Availability of data- Topo
sheets /Revenue Maps
State
Government
Review for
implementation
Time bound approval of
Appraisal Plans, FDPs,
DOC
MoPNG/DGH
/Authority
Take necessary
steps to ensure
time bound
approval process
Offering of Relinquished blocks/Areas to NOCs
Offering of relinquished
areas to NOCs on a
nomination basis for
Exploration and Production
MoPNG/DGH
Identification of
relinquished areas
by NOCs and
submission of list to
DGH.
Estimation of
exploration
acreage and
tentative
production
potential need to be
submitted to DGH.
First refusal rights
to be given to
company having
operations in
proximity to
relinquished area.
Detailed calculation on analysis of revenue to states for increased production of Oil & Gas is given in
annexure XI.
Zero Phase of Exploration
The concept of zero phase of exploration should be introduced, wherein the company holds discussion
and talks with the local community, clearly highlighting the impact of oil and gas exploration and
production activities and the measures that would be taken by the E&P Company to mitigate any such
social and environmental impact. The details of zero phase of exploration are given below:
Zero phase of exploration to last for a period of 6 months and extendable by a period of 3
months.
A state/district level agency to be setup for facilitating the interaction between the company
and local community.

Directorate General of Hydrocarbons (DGH)
[101] Hydrocarbon Vision 2030 for Northeast India- Final Report
The agency to facilitate the participation of Company and local community in socializing
programs, which are intended to create opportunities for dialogues and confidence building
between the parties.
The company to hold discussions with the local community regarding the potential impact of
E&P activities on the local community.
The company to highlight the measures to be adopted for mitigating any hazardous impact.
The company and the representatives of the community to arrive at compensation, that is to
be offered to the community members for use of land and resources of the community.
The company to make the community aware about the development activities on social,
economic, cultural and environmental fronts that will be carried out by the company.
At the end of the zero phases, the company has an exit option in case the local community and
the company are unable to reach to a concurring point.
5.1.5.1 Action Plan
The table below provides action plan needs to be carried out for including zero phase exploration period
Table 57: Action Plan for Zero phase of exploration
Action Items Concerned
Authorities
Timeline
Short Term
(Less than 2 Years)
Medium Term
(2- 5 Years)
Long
Term (> 5
Years)
Concept of zero phase
exploration period to be
included in the PSC, wherin
the E&P company and the
local community develop a
platform for interaction
DGH/MoPNG
To be implemented
in the new bidding
rounds
Setting up of a local agency
to facilitate the interaction
between company and
local community
State
Government/
MoP&NG
To be implemented

Directorate General of Hydrocarbons (DGH)
[102] Hydrocarbon Vision 2030 for Northeast India - Final Report
Midstream
Crude oil and petroleum products in India are transported through rail, road and pipeline with highest
share being moved through pipelines. Gas is primarily transported in pipeline only owing to its
characteristic constraints. Advantages of pipeline transport as compared to other modes of transport
are given below:
Table 58 Advantages/ Disadvantage of Pipeline Transport
Advantages Disadvantages
Lower cost of transportation
Lower transit losses
Lower energy intensiveness
Economies of scale
Safety and Reliability -minimum
disruptions
Environment friendliness
Multi-product handling
Stationary carrier
Augmentation at low cost
Minimal land costs
Decongestion of surface transport
systems
Non flexible
Economical only after certain volume is
transported
The table below provides comparison between different modes of transportation for crude oil, natural
gas, petroleum products and LPG.
Table 59: Capital and operating cost of different Modes
Particulars Pipelines Road (4 Lane) Rail
Capital Cost (Rs Cr/Km) 4.5 5-6 10-12
Operating Cost (Rs/t/Km) 0.54* 4-5 2-2.25
Source: CRIS Analysis
*Present cost for IOCL 0.49, BPC 0.53 and HPCL 0.60/t/km.
It can be observed from the table above that cost of transportation through pipeline network is cheaper
compared to other medium such as road and railway network.
Crude Oil Pipeline
Existing Crude Oil Pipeline Network in Northeast India
Currently, Northeast India has crude oil pipeline network of over 1500 km. Oil India Limited (OIL) is the
largest player with a pipeline network ranging around 1192 km. Crude oil pipeline in Northeast India is
operated by the national oil companies namely OIL and ONGC. Oil India Limited (OIL) is operating an
1157 KM long cross country pipeline from Naharkatia to Barauni, feeding the North East Refineries
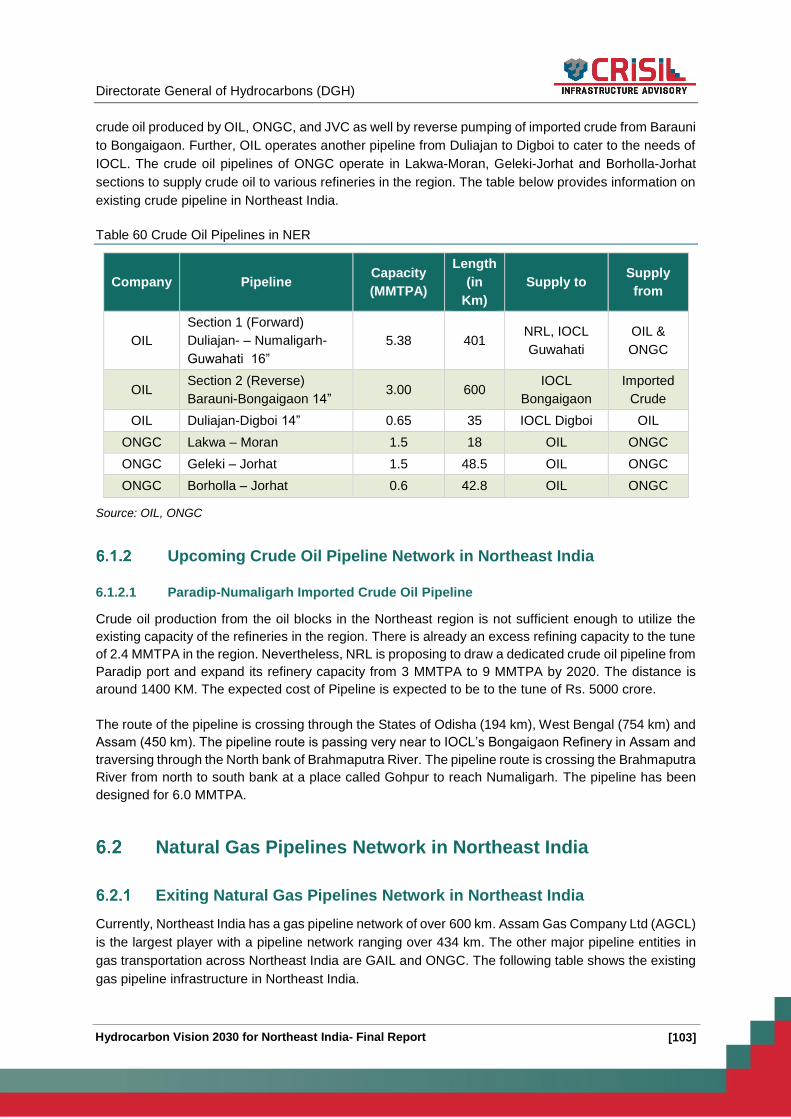
Directorate General of Hydrocarbons (DGH)
[103] Hydrocarbon Vision 2030 for Northeast India- Final Report
crude oil produced by OIL, ONGC, and JVC as well by reverse pumping of imported crude from Barauni
to Bongaigaon. Further, OIL operates another pipeline from Duliajan to Digboi to cater to the needs of
IOCL. The crude oil pipelines of ONGC operate in Lakwa-Moran, Geleki-Jorhat and Borholla-Jorhat
sections to supply crude oil to various refineries in the region. The table below provides information on
existing crude pipeline in Northeast India.
Table 60 Crude Oil Pipelines in NER
Company Pipeline Capacity
(MMTPA)
Length
(in
Km)
Supply to Supply
from
OIL
Section 1 (Forward)
Duliajan- – Numaligarh-
Guwahati 16”
5.38 401 NRL, IOCL
Guwahati
OIL &
ONGC
OIL Section 2 (Reverse)
Barauni-Bongaigaon 14” 3.00 600
IOCL
Bongaigaon
Imported
Crude
OIL Duliajan-Digboi 14” 0.65 35 IOCL Digboi OIL
ONGC Lakwa – Moran 1.5 18 OIL ONGC
ONGC Geleki – Jorhat 1.5 48.5 OIL ONGC
ONGC Borholla – Jorhat 0.6 42.8 OIL ONGC
Source: OIL, ONGC
Upcoming Crude Oil Pipeline Network in Northeast India
6.1.2.1 Paradip-Numaligarh Imported Crude Oil Pipeline
Crude oil production from the oil blocks in the Northeast region is not sufficient enough to utilize the
existing capacity of the refineries in the region. There is already an excess refining capacity to the tune
of 2.4 MMTPA in the region. Nevertheless, NRL is proposing to draw a dedicated crude oil pipeline from
Paradip port and expand its refinery capacity from 3 MMTPA to 9 MMTPA by 2020. The distance is
around 1400 KM. The expected cost of Pipeline is expected to be to the tune of Rs. 5000 crore.
The route of the pipeline is crossing through the States of Odisha (194 km), West Bengal (754 km) and
Assam (450 km). The pipeline route is passing very near to IOCL’s Bongaigaon Refinery in Assam and
traversing through the North bank of Brahmaputra River. The pipeline route is crossing the Brahmaputra
River from north to south bank at a place called Gohpur to reach Numaligarh. The pipeline has been
designed for 6.0 MMTPA.
Natural Gas Pipelines Network in Northeast India
Exiting Natural Gas Pipelines Network in Northeast India
Currently, Northeast India has a gas pipeline network of over 600 km. Assam Gas Company Ltd (AGCL)
is the largest player with a pipeline network ranging over 434 km. The other major pipeline entities in
gas transportation across Northeast India are GAIL and ONGC. The following table shows the existing
gas pipeline infrastructure in Northeast India.

Directorate General of Hydrocarbons (DGH)
[104] Hydrocarbon Vision 2030 for Northeast India - Final Report
Table 61: Existing natural gas pipelines in Northeast India
Route Owner/
Op
Length
(Km)
Supply
from Supply to
Supply
(mmscmd)
Duliajan-Namrup-Lakwa 16” AGCL 81 OIL Lakwa TPP 0.67
Duliajan-Namrup 20” AGCL 23 OIL Namrup
TPP 1.082
OIL-AGCL(Duliajan) Pipeline 1” AGCL 32 OIL - 0.00
Duliajan-Numaligarh Pipeline 16” DNPL 192 OIL NRL 0.91
AGCL(Duliajan) – Namrup (BVFCL)
Pipeline- HP 16” AGCL 25 OIL BVFCL 0.65
AGCL(Duliajan)-Namrup
(BVFCL)Pipeline-LP 16” AGCL 25 OIL BVFCL 1.24
Duliajan – Namrup (BVFCL) Pipeline)
14” AGCL 26 OIL BVFCL 0
Kathalguri – NEEPCO Pipeline 22” AGCL 7 OIL NEEPCO
TPP 1.83
Namrup (NTPS) - APL, Namrup
pipeline 4” AGCL 1 OIL APL 0.10
Wilton(Tengakhat)–
Madhabpur(Duliajan) Pipeline 12” AGCL 22 OIL - 0.00
Duliajan-Moran Pipeline AGCL
78
OIL
CGD
0.067
Bhekulajan-Dibrugarh Pipeline AGCL 47 OIL CGD 0.164
Tenghakhat-DoomDooma Pipeline AGCL 54 OIL CGD 0.118
Kushijan (Digboi)-DoomDooma
Pipeline AGCL
28 OIL
CGD
0.000
Digboi-Margherita Pipeline AGCL 23 OIL CGD 0.067
Lakwa-Jorhat/Golaghat Pipeline AGCL 117 OIL CGD 0.093
Koraghat-Uriumghat -Golaghat
Pipeline AGCL
58
OIL CGD
0.048
Lakwa 24” GAIL 8 ONGC ASEB,
Tea,LPG 0.52
Tripura 12” GAIL 61 ONGC
NEEPCO,T
NGCL,TSE
CL
1.44
Agartala- OTPC ONGC 35 ONGC OTPC
Duliajan – Dibrugarh BCPL 49 OIL BCPL N.A.
Source: AGCL, ONGC, GAIL
It can be observed from the above table that natural gas pipelines exist only in few pockets of the region.
Part of upper Assam and Tripura are currently covered under these networks as key demand centers
are located in Assam and Tripura. As can be observed from the table above, the total length of the
existing gas pipeline network in Northeast India is around 943 km which is too small a network to cover

Directorate General of Hydrocarbons (DGH)
[105] Hydrocarbon Vision 2030 for Northeast India- Final Report
such a vast area. Further, the cumulative capacities of these pipelines are around 13.98 MMSCMD,
which is barely enough to serve the present demand in the region.
Planned Natural Gas Pipelines Network in Northeast India
The capacities as well as coverage of gas pipelines in the region are not sufficient enough to meet
requirement of the region. The existing operators are trying to address the issues by putting in plans to
connect the major demand centers in Northeast India; the route of gas grid in the north east region has
been planned as below:
a) National Gas Grid (Barauni- Siliguri-Bongaigon-Guwahati pipeline network)
The proposed route has distance of around 800-900 Km and expected capital cost for the project is
around Rs 3600-4050 crore. Once connected, Northeast India will be connected to gas demand and
supply centers. The project is economically non-viable and still to take off.
Apart from connecting NER to National Gas grid, gas producing station need to be connected to other
demand centers, as major production of Gas is expected from Mizoram and Tripura Area, it is imperative
to connect these two states on a priority basis. Further, as Barauni is already being connected to
National Gas Grid through Jagdishpur-Barauni pipeline, it makes sense to propose a pipeline from
Barauni to rest of Northeast India. The figure below presents geographical map of the proposed pipeline
network.
Figure 29: Geographical Map of Barauni- Siliguri-Bongaigon-Guwahati pipeline
b) Proposed Gas Pipeline- Duliajan-Guwahati (by OIL)
The Duliajan - Numaligarh gas pipeline having capacity of 1 MMSCMD and currently utilization of
around 75-80% is proposed to be extended to Guwahati and subsequently to Bongaigaon for catering
needs of refineries. AGCL has carried out pre-feasibility survey on this route. The project has not
progressed further.
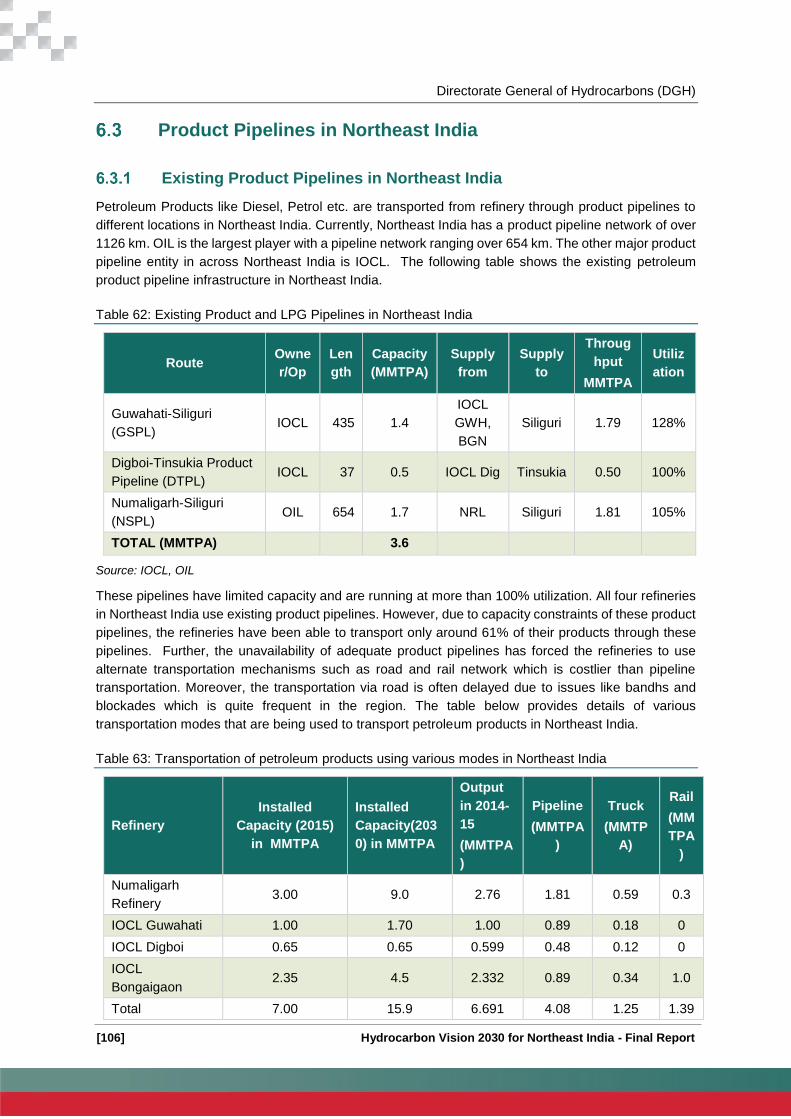
Directorate General of Hydrocarbons (DGH)
[106] Hydrocarbon Vision 2030 for Northeast India - Final Report
Product Pipelines in Northeast India
Existing Product Pipelines in Northeast India
Petroleum Products like Diesel, Petrol etc. are transported from refinery through product pipelines to
different locations in Northeast India. Currently, Northeast India has a product pipeline network of over
1126 km. OIL is the largest player with a pipeline network ranging over 654 km. The other major product
pipeline entity in across Northeast India is IOCL. The following table shows the existing petroleum
product pipeline infrastructure in Northeast India.
Table 62: Existing Product and LPG Pipelines in Northeast India
Route Owne
r/Op
Len
gth
Capacity
(MMTPA)
Supply
from
Supply
to
Throug
hput
MMTPA
Utiliz
ation
Guwahati-Siliguri
(GSPL) IOCL 435 1.4
IOCL
GWH,
BGN
Siliguri 1.79 128%
Digboi-Tinsukia Product
Pipeline (DTPL) IOCL 37 0.5 IOCL Dig Tinsukia 0.50 100%
Numaligarh-Siliguri
(NSPL) OIL 654 1.7 NRL Siliguri 1.81 105%
TOTAL (MMTPA) 3.6
Source: IOCL, OIL
These pipelines have limited capacity and are running at more than 100% utilization. All four refineries
in Northeast India use existing product pipelines. However, due to capacity constraints of these product
pipelines, the refineries have been able to transport only around 61% of their products through these
pipelines. Further, the unavailability of adequate product pipelines has forced the refineries to use
alternate transportation mechanisms such as road and rail network which is costlier than pipeline
transportation. Moreover, the transportation via road is often delayed due to issues like bandhs and
blockades which is quite frequent in the region. The table below provides details of various
transportation modes that are being used to transport petroleum products in Northeast India.
Table 63: Transportation of petroleum products using various modes in Northeast India
Refinery
Installed
Capacity (2015)
in MMTPA
Installed
Capacity(203
0) in MMTPA
Output
in 2014-
15
(MMTPA
)
Pipeline
(MMTPA
)
Truck
(MMTP
A)
Rail
(MM
TPA
)
Numaligarh
Refinery 3.00 9.0 2.76 1.81 0.59 0.3
IOCL Guwahati 1.00 1.70 1.00 0.89 0.18 0
IOCL Digboi 0.65 0.65 0.599 0.48 0.12 0
IOCL
Bongaigaon 2.35 4.5 2.332 0.89 0.34 1.0
Total 7.00 15.9 6.691 4.08 1.25 1.39
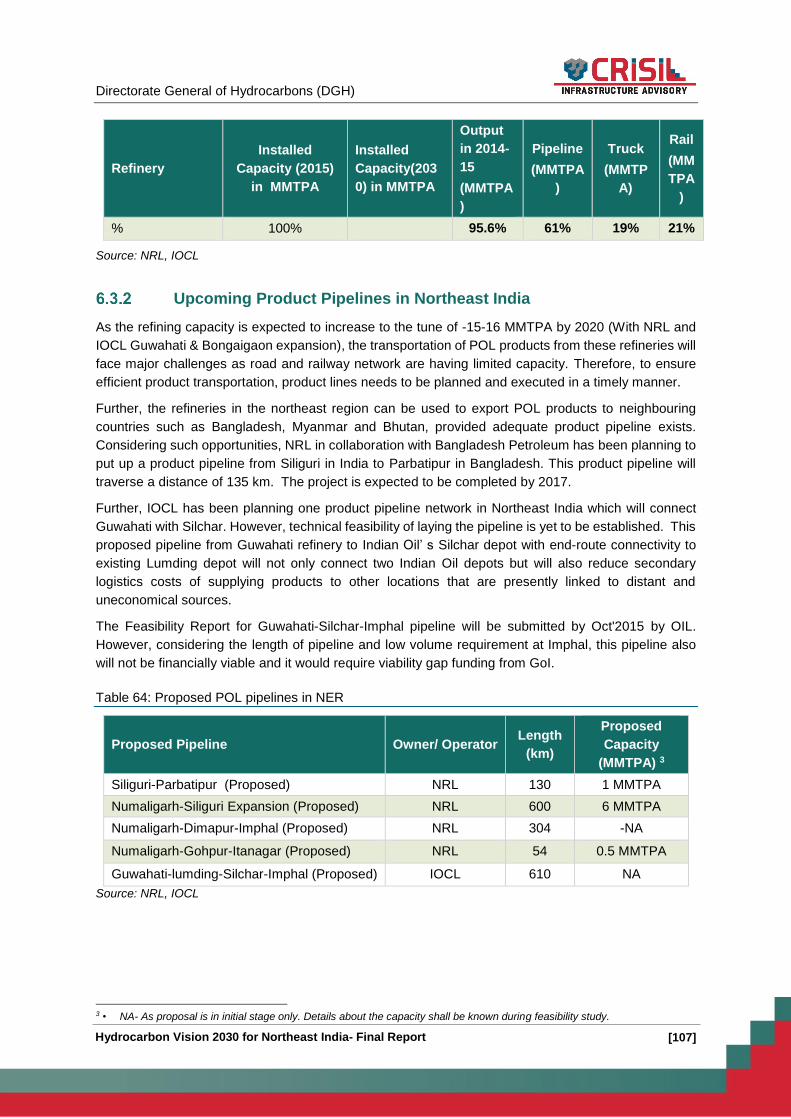
Directorate General of Hydrocarbons (DGH)
[107] Hydrocarbon Vision 2030 for Northeast India- Final Report
Refinery
Installed
Capacity (2015)
in MMTPA
Installed
Capacity(203
0) in MMTPA
Output
in 2014-
15
(MMTPA
)
Pipeline
(MMTPA
)
Truck
(MMTP
A)
Rail
(MM
TPA
)
% 100% 95.6% 61% 19% 21%
Source: NRL, IOCL
Upcoming Product Pipelines in Northeast India
As the refining capacity is expected to increase to the tune of -15-16 MMTPA by 2020 (With NRL and
IOCL Guwahati & Bongaigaon expansion), the transportation of POL products from these refineries will
face major challenges as road and railway network are having limited capacity. Therefore, to ensure
efficient product transportation, product lines needs to be planned and executed in a timely manner.
Further, the refineries in the northeast region can be used to export POL products to neighbouring
countries such as Bangladesh, Myanmar and Bhutan, provided adequate product pipeline exists.
Considering such opportunities, NRL in collaboration with Bangladesh Petroleum has been planning to
put up a product pipeline from Siliguri in India to Parbatipur in Bangladesh. This product pipeline will
traverse a distance of 135 km. The project is expected to be completed by 2017.
Further, IOCL has been planning one product pipeline network in Northeast India which will connect
Guwahati with Silchar. However, technical feasibility of laying the pipeline is yet to be established. This
proposed pipeline from Guwahati refinery to Indian Oil’ s Silchar depot with end-route connectivity to
existing Lumding depot will not only connect two Indian Oil depots but will also reduce secondary
logistics costs of supplying products to other locations that are presently linked to distant and
uneconomical sources.
The Feasibility Report for Guwahati-Silchar-Imphal pipeline will be submitted by Oct'2015 by OIL.
However, considering the length of pipeline and low volume requirement at Imphal, this pipeline also
will not be financially viable and it would require viability gap funding from GoI.
Table 64: Proposed POL pipelines in NER
Proposed Pipeline Owner/ Operator Length
(km)
Proposed
Capacity
(MMTPA) 3
Siliguri-Parbatipur (Proposed) NRL 130 1 MMTPA
Numaligarh-Siliguri Expansion (Proposed) NRL 600 6 MMTPA
Numaligarh-Dimapur-Imphal (Proposed) NRL 304 -NA
Numaligarh-Gohpur-Itanagar (Proposed) NRL 54 0.5 MMTPA
Guwahati-lumding-Silchar-Imphal (Proposed) IOCL 610 NA
Source: NRL, IOCL
3 • NA- As proposal is in initial stage only. Details about the capacity shall be known during feasibility study.
Directorate General of Hydrocarbons (DGH)
[108] Hydrocarbon Vision 2030 for Northeast India - Final Report
LPG Pipeline network in Northeast India
6.3.3.1 Existing LPG Network
Presently, Northeast India does not have LPG pipeline network, therefore entire supply of LPG is made
through road transportation using LPG bullet tankers/packed trucks. Supply by road is often subject to
various interruptions, which regularly occurs during the course of travel of LPG tankers/trucks to distant
destinations. The absence of LPG pipeline network and issues in LPG supply via road and rail network
have adversely affected the LPG coverage situation in the region. Further, movement of large number
of heavy vehicles increases traffic congestion.
6.3.3.2 Upcoming LPG Pipeline - Numaligarh-Dimapur-Imphal
To improve the supply scenario of LPG in remote areas, IOCL is proposing a LPG pipeline in this area.
The proposed pipeline will connect Numaligarh refinery of Assam with Imphal of Manipur. Numaligarh
refinery shall be having capacity of around 9 MMTPA in 2021 and LPG production of 316 TMTPA (0.31
MMTPA). By providing connectivity to Imphal through a pipeline, LPG can also be supplied to Dimapur
BP, Sekmai BP and, through further nodal movement, to Mualkhang BP (in Mizoram), for which, Sekmai
BP can be used as nodal point for loading tankers. The pipeline connectivity will ensure uninterrupted
supply, which, in turn, would also reduce dependence on road for LPG transportation.
The pre-feasibility study of “Numaligarh-Imphal LPG Pipeline” has already been completed. However,
as the pipeline would be laid through difficult terrain and remote areas, implementation would require
different set of security concern during construction as well as operation of the pipeline. Special
dispensation would be required from concerned Central/State authorities viz. MoEF & CC, Tribal Affairs
Ministry, Ministry of Urban Development, State PWD etc. for permitting laying of the pipeline in
NHAI/State Highway corridor, acquisition of land in tribal areas, timely permission for laying the pipeline
in reserve forest etc. as per requirement. The total capital cost of 265km LPG pipeline (Capacity 0.1
MMTPA) project is around 470 Crore. The annual operating cost as per initial study is Rs 20
Crore/annum. The proposal seeks viability gap funding support from GoI of about Rs. 260 crore which
is about 58% of total capital cost of project.
Issues and Challenges
Gas evacuation in Northeast India is extremely challenging owing to variety of reasons. It may be noted
that most of the gas in upper Assam is ‘Associated Gas’ and a few gas fields which have been
discovered are small and isolated. Free Gas (FG), i.e. gas from gas fields though not very large in
quantity, is mainly locked up due to isolated location of these fields and lack of local consumers. Further,
the existing gas networks are mostly localized and there is no interconnectivity between these networks
and may not be warranted under the present circumstances considering the small volumes and long
distance between location of supply and location of consumption. One of the options for monetizing the
isolated gas is by incentivizing the consumers to setup units in vicinity of these fields.
Capacity of Pipelines
6.4.1.1 Crude Pipeline
The crude oil pipeline in Northeast India has sufficient capacity to transport locally produced oil to the
refineries. However, due to declining trend of oil production in the region the refineries are required to
import oil from other parts of the country. This has been a challenge for the region as Northeast India

Directorate General of Hydrocarbons (DGH)
[109] Hydrocarbon Vision 2030 for Northeast India- Final Report
is not well connected with other parts of the country for transportation of crude oil. Further, the refineries
in the region are planning for an expansion which will be dependent on imported crude oil. Moreover,
the renewed activities from all quarters to extract more oil from the region will call for expansion of
pipeline network within the region.
OIL Pipeline (Section Barauni-Bongaigaon reverse Pumping)
The Bongaigaon- Barauni crude oil pipeline was established to transport excess crude oil from
Northeast India to Barauni refinery. However, over the years the production of crude oil has been
decreasing and this section is used for reverse pumping of imported crude from Barauni to Bongaigaon.
The crude for Bongaigaon refinery is being imported through Paradip port. Further, the crude is being
transported to Haldia through Paradip-Haldia crude oil pipeline and thereafter, from Haldia to Barauni
via Haldia-Barauni Pipeline.
Now to improve efficiency OIL is in process to abolish 2 pump stations which may reduce the pipeline
capacity to some extent. Project has already started and expected to commission soon for reduction of
pipeline capacity to 2.0 MMTPA.
As per OIL, the pipeline will be still sufficient to feed the required crude oil to Bongaigaon refinery and
will not impact the operations of IOCL Bongaigaon. Also in future if any capacity expansion is planned
by IOCL Bongaigaon, after mutual agreement between OIL & IOCL, capacity of pipeline can further be
enhanced.
Capacity of Barauni-Bongaigaon pipeline should be maintained to fulfill the requirement of Bongaigaon
refinery; it should also be able to meet the gap between NE crude oil production and maximum capacity
of all the four refineries, which stands at 7 MMTPA at present. Further, the imported crude oil needs to
be transported even to Guwahati Refinery. The Oil India pipeline between Barauni to Bongaigaon
having 3.0 MMMTPA capacities is being modernised and capacity of this line will be reduced to 2.0
MMMTPA from April’16 as two intermediate pump stations will be taken out from the system. IOCL
informed that in view of decline in NE crude availability, capacity utilisation of North East Refinery
depends on imported crude supply through this pipeline. In case of reduction in capacity of the pipeline,
NE refineries may starve of crude oil. It was suggested that Oil India should ensure that NE refineries
do not starve on account of de-rating of this Barauni Bongaigaon pipeline. If required, Oil India needs
to commission the new facilities to check the guarantee and thereafter revert to old pumping system to
ensure full supply of imported crude oil to NE refineries. In the mean-time, Oil India has to take steps
to enhance capacity of the pipeline back to 3.0 MMTPA by way of modernising the two intermediate
pump stations which are proposed to be taken out from the system, and putting them on stream. In
order to supply imported crude oil upto Guwahati Refinery, necessary modifications needs to be carried
out by Oil India for pumping imported crude oil from Bongaigaon to Guwahati by reverse pumping
through the existing line. This is necessary to improve capacity utilisation of the refinery on account of
low availability of NE crude.
6.4.1.2 Natural Gas Pipeline
Capacities of existing pipelines are not sufficient to serve the local demand. Moreover, the pipelines are
available in limited areas in upper Assam and lower part of Tripura. Major pipelines are connected from
Gas fields to Refinery, fertilizer Plant, Cracker Plant, Power Plants, CGD in upper Assam and Tripura.
No long distance pipeline exists in region other than Duliajan-numaligarh Gas pipeline. Due to non
existence of pipeline network following volume of Gas is flared from different fields of ONGC, OIL and
others.
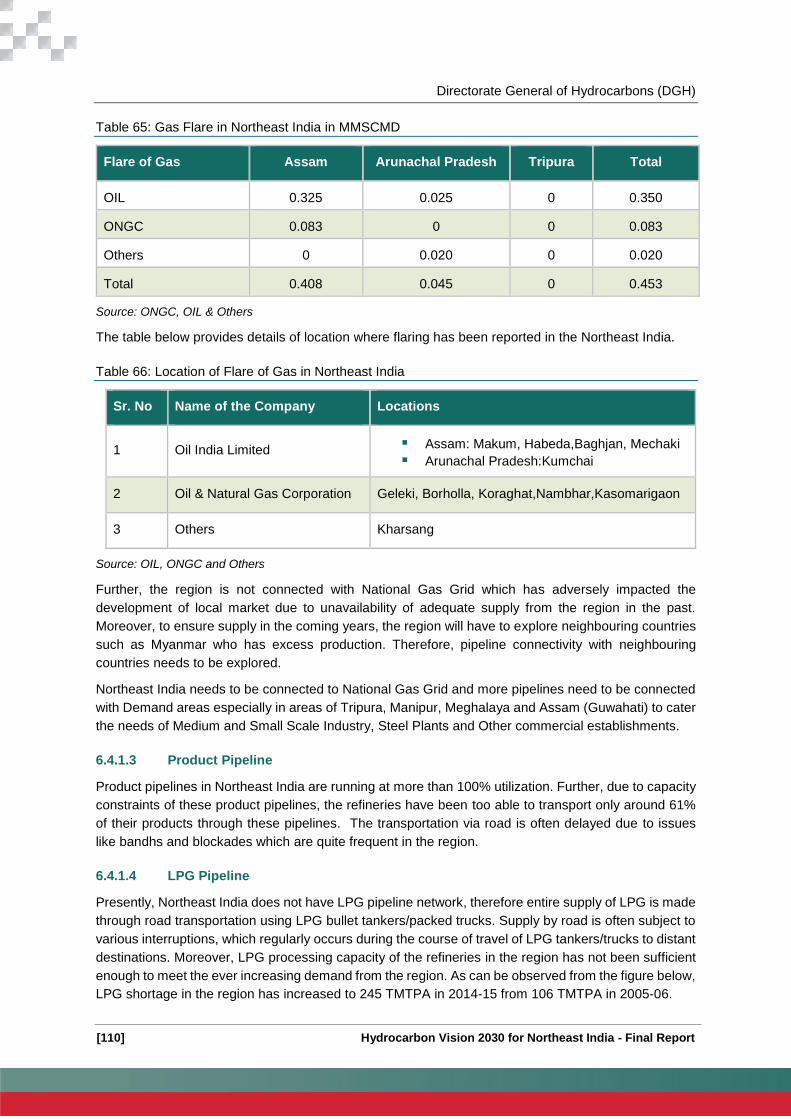
Directorate General of Hydrocarbons (DGH)
[110] Hydrocarbon Vision 2030 for Northeast India - Final Report
Table 65: Gas Flare in Northeast India in MMSCMD
Flare of Gas Assam Arunachal Pradesh Tripura Total
OIL 0.325 0.025 0 0.350
ONGC 0.083 0 0 0.083
Others 0 0.020 0 0.020
Total 0.408 0.045 0 0.453
Source: ONGC, OIL & Others
The table below provides details of location where flaring has been reported in the Northeast India.
Table 66: Location of Flare of Gas in Northeast India
Sr. No Name of the Company Locations
1 Oil India Limited Assam: Makum, Habeda,Baghjan, Mechaki
Arunachal Pradesh:Kumchai
2 Oil & Natural Gas Corporation Geleki, Borholla, Koraghat,Nambhar,Kasomarigaon
3 Others Kharsang
Source: OIL, ONGC and Others
Further, the region is not connected with National Gas Grid which has adversely impacted the
development of local market due to unavailability of adequate supply from the region in the past.
Moreover, to ensure supply in the coming years, the region will have to explore neighbouring countries
such as Myanmar who has excess production. Therefore, pipeline connectivity with neighbouring
countries needs to be explored.
Northeast India needs to be connected to National Gas Grid and more pipelines need to be connected
with Demand areas especially in areas of Tripura, Manipur, Meghalaya and Assam (Guwahati) to cater
the needs of Medium and Small Scale Industry, Steel Plants and Other commercial establishments.
6.4.1.3 Product Pipeline
Product pipelines in Northeast India are running at more than 100% utilization. Further, due to capacity
constraints of these product pipelines, the refineries have been too able to transport only around 61%
of their products through these pipelines. The transportation via road is often delayed due to issues
like bandhs and blockades which are quite frequent in the region.
6.4.1.4 LPG Pipeline
Presently, Northeast India does not have LPG pipeline network, therefore entire supply of LPG is made
through road transportation using LPG bullet tankers/packed trucks. Supply by road is often subject to
various interruptions, which regularly occurs during the course of travel of LPG tankers/trucks to distant
destinations. Moreover, LPG processing capacity of the refineries in the region has not been sufficient
enough to meet the ever increasing demand from the region. As can be observed from the figure below,
LPG shortage in the region has increased to 245 TMTPA in 2014-15 from 106 TMTPA in 2005-06.
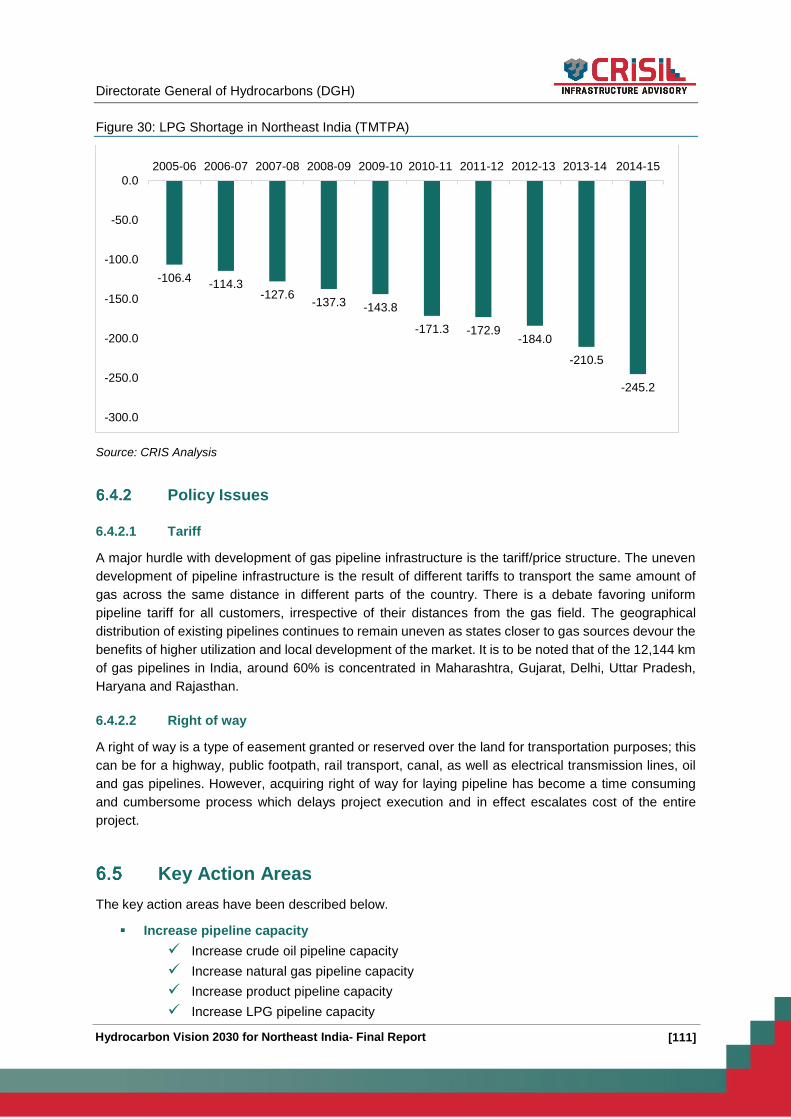
Directorate General of Hydrocarbons (DGH)
[111] Hydrocarbon Vision 2030 for Northeast India- Final Report
Figure 30: LPG Shortage in Northeast India (TMTPA)
Source: CRIS Analysis
Policy Issues
6.4.2.1 Tariff
A major hurdle with development of gas pipeline infrastructure is the tariff/price structure. The uneven
development of pipeline infrastructure is the result of different tariffs to transport the same amount of
gas across the same distance in different parts of the country. There is a debate favoring uniform
pipeline tariff for all customers, irrespective of their distances from the gas field. The geographical
distribution of existing pipelines continues to remain uneven as states closer to gas sources devour the
benefits of higher utilization and local development of the market. It is to be noted that of the 12,144 km
of gas pipelines in India, around 60% is concentrated in Maharashtra, Gujarat, Delhi, Uttar Pradesh,
Haryana and Rajasthan.
6.4.2.2 Right of way
A right of way is a type of easement granted or reserved over the land for transportation purposes; this
can be for a highway, public footpath, rail transport, canal, as well as electrical transmission lines, oil
and gas pipelines. However, acquiring right of way for laying pipeline has become a time consuming
and cumbersome process which delays project execution and in effect escalates cost of the entire
project.
Key Action Areas
The key action areas have been described below.
Increase pipeline capacity
Increase crude oil pipeline capacity
Increase natural gas pipeline capacity
Increase product pipeline capacity
Increase LPG pipeline capacity
-106.4-114.3
-127.6-137.3 -143.8
-171.3 -172.9-184.0
-210.5
-245.2
-300.0
-250.0
-200.0
-150.0
-100.0
-50.0
0.0
2005-06 2006-07 2007-08 2008-09 2009-10 2010-11 2011-12 2012-13 2013-14 2014-15

Directorate General of Hydrocarbons (DGH)
[112] Hydrocarbon Vision 2030 for Northeast India - Final Report
Policy level issues
Tariff
Right of way
Increase pipeline capacity
The existing pipeline capacity is not adequate to serve the demand of the region. Therefore, new
pipelines must be planned to ensure development of the sector in the region.
6.5.1.1 Increase Crude Oil Pipeline Capacity
Paradip-Siliguri-Bongaigaon --Numaligarh Imported Crude Oil Pipeline
As oil production in the region has been declining, the refineries are required to import oil to utilize their
existing capacity. Further, the refinery capacity of NRL is expected to be expanded in future which will
require imported crude from elsewhere. NRL is envisaging a crude pipeline network from Paradip to
Numaligarh (via Bongaigaon, Rangiya, Mohpur) to ensure crude oil supply to its refinery. Further, IOCL
is considering capacity expansion of its Guwahati refinery (from 1.0 MMTPA to 1.7 MMTPA) and
Bongaigaon (from 2.35 MMTPA to 4.5 MMTPA). Crude Oil supply to the above mentioned capacity
expansion plans of Bongaigaon, Guwahati and Numaligarh refineries are to be linked with proposed
Paradip-Numaligarh pipeline of NRL for supply of imported crude oil.
The total POL production will increase to around 12.4 MMTPA by 2021-22 from the current level of 6.5
MMTPA in 2014-15. However, consumption within northeast region is likely to increase from 3.2
MMTPA to 4.5 MMTPA over the same period. Therefore, the refineries in northeast India will have a
surplus POL production capacity to the tune of around 8 MMTPA by 2021-22. Hence, options needs
to be explored to transport the excess production to elsewhere in the country.
6.5.1.2 Increase Natural Gas Pipeline capacity
Connect NER with National Gas Grid and Develop Regional Gas Grid
To ensure supply and connect demand centres in Northeast India, the route of National Gas Grid, which
has been planned as Barauni-Siliguri-Bongaigon-Guwahati, needs to be extended. The already
proposed route has distance of around 800-900 Km and expected capital cost for the project is around
Rs 3600-4050 crore. As major production of Gas is expected from Mizoram, Manipur and Tripura Area,
it is important to connect these states with the national gas grid on a priority basis. Further, as Barauni
is already being connected to National Gas Grid through Jagdishpur-Barauni pipeline, it makes sense
to propose a pipeline from Barauni to the rest of Northeast India.
To ensure timely implementation of extended national gas grid in Northeast India, the entire network
can be divided under in 3 Phases. Further, the 3 phases need to be given to single entity which can be
formed as a JV among various stakeholders such as GAIL, AGCL, TNGCL and other state entities.
State entities can play important roles in implementation and operation of Project. Considering the
present demand and supply scenario, phase I and phase II need to be developed simultaneously,
whereas phase III can be completed a later period of time.
Phase I: Agartala-Silchar-Shillong-Guwahati-Bongaigaon (With 2 Spur line- Silchar-Aizawl and
Silchar-Imphal).
Connect Agartala to Bongaigaon through Guwahati (800 KM) via Silchar, Shillong, along with NH 44
route. The demand of this area is expected to be around 5-6 mmscmd in future and production from
Tripura is also expected to increase to ~12 MMSCMD by 2020 from current level of ~4 mmscmd in
2014-15. After fulfilling local demand of Tripura for OTPC expansion and proposed Fertilizer Plant by

Directorate General of Hydrocarbons (DGH)
[113] Hydrocarbon Vision 2030 for Northeast India- Final Report
ONGC and Chambal fertilizer Limited, the surplus gas can be transported to other cities/states. To fulfil
this demand, pipeline route from Agartala–Bongaigaon needs to be reviewed for implementation.
Further, detailed feasibility study need to be conducted for this route.
Phase II: Extension of Duliajan-Numaligarh pipeline to Bongaigaon
Extension of Duliajan-Numaligarh pipeline to Bongaigaon to connect upper Assam to Guwahati for
potential production of Gas from Kharsang Block needs to be considered. The production potential is
estimated to be around 1.5 to 2 MMSCMD. Detailed feasibility study needs to be conducted to assess
the cost of project and VGF requirement. Further, to support such production, the existing Dulaijan-
Numaligah pipeline capacity should be augmented from the present level of 1 MMTPA to 3 MMTPA.
Phase III: Connect Bongaigaon with Barauni
The expected gas demand from the region is going to be far more than the expected supply in future.
In fact, supply shortage to the tune of 7-8 MMSCMD is expected in immediate future. In case the
demand out scores supply in the future, connecting NER to Barauni, which is already connected with
national gas grid, will play a key role in ensuring supply to the region.
Myanmar to Agartala Gas Pipeline
Oil India Limited has been offered two offshore blocks in Myanmar. The total initial prognosticated
resource of the two blocks is 3280 BCF, or about 93 BCM, of natural gas and 221 MMBbl, or about 35
MMKL of crude oil. The blocks are in very initial phase of exploration, and therefore the aforementioned
figures can vary substantially. However, the total estimated plateau production from the two blocks can
be considered to be around 8 - 9 MMSCMD. As the domestic obligation is 25% of the production, the
remaining 75% (that is, an estimated plateau production level of 6 - 6.5 MMSCMD) would be available
for export to India from Myanmar.
Hence, surplus gas after fulfilling domestic obligation by OIL can be transported to India through pipeline
from Myanmar to Agartala in future.
6.5.1.3 Increase Product pipeline capacity
As product pipelines in Northeast India are not only over-utilized but also have limited capacity due to
which only 61% of the total production by refineries can be transported through pipelines. Therefore,
the proposed product pipelines need to be fast tracked to ensure immediate implementation. The
proposed pipelines are Numaligarh-Siliguri-Parbatipur, Numaligarh-Imphal and Guwahati-Silchar-
Imphal.
Figure 31: Proposed Numaligarh-Siliguri-Parbatipur product pipeline
Source: Industry Reports, CRIS Analysis
Numaligarh-Siliguri –Parbatipur pipeline
PaParbatipurPipeline

Directorate General of Hydrocarbons (DGH)
[114] Hydrocarbon Vision 2030 for Northeast India - Final Report
The figure below provides geographical map of proposed Guwahati-Silchar-Imphal product pipeline.
Figure 32: Proposed Guwahati-Silchar-Imphal product pipeline
Source: Industry Reports, CRIS Analysis
Particulars Company Distance
(km) Capacity
Siliguri-Parbatipur (Proposed) NRL 150 NA
Numaligarh-Siliguri Expansion (Proposed) NRL 600 6 MMTPA
Siliguri-Prabatipur (Bangladesh) (Proposed) NRL 130 1 MMTPA
Numaligarh-Dimapur-Imphal -Moreh (Proposed) NRL 304 NA
Guwahati-lumding-Silchar-Imphal (Further
extension to Agartal) (Proposed) IOCL 610 NA
Numaligath-Itanagar (Future Plan) NRL 54 0.5 MMTPA
Numaligarh-Siliguri-Prabatipur Pipeline (Numaligarh-Siliguri)
The expansion of NRL will leave the refinery with surplus POL production capacity, as local demand is
expected to be lower that the supply. Hence, POL need to be transported to either Bihar/UP/Orissa or
exported to other countries like Bangladesh. NRL is planning a pipeline expansion for existing pipeline
from Numaligarh-Siliguri and new pipeline from Siliguri to Parbatipur for export of POL to Bangladesh.
Numaligarh-Siliguri pipeline capacity needs to be enhanced to 7.7 MMTPA from the existing capacity
of 1.7 MMTPA.
Numaligarh-Dimapur-Imphal-Moreh
NRL is planning another pipeline from Numaligarh-Dimapur-Imphal-Moreh to improve the supply of POL
products and reduce dependent upon road transport. The pipeline distance is assumed to be around
304 KM.
Guwahati-Silchar-Imphal (Further extension to Agartala) Product Pipeline
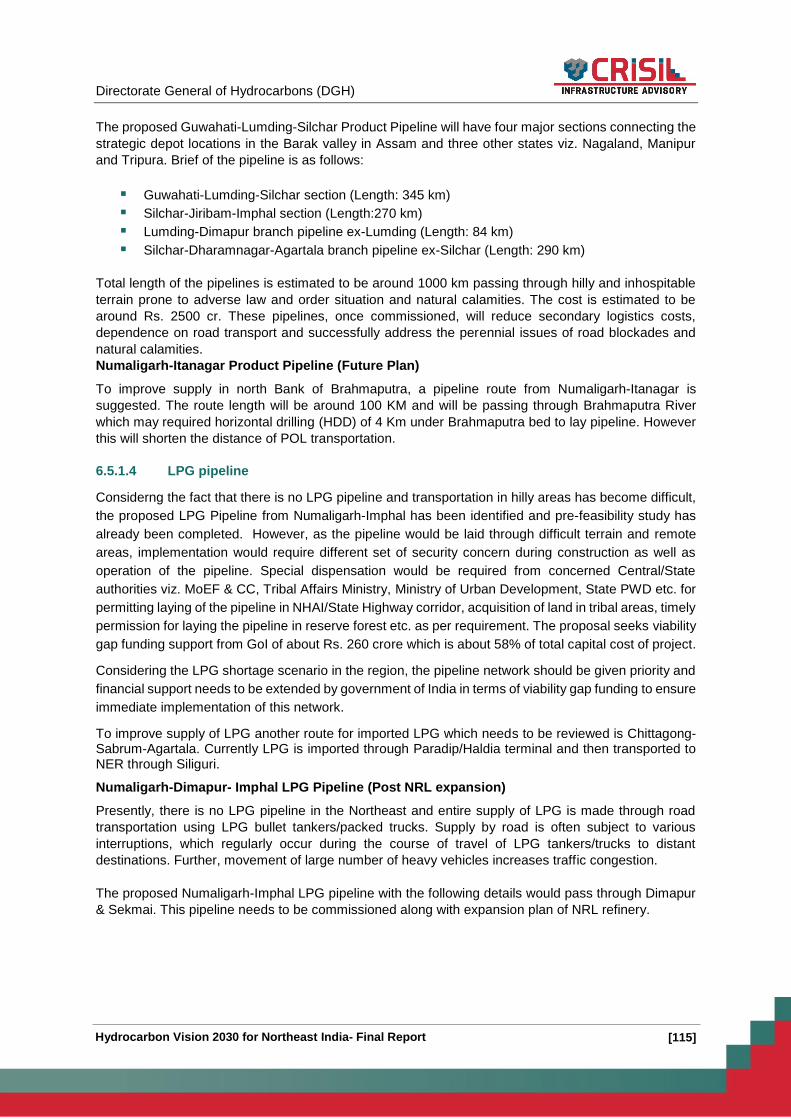
Directorate General of Hydrocarbons (DGH)
[115] Hydrocarbon Vision 2030 for Northeast India- Final Report
The proposed Guwahati-Lumding-Silchar Product Pipeline will have four major sections connecting the
strategic depot locations in the Barak valley in Assam and three other states viz. Nagaland, Manipur
and Tripura. Brief of the pipeline is as follows:
Guwahati-Lumding-Silchar section (Length: 345 km)
Silchar-Jiribam-Imphal section (Length:270 km)
Lumding-Dimapur branch pipeline ex-Lumding (Length: 84 km)
Silchar-Dharamnagar-Agartala branch pipeline ex-Silchar (Length: 290 km)
Total length of the pipelines is estimated to be around 1000 km passing through hilly and inhospitable
terrain prone to adverse law and order situation and natural calamities. The cost is estimated to be
around Rs. 2500 cr. These pipelines, once commissioned, will reduce secondary logistics costs,
dependence on road transport and successfully address the perennial issues of road blockades and
natural calamities.
Numaligarh-Itanagar Product Pipeline (Future Plan)
To improve supply in north Bank of Brahmaputra, a pipeline route from Numaligarh-Itanagar is
suggested. The route length will be around 100 KM and will be passing through Brahmaputra River
which may required horizontal drilling (HDD) of 4 Km under Brahmaputra bed to lay pipeline. However
this will shorten the distance of POL transportation.
6.5.1.4 LPG pipeline
Considerng the fact that there is no LPG pipeline and transportation in hilly areas has become difficult,
the proposed LPG Pipeline from Numaligarh-Imphal has been identified and pre-feasibility study has
already been completed. However, as the pipeline would be laid through difficult terrain and remote
areas, implementation would require different set of security concern during construction as well as
operation of the pipeline. Special dispensation would be required from concerned Central/State
authorities viz. MoEF & CC, Tribal Affairs Ministry, Ministry of Urban Development, State PWD etc. for
permitting laying of the pipeline in NHAI/State Highway corridor, acquisition of land in tribal areas, timely
permission for laying the pipeline in reserve forest etc. as per requirement. The proposal seeks viability
gap funding support from GoI of about Rs. 260 crore which is about 58% of total capital cost of project.
Considering the LPG shortage scenario in the region, the pipeline network should be given priority and
financial support needs to be extended by government of India in terms of viability gap funding to ensure
immediate implementation of this network.
To improve supply of LPG another route for imported LPG which needs to be reviewed is Chittagong-Sabrum-Agartala. Currently LPG is imported through Paradip/Haldia terminal and then transported to NER through Siliguri.
Numaligarh-Dimapur- Imphal LPG Pipeline (Post NRL expansion)
Presently, there is no LPG pipeline in the Northeast and entire supply of LPG is made through road
transportation using LPG bullet tankers/packed trucks. Supply by road is often subject to various
interruptions, which regularly occur during the course of travel of LPG tankers/trucks to distant
destinations. Further, movement of large number of heavy vehicles increases traffic congestion.
The proposed Numaligarh-Imphal LPG pipeline with the following details would pass through Dimapur
& Sekmai. This pipeline needs to be commissioned along with expansion plan of NRL refinery.

Directorate General of Hydrocarbons (DGH)
[116] Hydrocarbon Vision 2030 for Northeast India - Final Report
Table 67: Proposed LPG pipelines
Name Owner Length
(Km)
Capacity
(MMTPA)
Estimated
Capital
Cost (Rs.
cr)
Annual
Operating Cost
(Rs. cr)
VGF
requirement
(Rs Cr)
Numaligarh-
Imphal LPG
Pipeline (Post
NRL
Expansion)
IOCL 265 0.1 470 20 260
Chittagong-
Sabrum-
Agartala (with
further
extension to
Silchar &
Aizawl)
IOCL 230 NA 450 NA NA
Durgapur-
Siliguri-
Guwahati
(Alternate to
Chittagong)
IOCL 900 NA 1800 NA NA
Source: IOCL/CRIS Analysis
By providing connectivity to Imphal through a pipeline, LPG can be supplied to Dimapur BP, Sekmai
BP and, through further nodal movement, to Mualkhang BP (in Mizoram), for which, Sekmai BP can be
used as nodal point for loading tankers. The pipeline connectivity will ensure uninterrupted supply,
which, in turn, would also reduce dependence on road.
Further, related to this augmentation of BPs at Dimapur, Imphal & Sekmai may also require
consideration.

Directorate General of Hydrocarbons (DGH)
[117] Hydrocarbon Vision 2030 for Northeast India- Final Report
Figure 33: Map of proposed pipelines in NER
Policy Level Action Areas
6.5.2.1 Tariff
A major hurdle with development of gas pipeline infrastructure is the tariff/price structure. Therefore, for
the development of pipeline network, in areas such as North-eastern region, uniform pipeline tariff for
all customers can be considered, irrespective of their distance from the gas field.
6.5.2.2 Right of Way
As acquiring right of way for laying pipeline has become a time consuming and cumbersome process
which delays project execution and in effect escalates cost of the entire project, the government can
allow pipeline players special permission in the Northeast region to lay pipeline.
6.5.2.3 VGF Funding
The limit of VGF funded projects is only 20% and is applicable only to PPP projects where PSUs are
not eligible to participate.

Directorate General of Hydrocarbons (DGH)
[118] Hydrocarbon Vision 2030 for Northeast India - Final Report
6.5.2.4 Flare of Gas
A large amount of gas is flared in NER due to unavialaliby of modes for evacuation of gas. The policy
related to sale of Gas from small & isolated fields are more inclined to seller side and hence ONGC/OIL
is not able to sell the gas which is flared now.
Map of all suggested/proposed pipeline route are as below:
Table 68: Details of the proposed pipelines in Northeast India
Pipeline Route Distance (km)
Crude Pipeline
Paradip-Siliguri-Bongaigaon-Numaligarh 1400
Gas Pipeline
Ph-I Agartala-Silchar-Shillong-Guwahati-Bongaigaon 600
Ph-II Duliajan-Numaligarh-Guwahati 450
Ph-III Barauni-Siliguri-Bongaigaon 800
Silchar-Aizawl-Sitwe (Myanmar) 350
Product Pipeline
Siliguri-Prabatipur (Bangladesh) (Post NRL Exp) 130
Numaligarh-Siliguri (Expansion) (Post NRL Exp) 700
Guwahati-Lumding -Silchar-Imphal (Further extension to Aizawl/Agartala)
615
Numaligarh-Dimapur-Imphal-Moreh (Post NRL expansion) 400
Numaligarh-Itanagar (Future Plan) 54
LPG Pipeline
Numaligarh-Dimapur-Imphal (with NRL Exp) 265
Chittagong-Sabrum-Agartala (Further extension to Silchar/Aizawl)
230
Durgapur-Siliguri-Guwahati (Alternate to Chittagong Pipeline) 900

Directorate General of Hydrocarbons (DGH)
[119] Hydrocarbon Vision 2030 for Northeast India- Final Report
Action Plan
The action plan for augmenting the prospects of the Oil & Gas midstream sector in the North East region has been presented below.
Table 69: Action Plan for Midstream sector in Northeast India
Action Items Concerned
Authorities
Timeline
Short Term
(less than 2 Year)
Medium Term
(2-5 Years)
Long Term
(More than
5 Years)
Infrastructure- Crude Oil pipeline capacity
Paradip-Siliguri-
Numaligarh
Imported Crude
Oil Pipeline
NRL
Achieve
financial
closure and
start laying
pipelines
Barauni-
Bongaigaon
Pipeline
OIL
OIL to maintain the same
capacity of pipeline as per
requirement of NE
refineries. OIL to consider
capacity enhancement of
pipeline for expansion of
NE refineries
Infrastructure- Natural Gas Pipeline capacity
Gas Grid Phase
I:
Agartala-
Silchar-Shillong-
Guwahati-
Bongaigaon
(Spur Lines-
Silchar-Aizawl
and Silchar-
Imphal)
GAIL/
PNGRB/MoPNG/
AGCL/TNGCL/St
ate Govt
Feasibility study needs
to be developed for
this route by GAIL
This project needs to
be taken on VGF
model. Amount of
VGF need to be
determined.
Implementation
Gas Grid Phase
II:
Duliajan/Numali
garh pipeline to
Guwahati
(capacity
enhancement of
Duliajan-
Numaligarh
Pipeline)
GAIL/NRL/OIL/P
NGRB/MoPNG/A
GCL/TNGCL/Stat
e Govt
Route and Demand Survey
Feasibility Study
This project needs to be taken on VGF model. Amount of VGF need to be determined
Implementation
Gas Grid Phase
III:
GAIL/
PNGRB/MoPNG/
Conduct Feasibility
Study Implementation

Directorate General of Hydrocarbons (DGH)
[120] Hydrocarbon Vision 2030 for Northeast India - Final Report
Action Items Concerned
Authorities
Timeline
Short Term
(less than 2 Year)
Medium Term
(2-5 Years)
Long Term
(More than
5 Years)
Connect
Barauni with
Guwahati
AGCL/TNGCL/St
ate Govt Assess funding
requirement and other
support from other
ministries
Gas pipeline
from Myanmar
to Agartala
(Sitwe-Aizawl-
Silchar)
MoPNG/MEA/GA
IL
Feasibility
Study
Implementa
tion
Phase I, II & III need to be given to PSUs (GAIL, AGCL, TNGCL etc) on nomination basis
Infrastructure - Product Pipeline Capacity
Guwahati-
Lumding -
Silchar- Imphal
(Further
extension to
Aizawl/Agartala)
IOCL
Conduct Feasibility
Study
Assess requirement of
VGF
Assess requirement of
support from other
ministries
Review for
implementation
Numaligarh-
Siliguri
(Capacity
Enhancement)
NRL/
MoPNG/PNGRB
Conduct Feasibility
Study
Assess requirement of
VGF
Assess requirement of
support from other
ministries
Feasibility of
Siliguri-
Barauni-
Mughalsarai
Pipeline
Siliguri-
Parbatipur
(Bangladesh)
NRL/
MoPNG/MEA/
Govt. of
Bangladesh/PNG
RB
Conduct Feasibility
Study
Assess requirement of
VGF
Assess requirement of
support from other
ministries
Review for
implementation
Numaligarh-
Dimapur-
Imphal-Moreh
NRL/
MoPNG/PNGRB
Conduct Feasibility
Study
Assess requirement of
VGF
Assess requirement of
support from other
ministries
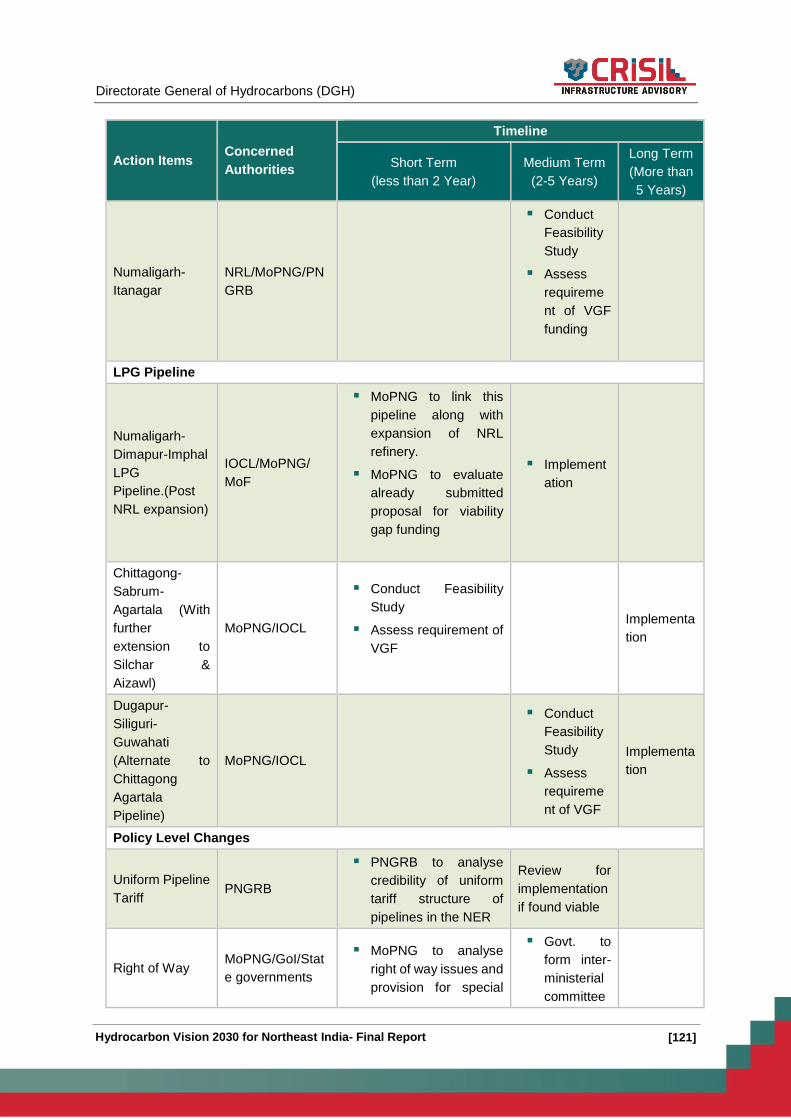
Directorate General of Hydrocarbons (DGH)
[121] Hydrocarbon Vision 2030 for Northeast India- Final Report
Action Items Concerned
Authorities
Timeline
Short Term
(less than 2 Year)
Medium Term
(2-5 Years)
Long Term
(More than
5 Years)
Numaligarh-
Itanagar
NRL/MoPNG/PN
GRB
Conduct
Feasibility
Study
Assess
requireme
nt of VGF
funding
LPG Pipeline
Numaligarh-
Dimapur-Imphal
LPG
Pipeline.(Post
NRL expansion)
IOCL/MoPNG/
MoF
MoPNG to link this
pipeline along with
expansion of NRL
refinery.
MoPNG to evaluate
already submitted
proposal for viability
gap funding
Implement
ation
Chittagong-
Sabrum-
Agartala (With
further
extension to
Silchar &
Aizawl)
MoPNG/IOCL
Conduct Feasibility
Study
Assess requirement of
VGF
Implementa
tion
Dugapur-
Siliguri-
Guwahati
(Alternate to
Chittagong
Agartala
Pipeline)
MoPNG/IOCL
Conduct
Feasibility
Study
Assess
requireme
nt of VGF
Implementa
tion
Policy Level Changes
Uniform Pipeline
Tariff PNGRB
PNGRB to analyse
credibility of uniform
tariff structure of
pipelines in the NER
Review for
implementation
if found viable
Right of Way MoPNG/GoI/Stat
e governments
MoPNG to analyse
right of way issues and
provision for special
Govt. to
form inter-
ministerial
committee

Directorate General of Hydrocarbons (DGH)
[122] Hydrocarbon Vision 2030 for Northeast India - Final Report
Action Items Concerned
Authorities
Timeline
Short Term
(less than 2 Year)
Medium Term
(2-5 Years)
Long Term
(More than
5 Years)
permission in laying of
pipelines in NER
to evaluate
proposal
submitted
by MoPNG
Govt. to
come out
with
recommen
dation
Limit of VGF to
increase to 50% MoPNG/MoF
Current limit of 20%
is not sufficient to
fund the
requirement of
projects as funding
gap of more than
50% is expected.
VGF should be
made available for
PSUs also.
Flare of Gas:
Contract terms
should be
equitable for
both supplier
and off taker of
gas, with liability
being equally
shared for the
contract period.
MoPNG/PNGRB/
NOCs
Current market price
of gas as minimum
reserve price should
be scrapped
NOCs to help long
term customers like
AGCL/TNGCL for off-
taking of gas (by
constructing small
pipelines if required)

Directorate General of Hydrocarbons (DGH)
[123] Hydrocarbon Vision 2030 for Northeast India- Final Report
Proposed Energy Corridor
Proposed Energy Corridor for Northeast India
Energy corridor needs to be developed in NER for utilization of resources available in NER and for overall
growth of area. Following is the details related to concept of Energy Corridor
Phase I - Connect Paradip to NE
Phase II- Connect Chittagong to NE
Facilitate uninterrupted and economic transportation of hydrocarbon energy. The proposed energy highway
will bring in crude oil and natural gas to the region and will take out petroleum products.
Table 70: Map of Proposed Energy Corridor in Northeast India
Phase I: Paradip port to North East: (Barauni-Guwahati-Numaligarh- route common to Extended National Gas Grid)
Two way movement of energy along the corridor.
NRL has planned to construct a 1400 km crude pipeline from Paradip to Numaligarh
The proposed ROU will intersect the National Gas Grid at Burdwan in West Bengal
From Burdwan, NG Grid may be extended to NE along the same ROU.
Ensure adequate availability of crude and gas in the region.
Phase II: Chittagong port to North East
Chittagong to Agartala-Numaligarh - 800 KM 234 km
Energy Highway will pass through Tripura and Meghalaya and connect Numaligarh.
From Numaligarh the highway will be extended towards east up to Dibrugarh crossing Numaligarh in
between.
The Energy highway may be extended further east from Dibrugarh via Tinsukia and Ledo and then
onwards using the ‘Stilwell Route’ to Myanmar.
The same energy highway will again be extended from Guwahati towards west up to Burdwan (West
Bengal) - proposed National Gas Grid gets connected.
Connecting Myanmar will boost Government of India’s endeavor on ‘Act East Policy.’
Major State capitals will be connected to the energy corridor via branch lines.
Guwahati – Dibrugarh (Via Numaligarh): 450 kms
Guwahati-Burdwan: 872 kms (Bongaigaon)

Directorate General of Hydrocarbons (DGH)
[124] Hydrocarbon Vision 2030 for Northeast India - Final Report
Suggestions for VGF Model
Natural gas pipeline projects for Northeast India can potentially fall short of viability owing to lack of gas
availability and slower growth in demand. VGF, in case of gas pipelines, would be utilized to hedge the
license holder primarily from the risk of volatility in lack of supply volumes as well as slippages in
demand build-up. Following pipeline are proposed to take up immediate basis on VGF routeas demand
from these cities shall not be enough to make projects viable. The expected timeline to commission
these pipelines shall be around 2-3 years, provided all clearances are in place.
The following table provides the listing of pipelines which might require VGF to make it feasible.
Table 71: Pipelines proposed under VGF Model
Pipeline Route Distance
(km)
Estimated
Capital Cost (Rs
crores)
VGF
Amount
(%)
Gas
Pipeline*
Ph-I Agartala-Silchar-Shillong-
Guwahati-Bongaigaon 800 3600 55%
Ph-II Duliajan-Numaligarh-
Guwahati 450 2025 65%
Ph-III Barauni-Siliguri-Bongaigaon 800 3600 55%
Silchar-Aizawl-Sitwe (Myanmar) 350 1575 42%
Product
Pipeline
Guwahati-Lumding -Silchar-Imphal
(Further to Aizawl/Agartala) 615 1800 60%
Numaligarh-Dimapur-Imphal-
Moreh (Post NRL expansion) 400 1600 60%
Numaligarh-Itanagar (Future Plan) 60 200 Need to
assess
Numaligarh-Dimapur-Imphal (Post
NRL Exp) 265 530 63%
LPG
Pipeline
Chittagong-Sabrum-
AgartalaBongaigaon-Guwahati-
Shillong-Silchar
230 460 63%
Durgapur-Siliguri-Guwahati 900 1800 63%
Numaligarh Imphal 265 530 63%
TOTAL 17,720 ~50%
Source: CRIS Analysis
*Natural Gas pipeline capital cost considered at Rs 4.5 cr/km for a 30 inch diameter pipeline.
Right of Way
Considering the above pipelines, there are common routes of pipelines for which common Right of Way
(RoW) can be used for development of projects. This will further reduce the project cost, time for
implementation and hence funding requirement.
Below is the list of pipelines routes having common RoW.

Directorate General of Hydrocarbons (DGH)
[125] Hydrocarbon Vision 2030 for Northeast India- Final Report
Table 72: Pipeline routes having common Right of Way (RoW)
Route Usage
Numaligarh-Dimapur-Imphal Product Pipeline LPG Pipeline
Silchar-Aizawl Gas Pipeline Product Pipeline
Silchar-Agartala Gas Pipeline Product Pipeline
Silchar-Imphal Gas Pipeline Product Pipeline
Bongaigaon-Siliguri Crude Oil Pipeline Gas Pipeline LPG Pipeline
Financing
VGF is a grant, one-time or deferred, provided to support infrastructure projects that are economically
justified but fall short of financial viability. VGF is designed to make projects that are economically viable
over the long term and commercially viable for investors. It helps mobilise private sector investment for
development projects, while ensuring that the private sector still shares in the risks of infrastructure
delivery and operation. The VGF mechanism for pipeline connectivity should be considered as
development mechanism to establish evacuation systems. Also, other options such as following need
to be considered:
Provision of soft loans
Issue of tax-free infrastructure bonds from public sector undertakings – GAIL, IOCL, ONGC
Development cess on petrol/diesel or Aviation turbine fuel (ATF) at national level for projects
related to the north-eastern region for a limited period
Increasing budget allocation from the central pool for North Eastern Council (NEC)
Also, considering the quantum of funds required to build projects in northeast India, the existing VGF
limits which is subject to a maximum of 20% of total project cost, may not be sufficient to make
projects financially viable. Therefore, such limits needs to be suitably increased to make the projects
viable. VGF should be made available for PSUs also.
Case Study –Public Private Partnership (PPP) Model for
Pipelines
Laying of new pipelines infrastructure in Northeast India faces multiple challenges, be it geographical,
socio-political or financial feasibility. Financial feasibility appears to be a key concern for any such
projects in Northeast India as building a new pipeline network requires massive capital investment.
Market for natural gas in the region is yet to be developed to a level due to which a pipeline project in
the region is financially lucrative for private investment. The government also have fiscal limitations,
therefore getting resources for such projects become challenging. Therefore, to make implementation
possible for pipeline projects in the region, different project structures need to be thought. PPP models
in infrastructure financing have come out as an interesting proposition. The case study provides
example of such pipeline project that has been envisaged by MoPNG under PPP mode.

Directorate General of Hydrocarbons (DGH)
[126] Hydrocarbon Vision 2030 for Northeast India - Final Report
Ranchi-Talcher-Paradip pipeline network
MoPNG has identified GAIL as the “sponsoring authority” for implementing Ranchi-Talcher-Paradip
pipeline section on a pilot basis through PPP mode with viability gap funding (VGF). Route
Reconnaissance survey work has been completed and DFR is under preparation. The expected
date of PPP agreement is March, 2016. The route length is around 700 Kms including spur lines.
The cost of this project is expected to be around Rs 2500 Crore. The Pipeline will be connected from
LNG terminal AT Paradip port to Ranchi to supply PNG, CNG gas to cities of Jharkhand. This will
be first project on PPP model in pipeline area. Once successfully implemented, this project can be
replicated in economical non-viable areas like North Eastern States.
Along with this route, 2 other routes have been identified under PPP mode. The total length of these
3 routes is 2500 kms. The Viability Gap Funding shall be provided by Ministry of Finance through
Indian Infrastructure Project Development Fund (IIPDF). The remaining 2 pipeline sections viz.,
Barauni-Guwahati-Agartala and Haldia-Paradip/Srikakulam would be considered through PPP
mode with VGF after successful completion of the pilot project. The details of these pipeline network
has been mentioned below:
Ranchi-Talcher-Paradip- 530 KM
Barauni-Guwahati-Agartala- 1300 KM
Haldia-Paradip/Srikakulam- 500/700 KM
The following map shows the proposed pipeline infrastructure under PPP mode in India.
Figure 34: Proposed Natural Gas pipelines in India under PPP mode
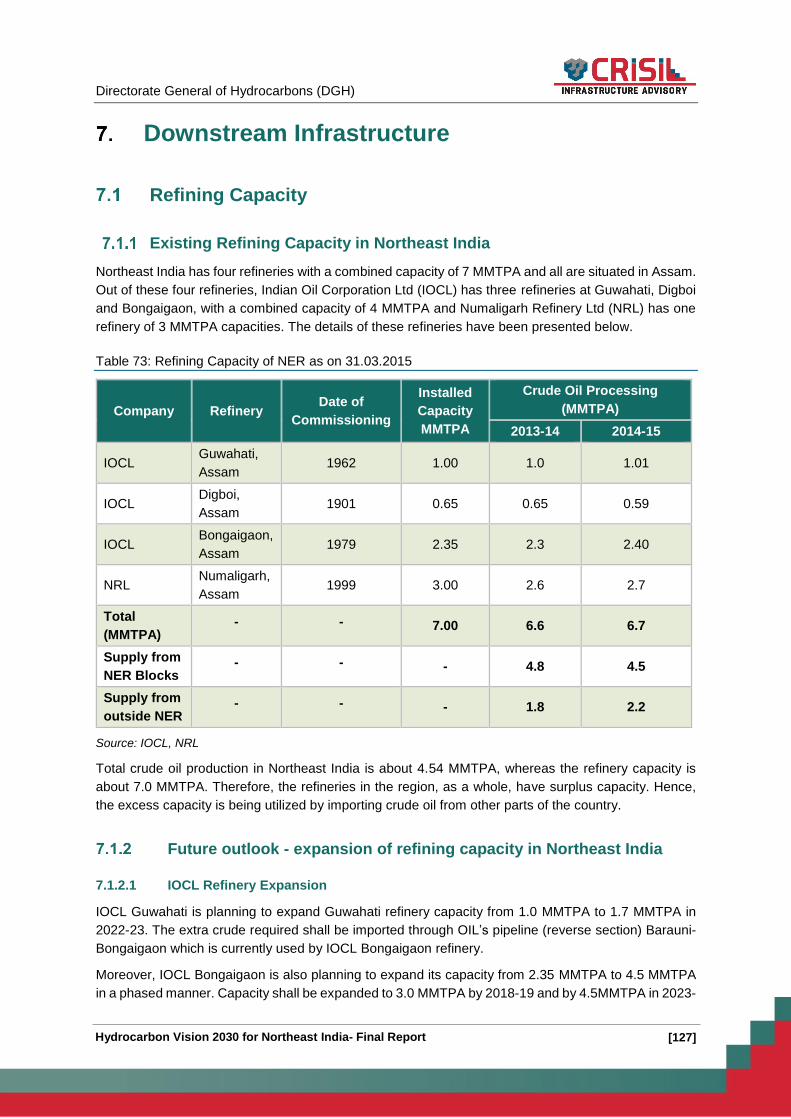
Directorate General of Hydrocarbons (DGH)
[127] Hydrocarbon Vision 2030 for Northeast India- Final Report
Downstream Infrastructure
Refining Capacity
Existing Refining Capacity in Northeast India
Northeast India has four refineries with a combined capacity of 7 MMTPA and all are situated in Assam.
Out of these four refineries, Indian Oil Corporation Ltd (IOCL) has three refineries at Guwahati, Digboi
and Bongaigaon, with a combined capacity of 4 MMTPA and Numaligarh Refinery Ltd (NRL) has one
refinery of 3 MMTPA capacities. The details of these refineries have been presented below.
Table 73: Refining Capacity of NER as on 31.03.2015
Company Refinery Date of
Commissioning
Installed
Capacity
MMTPA
Crude Oil Processing
(MMTPA)
2013-14 2014-15
IOCL Guwahati,
Assam 1962 1.00 1.0 1.01
IOCL Digboi,
Assam 1901 0.65 0.65 0.59
IOCL Bongaigaon,
Assam 1979 2.35 2.3 2.40
NRL Numaligarh,
Assam 1999 3.00 2.6 2.7
Total
(MMTPA) - - 7.00 6.6 6.7
Supply from
NER Blocks - - - 4.8 4.5
Supply from
outside NER - - - 1.8 2.2
Source: IOCL, NRL
Total crude oil production in Northeast India is about 4.54 MMTPA, whereas the refinery capacity is
about 7.0 MMTPA. Therefore, the refineries in the region, as a whole, have surplus capacity. Hence,
the excess capacity is being utilized by importing crude oil from other parts of the country.
Future outlook - expansion of refining capacity in Northeast India
7.1.2.1 IOCL Refinery Expansion
IOCL Guwahati is planning to expand Guwahati refinery capacity from 1.0 MMTPA to 1.7 MMTPA in
2022-23. The extra crude required shall be imported through OIL’s pipeline (reverse section) Barauni-
Bongaigaon which is currently used by IOCL Bongaigaon refinery.
Moreover, IOCL Bongaigaon is also planning to expand its capacity from 2.35 MMTPA to 4.5 MMTPA
in a phased manner. Capacity shall be expanded to 3.0 MMTPA by 2018-19 and by 4.5MMTPA in 2023-

Directorate General of Hydrocarbons (DGH)
[128] Hydrocarbon Vision 2030 for Northeast India - Final Report
24. The additional crude required shall be imported from Paradip-Haldia-Barauni-Bongaigaon pipeline.
There may be requirement of enhancement of pipeline capacity by OIL.
Numaligarh Refinery Ltd (NRL) is planning to expand its refining capacity from 3 MMTPA to 9 MMTPA
by 2020. The mega refinery expansion plan of NRL will call for a capital expenditure to the tune of Rs
20,000 crore. While about 70% products would be lifted by NRL's holding company, Bharat Petroleum
Corporation Limited (BPCL) to fulfill its existing demand for POL products in other regions of India like
Orissa/Bihar/UP; the region and its geographically contiguous neighbouring countries like Bangladesh,
Nepal and Myanmar are being explored for selling the balance products.
The company has already inked important memorandums of understanding (MoU), with Cement
Corporation of India (CCI) for utilization of raw petroleum coke, likely to be generated at NRL after its
proposed capacity expansion. The capacity expansion of the refinery is expected to address the sub-
economic size of the refinery which has been hindering the scalability as well as profitability of the
company. Considering the declining trend in domestic crude oil supplies from North Eastern oil fields,
NRL will be importing crude oil to utilize the additional refining capacity. To facilitate transportation of
around 6 MMTPA, imported crude oil from Paradip port in Orissa to Numaligarh, a new pipeline is
envisaged to be constructed via Siliguri, Bongaigaon. Moreover, part of NRL’s increased production is
also envisaged to be exported to Bangladesh through Parbatipur (150 km from the NRL terminal at
Siliguri) while part quantities are envisaged to be utilized for production of petrochemical grade Naphtha
for which adequate demand exists within the country.
Assessment of future refining capacity in Northeast India
NER consumes around 3.2 MMTPA of petroleum products, which is about 2% of India’s total
consumption. However, in last nine years, consumption of major POL products in NE has increased at
a CAGR of 4.6% (from 2004-05 to 2014-15), whereas in India it witnessed CAGR of about 4.3 % over
the same period. Assam accounts for about 60% of NER’s POL consumption, followed by Meghalaya
which accounts for about 13% of NER’s POL consumption.
Table 74: Consumption of POL in NER States in 2014-15 (TMTPA)
NER Assa
m
Arunacha
l
Manipu
r
Meghalay
a
Mizora
m
Nagalan
d
Tripur
a
Sikki
m
3189.
7 1905.4 177.7 173.3 422.4 107.4 120.3 190.3 92.9
100% 60% 6% 5% 13% 3% 4% 6% 3%
Source: PPAC
By 2030, the expected installed capacity of NER refineries will reach 16 MMTPA (after Numaligarh,
Guwahati & Bongaigaon refineries expansion). The figure below provides the break-up of refinery
capacity from 2015-16 to 2029-30.

Directorate General of Hydrocarbons (DGH)
[129] Hydrocarbon Vision 2030 for Northeast India- Final Report
Figure 35: Break-up of refinery capacity from 2015-16 to 2029-30 in NER in MMTPA
Source: IOCL, NRL
However, by 2030 crude oil supply will likely to be around 5.1 MMTPA (considering firm production).
Therefore, significant shortage of crude oil (around 10.7 MMTPA) will be there to run these refineries
at 100% capacity. Hence, imported crude pipeline needs to be developed to connect these refineries
with ports elsewhere in the country. Along with that, all POL products, except for LPG, shall be surplus
and the same need to be exported to possible demand centers within or outside the country.
Neighbouring countries such as Bangladesh, Myanmar, Bhutan and Nepal could be possible demand
centers as these countries are net importers of POL products as of now. The figure below plots details
of upcoming refining capacity and supply of crude from the region.
Figure 36: Refining capacity vis-à-vis crude oil production in Northeast India (MMTPA)
Source: ONGC, OIL, IOCL, NRL
2015-16
2016-17
2017-18
2018-19
2019-20
2020-21
2021-22
2022-23
2023-24
2024-25
2025-26
2026-27
2027-28
2028-29
2029-30
NRL, Numaligarh, Assam 3 3 3 3 3 9 9 9 9 9 9 9 9 9 9
IOCL Bongaigaon, Assam 2.35 2.35 2.35 3 3 3 3 3 4.5 4.5 4.5 4.5 4.5 4.5 4.5
IOCL Digboi, Assam 0.65 0.65 0.65 0.65 0.65 0.65 0.65 0.65 0.65 0.65 0.65 0.65 0.65 0.65 0.65
IOCL Guwahati, Assam 1 1 1 1 1 1 1 1.7 1.7 1.7 1.7 1.7 1.7 1.7 1.7
Total 7 7 7 7.7 7.7 13.7 13.7 14.4 15.9 15.9 15.9 15.9 15.9 15.9 15.9
7 7 77.7 7.7
13.7 13.714.4
15.9 15.9 15.9 15.9 15.9 15.9 15.9
0
2
4
6
8
10
12
14
16
18
IOCL Guwahati, Assam IOCL Digboi, Assam IOCL Bongaigaon, Assam
NRL, Numaligarh, Assam Total
7.0 7.0 7.0 7.0 7.7 7.7
13.7 13.7 14.415.9 15.9 15.9 15.9 15.9 15.9 15.9
4.5 4.5 5.0 5.3 5.7 5.7 5.8 5.9 5.9 5.9 5.9 5.9 5.8 5.8 5.8 5.7
2.5 2.5 2.1 2.0 2.5 2.5
8.6 8.6 9.310.9 11.0 11.1 11.1 11.2 11.2 11.3
0.02.04.06.08.0
10.012.014.016.018.0
201
4-1
5
201
5-1
6
201
6-1
7
201
7-1
8
201
8-1
9
201
9-2
0
202
0-2
1
202
1-2
2
202
2-2
3
202
3-2
4
202
4-2
5
202
5-2
6
202
6-2
7
202
7-2
8
202
8-2
9
202
9-3
0
Capacity of Refinery Supply without Indicative Gap of Crude Oil Supply

Directorate General of Hydrocarbons (DGH)
[130] Hydrocarbon Vision 2030 for Northeast India - Final Report
It can be observed from the figure above that after expansion of refining capacity in 2020-21 there will
be shortage of around 8.4 MMTPA of crude oil and shortage of around 11.3 MMTPA in 2029-30.
Demand-Supply Assessment of POL Products in Northeast
India
The North East Region in India constitutes around 7.9% of area of India and has 3.2% of the population.
But the consumption of POL products is around 1.9% of the national consumption. The reason can be
attributed to lack of economic development of the region compared to other parts of the country. The
table below provides comparison of POL products consumption in Northeast India vis-à-vis India.
Table 75: POL product consumption in NER vis-à-vis India (MMTPA)
POL Products 2005-
06
2006-
07
2007-
08
2008-
09
2009-
10
2010-
11
2011-
12
2012-
13
2013-
14
2014-
15
All India Consumption
(MMTPA) 113.2 120.7 128.9 133.6 137.8 141.0 148.1 157.1 158.4 165.0
NER Consumption
(MMTPA) 2.1 2.1 2.3 2.5 2.7 2.8 3.0 3.0 3.2 3.2
% of All India
Consumption 1.9% 1.8% 1.8% 1.8% 2.0% 2.0% 2.0% 1.9% 2.0% 1.9%
NER Population ~ 3.2%
NER Area ~ 7.9 %
Source: PPAC, CRIS Analysis
Existing demand of POL products in Northeast India
The overall consumption for POL products in Northeast India has been showing increasing trends over
the last few years. The total consumption of POL products in Northeast India in 2009-10 was 2.7
MMTPA which has increased to 3.2 MMTPA at a CAGR of 3.28% over the same period which follows
the national level growth trends which stands at 3.7% over the same period of time. However, even
though the region accounts for 3.2% of the country’s population, it records only 1.9% of the pan India
consumption. Therefore, the consumption profile of the region ought to grow at a much faster rate than
the national average to reduce the consumption imbalances to certain extent.
Table 76: Existing Consumption of POL products in Northeast India (TMMTPA)
Consumption 2009-10 2010-11 2011-12 2012-13 2013-14 2014-15
LPG 296 315 335 330 365 402
Naphtha 0 0 0 0 0 0
Motor Spirit 284 312 345 363 403 443
High Speed Diesel 1233 1348 1489 1493 1535 1517
Kerosene 376 368 369 373 372 373
ATF 92 97 112 113 112 111
Bitumen 107 120 121 111 103 92
Others 326 267 233 188 294 252
Total NER (in TMTPA) 2714 2827 3005 2970 3184 3190

Directorate General of Hydrocarbons (DGH)
[131] Hydrocarbon Vision 2030 for Northeast India- Final Report
Consumption 2009-10 2010-11 2011-12 2012-13 2013-14 2014-15
Total NER (in MMTPA) 2.7 2.8 3.0 3.0 3.2 3.2
Source: PPAC, CRIS Analysis
Product Balance
As can be observed from the table below, at product level there is a surplus in most of the products,
with HSD production being about three times that of the consumption level in the region. However, the
region has a significant LPG deficit, which has constrained the supply of LPG in the rural market. As
regards ATF, production is more or less matching the consumption; any future shortfall in ATF can be
met through suitable modification in the Refineries.
Figure 37: Major POL products, demand supply balance in NER in 2014-15 (TMTPA)
Source: CRIS Analysis
Existing Supply and Consumption of POL products in NER
The production of POL products from the refineries in Northeast India suffices the demand from the
region, except for LPG which is short of supply. The table below provides demand-supply scenario for
POL products in Northeast India.
Table 77: Existing Supply and Consumption of POL products in Northeast India (TMTPA)
POL Products 2013-14 2014-15
Supply Consumption Supply Consumption
LPG 155 365 157 402
Naphtha 325 0 294 0
Motor Spirit 710 403 785 443
High Speed Diesel 4102 1535 4280 1517
Kerosene 428 372 328 373
ATF 120 112 143 111
Bitumen 0 103 0 92
Others 566 294 555 252
156786
4279
328116402 443
1517
373 111
LPG Motor Spirit High Speed Diesel Kerosene ATFProduction Consumption

Directorate General of Hydrocarbons (DGH)
[132] Hydrocarbon Vision 2030 for Northeast India - Final Report
POL Products 2013-14 2014-15
Supply Consumption Supply Consumption
Total (in TMTPA) 6406 3184 6541 3190
Total (in MMTPA) 6.4 3.2 6.6 3.2
Source: PPAC, CRIS Analysis
It can be observed from the table above that except for LPG, Bitumen and Kerosene Oil, rest of the
POL products are in surplus. The shortage of LPG has been a cause of concern for quite some time
now, as can be observed from the figure below. In fact, LPG shortage in the region has been growing
over the last ten years. The LPG processing capacity of the refineries in the region have not been
sufficient enough to meet the ever increasing demand from the region. Going forward, the trend is likely
to continue as more consumers are going to receive LPG connection which will outpace the increase
in proposed LPG processing capacity of the refineries in the region.
Figure 38: Shortage of LPG Trend in North Eastern States (TMTPA)
Source: PPAC, CRIS Analysis
Existing LPG connections in Northeast India
NER has 54.5 Lakh LPG connection compared to the national figure of 18194 Lakh. However, as per
‘PAHAL-Direct Benefits Transfer for LPG (DBTL) Consumers Scheme’ the overall connection figures is
around 14.25 crore (As per Aug 2015 Data). As per IOCL estimates, the DBT scheme covers around
82% of all connections. Therefore, considering all the factors, the total number of active connections in
India is estimated to be around 17 Crore. Further, growth rate of LPG connections in Northeast India
matches with that of the national growth rate. The table below provides details of LPG connection in
Northeast India in the last decade.
4 These figures are based on the connections data released by OMCs.Active connections are less than released connections.
-106.4-114.3
-127.6-137.3 -143.8
-171.3 -172.9-184.0
-210.5
-245.2
-300.0
-250.0
-200.0
-150.0
-100.0
-50.0
0.0
2005-06 2006-07 2007-08 2008-09 2009-10 2010-11 2011-12 2012-13 2013-14 2014-15
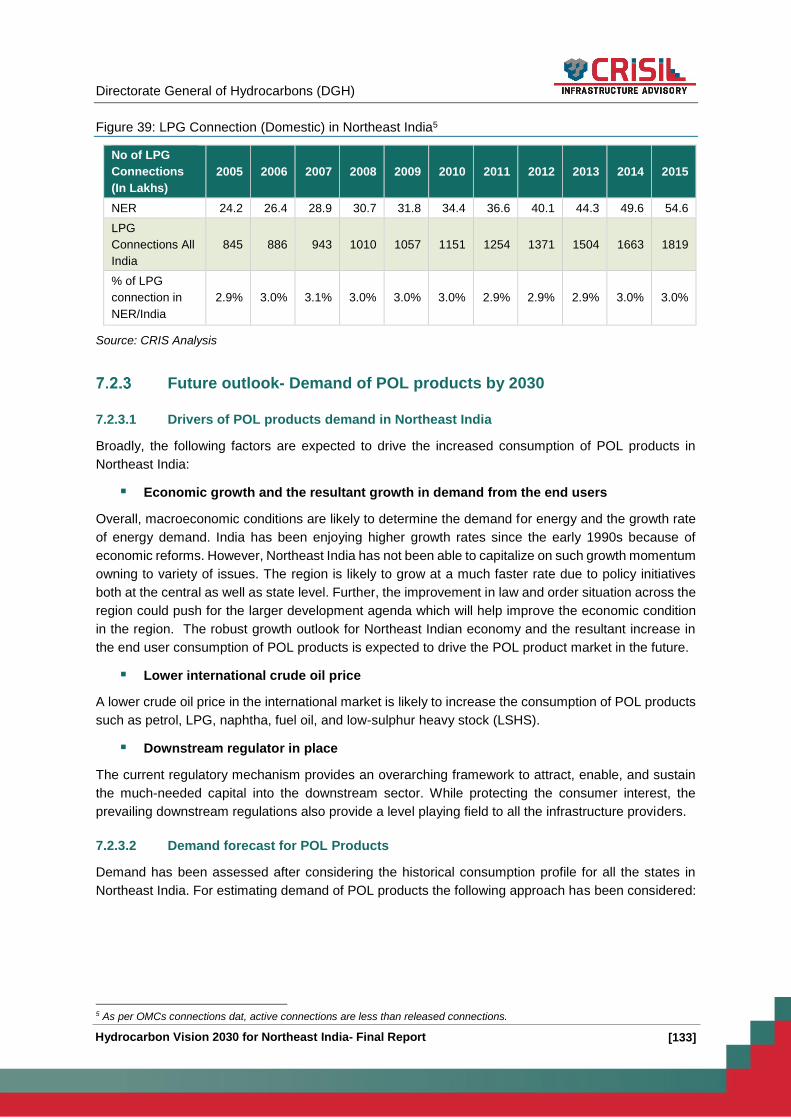
Directorate General of Hydrocarbons (DGH)
[133] Hydrocarbon Vision 2030 for Northeast India- Final Report
Figure 39: LPG Connection (Domestic) in Northeast India5
No of LPG
Connections
(In Lakhs)
2005 2006 2007 2008 2009 2010 2011 2012 2013 2014 2015
NER 24.2 26.4 28.9 30.7 31.8 34.4 36.6 40.1 44.3 49.6 54.6
LPG
Connections All
India
845 886 943 1010 1057 1151 1254 1371 1504 1663 1819
% of LPG
connection in
NER/India
2.9% 3.0% 3.1% 3.0% 3.0% 3.0% 2.9% 2.9% 2.9% 3.0% 3.0%
Source: CRIS Analysis
Future outlook- Demand of POL products by 2030
7.2.3.1 Drivers of POL products demand in Northeast India
Broadly, the following factors are expected to drive the increased consumption of POL products in
Northeast India:
Economic growth and the resultant growth in demand from the end users
Overall, macroeconomic conditions are likely to determine the demand for energy and the growth rate
of energy demand. India has been enjoying higher growth rates since the early 1990s because of
economic reforms. However, Northeast India has not been able to capitalize on such growth momentum
owning to variety of issues. The region is likely to grow at a much faster rate due to policy initiatives
both at the central as well as state level. Further, the improvement in law and order situation across the
region could push for the larger development agenda which will help improve the economic condition
in the region. The robust growth outlook for Northeast Indian economy and the resultant increase in
the end user consumption of POL products is expected to drive the POL product market in the future.
Lower international crude oil price
A lower crude oil price in the international market is likely to increase the consumption of POL products
such as petrol, LPG, naphtha, fuel oil, and low-sulphur heavy stock (LSHS).
Downstream regulator in place
The current regulatory mechanism provides an overarching framework to attract, enable, and sustain
the much-needed capital into the downstream sector. While protecting the consumer interest, the
prevailing downstream regulations also provide a level playing field to all the infrastructure providers.
7.2.3.2 Demand forecast for POL Products
Demand has been assessed after considering the historical consumption profile for all the states in
Northeast India. For estimating demand of POL products the following approach has been considered:
5 As per OMCs connections dat, active connections are less than released connections.

Directorate General of Hydrocarbons (DGH)
[134] Hydrocarbon Vision 2030 for Northeast India - Final Report
Figure 40: Demand estimation for POL products in Northeast India
7.2.3.3 Historical Consumption profile of POL products in Northeast India
Overall consumption of POL products in the region registered substantial growth over the last five years.
However, the growth rates vary quite significantly across different states within the region. Although
Assam continues to be the largest consumer of POL products in the region, it registered growth rate of
2.79% over the last 5 years. States such as Arunachal Pradesh, Mizoram and Nagaland registered
higher growth rates compared to other states in the region.
Table 78: State-wise historical Consumption of POL products in Northeast India (TMTPA)
States 2009-10 2010-11 2011-12 2012-13 2013-14 2014-15 CAGR
Arunachal Pradesh 133 135 145 158 170 177 5.81%
Assam 1661 1714 1768 1686 1880 1905 2.79%
Manipur 139 104 134 156 164 173 4.53%
Meghalaya 351 394 457 472 469 422 3.75%
Mizoram 84 90 101 106 103 107 5.07%
Nagaland 94 111 116 118 120 120 5.05%
Sikkim 82 97 94 91 95 93 2.49%
Tripura 169 182 189 181 181 190 2.35%
Source: IOCL, OIL, PPAC
Per capita consumption of POL products in Northeast India not only lags to the national average but
also varies significantly across the states within the region.
Analyse State-wise historical consumptions of all POL products
Estimating Growth rates for POL Products for every states in Northeast India
Forecasitng State-wise demand of POL products
Forecasting overall demand of POL products for Northeast Region

Directorate General of Hydrocarbons (DGH)
[135] Hydrocarbon Vision 2030 for Northeast India- Final Report
Figure 41: Per Capita Consumption of POL products by north eastern states in India (in KG)
Source: PPAC, IOCL, CRIS Analysis
It can be observed from the table above that per capita consumption is highest in Sikkim and Meghalaya
in the region. Moreover, per capita consumptions in Arunachal Pradesh and Mizoram are higher than
the national average. Interestingly, Assam which stands as the largest consumer of POL products in
the region has a quite low per capita consumption figures with respect to national average as well as
its tiny neighbors. Therefore, significant opportunity lies in the region to beef up the consumption of POL
products as most of the states are yet to be at par with the national average.
7.2.3.4 Estimating growth rates of POL products
The analysis of consumption profile of POL products across different states in Northeast India varies
not only in overall growth rates but also in growth rates across product category. The table below
provides state-wise, product-category wise growth rates of POL products for all the states in northeast
India. The growth rates presented below are average of 5 year compound annual growth rates.
Table 79: Growth in consumption of POL products in Northeast India (CAGR 5Y 2009-10 to 2014-15)
Products Assam Arunacha
l Pradesh Manipur
Meghalay
a Mizoram Nagaland Tripura Sikkim
LPG 7.6% 5.4% 2.2% 2.9% 3.2% 3.3% 7.0% 3.3%
Naphtha 0.0% 0.0% 0.0% 0.0% 0.0% 0.0% 0.0% 0.0%
Motor Spirit 10.5% 8.4% 11.6% 7.1% 10.1% 5.0% 7.7% 8.2%
High Speed
Diesel 3.7% 8.2% 6.3% 3.1% 7.0% 10.1% 3.1% 2.8%
Kerosene -0.3% 3.4% -0.6% -0.3% -1.3% -0.3% 0.0% -0.8%
ATF 6.2% -8.0% -9.4% -100.0% 11.3% -1.7% -19.7% -100.0%
Bitumen -1.0% -10.8% -16.7% 10.8% -13.9% -7.6% -7.1% -2.6%
Others -5.0% -8.3% -7.9% 3.8% -23.6% -0.5% -1.3% -25.5%
Total 2.8% 5.8% 4.5% 3.8% 5.1% 5.1% 2.4% 2.5%
Source: CRIS Analysis
0.10
0.06 0.05
0.15
0.09
0.06
0.15
0.05 0.07
-
0.02
0.04
0.06
0.08
0.10
0.12
0.14
0.16
0.18A
runa
cha
lP
rade
sh
Assa
m
Ma
nip
ur
Me
gh
ala
ya
Miz
ora
m
Na
gala
nd
Sik
kim
Trip
ura
NE
R
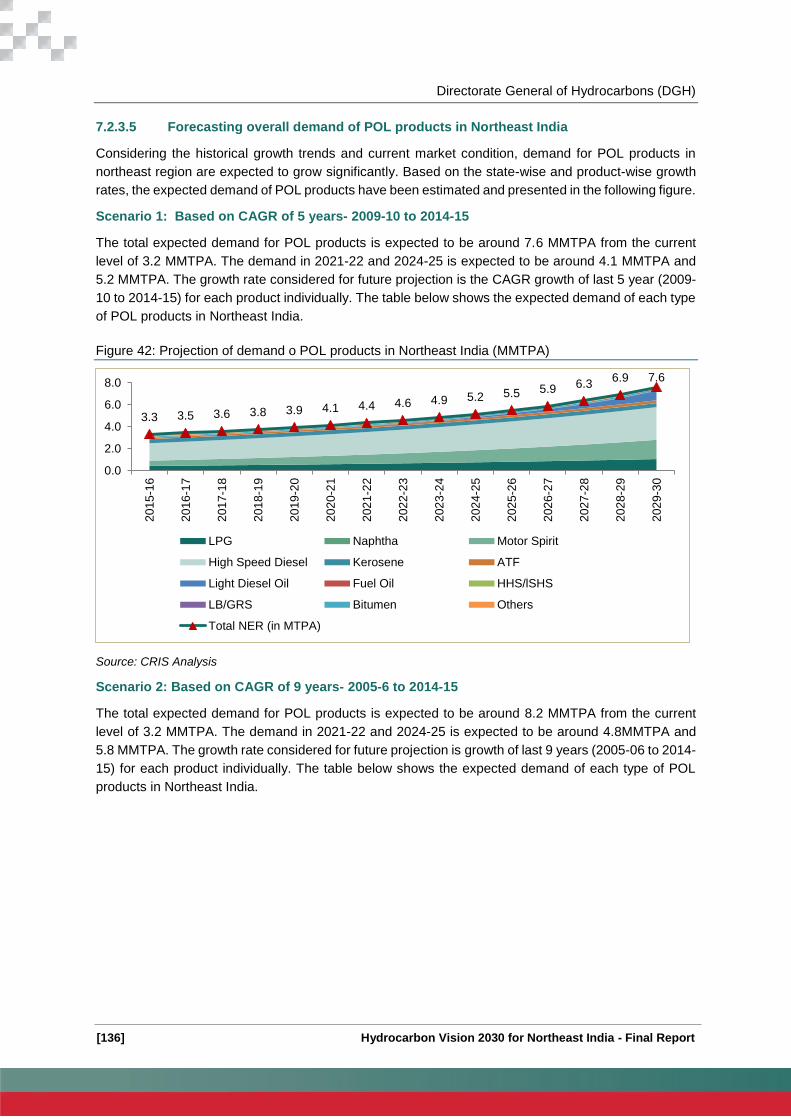
Directorate General of Hydrocarbons (DGH)
[136] Hydrocarbon Vision 2030 for Northeast India - Final Report
7.2.3.5 Forecasting overall demand of POL products in Northeast India
Considering the historical growth trends and current market condition, demand for POL products in
northeast region are expected to grow significantly. Based on the state-wise and product-wise growth
rates, the expected demand of POL products have been estimated and presented in the following figure.
Scenario 1: Based on CAGR of 5 years- 2009-10 to 2014-15
The total expected demand for POL products is expected to be around 7.6 MMTPA from the current
level of 3.2 MMTPA. The demand in 2021-22 and 2024-25 is expected to be around 4.1 MMTPA and
5.2 MMTPA. The growth rate considered for future projection is the CAGR growth of last 5 year (2009-
10 to 2014-15) for each product individually. The table below shows the expected demand of each type
of POL products in Northeast India.
Figure 42: Projection of demand o POL products in Northeast India (MMTPA)
Source: CRIS Analysis
Scenario 2: Based on CAGR of 9 years- 2005-6 to 2014-15
The total expected demand for POL products is expected to be around 8.2 MMTPA from the current
level of 3.2 MMTPA. The demand in 2021-22 and 2024-25 is expected to be around 4.8MMTPA and
5.8 MMTPA. The growth rate considered for future projection is growth of last 9 years (2005-06 to 2014-
15) for each product individually. The table below shows the expected demand of each type of POL
products in Northeast India.
3.3 3.5 3.6 3.8 3.9 4.1 4.4 4.6 4.9 5.2 5.5 5.9 6.36.9 7.6
0.0
2.0
4.0
6.0
8.0
201
5-1
6
201
6-1
7
201
7-1
8
201
8-1
9
201
9-2
0
202
0-2
1
202
1-2
2
202
2-2
3
202
3-2
4
202
4-2
5
202
5-2
6
202
6-2
7
202
7-2
8
202
8-2
9
202
9-3
0
LPG Naphtha Motor Spirit
High Speed Diesel Kerosene ATF
Light Diesel Oil Fuel Oil HHS/lSHS
LB/GRS Bitumen Others
Total NER (in MTPA)
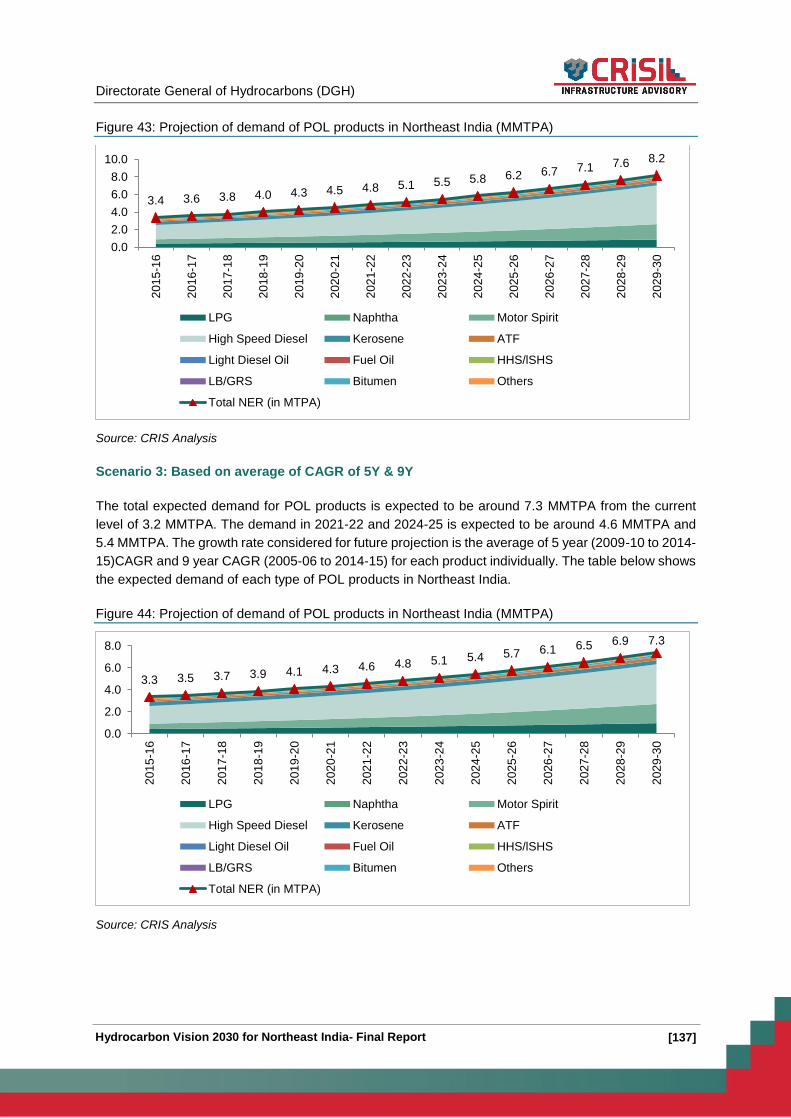
Directorate General of Hydrocarbons (DGH)
[137] Hydrocarbon Vision 2030 for Northeast India- Final Report
Figure 43: Projection of demand of POL products in Northeast India (MMTPA)
Source: CRIS Analysis
Scenario 3: Based on average of CAGR of 5Y & 9Y
The total expected demand for POL products is expected to be around 7.3 MMTPA from the current
level of 3.2 MMTPA. The demand in 2021-22 and 2024-25 is expected to be around 4.6 MMTPA and
5.4 MMTPA. The growth rate considered for future projection is the average of 5 year (2009-10 to 2014-
15)CAGR and 9 year CAGR (2005-06 to 2014-15) for each product individually. The table below shows
the expected demand of each type of POL products in Northeast India.
Figure 44: Projection of demand of POL products in Northeast India (MMTPA)
Source: CRIS Analysis
3.4 3.6 3.8 4.0 4.3 4.5 4.8 5.1 5.5 5.8 6.2 6.7 7.1 7.6 8.2
0.0
2.0
4.0
6.0
8.0
10.02
01
5-1
6
201
6-1
7
201
7-1
8
201
8-1
9
201
9-2
0
202
0-2
1
202
1-2
2
202
2-2
3
202
3-2
4
202
4-2
5
202
5-2
6
202
6-2
7
202
7-2
8
202
8-2
9
202
9-3
0
LPG Naphtha Motor Spirit
High Speed Diesel Kerosene ATF
Light Diesel Oil Fuel Oil HHS/lSHS
LB/GRS Bitumen Others
Total NER (in MTPA)
3.3 3.5 3.7 3.9 4.1 4.3 4.6 4.8 5.1 5.4 5.7 6.1 6.5 6.9 7.3
0.0
2.0
4.0
6.0
8.0
201
5-1
6
201
6-1
7
201
7-1
8
201
8-1
9
201
9-2
0
202
0-2
1
202
1-2
2
202
2-2
3
202
3-2
4
202
4-2
5
202
5-2
6
202
6-2
7
202
7-2
8
202
8-2
9
202
9-3
0
LPG Naphtha Motor Spirit
High Speed Diesel Kerosene ATF
Light Diesel Oil Fuel Oil HHS/lSHS
LB/GRS Bitumen Others
Total NER (in MTPA)
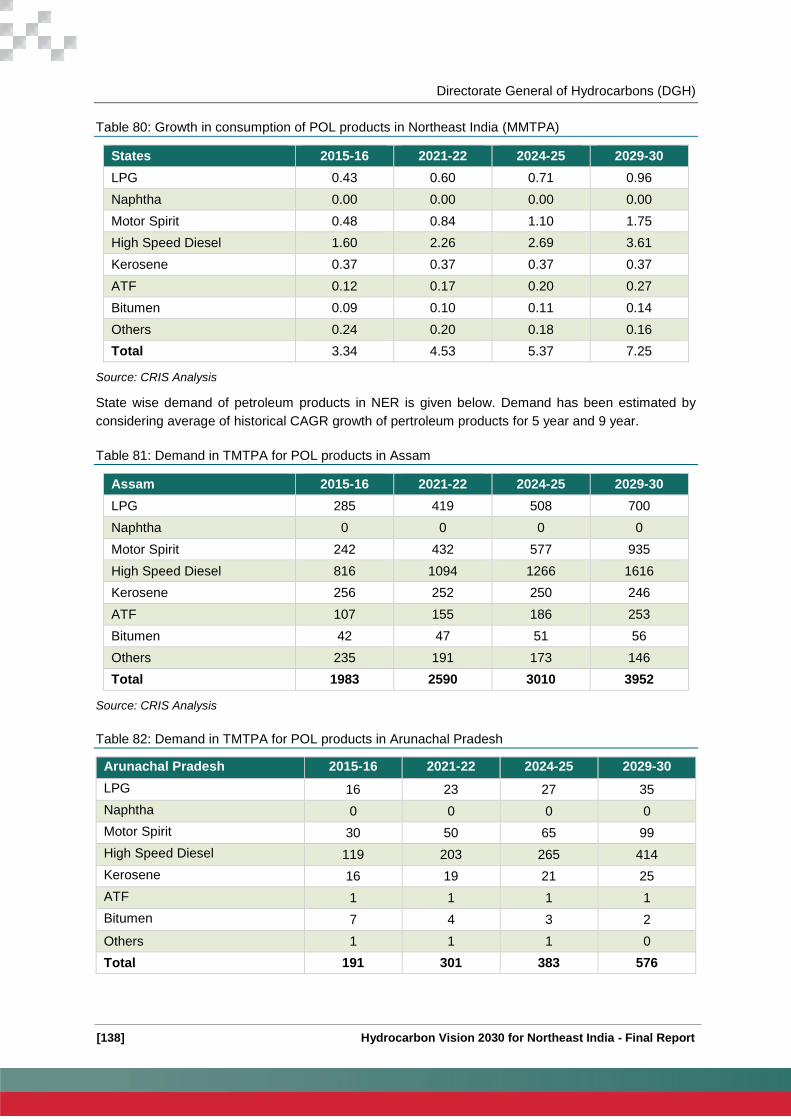
Directorate General of Hydrocarbons (DGH)
[138] Hydrocarbon Vision 2030 for Northeast India - Final Report
Table 80: Growth in consumption of POL products in Northeast India (MMTPA)
States 2015-16 2021-22 2024-25 2029-30
LPG 0.43 0.60 0.71 0.96
Naphtha 0.00 0.00 0.00 0.00
Motor Spirit 0.48 0.84 1.10 1.75
High Speed Diesel 1.60 2.26 2.69 3.61
Kerosene 0.37 0.37 0.37 0.37
ATF 0.12 0.17 0.20 0.27
Bitumen 0.09 0.10 0.11 0.14
Others 0.24 0.20 0.18 0.16
Total 3.34 4.53 5.37 7.25
Source: CRIS Analysis
State wise demand of petroleum products in NER is given below. Demand has been estimated by
considering average of historical CAGR growth of pertroleum products for 5 year and 9 year.
Table 81: Demand in TMTPA for POL products in Assam
Assam 2015-16 2021-22 2024-25 2029-30
LPG 285 419 508 700
Naphtha 0 0 0 0
Motor Spirit 242 432 577 935
High Speed Diesel 816 1094 1266 1616
Kerosene 256 252 250 246
ATF 107 155 186 253
Bitumen 42 47 51 56
Others 235 191 173 146
Total 1983 2590 3010 3952
Source: CRIS Analysis
Table 82: Demand in TMTPA for POL products in Arunachal Pradesh
Arunachal Pradesh 2015-16 2021-22 2024-25 2029-30
LPG 16 23 27 35
Naphtha 0 0 0 0
Motor Spirit 30 50 65 99
High Speed Diesel 119 203 265 414
Kerosene 16 19 21 25
ATF 1 1 1 1
Bitumen 7 4 3 2
Others 1 1 1 0
Total 191 301 383 576

Directorate General of Hydrocarbons (DGH)
[139] Hydrocarbon Vision 2030 for Northeast India- Final Report
Source: CRIS Analysis
Table 83: Demand in TMTPA for POL products in Manipur
Manipur 2015-16 2021-22 2024-25 2029-30
LPG 23 27 30 35
Naphtha 0 0 0 0
Motor Spirit 46 90 126 219
High Speed Diesel 91 151 194 296
Kerosene 20 19 19 18
ATF 3 3 3 3
Bitumen 3 1 1 0
Others 0 0 0 0
Total 186 291 372 571
Source: CRIS Analysis
Table 84: Demand in TMTPA for POL products in Meghalaya
Meghalaya 2015-16 2021-22 2024-25 2029-30
LPG 17 20 22 25
Naphtha 0 0 0 0
Motor Spirit 64 101 128 188
High Speed Diesel 317 425 493 629
Kerosene 20 20 20 20
ATF 0 0 0 0
Bitumen 22 38 50 77
Others 5 6 7 8
Total 445 611 718 948
Source: CRIS Analysis
Table 85: Demand in TMTPA for POL products in Mizoram
Mizoram 2015-16 2021-22 2024-25 2029-30
LPG 22 25 28 31
Naphtha 0 0 0 0
Motor Spirit 25 43 57 90
High Speed Diesel 58 91 113 165
Kerosene 6 5 5 5
ATF 2 3 5 10
Bitumen 2 1 1 0
Others 0 0 0 0
Total 114 169 208 301
Source: CRIS Analysis

Directorate General of Hydrocarbons (DGH)
[140] Hydrocarbon Vision 2030 for Northeast India - Final Report
Table 86: Demand in TMTPA for POL products in Nagaland
NAgaland 2015-16 2021-22 2024-25 2029-30
LPG 18 21 24 28
Naphtha 0 0 0 0
Motor Spirit 26 36 42 56
High Speed Diesel 62 106 138 215
Kerosene 13 13 13 13
ATF 1 1 2 2
Bitumen 5 3 2 1
Others 0 0 0 0
Total 126 181 221 315
Source: CRIS Analysis
Table 87: Demand in TMTPA for POL products in Tripura
Tripura 2015-16 2021-22 2024-25 2029-30
LPG 34 50 61 84
Naphtha 0 0 0 0
Motor Spirit 35 58 74 110
High Speed Diesel 86 118 137 177
Kerosene 30 30 30 30
ATF 2 1 1 1
Bitumen 9 7 6 4
Others 1 1 1 0
Total 199 264 309 408
Source: CRIS Analysis
Table 88: Demand in TMTPA for POL products in Sikkim
Sikkim 2015-16 2021-22 2024-25 2029-30
LPG 12 15 16 19
Naphtha 0 0 0 0
Motor Spirit 16 27 35 54
High Speed Diesel 56 71 80 98
Kerosene 11 11 11 11
ATF 0 0 0 0
Bitumen 1 1 1 1
Others 0 0 0 0
Total 97 125 144 184
Source: CRIS Analysis

Directorate General of Hydrocarbons (DGH)
[141] Hydrocarbon Vision 2030 for Northeast India- Final Report
Table 89: Total demand in NER in TMTPA
Sikkim 2015-16 2021-22 2024-25 2029-30
LPG 426 600 714 957
Naphtha 0 0 0 0
Motor Spirit 485 837 1103 1750
High Speed Diesel 1605 2257 2686 3610
Kerosene 373 371 370 369
ATF 117 165 198 269
Bitumen 92 103 114 143
Others 242 199 181 155
Total 3339 4532 5365 7254
Source: CRIS Analysis
Mapping demand-supply of POL products in Northeast India
Mapping of demand and supply of POL products are important as it provides key insights about annual
deficit or surplus figures. It can be observed from the figure below that Northeast India will continue to
be surplus region as far as POL products are concerned. Therefore, proper planning is required to
utilize the excess supply coming out of the refineries in the region.
Figure 45: Demand-supply mapping of POL products in NER (MMTPA) (Avg of CAGR 5Y & 9Y)
Source: CRIS Analysis
Further, the demand-supply analysis at product level reveals that Northeast India will continue to be in
deficit as far as LPG is concerned. Moreover, even after considering INDMAX technology used by
IOCL to increase production of LPG, the deficit in 2029-30 will be around 0.15 MMTPA by 2029-30.
However, the concerted effort by the refineries in the region will likely to cut the LPG deficit by 2019-20.
Infact, in the period of years 2021 to 2026, the region is likely to be in surplus scenario as far as LPG
supply in concerned. As maximum quantity of LPG shall be available from IOCL Bongaigaon refinery,
the surplus LPG can be transported to other part of the country via Siliguri.
3.4 3.2 3.1 2.9 3.2 3.0
8.1 7.8 8.19.2 8.9 8.6 8.2 7.9 7.5 7.0
0.0
2.0
4.0
6.0
8.0
10.0
12.0
14.0
16.0
201
4-1
5
201
5-1
6
201
6-1
7
201
7-1
8
201
8-1
9
201
9-2
0
202
0-2
1
202
1-2
2
202
2-2
3
202
3-2
4
202
4-2
5
202
5-2
6
202
6-2
7
202
7-2
8
202
8-2
9
202
9-3
0
Supply Demand Surplus

Directorate General of Hydrocarbons (DGH)
[142] Hydrocarbon Vision 2030 for Northeast India - Final Report
However, the demand for LPG in the later period will be much higher, which in effect will once again
exceed the supply, leaving the region in LPG deficit once again.
Table 90: Demand- Supply gap at product level (MMTPA)
Surplus/Deficit 2015-16 2021-22 2024-25 2029-30
LPG -0.27 0.06 0.09 -0.15
Naphtha 0.28 0.29 0.29 0.29
Motor Spirit 0.33 1.46 1.75 1.10
High Speed Diesel 2.64 5.28 5.92 5.00
Kerosene -0.05 0.24 0.31 0.31
ATF 0.03 0.10 0.07 .001
Bitumen -0.09 -0.10 -0.11 -0.14
Total 3.20 7.8 8.9 7.0
Source: CRIS Analysis
Deficit of Bitumen in NER
From the above table we can see that there is a deficit of bitumen production in NER. The main use of
bitumen is in construction of roads and highways. NER has an abundance of limestone mines which is
the major ingredient for manufacturing cement. This has led to a number of cement plants to come up
in the region. Hence in order to compensate for bitumen deficit, instead of conventional roads, concrete
roads construction can be planned in NER, which would use locally manufactured cement and would
also give further boost to cement manufacturing in the region.
The LPG production in NER has been compared with that of all India production. Further, the same has
been analyzed as a percentage of total production of POL products. It has been observed that LPG
production as a % of overall POL production in Northeast India has been historically lower than that of
all India numbers. The average production of LPG, as a percentage of total POL produced in NER over
the period of 2005-06 to 2014-15, is close to 2.4 %, whereas the all India figure for the same is around
5.3%.
The chart below shows the historical % LPG production of total POL production for NER and India.
Figure 46: Historical LPG production trends as % of POL production in northeast India vis-à-vis India
Source: IOCL, OIL, CRIS Analysis
2.57% 2.53% 2.55% 2.38% 2.41% 2.49% 2.47% 2.36% 2.41% 2.38%
6.22% 6.04% 5.92% 5.93% 5.59%4.92% 4.68% 4.51% 4.55% 4.46%
0.00%
1.00%
2.00%
3.00%
4.00%
5.00%
6.00%
7.00%
200
5-0
6
200
6-0
7
200
7-0
8
200
8-0
9
200
9-1
0
201
0-1
1
201
1-1
2
201
2-1
3
201
3-1
4
201
4-1
5
NER India Linear (NER)

Directorate General of Hydrocarbons (DGH)
[143] Hydrocarbon Vision 2030 for Northeast India- Final Report
Based on analysis of POL production data released by refining companies in NER, the situation is going
to be only slightly better, with percentage LPG production reaching to a maximum of 5.6% of the total
production of POL products by 2020-21. Initiatives are required from the refineries to increase LPG
production from the NER region and to take it to the all India level of average production. This would
require the refining companies to upgrade their refineries and change their refinery configuration so that
more of LPG is produced from the region.
IOCL has started upgradation of it Guwahati refinery by implementing its in-house patented technology
INDMAX, for enhancement of LPG and gasoline production. Similar initiatives from the other three
refineries are also warranted for increasing LPG production. The quantity of LPG produced, as a
percentage of total POL production in in NER, is given in table below:
Table 91: LPG production in northeast India
Year 2014-15 2020-21 2024-25 2029-30
LPG produced in
TMTPA 157 656 806 806
LPG produced as a
% of total POL
products in NER
2.4% 5.3% 5.6% 5.6%
Source: IOCL, OIL, CRIS Analysis
Special Products in NER refineries
Indian Oil Corporation Limited (IOCL)
NER refineries face high operating cost as compared to that of large refineries elsewhere in the country,
due to smaller size. In order to make these refineries more profitable, opportunities of producing value
added specialty products should be explored, some of the areas which are being studied as follows:
Digboi: Revamp of DHDT, Paraffin Wax, CRMB/ Hybrid Bitumen, Calcined petroleum coke/
Needle coke, Naphthenic base oil
Guwahati: CRU installation, Petcoke fired boiler, Needle coke
Bongaigaon: IndMAX, Revamp of ISOM Unit, CRU/ DHDT capacity expansion, Calcium
Carbide-Acetylene-PVC and production of special boiling point solvents
Production of Value added specialty chemicals not only improves profitability of the refineries, it also
will help in setting up new downstream units in and around NE thereby helping economic development
in the area. Emphasis therefore needs to be given to these refineries for production of specialty
products.
In addition to this, Guwahati Refinery installation of Pet Coke fired Boiler of 80 TPH capacity for reducing
power cost is under approval.
Numaligarh Rfeinery Limited (NRL)
Bioethanol

Directorate General of Hydrocarbons (DGH)
[144] Hydrocarbon Vision 2030 for Northeast India - Final Report
Bioethanol is a bio fuel made from renewable feedstock such as grains, sugar beets, bamboo, jatropha
seeds etc. Bioethanol is one of the most frequently used biofuel that can be mixed with petrol in varying
proportions depending upon norms in the country.
USA is the largest producer of bioethanol followed by Brazil and China. The figure below shows the
major producers of fuel grade bioethanol and their production in 2014.
Figure 47: Fuel Ethanol production in million gallons
Source: CRIS Research
Currently across the globe including India, majority of ethanol production is done by using sugarcane
as a feedstock. However, new technologies for production of bioethanol using alternative feedstock are
being explored in order to:
Developing cost-competitive advanced technologies to convert available feedstock into fuels
Producing fuels with advanced properties that are compatible with existing engines and
infrastructure (for air, long-distance freight, and shipping)
We have highlighted in this section the production of bioethanol, using bamboo as a feedstock which is
in abundance in North Eastern Region.
Use of bamboo as a feedstock for production of bioethanol
Globally research has been carried on utilizing bamboo as a feedstock for production of bioethanol with
positive results. Bamboo can be used as a feedstock for bioethanol production to its natural abundance,
rapid growth, perennial nature and low management requirements. As a member of the Gramineae
family, the composition of bamboo is highly similar to other grasses utilized for producing biofuels (e.g.
switch-grass, Miscanthus). Its cell wall is comprised of the polymeric constituents: cellulose,
hemicellulose and lignin. The complex physical and chemical interactions between these components
prevent enzymes from readily accessing the microfibrillar cellulose during the saccharification stage of
its conversion into biofuel.
The North East region of India has almost close to 30% of total area used for cultivating Bamboo in the
country and accounts for 66% of Bamboo production of India. This makes North East a region with
abundant bamboo cultivation and a location where plenty of raw material is available for production of
bioethanol.
Bio-refinery at Numaligarh
14,300
6,190
1,445635 510 310 160 155
865
0
2,000
4,000
6,000
8,000
10,000
12,000
14,000
16,000
US
Bra
zil
Euro
pe
Ch
ina
Ca
nad
a
Tha
iland
Arg
entina
India
Re
st
of W
orld
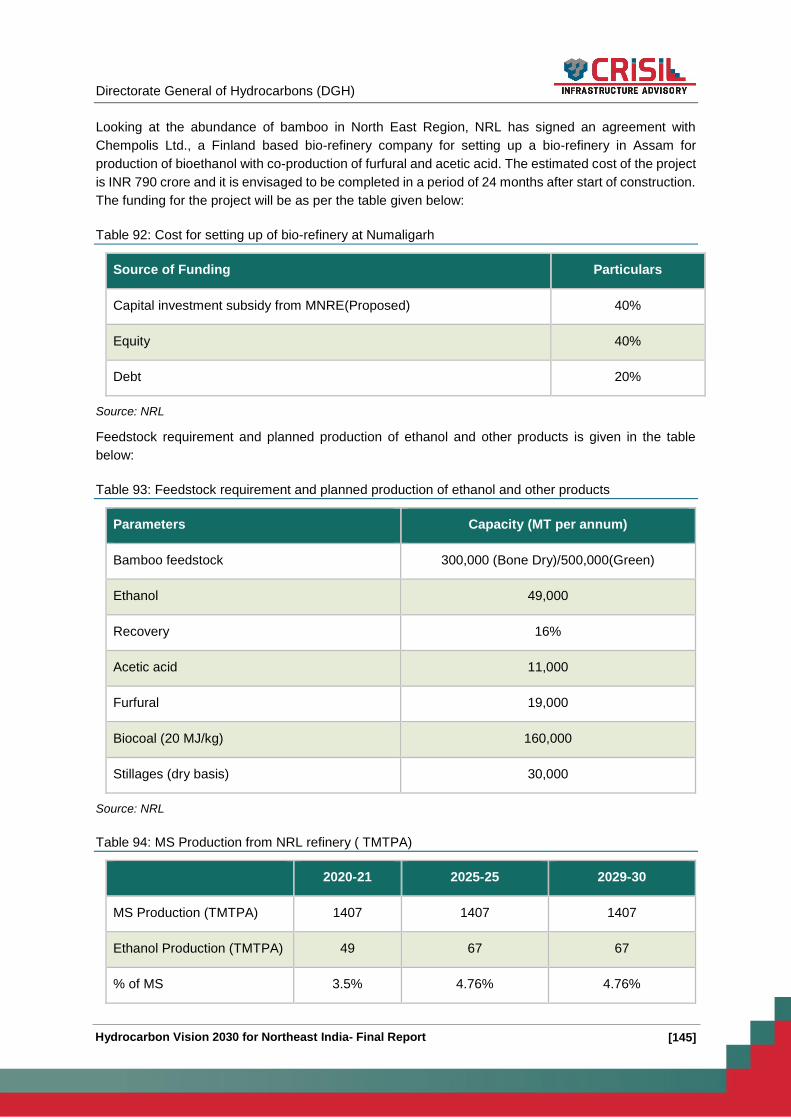
Directorate General of Hydrocarbons (DGH)
[145] Hydrocarbon Vision 2030 for Northeast India- Final Report
Looking at the abundance of bamboo in North East Region, NRL has signed an agreement with
Chempolis Ltd., a Finland based bio-refinery company for setting up a bio-refinery in Assam for
production of bioethanol with co-production of furfural and acetic acid. The estimated cost of the project
is INR 790 crore and it is envisaged to be completed in a period of 24 months after start of construction.
The funding for the project will be as per the table given below:
Table 92: Cost for setting up of bio-refinery at Numaligarh
Source of Funding Particulars
Capital investment subsidy from MNRE(Proposed) 40%
Equity 40%
Debt 20%
Source: NRL
Feedstock requirement and planned production of ethanol and other products is given in the table
below:
Table 93: Feedstock requirement and planned production of ethanol and other products
Parameters Capacity (MT per annum)
Bamboo feedstock 300,000 (Bone Dry)/500,000(Green)
Ethanol 49,000
Recovery 16%
Acetic acid 11,000
Furfural 19,000
Biocoal (20 MJ/kg) 160,000
Stillages (dry basis) 30,000
Source: NRL
Table 94: MS Production from NRL refinery ( TMTPA)
2020-21 2025-25 2029-30
MS Production (TMTPA) 1407 1407 1407
Ethanol Production (TMTPA) 49 67 67
% of MS 3.5% 4.76% 4.76%

Directorate General of Hydrocarbons (DGH)
[146] Hydrocarbon Vision 2030 for Northeast India - Final Report
Source: NRL
The bio-coal and stillages produced as above shall be combusted in Boiler for production of process
steam and power. NRL has confirmed the availability of the bamboo feedstock on the basis of a
feedstock availability study carried out by it.
Storage and transportation of ethanol
Transportation of 48 TMTPA of produced ethanol is planned through the Tank Trucks (TTs) from the
existing marketing terminal of NRL at Numaligarh to the 13 Depot locations in North East. As ethanol
has an affinity to absorbs water at ambient temperature. If the percentage of water in the ethanol
blended MS increases above 0.5% then phase separation may occur and ethanol along with water will
separate from MS. In order to reduce the time between ethanol being blended in MS and finally
consumed by end customer, ethanol is planned to be doped online into MS, only when making final
delivery to Retail outlet through Tank Trucks.
Perceived benefits from the project
Socio Economic benefits: The bio-refinery project is bound to make a major socio-economic
benefit in the region. The large scale bamboo purchase by NRL-Chempolis JV for the bio
refinery would cater to the farm and non-farm sectors of the economy especially in the North
Eastern States. The opportunities created by the new demand will help build suitable models
for sustainable livelihood and also augment the income of farmers & suppliers who are
dependent on this resource. Bamboo as an economic resource is capable of generating
employment for the rural poor in Bamboo plantations and commercial activities such as semi
processing for supply to the Bio Refinery can be taken up by local entrepreneurs in the private
sector. The Central Government through National Bamboo Mission and State Governments of
each North Eastern State through the State Bamboo Missions will play the role of facilitator
responsible for creating an enabling environment by providing policy, technical and financial
support.
Environmental benefits: The value added should however also be seen in ecological terms.
Bamboo is an effective crop for environmental protection. Bamboo produces a full green canopy
within three to four years after planting. So long as selective harvesting is practiced, the canopy
will remain green. This distinguishes bamboo from other forestry species where harvesting
implies a reduction in forest cover. The direct purchase of bamboo by the proposed bio refinery
from the NE states has tremendous impact on the ecology, economy, poverty alleviation and
employment. Bamboo, once planted, the clumps will go on producing culms and shoot for about
20 years.
Bio fuels policy:It is in line with National Policy on Bio-fuels announced by Ministry of New
and Renewable Energy, Government of India in 2009 sets an indicative target of 20% blending
of bio-fuels, both for bio-diesel in diesel and bio-ethanol in petrol, by 2017.
Cost reduction for refinery: Production of fuel grade ethanol shall reduce NRL’s requirement
of imported MTBE and Reformate for MS blending due to higher octane number of ethanol and
shall result in net cost savings for NRL.
Improve efficiency of vehicles: Mixing of petrol with ethanol leads to increased engine
efficiency of vehicles, more oxygenation of the fuel leading to cleaner emissions and reduction
in air pollution.

Directorate General of Hydrocarbons (DGH)
[147] Hydrocarbon Vision 2030 for Northeast India- Final Report
Storage of POL Products in Northeast India
7.2.6.1 Storage facilities available in NER
Storage facilities for POL products in Northeast India are being handled by few players namely IOCL,
BPCL, NRL, HPCL and OIL. IOCL is the largest player among them, holds the maximum share in
customer touch-points and is the only player in some categories. The table below provides details of
storage facilities in Northeast India.
Table 95: Storage Facilities in Northeast India as on April, 2015
Particulars IOCL BPCL+NRL HPCL OIL Total
Terminals 3 1 1 - 5
LPG Bottling Plant 12 1 - 1 14
Bulk Depot 10 1 - - 11
AFS 15 1 1 - 17
Retail Outlets 893 204 124 - 1221
SKO / LDO Wholesalers 556 2 - - 558
LPG Distributors 587 51 25 - 663
Source: IOCL, CRIS Analysis
Presently, the tankage capacity of POL products in Northeast India is 1,92,055 kilolitres. Product wise
tankage details along with number of day’s coverage have been provided in the following table.
LPG Infrastructure
Currently, there are 12 LPG bottling plants across NER with a total bottling capacity of 426 TMTPA and
existing tankage of around 15 TMTPA. Additional tankages of 34 TMTPA and enhancement of bottling
capacity by another 100 TMTPA has already been planned by 2019-20. In order to meet the demand
of around about 1200 TMTPA by 2030, , IOC has planned to commission 5 new bottling plants at –
Subroom, Silchar, Nogaon, Golaghat and Agartala with total capacity addition of 700 TMTPA, which
should be adequate to cover the increased demand. The tankage capacity will also have to be increased
further and is expected to be around 48 TMTPA which should ensure adequate storage cover of 15
days. Estimated cost of upgrading the bottling and storage capacity is Rs. 1500 cr at today's levels.
Below is the list of existing bottling Plants of LPG in NER.
Table 96: existing bottling Plants in Northeast India
Sr No Name of City State Capacity (TMTPA)
1 Bishalgarh Tripura 29
2 Bongaigaon Assam 38
3 Dimapur Nagaland 12
4 Gopanari Assam 36
5 Kimin Arunachal Pradesh 15
6 Mualkhang Mizoram 13
7 Guwahati Assam 166
8 Duliajan Assam 19
9 Sarpara Assam 76

Directorate General of Hydrocarbons (DGH)
[148] Hydrocarbon Vision 2030 for Northeast India - Final Report
Sr No Name of City State Capacity (TMTPA)
10 Sekmai Manipur 32
11 Silchar Assam 44
12 Sikkim Sikkim N.A.
13 Numaligarh Assam 10
Total 489
Source: CRIS Analysis
Map of existing LPG bottling plants in NER are provided below:
Figure 48: LPG bottling plants in northeast India
POL infrastructure
Currently, there are 11 depots/terminals located in states of NER other than refinery linked terminals.
The total tankages available are 165 TKL for MS, HSD and SKO. IOC has already undertaken re-
sitement/augmentation of depot tankages. Keeping in view of the demand for 2030, an exercise on
further augmentation of depot tankages, if any, has to be taken on priority.
Taking into account the capital expenditure of approximately Rs. 1000 crore for augmentation in
tankages, storage cover will increase to 40 days at POL demand of approximately 2000 TMTPA.
However, the storage cover will reduce to 10 days in 2030 with POL demand rising to approximately
7500 TMTPA level. Therefore, planning of additional tankages need to be put in place so that adequate
storage cover is available in the NER.

Directorate General of Hydrocarbons (DGH)
[149] Hydrocarbon Vision 2030 for Northeast India- Final Report
Table 97: Product wise tankage capacity in Northeast India
State
MS HSD SKO
Tankage
(in KLs)
Days
cover
Tankage
(in KLs)
Days
cover
Tankage
(in KLs)
Days
Cover
Arunachal Pradesh 1167 11 4001 12 1580 50
Assam 35252 42 82410 32 35225 238
Manipur 1119 9 3591 15 2666 38
Meghalaya 0 0 0 0 0 0
Mizoram 283 3 758 4 233 9
Nagaland 1580 22 6280 38 2990 52
Tripura 91 6 4347 14 4153 32
Sikkim 675 12 1794 10 1033 59
Source: IOCL, CRIS Analysis
The Northeast region holds strategic importance as it shares most of its boundaries with other countries
such as Bangladesh, Myanmar, Bhutan and China. The region is geographically isolated from the rest
of the country and is connected through a small stretch of road with the rest of country. The limited road
and railway networks in the region have further isolated the region not only from the other parts of the
country but also within itself. Therefore, air connectivity is a plausible alternative in the short to medium
term to have better access in the region. Considering the geographical set up, it is sometimes also
economical to have air connectivity than to create alternative infrastructures which would not only cost
more but also will take much longer duration to build. The government of India rightly identified the
problem and thereby created airports in the region. However, to sustain such air connectivity round the
year, it is imperative to have uninterrupted supply of aviation fuel in the region. At present, the region
has 17 Aviation Fuel Stations (AFS) to its ranks. The table below provides state-wise break up of
aviation fuel stations in Northeast India.
Table 98: Aviation Fuel Stations in Northeast India
State Aviation Stations NOs
Arunachal Pradesh 3
Assam 9
Manipur 1
Meghalaya 1
Mizoram 1
Nagaland 1
Tripura 1
Sikkim 0
Source: IOCL
It can be observed from the table above that Assam has the maximum number of aviation fuel stations
as the state has maximum number of civilian airports in the region. The AFS in Arunachal Pradesh and
Meghalaya are utilized by the Indian Air Force as of now. The rest of the states have one AFS each
which supplies fuel to the existing civilian airports in these states. However, Sikkim, which is yet to have
any airports in its ranks, does not have an AFS.

Directorate General of Hydrocarbons (DGH)
[150] Hydrocarbon Vision 2030 for Northeast India - Final Report
7.2.6.2 LPG Storage Capacity in Northeast India
Storage of POL products, especially storage of LPG in Northeast India is very important as the region
continue to be in deficit as far as LPG is concerned. Further, the region faces severe connectivity
challenges, be it the pipeline or the road or rail connectivity. The infrastructural gaps coupled with the
socio-political problem has put part of the region in isolation from the other parts of the country from
time to time. Therefore, to ensure smooth supply of LPG in the region, storage facility will have to be
improved.
However, the state-wise LPG storage capacity figures in terms of number of days are not very
encouraging at present. The figure is more dismal for states such as Meghalaya, Tripura and Mizoram
which have 0-2 day’s coverage. Therefore, considering the geographical locations of the region, effort
should be made to increase LPG coverage to 15 days from current level of 5-6 days.
The figure below depicts state-wise LPG coverage details for the region.
Figure 49: LPG storage capacity in days in Northeast India
Source: IOCL, CRIS Analysis
Further, North-eastern states fare poorly in terms of percentage of population having LPG access as
well. The reason can be largely attributed to poor infrastructural connectivity network. LPG coverage in
all India level is estimated to be around 65-70% whereas in NER it is only 59% which is much lower
than the national average. However, LPG coverage in Northeast India is going to improve in near future
as initiatives are taken to cover more areas under LPG network. As can be observed from the figure
below, LPG coverage by the end of 2015-16 is likely to improve. The coverage in some of areas is
higher due to multiple connections or due to inactive connections in that area.
4
5
7
0
2
3
1.5
10
0
2
4
6
8
10
12
ArunachalPradesh
Assam Manipur Meghalaya Mizoram Nagaland Tripura Sikkim
Days coverage

Directorate General of Hydrocarbons (DGH)
[151] Hydrocarbon Vision 2030 for Northeast India- Final Report
Figure 50: LPG coverage in Northeast India in terms of percentage of population
Source: CRIS Analysis
7.2.6.3 Expansion Projects of LPG Storage in NER
Following are the initiatives undertaken by IOCL to increase the penetration/supply in NER Areas:
Table 99: Initiatives undertaken by IOCL to increase the penetration/supply in NER Areas
Name of the Project with
Location
Existing
storage (MT)
Approved
Cost
(Rs. crore)
Brief Description of the
Project
3 x 600 MT Additional Storage
project at LPG BP Silchar (Assam) 500 37.39
3 x 600 MT (Additional
Mounded Storage)
2x600 MT Additional Storage project
at LPG BP N. Guwahati (Assam) 1320 28.48
2 x 600 MT (Additional
Mounded Storage)
3x150 MT Additional Storage project
at LPG BP Bishalgarh (Tripura) 83 28.54
3 x 150 MT (Additional
Mounded Storage)
2x150 MT Additional Storage project
at LPG BP Dimapur (Nagaland) 99 17.97
2 x 150 MT (Additional
Mounded Storage)
Source: IOCL
Demand-Supply Assessment of Natural Gas
Existing Consumption of natural gas in Northeast India
With the recent changes in the structure of the macro-economic factors and economic boom in India,
the total primary energy requirement is increasing at a rapid pace. Coal and Oil have been the dominant
fuel in the primary energy basket; however, natural gas has increased its share due to increased
availability from domestic production by private players and LNG imports. One of the ways to secure
energy in an efficient way is through consumption of natural gas. Natural gas being a reliable, cost
effective (in comparison to liquid fuels) and cleaner fuel can also address the issue of increasing
pollution level and global warming. However, due to lower production level and increased demand for
natural gas in India there is an increased focus on imported LNG.
94.03
55.17
77.49
35.3
134.79
59.01 57.07
75.58
98
60.59
85.77
38.27
143.84
64.63 62.41
83.04
0
20
40
60
80
100
120
140
160
ArunachalPradesh
Assam Manipur Meghalaya Mizoram Nagaland Tripura Sikkim
LPG coverage now (%) LPG coverage predicted at end of 15‐16 (%)
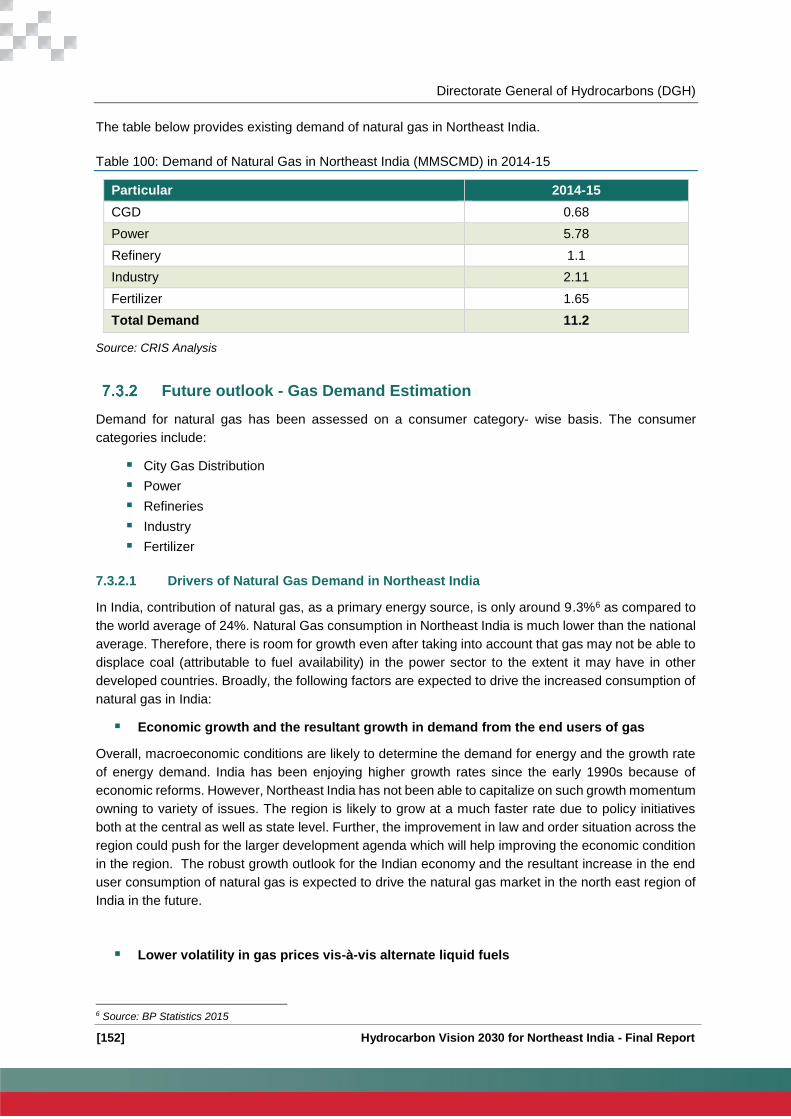
Directorate General of Hydrocarbons (DGH)
[152] Hydrocarbon Vision 2030 for Northeast India - Final Report
The table below provides existing demand of natural gas in Northeast India.
Table 100: Demand of Natural Gas in Northeast India (MMSCMD) in 2014-15
Particular 2014-15
CGD 0.68
Power 5.78
Refinery 1.1
Industry 2.11
Fertilizer 1.65
Total Demand 11.2
Source: CRIS Analysis
Future outlook - Gas Demand Estimation
Demand for natural gas has been assessed on a consumer category- wise basis. The consumer
categories include:
City Gas Distribution
Power
Refineries
Industry
Fertilizer
7.3.2.1 Drivers of Natural Gas Demand in Northeast India
In India, contribution of natural gas, as a primary energy source, is only around 9.3%6 as compared to
the world average of 24%. Natural Gas consumption in Northeast India is much lower than the national
average. Therefore, there is room for growth even after taking into account that gas may not be able to
displace coal (attributable to fuel availability) in the power sector to the extent it may have in other
developed countries. Broadly, the following factors are expected to drive the increased consumption of
natural gas in India:
Economic growth and the resultant growth in demand from the end users of gas
Overall, macroeconomic conditions are likely to determine the demand for energy and the growth rate
of energy demand. India has been enjoying higher growth rates since the early 1990s because of
economic reforms. However, Northeast India has not been able to capitalize on such growth momentum
owning to variety of issues. The region is likely to grow at a much faster rate due to policy initiatives
both at the central as well as state level. Further, the improvement in law and order situation across the
region could push for the larger development agenda which will help improving the economic condition
in the region. The robust growth outlook for the Indian economy and the resultant increase in the end
user consumption of natural gas is expected to drive the natural gas market in the north east region of
India in the future.
Lower volatility in gas prices vis-à-vis alternate liquid fuels
6 Source: BP Statistics 2015

Directorate General of Hydrocarbons (DGH)
[153] Hydrocarbon Vision 2030 for Northeast India- Final Report
Volatility in crude oil prices over the past few years has translated in price variability of alternate liquid
fuels, like petrol, LPG, naphtha, fuel oil, and low-sulphur heavy stock (LSHS). In comparison, gas prices
in India have been less volatile. Petroleum product prices are highly correlated to the dynamics of the
crude oil market, whereas natural gas prices (across sources) in India have so far been set on long-
term basis, thereby making them less volatile.
Downstream regulator in place
The current regulatory mechanism provides an overarching framework to attract, enable, and sustain
the much-needed capital into the natural gas downstream sector. While protecting the consumer
interest, the prevailing downstream regulations also provide a level playing field to all the infrastructure
providers.
Environmental concerns
Globally, reduction in carbon emission has emerged as a key concern area. Natural gas being a cleaner
and environmental friendly fuel (lower carbon emissions per unit energy generated), local governments
the world over are promoting higher usage of natural gas across key end-use segments, such as in
power generation, as industrial and auto fuel. End users consuming natural gas are entitled to certified
emission reduction credits and can therefore gain financially from such projects/transactions.
7.3.2.2 Demand from CGD sector
Gas demand from the CGD sector has been estimated for existing cities and the new demand from
other cities has been arrived at after giving due consideration to the likely time frame within which
cities/districts will receive pipeline connectivity. Existing CGD entities include cities that are deemed
authorized i.e. AGCL and TNGCL. Gas demand from these entities stood at around 0.68 MMSCMD in
2014-15 and is expected to reach about 4.4 MMSCMD by 2029-30 considering phase 1, 2 and phase
3 of gas pipeline are connected and spur lines within districts are implemented. Districts considered in
each phase are:
Phase 1: Guwahati, Silchar (Cachar Hills), Aizawl, Imphal, Kamrup, Shillong, Karimganj,
hailakandi, Goalpara, Bongaigaon
Phase 2: Morigaon, Nagaon
Phase 3: Bongaigaon, Dhubri, Kokrajhar
The following assumptions have been considered for estimating CGD demand.
Each family consist of 5 members and consumption per family is 0.5 SCM gas per annum
Maximum conversion of 65-70% has been considered for all categories (Domestic,
Commercial, CNG and Industrial).
Phasing across the years is considered in all categories
Discount of 50% for CNG consumption and discount of 80% for industrial consumption have
been considered for all India pattern for CNG and PNG.
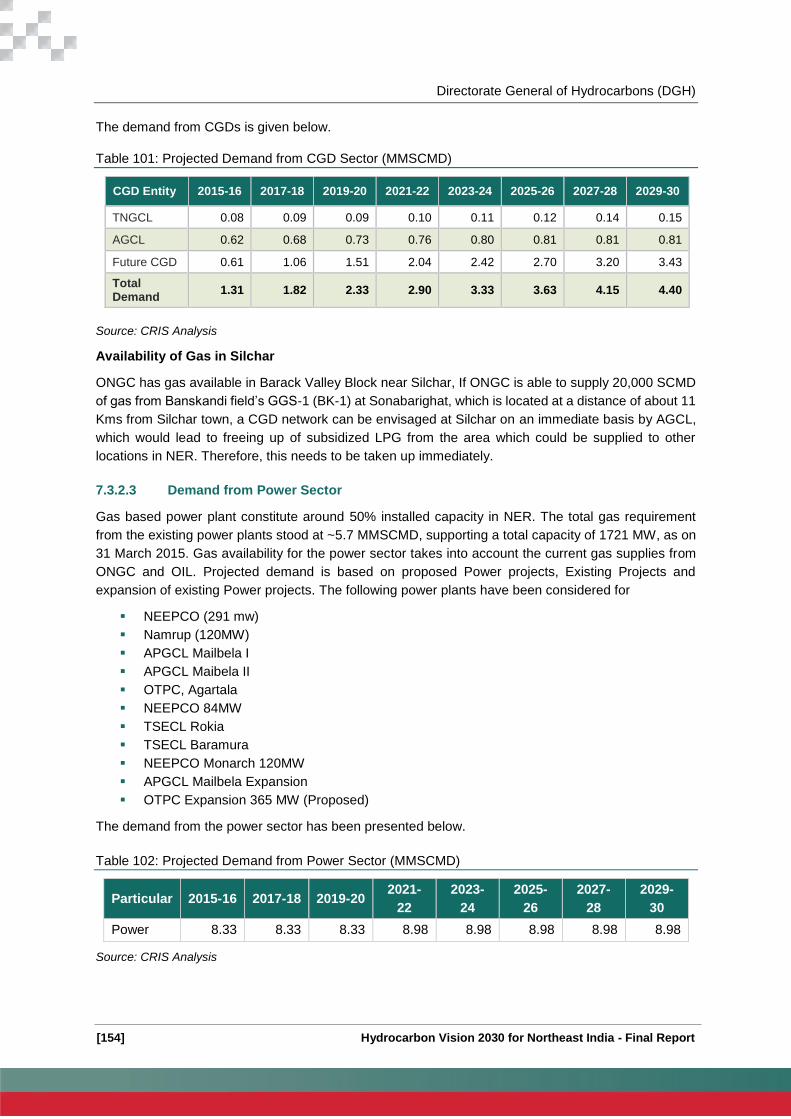
Directorate General of Hydrocarbons (DGH)
[154] Hydrocarbon Vision 2030 for Northeast India - Final Report
The demand from CGDs is given below.
Table 101: Projected Demand from CGD Sector (MMSCMD)
CGD Entity 2015-16 2017-18 2019-20 2021-22 2023-24 2025-26 2027-28 2029-30
TNGCL 0.08 0.09 0.09 0.10 0.11 0.12 0.14 0.15
AGCL 0.62 0.68 0.73 0.76 0.80 0.81 0.81 0.81
Future CGD 0.61 1.06 1.51 2.04 2.42 2.70 3.20 3.43
Total Demand
1.31 1.82 2.33 2.90 3.33 3.63 4.15 4.40
Source: CRIS Analysis
Availability of Gas in Silchar
ONGC has gas available in Barack Valley Block near Silchar, If ONGC is able to supply 20,000 SCMD
of gas from Banskandi field’s GGS-1 (BK-1) at Sonabarighat, which is located at a distance of about 11
Kms from Silchar town, a CGD network can be envisaged at Silchar on an immediate basis by AGCL,
which would lead to freeing up of subsidized LPG from the area which could be supplied to other
locations in NER. Therefore, this needs to be taken up immediately.
7.3.2.3 Demand from Power Sector
Gas based power plant constitute around 50% installed capacity in NER. The total gas requirement
from the existing power plants stood at ~5.7 MMSCMD, supporting a total capacity of 1721 MW, as on
31 March 2015. Gas availability for the power sector takes into account the current gas supplies from
ONGC and OIL. Projected demand is based on proposed Power projects, Existing Projects and
expansion of existing Power projects. The following power plants have been considered for
NEEPCO (291 mw)
Namrup (120MW)
APGCL Mailbela I
APGCL Maibela II
OTPC, Agartala
NEEPCO 84MW
TSECL Rokia
TSECL Baramura
NEEPCO Monarch 120MW
APGCL Mailbela Expansion
OTPC Expansion 365 MW (Proposed)
The demand from the power sector has been presented below.
Table 102: Projected Demand from Power Sector (MMSCMD)
Particular 2015-16 2017-18 2019-20 2021-
22
2023-
24
2025-
26
2027-
28
2029-
30
Power 8.33 8.33 8.33 8.98 8.98 8.98 8.98 8.98
Source: CRIS Analysis

Directorate General of Hydrocarbons (DGH)
[155] Hydrocarbon Vision 2030 for Northeast India- Final Report
7.3.2.4 Demand from Refineries
Gas demand from the refinery sector has been estimated considering the internal fuel consumption of
each refinery and the gas required for hydrogen production in the refining process. Natural gas can be
used in a refinery for various purposes like
Fuel for process and utility heaters
Feed and fuel for the hydrogen generation unit
Fuel for gas turbines
The current capacity of the refinery sector in Northeast India is 7 MMTPA. The demand for natural gas
from the refining sector stood at ~1 MMSCMD in 2014-15. Backed by better pipeline connectivity in the
coming years, the total demand for natural gas from the refining sector in Northeast India is expected
to reach around 5.0 MMSCMD by 2029-30.
Natural gas demand for the refining sector in Northeast India is given in the following table.
Table 103: Projected Demand from Refinery and related Sector (MMSCMD)
Particular 2015-
16
2017-
18
2019-
20
2021-
22
2023-
24
2025-
26
2027-
28
2029-
30
Total
Demand 1.3 2.1 2.6 5.0 5.0 5.0 5.0 5.0
Source: CRIS Analysis
Demand in 2029-30- IOCL Guwahati-0.5, IOCL Digboi 0.3, IOCL Bongaigaon 1.2, NRL- 3.0
7.3.2.5 Gas Demand from Industrial Consumers
Gas demand from industries was 2.00 MMSCMD in 2014-15. Expected Gas demand from the Industrial
consumers is going to be around 8.9 MMSCMD by 2029-30. Expected demand from other industries
such as paper mills, cement plants, brick kilns, tea plantations, steel industries and internal consumption
of ONGC and OIL have been considered to estimate demand from the Industrial segment. It is to be
noted that internal consumption of OIL and ONGC, to the tune of 1.95 MMSCMD, has been considered
under Industrial consumption.
Table 104: Projected Demand from Industrial Consumers (MMSCMD)
Particular 2015-
16
2017-
18
2019-
20 2021-22 2023-24 2025-26 2027-28 2029-30
Total
Demand 4.2 4.2 4.2 4.2 4.2 4.2 4.2 4.2
Source: CRIS Analysis

Directorate General of Hydrocarbons (DGH)
[156] Hydrocarbon Vision 2030 for Northeast India - Final Report
7.3.2.6 Gas Demand from Petrochemical plants and craker units
Gas demand from petrochemical plants and cracker units was 0.2 MMSCMD in 2014-15. Expected
Gas demand from the Industrial consumers is going to be around 5.5 MMSCMD by 2029-30.
Table 105: Projected Demand from Cracker Plants and plastic units (MMSCMD)
Particula
r
2015-
16
2017-
18
2019-
20
2021-
22
2023-
24
2025-
26
2027-
28
2029-
30
Total
Demand 1.5 1.9 1.9 1.9 1.9 2.45 3.1 3.1
Source: CRIS Analysis
Demand in 2029-30- APL 0.5, BCPL 1.38 and one more platic Park 1.2 (after 2025)
7.3.2.7 Gas Demand from Fertilizer Plants
Natural gas is used both as a feedstock and as a fuel in the fertilizer units. Apart from natural gas, urea
units utilise alternate fuels/feedstock such as naphtha and fuel oil/LSHS. The new fertilizer policy
mandates the conversion of such units to natural gas, and therefore, the same have been considered
as potential consumers of gas. Gas requirement from the existing fertilizer plants was 1.65 MMSCMD
in 2014-15. Expected demands from BCPL and expected plant of ONGC-CFL have been considered
to estimate demand form this segment.
Expected gas requirement for all the gas-based fertilizer plants is shown below.
Table 106: Projected Demand from Fertilizer Plants (MMSCMD)
Particula
r 2015-16 2017-18 2019-20 2021-22 2023-24 2025-26 2027-28 2029-30
Total
Demand 1.7 1.7 3.7 3.7 3.7 3.7 3.7 3.7
Source: CRIS Analysis
Fertilizer Plants considered are : BVFCL and CFL
7.3.2.8 Summary of Demand of Natural Gas in Northeast India
The table below summarizes the overall expected demand of natural gas in Northeast India till 2029-
30.
Table 107: Total projected demand of Natural Gas in Northeast India (MMSCMD)
Particular 2015-16 2017-18 2019-20 2021-22 2023-24 2025-26 2027-28 2029-30
CGD 1.3 1.8 2.3 2.9 3.3 3.6 4.1 4.4
Power 8.3 8.3 8.3 9.0 9.0 9.0 9.0 9.0
Refinery 1.3 2.1 2.6 5.0 5.0 5.0 5.0 5.0
Industry 4.2 4.2 4.2 4.2 4.2 4.2 4.2 4.2
Plastic 1.5 1.9 1.9 1.9 1.9 2.4 3.1 3.1
Fertilizer 1.7 1.7 3.7 3.7 3.7 3.7 3.7 3.7
Total
Demand 18.4 20.0 23.0 26.7 27.1 27.9 29.1 29.4
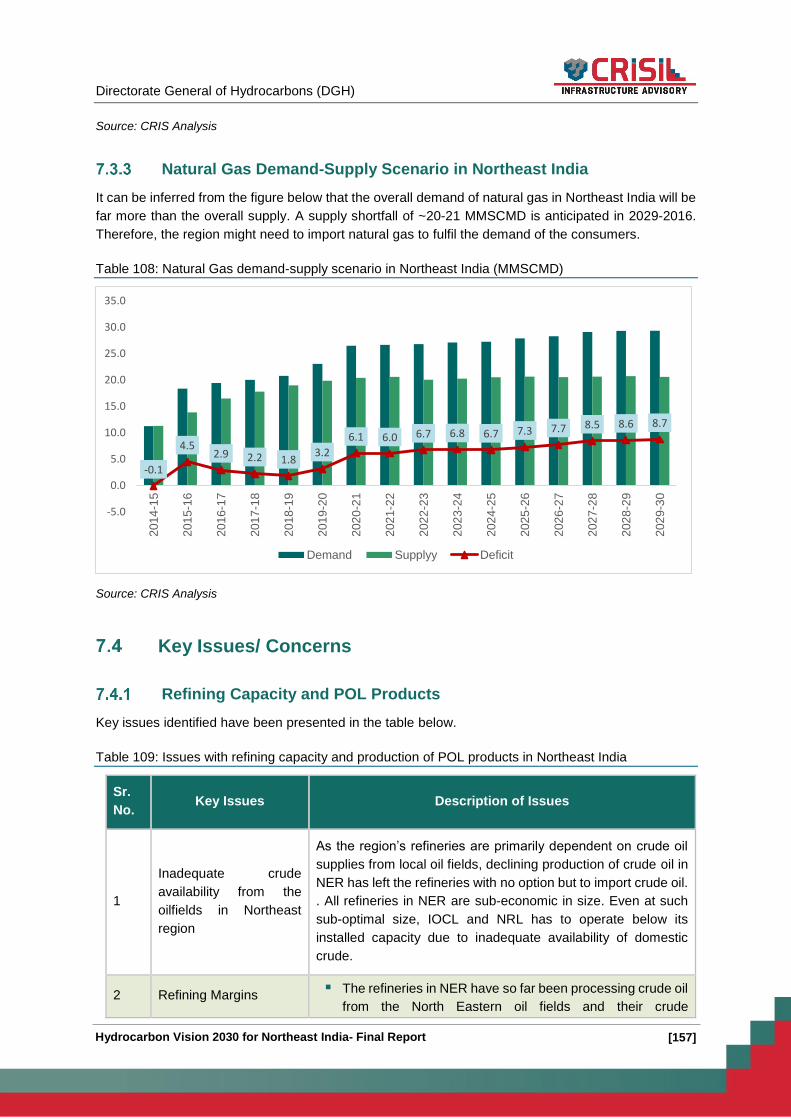
Directorate General of Hydrocarbons (DGH)
[157] Hydrocarbon Vision 2030 for Northeast India- Final Report
Source: CRIS Analysis
Natural Gas Demand-Supply Scenario in Northeast India
It can be inferred from the figure below that the overall demand of natural gas in Northeast India will be
far more than the overall supply. A supply shortfall of ~20-21 MMSCMD is anticipated in 2029-2016.
Therefore, the region might need to import natural gas to fulfil the demand of the consumers.
Table 108: Natural Gas demand-supply scenario in Northeast India (MMSCMD)
Source: CRIS Analysis
Key Issues/ Concerns
Refining Capacity and POL Products
Key issues identified have been presented in the table below.
Table 109: Issues with refining capacity and production of POL products in Northeast India
Sr.
No. Key Issues Description of Issues
1
Inadequate crude
availability from the
oilfields in Northeast
region
As the region’s refineries are primarily dependent on crude oil
supplies from local oil fields, declining production of crude oil in
NER has left the refineries with no option but to import crude oil.
. All refineries in NER are sub-economic in size. Even at such
sub-optimal size, IOCL and NRL has to operate below its
installed capacity due to inadequate availability of domestic
crude.
2 Refining Margins The refineries in NER have so far been processing crude oil
from the North Eastern oil fields and their crude
-0.1
4.52.9 2.2 1.8
3.2
6.1 6.0 6.7 6.8 6.7 7.3 7.7 8.5 8.6 8.7
-5.0
0.0
5.0
10.0
15.0
20.0
25.0
30.0
35.0
201
4-1
5
201
5-1
6
201
6-1
7
201
7-1
8
201
8-1
9
201
9-2
0
202
0-2
1
202
1-2
2
202
2-2
3
202
3-2
4
202
4-2
5
202
5-2
6
202
6-2
7
202
7-2
8
202
8-2
9
202
9-3
0
Demand Supplyy Deficit
Directorate General of Hydrocarbons (DGH)
[158] Hydrocarbon Vision 2030 for Northeast India - Final Report
Sr.
No. Key Issues Description of Issues
procurement prices are linked to the international market.
Therefore, price volatility in international market influences
their crude procurement prices as well. The North East
refineries, in particular, are sensitive to changes in duty
structure of crude and petroleum products. In June 2011,
government reduced customs duty on crude oil, MS and
HSD by 5%. This measure is not expected to have
significant impact on profitability of other refineries in the
country processing imported crude. With this change,
Northeast refineries are now at a disadvantageous position
vis-à-vis refineries processing imported crude oil as N-E
refineries are required to pay VAT at five per cent and entry
tax at two per cent. Refineries processing imported crude
oil do not have to pay anything as the incidence of customs
duty/sales tax for them is nil now.
The central government provides 50 per cent excise duty
concession in view of the sub-economic size and
geographically disadvantageous location for NER
refineries. In addition to these, enhancement in VAT rate
from four to five per cent on crude oil by the state
government and revision in pipeline charges by OIL for
Barauni-Bongaigaon section have adversely affected the
refineries of the region.
NER refineries are designed for processing only Assam
crude (Low Sulphur) and hence not capable of processing
of low-cost high sulphur crudes. Intake of imported low
sulphur crude to North East refineries adds to cost and
thereby affects profitability
NE refineries are not considered at par with other
consumers for grant of subsidy of 40%. Thus the natural
gas required as feed stock is costlier
Assam VAT act debars refineries from availing VAT credit
on raw material including chemical catalyst
Entry Tax which was earlier applicable only on Assam crude has
also been extended to Imported crude w.e.f. Feb, 2015. This has
an adverse impact on Bongaigaon refinery which is importing
crude oil to facilitate capacity utilisation of other NE refineries.
3 Inadequate Pipeline
Capacity
In order to achieve economic scale of operations, NRL has
mooted a plan for refinery expansion from 3 to 9 MMTPA
by processing imported crude oil. In same way, IOCL
Guwahati and IOCL Bongaigaon is also planning to expand
capacity from 1.0 to 1.7 and 2.35 to 4.5 MMTPA
respectively. However, as oil production from the region has
Directorate General of Hydrocarbons (DGH)
[159] Hydrocarbon Vision 2030 for Northeast India- Final Report
Sr.
No. Key Issues Description of Issues
already been declining; the additional refining capacity will
require imported oil from elsewhere in the country. The
inadequate pipeline capacity to import oil from other parts
of the country may prove to be a cause of concern.
Product pipelines in Northeast India are running at more
than 100% utilization. Further, due to capacity constraints
of these product pipelines, the refineries have been able to
transport only around 61% of their products through these
pipelines.
4 Market for POL
Products
Except for LPG, the other POL products produced by the
refineries in the region are already in excess of the demand from
the region. The further expansion of refinery capacity will
increase the surplus capacity to great extent. Therefore, finding
market for this surplus capacity will pose a challenge.
5 Limited Production of
LPG
The refineries in the region have not been able to produce
enough LPG to meet the local demand. In fact, the LPG
shortage has been escalating ever since. The limited LPG
processing capacity of the refineries in the region is a big
challenge.
6 Storage and Coverage
of LPG
The state-wise LPG storage figures in Northeast India in
terms of number of days are not very encouraging at
present. The storage capacity is more dismal for sates such
as Arunachal Pradesh, Nagaland, Meghalaya, Tripura and
Mizoram which have 0-2 day’s storage capacity.
LPG coverage in all India level is estimated to be around
65-70%, whereas in NER it is only 59% which is much lower
than the national average.
7 IOCL Digboi Specific
Issue
Encroachment on Refinery properties at Digboi: Digboi
refinery is facing serious problem of illegal/ unauthorized
encroachment in and around Digboi, including periphery
of oil installations of IOCL like the Refinery, New Tank
Farm (NTF), Nazirating Water Line and the Digboi -
Tinsukia Product Pipeline (DTPL). Encroachment over any
petroleum product pipeline is a grave safety and security
hazard. Any serious accident in the pipeline can have
a huge impact in terms of loss of life and property.
Delay in construction of the new tank firm and loading
gantry at Digboi due to land ownership issue: IOCL is
building up a new terminal at Golai near Digboi refinery on
a land acquired by IOCL. NOC from Deputy Commissioner,
Tinsukia was obtained in May2010 following which
construction works commenced for this Rs. 250 Crores

Directorate General of Hydrocarbons (DGH)
[160] Hydrocarbon Vision 2030 for Northeast India - Final Report
Sr.
No. Key Issues Description of Issues
project. Local Military Authority (LMA) claimed that a portion
of land totalling 3.03 acres within the proposed terminal
belonged to Army. The Local Military Authority (LMA) has
also made a simultaneous claim of additional 38.11 acres
land, under possession of IOCL, as Defence Land.
BG Railfed Petroleum Storage Depot at Moinarband
(Silchar): 2.56 acre for the approach road is under litigation.
State Govt may expedite handing over of this portion of land.
The project is also awaiting EC from Pollution Control Board,
Assam.
Natural Gas
Key issues identified have been presented in the table below.
Table 110: Issues with Natural Gas market in Northeast India
Sr.
No. Key Issues Description of Issues
1 Pipeline
Capacity
Capacities of existing pipelines are not sufficient to serve the local
demand as demand centers are not connected.
Moreover, the pipelines are available in limited areas in upper
Assam and lower part of Tripura. Due to non existence of pipeline
network gas is flared from different fields of ONGC, OIL and
Others.
2
Market
Development for
Natural gas
Most of the towns/cities in Northeast India have individual houses
which makes CGD connection economically unviable
Due to critical geographic location and lack of business (TNGCL is
the only CGD players in Northeast India that have CNG
infrastructure), there is hardly any base of vendors who support the
PNG and CNG Business. This results in much higher project as
well as O&M expenditure. Vendors are not easily available for PNG
material, CNG station construction job, spares related to CNG
Business and for calibration of instruments
There are very few small and medium scale industries in Tripura
resulting into very low business opportunity for any CGD entity
Since Agartala and cities in Assam are not planned cities, there are
no utility corridors to lay pipeline in most of the areas. Hence, the
asphalt roads need to be cut to lay pipelines; restoration of which
becomes very costly, increasing the project cost
The small size of commercial segment makes the MDP price
unaffordable for them. Hence, subsidized rate need to be made
applicable for those consumers
Directorate General of Hydrocarbons (DGH)
[161] Hydrocarbon Vision 2030 for Northeast India- Final Report
Key Action Areas
The action areas for improving the downstream segment have been presented below.
Refining capacity
Ensure adequate crude oil supply for the refineries
Refining margins
Increase consumption of POL products
Develop new markets for POL products
Increase production of LPG
Increase LPG penetration
Utilizing Naptha production
Developing northeast as a Wax production hub
Development of common user facility in NER
National waterways-2 for petroleum products
LNG skid mounting trucks
Co-operation between SAARC countries
Bio Ethanol Production
Increase demand for natural gas
Increase pipeline capacity
Offset LPG requirement with natural gas
Identifying new areas for CGD network
Development of end consumer segment
Refining Capacity
7.5.1.1 Ensure Adequate Crude oil Supply for the refineries
Declining production of crude oil in the Northeast region is a matter of concern. Total crude oil production
in Northeast India is about 4.54 MMTPA, whereas the refinery capacity is about 7 MMTPA. Therefore,
the refineries in the region, as a whole, have surplus installed capacity. Hence, to run at 100% utilization
crude oil is being imported from other parts of the country. Further, Numaligarh Refinery Ltd (NRL) and
IOCL has been planning to expand its refining capacity from 3 MMTPA to 9 MMTPA by 2020 (NRL) and
1.0 to 1.7 MMTPA (IOCL Guwahati), 2.35 to 4.5 MMTPA (IOCL Bongaigaon).
Therefore to ensure crude oil supply in the refineries of the region Paradip-Siliguri-Bongaigaon-
Numaligarh imported crude oil pipeline network need to be planned and implemented.
7.5.1.2 Modernization of OIL Pipeline Capacity
Oil India pipeline between Barauni to Bongaigaon of 3.0 MMTPA capacity is being modernised and
capacity of this line will be reduced to 2 MMTPA from the present level of 3 MPTA from April’16 as two
intermediate pump stations will be taken out from the system. In view of decline in NER crude
availability, capacity utilisation of North East Refinery depends on imported crude supply through this
pipeline. In case of reduction in capacity of the pipeline, NE refineries may starve of crude oil. It was
suggested that Oil India should ensure that NE refineries do not starve on account of de-rating of this
Directorate General of Hydrocarbons (DGH)
[162] Hydrocarbon Vision 2030 for Northeast India - Final Report
Barauni Bongaigaon pipeline. If required, Oil India to commission the new facilities to check the
guarantee and thereafter revert to old pumping system to ensure full supply of imported crude oil to NE
refineries. In the mean-time Oil India is planning to take steps to enhance capacity of the pipeline back
to 3.0 MMTPA by way of modernising the two intermediate pump stations which are proposed to be
taken out from the system, and putting them on stream.
7.5.1.3 Refining Margins
VAT & Entry Tax: In June 2011, government reduced customs duty on crude oil, MS and HSD by 5%.
With this change, Northeast refineries are at a disadvantage vis-à-vis refineries processing imported
crude oil, as N-E refineries are required to pay VAT at 5% and entry tax 2% per cent. Refineries
processing imported crude oil do not have to pay anything as the incidence of customs duty/sales tax
for them is nil now. Therefore, the Government of India and state governments needs to take
appropriate steps to reduce VAT or entry tax so that the refining margins of the North-eastern refineries
do not suffer.
Stream Exhange: To facilitate the sharing of intermediate products within four NE refineries (in order
to optimize cost and improve product yield), suitable exemption from levy of tax may be provided at first
point even for those category of sale where goods are used by the buyer for further processing. This
can be done by incorporating a clarification to the effect that VAT is not applicable for exchange/sale of
any intermediaries to be used as raw material to produce finished petroleum products. Such exemption
also needs to be extended to Entry Tax and all other local levies, which otherwise also is paid at the
time of sourcing of raw material by the dispatching Companies. Alternatively the tax on input may also
be permitted to be set off against tax on output.
Increasing consumption of POL Products
7.5.2.1 Develop new market for POL products
The surplus POL products generated from the refinery of the Northeast India can primarily be exported
to Bangladesh and Myanmar while part quantities are envisaged to be utilized for production of
petrochemical grade Naphtha for which adequate demand exists within the country. Therefore, steps
needs to be taken to create pipeline infrastructure in collaboration with the neighbouring countries.
7.5.2.2 Increase Production of LPG
The refineries in the region do not have sufficient LPG production capacity. Therefore, the refiners in
the region must look to increase LPG production capacity by induction of new technology or with further
capacity addition.
In order to increase LPG production, Indian Oil Corporation Limited (IOCL) has commissioned an
Indmax Unit (a technology developed by IndianOil’s R&D Centre for upgrading heavy ends to LPG
gasoline and diesel), in Guwahati Refinery in June 2003. Such technologies can be shared with other
refineries in the region so that production of LPG can be enhanced.
7.5.2.3 Increase LPG penetration
LPG penetration in NER is lowest among all areas of India. Indian penetration is around 65-70% while
NER Penetration is 59% with Meghalaya having lowest of 35%. Assam has maximum consumers of
LPG however the penetration is below the national average.
IOCL is proposing to lay LPG pipeline to address the supply scenario in remote areas in NER. The
proposed pipeline will connect Numaligarh refinery of Assam with Imphal in Manipur. This connectivity
to Imphal through the pipeline, LPG can also be supplied to Dimapur BP, Sekmai BP and further nodal

Directorate General of Hydrocarbons (DGH)
[163] Hydrocarbon Vision 2030 for Northeast India- Final Report
movementto Mualkhang BP (in Mizoram), for which, Sekmai BP can be used as nodal point for loading
tankers. The pipeline connectivity will ensure uninterrupted supply, which, in turn would also reduce
dependence on road for LPG transportation.
Strategies for Meeting Long-term LPG Demand
Given the inherent constraints of refinery production, wherein a fixed slate of products is available
depending on the configuration, there is a limitation to which LPG production (which is around 4% of
refinery production) can be maximized. Increase in capacity to augment LPG production will also lead
to higher production of other products, mainly MS & HSD, which also have to find their markets and
related logistics are to be developed, either for evacuation or absorption.
In this context, the strategy for tackling the projected demand has to be multi-pronged as broadly
described below:
Utilization of natural gas locally available within NER for substitution of mainly LPG
Increase the capacity of NER refineries
Addressing the issues of decreasing trend of crude production within NER & increased demand
of crude oil for the expanded/new refineries
Creation of an intra-regional pipeline grid to ensure uninterrupted supplies of petroleum products
Development of marketing infrastructure in NER in keeping with increased demand
Imports of LPG directly to NER via Chittagong Port, Bangladesh
Each of these above approaches has been elaborated in various sections of the report as described
below:
Approach on utilization of natural gas locally available within NER for substitution of mainly LPG
is described below
Approach on increase the capacity of NER refineries is described in section 7.1.3
Approach on addressing the issues of decreasing trend of crude production within NER &
increased demand of crude oil for the expanded/new refineries is described in section 7.1.3
Approach on creation of an intra-regional pipeline grid to ensure uninterrupted supplies of
petroleum products is described in section in section 6.3
Approach to development of marketing infrastructure in NER in keeping with increased demand
is described in section 7.2.6
Imports of LPG directly to NER via Chittagong Port, Bangladesh is described below
Utilization of natural gas locally available within NER for substitution of mainly LPG
Natural Gas production in NER is expected to witness a major scale up. As per ONGC, OIL- the two
main E&P Operators in NER, natural gas production is estimated to increase from 13.9 mmscmd in
2015-16 to 20.6 mmscmd in 2029-30. Significant part of this increased quantity is likely to come from
two major sources – Tripura fields and A&AA. During the reference period, in case of Tripura, the
bottling quantity is likely to go up from 3.1 mmscmd to 8.4 mmscmd, registering an increase of more
than 60 percent. In case of Assam & Assam-Arakan (A&AA) fields, the increase is likely to the extent
of 2 mmscmd from near negligible levels today. This increase offers a sizeable opportunity for
absorption and monetization of this increased gas availability in industrial, commercial, transport &
domestic applications. It is imperative to develop a full-scale gas distribution network in NER. Allocation
of this increased availability of natural gas for CGD on priority has to be therefore considered by the
Govt.
The following options are therefore proposed:
Gas from Upper Assam Fields (A&AA)

Directorate General of Hydrocarbons (DGH)
[164] Hydrocarbon Vision 2030 for Northeast India - Final Report
In view of the enhancement in gas production and projected LPG deficit in NER, a case for a gas
pipeline from Upper Assam fields (near Duliajan) to Bongaigaon via Guwahati and associated CGD
networks is highly impelling.
At present, the Duliajan - Numaligarh gas pipeline with capacity of 1 mmscmd capacity is operated by
M/s DNPL a JV between Assam Gas Company Ltd (AGCL), NRL & OIL. In fact, AGCL is looking forward
to extend the pipeline to Guwahati and subsequently to New Bongaigoan depending on the availability
of gas in the upper Assam gas fields. AGCL is currently authorized to supply PNG to the Upper Assam
Geographical Area, upto Golaghat District.
In order to maximize the usage of gas and to enhance project viability, Guwahati & Bongaigaon
refineries may be considered as major anchor loads, which between them can absorb 1MMSCMD of
gas, with their existing capacities. Additionally, this pipeline will travel through major demand centres of
Assam such as Nagaon, Guwahati, Nalbari, Bongaigaon, Kokrajhar & Dhubri, which together account
for around 125 TMTPA of Domestic LPG usages (equivalent to 0.5 mmscmd of gas). Currently, the
LPG penetration in Assam is around 55%. The projected LPG demand for NER is based on the target
of 80% coverage by 2029-30. Further, a large part of the projected LPG demand in NER is expected to
come from these major demand centres in Assam and along with the adjoining suburban areas. In this
context, a strategy for bridging the deficit in LPG could be through fuel substitution, i.e. moving from
LPG to PNG. Accordingly, spur lines on Duliajan-Numaligarh-Guwahti-Bongaigaon for supplying to
domestic customers through CGD networks could work out as an attractive proposition, given the high
demand potential. At the same time, this will alleviate the pressure on LPG demand. In addition, the
automotive and industrial sectors like the vast tea gardens of Assam could also be supplied through the
CGD network, thereby further enhancing the viability of CGD operations in these areas. PNGRB may
consider, adding further Geographical Areas beyond Golaghat District and Bongaigaon.
Gas from Tripura fields
Production of Tripura Gas is expected to see a major scale-up. It is proposed to lay two major cross-
country gas pipelines from Tripura gas fields to Guwahati with spur lines connecting to Mizoram and
Manipur. Presently, LPG demand in Tripura is in the tune of 31 TMTPA. CGD networks along these two
proposed gas pipelines could cater to the present combined (Tripura, Barrak valley & Mizoram) LPG
demand of around 100 TMTPA (equivalent to 0.365 mmscmd of gas).
These pipelines based on enhanced Tripura Gas will alleviate the pressure on LPG demand by fuel
substitution.
Imports of LPG directly to NER via Chittagong Port, Bangladesh
Chittagong (Bangladesh) to Sabrum (Tripura) LPG Pipeline
Presently LPG deficit in the NER is met through imports received at Haldia and other ports and
transported through Tank trucks. Considering the location advantage, Govt. of Tripura has already
undertaken to construction of a bridge over Feni river in Tripura to access Chittagong port in Bangladesh
for movement of heavy machinery for NER. Developing an all weather access for import of LPG at
Chittagong port can be explored thereafter.
Once the import facility is developed at Chittagong port, LPG can be transported thereafter through a
pipeline connecting it to Sabrum in Tripura. This Chittagong-Sabrum 172 KM pipeline could
considerably reduce transportation costs and time. At Sabrum a bulk storage facility would need to be
created and bulk LPG movementwill be through tank trucks and will be transported to Vishalgarh LPG
plant in Tripura, Silchar BP in Assam, & Aizawl BP.
Summary of LPG Demand/Supply in Northeast India

Directorate General of Hydrocarbons (DGH)
[165] Hydrocarbon Vision 2030 for Northeast India- Final Report
The total LPG demand is expected to reach 1100-1200 TMTPA by 2030 in NER considering 80%
penetration and 1500 TMTPA considering universal availability and access to all It is expected that LPG
production from existing sources as well as from envisaged capacity additions will be approximately
806 TMTPA. Further production from Upper Assam Fields and enhanced production from Tripura Gas
Fields will take the total supply to 1010 TMTPA level, which will match the demand.
Table 111: LPG Balance in 2030
Particulars Figures in TMTPA
Demand (with 80% penetration) 1,203
Demand (Access to all) 1,504
Supply
IOCL Digboi LPG Production 9
IOCL Guwahati LPG Production 66
IOCL Bongaigaon 415
Expansion in NRL (6 MMTPA) 316
Total (Supply) 806
Gas from Upper Assam 100
Gas from Tripura Fields 125
Grand Total (Supply) 1031
Shortage (TMTPA) with 80% penetration 397
Shortage (TMTPA) with access to all 698
LPG shortfall could be made up through LPG imports at Chittagong Port, Bangladesh to Tripura
However, in another scenario, if additional gas from Upper Assam Field and Tripura Gas Field is not
available, the shortfall of approximately 225 TMTPA may be met through import. It may be possible to
import gas from Chittagong to Sabrum through a dedicated gas pipeline which can further meet the
demand in Agartala, Barak Valley and Aizawl. Additional bottling and storage infrastructure need to be
created in these areas in this case.
LPG storage facility at Chittagong (Bangladesh)
Bangladesh Petroleum Corporation is planning to set up a 1 lakh MT LPG bottling plant in Chittagong
which will be completely import-based. Presently, close to 80,000 MT of LPG is imported in Bangladesh.
Currently the Chittagong port has a bottling capacity of 10,000 MT of LPG per shift per year.
The new LPG plant at Chittagong will be installed on 10 acres of land with LPG import facilities and
storage tanks. The facility is planned to be setup under the PPP mode by Bangladesh Government.
The current port handling facility available at Chittagong port for all type of imports is given below:

Directorate General of Hydrocarbons (DGH)
[166] Hydrocarbon Vision 2030 for Northeast India - Final Report
Table 112: Port handling facilities at Chittagong Port
Facility Capacity (No of births)
For Ocean going vessels
General Cargo births 6
Container Births 11
Dolphin oil jetty for POL products 3
Grain Silo Jetty 1
Cement Clinker Jetty 1
TSP jetty 1
CUFL Jetty 1
KAFCO Urea Jetty 1
Ammonia Jetty 1
For Inland coastal vessels
Jetty births for POL 1
Concrete Berths (Grains) 1
Pontoon berths for POL 3
Pontoon berths for cement 1
Single point mooring 14
Source: CPA
Cargo storage space available at Chittagong port
Below is the chart of Cargo storage space already available at Chittagong Port.
Table 113: Cargo Storage space available at Chittagong Port
Protected Area Nos. Sq. Meter
Transit sheds 1-9 9 64,364.70
Warehouses D,F,P,O 4 20,712.41
Car Sheds (P Shed & F Shed) 1 8,696.63
Open Dumps - 90,000.00
Outside Protected Area: Nos. Sq. Meters
Warehouses 6 25,179.36
Open Dumps - 2.00
Source: CPA

Directorate General of Hydrocarbons (DGH)
[167] Hydrocarbon Vision 2030 for Northeast India- Final Report
7.5.2.4 Uses of Naphtha
Naphtha production from North East Region is expected to be around 0.48 MMT after all refinery
expansion projects are completed. Naphtha finds a wide variety of uses in production of fertilizers and
petrochemicals. Some of the major uses of naphtha are listed below:
Naphtha is used as a feedstock for production of intermediate petrochemical products such as
Ethylene, Propylene, Butadiene and Benzene.
Naphtha is also used as a solvent in various industries
In production of fertilizers (Urea)
Industries like petrochemical and fertilizer plants which consume naphtha as a feedstock can be built
at nearby locations which can consume the Naphtha produced from the NER region.
Table 114: Production forecast of Naptha in Northeast India (TMTPA)
Year 2014-15 2020-21 2024-25 2029-30
Quantity
(TMTPA) 294 292 292 292
Source: CRIS Analysis
7.5.2.5 Developing northeast as a Wax production hub
Crude oil produced from North East Region has high wax content; hence the region has been developed
as a major wax producing area. North East has two Paraffin Wax producing units located at IOCL’s
Digboi refinery producing 60,000 TMPA and at Numaligarh refinery producing 50,000 TPA of paraffin
wax and these two together contributes for majority of wax production in the country.
In view of such large availability of wax in the region, Government of India may formulate policies to
incentivize industries to set up downstream units which consume wax as raw material. Some industries
which use paraffin wax as a feedstock are tyre manufacturing, small scale candle manufacturing units,
pharmaceuticals and cosmetic industries.
Since, candle manufacturing is not capital intensive and requires minimal resources; North East can be
developed as a candle manufacturing hub for the country. Proximity with countries such as Bangladesh,
Myanmar, Nepal and Bhutan would ensure a ready market for export for these small scale industries.
Already India, Nepal, Bhutan and Bangladesh have signed a landmark Motor Vehicles Agreement
(MVA) for the Regulation of Passenger, Personnel and Cargo Vehicular Traffic among the four South
Asian neighbors. The agreement paves way for a seamless movement of people and goods across
their borders for the benefit and integration of the region and its economic development.
7.5.2.6 Development of Common User Facility (CUF) in NER
North East Region has a difficult terrain and therefore associated logistics cost for transporting of
petroleum products in any of the North East state is high. Only IOCL has depot infrastructure in all North
East states other than Assam for storage of POL products. None of the other oil marketing companies
(OMC) have any such storage facility in the region, since demand for POL products in any of the north
eastern states is not very high and therefore it is not economical for any individual oil company to
operate Depots in all these states, which leads to:
Higher freight cost: OMCs are taking product to their Retail Outlets directly from the refineries by
tankers, thus incurring higher freight cost.
There is no safety stock to meet exigency in demand and supply.

Directorate General of Hydrocarbons (DGH)
[168] Hydrocarbon Vision 2030 for Northeast India - Final Report
To overcome the problems related to logistics and high operational costs mentioned as above, we
recommend:
In order to achieve economies of scale by integration of volume, we propose development of
common marketing facilities in NER which can be shared by all of the individual OMCs.
Depots for storage of POL products can be built by considering demand of entire State and
individual OMCs can book storage space on lease to cater to their own demand in the state. The
depots can be connected by a pipeline as a common carrier or connected to the nearest Rail
network.
7.5.2.7 National Waterways-2 for Petroleum products
Development of NW-2 through Bangladesh for easy movement is expected to prove critical for POL
products to Bangladesh. The river Brahmaputra having a length of 891 Km between Bangladesh Border
and Sadiya was declared as National Waterway no. 2 (NW-2). Advantages of using NW-2 as compared
to Roads and Railways have been presented below:
Particulars Water ways Road Railway
1 Horsepower Moves 4000 kg Moves 150 kg Moves 500 kg
1 Litre Fuel Runs 105 t-km Runs 24 t-km Runs 85 t-km
Source: CRIS analysis
Costs of developing waterways are much lower than railway and road. Further, the waterway
transportation is environmentally friendlier than road and railways as it consumes lower fuel to traverse
the same distance. The average CO2 emission in waterway transportation is 50% lesser than that of
road transportation. Further, as road and railway network requires land acquisition, the process is much
more time consuming. Moreover, by developing NW-2, a trade corridor can be created for economic
import / export of goods in and out of the region, including export of petroleum product. This will facilitate
industrialization of NE region. The figure below provides map of NW-2.
Figure 51: National Waterways- 2
7.5.2.8 Cascading of Gas
The flaring of gas is mainly due to 3 reasons:
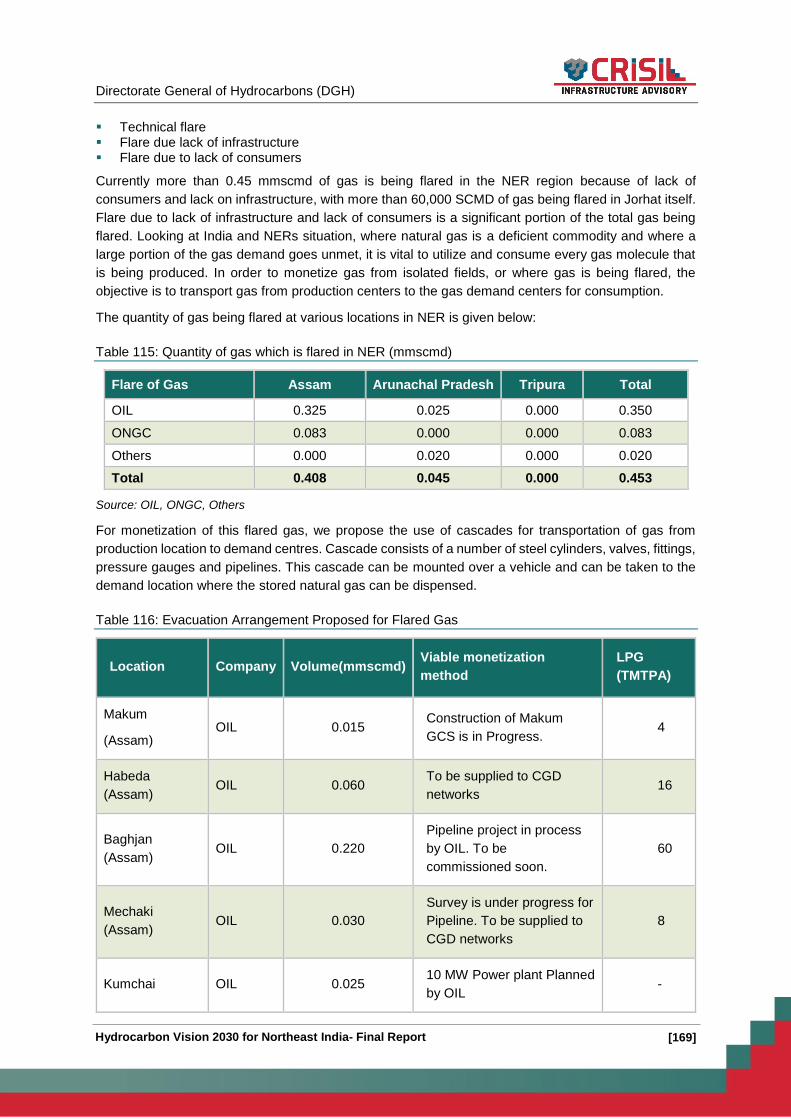
Directorate General of Hydrocarbons (DGH)
[169] Hydrocarbon Vision 2030 for Northeast India- Final Report
Technical flare Flare due lack of infrastructure Flare due to lack of consumers
Currently more than 0.45 mmscmd of gas is being flared in the NER region because of lack of
consumers and lack on infrastructure, with more than 60,000 SCMD of gas being flared in Jorhat itself.
Flare due to lack of infrastructure and lack of consumers is a significant portion of the total gas being
flared. Looking at India and NERs situation, where natural gas is a deficient commodity and where a
large portion of the gas demand goes unmet, it is vital to utilize and consume every gas molecule that
is being produced. In order to monetize gas from isolated fields, or where gas is being flared, the
objective is to transport gas from production centers to the gas demand centers for consumption.
The quantity of gas being flared at various locations in NER is given below:
Table 115: Quantity of gas which is flared in NER (mmscmd)
Flare of Gas Assam Arunachal Pradesh Tripura Total
OIL 0.325 0.025 0.000 0.350
ONGC 0.083 0.000 0.000 0.083
Others 0.000 0.020 0.000 0.020
Total 0.408 0.045 0.000 0.453
Source: OIL, ONGC, Others
For monetization of this flared gas, we propose the use of cascades for transportation of gas from
production location to demand centres. Cascade consists of a number of steel cylinders, valves, fittings,
pressure gauges and pipelines. This cascade can be mounted over a vehicle and can be taken to the
demand location where the stored natural gas can be dispensed.
Table 116: Evacuation Arrangement Proposed for Flared Gas
Location Company Volume(mmscmd) Viable monetization
method
LPG
(TMTPA)
Makum
(Assam) OIL 0.015
Construction of Makum
GCS is in Progress. 4
Habeda
(Assam) OIL 0.060
To be supplied to CGD
networks 16
Baghjan
(Assam) OIL 0.220
Pipeline project in process
by OIL. To be
commissioned soon.
60
Mechaki
(Assam) OIL 0.030
Survey is under progress for
Pipeline. To be supplied to
CGD networks
8
Kumchai OIL 0.025 10 MW Power plant Planned
by OIL -
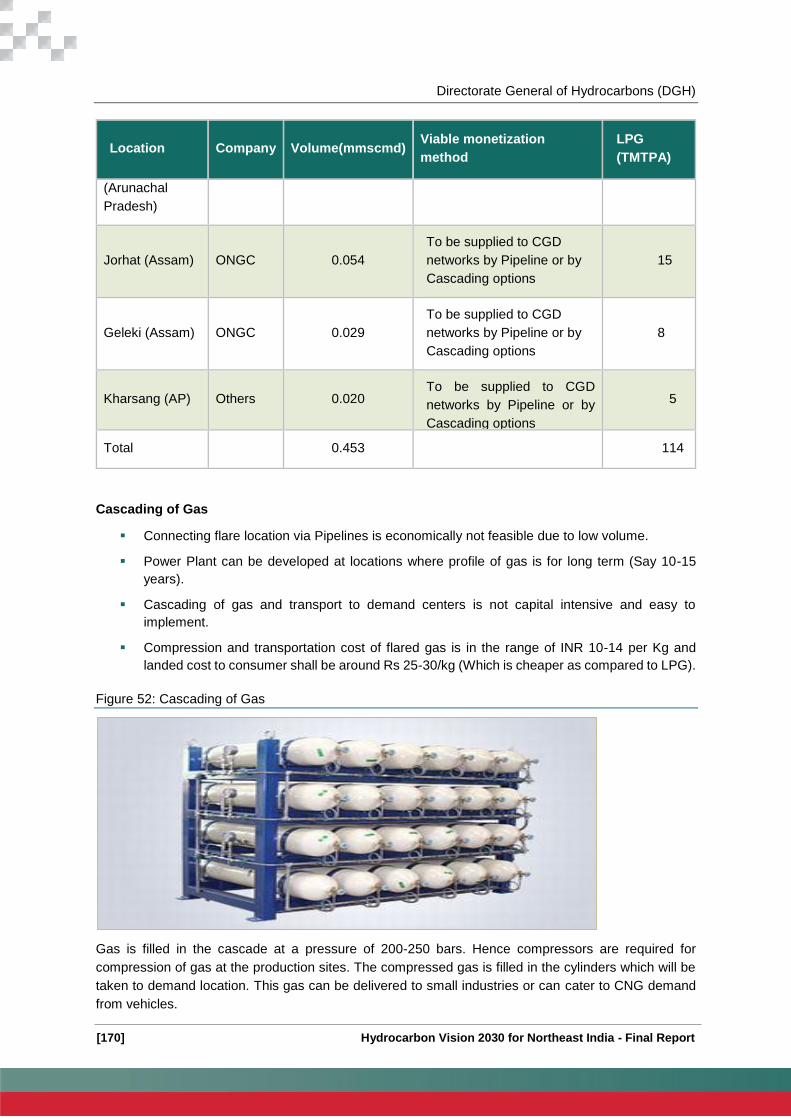
Directorate General of Hydrocarbons (DGH)
[170] Hydrocarbon Vision 2030 for Northeast India - Final Report
Location Company Volume(mmscmd) Viable monetization
method
LPG
(TMTPA)
(Arunachal
Pradesh)
Jorhat (Assam) ONGC 0.054
To be supplied to CGD
networks by Pipeline or by
Cascading options
15
Geleki (Assam) ONGC 0.029
To be supplied to CGD
networks by Pipeline or by
Cascading options
8
Kharsang (AP) Others 0.020 To be supplied to CGD
networks by Pipeline or by
Cascading options
5
Total 0.453 114
Cascading of Gas
Connecting flare location via Pipelines is economically not feasible due to low volume.
Power Plant can be developed at locations where profile of gas is for long term (Say 10-15
years).
Cascading of gas and transport to demand centers is not capital intensive and easy to
implement.
Compression and transportation cost of flared gas is in the range of INR 10-14 per Kg and
landed cost to consumer shall be around Rs 25-30/kg (Which is cheaper as compared to LPG).
Figure 52: Cascading of Gas
Gas is filled in the cascade at a pressure of 200-250 bars. Hence compressors are required for
compression of gas at the production sites. The compressed gas is filled in the cylinders which will be
taken to demand location. This gas can be delivered to small industries or can cater to CNG demand
from vehicles.

Directorate General of Hydrocarbons (DGH)
[171] Hydrocarbon Vision 2030 for Northeast India- Final Report
7.5.2.9 LNG Skid Mounting Trucks
There is surplus gas available which is flared in some of the blocks that are not connected with pipeline
network. As demand for natural gas exceeds the supply, such sources can be utilized with the help of
latest technology. The gas can then be supplied to small scale industries such as tea gardens, brick
kilns, paper industry etc. using LNG skid mounting trucks.
However, the technology is quite costly as of now as it requires multiple conversion before the gas can
be put to use. The process of multiple conversions has actually increased the landed cost of gas to end
consumer- which makes it unattractive for the small scale industries. Further, volume of flared gas is
also not sufficient enough to achieve economies of scale, the connectivity issues in the region
challenges transportation of gas through road. Therefore, monetization of flared gas will require financial
support such as VGF from the government.
Figure 53: Flared Gas transportation by using LNG Skid Mounting trucks
7.5.2.10 Co-operation between SAARC Countries
NER has surplus POL capacity which is transported to Bihar, UP and West Bengal. This is a costlier
proposition as transportation cost is quite significant. Bangladesh and Myanmar are net importer of
POL products, therefore surplus products from NER refineries can be exported to Bangladesh and
Myanmar. The table below depicts the surplus capacity of the refineries in Northeast India vis-à-vis
demand potential for POL products from the neighbouring countries.
Table 117: Demand potential of POL products in neighbouring countries (MMTPA)
Country 2014-15 2019-2020 2024-25 2029-30
Demand Potential in neighbouring countries
Myanmar 2.00 1.25 1.00 0.75
Bangladesh 4.00 4.00 3.60 5.40
Nepal 1.40 1.70 2.07 2.52
Bhutan 0.10 0.12 0.15 0.18
Sri Lanka 2.00 1.50 2.50 3.50
Total Demand
Potential for POL
products
9.50 8.57 9.32 12.35
Supply Potential in NER
Production Capacity
(POL) 6.5 7.0- 14.3 14.3
Demand from NER 3.20 4.0 5.4 7.3
Surplus POL Available 3.3 3.0 8.9 7.0
Source: CRIS Analysis
Flared GasConversion
to LNGLNG Trucks
Re-conversion
Supply to end
consumer
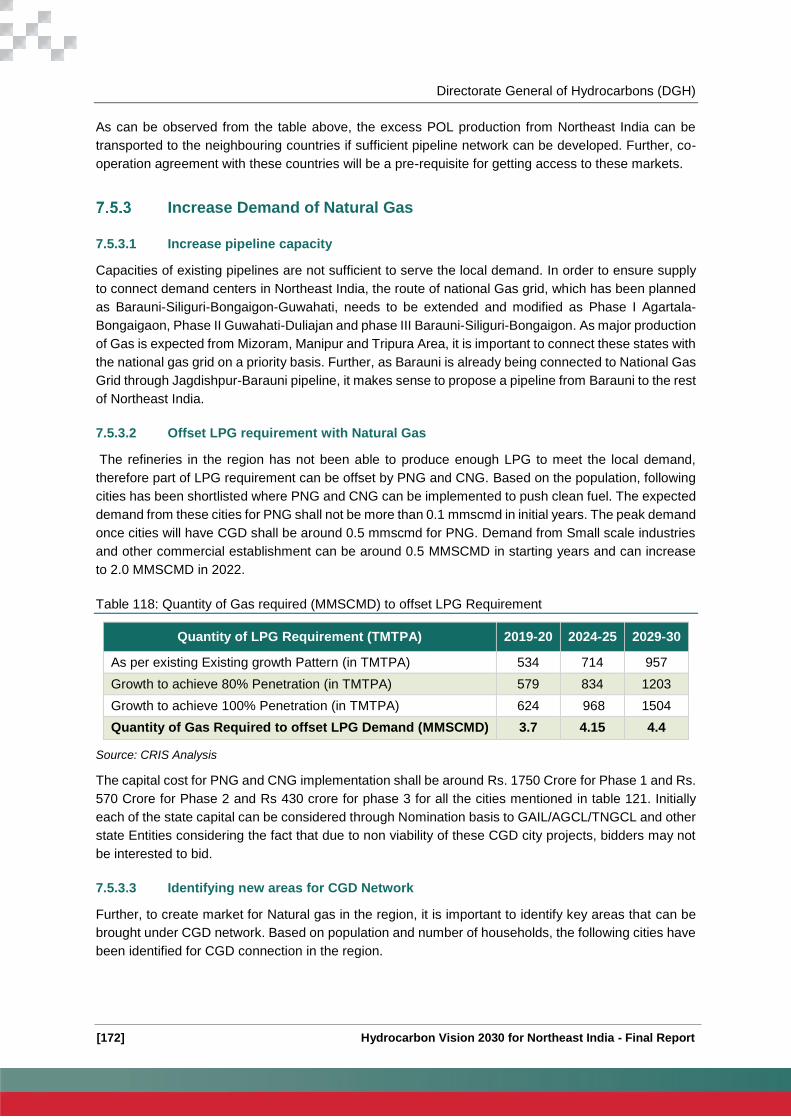
Directorate General of Hydrocarbons (DGH)
[172] Hydrocarbon Vision 2030 for Northeast India - Final Report
As can be observed from the table above, the excess POL production from Northeast India can be
transported to the neighbouring countries if sufficient pipeline network can be developed. Further, co-
operation agreement with these countries will be a pre-requisite for getting access to these markets.
Increase Demand of Natural Gas
7.5.3.1 Increase pipeline capacity
Capacities of existing pipelines are not sufficient to serve the local demand. In order to ensure supply
to connect demand centers in Northeast India, the route of national Gas grid, which has been planned
as Barauni-Siliguri-Bongaigon-Guwahati, needs to be extended and modified as Phase I Agartala-
Bongaigaon, Phase II Guwahati-Duliajan and phase III Barauni-Siliguri-Bongaigon. As major production
of Gas is expected from Mizoram, Manipur and Tripura Area, it is important to connect these states with
the national gas grid on a priority basis. Further, as Barauni is already being connected to National Gas
Grid through Jagdishpur-Barauni pipeline, it makes sense to propose a pipeline from Barauni to the rest
of Northeast India.
7.5.3.2 Offset LPG requirement with Natural Gas
The refineries in the region has not been able to produce enough LPG to meet the local demand,
therefore part of LPG requirement can be offset by PNG and CNG. Based on the population, following
cities has been shortlisted where PNG and CNG can be implemented to push clean fuel. The expected
demand from these cities for PNG shall not be more than 0.1 mmscmd in initial years. The peak demand
once cities will have CGD shall be around 0.5 mmscmd for PNG. Demand from Small scale industries
and other commercial establishment can be around 0.5 MMSCMD in starting years and can increase
to 2.0 MMSCMD in 2022.
Table 118: Quantity of Gas required (MMSCMD) to offset LPG Requirement
Source: CRIS Analysis
The capital cost for PNG and CNG implementation shall be around Rs. 1750 Crore for Phase 1 and Rs.
570 Crore for Phase 2 and Rs 430 crore for phase 3 for all the cities mentioned in table 121. Initially
each of the state capital can be considered through Nomination basis to GAIL/AGCL/TNGCL and other
state Entities considering the fact that due to non viability of these CGD city projects, bidders may not
be interested to bid.
7.5.3.3 Identifying new areas for CGD Network
Further, to create market for Natural gas in the region, it is important to identify key areas that can be
brought under CGD network. Based on population and number of households, the following cities have
been identified for CGD connection in the region.
Quantity of LPG Requirement (TMTPA) 2019-20 2024-25 2029-30
As per existing Existing growth Pattern (in TMTPA) 534 714 957
Growth to achieve 80% Penetration (in TMTPA) 579 834 1203
Growth to achieve 100% Penetration (in TMTPA) 624 968 1504
Quantity of Gas Required to offset LPG Demand (MMSCMD) 3.7 4.15 4.4
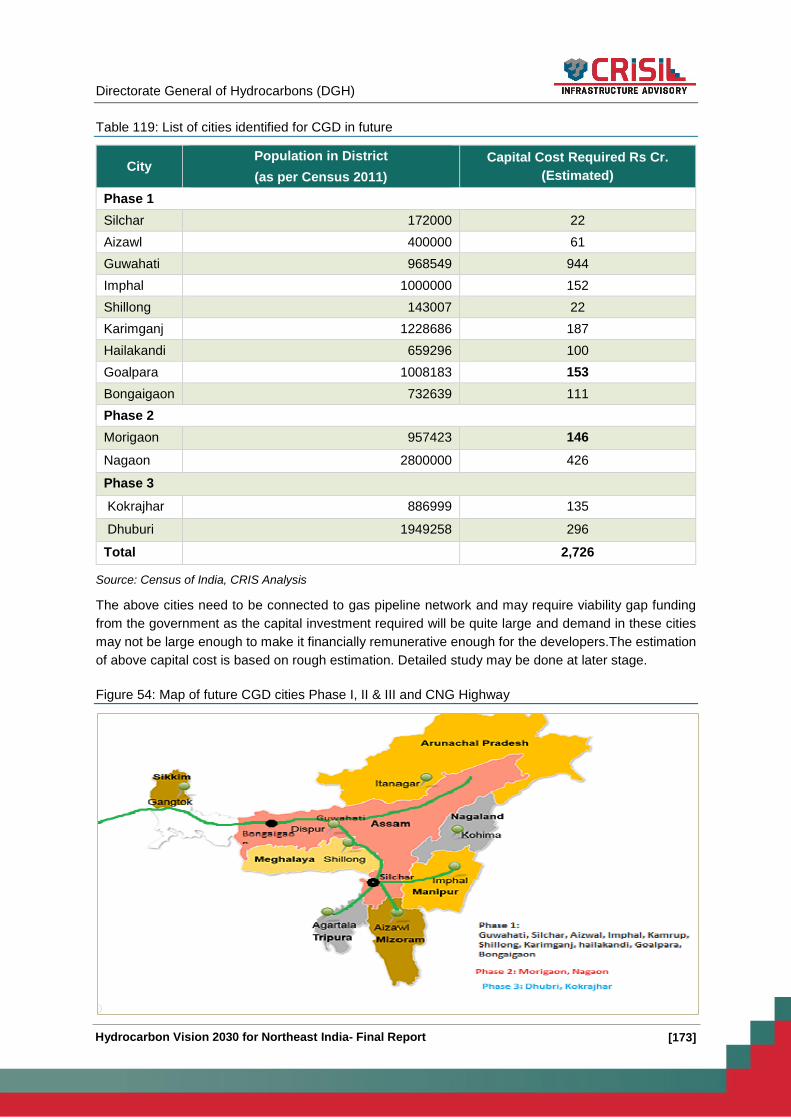
Directorate General of Hydrocarbons (DGH)
[173] Hydrocarbon Vision 2030 for Northeast India- Final Report
Table 119: List of cities identified for CGD in future
City Population in District
(as per Census 2011)
Capital Cost Required Rs Cr.
(Estimated)
Phase 1
Silchar 172000 22
Aizawl 400000 61
Guwahati 968549 944
Imphal 1000000 152
Shillong 143007 22
Karimganj 1228686 187
Hailakandi 659296 100
Goalpara 1008183 153
Bongaigaon 732639 111
Phase 2
Morigaon 957423 146
Nagaon 2800000 426
Phase 3
Kokrajhar 886999 135
Dhuburi 1949258 296
Total 2,726
Source: Census of India, CRIS Analysis
The above cities need to be connected to gas pipeline network and may require viability gap funding
from the government as the capital investment required will be quite large and demand in these cities
may not be large enough to make it financially remunerative enough for the developers.The estimation
of above capital cost is based on rough estimation. Detailed study may be done at later stage.
Figure 54: Map of future CGD cities Phase I, II & III and CNG Highway

Directorate General of Hydrocarbons (DGH)
[174] Hydrocarbon Vision 2030 for Northeast India - Final Report
Source: CRIS Analysis
7.5.3.4 Development of End Consumer Segment
The proposed Chambal fertilizer plant in Tripura which is under planning stage for quite some time
needs to be fast tracked not only to ensure supply of fertilizer in the region but also to create adequate
demand for the gas fields in Tripura. Further, the opening of Chittagong port can ensure future gas
requirement from the industries in the region, as importing LNG through the port will be easier and
economical. Access to Chittagong port will ensure trade from the region with Bangladesh as well as
with rest of the country. Further, existing ONGC gas based power plant can be expanded to supply
power to Bangladesh which is a power deficit country.
NEIIPP 2007 policy was suspended by government on temporary basis. The policy has led to positive
results in NER states especially in Assam. Therefore re-instatement of NEIIPP Policy can be considered
which will help in setting up medium and large scale industries in the region. These industries can then
be targeted for gas consumption in the region. Therefore, re-introduction of the policy will enhance the
prospect of greater market for natural gas in the region.
Action Plan
Table 120: Action Plan for Downstream segment
Action Items Concerned
Authorities
Timeline
Short Term
(less than 2 Year)
Medium Term
(2-5 Years)
Long Term
(More than 5
Years)
Refining Capacity
Expansion of
Refining
Capacity
NRL
Expansion
needs to
be planned
along with
other
infrastructu
re like
imported
Crude Oil
Pipeline
and
Product
pipeline
from
Siliguri-
Parbatipur
Product
pipeline
from
Siliguri to
Orissa/Mu

Directorate General of Hydrocarbons (DGH)
[175] Hydrocarbon Vision 2030 for Northeast India- Final Report
Action Items Concerned
Authorities
Timeline
Short Term
(less than 2 Year)
Medium Term
(2-5 Years)
Long Term
(More than 5
Years)
ghal Sarai
need to be
planned in
future.
Expansion of
Refining
Capacity
IOCL
Guwahati,
Bongaigaon
Expansion needs to be
planned along with other
infrastructure like Crude
Oil Pipeline for imported
crude and Product
pipelines
Product
pipelines
from
Bongaigao
n to
Siliguri-
mainland in
India.
Enhancement
of LPG
production in
refineries
using
INDMAX
technology
IOCL
IOCL need
to
implement
INDMAX
technology
for
enhancem
ent of LPG
production
on Urgent
Basis
Export of POL
to SAARC
countries
NRL/IOCL/M
oPNG/MEA
MoPNG to form a
committee to evaluate
possibility of export of
POL products in
neighbouring country –
Bangladesh, and
Myanmar
Discussion with
governments of
Bangladesh, Nepal,
Bhutan Sri Lanka and
Myanmar for export of
POL products. These
countries are net importer
of POL products.
Increasing consumption of POL Products
Increase the
per capita
consumption
MoPNG/
IOCL/
NRL
Numaligarh-Imphal route
(LPG and Product
pipeline) to cater the
Guwahati-
Silchar-
Imphal
LPG Pipeline
from Durgapur-
Guwahati as

Directorate General of Hydrocarbons (DGH)
[176] Hydrocarbon Vision 2030 for Northeast India - Final Report
Action Items Concerned
Authorities
Timeline
Short Term
(less than 2 Year)
Medium Term
(2-5 Years)
Long Term
(More than 5
Years)
by laying
product
pipeline
network and
LPG Pipeline
demand in areas-
Dimapur (Nagaland),
Sekmai (Nagaland),
Mualkhang (Mizoram)
product
pipeline
(with
further
extension
of Silchar-
Agartala&
Silchar-
Aizawl)
LPG
pipeline
from
Chittagong
-Sabrum-
Agartala
alternate route
to Chittagong-
Sabrum route
Re-
instatement of
NEIIPP Policy
DIPP
Re-instatement of
NEIIPP Policy with
budget allocation
increased to 10 times of
current as the promotion
of industries will not only
ensure higher
hydrocarbon
consumptions but also
will create jobs for local
people .
Inclusion of
Medium
Scale
Industries
also in
NEIIPP
Policy.
To promote
local
manufactur
ing of
Spare
parts
related to
Hydrocarb
on Industry
in
Tripura/Gu
wahati/Dibr
ugarh by
inclusion of
special
provision to
mentioned
industry.
Industries
DIPP/MoPN
G
Development of small
scale industries like
WAX, Bamboo Based

Directorate General of Hydrocarbons (DGH)
[177] Hydrocarbon Vision 2030 for Northeast India- Final Report
Action Items Concerned
Authorities
Timeline
Short Term
(less than 2 Year)
Medium Term
(2-5 Years)
Long Term
(More than 5
Years)
industries, Candle
manufacturing, Tyre,
Rubber based industry
etc
Improve
connectivity
to increase
industrial
development
and hence
more
consumption
of POL
products
NRL/GoI/DIP
P/
MORTH
4 Laning of NH 37 and 2
Laning of NH 150
Connectivity to Agartala
via NH-44 need to be
upgraded to 2 lane.
Upgrade
Silchar,
Shillong,
Dimapur,
Jorhat
civilian
airports to
improve
connectivit
y and
promote
Tourism
National
Waterways-2
for Petroleum
products
IWAI/MEA/M
oPNG
To improve the
connectivity from upper
Assam to mainland in
West Bengal and
Bangladesh, NW-2 needs
to be extended to
Bangladesh
Review for
implement
ation of
road map
to be
developed
Development
of common
marketing
facilities in
NER which
can be shared
by all of the
individual
OMCs.
MoPNG,
IOCL, NRL,
BPCL
Developm
ent of
Common
User
Facilities
(CUF)
Setting up of
ancillary
industries like
fertilizer and
petrochemical
plants around
refineries in
NER which
can utilize the
Naphtha
DIPP, MOCI,
MSME
Strategy for
implementation to be
formulated
Setting up
of ancillary
industries
Setting up
of ancillary
industries
like
fertilizer
and
petrochemi
cal plants
around
refineries

Directorate General of Hydrocarbons (DGH)
[178] Hydrocarbon Vision 2030 for Northeast India - Final Report
Action Items Concerned
Authorities
Timeline
Short Term
(less than 2 Year)
Medium Term
(2-5 Years)
Long Term
(More than 5
Years)
produced
from the
refineries as a
Feedstock
in NER
which can
utilize the
Naphtha
produced
from the
refineries
as a
Feedstock
Increase Demand of Natural Gas
CGD
Development
(Phase I, II,
III)
CGD
Development
–Silchar City
GAIL/PNGRB
/AGCL/TNGC
L/State
Governments
Cities falling on the
proposed Gas Pipeline
route of Agartala-
Bongaigaon and
Guwahati-Duliajan need
to be considered in
Phase-I & II.
GAIL to analyse the
potential demand of gas
for industries and
commercial use in these
cities for making the
pipeline projects viable.
CGD in Silchar city need
to be implemented using
Gas from ONGC Block by
connecting through
pipeline.
Cities
falling on
the
proposed
Gas
Pipeline
route of
Barauni-
Bongaigao
n need to
be
considered
in Phase-
III.
Incentives for
CGD
Development
MoPNG/PNG
RB/AGC/
TNGCL/GAIL
Option 1 – Bidding Route
– PPP Mode (VGF)
MoPNG to evaluate various
incentive schemes such as
VGF, tax benefit, subsidy for
initial years etc. to attract CGD
players in the region
Option 2: Nomination Basis
to GAIL.AGCL.TNGCL.
Financial support required by
AGCL and TNGCL to be
submitted to MoPNG. MoPNG
to evaluate the proposal

Directorate General of Hydrocarbons (DGH)
[179] Hydrocarbon Vision 2030 for Northeast India- Final Report
Action Items Concerned
Authorities
Timeline
Short Term
(less than 2 Year)
Medium Term
(2-5 Years)
Long Term
(More than 5
Years)
Offset LPG
requirement
by -
Cascading of
Gas
GAIL
(feasibility)
As a trial basis this
stranded gas need to be
utilized in this way as gas
demand is high and E&P
companies are not able to
supply and hence gas is
flared.
GAIL to identify the exact
costs associated with
transporting gas to
demand centers by using
cascades.(Estimated
cost is around Rs 25-
30/Kg)
If projects
are
financially
not viable,
MoPNG to
support
GAIL/End
Consumer
s by
offering
subsidy to
consumers
for opting
this gas.
Preference
should be
given to
consumers
using LPG.
This will
also offset
the
requiremen
t of LPG to
some
extent (124
TMTPA).
Utilization of
flared gas by
using
LNG skid
mounted
trucks
Modular
Power Plants
GAIL/NOCs
GAIL to assess
conversion of Gas to
LNG, transportation cost,
re-conversion cost and
hence landed cost to
consumers/industry for
supplying LNG through
trucks.
If projects
is
financially
not viable,
MoPNG to
support
GAIL/End
Consumer
s by
offering
subsidy to
consumers
for opting
this gas.
Modular
Power Plants
ONGC/OIL/A
PGCL
Small capacity Power
plants need to be

Directorate General of Hydrocarbons (DGH)
[180] Hydrocarbon Vision 2030 for Northeast India - Final Report
Action Items Concerned
Authorities
Timeline
Short Term
(less than 2 Year)
Medium Term
(2-5 Years)
Long Term
(More than 5
Years)
established near location
of Flare Gas. Typically 10
MW of Power Plant
required 0.04 mmscmd of
gas.
Development
of end
Consumer
Segment
MoPNG/MoF/
State
governments/
DIPP
DIPP to re-implement
NEIIPP
Provide more budgetary
allocation under such
schemes
State government to
come out with industrial
policy
Development
of end
Consumer
Segment
(Fertilizer)
ONGC/
CFL/
MoPNG/MEA
Fertilizer Plant which is
under planning stage at
Tripura from ONGC and
Chambal fertilizer need to
be fast track along with
opening up of Chittagong
port route
Development
of end
Consumer
Segment
(Power)
ONGC/MoP
Expansion
of OTPC
for selling
surplus
power to
Banglades
h using
transmissio
n line.
. Bio-Ethanol
MoPNG/Dep
artment of
Agriculture
and co-
operation(DA
C)/ NABARD
To add NER as a location
for setting up of bio-
refinery under CIS
scheme and for granting
of 40% CIS.
The government to
incentivize production of
Bamboo in NER, through
National Bamboo
Mission, and fund the
intermediary bamboo
processing industry

Directorate General of Hydrocarbons (DGH)
[181] Hydrocarbon Vision 2030 for Northeast India- Final Report
Action Items Concerned
Authorities
Timeline
Short Term
(less than 2 Year)
Medium Term
(2-5 Years)
Long Term
(More than 5
Years)
through NABARD for
incentivizing farmers and
entrepreneurs
Policy Level/ State Government Support/ MoPNG Support
Tax
Incentives
(VAT, Entry
Tax)
MoPNG,
MoF, state
government
(Assam)
MoPNG to take up the
concern of the refineries
wrt VAT, Entry Tax, State
govt is requested to
consider waiver of VAT
and State entry tax for
new projects and
expansion projects in
Assam
Facilitation of Stream
Exchange Between the 4
NE Refineries by
Permitting Setting off of
Tax on Inputs Against
Tax on Output
MoPNG to take up the
issue with MoF and State
government.
MoP&NG to review
instructions on bearing
the burden of sales tax as
well as transportation
cost on indigenous crude
by the NE refineries
instead of by OIL/ONGC
Land
Acquisition,
Encroachmen
t etc.
MoPNG/Stat
e
Government
BG Railfed Petroleum
Storage Depot near
Jirania (Agartala):
Confirmation needed on
funding of two associated
project and clearance
from All Tripura Tribal
Association (ATTA) for
the use of the identified
land for the project
awaited from Govt. Of
Tripura.

Directorate General of Hydrocarbons (DGH)
[182] Hydrocarbon Vision 2030 for Northeast India - Final Report
Action Items Concerned
Authorities
Timeline
Short Term
(less than 2 Year)
Medium Term
(2-5 Years)
Long Term
(More than 5
Years)
BG Railfed Petroleum
Storage Depot at
Moinarband (Silchar):
2.56 acre for the
approach road is under
litigation. State Govt to
expedite handing over of
this portion of land. EC
need to be provided by
PCB, Assam for the
project.
Delay in construction of
the new tank firm and
loading gantry at
Digboi: State goverment
is requested to review the
matter favourably, so as
to avoid such delays in
projects
Encroachment at
Digboi Refinery/DTPL
pipeline, New Tank
Farm, Waterline: State
govt need to take early
action to avoid any
mishaps
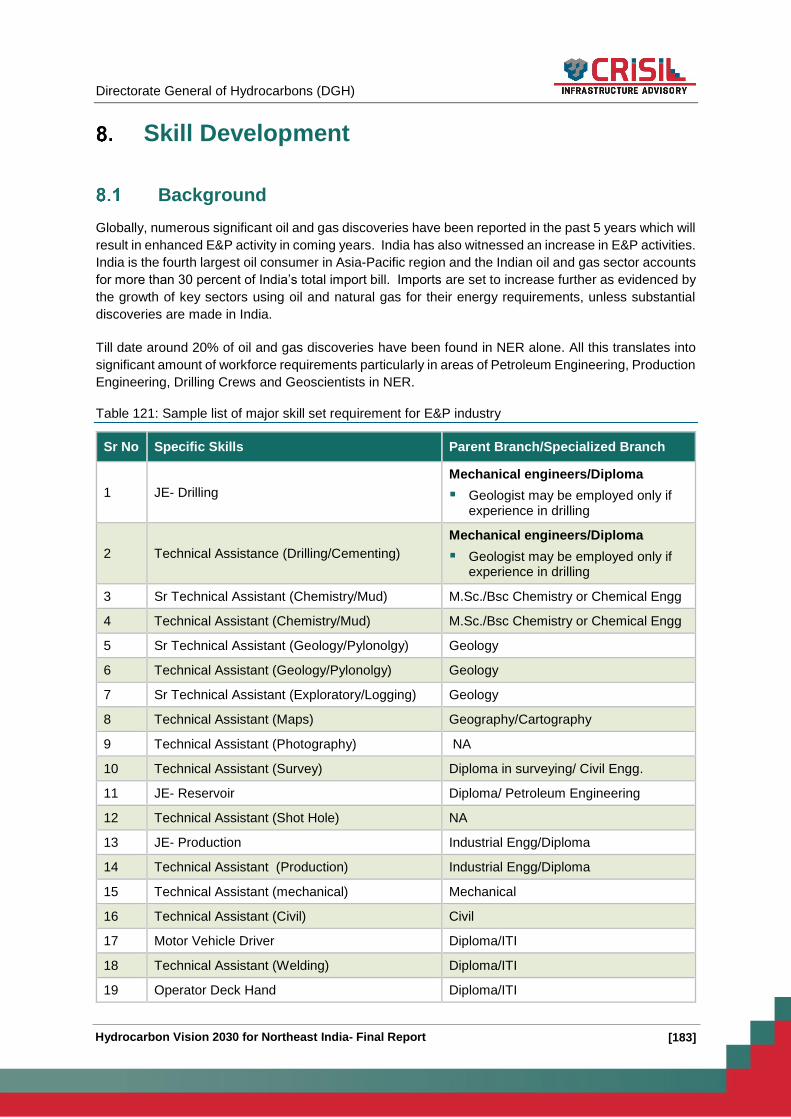
Directorate General of Hydrocarbons (DGH)
[183] Hydrocarbon Vision 2030 for Northeast India- Final Report
Skill Development
Background
Globally, numerous significant oil and gas discoveries have been reported in the past 5 years which will
result in enhanced E&P activity in coming years. India has also witnessed an increase in E&P activities.
India is the fourth largest oil consumer in Asia-Pacific region and the Indian oil and gas sector accounts
for more than 30 percent of India’s total import bill. Imports are set to increase further as evidenced by
the growth of key sectors using oil and natural gas for their energy requirements, unless substantial
discoveries are made in India.
Till date around 20% of oil and gas discoveries have been found in NER alone. All this translates into
significant amount of workforce requirements particularly in areas of Petroleum Engineering, Production
Engineering, Drilling Crews and Geoscientists in NER.
Table 121: Sample list of major skill set requirement for E&P industry
Sr No Specific Skills Parent Branch/Specialized Branch
1 JE- Drilling
Mechanical engineers/Diploma
Geologist may be employed only if experience in drilling
2 Technical Assistance (Drilling/Cementing)
Mechanical engineers/Diploma
Geologist may be employed only if experience in drilling
3 Sr Technical Assistant (Chemistry/Mud) M.Sc./Bsc Chemistry or Chemical Engg
4 Technical Assistant (Chemistry/Mud) M.Sc./Bsc Chemistry or Chemical Engg
5 Sr Technical Assistant (Geology/Pylonolgy) Geology
6 Technical Assistant (Geology/Pylonolgy) Geology
7 Sr Technical Assistant (Exploratory/Logging) Geology
8 Technical Assistant (Maps) Geography/Cartography
9 Technical Assistant (Photography) NA
10 Technical Assistant (Survey) Diploma in surveying/ Civil Engg.
11 JE- Reservoir Diploma/ Petroleum Engineering
12 Technical Assistant (Shot Hole) NA
13 JE- Production Industrial Engg/Diploma
14 Technical Assistant (Production) Industrial Engg/Diploma
15 Technical Assistant (mechanical) Mechanical
16 Technical Assistant (Civil) Civil
17 Motor Vehicle Driver Diploma/ITI
18 Technical Assistant (Welding) Diploma/ITI
19 Operator Deck Hand Diploma/ITI

Directorate General of Hydrocarbons (DGH)
[184] Hydrocarbon Vision 2030 for Northeast India - Final Report
Sr No Specific Skills Parent Branch/Specialized Branch
20 Technical Assistant (Marine Radio/Wireless/Telecom operator)
Telecom/Diploma/ITI
21 Fire Inspector Fire Engineer/Diploma
22 Assistant Fire Man Fire Engg/Diploma
Source: CRIS Research
Educational Set up/Facilities available in NER
The existing level of educational institutes offering professional degrees/diplomas and vocational
training institutes paints a satisfactory picture of the skill availability in the north eastern region.
Table 122: List of Educational institutes in NER
State ITI Diploma Colleges Engineering Colleges
Arunachal Pradesh
ITI ROING
ITI Dirang
ITI Tabarijo
NEFTU
Rajiv Gandhi Government Polytechnic
Govt Polytechnic, Palighat
Govt Polytechnic, Roing
Govt Polytechnic, Dirang
Govt Polytechnic, Namsai
Govt Polytechnic, Laying
NIT, AP
NERIST
Assam
POWI Jorhat ITIs Nagaon,
Srikona And Barpeta
Nowgong polytechnic Gyan sagar foundation
group of institutions Bongaigaon polytechnic Dibrugarh polytechnic Assam engineering institute Hrh the Prince of Wales
institute of engg. & tech., Dibrugarh polytechnic
Oil Institute Of Well Control Technology
IIT Guwahati
NIT Silchar
Tezpur University
Girijananda Chowdhury Institute Of Management And Technology
NITS, Mirza
Assam Engg College
Dibrugarh University Institute Of Engineering And Technology (Petroleum)
Tripura
ITIs
Indranagar, Jatanbari, Belonia, Kailahahar,
Tripura Institute of Technology
Dhalai District Polytechnic
Tripura Institute of Technology,
NIT Agartala

Directorate General of Hydrocarbons (DGH)
[185] Hydrocarbon Vision 2030 for Northeast India- Final Report
State ITI Diploma Colleges Engineering Colleges
Ambassa, Dharmanagar
North Tripura District Polytechnic
Techno India Agartala
Gomati District Polytechnic
Manipur ITI Takyel Government Polytechnic
GOVERNMENT COLLEGE OF TECHNOLOGY
NIT Manipur
Mizoram
ITI
Aizawal, Saiha
Mizoram Polytechnic NIT Aizawl
Mizoram University
Meghalya
ITI
Rynjah, Tura, Nongpoh, Shillong
GITI
Tura, Shillong, Jowai, Williamnagar, Nongstoin, Sohra, Resubelpara
Shillong Polytechnic
Regional Institute Of Science and Technology
UTM (Petroluum)
Nagaland
ITI
Kohima, Mon, Wokha, Phek, Tuensang, Zunheboto, Mokokchung
Kheloshe Polytechnic NIT Nagaland
Nagaland University
Source: CRIS Research
Team composition for E&P Activities
Based on inputs provided by ONGC we have shown in the table below, the team composition required
during the data acquisition phase of exploratory drilling.
Table 123: Team Composition during Exploratory Drilling (Acquisition phase)
Particulars Numbers
Geologist 4

Directorate General of Hydrocarbons (DGH)
[186] Hydrocarbon Vision 2030 for Northeast India - Final Report
Particulars Numbers
Geophysicist 14
Observers 2
Data Processors 2
Crew Manager 2
MDT- Processing and Interpretation Per Rig (Requirement on each rig)
Geologist 8
Geophysicist 12
Geochemist 3
Reservoir Engg 2
Mud Logger 2
Programmer 3
The table below shows the drilling team composition during subsurface analysis of exploratory drilling phase:
Table 124: Team Composition during Exploratory Drilling (Subsurface)
Particulars Number
Geologist 6
Geophysicist 2
Petro physicist 3
Geochemist 3
Reservoir Engg 2
Mud Logger 2
Drilling Crew Per Rig (Requirement on each rig)
Drilling Suptd.(Rig Manager) 1
Tool Pusher 2
Driller 4
Asst Driller 4
Derrickman 4
Oil Well Cementer 2
Roughnecks 16
Crane Operator 4
Roustabout 20
Chief Mechanic 2
Chief Electrician 2
Welder 2
Motorman 4
Electrician 2
The table below shows the team composition and manpower requirement per rig during the
development drilling phase:
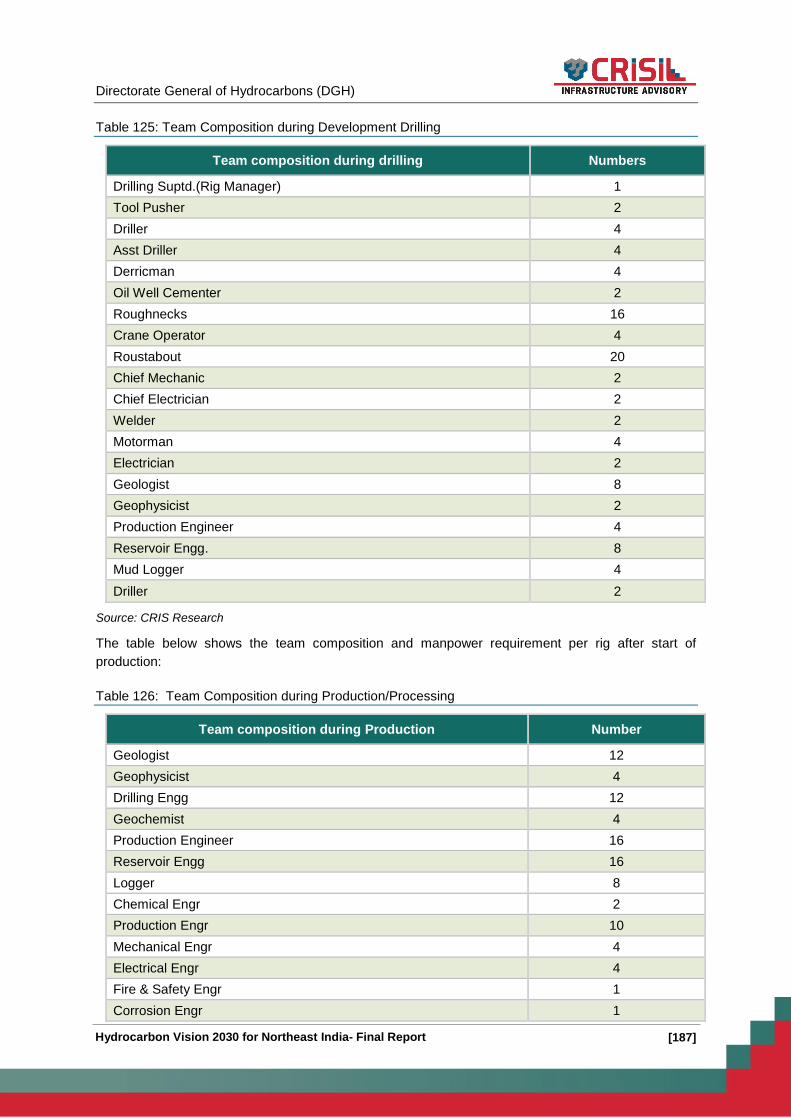
Directorate General of Hydrocarbons (DGH)
[187] Hydrocarbon Vision 2030 for Northeast India- Final Report
Table 125: Team Composition during Development Drilling
Team composition during drilling Numbers
Drilling Suptd.(Rig Manager) 1
Tool Pusher 2
Driller 4
Asst Driller 4
Derricman 4
Oil Well Cementer 2
Roughnecks 16
Crane Operator 4
Roustabout 20
Chief Mechanic 2
Chief Electrician 2
Welder 2
Motorman 4
Electrician 2
Geologist 8
Geophysicist 2
Production Engineer 4
Reservoir Engg. 8
Mud Logger 4
Driller 2
Source: CRIS Research
The table below shows the team composition and manpower requirement per rig after start of
production:
Table 126: Team Composition during Production/Processing
Team composition during Production Number
Geologist 12
Geophysicist 4
Drilling Engg 12
Geochemist 4
Production Engineer 16
Reservoir Engg 16
Logger 8
Chemical Engr 2
Production Engr 10
Mechanical Engr 4
Electrical Engr 4
Fire & Safety Engr 1
Corrosion Engr 1
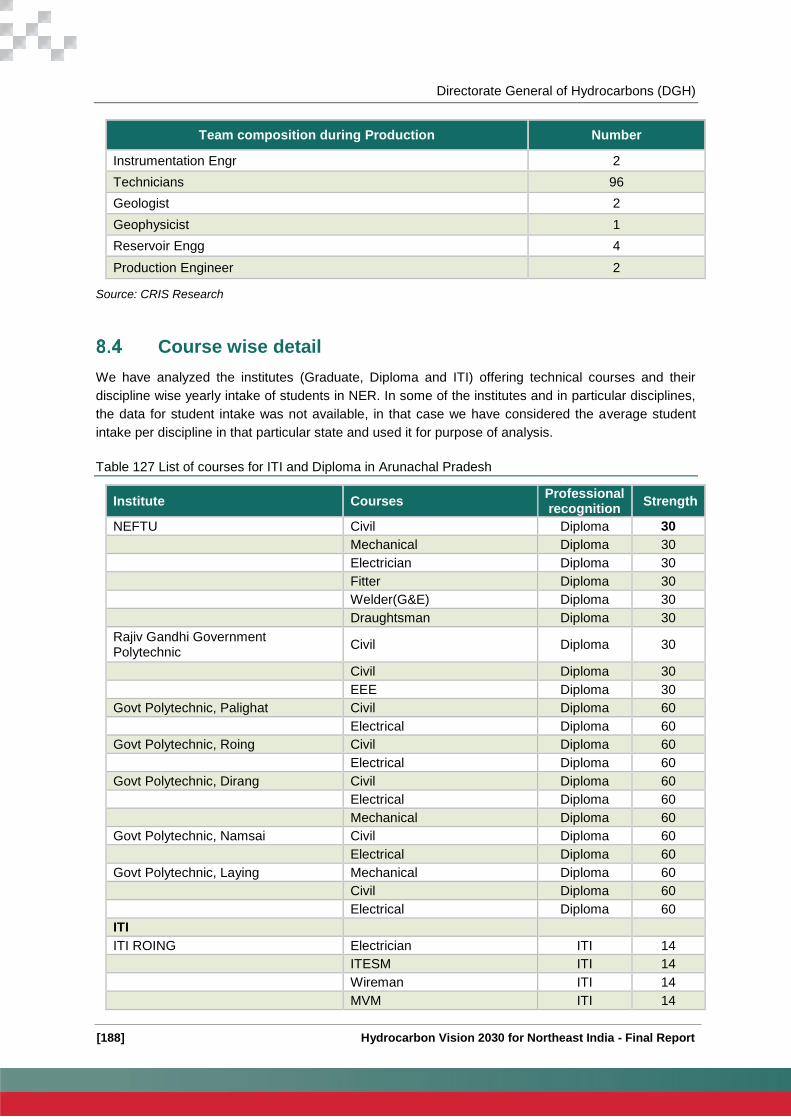
Directorate General of Hydrocarbons (DGH)
[188] Hydrocarbon Vision 2030 for Northeast India - Final Report
Team composition during Production Number
Instrumentation Engr 2
Technicians 96
Geologist 2
Geophysicist 1
Reservoir Engg 4
Production Engineer 2
Source: CRIS Research
Course wise detail
We have analyzed the institutes (Graduate, Diploma and ITI) offering technical courses and their
discipline wise yearly intake of students in NER. In some of the institutes and in particular disciplines,
the data for student intake was not available, in that case we have considered the average student
intake per discipline in that particular state and used it for purpose of analysis.
Table 127 List of courses for ITI and Diploma in Arunachal Pradesh
Institute Courses Professional recognition
Strength
NEFTU Civil Diploma 30
Mechanical Diploma 30
Electrician Diploma 30
Fitter Diploma 30
Welder(G&E) Diploma 30
Draughtsman Diploma 30
Rajiv Gandhi Government Polytechnic
Civil Diploma 30
Civil Diploma 30
EEE Diploma 30
Govt Polytechnic, Palighat Civil Diploma 60
Electrical Diploma 60
Govt Polytechnic, Roing Civil Diploma 60
Electrical Diploma 60
Govt Polytechnic, Dirang Civil Diploma 60
Electrical Diploma 60
Mechanical Diploma 60
Govt Polytechnic, Namsai Civil Diploma 60
Electrical Diploma 60
Govt Polytechnic, Laying Mechanical Diploma 60
Civil Diploma 60
Electrical Diploma 60
ITI
ITI ROING Electrician ITI 14
ITESM ITI 14
Wireman ITI 14
MVM ITI 14

Directorate General of Hydrocarbons (DGH)
[189] Hydrocarbon Vision 2030 for Northeast India- Final Report
Institute Courses Professional recognition
Strength
Fitter ITI 14
Plumber ITI 14
Draughtsman ITI 14
Surveyor ITI 14
Welder ITI 14
Carpenter ITI 14
ITI Dirang Welder ITI 10
ITI Tabarijo Electrician ITI 24
ITESM ITI 24
Draughtsman ITI 24
Source: CRIS Research
Table 128: List of courses for ITI and Diploma in Meghalaya
Institute Courses Professional Recognition
Strength
Shillong Polytechnic Civil Diploma 60
- Mechanical Diploma 30
- Electrical Diploma 30
ITI
ITI Rynjah Electrician ITI 21
Fitter ITI 21
Welder ITI 21
Civil Draughtsman ITI 21
Surveyor ITI 21
ITI Tura Basic Welding(Gas) ITI 20
- Basic Welding(Arc) ITI 20
GITI Tura Electrician ITI 20
Draughtsman(MEchanical) ITI 20
Fitter ITI 20
Draughtsman(Civil) ITI 20
Surveyor ITI 20
Welder ITI 20
ITI Nongpoh Basic Welding(Arc) ITI 20
ITI Shillong Electrician ITI 20
Mechanical(M.V) ITI 20
Draughtsman(MEchanical) ITI 20
GITI Shillong Fitter ITI 20
Draughtsman(Civil) ITI 20
Surveyor ITI 20
Welder ITI 20
Electrician ITI 20
GITI Jowai Welder ITI 20
Electrician ITI 20
GITI Williamnagar Wireman ITI 20
GITI Nongstoin Mechanic ITI 20
GITI Nongpoh Welder ITI 20

Directorate General of Hydrocarbons (DGH)
[190] Hydrocarbon Vision 2030 for Northeast India - Final Report
Institute Courses Professional Recognition
Strength
GITI Sohra Wirieman ITI 20
GITI Resubelpara Mechanic ITI 20
Source: CRIS Research
Table 129: List of courses for ITI and Diploma in Manipur
Institute Courses Professional recognition
Strength
Government Polytechnic Civil Diploma 60
Mechanical Diploma 20
Electrical Diploma 40
ITI
ITI Takyel Electrician ITI 20
Surveyor ITI 20
Draughtsman ( Mech) ITI 20
Draughtsman ( Civil) ITI 20
Source: CRIS Research
Table 130: List of courses for ITI and Diploma in Tripura
Institute Courses Professional Recognition
Strength
Tripura institute of technology Civil Diploma 30
Electrical Diploma 30
Mechanical Diploma 30
Dhalai district polytechnic Civil Diploma 40
Electrical Diploma 40
North tripura district polytechnic Civil Diploma 60
Mechanical Diploma 60
Techno india agartala Civil Diploma 60
Electrical Diploma 60
Mechanical Diploma 60
Gomati district polytechnic Civil Diploma 60
Electrical Diploma 60
ITI
ITI Indranagar Welder ITI 16
Draughtsman(Civil) ITI 16
Surveyor ITI 16
Fitter ITI 16
ITI Belonia Welder ITI 12
Electrician ITI 16
Draughtsman(Civil) ITI 16
ITI Kailahahar Fitter ITI 16
Electrician ITI 16
Draughtsman(Civil) ITI 16
Surveyor ITI 16
ITI Ambassa Welder ITI 12
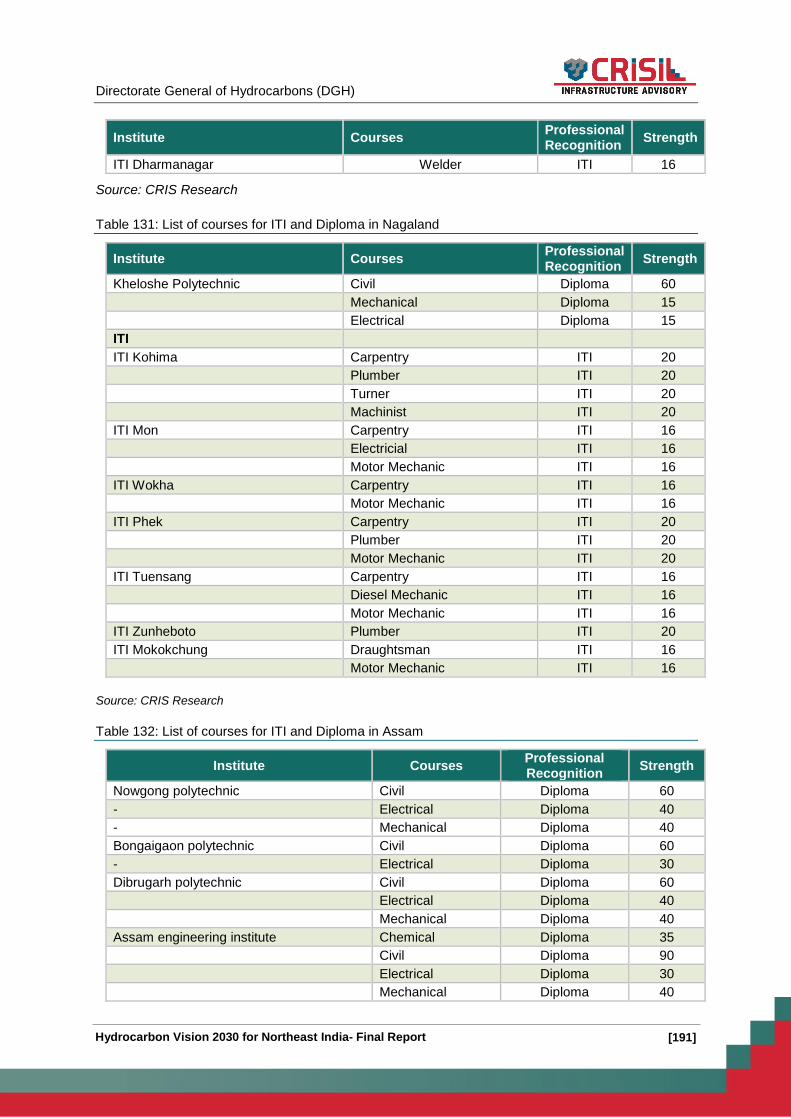
Directorate General of Hydrocarbons (DGH)
[191] Hydrocarbon Vision 2030 for Northeast India- Final Report
Institute Courses Professional Recognition
Strength
ITI Dharmanagar Welder ITI 16
Source: CRIS Research
Table 131: List of courses for ITI and Diploma in Nagaland
Institute Courses Professional Recognition
Strength
Kheloshe Polytechnic Civil Diploma 60
Mechanical Diploma 15
Electrical Diploma 15
ITI
ITI Kohima Carpentry ITI 20
Plumber ITI 20
Turner ITI 20
Machinist ITI 20
ITI Mon Carpentry ITI 16
Electricial ITI 16
Motor Mechanic ITI 16
ITI Wokha Carpentry ITI 16
Motor Mechanic ITI 16
ITI Phek Carpentry ITI 20
Plumber ITI 20
Motor Mechanic ITI 20
ITI Tuensang Carpentry ITI 16
Diesel Mechanic ITI 16
Motor Mechanic ITI 16
ITI Zunheboto Plumber ITI 20
ITI Mokokchung Draughtsman ITI 16
Motor Mechanic ITI 16
Source: CRIS Research
Table 132: List of courses for ITI and Diploma in Assam
Institute Courses Professional Recognition
Strength
Nowgong polytechnic Civil Diploma 60
- Electrical Diploma 40
- Mechanical Diploma 40
Bongaigaon polytechnic Civil Diploma 60
- Electrical Diploma 30
Dibrugarh polytechnic Civil Diploma 60
Electrical Diploma 40
Mechanical Diploma 40
Assam engineering institute Chemical Diploma 35
Civil Diploma 90
Electrical Diploma 30
Mechanical Diploma 40
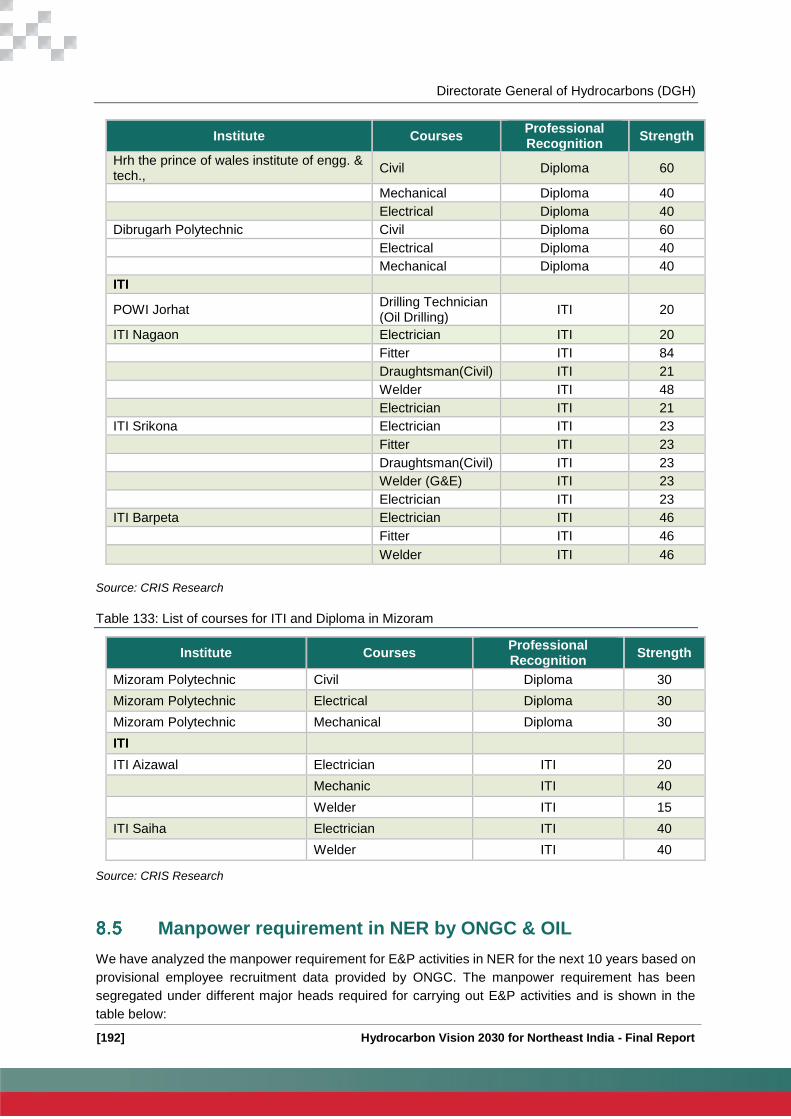
Directorate General of Hydrocarbons (DGH)
[192] Hydrocarbon Vision 2030 for Northeast India - Final Report
Institute Courses Professional Recognition
Strength
Hrh the prince of wales institute of engg. & tech.,
Civil Diploma 60
Mechanical Diploma 40
Electrical Diploma 40
Dibrugarh Polytechnic Civil Diploma 60
Electrical Diploma 40
Mechanical Diploma 40
ITI
POWI Jorhat Drilling Technician (Oil Drilling)
ITI 20
ITI Nagaon Electrician ITI 20
Fitter ITI 84
Draughtsman(Civil) ITI 21
Welder ITI 48
Electrician ITI 21
ITI Srikona Electrician ITI 23
Fitter ITI 23
Draughtsman(Civil) ITI 23
Welder (G&E) ITI 23
Electrician ITI 23
ITI Barpeta Electrician ITI 46
Fitter ITI 46
Welder ITI 46
Source: CRIS Research
Table 133: List of courses for ITI and Diploma in Mizoram
Institute Courses Professional Recognition
Strength
Mizoram Polytechnic Civil Diploma 30
Mizoram Polytechnic Electrical Diploma 30
Mizoram Polytechnic Mechanical Diploma 30
ITI
ITI Aizawal Electrician ITI 20
Mechanic ITI 40
Welder ITI 15
ITI Saiha Electrician ITI 40
Welder ITI 40
Source: CRIS Research
Manpower requirement in NER by ONGC & OIL
We have analyzed the manpower requirement for E&P activities in NER for the next 10 years based on
provisional employee recruitment data provided by ONGC. The manpower requirement has been
segregated under different major heads required for carrying out E&P activities and is shown in the
table below:
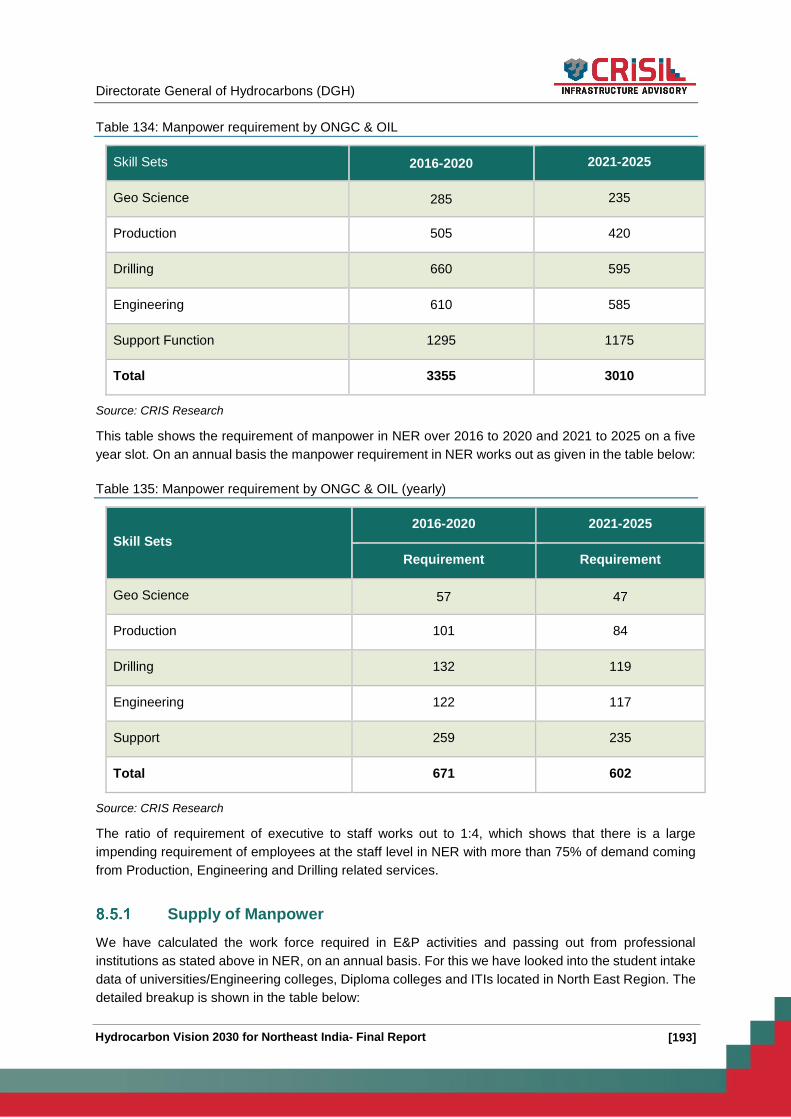
Directorate General of Hydrocarbons (DGH)
[193] Hydrocarbon Vision 2030 for Northeast India- Final Report
Table 134: Manpower requirement by ONGC & OIL
Skill Sets 2016-2020 2021-2025
Geo Science 285 235
Production 505 420
Drilling 660 595
Engineering 610 585
Support Function 1295 1175
Total 3355 3010
Source: CRIS Research
This table shows the requirement of manpower in NER over 2016 to 2020 and 2021 to 2025 on a five
year slot. On an annual basis the manpower requirement in NER works out as given in the table below:
Table 135: Manpower requirement by ONGC & OIL (yearly)
Skill Sets
2016-2020 2021-2025
Requirement Requirement
Geo Science 57 47
Production 101 84
Drilling 132 119
Engineering 122 117
Support 259 235
Total 671 602
Source: CRIS Research
The ratio of requirement of executive to staff works out to 1:4, which shows that there is a large
impending requirement of employees at the staff level in NER with more than 75% of demand coming
from Production, Engineering and Drilling related services.
Supply of Manpower
We have calculated the work force required in E&P activities and passing out from professional
institutions as stated above in NER, on an annual basis. For this we have looked into the student intake
data of universities/Engineering colleges, Diploma colleges and ITIs located in North East Region. The
detailed breakup is shown in the table below:

Directorate General of Hydrocarbons (DGH)
[194] Hydrocarbon Vision 2030 for Northeast India - Final Report
Table 136: Supply of technical Manpower
Graduate Courses Diploma ITI
Course Seats Course Seats Course Seats
Chemical 221 Civil 1,241 Electrician 429
Civil 1,435 Mechanical 502 ITES 55
Mechanical 1,327 Electrical 718 Wireman 20
Electrical 956 Mechanic 149
Chemistry 148 Fitter 274
Physics 101 Plumber 79
Geology 30 Draughtsman 210
Surveyor 98
Welder 375
Carpenter 96
Total 4,218 Total 2,460 Total 1,784
Source: CRIS Research
Demand and Supply analysis
In our analysis we have mapped the demand and supply of employees required for E&P activities in
NER. Our analysis reveals that there is no shortage of manpower in the region, and all types of skill set
required is available locally in the region. The table below shows if there is a surplus or shortage of
employees based on mapping of demand and supply.
Table 137: Demand Supply of Technical Manpower
Particulars Executives Staff
Geo Science Surplus Matched
Production Surplus Surplus
Drilling Surplus Surplus
Engineering Surplus Surplus
Support Surplus Shortage in Fire security

Directorate General of Hydrocarbons (DGH)
[195] Hydrocarbon Vision 2030 for Northeast India- Final Report
However in the support category operations we find that there is a dearth of Fire safety training institutes
in the region. Based on our analysis there is an annual requirement of 12 fire safety personnel at the
staff level. To overcome this shortage, we suggest a separate branch on fire safety maybe started in
the ITIs where educational infrastructure is already present.
Initiatives by Central Government/State Government
Setting up of premier institutes to cater to Oil & Gas Human resource
IIITAs
The Assam government, in partnership with the Tata Group and Oil India, is started the Indian Institute
of Information Technology and Advanced Sciences (IIITAS). Emphasis will be on industry-interface
research and development relevant to Assam, besides skill development, helping the youth of the state
to be employable here and elsewhere. While the centre will hold a 57.5% stake in the project, the state
government will hold 35%, and the Tata Group and OIL will hold the remaining stake.
Rajiv Gandhi Institute of Petroleum Technology (RGIPT)
RGPIT, Sivasagar in Assam is currently under construction. It is Assam centre of the flagship RGIPT in
Jais, Raebareli, in Uttar Pradesh. RGIPT, Jais is a training and education institute that gives technical
and management training to the petroleum industry and was formally opened on July 2008. It has been
accorded the Institute of National Importance status. It offers courses in engineering, pure sciences,
management and humanities with a focus on petroleum engineering. The programs and courses offered
at RGIPT are changing as the school is evolving into a full-fledged petroleum engineering university.
In consonance with the charter of RGIPT, the primary objective of the Assam Center of RGIPT is
envisaged to offer programmes of education and training of skilled technical manpower at the diploma
and advance diploma levels including B.Sc - M.Sc integrated courses in various areas in the domain of
the petroleum sector as per requirements of the oil, gas and petrochemical industry.
IIP
CSIR-Indian Institute of Petroleum (CSIR-IIP) is one of the leading constituent laboratories of the
Council of Scientific & Industrial Research (CSIR). Established in 1960, the Institute is devoted to
multidisciplinary areas of research and development in the downstream sector of hydrocarbon and
related industry. It has good experienced and qualified staff and is equipped with comprehensive state-
of-art R&D facilities including pilot plants. The Institute undertakes R&D work in areas of petroleum
refining, natural gas, alternative fuels, petrochemicals utilization of petroleum products in IC engines
and in industrial and domestic combustion. Institute also provides technical and analytical services to
petroleum refining and related industry including technology transfer for developing novel, state-of-art
technologies and products.
Dibrugarh University
Dibrugarh University, the eastern most University of India was set up in 1965. It is a teaching-cum-
affiliating University with limited residential facilities. The University is situated at Rajabheta, five
kilometres to the south of the premier town of Dibrugarh in the northeast India. The Dibrugarh University
Campus is well connected by roads, rails, air and waterways. The National Highway No.37 passes
through the University Campus. The University is accredited by National Assessment and Accreditation
Council (NAAC) with an institutional score of 71% (B grade). The Re-accreditation has been done in

Directorate General of Hydrocarbons (DGH)
[196] Hydrocarbon Vision 2030 for Northeast India - Final Report
March 2009. The University has around 200 affiliated and permitted colleges and institutes to achieve
its goal of dissemination of knowledge and generation of human resource.
Setting up of National Skill Development Corporation
National Skill Development Corporation India (NSDC) is a not-for-profit company set up by the Ministry
of Finance, under Section 25 of the Companies Act.
NSDC is a one of its kind, Public Private Partnership in India. It aims to promote skill development by
catalyzing creation of large, quality, for-profit vocational institutions. NSDC provides funding to build
scalable, for-profit vocational training initiatives. Its mandate is also to enable support systems such as
quality assurance, information systems and train the trainer academies either directly or through
partnerships. NSDC acts as a catalyst in skill development by providing funding to enterprises,
companies and organizations that provide skill training. It will also develop appropriate models to
enhance, support and coordinate private sector initiatives. NSDC has 207 approved partners, which
together have 2,904 operational NSDC partner centers, including 676 mobiles centers. These centers
cover 471 districts across 28 states and five union territories.
Key Issues
The E&P sector faces a critical challenge in attracting the young talent. The Indian education
sector prepares around 500+ students in E&P related geo-science courses. Of the students
passing out of petro-technical streams only few join E&P companies. The entry to E&P
sector is limited to very low percent due to the low awareness of the job opportunities in the
sector at the entry level and the perceived higher attractiveness of other sectors mainly IT,
Telecom.
The Indian industry will require an additional 800 petro-technical students by 2017. This will
require an increase in the number of students taking up education related to this sector.
However, the sector faces the following challenges in attracting young talent:
Low Industry Attractiveness: Generally tougher working conditions and low attractiveness of
the field job, coupled with a favorable alternative job market scenario make the E&P sector
low on attraction for employees at all levels.
Attraction to Global Players: Experienced talent available in India is generally attracted to
foreign and global players offering higher salary and better working conditions as compared
to India.
Companies need to train Diploma and ITI engineers for getting the right output.
Local people are available but do not have good experience and are fresher level only.
Problems are faced recruiting experienced manpower for ready to give output.
Specialized services people like Fire Man, Doctors, etc. are not easily available localy. Due to
law and order deterioration, manpower from rest of India does not express willingness to
work in NER.
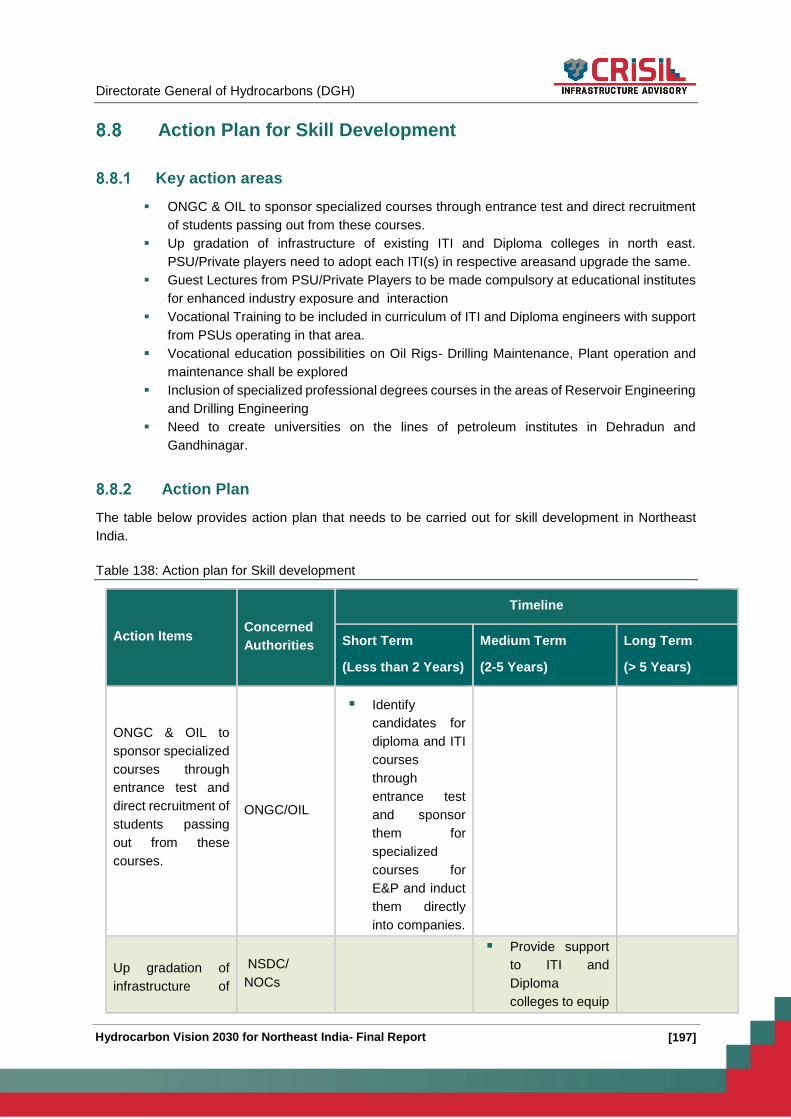
Directorate General of Hydrocarbons (DGH)
[197] Hydrocarbon Vision 2030 for Northeast India- Final Report
Action Plan for Skill Development
Key action areas
ONGC & OIL to sponsor specialized courses through entrance test and direct recruitment
of students passing out from these courses.
Up gradation of infrastructure of existing ITI and Diploma colleges in north east.
PSU/Private players need to adopt each ITI(s) in respective areasand upgrade the same.
Guest Lectures from PSU/Private Players to be made compulsory at educational institutes
for enhanced industry exposure and interaction
Vocational Training to be included in curriculum of ITI and Diploma engineers with support
from PSUs operating in that area.
Vocational education possibilities on Oil Rigs- Drilling Maintenance, Plant operation and
maintenance shall be explored
Inclusion of specialized professional degrees courses in the areas of Reservoir Engineering
and Drilling Engineering
Need to create universities on the lines of petroleum institutes in Dehradun and
Gandhinagar.
Action Plan
The table below provides action plan that needs to be carried out for skill development in Northeast
India.
Table 138: Action plan for Skill development
Action Items Concerned
Authorities
Timeline
Short Term
(Less than 2 Years)
Medium Term
(2-5 Years)
Long Term
(> 5 Years)
ONGC & OIL to
sponsor specialized
courses through
entrance test and
direct recruitment of
students passing
out from these
courses.
ONGC/OIL
Identify
candidates for
diploma and ITI
courses
through
entrance test
and sponsor
them for
specialized
courses for
E&P and induct
them directly
into companies.
Up gradation of
infrastructure of
NSDC/
NOCs
Provide support
to ITI and
Diploma
colleges to equip

Directorate General of Hydrocarbons (DGH)
[198] Hydrocarbon Vision 2030 for Northeast India - Final Report
Action Items Concerned
Authorities
Timeline
Short Term
(Less than 2 Years)
Medium Term
(2-5 Years)
Long Term
(> 5 Years)
existing ITI and
Diploma colleges
them with better
training facility
Inclusion of
vocational training
in educational
institutions
Add vocational
training in the
curriculum of
educational
institutions
Specialized
professional
colleges/
universities
Establish
colleges/univ
ersities
specifically for
petroleum
and natural
gas courses
To start new
streams in ITIs on
fire safety
management
Starting a course
on fire hazard
and safety in the
existing ITIs
where
educational
infrastructure is
already present

Directorate General of Hydrocarbons (DGH)
[199] Hydrocarbon Vision 2030 for Northeast India- Final Report
Infrastructure Gaps
The infrastructure gap is a major concern in the region, and acceleration in economic growth and the
economic development of the region is dependent on how fast this deficit is overcome. The lack of
connectivity has virtually segregated and isolated the region not only from the rest of the country and
the world, but also within itself. Poor density of road and rail transportation within the region has not
only hampered mobility but also hindered the development of markets. Although the air connectivity
has improved in the last few years, the frequency of flights remains a key concern. Further, air inter-
connectivity between different States in the region is limited. Although Inland Water Transport (IWT) is
operationally cheaper, high in fuel efficiency and environment friendly, the development of inland water
transport has remained dormant for a long time. The connectivity concerns thus created a barrier for
industrial development in the region.
Although endowed with huge oil and gas potential, the E&P activities in the region have not been able
to pick up due to several issues. The lack of connectivity has remained one of the key impediments for
the development of E&P sector in the region. Following key action areas have been identified for
plugging the infrastructure gaps in the north east region.
Key Action Areas
Manipur
Road Infrastructure
Improvement of road conditions by ensuring black top surface across the entire stretch of the
national highways i.e. NH 53, NH 150 and NH 102B
The approach road for reaching the blocks needs to be developed by the operator, however
the state government should provide adequate help by way of providing impromptu clearances
which is required for laying such roads
Improvement of load carrying capacity so that heavy equipment can be transported easily
The steel Bailey Bridges needs to be replaced with modern bridge infrastructure with adequate
load carrying capacity to allow heavy equipment to be transported to project locations.
Proposed double laning of NH 53 under Special Accelerated Road Development Programme
for North East (SARDP-NE) should be fast tracked as this could be used as an alternate route
to NH 39 that comes under blockades from time to time.
Double laning of NH 53, NH 150 and NH 102B needs to be taken up immediately as this will
improve the accessibility concerns in the state
Facilitate the development of proposed Asian highways as this will allow the region to be
connected with south east Asian market and thereby will bring in much needed economic
impetus to this region
Railway Infrastructure
Access to railway network is non-existent which has imposed serious challenges on
transportation of goods and services in the state. The proposed railway network also covers
limited part of the state. Considering the strategic importance of Manipur, both in terms of
security and resource potential, better railway connectivity is essential. The railway authority
needs to take cognizance of this matter and should include more areas under their tutelage as
Directorate General of Hydrocarbons (DGH)
[200] Hydrocarbon Vision 2030 for Northeast India - Final Report
part of the grand development plan for the state. Further, focus on timely implementation is
much needed.
Airport Infrastructure
The air infrastructure is Manipur is good enough to serve the present market needs.
Tripura
Road Infrastructure
Improvement of road conditions by ensuring black top surface across the entire stretch of the
NH 44
The approach road for reaching the blocks needs to be developed by the operator, however
the state government should provide adequate help by way of providing impromptu clearances
which is required for laying of such roads
Improvement of load carrying capacity so that heavy vehicle/ equipment can be transported
easily
Double laning of NH 44 needs to be taken up immediately as proposed under SARDP-NE, as
this will improve the accessibility concerns in the state
Railway Infrastructure
Access to railway network is limited which has imposed serious challenges on transportation of
goods and services in the state. The proposed railway network also covers limited part of the
state. Considering the strategic importance of Tripura, both in terms of security and resource
potential, better railway connectivity is essential. The railway authority needs to take
cognizance of this matter and should include more areas under their tutelage as part of the
grand development plan for the state. Further, focus on timely implementation is much needed.
Airport Infrastructure
The air infrastructure is Tripura is good enough to serve the present market needs.
Arunachal Pradesh
Road Infrastructure
Proposed double laning of NH 52 B under Special Accelerated Road Development Programme
for North East (SARDP-NE) should be implemented in time bound manner
Railway Infrastructure
Access to railway network is limited which has imposed serious challenges on transportation of
goods and services in the state. The proposed railway network also covers limited part of the
state. Considering the strategic importance of Arunachal Pradesh, both in terms of security and
resource potential, better railway connectivity is essential. The railway authority needs to take
cognizance of this matter and should include more areas under their tutelage as part of the grand
development plan for the state. Further, focus on timely implementation is much needed.
Airport Infrastructure
Directorate General of Hydrocarbons (DGH)
[201] Hydrocarbon Vision 2030 for Northeast India- Final Report
Development of civilian airport is much required to provide access to this difficult terrain. This
will not only ensure easy access to this state, but also will enable investors to do business
development in the state.
Mizoram
Road Infrastructure
Proposed double laning of NH 54 under Special Accelerated Road Development Programme for
North East (SARDP-NE) should be implemented in time bound manner
The approach road for reaching the blocks needs to be developed by the operator, however the
state government should provide adequate help by way of providing necessary clearances
Increasing operational hours at airports in Aizawl so that more routes can be operated
Railway Infrastructure
Access to railway network is limited which has imposed serious challenges on transportation of
goods and services in the state. The proposed railway network also covers limited part of the
state. The railway authority needs to take cognizance of this matter and should include more
areas under their tutelage as part of the grand development plan for the state. Further, focus on
timely implementation is much needed.
Airport Infrastructure
Although the state has an airport in Aizawl, the limited operational hours restrict air travel to a
great extent. Therefore, operational hours need to be increased so that more routes can be
operated.
Assam
Road Infrastructure
Proposed 4 laning of NH 37 under Special Accelerated Road Development Programme for North
East (SARDP-NE) should be implemented in time bound manner. This will not only help in
reducing congestion but also will ensure faster delivery of exploration equipment to the project
locations, thereby expediting the exploration process in Assam.
Improvement of existing single lane road stretches on NH-36, 52, 61 to double lane as proposed
under SARDP-NE in a time bound manner
Numaligarh- Golaghat-Dhodali-Namrup – Upgradation to 2 lanes. (Alternate route to NH 37)
Stillwell Road development for inter country with connection to China, India and Myanmar.
Alternate road should be developed for inter North East Connectivity
Digboi- Duliajan- Lakwa-Nagaland-Manipur
Guwahati- Shillong-Silchar-Aizawl
Guwahati-Shillong-Silchar-Agartala
Further Koraghat-Nambar-Kasomarigaon-Borholla ring-road can be developed as National
highway as lots of resources can be explored in this region if such connectivity is established
The approach road for reaching the blocks needs to be developed by the operator, however the
state government should provide adequate help by way of providing impromptu clearances
which is required for laying of such roads
Railway Infrastructure

Directorate General of Hydrocarbons (DGH)
[202] Hydrocarbon Vision 2030 for Northeast India - Final Report
Although the state is well connected via railway network, the present capacity proves to be a
key constraint for accessing railway network. Therefore augmentation of network capacity as
well as expansion of network to unconnected areas is much needed.
Considering the E&P activates in the Jorhat-Dibrugarh region, the railway authorities need to
convert the Guwahati-Dibrugarh railway line into a double line network. This will ensure faster
transportation of equipment and materials in the region
Airport Infrastructure
The airport at Jorhat needs to be converted into a complete civilian airport. This will provide
better access to the region which has been one of the key centers of oil and gas exploration in
the state.
9.1.5.1 Waterway Infrastructure for Northeast India
Government of India through Ministry of transport has already initiated the process of developing
and operating NW-2 as alternative to Road and Rail for connectivity in NE. On the same lines,
NW-6 also needs to be connected for Manipur and Mizoram states with Assam.
Fast tracking of clearances to these projects is essential to make it a reality; therefore the
authorities both at the state and central level needs to provide adequate assistance to create
waterway connectivity in the region.
Action Plan
The table below provides action plan needed to be carried out for improving infrastructure related issues
in Northeast India.
Table 139: Action plan for Infrastructure Development
Action
Items
Concerned
Authorities
Timeline
Short Term
(Less than 2
Years)
Medium Term
(2-5 Years)
Long Term
(> 5 Years)
Road Infrastructure
Improving
condition of
National
Highways
NHAI
PWD
BRO
Ensure
black top
surface on
NH 53, NH
150 and NH
102B in
Manipur
Ensure
black top
surface
across the
entire
stretch of
the NH 44 in
Tripura
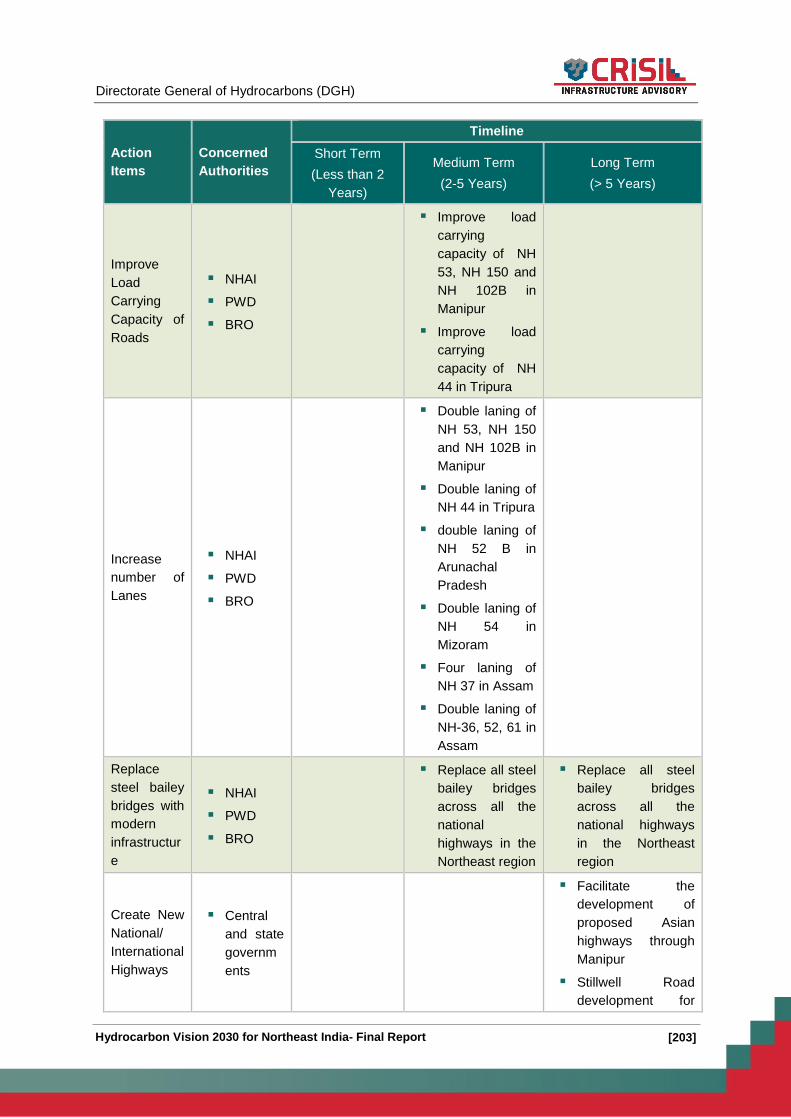
Directorate General of Hydrocarbons (DGH)
[203] Hydrocarbon Vision 2030 for Northeast India- Final Report
Action
Items
Concerned
Authorities
Timeline
Short Term
(Less than 2
Years)
Medium Term
(2-5 Years)
Long Term
(> 5 Years)
Improve
Load
Carrying
Capacity of
Roads
NHAI
PWD
BRO
Improve load
carrying
capacity of NH
53, NH 150 and
NH 102B in
Manipur
Improve load
carrying
capacity of NH
44 in Tripura
Increase
number of
Lanes
NHAI
PWD
BRO
Double laning of
NH 53, NH 150
and NH 102B in
Manipur
Double laning of
NH 44 in Tripura
double laning of
NH 52 B in
Arunachal
Pradesh
Double laning of
NH 54 in
Mizoram
Four laning of
NH 37 in Assam
Double laning of
NH-36, 52, 61 in
Assam
Replace
steel bailey
bridges with
modern
infrastructur
e
NHAI
PWD
BRO
Replace all steel
bailey bridges
across all the
national
highways in the
Northeast region
Replace all steel
bailey bridges
across all the
national highways
in the Northeast
region
Create New
National/
International
Highways
Central
and state
governm
ents
Facilitate the
development of
proposed Asian
highways through
Manipur
Stillwell Road
development for

Directorate General of Hydrocarbons (DGH)
[204] Hydrocarbon Vision 2030 for Northeast India - Final Report
Action
Items
Concerned
Authorities
Timeline
Short Term
(Less than 2
Years)
Medium Term
(2-5 Years)
Long Term
(> 5 Years)
inter country with
connection to
China, India and
Myanmar.
Creation of National
highway from
(Numaligarh-
Golaghat-Dhodali-
Namrup)
Numaligarh-
Namrup as an
alternate route to
NH 37
Alternate road
should be
developed for inter
North East
Connectivity
Digboi- Duliajan-
Lakwa-Nagaland-
Manipur
Guwahati- Shillong-
Silchar-Aizawl
Guwahati-Shillong-
Silchar-Agartala
Koraghat-Nambar-
Kasomarigaon-
Borholla ring-road
to be developed as
National highway
Railway Infrastructure
Covering
more area
under
railway
network
Ministry of
Railway
Including more
areas of Manipur,
Mizoram, Tripura
and Arunachal
Pradesh under
railway network
Strengthen
Existing
Railway
network
Ministry of
Railway
Guwahati-
Dibrugarh
railway network
to be converted

Directorate General of Hydrocarbons (DGH)
[205] Hydrocarbon Vision 2030 for Northeast India- Final Report
Action
Items
Concerned
Authorities
Timeline
Short Term
(Less than 2
Years)
Medium Term
(2-5 Years)
Long Term
(> 5 Years)
into double line
network
Conversion
of Narrow
gauge to
broad
gauge
Ministry of
Railway
Convert all
narrow gauge
network into
broad gauge
network
Rail
connectivity
of India with
Bangladesh
Ministry of
Railway
Connect Agartala
with Amhara in
Bangladesh
Airport Infrastructure
Improving
airport
facilities
More number of
operating hours
for Aizawl airport
Full civilian
status to
airports
under IAF
now
AAI
Jorhat Airport in
Assam to be
converted into
complete civilian
airport
New Airport
Developme
nt
AAI
Development of
civilian airport in
Arunachal
Pradesh
Waterways Infrastructure
Developme
nt of NW-1
and NW-6
IWAI Development
of NW-6
Connect Manipur
and Mizoram
with NW-6

Directorate General of Hydrocarbons (DGH)
[206] Hydrocarbon Vision 2030 for Northeast India - Final Report
Law and Order
The instability in the Northeast India is characterized by two distinct factors- ethnic clashes among the
indigenous groups and political movement. The conflicting dynamics in the Northeast ranges from
terrorism to ethnic clashes, to problems of continuous inflow of migrants and the fight over resources.
Moreover, vested interests and inter-tribal and inter factional rivalry have led militant groups to
continually clash among themselves, plunging the region in a vicious cycle of militancy, social violence
and lack of economic growth.
Over the years, both the state and central government have used various tactics to curtail militancy in
the region. The government introduced the institution of Autonomous District Councils (ADC) to give
the region’s tribal groups a limited self-rule by providing them greater control over local resources and
protection of cultural identity. Following action areas have been identified for the north east region for
supporting the development of the Oil & Gas industry in the region.
Key Action Areas
The central and state governments need to initiate action to resolve the boundary issues within
states as boundary issues between Assam-Nagaland, Manipur-Nagaland and Assam-
Arunachal Pradesh have been instrumental in delaying exploration activities and in some cases
the issue has led to abandonment of exploration activities by the E&P operator
A multi-pronged strategy needs to be evaluted to curb bands and blockades which is blocking
and choking the economic development and social harmony in the region.
Political will to curb such activities
Shifting the Centre of Gravity to Progress and Development
Creating alternative route of supply to affected states
Involving local media in a responsive and impartial way to create public consensus
Action Plan
The table below provides action plan needs to be carried out for improving law and order scenario in
Northeast India.
Table 140: Action Plan for law and order issues in Northeast India
Action Items Concerned Authorities
Timeline
Short Term
(Less than 2
Years)
Medium
Term
(2-5 Years)
Long
Term
(> 5
Years)
Law and Order
State Boundary
Issue Central & State Governments Yes
Terrorism & ethnic
Clashes Central & state government Yes

Directorate General of Hydrocarbons (DGH)
[207] Hydrocarbon Vision 2030 for Northeast India- Final Report
Action Items Concerned Authorities
Timeline
Short Term
(Less than 2
Years)
Medium
Term
(2-5 Years)
Long
Term
(> 5
Years)
Bandhs and
blockades State Government & local bodies Yes
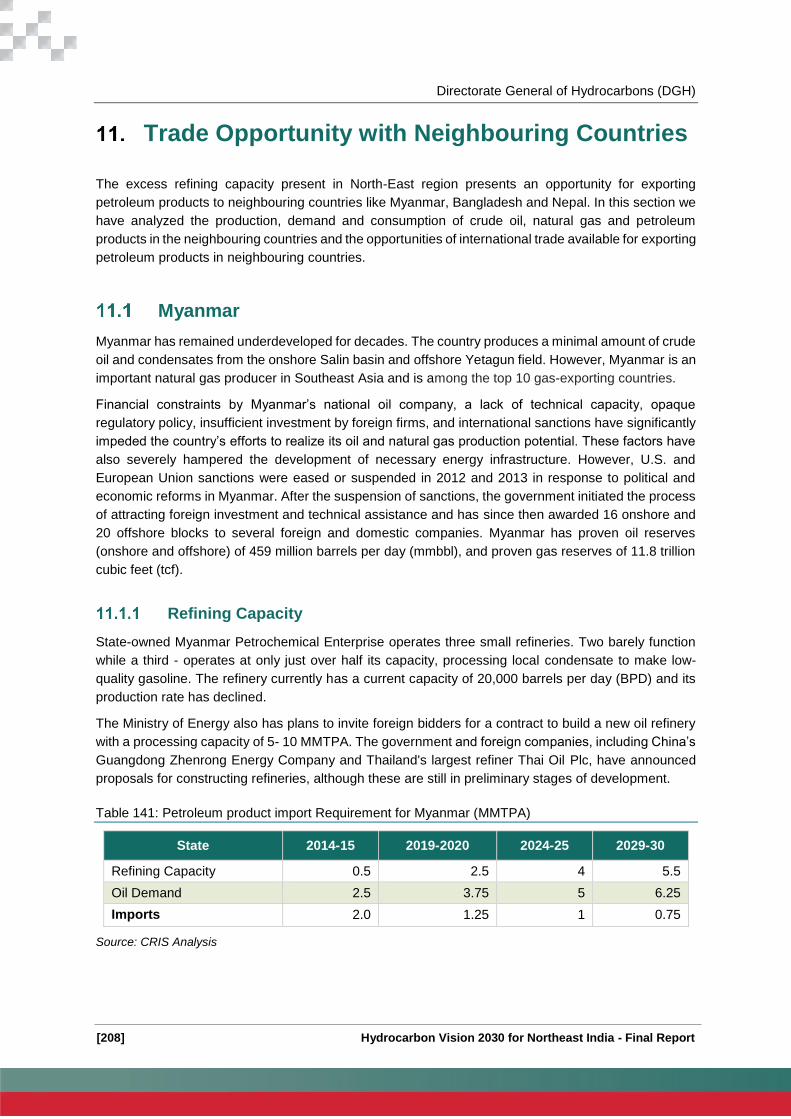
Directorate General of Hydrocarbons (DGH)
[208] Hydrocarbon Vision 2030 for Northeast India - Final Report
Trade Opportunity with Neighbouring Countries
The excess refining capacity present in North-East region presents an opportunity for exporting
petroleum products to neighbouring countries like Myanmar, Bangladesh and Nepal. In this section we
have analyzed the production, demand and consumption of crude oil, natural gas and petroleum
products in the neighbouring countries and the opportunities of international trade available for exporting
petroleum products in neighbouring countries.
Myanmar
Myanmar has remained underdeveloped for decades. The country produces a minimal amount of crude
oil and condensates from the onshore Salin basin and offshore Yetagun field. However, Myanmar is an
important natural gas producer in Southeast Asia and is among the top 10 gas-exporting countries.
Financial constraints by Myanmar’s national oil company, a lack of technical capacity, opaque
regulatory policy, insufficient investment by foreign firms, and international sanctions have significantly
impeded the country’s efforts to realize its oil and natural gas production potential. These factors have
also severely hampered the development of necessary energy infrastructure. However, U.S. and
European Union sanctions were eased or suspended in 2012 and 2013 in response to political and
economic reforms in Myanmar. After the suspension of sanctions, the government initiated the process
of attracting foreign investment and technical assistance and has since then awarded 16 onshore and
20 offshore blocks to several foreign and domestic companies. Myanmar has proven oil reserves
(onshore and offshore) of 459 million barrels per day (mmbbl), and proven gas reserves of 11.8 trillion
cubic feet (tcf).
Refining Capacity
State-owned Myanmar Petrochemical Enterprise operates three small refineries. Two barely function
while a third - operates at only just over half its capacity, processing local condensate to make low-
quality gasoline. The refinery currently has a current capacity of 20,000 barrels per day (BPD) and its
production rate has declined.
The Ministry of Energy also has plans to invite foreign bidders for a contract to build a new oil refinery
with a processing capacity of 5- 10 MMTPA. The government and foreign companies, including China’s
Guangdong Zhenrong Energy Company and Thailand's largest refiner Thai Oil Plc, have announced
proposals for constructing refineries, although these are still in preliminary stages of development.
Table 141: Petroleum product import Requirement for Myanmar (MMTPA)
State 2014-15 2019-2020 2024-25 2029-30
Refining Capacity 0.5 2.5 4 5.5
Oil Demand 2.5 3.75 5 6.25
Imports 2.0 1.25 1 0.75
Source: CRIS Analysis

Directorate General of Hydrocarbons (DGH)
[209] Hydrocarbon Vision 2030 for Northeast India- Final Report
Crude Oil
Fuel demand has gradually increased from 13,000 barrels per day (b/d) in 2000 to approximately 50,000
barrels per day (bpd) in 2015 as per estimates from Energy ministry data and undocumented fuel flows
smuggled in from Thailand. However, the country’s limited domestic production and refining capacity
makes Myanmar a net importer of petroleum products.
The table above shows the import requirement of Myanmar despite the augmentation in refinery
capacity by international players.
Natural Gas
Natural gas production in Myanmar has grown many folds over the last decade, from 3.4 BCM in 2000
to 13.1 BCM in 2014 at a CAGR of 12.1%. Development in the country has led to increase in its
consumption, which reached a peak of 4.59 BCM in 2013.
This surplus availability makes it an exporter. Majority of the natural gas produced in Myanmar is
exported to Thailand and, more recently, to China. However, in anticipation of greater local gas demand
for the power, fertilizer and transportation industries, Myanmar has placed a domestic obligation to
retain 25% of the production from any new projects for the domestic market and is in the process of
negotiating contracts. PTTEP, Thailand’s national oil company, launched commercial operations of the
Zawtika gas project in the second half of 2014 and expects to produce 3.11 BCM per year at the field’s
peak. This project is slated to increase natural gas exports to Thailand and serve Burma’s domestic
market.
This surplus reflects an opportunity for imports from Myanmar into NER of India.
Bangladesh
Refining Capacity
Bangladesh processes crude oil at its 33,000 b/d refinery owned by Eastern Refinery Limited (ERL), a
subsidiary of Bangladesh Petroleum Corporation. Bangladesh Petroleum Corporation plans to nearly
triple the refinery’s capacity to 90,000 b/d by 2016.
Table 142: Petroleum product import Requirement for Bangladesh (MMTPA)
State 2014-15 2019-2020 2024-25 2029-30
Refining Capacity 1.5 1.5 4.5 4.5
POL Demand 5.5 5.5 8.1 9.9
Imports 4 4 3.6 5.4
Source: CRIS Analysis
Crude Oil
Bangladesh is a net importer of crude oil and petroleum products with minimal production being done
domestically. In 2013, the country produced 4,500 b/d of crude oil and consumed nearly 119,000 b/d.
of petroleum products. Most of Bangladesh’s petro-products currently come from Malaysia and

Directorate General of Hydrocarbons (DGH)
[210] Hydrocarbon Vision 2030 for Northeast India - Final Report
Singapore. During 2012-13, Bangladesh imported petroleum products worth only USD 138 million from
India, while imports from Malaysia and Singapore added up to USD 1,362 million.
A steadily increasing demand for petroleum products holds significant demand potential despite ERL’s
capacity expansion.
Natural Gas
Bangladesh is the 7th largest producer of natural gas in Asia and produced 23.6 BCM in 2014.
Production of natural gas in Bangladesh has grown at close to 7% CAGR over 2000 to 2014. All of the
natural gas produced is consumed domestically. Bangladesh, which once considered the possibility of
exporting natural gas in the wake of promising new gas discoveries offshore, is currently short of 5-10
BCMA versus domestic demand, primarily from power sector
Nepal
Nepal is primarily dependent upon fuelwood as a primary source of energy. Fuelwood fulfills close to
65 – 70% of Nepal’s total energy needs, while petroleum products fulfill 15% of the energy demand.
Nepal does not produce any oil and gas and is solely dependent upon import of petroleum products
from India.
The demand of products like MS, HSD, SKO, ATF and LPG is about 1.2 million ton (MT) per annum
and is annually growing at 10%. All the petroleum products consumed in Nepal are procured and
imported from India under an agreement with Indian Oil Corporation Ltd (IOCL). Nepal Oil Corporation
uplifts petroleum products as per its requirement from IOC's different refineries, terminals and depots
situated in eastern and northern part of India. The supply of LPG is arranged under a PDO (Product
Delivery Order) system and IOCL is providing Bulk LPG to Nepalese LPG industries from Haldia,
Barauni, Mathura and Panipat refineries.
To meet the increasing demand, a MOU between IOC and NOC for construction of cross border
Petroleum Product Pipeline from IOCL's depot (Raxaul) to NOC's depot (Amlekhgunj) has been signed.
Table 143: Petroleum product import Requirement for Nepal (MMTPA)
State 2014-15 2019-2020 2024-25 2029-30
Refining Capacity - - -
POL Demand 1.4 1.70 2.07 2.52
Imports 1.4 1.70 2.07 2.52
Source: CRIS Analysis
As mentioned in the table above, Nepal presents a big market for petroleum products by replacing
fuelwood with petroleum products.
Bhutan
Bhutan has no natural petroleum or natural gas reserves. The kingdom has some 1.3 million tonnes of
coal reserves, but extracts only about 1,000 tonnes of coal yearly, entirely for domestic consumption.
Bhutan also imports oil at some 1,000 barrels per day. Most oil imports supplied fuel for automobiles.

Directorate General of Hydrocarbons (DGH)
[211] Hydrocarbon Vision 2030 for Northeast India- Final Report
In the early 21st century, about 70 percent of all energy consumption in Bhutan was in the household
sector. Heating and cooking with firewood in particular accounted for between 70 and 90 percent of
total energy consumption and virtually 100 percent of household energy consumption. In contrast,
commercial activities in Bhutan were fueled mostly by hydroelectricity (about 97%), some fossil-fuel
based thermal power (about 3%), and a minimal amount of other fossil fuels. As a result, Bhutan sold
much of its hydroelectricity to India during summer months.
This also presents a potential for petroleum products by replacing fuelwood with petroleum products.
Sri Lanka
Refining Capacity
The domestic oil and gas industry is small, with no hydrocarbon production, despite a refinery at
Sapugaskanda with a processing capacity of 50,000 barrels of oil per day (bopd) or 2 MMTPA. The Sri
Lankan government has been looking at setting up another refinery. They were looking at expressions
of interest from various countries. IOC, which is already present in Sri Lanka through its subsidiary
Lanka IOC, has come forward to set up the refinery in a joint venture with the Sri Lankan government.
Considering Sri Lanka’s fuel consumption targets for 2020 and 2030, IOCL may look at a capacity
addition of 5- 9 MMTPA.
Table 144: Petroleum product import Requirement for Myanmar (MMTPA)
State 2014-15 2019-2020 2024-25 2029-30
Refining Capacity 2 5 5 5
POL Demand 4.5 6.5 7.5 8.5
Imports 2.0 1.5 2.5 3.5
Source: CRIS Analysis
Crude Oil
The country is dependent on petroleum imports for its domestic needs with oil consumption of around
92000 barrels per day. Over the last 15 years or so, the demand for petroleum products has risen at an
annual average rate of about 5 percent. The current demand of 4.5 MMTPA is expected to reach 8
MMTPA by 2030
Sri Lanka’s only refinery has a refining capacity of 2 MMTPA. The country’s fuel consumption is 4.5
MMTPA, which necessitates 2.5 MMTPA of imports. Sri Lanka’s fuel needs are estimated to rise to 6.5
MMTPA by 2020 and 8.5 MMTPA by 2030. Instead of importing fuel, the country plans to import crude
oil and process it.
The South Asian island-state, located off the southeastern coast of India in the Indian Ocean, will still
be dependent on imports of petroleum imports for its domestic needs, despite the proposed expansion
in refinery capacity.
Natural Gas
Cairn India Ltd. made two gas discoveries at Dorado and Barracuda wells in 2011 as part of a four-
well drilling program in Sri Lanka’s Mannar Basin. The first gas from Cairn is expected to be produced
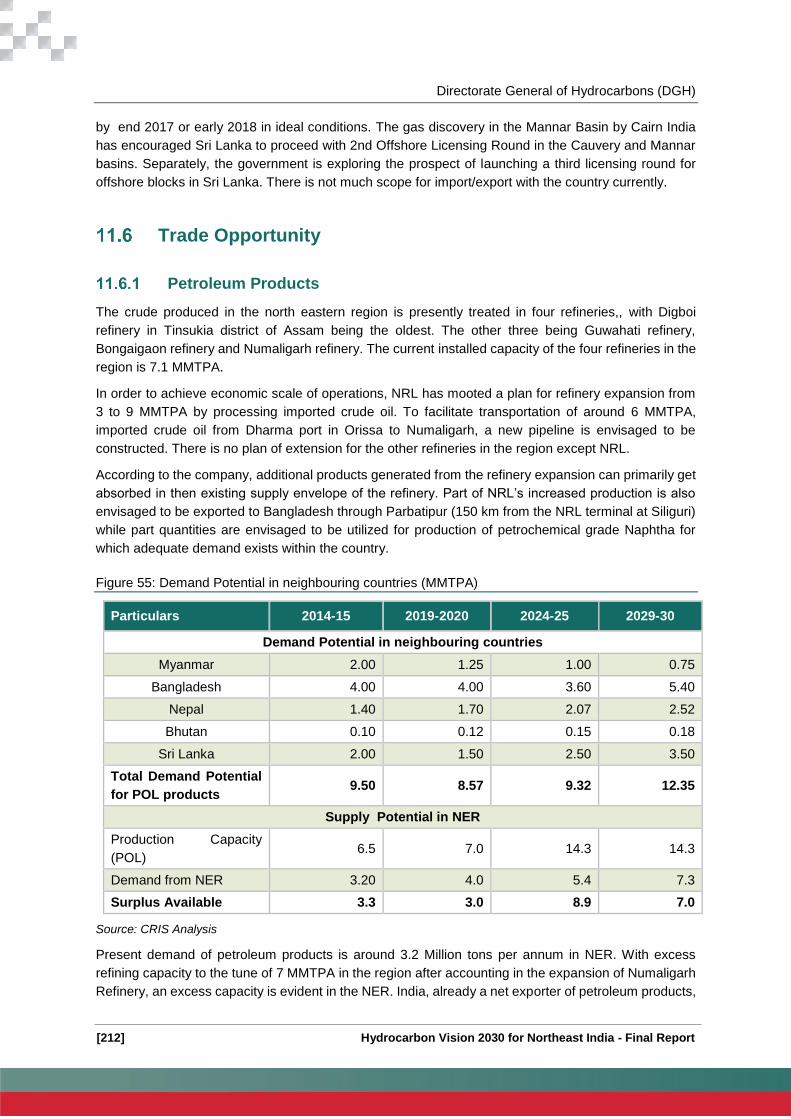
Directorate General of Hydrocarbons (DGH)
[212] Hydrocarbon Vision 2030 for Northeast India - Final Report
by end 2017 or early 2018 in ideal conditions. The gas discovery in the Mannar Basin by Cairn India
has encouraged Sri Lanka to proceed with 2nd Offshore Licensing Round in the Cauvery and Mannar
basins. Separately, the government is exploring the prospect of launching a third licensing round for
offshore blocks in Sri Lanka. There is not much scope for import/export with the country currently.
Trade Opportunity
Petroleum Products
The crude produced in the north eastern region is presently treated in four refineries,, with Digboi
refinery in Tinsukia district of Assam being the oldest. The other three being Guwahati refinery,
Bongaigaon refinery and Numaligarh refinery. The current installed capacity of the four refineries in the
region is 7.1 MMTPA.
In order to achieve economic scale of operations, NRL has mooted a plan for refinery expansion from
3 to 9 MMTPA by processing imported crude oil. To facilitate transportation of around 6 MMTPA,
imported crude oil from Dharma port in Orissa to Numaligarh, a new pipeline is envisaged to be
constructed. There is no plan of extension for the other refineries in the region except NRL.
According to the company, additional products generated from the refinery expansion can primarily get
absorbed in then existing supply envelope of the refinery. Part of NRL’s increased production is also
envisaged to be exported to Bangladesh through Parbatipur (150 km from the NRL terminal at Siliguri)
while part quantities are envisaged to be utilized for production of petrochemical grade Naphtha for
which adequate demand exists within the country.
Figure 55: Demand Potential in neighbouring countries (MMTPA)
Particulars 2014-15 2019-2020 2024-25 2029-30
Demand Potential in neighbouring countries
Myanmar 2.00 1.25 1.00 0.75
Bangladesh 4.00 4.00 3.60 5.40
Nepal 1.40 1.70 2.07 2.52
Bhutan 0.10 0.12 0.15 0.18
Sri Lanka 2.00 1.50 2.50 3.50
Total Demand Potential
for POL products 9.50 8.57 9.32 12.35
Supply Potential in NER
Production Capacity
(POL) 6.5 7.0 14.3 14.3
Demand from NER 3.20 4.0 5.4 7.3
Surplus Available 3.3 3.0 8.9 7.0
Source: CRIS Analysis
Present demand of petroleum products is around 3.2 Million tons per annum in NER. With excess
refining capacity to the tune of 7 MMTPA in the region after accounting in the expansion of Numaligarh
Refinery, an excess capacity is evident in the NER. India, already a net exporter of petroleum products,

Directorate General of Hydrocarbons (DGH)
[213] Hydrocarbon Vision 2030 for Northeast India- Final Report
can capitalize such excess capacity better by catering to demand from the neighbouring nations rather
than exports to farfetched markets.
Bangladesh, Myanmar, Srilanka and Bhutan holds a significant demand that should be targeted to be
served from North Eastern region. Nepal is being already served by Indian Oil Corporation.
Natural Gas
In case of Bhutan and Nepal, fuelwood contributes close to 65-70% of total primary energy need. This
presents an excellent opportunity to initiate steps to replace fuelwood by cleaner sources of energy i.e.
natural gas and LPG.
In case of Myanmar, there exists a significant gap between production and consumption of natural gas.
Therefore, the option to import gas from Myanmar through North-East may be considered, for
consumption in North East Region and bringing gas into the country once the gas pipeline network in
NER develops and is linked to the national gas grid. Development of gas grid in the region would benefit
the states in terms of additional revenues and would provide opportunities for setting up industries like
power and petrochemical plants in the region which would bring in investment and employment
opportunities to the local population. China’s CNPC has already commissioned an onshore natural gas
pipeline from Myanmar of capacity 12 BCM/year to carry gas from the Shwe gas project.
Directorate General of Hydrocarbons (DGH)
[214] Hydrocarbon Vision 2030 for Northeast India - Final Report
Make in India
Make in India initiative was launched by the honorable Prime Minister of India on 25 September 2014,
with an objective to make India a renowned manufacturing hub for key sectors. Make in India program
focusses on pursuing new initiatives to facilitate investment and foster innovation, attract FDI in the
country, protecting intellectual property rights of innovators by developing conducive policies and to
develop national manufacturing and raising its standards to global levels. The policy is the first of its
kind for the manufacturing sector as it addresses areas of regulation, infrastructure, skill development,
technology, availability of finance, exit mechanism and other pertinent factors related to the growth of
the sector.
Key sectors
The key sectors that have been identified for Make in India drive are:
Oil and Gas
Mining
Thermal power
Construction
Automobiles
Defense manufacturing
Renewable energy etc.
Oil and gas is a key sector under the initiative since India is largely dependent upon import of Oil and
gas for meeting its domestic oil and gas requirement with close to 80% of oil and 30% of natural gas
being imported. We have described below, the Make in India plan for Oil and gas sector in India.
Make in India – Oil & Gas Sector
India is an energy starved nation, with one of the lowest per capital energy consumption within
developing countries. In order to boost manufacturing, maintaining a GDP growth rate in the range of 7
– 8 % and uplifting the status of the nation to developed category, there is huge demand of energy
which is looming to be met. As per estimates the demand for energy is going to increase roughly three
times by 2035 to 1516 MMTOE, from current consumption of 638 MMTOE in 2014. With lower crude
prices and impetus on increasing consumption of natural gas, the share of oil and gas in India’s primary
energy mix is bound to increase. Presently oil and gas together contributes close to 30% of India’s
energy requirement. To promote development of oil and gas sector in India, the government has taken
several key initiatives which are listed below:
Government to auction 69 marginal oil and gas blocks under the revenue sharing model. These
blocks are estimated to hold 89 MMTOE of oil and gas resources.
The government is preparing to issue the 10th round of bidding for the National Exploration
Licensing Policy; 60% of prognosticated oil and gas resources are yet to be harnessed
Pricing reforms in natural gas sector have been brought in by the government to make a move
towards international market driven prices
Policy on CBM and shale gas to promote E&P companies to invest in development of these energy
sources

Directorate General of Hydrocarbons (DGH)
[215] Hydrocarbon Vision 2030 for Northeast India- Final Report
Make in India – NER focus
With a major plan being chalked out for North East for oil and gas sector development in the region, the
make in India plan and NER development can go hand in hand. The key manufacturing activities have
been identified which can be planned in the region to improve upon the overall development agenda of
oil and gas sector.
Upstream
Equipment’s like drill pipes, nuts and bolts, casing and tubing, well head equipment, to be manufactured
in the region for local consumption and for exporting it to neighbouring countries like Myanmar and
Bangladesh. Further, setting up of service provider hub in NER can be thought of, so that small and
private players can have access to technologies/services that have been developed by ONGC and OIL
with their long experience of operating in the region.
Midstream
There is a proposal to lay more than 7500 Kms. of natural gas and petroleum products pipeline and
development of CGD infrastructure in NER. The construction activities related to the pipelines can be
carried out in the region. This will provide an opportunity for domestic and international manufacturers
to set up pipeline manufacturing units in NER.
Downstream
Expansion of refineries in NER and supplying the surplus petroleum products to neighbouring
countries like Bangladesh and Myanmar.
Develop NER as a wax hub as raw material is abundantly available
Brahmaputra cracker and Petrochemmical Limited have set up a petrochemical unit in Assam.
The Feedstock for the project will be Natural Gas and Naphtha. OIL and ONGC will supply
Natural Gas and Naphtha shall be supplied by NRL. The principal end products of the Complex
will be High Density Polyethylene (HDPE) and Linear Low Density polyethylene (LLDPE)
totaling 2, 20,000 Tonnes per Annum (TPA) and 60,000 TPA of Polypropylene (PP). The other
products include Raw Pyrolysis Gasoline and Fuel oil.
The products produced at BCPL have varying uses in the manufacturing of various plastic products.
The uses of principal end products from BCPL are given in table below:
Products Usage
LLDPE grade (MFI-0.9) Packaging films, Liners
LLDPE grade (MFI – 2.0) Stretch films and stretch film rolls
LLDPE grade (MFI- 4.0) High quality packaging films, bubble film packaging
HMHDPE (MFI –I21- 10) Trash bag, carrier bags
MDPE (MFI 3.0) Draining parts, fuel tanks etc.
MDPE (MFI 4.0) Tanks, containers, waste bins, road dividers
HDPE (MFI – 4.5) Dustbins, pallet boxes, fish crates, technical mouldings
HDPE (MFI – 8.4) Crates, boxes, pallets, closures, helmets
HDPE (MFI – 21) Housewares, buckets and baskets
HDPE (MFI – 1.0) Fishnets, raffia bags

Directorate General of Hydrocarbons (DGH)
[216] Hydrocarbon Vision 2030 for Northeast India - Final Report
Products Usage
HDPE (MFI -0.2) Oil containers, lube containers)
HDPE (MFI – I21 - 10) Large containers
Polypropylene
TQ Film (MFI-12) Textile overwraps, garments bag, snack food packaging
Raffia (MFI – 3.4) Raffia bags, leno bags
Injection moulding (MFI -
12) Rigid packaging, furniture, house wares, closures etc.
Downstream plastic manufacturing industries like polybags, plastic containers, packaging,
housewares etc. can be developed in NER using products produced at BCPL as a feedstock.
Other Industries around oil and Gas
Tyre manufacturering can be an option in northeast India, as the region is naturally rich in raw
material. Moreover, rubber produced can be consumed domestically or may be exported to
Bangladesh and Myanmar.
With surplus refining capacity coming in the region, and with availability of plastic and cracker
plants, small industries in plastic goods manufacturing can be set up by providing tax incentives.
Gas based power generation plants that consume locally produced natural gas, can be set up
in NER
Since country’s majority of wax production is being carried in NER, hence the region can be
developed as a wax hub by promoting candle manufacturing industry in the region
NRL has already envisaged production of bio-ethanol from Bamboo in NER. Other bio-ethanol
production units can be setup in the region to utilize bamboo or other feedstock sources for bio-
ethanol production
Imports in NER
The region is found to be deficient in production of various materials, despite being plentiful in raw
material. Some of the key items that are required to be imported in the region have been mentioned
below:
Bitumen
Readymade clothes/Synthetic fibers, Textile items, Cotton waste,
Cement, Bricks and Precious Stone
Food grains, Processed food items and drinks, Ginger, Chips,
Fertilizer
Most of these items can be produced locally at a much cheaper rate as raw materials are locally
avalibale in abundance. Therefore, steps need to be taken to incentive setting up industries to produce
such items locally.
Action Plan
Based on the concerns related to imports and lacks of manufacturing following action plan are
recommended:

Directorate General of Hydrocarbons (DGH)
[217] Hydrocarbon Vision 2030 for Northeast India- Final Report
Table 145: Action Plan for Make in India program in NER
Action Items Concerned
Authorities
Timeline
Short Term
(Less than 2
Years)
Medium Term
(2- 5 Years)
Long
Term (>
5 Years)
Upstream
Manufacturing Equipment’s
like Drilling Rigs, drill pipes,
nuts and bolts, casing and
tubing, well head
equipment, to be
manufactured in NER and
export of same to
Bangladesh, Myanmar &
Malaysia
DIPP/MoPNG Review for
implementation
Development of
manufacturing
units in the
region
Midstream
To promote industries
related to pipe
manufacturing/Steel in
NER as potential is for
development of pipeline of
1000-1200 KM per year
DIPP/MoPNG Review for
implementation Plants to be
setup in the
region
Downstream
Expansion of refineries in
NER
NRL/IOCL Review for
implementation
along with crude
oil pipelines
Develop
roadmap for
implementation
of refinery along
with pipeline
network
Other industries around oil and gas
Development of
concomitant infrastructure
to facilitate production and
evacuation of finished
products from hydrocarbon
related industries
MoPNG/Ministry of
Finance/Ministry of
Commerce/Ministr
y of power
Identifying key
industries to be
setup
Envisaged plan
to be
implemented in
the medium term
To promote industries
related to decorative items
based on Wax.
DIPP Candle
manufacturing
industry to be

Directorate General of Hydrocarbons (DGH)
[218] Hydrocarbon Vision 2030 for Northeast India - Final Report
Action Items Concerned
Authorities
Timeline
Short Term
(Less than 2
Years)
Medium Term
(2- 5 Years)
Long
Term (>
5 Years)
developed in the
region
To promote Bio ethanol
production in NER as large
quantity of raw material
(Bamboo) is available.
MNRE/MoPNG Identification of
key regions
where bio-
ethanol
production units
can be set up
Implementation
plan to
commence

Directorate General of Hydrocarbons (DGH)
[219] Hydrocarbon Vision 2030 for Northeast India- Final Report
Health/Medical services
For health and medical services, National Health Mission has been setup with a vision of “Attainment
of Universal Access to Equitable, Affordable and Quality health care services, accountable and
responsive to people’s needs, with effective inter-sectoral convergent action to address the wider social
determinants of health”.
Objectives of National Health Mission:
There are a set of objectives that have been identified that have been included as a part of the 12th five
year plan. The list of objectives have been given below
Reduce Mother Mortality Rate (MMR) to 1/1000 live births
Reduce Infant Mortality Rate (IMR) to 25/1000 live births
Prevention and reduction of anemia in women aged 15–49 years
Prevent and reduce mortality & morbidity from communicable, non- communicable; injuries and
emerging diseases
Reduce household out-of-pocket expenditure on total health care expenditure
Reduce annual incidence and mortality from Tuberculosis by half
Reduce prevalence of Leprosy to <1/10000 population and incidence to zero in all districts
Annual Malaria Incidence to be <1/1000
Less than 1 per cent microfilaria prevalence in all districts
Kala-azar Elimination by 2015, <1 case per 10000 population in all blocks
Initiatives under NHM
To meet the above mentioned objectives, certain initiatives have been taken by the government. These
initiatives are mentioned below:
Mobile Medical Units (MMU): is a mechanism to provide outreach services in rural and remote
areas. This is not meant to transfer patients. This provides on the spot medical treatment.
National Ambulance Service: To develop a network of ambulances and to reach the critical areas
with delays.
Accredited Social Health Activists (ASHA): It provides the villages with a trained female community
health activist. The activist will be selected from the village itself and accountable to it, the ASHA
will be trained to work as an interface between the community and the public health system.
Rogi Kalyan Samiti (Patient Welfare Committee) / Hospital Management Society: Objective of this
scheme is to provide better medical facilities with certain standards that are met.
Janani Suraksha Yojana (JSY): It is being implemented with the objective of reducing maternal and
neonatal mortality by promoting institutional delivery among poor pregnant women.
Janani Shishu Suraksha Karyakram (JSSK): The scheme is slated to benefit more than 12 million
pregnant woman. This initiative promotes safe child delivery in hospitals rather than at homes.
Rastariya Bal Swasthya Karyakram (RBSK): This initiative recognizes diseases in children from 0-
18 years of age and providing health services to these children.
Mother and Child Health Wings (MCH Wings): With a focus to reduce maternal and child mortality,
dedicated Mother and Child Health Wings with 100/50/30 bed capacity have been sanctioned in
high case load district hospitals and CHCs which would create additional beds for mothers and
children.
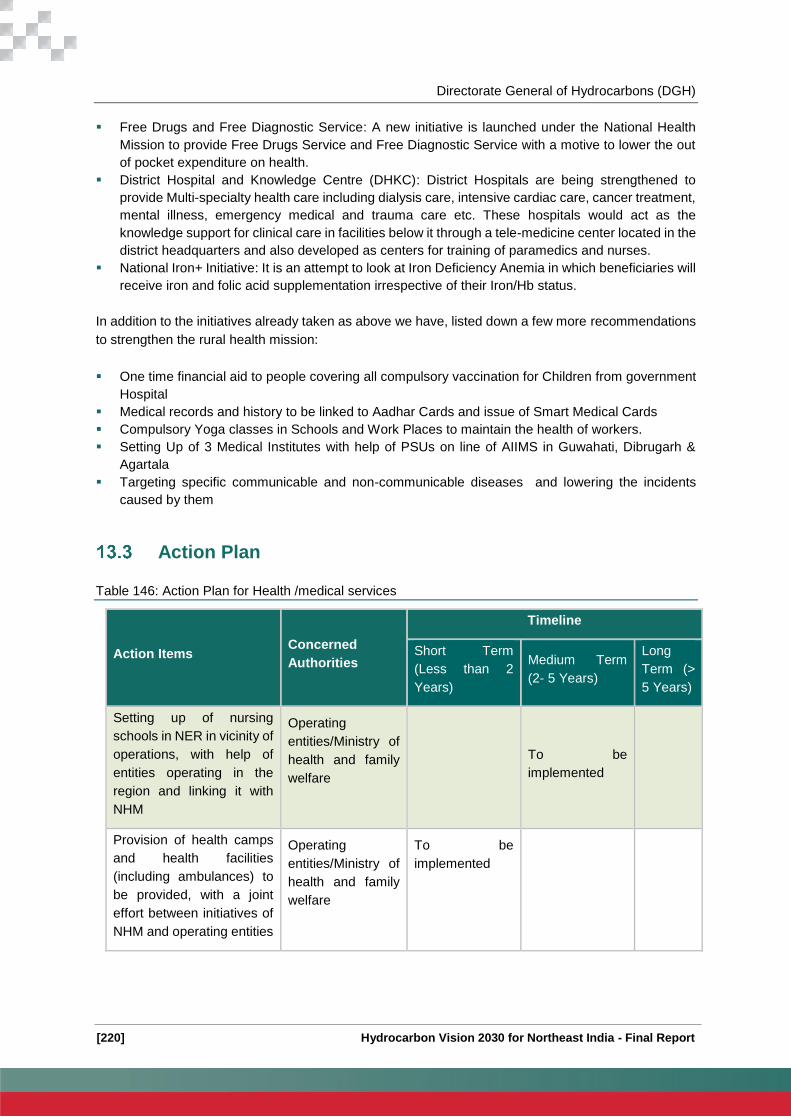
Directorate General of Hydrocarbons (DGH)
[220] Hydrocarbon Vision 2030 for Northeast India - Final Report
Free Drugs and Free Diagnostic Service: A new initiative is launched under the National Health
Mission to provide Free Drugs Service and Free Diagnostic Service with a motive to lower the out
of pocket expenditure on health.
District Hospital and Knowledge Centre (DHKC): District Hospitals are being strengthened to
provide Multi-specialty health care including dialysis care, intensive cardiac care, cancer treatment,
mental illness, emergency medical and trauma care etc. These hospitals would act as the
knowledge support for clinical care in facilities below it through a tele-medicine center located in the
district headquarters and also developed as centers for training of paramedics and nurses.
National Iron+ Initiative: It is an attempt to look at Iron Deficiency Anemia in which beneficiaries will
receive iron and folic acid supplementation irrespective of their Iron/Hb status.
In addition to the initiatives already taken as above we have, listed down a few more recommendations
to strengthen the rural health mission:
One time financial aid to people covering all compulsory vaccination for Children from government
Hospital
Medical records and history to be linked to Aadhar Cards and issue of Smart Medical Cards
Compulsory Yoga classes in Schools and Work Places to maintain the health of workers.
Setting Up of 3 Medical Institutes with help of PSUs on line of AIIMS in Guwahati, Dibrugarh &
Agartala
Targeting specific communicable and non-communicable diseases and lowering the incidents
caused by them
Action Plan
Table 146: Action Plan for Health /medical services
Action Items Concerned
Authorities
Timeline
Short Term
(Less than 2
Years)
Medium Term
(2- 5 Years)
Long
Term (>
5 Years)
Setting up of nursing
schools in NER in vicinity of
operations, with help of
entities operating in the
region and linking it with
NHM
Operating
entities/Ministry of
health and family
welfare
To be
implemented
Provision of health camps
and health facilities
(including ambulances) to
be provided, with a joint
effort between initiatives of
NHM and operating entities
Operating
entities/Ministry of
health and family
welfare
To be
implemented
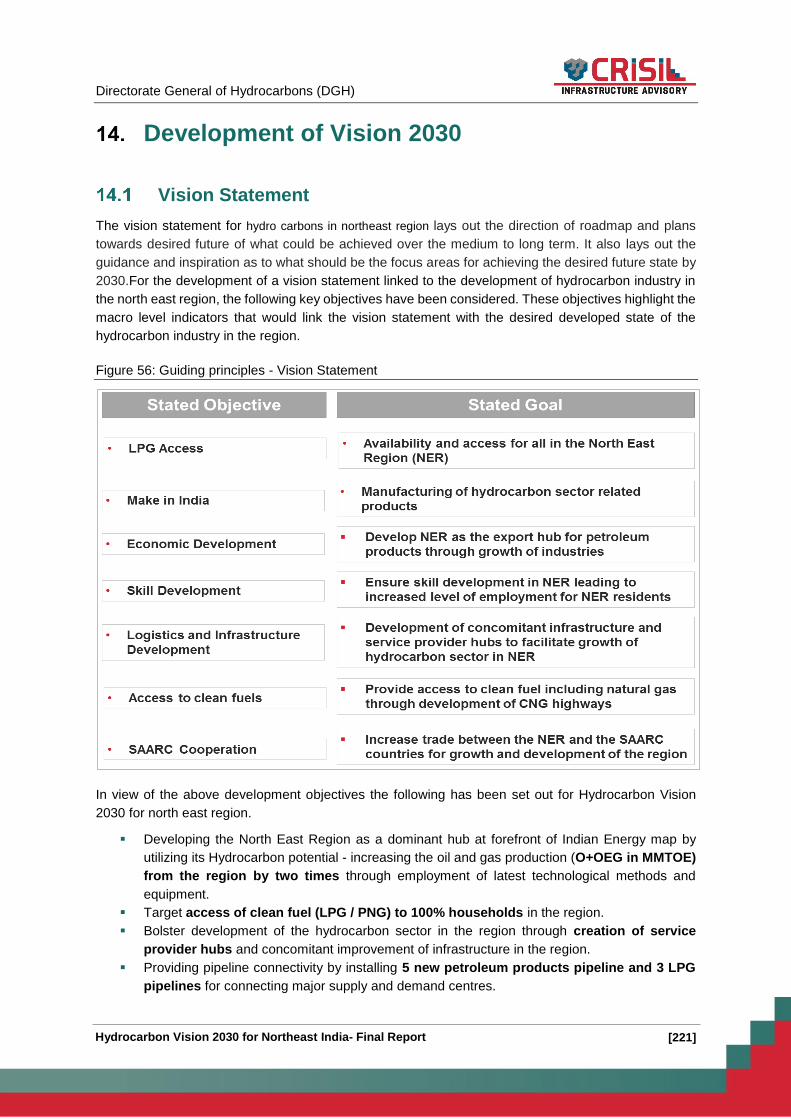
Directorate General of Hydrocarbons (DGH)
[221] Hydrocarbon Vision 2030 for Northeast India- Final Report
Development of Vision 2030
Vision Statement
The vision statement for hydro carbons in northeast region lays out the direction of roadmap and plans
towards desired future of what could be achieved over the medium to long term. It also lays out the
guidance and inspiration as to what should be the focus areas for achieving the desired future state by
2030.For the development of a vision statement linked to the development of hydrocarbon industry in
the north east region, the following key objectives have been considered. These objectives highlight the
macro level indicators that would link the vision statement with the desired developed state of the
hydrocarbon industry in the region. To Put North
Figure 56: Guiding principles - Vision Statement
In view of the above development objectives the following has been set out for Hydrocarbon Vision
2030 for north east region.
Developing the North East Region as a dominant hub at forefront of Indian Energy map by
utilizing its Hydrocarbon potential - increasing the oil and gas production (O+OEG in MMTOE)
from the region by two times through employment of latest technological methods and
equipment.
Target access of clean fuel (LPG / PNG) to 100% households in the region.
Bolster development of the hydrocarbon sector in the region through creation of service
provider hubs and concomitant improvement of infrastructure in the region.
Providing pipeline connectivity by installing 5 new petroleum products pipeline and 3 LPG
pipelines for connecting major supply and demand centres.

Directorate General of Hydrocarbons (DGH)
[222] Hydrocarbon Vision 2030 for Northeast India - Final Report
Transition towards usage of sustainable forms of energy by development of natural gas grid
and CNG highways connecting the states in the region and also to the national gas grid to
increase consumption of natural gas as a fuel of choice.
Develop the manufacturing industry in the region by focusing on the hydrocarbon sector
related products like drill pipes, nuts and bolts, casing and tubing and other spare parts.
Facilitating the consumption of petroleum products in the region through industrial development
and improvement in the pipeline transport infrastructure.
Increase the production of bio fuels in the region towards providing access to clean fuels for
all in the north east region.
Development of employment opportunities in region through skill development and by
promoting industries in the Hydrocarbon and allied sectors like Power, Fertilizer, Plastic
industries and realizing the potential of the region as an export hub for petroleum products to
neighbouring countries like Bangladesh and Myanmar.
Encourage hydrocarbons trade with SAARC countries surrounding the region to cohesively
work towards developing the hydrocarbon potential of the north east for regional as well as
national good.

Directorate General of Hydrocarbons (DGH)
[223] Hydrocarbon Vision 2030 for Northeast India- Final Report
Appendix
Power Transmission Infrastructure in Northeast India
Need for Power Transmission network in Northeast India
Northeast India faced a peak power deficit of 12.9% and energy deficit of 8.7% in 2014-15 which have
added to the misery of the region’s economy. Further, power transmission constraints have also made
it difficult to evacuate excess power and channel it to areas that face shortages. Projects have had to
purchase power from costlier sources while others remained under-utilized. Hence, there is an urgent
need to timely address underlying issues in the transmission sector to ensure power demand is
effectively met in the future.
Existing Transmission Infrastructure in Northeast India
The table below provides the status of power transmission network in Northeast India. It can be
observed that only 590 ckm of inter-regional transmission line has been laid in the region till now.
Further, the numbers of available substations are only 14. Therefore, the region registers very high
transmission losses due to unavailability of high voltage network.
Table 147: Existing Power transmission network in Northeast India
Equipment Category Units (ckm/ Nos)
Transmission Lines
400 kV 1870
220kV 545
132/66 kV 1810
Inter-regional (400 kV) 430
Inter-regional (220 kV) 160
Substations
1445 MVA 14 Nos
Source: MDONER
15.1.2.1 Proposed Transmission Network
A comprehensive scheme for strengthening of transmission, sub-transmission and distribution system
has been evolved by CEA in consultation with POWERGRID and NER states. The details of the scheme
have been presented below:
Transmission system associated with Lower Subansiri HEP (2000 MW) and Kameng HEP (600
MW) in Arunachal Pradesh:
Under this scheme, POWERGRID is constructing dedicated 400kV transmission system to
interconnect the generating station to the pooling s/s at Bishwanath Chariali in Assam.
6000 MW HVDC line (800kV) from Bishwanath Chariali in NER to Agra in Northern region for
transmission of power from NER to NR/WR.

Directorate General of Hydrocarbons (DGH)
[224] Hydrocarbon Vision 2030 for Northeast India - Final Report
Transmission system for Pallatana (726 MW) & Bongaigaon (750 MW) being constructed by
NETC (JV of OTPC-35%, Tripura-10%, Assam-13%, Mizoram-10%, Manipur-6%,
POWERGRID-26%) - 400kV D/C Pallatana – Silchar Line – 254 Kms.
8 no. of 400, 220 & 132kV new S/s (Silchar & Mariani in Assam, Rowing, Tezu & Namsai in
Arunachal Pr., Imphal in Manipur, Melriat in Mizoram and Mokokchung in Nagaland)
14 no. of new 400, 220 & 132kV Transmission Lines
Pallatana - Surajmaninagar 400kV D/C line (charged at 132kV) (for Tripura)
Silchar – Purba Kanchan Bari 400kV D/C line (charged at 132kV) (for Tripura)
Silchar – Melriat (New) 400kV D/C line (charged at 132kV) (for Mizoram)
Silchar – Imphal (New) 400kV D/C line (charged at 132kV) (for Manipur)
Mariani(new) - Mokokchung (PG) 220kV D/C line (for Nagaland)
Pasighat–Roing–Tezu–Namsai 132kV S/c line (on D/c tower) (for Ar. Pradesh)
State specific issues
Assam
Law and order situation
Since the restructuring of Assam after independence, communal tensions, cross border migration from
Bangladesh, sluggish economic growth, and ethnic violence have caused instability in the state.
Separatist groups began forming along ethnic lines, and demands for autonomy and sovereignty grew,
resulting into fragmentation of Assam. The armed separatist groups like United Liberation Front of Asom
(ULFA), Kuki National Liberation Front (KNLF), National Democratic Front of Bodoland (NDFB) and
Kamtapur Liberation Organization (KLO) are still active in Assam. The various interventions by the
Government of India at different point of times have been able to pacify the armed movement to a
certain extent, however low-intensity military conflicts have continued.
The history of civil strife and various separatist movements have negatively impacted development
indicators of Assam. The modern day Assam has been struggling with border disputes with
neighbouring states, communal tensions and high rate of unemployment among younger population.
Issues such as bandhs, blockades, protest during public hearings, ransoms etc. have been further
hindering the industrial development in the state
Delay in getting clearances and approvals
The environmental clearance and approvals from different authorities proved to be the key challenge
for exploration activities. There have been significant delays in granting of clearances by MOEF and
state government of Assam. The table below provides the details of the blocks in which E&P activities
have been delayed due to delay in providing clearances.
S.No Blocks Issues
1 AA-ONN-
2001/3
Environmental Clearance/Forest Clearance not granted by MoEF /Govt.
of Assam 2
AA-ONN-
2003/1
3 AA-ONN-
2004/2
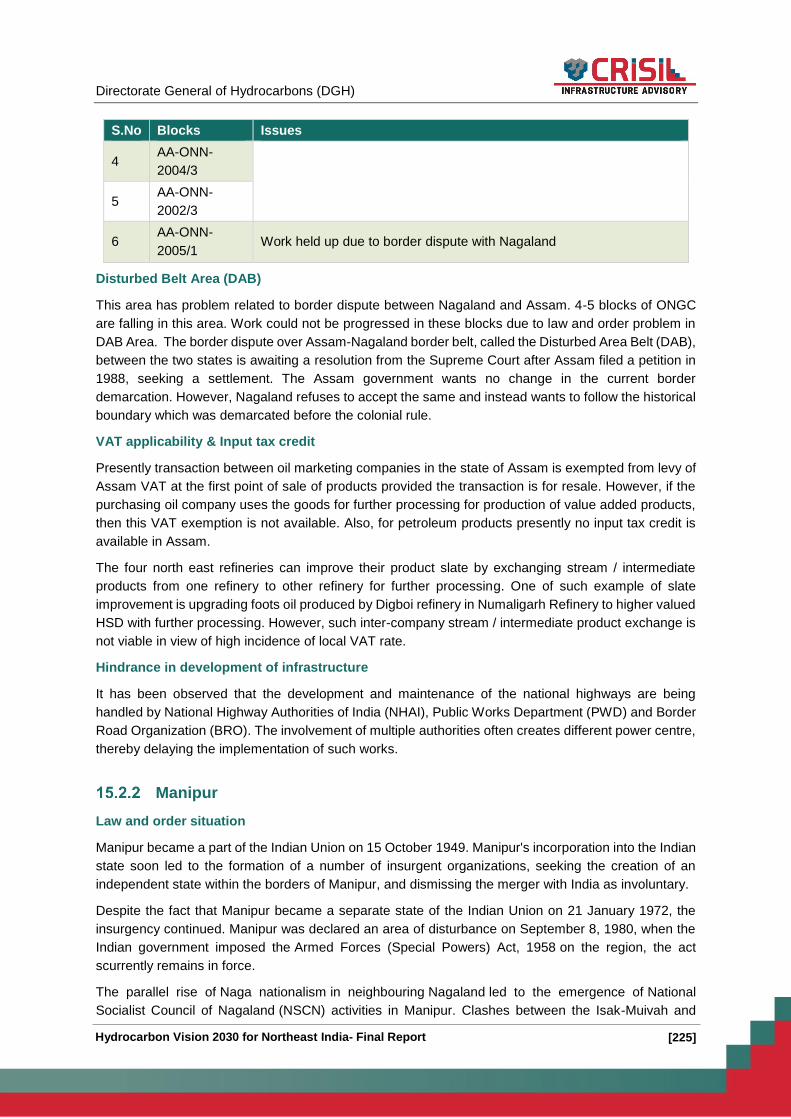
Directorate General of Hydrocarbons (DGH)
[225] Hydrocarbon Vision 2030 for Northeast India- Final Report
S.No Blocks Issues
4 AA-ONN-
2004/3
5 AA-ONN-
2002/3
6 AA-ONN-
2005/1 Work held up due to border dispute with Nagaland
Disturbed Belt Area (DAB)
This area has problem related to border dispute between Nagaland and Assam. 4-5 blocks of ONGC
are falling in this area. Work could not be progressed in these blocks due to law and order problem in
DAB Area. The border dispute over Assam-Nagaland border belt, called the Disturbed Area Belt (DAB),
between the two states is awaiting a resolution from the Supreme Court after Assam filed a petition in
1988, seeking a settlement. The Assam government wants no change in the current border
demarcation. However, Nagaland refuses to accept the same and instead wants to follow the historical
boundary which was demarcated before the colonial rule.
VAT applicability & Input tax credit
Presently transaction between oil marketing companies in the state of Assam is exempted from levy of
Assam VAT at the first point of sale of products provided the transaction is for resale. However, if the
purchasing oil company uses the goods for further processing for production of value added products,
then this VAT exemption is not available. Also, for petroleum products presently no input tax credit is
available in Assam.
The four north east refineries can improve their product slate by exchanging stream / intermediate
products from one refinery to other refinery for further processing. One of such example of slate
improvement is upgrading foots oil produced by Digboi refinery in Numaligarh Refinery to higher valued
HSD with further processing. However, such inter-company stream / intermediate product exchange is
not viable in view of high incidence of local VAT rate.
Hindrance in development of infrastructure
It has been observed that the development and maintenance of the national highways are being
handled by National Highway Authorities of India (NHAI), Public Works Department (PWD) and Border
Road Organization (BRO). The involvement of multiple authorities often creates different power centre,
thereby delaying the implementation of such works.
Manipur
Law and order situation
Manipur became a part of the Indian Union on 15 October 1949. Manipur's incorporation into the Indian
state soon led to the formation of a number of insurgent organizations, seeking the creation of an
independent state within the borders of Manipur, and dismissing the merger with India as involuntary.
Despite the fact that Manipur became a separate state of the Indian Union on 21 January 1972, the
insurgency continued. Manipur was declared an area of disturbance on September 8, 1980, when the
Indian government imposed the Armed Forces (Special Powers) Act, 1958 on the region, the act
scurrently remains in force.
The parallel rise of Naga nationalism in neighbouring Nagaland led to the emergence of National
Socialist Council of Nagaland (NSCN) activities in Manipur. Clashes between the Isak-Muivah and
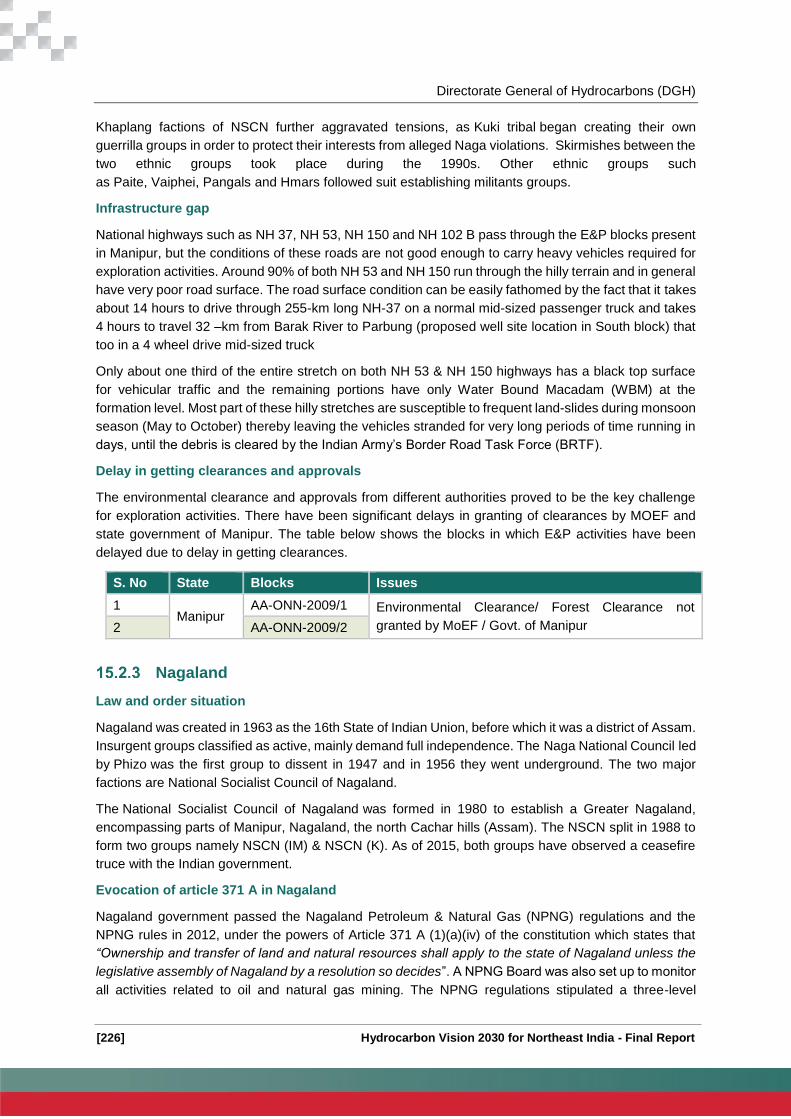
Directorate General of Hydrocarbons (DGH)
[226] Hydrocarbon Vision 2030 for Northeast India - Final Report
Khaplang factions of NSCN further aggravated tensions, as Kuki tribal began creating their own
guerrilla groups in order to protect their interests from alleged Naga violations. Skirmishes between the
two ethnic groups took place during the 1990s. Other ethnic groups such
as Paite, Vaiphei, Pangals and Hmars followed suit establishing militants groups.
Infrastructure gap
National highways such as NH 37, NH 53, NH 150 and NH 102 B pass through the E&P blocks present
in Manipur, but the conditions of these roads are not good enough to carry heavy vehicles required for
exploration activities. Around 90% of both NH 53 and NH 150 run through the hilly terrain and in general
have very poor road surface. The road surface condition can be easily fathomed by the fact that it takes
about 14 hours to drive through 255-km long NH-37 on a normal mid-sized passenger truck and takes
4 hours to travel 32 –km from Barak River to Parbung (proposed well site location in South block) that
too in a 4 wheel drive mid-sized truck
Only about one third of the entire stretch on both NH 53 & NH 150 highways has a black top surface
for vehicular traffic and the remaining portions have only Water Bound Macadam (WBM) at the
formation level. Most part of these hilly stretches are susceptible to frequent land-slides during monsoon
season (May to October) thereby leaving the vehicles stranded for very long periods of time running in
days, until the debris is cleared by the Indian Army’s Border Road Task Force (BRTF).
Delay in getting clearances and approvals
The environmental clearance and approvals from different authorities proved to be the key challenge
for exploration activities. There have been significant delays in granting of clearances by MOEF and
state government of Manipur. The table below shows the blocks in which E&P activities have been
delayed due to delay in getting clearances.
S. No State Blocks Issues
1 Manipur
AA-ONN-2009/1 Environmental Clearance/ Forest Clearance not
granted by MoEF / Govt. of Manipur 2 AA-ONN-2009/2
Nagaland
Law and order situation
Nagaland was created in 1963 as the 16th State of Indian Union, before which it was a district of Assam.
Insurgent groups classified as active, mainly demand full independence. The Naga National Council led
by Phizo was the first group to dissent in 1947 and in 1956 they went underground. The two major
factions are National Socialist Council of Nagaland.
The National Socialist Council of Nagaland was formed in 1980 to establish a Greater Nagaland,
encompassing parts of Manipur, Nagaland, the north Cachar hills (Assam). The NSCN split in 1988 to
form two groups namely NSCN (IM) & NSCN (K). As of 2015, both groups have observed a ceasefire
truce with the Indian government.
Evocation of article 371 A in Nagaland
Nagaland government passed the Nagaland Petroleum & Natural Gas (NPNG) regulations and the
NPNG rules in 2012, under the powers of Article 371 A (1)(a)(iv) of the constitution which states that
“Ownership and transfer of land and natural resources shall apply to the state of Nagaland unless the
legislative assembly of Nagaland by a resolution so decides”. A NPNG Board was also set up to monitor
all activities related to oil and natural gas mining. The NPNG regulations stipulated a three-level

Directorate General of Hydrocarbons (DGH)
[227] Hydrocarbon Vision 2030 for Northeast India- Final Report
committee: the first comprising state ministers; the second with senior bureaucrats; and the third with
junior government officers, advisers and others.
After the notification of the legislation in 2012, the government floated an Expression of Interest (EOI)
for 11 oil and gas zones, including the Wokha oil zone in Wokha district. A ministerial group gave the
permit for the oil zones at Wokha and Peren to a company called Metropolitan Oil & Gas Private Limited
(MOGPL). This included the Changpang oil field in Wokha, which was abandoned by ONGC in 1994.
The region remains to be in a state of tussle between the state and central government, thus hindering
any productive E&P activities in the region.
Delay in getting clearances and approvals
The environmental clearance and approvals from different authorities proved to be the key challenge
for exploration activities. The state of Nagaland has entirely stopped giving clearances for blocks
located in the region. This lead to relinquishment of blocks allotted in Nagaland under the NELP round.
The details of the two blocks that were relinquished by ONGC are given below:
S.
No Blocks Issues
9 AA-ONN-2001/4 Nagaland Govt. has either stopped or not allowed to commence
exploration activities 10 AA-ONN-2002/4
Tripura
Law and order situation
The insurgent groups in Tripura emerged in the end of the 1970s, as ethnic tensions between
the Bengali immigrants and the tribal native population who were outnumbered by the former hailing
from other parts of India and nearby Bangladesh which resulted in their being reduced to minority status
even threatening them economically, socially, culturally which thus resulted in a clarion call of
safeguarding tribal rights and cultures. Such being the extent of desperation naturally resulted in hatred
and suspicion and as such their status is classified as very active.
Infrastructure gap
Two blocks have been allocated till now in Tripura. While block AA-ONN-2001/1 has been awarded to
ONGC thorough NELP III round bidding, the second block i.e. AA-ONN-2002/1 has been won by the
consortium of GAIL and Jubilant Oil & Gas Private Ltd (JOGPL).
Connectivity of these blocks are through poorly constructed, single lane roads, which even lack black
top surface in some part of the stretch. In terms of rail infrastructure, the area is still in preliminary stages
of development.
The connectivity infrastructure in Tripura has been posing serious challenges to the exploration
activities in the state. Further, the railway network needs to be implemented in a time-bound manner.
Meghalaya
Law and order situation
The state of Meghalaya was separated from the state of Assam in 1971, in order to satisfy
the Khasi, Synteng and Garo for a separate state. The decision was initially praised as an example of
successful national integration into the wider Indian state.

Directorate General of Hydrocarbons (DGH)
[228] Hydrocarbon Vision 2030 for Northeast India - Final Report
This however failed to prevent the rise of national consciousness among the local tribal populations.
Later leading to a direct confrontation between Indian nationalism and the newly created Garo and
Khasi nationalisms. A parallel rise of nationalism in the other members of the Seven Sister States further
complicated the situation, resulting in occasional clashes between fellow rebel groups.
The state wealth distribution system further fueled the rising separatist movements, as funding is
practiced through per capita transfers, which largely benefits the leading ethnic group.
The first militant outfit to emerge in the region was the Hynniewtrep Achik Liberation Council (HALC), it
was formed in 1992, aiming to protect the interests of Meghalaya's indigenous population from the rise
of non-tribal ("Dkhar") immigration.
Mizoram
Law and order situation
Mizoram's tensions were largely due to the simmering Assamese domination and the neglect of
the Mizo people. In 1986, the Mizo accord ended the main secessionist movement led by the Mizo
National Front, bringing peace to the region. Insurgency status is classified as partially active, due to
secessionist/autonomy demands by the Hmars, chakmas and Brus.
Infrastructure gap
The national highways connecting the oil and gas blocks are single lane. The nearest airport in the
region is at Aizawl which is operated by Govt. of Mizoram. The airport is operational for short time
duration only.
Arunachal Pradesh
Infrastructure gap
The Kharsang oil Field is located in the state of Arunachal Pradesh about 50 Km east of Digboi Refinery
and is part of the Assam-Arakan Basin. The Kharsang license covers an area of approximately 10
square kms and is operated by GeoEnpro Petroleum Ltd. The connectivity to this block is via single
lane highway. The nearest railway station in the region is located 32 Kms away at Ledo in Assam, while
the nearest airport is located 135 kms away at Mohanbari in Dibrugarh district of the neighbouring state
of Assam.
The state has no railway infrastructure, leaving the delivery of goods and services completely on the
road infrastructure.

Directorate General of Hydrocarbons (DGH)
[229] Hydrocarbon Vision 2030 for Northeast India- Final Report
Annexure I: Abbreviation
Acronym Definition
AAI Airports Authority of India
ADC Autonomous District Council
AFS Aviation Fuel Stations
AGCL Assam Gas Company Limited
AICTE All India Council of Technical Education
AIDCL Assam Industrial Development Corporation Limited
AOGO Association of Oil and Gas Operators
ASEB Assam State Electricity Board
ATF Aviation Turbine Fuel
BCF Billion Cubic Feet
BCM Billion Cubic Meter
BCMA Billion Cubic Meter per Annum
BCPL Brahmaputra Cracker and Polymer Limited
BOE Barrel of Oil Equivalent
BPCL Bharat Petroleum Corporation Limited
BRO Border Roads Organization
BVFCL Brahmaputra Valley Fertilizer Corporation Limited
CAG Comptroller and Auditor General
CAGR Compounded Annual Growth Rate
CBM Coal Bed Methane
CCEA Cabinet Committee on Economic Affairs
CCGT Combined Cycle Gas Turbine
CCI Cement Corporation of India
CEA Central Electricity Authority
CGD City Gas Distribution
CIWTC Central Inland Water Corporation
CNG Compressed Natural Gas
CNPC China National Petroleum Corporation
DFR Detailed Feasibility Report
DGH Directorate General of Hydrocarbons
DIPP Department of Industrial Policy and Promotion
DPCL Dharma Port Company Limited
EIL Engineers India Limited
EOI Expression of Interest
EOL Essar Oil Limited
EOR Enhanced Oil Recovery

Directorate General of Hydrocarbons (DGH)
[230] Hydrocarbon Vision 2030 for Northeast India - Final Report
Acronym Definition
EPF Employees Provident Fund
ERL Eastern Refinery Limited
ESIC Employee's State Insurance Corporation
GAIL GAIL India Limited
GDP Gross Domestic Product
GLK Ground Line Kilometer
GSDP Gross State Domestic Product
GSPC Gujarat State Petroleum Corporation
HALC Hynniewtrep Achik Liberation Council
HDPE High Density Polyethylene
HEP Hydroelectric Power
HOEC Hindustan Oil Exploration Company
HPCL Hindustan Petroleum Corporation Limited
HSD High Speed Diesel
HVDC High Voltage Direct Current
IAF Indian Air Force
IIITAS Indian Institute of Information Technology and Advanced Sciences
IIP Indian Institute of Petroleum
IIPDF Indian Infrastructure Project Development Fund
IIT Indian Institute of Technology
IOC Indian Oil Corporation
IOR Improved Oil Recovery
ITI Indian Technical Institute
IWAI Inland Waterways Authority of India
IWT Inland Water Transport
JOGPL Jubilant Oil and Gas Pvt Ltd
JSPL Jindal Steel and Power
JVC Joint Venture Company
KLO Kamtapur Liberation Organization
KNLF Kuki National Liberation Front
KTA Kilo Tonnes per Annum
LDO Light Diesel Oil
LLDPE Linear Low Density polyethylene
LNG Liquefied Natural Gas
LPG Liquefied Petroleum Gas
LSHS Low Sulphur Heavy Stock
MDONER Ministry Of Development Of North Eastern Region
MDP Market Driven Price
MEA Ministry of External Affairs

Directorate General of Hydrocarbons (DGH)
[231] Hydrocarbon Vision 2030 for Northeast India- Final Report
Acronym Definition
MHA Ministry of Home Affairs
MMSCF Million Metric Standard Cubic Feet
MMSCM Million Metric Standard Cubic Meter
MMSCMD Million Metric Standard Cubic Meters per Day
MMT Million Metric Tonne
MMTPA Million Metric Tonnes per Annum
MOEF Ministry of Environment & Forests
MOGE Myanmar Oil and Gas Enterprise
MOGPL Metropolitan Oil & Gas Private Limited
MORTH Ministry of road transport and highways
MOU Memorandum of understanding
MSME Micro, Small and Medium Enterprise
MMTPA Million Tonnes per Annum
MVA Mega Volt Ampere
NAAC National Assessment and Accreditation Council
NDFB National Democratic Front of Bodoland
NDR National Data Repository
NEEPCO North Eastern Electric Power Corporation
NEFTU North East Frontier Technical University
NEIIPP North East Industrial and Investment Promotion Policy
NELP New Exploration Licensing Policy
NER North Eastern Railway
NERIST North Eastern Regional Institute of Science and Technology
NHAI National Highway Authority of India
NIT National Institute of Technology
NOC National Oil Companies
NPNG Nagaland Petroleum & Natural Gas
NRL Numaligarh Refinery Limited
NSCN National Socialist Council of Nagaland
NSDC National Skill Development Corporation India
NSDP Net State Domestic Product
OALP Open Acreage Licensing Policy
OEG Oil Equivalent of Gas
OFS Oil Field Services
OIIP Oil Initial in place
OIL Oil India Limited
OMC Oil Marketing Company
ONGC Oil & Natural Gas Corporation
OTPC ONGC Tripura Power Company

Directorate General of Hydrocarbons (DGH)
[232] Hydrocarbon Vision 2030 for Northeast India - Final Report
Acronym Definition
PCB Pollution Control Board
PDO Product Delivery Order
PEL Petroleum Exploration License
PML Petroleum Mining Lease
PNGRB Petroleum & Natural Gas Regulatory Board
POL Petroleum, Oils and Lubricants
PPAC Petroleum Planning & Analysis Cell
PPP Public Private Partnership
PSC Production Sharing Contract
PSU Public Sector Unit
PTTEP PTT Exploration and Production
PWD Public Works Department
RGIPT Rajiv Gandhi Institute of Petroleum Technology
RGPIT Rajiv Gandhi Institute of Petroleum Technology
ROFR Right of First Refusal
RSC Revenue Sharing Contract
SAARC South Asian Association for Regional Cooperation
SARDP Special Accelerated Road Development Programme for North East
SCM Standard Cubic Meter
SEZ Special Economic Zone
SKM Square Kilometer
SKO Superior Kerosene Oil
SPV Special Purpose Vehicle
SSI Small Scale Industry
TMT Thousand Metric Tonne
TMTPA Thousand Metric Tonnes per Annum
TNGCL Tripura Natural Gas Company Limited
TPA Tonnes per Annum
TPD Tonnes per Day
TSECL Tripura State Electricity Corporation Limited
UAE United Arab Emirates
ULFA United Liberation Front of Asom
UPES University of Petroleum and Energy Studies
VAT Value Added Tax
VGF Viability Gap Funding
WBM Water Bound Macadam
YTF Yet to Find

Directorate General of Hydrocarbons (DGH)
[233] Hydrocarbon Vision 2030 for Northeast India- Final Report
Annexure II: Demographic and Macroeconomic
Indicators of NER
Particulars Assam
Arun
achal
Prade
sh
Manipur Meghala
ya
Mizora
m
Nagalan
d Tripura Sikkim
GSDP (Rs
Crores) 88,537 6,171 7,892 13,215 5608 10,492 18510 5,491
Per capita
Income (in Rs) 24,533
37,99
6 23,996 42,467 40,930 46,889 42,315 75,137
Per Capita state
income % of Per
Capita National
Income
61% 95% 60% 106% 103% 118% 106% 188%
Total Area
(Square km) 78438 83743 22327 22479 21087 16579 10492 7096
Population (in
lakh) 312 14 27 30 11 20 37 6
Literacy Rate(%) 73% 67% 80% 75% 92% 80% 88% 82%
Male to Female
ratio(Per
thousand Male)
954 920 987 986 975 931 961 889
Households 6,367,2
95
261,6
14 507,152 538,299 221,077 399,965
842,78
1 128,131
Electricity
consumption
(MU)
7,926 610 678 1,634 425 661 1,048 399

Directorate General of Hydrocarbons (DGH)
[234] Hydrocarbon Vision 2030 for Northeast India - Final Report
Annexure III: Tax Structure in existing PSCs
Onshore Blocks Shallow Water Offshore (deep Water
and Frontier Blocks)
Exploration period 7 years (4+3) 7 years (4+3) 8 years (5+3)
PEL & PML
20 years; extended by
5 years or 10 years in
case of a gas
discovery
20 years; extended by
5 years or 10 years in
case of a gas
discovery
20 years; extended by
5 years or 10 years in
case of a gas
discovery
Royalty 12.5% oil and 10%
natural gas
12.5% oil and 10%
natural gas
5% for crude oil and
Natural gas both.
Tax rates
100% deduction on
exploration, capital
costs
100% deduction on
exploration, capital
costs
100% deduction on
exploration, capital
costs
Tax Holiday
Companies with oil
production get a 7
year tax holiday
(section 80 IB of IT
Act)
Companies with oil
production get a 7
year tax holiday
(section 80 IB of IT
Act)
Companies with oil
production get a 7
year tax holiday
(section 80 IB of IT
Act)

Directorate General of Hydrocarbons (DGH)
[235] Hydrocarbon Vision 2030 for Northeast India- Final Report
Annexure IV: Service Hubs
World Example: Service Hub(s)
Onne Oil and Gas Free Zone, Nigeria
Jebel Ali Free Trade Zone, UAE
Free zones in Malaysia and Singapore
Onne Oil and Gas Free Zone at a Glance
The Onne Oil and Gas Free Zone in Nigeria officially opened in March 1997. It was established by the
Nigerian government to provide the ideal infrastructure to create a hub for oilfield services to assist not
only the country’s onshore and offshore fields but also to provide easy access to the entire West African
oilfield operating regions. It is managed by DMS International Ltd. It combines the effectiveness of the
private sector with the required commitment and support of the Federal Government of Nigeria.
As a result of the various incentives offered by the Onne Oil and Gas Free Zone, it has been able to
attract over 140 major companies and create over 30,000 jobs (directly and indirectly). It has also
resulted in the transfer of technological skills to Nigeria, increase of local content within the hydrocarbon
industry and substantial revenue savings for the government.
Table 148: Advantages of Onne Oil and Gas Free Zone
Specific Advantage General Advantage
Customs privileges for goods consigned to
Onne Oil and Gas Free Zone, including goods
in transit to other West African territories.
No pre-shipment inspection – goods are not
consigned to Nigeria
Duty-free stock, equipment, spare parts and
pipes
No double handling in and out of Nigeria
Access to major projects onshore, offshore and
regional
Cost-efficient operations
Sophisticated oil service centre support.
Quick and simple registration
procedures
Easy cargo customs clearing
procedures
Fast track procedures at port and
airports for all visiting and Free
Zone expatriate personnel
Easy clearing process
Duty-free status for imports
Pre-shipment inspection in the
free zone
Duties paid on goods exported to
Nigeria
Sea-air logistics
Free Zone Advantage Tax advantage
100% import and export tax exemption
100% exemption from commercial levies
100% repatriation of capital and profits
100% foreign company ownership
Leases available from five to 21 years
No quotas for expatriate employees
No corporate taxes
No personal income taxes
No VAT
No withholding taxes
No levies

Directorate General of Hydrocarbons (DGH)
[236] Hydrocarbon Vision 2030 for Northeast India - Final Report
Annexure V: OTPC Power Plant, Tripura
ONGC Tripura Power Company (OTPC) ltd. is power project being implemented in the state of Tripura,
at Palatana district in Udaipur. The project site is located adjacent to the existing State Highway
connecting to Udaipur, with onward connectivity to Agartala by NH-44. The project is being implemented
with the objective of utilizing the gas available in Tripura, and establishing a 726.6 MW (two units of
363.3 MW) Combined Cycle Gas Turbine (CCGT) power plant along with an associated power
transmission system from the project site to Bongaigaon in Assam.
Holding structure of the SPV
OTPC project is being implemented via the Special Purpose Vehicle (SPV) route. ONGC is the major
shareholder and the promoter of the project. Shareholding pattern of the company is shown in the table
below.
Shareholder Percentage holding (%)
ONGC 50%
Infrastructure Leasing & Financial Services (IL&FS) 26%
India Infrastructure Fund – II 23.5%
Government of Tripura 0.5%
Source: OTPC website
Cost of the project
The project is being implemented at a total cost of INR 6,929.5 crore. Generation project would cost
INR 3429.5 crore and establishment of transmission system will cost INR 1,750 crore. We have
mentioned the project cost along with capital structure for generation and transmission projects in the
table below:
Generation project INR Crore Percentage
Debt 2,572.1 75%
Equity 857.4 25%
Project cost 3,429.5 100%
Transmission project
Debt 1,400 80%
Equity 350 20%
Project cost 1,750 100%
Source: OTPC website
Power off take
Sale of power from the power plant is based on allocation decided by Ministry of Power. As per the
allocation, out of the total capacity, 628 MW has been allocated to the North Eastern states and the
balance of 98 MW will be sold on merchant basis by OTPC. State wise allocation of power is given in
the table below:
State Allocation (MW)
Assam 240
Meghalaya 79

Directorate General of Hydrocarbons (DGH)
[237] Hydrocarbon Vision 2030 for Northeast India- Final Report
State Allocation (MW)
Manipur 42
Nagaland 27
Arunachal Pradesh 22
Mizoram 22
Tripura 196
Balance on merchant sales 98
Total 726
Source: Ministry of Power, Circular order dated November 25, 2008

Directorate General of Hydrocarbons (DGH)
[238] Hydrocarbon Vision 2030 for Northeast India - Final Report
Annexure VI: National Gas Grid
National Gas Grid

Directorate General of Hydrocarbons (DGH)
[239] Hydrocarbon Vision 2030 for Northeast India- Final Report
Annexure VII: Kharsang Block
Kharsang Block
Kharsang block is located in the state of Arunachal Pradesh, and is approximately at a distance of 140
km from Dibrugarh (Assam). The block was discovered in 1976 by Oil India Limited. Commercial
production from the block commenced in 1983. The entire PML area of 11 sq. Km. is covered by forest
area. GeoEnpro Petroleum Limited is the operator of the block which is a joint venture between
Geopetrol International Inc. and Jubilant Energy. Participants associated with the block are Oil India
Limited (40%), Jubilant Energy (Kharsang) Pvt. Ltd. (25%), Geopetrol International Inc. (25%) and
GeoEnpro Petroleum Limited (10%, Operator).
PSC for the block was signed on 16 June 1995 and is valid for a period of 20 years till 15 June 2015,
and can be extended for a further period not exceeding five (5) years, provided that in the event of
Commercial Production of Non Associated Natural Gas, the PSC may be extended for a period up to
but not exceeding thirty five (35) years from the Effective Date.
Activities carried out till date
The contractor of the block has invested around USD 138 million till the end of FY15 on exploration and
development activities in Kharsang Field. Activities carried out till date in the block are mentioned below:
32 Development Wells (majority being directional/high angled wells)
2 Exploration Wells
60 LKM of 2D Seismic (2001)
37 Sq. Km of 3D Seismic (2008)
87 Sq. Km of 3D Seismic (2012-13)
Various G&G and Reservoir Engineering studies for better understanding of the complex
reservoir
Radial Drilling, Sand Consolidation and various new production technologies have been
implemented in the Kharsang Field to address the complexities (sanding, waxing, shallow
reservoir and low pressure)
Current oil and Gas production
2014-15 2015-16 (Expected)
Oil Production 1,372 BOPD 1,100 BOPD
Gas Production Between 50,000 – 60,000 SCMD* N.A.
*Out of the 50,000 to 60,000 SCMD of gas produced, 13,000 to 15,000 SCMD is used for internal consumption,
19,000 to 20,000 SCMD is the unavoidable loss ad 18,000 to 25,000 SCMD is flared. Till date the contractor has
not been able to monetize the produced gas.
Till date 12 MMBLs of oil has been extracted from the Kharsang field. As per the PSC, the field had
recoverable reserves to the tune of 20.06 MMBL of crude oil, thus the field still has close to 8 MMBLs
of balance recoverable crude oil.
Untapped potential from deeper plays (Girujan and Tipams)
Resources Potential
Contingent resources 15.03 MMBbl of oil and 248.8 BCF of Gas
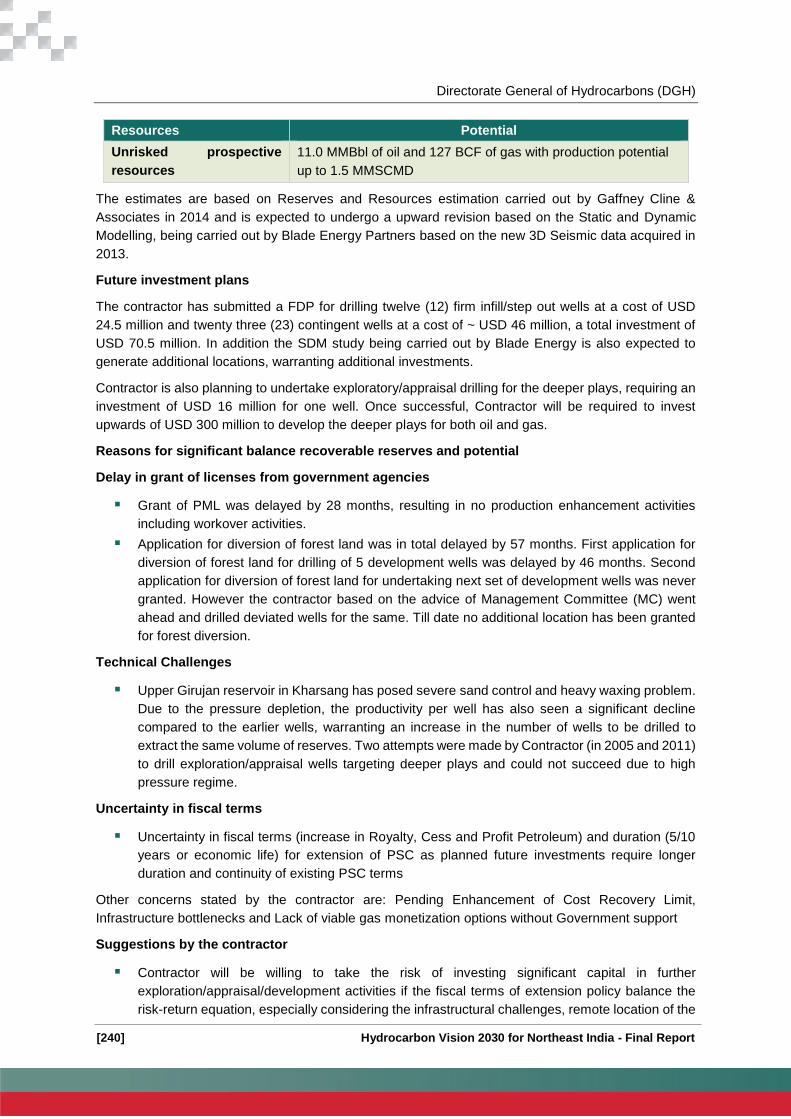
Directorate General of Hydrocarbons (DGH)
[240] Hydrocarbon Vision 2030 for Northeast India - Final Report
Resources Potential
Unrisked prospective
resources
11.0 MMBbl of oil and 127 BCF of gas with production potential
up to 1.5 MMSCMD
The estimates are based on Reserves and Resources estimation carried out by Gaffney Cline &
Associates in 2014 and is expected to undergo a upward revision based on the Static and Dynamic
Modelling, being carried out by Blade Energy Partners based on the new 3D Seismic data acquired in
2013.
Future investment plans
The contractor has submitted a FDP for drilling twelve (12) firm infill/step out wells at a cost of USD
24.5 million and twenty three (23) contingent wells at a cost of ~ USD 46 million, a total investment of
USD 70.5 million. In addition the SDM study being carried out by Blade Energy is also expected to
generate additional locations, warranting additional investments.
Contractor is also planning to undertake exploratory/appraisal drilling for the deeper plays, requiring an
investment of USD 16 million for one well. Once successful, Contractor will be required to invest
upwards of USD 300 million to develop the deeper plays for both oil and gas.
Reasons for significant balance recoverable reserves and potential
Delay in grant of licenses from government agencies
Grant of PML was delayed by 28 months, resulting in no production enhancement activities
including workover activities.
Application for diversion of forest land was in total delayed by 57 months. First application for
diversion of forest land for drilling of 5 development wells was delayed by 46 months. Second
application for diversion of forest land for undertaking next set of development wells was never
granted. However the contractor based on the advice of Management Committee (MC) went
ahead and drilled deviated wells for the same. Till date no additional location has been granted
for forest diversion.
Technical Challenges
Upper Girujan reservoir in Kharsang has posed severe sand control and heavy waxing problem.
Due to the pressure depletion, the productivity per well has also seen a significant decline
compared to the earlier wells, warranting an increase in the number of wells to be drilled to
extract the same volume of reserves. Two attempts were made by Contractor (in 2005 and 2011)
to drill exploration/appraisal wells targeting deeper plays and could not succeed due to high
pressure regime.
Uncertainty in fiscal terms
Uncertainty in fiscal terms (increase in Royalty, Cess and Profit Petroleum) and duration (5/10
years or economic life) for extension of PSC as planned future investments require longer
duration and continuity of existing PSC terms
Other concerns stated by the contractor are: Pending Enhancement of Cost Recovery Limit,
Infrastructure bottlenecks and Lack of viable gas monetization options without Government support
Suggestions by the contractor
Contractor will be willing to take the risk of investing significant capital in further
exploration/appraisal/development activities if the fiscal terms of extension policy balance the
risk-return equation, especially considering the infrastructural challenges, remote location of the

Directorate General of Hydrocarbons (DGH)
[241] Hydrocarbon Vision 2030 for Northeast India- Final Report
field and the technical challenges. Continuing the existing PSC fiscal terms will balance the risk-
return equation.
Delays in Statutory Approvals were the primary reason for Contractor’s inability to undertake
exploration/appraisal/development activities as envisaged at the time of bidding. Due
consideration must be given for granting extension to the duration of the PSC with the current
terms for the period of delay.
MoEF & CC to award relevant approvals in a fast track mode.
Support for monetising the gas production in remote areas through funding of evacuation
infrastructure and freedom to market the gas to customers who can afford the import parity price.
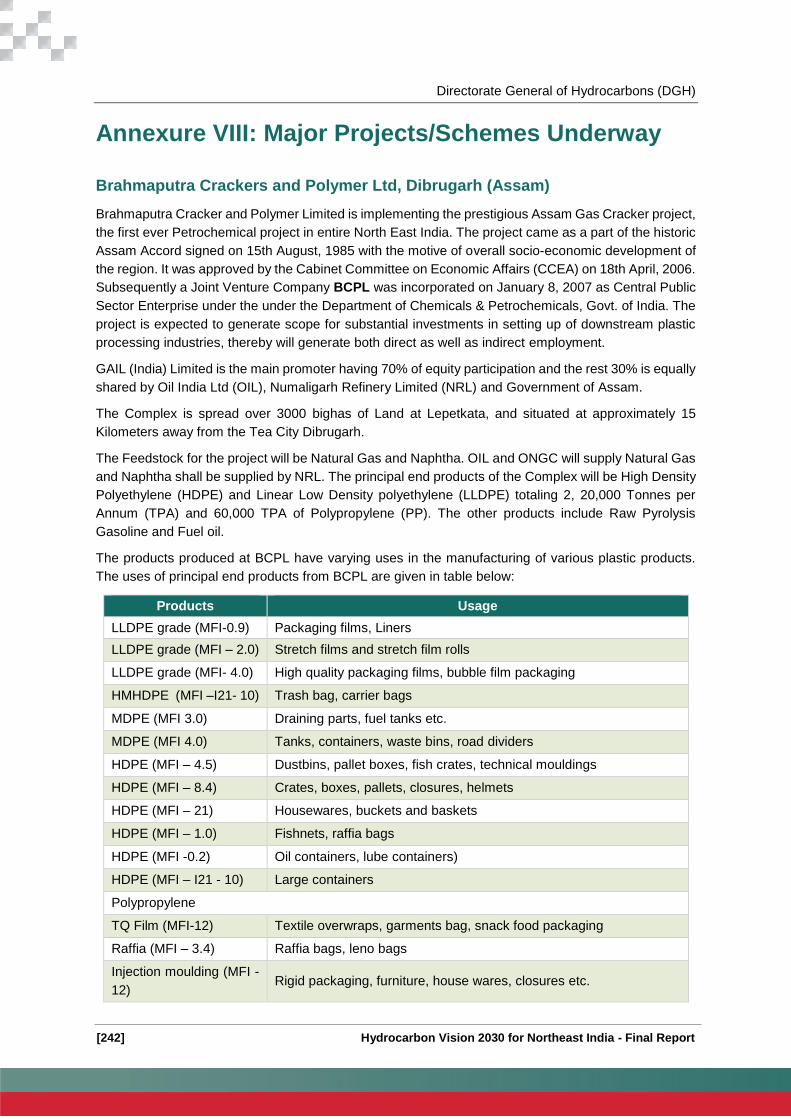
Directorate General of Hydrocarbons (DGH)
[242] Hydrocarbon Vision 2030 for Northeast India - Final Report
Annexure VIII: Major Projects/Schemes Underway
Brahmaputra Crackers and Polymer Ltd, Dibrugarh (Assam)
Brahmaputra Cracker and Polymer Limited is implementing the prestigious Assam Gas Cracker project,
the first ever Petrochemical project in entire North East India. The project came as a part of the historic
Assam Accord signed on 15th August, 1985 with the motive of overall socio-economic development of
the region. It was approved by the Cabinet Committee on Economic Affairs (CCEA) on 18th April, 2006.
Subsequently a Joint Venture Company BCPL was incorporated on January 8, 2007 as Central Public
Sector Enterprise under the under the Department of Chemicals & Petrochemicals, Govt. of India. The
project is expected to generate scope for substantial investments in setting up of downstream plastic
processing industries, thereby will generate both direct as well as indirect employment.
GAIL (India) Limited is the main promoter having 70% of equity participation and the rest 30% is equally
shared by Oil India Ltd (OIL), Numaligarh Refinery Limited (NRL) and Government of Assam.
The Complex is spread over 3000 bighas of Land at Lepetkata, and situated at approximately 15
Kilometers away from the Tea City Dibrugarh.
The Feedstock for the project will be Natural Gas and Naphtha. OIL and ONGC will supply Natural Gas
and Naphtha shall be supplied by NRL. The principal end products of the Complex will be High Density
Polyethylene (HDPE) and Linear Low Density polyethylene (LLDPE) totaling 2, 20,000 Tonnes per
Annum (TPA) and 60,000 TPA of Polypropylene (PP). The other products include Raw Pyrolysis
Gasoline and Fuel oil.
The products produced at BCPL have varying uses in the manufacturing of various plastic products.
The uses of principal end products from BCPL are given in table below:
Products Usage
LLDPE grade (MFI-0.9) Packaging films, Liners
LLDPE grade (MFI – 2.0) Stretch films and stretch film rolls
LLDPE grade (MFI- 4.0) High quality packaging films, bubble film packaging
HMHDPE (MFI –I21- 10) Trash bag, carrier bags
MDPE (MFI 3.0) Draining parts, fuel tanks etc.
MDPE (MFI 4.0) Tanks, containers, waste bins, road dividers
HDPE (MFI – 4.5) Dustbins, pallet boxes, fish crates, technical mouldings
HDPE (MFI – 8.4) Crates, boxes, pallets, closures, helmets
HDPE (MFI – 21) Housewares, buckets and baskets
HDPE (MFI – 1.0) Fishnets, raffia bags
HDPE (MFI -0.2) Oil containers, lube containers)
HDPE (MFI – I21 - 10) Large containers
Polypropylene
TQ Film (MFI-12) Textile overwraps, garments bag, snack food packaging
Raffia (MFI – 3.4) Raffia bags, leno bags
Injection moulding (MFI -
12) Rigid packaging, furniture, house wares, closures etc.

Directorate General of Hydrocarbons (DGH)
[243] Hydrocarbon Vision 2030 for Northeast India- Final Report
Numaligarh Refinery Expansion Plan, Assam
Numaligarh Refinery Ltd (NRL) is planning to expand its refining capacity from 3 MMTPA to 9 MMTPA
by 2020. The mega refinery expansion plan of NRL will call for a capital expenditure to the tune of Rs
20,000 crore.
While about 70% products would be lifted by NRL's holding company, Bharat Petroleum (BPCL) to fulfill
its existing demand for POL products; the region and its geographically contiguous neighbouring
countries like Bangladesh, Nepal and Myanmar are being explored for selling the balance products.
The company has already inked two important memorandums of understanding (MoU), one with
Dharma Port Company Limited (DPCL) for import of crude oil and LPG and the other with Cement
Corporation of India (CCI) for utilization of raw petroleum coke, likely to be generated at NRL after its
proposed capacity expansion. The capacity expansion of the refinery is expected to address the sub-
economic size of the refinery which has been hindering the scalability as well as profitability of the
company. Considering the declining trend in domestic crude oil supplies from North Eastern oil fields,
NRL will be importing crude oil to utilize the additional refining capacity. To facilitate transportation of
around 6 MMTPA, imported crude oil from Dhamra port in Orissa to Numaligarh, a new pipeline is
envisaged to be constructed. As of now, there is no plan of extension for the other refineries in the
region except NRL.
According to the company, additional products generated from the refinery expansion will primarily be
absorbed within the region. Moreover, part of NRL’s increased production is also envisaged to be
exported to Bangladesh through Parbatipur (150 km from the NRL terminal at Siliguri) while part
quantities are envisaged to be utilized for production of petrochemical grade Naphtha for which
adequate demand exists within the country.
Fertilizer Plant in Tripura– ONGC and Chambal Fertilizers
The ONGC, Tripura Government, and private Chambal Fertilizers and Chemicals had signed
memorandum of understanding (MOU) to set up the plant in Unkoti district by 2016. The requirement
of land is around 600-800 acre. The supply of gas to the plant site would be made available from newly
discovered Khubal well in the area. However experts are yet to find out a regular source to bring in
water to the plant site. Tripura government — which has a 10% share in the plant — hoped that
Bangladesh would grant permission for transportation of fertilizer to rest of India through Bangladesh.
The cross border transit facility would ease price of the Urea fertilizer and could meet demand in a short
time. Production of gas in Tripura is projected at 2.8 million standard cubic metre or mmscmd. Half of
the production is marked for the proposed fertilizer plant.
Plastic Park, Tinsukia, Assam
The AIDCL is in the process of setting up a 360 acre Plastic Park in Tinsukia, north of Guwahati that
will use raw material produced at the Brahmaputra Crackers and Polymers Limited (BCPL) that is likely
to come on stream in around a year's time. The idea is to utilize the 200,000 tonnes per annum polymer
produced at the BCPL to produce finished products that can be sold in neighbouring markets of
Myanmar, Bangladesh, and Bhutan among other regions in South East Asia.
At least six or seven plastic processing companies from the state have decided to set up units at the
upcoming Tinsukia Plastic Park in Assam for a total investment close to Rs 150 crore in response to
Assam Industrial Development Corporation Ltd (AIDCL) campaign to attract investors to the Plastic
Park project. It expects to attract around Rs 5000 crore worth investments in the park.

Directorate General of Hydrocarbons (DGH)
[244] Hydrocarbon Vision 2030 for Northeast India - Final Report
The hilly states are an attractive destination for the small and medium companies from other regions
who look forward to setting up units there to take advantage of the excise and other duty incentives
offered by these states. In Assam, for example, apart from value added tax (VAT) exemption, micro
industries would also enjoy 30 per cent interest subsidy on term loans, apart from a 30 per cent power
subsidy.
The state accounts for nearly 60 per cent of the net polymer production of the country. India's net
production capacity is around six million tonnes per annum. However, at nearly 90,000 tonnes per
annum (TPA), Gujarat currently accounts for 15 per cent of all-India polymer processing.
Once complete, the Tinsukia Plastic Park is expected to house at least 1250 downstream plastic
processing units generating over one lakh direct and indirect employments.
Brahmaputra Valley Fertilizer Corporation Limited
The Namrup Fertilizer Complex, renamed as Brahmaputra Valley Fertilizer Corporation Limited after
bifurcation from erstwhile Hindustan Fertilizer Corporation Limited w.e.f. 1st April 2002 located on the
bank of the river Dilli in the south-western border of Dibrugarh District in Assam is the first factory of its
kind in India to use associated natural gas as basic raw material for producing nitrogenous fertilizer. Till
the beginning of sixties, Namrup a sleepy village, was little known to the rest of the country. Discovery
of oil and natural gas in Naharkatiya region promoted a serious thinking on proper utilization of gas
which had to be otherwise to be flared up.
Project planning for Namrup-I Group of plants was started in the middle of 1960 by Hindustan Chemicals
and Fertilizers which was merged with Fertilizer Corporation of on 1st January 1961. After crossing
various hurdles successfully, the foundation stone could be laid on 1st January, 1966 by the
then Assam Chief Minister Late B P Chaliha and the factory went into stream in the month of August,
1968. Commercial production, however, commenced from 1st January, 1969 with annual capacity of
only 55000 MT of urea and 100000 MT of Ammonium Sulphate. Namrup-I was set up at a cost of Rs.
24.96 crore including foreign exchange of Rs.6.36 crore
While operation of Namrup -I was in progress, it was found that surplus natural gas would be available
in the adjoining Moran-Naharkatiya oil fields of M/S. Oil India Limited. Government decided to gainfully
utilize this associated natural gas by putting up the 2nd unit of Namrup Fertilizer Plant at a cost of Rs.
74.60 crore including foreign exchange of Rs.23.60 crore. Namrup -II plant went into commercial
production in 1976 with annual capacity of 3, 30,000 MT of urea.
The availability of surplus natural gas in the Naharkatiya- Moran and Lakwa oil fields led to the addition
of the 3rd Unit of Namrup Fertilizer Plant at a cost of Rs. 285.55 crore including Rs. 58.67 crore of
foreign exchange. The plant went into commercial production in 1987 with annual capacity of 3, 85,000
MT of urea.
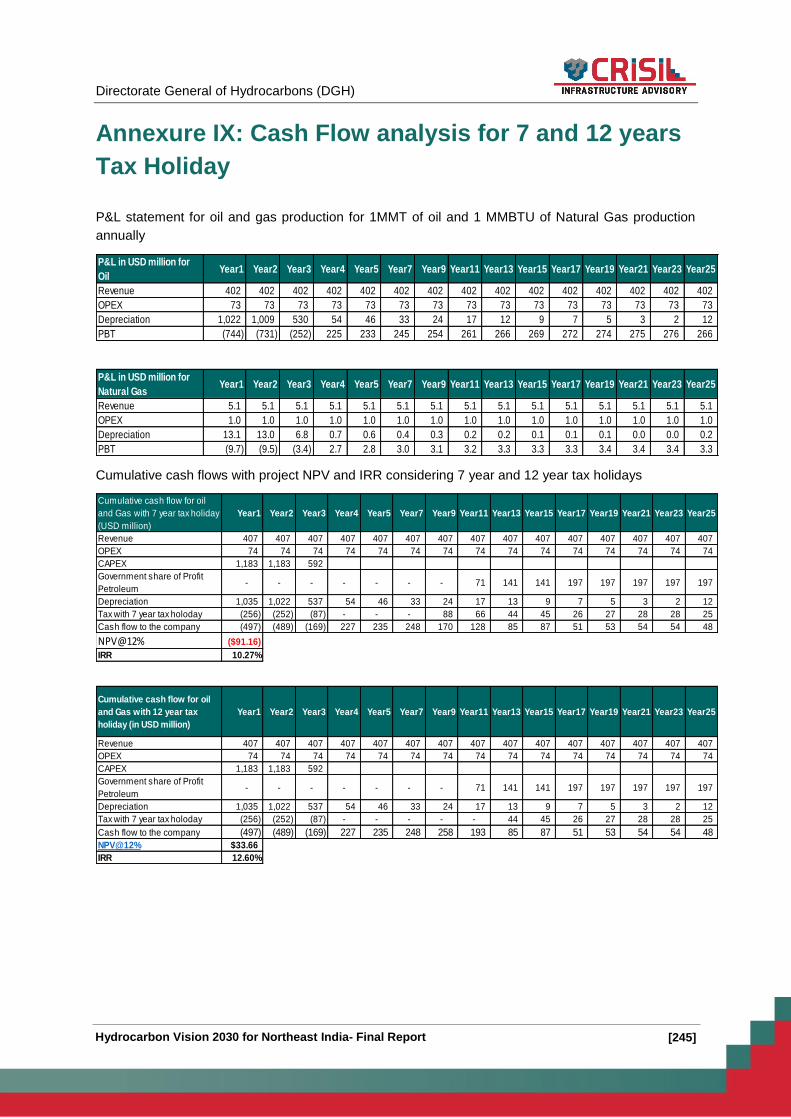
Directorate General of Hydrocarbons (DGH)
[245] Hydrocarbon Vision 2030 for Northeast India- Final Report
Annexure IX: Cash Flow analysis for 7 and 12 years
Tax Holiday
P&L statement for oil and gas production for 1MMT of oil and 1 MMBTU of Natural Gas production
annually
Cumulative cash flows with project NPV and IRR considering 7 year and 12 year tax holidays
P&L in USD million for
OilYear1 Year2 Year3 Year4 Year5 Year7 Year9 Year11 Year13 Year15 Year17 Year19 Year21 Year23 Year25
Revenue 402 402 402 402 402 402 402 402 402 402 402 402 402 402 402
OPEX 73 73 73 73 73 73 73 73 73 73 73 73 73 73 73
Depreciation 1,022 1,009 530 54 46 33 24 17 12 9 7 5 3 2 12
PBT (744) (731) (252) 225 233 245 254 261 266 269 272 274 275 276 266
P&L in USD million for
Natural GasYear1 Year2 Year3 Year4 Year5 Year7 Year9 Year11 Year13 Year15 Year17 Year19 Year21 Year23 Year25
Revenue 5.1 5.1 5.1 5.1 5.1 5.1 5.1 5.1 5.1 5.1 5.1 5.1 5.1 5.1 5.1
OPEX 1.0 1.0 1.0 1.0 1.0 1.0 1.0 1.0 1.0 1.0 1.0 1.0 1.0 1.0 1.0
Depreciation 13.1 13.0 6.8 0.7 0.6 0.4 0.3 0.2 0.2 0.1 0.1 0.1 0.0 0.0 0.2
PBT (9.7) (9.5) (3.4) 2.7 2.8 3.0 3.1 3.2 3.3 3.3 3.3 3.4 3.4 3.4 3.3
Cumulative cash flow for oil
and Gas with 7 year tax holiday
(USD million)
Year1 Year2 Year3 Year4 Year5 Year7 Year9 Year11 Year13 Year15 Year17 Year19 Year21 Year23 Year25
Revenue 407 407 407 407 407 407 407 407 407 407 407 407 407 407 407
OPEX 74 74 74 74 74 74 74 74 74 74 74 74 74 74 74
CAPEX 1,183 1,183 592
Government share of Profit
Petroleum- - - - - - - 71 141 141 197 197 197 197 197
Depreciation 1,035 1,022 537 54 46 33 24 17 13 9 7 5 3 2 12
Tax with 7 year tax holoday (256) (252) (87) - - - 88 66 44 45 26 27 28 28 25
Cash flow to the company (497) (489) (169) 227 235 248 170 128 85 87 51 53 54 54 48
NPV@12% ($91.16)
IRR 10.27%
Cumulative cash flow for oil
and Gas with 12 year tax
holiday (in USD million)
Year1 Year2 Year3 Year4 Year5 Year7 Year9 Year11 Year13 Year15 Year17 Year19 Year21 Year23 Year25
Revenue 407 407 407 407 407 407 407 407 407 407 407 407 407 407 407
OPEX 74 74 74 74 74 74 74 74 74 74 74 74 74 74 74
CAPEX 1,183 1,183 592
Government share of Profit
Petroleum- - - - - - - 71 141 141 197 197 197 197 197
Depreciation 1,035 1,022 537 54 46 33 24 17 13 9 7 5 3 2 12
Tax with 7 year tax holoday (256) (252) (87) - - - - - 44 45 26 27 28 28 25
Cash flow to the company (497) (489) (169) 227 235 248 258 193 85 87 51 53 54 54 48
NPV@12% $33.66
IRR 12.60%
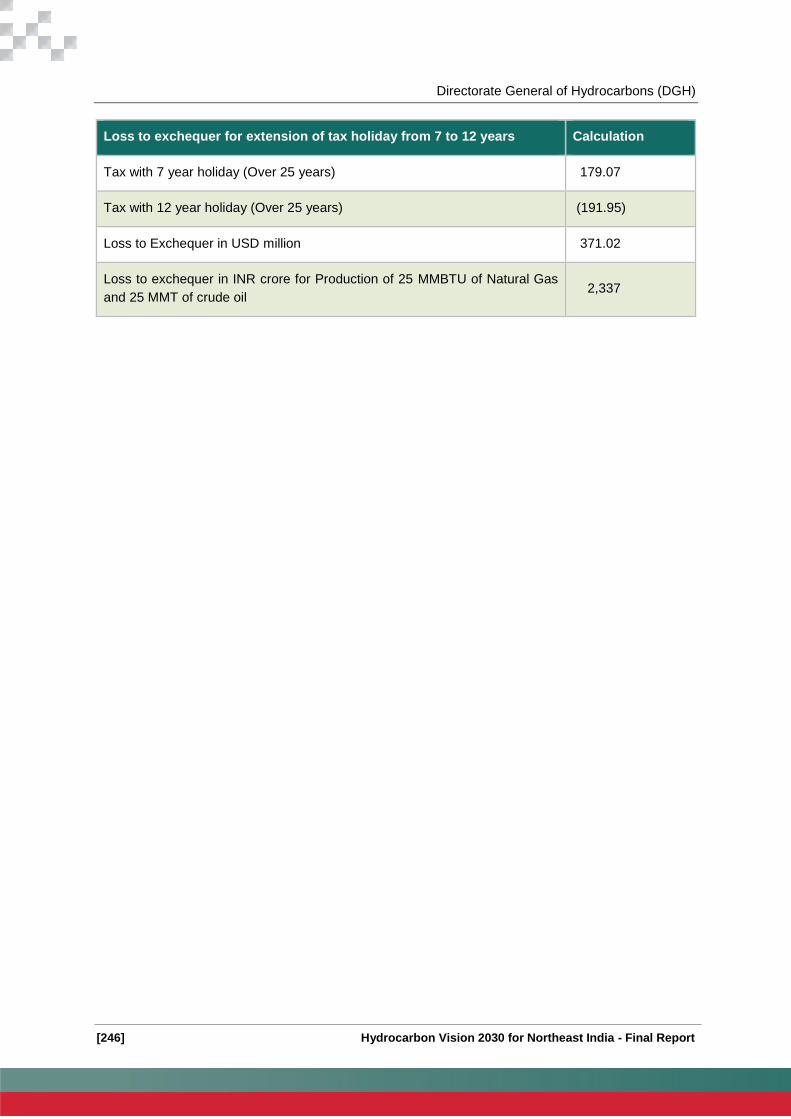
Directorate General of Hydrocarbons (DGH)
[246] Hydrocarbon Vision 2030 for Northeast India - Final Report
Loss to exchequer for extension of tax holiday from 7 to 12 years Calculation
Tax with 7 year holiday (Over 25 years) 179.07
Tax with 12 year holiday (Over 25 years) (191.95)
Loss to Exchequer in USD million 371.02
Loss to exchequer in INR crore for Production of 25 MMBTU of Natural Gas
and 25 MMT of crude oil 2,337

Directorate General of Hydrocarbons (DGH)
[247] Hydrocarbon Vision 2030 for Northeast India- Final Report
Annexure X: Details of Oil & Gas resource
conversion in NER
Details of Oil & Gas resource conversion by ONGC in Northeast
As a result of its exploratory efforts as on 01.04.15, ONGC has made 76 hydrocarbon discoveries which include 55 discoveries in Assam, 17 in Tripura, 3 in the state of Nagaland & 1 in Mizoram. This has resulted in establishment of 904.32 MMt (O+OEG) in place and 269.21MMt (O+OEG) ultimate reserves in Assam & Assam Arakan Basin. The state wise distribution of established in-place and ultimate volumes is as under:
In place & Ultimate Reserves established in A&A Basin-ONGC (as on 1-04-2015)
State
Prognositicated
Resource MMTOE
(O+OEG)
Inplace, MMT
( O+OEG)
Ultimate,
MMT(O+OEG)
Conversion %
(Prognosticated
to Ultimate)
Assam 1615 785.21 214.34 13%
Mizoram 170 2.28 0 0%
Tripura 590 99.78 50.87 9%
Nagaland 555 17.05 4.0 1%
Assam & Assam
Arakan Basin 2930 904.32 269.21 9%
Targets by ONGC for increase In place reserves:
a. Assam shelf : In-place accretion realization from 782.6 MMt to 952.6 MMt by 2030 and in terms of
Prognosticated resource conversion from 65 % to 80%.
b. Fold Belt Sector covering Cachar, Tripura, Mizoram: In-place accretion realization from 101.95 MMt
to 167.95 MMt by 2030 and in terms of Prognosticated resource conversion from 17 % to 28%.
Initiatives by ONGC:
Induction of new rig to achieve Exploratory Drilling levels of 28 wells by 2016-17 from current level of16
wells.
Details of Oil & Gas resources in YTF areas of NER for Oil India
As on 01.04.2015, 2P and 1P reserves of Oil India are given in table below:
Oil India 2P reserves 1 P reserves
Oil + Condensates (MMTOE) 83.41 31.26
Gas (BCM) 44.10 23.79

Directorate General of Hydrocarbons (DGH)
[248] Hydrocarbon Vision 2030 for Northeast India - Final Report
Oil India 2P reserves 1 P reserves
O+OEG ( MMTOE) 121.31 51.76
Total prognosticated reserves estimated by Oil India from YTF areas are 1,834 MMTOE. Considering
the same conversion percentage as calculated above for conversion of prognosticated to established
and established to recoverable category for reserves in NER, the estimated established and
recoverable reserves from YTF areas for Oil India are:
State Established (MMTOE) Recoverable (MMTOE)
Assam 1190 178
Arunachal Pradesh 15.7 1.4
Total NER 1204.7 179.4

Directorate General of Hydrocarbons (DGH)
[249] Hydrocarbon Vision 2030 for Northeast India- Final Report
Annexure XI: Analysis of Revenue to states for
increased Production of Oil & Gas
With increased production of Oil & Gas from NER states, the states having blocks shall be major
beneficial in terms of getting royalty from producers. Along with royality, states will get other revenues
like VAT, Entry Tax and sales tax. Below are the analysis of increased production of Oil & Gas:
Analysis of royalty to states for 1 MMTPA of Crude Oil
For Crude oil Calculation
Barrel to MT 7.3
Exchange rate 63
Crude price ($/bbl) 50
Production (MMT) 1
Royalty rate 12.50%
Crude price in INR/MT 22,995
Yearly Royalty (INR crore) 287
Source: CRIS Analysis
Analysis of royality to states for 1mmscmd of gas
For Natural Gas Calculation
M3/BTU 39,683
Exchange rate 63
Gas price ($/mmbtu) 4.66
Production (MMSCMD) 1
Production (MMSCM) 365
Royalty rate 10.0%
Gas price INR/MSCM 11,650
Yearly Royalty (INR crore) 42.5
Source: CRIS Analysis

Directorate General of Hydrocarbons (DGH)
[250] Hydrocarbon Vision 2030 for Northeast India - Final Report
So considering the potential of NER , additional 2 MMTPA of Oil production and 10 mmscmd of gas
production can increase income of NER states by around 1000 Crore per annum. Additional revenue
from VAT, Sales Tax and entry tax may be in tune of another 300-400 crore.

Directorate General of Hydrocarbons (DGH)
[251] Hydrocarbon Vision 2030 for Northeast India- Final Report
Disclaimer
This report is prepared by CRISIL Risk and Infrastructure Solutions Limited (CRIS). This report may have been prepared by CRIS at the request of a client of CRIS (client). This report may include or refer to information and materials provided by the client and/or obtained by CRIS from sources that CRIS considers reliable (together, “materials”). In preparing this report, CRIS does not independently validate any such materials and assumes those materials are accurate. CRIS does not guarantee the accuracy, adequacy or completeness of any material contained in or referred to in the report. While CRIS takes reasonable care in preparing the report, CRIS shall not be responsible for any errors or omissions in or for the results obtained from the use of or the decisions made based on, the report. The user takes full responsibility for the use of and the decisions made based on the report. While portions of materials are included in the report, CRIS makes all reasonable attempts to attribute credits to the source of the materials; however, even if a particular source of a material is not so attributed, CRIS stakes no claim to any such material in the form as provided to or made accessible to CRIS. No third party whose material is included or referenced in this report under credit to it, assumes any liability towards the user with respect to such material. Neither CRIS nor its directors, employees and representatives accept any liability with regard to any access, use of or reliance on, the report and that CRIS expressly disclaim all such liability. Any third party brands, names or trademarks contained in the report belong to the relevant third parties. The report contains CRIS’ view as at the date of the report based on available material. CRIS does not assume an obligation to update the report where updated materials are available or to notify anyone that an updated report is available. This report may not be reproduced or redistributed or communicated directly or indirectly in any form or published or copied in whole or in part except as authorized by CRIS. Unless CRIS has expressly agreed in writing, this report is not intended for use outside India. By accessing and/or using any part of the report, the user accepts the foregoing disclaimers and exclusion of liability which operates to the benefit.
Our Offices / Contact us:
Registered Office – Mumbai
CRISIL House, Central Avenue,
Hiranandani Business Park,
Powai, Mumbai- 400 076
Phone : 91-22-3342 3000
Fax : 91-22-3342 1830
Gurgaon
Plot No. 46 (Opposite Provident
Fund Office),
Sector 44, Gurgaon 122 003,
Haryana, India
Phone : 91-124-672 2000
Fax : 91-124-672 2495
Hyderabad
3rd Floor, Uma Chambers
Plot No. 9&10, Nagarjuna Hills,
Near Punjagutta Cross Road
Hyderabad - 500 082
Phone : 91-40-40328200
Fax : 91-40-2335 7507
Bengaluru
W-101, Sunrise Chambers,
22, Ulsoor Road,
Bengaluru - 560 042
Phone : 91-80-2558 0899
Fax : 91-80-2559 4801
Ahmedabad
706, Venus Atlantis,
Near Reliance Petrol Pump
Prahladnagar, Ahmedabad - 380 015
Phone : 91-79-4024 4500
Fax : 91-79-2755 9863
Visit us at:
www.crisil.com
About CRISIL Infrastructure Advisory
CRISIL Infrastructure Advisory is a division of CRISIL Risk and Infrastructure Solutions Limited, a 100% subsidiary of CRISIL Limited – India’s
leading Ratings, Research, Risk and Policy Advisory Company.
CRISIL Infrastructure Advisory is India’s premier advisor focusing on policy issues, as well as commercial and contractual issues in the areas of
transport, energy and urban infrastructure. We also provide support to international firms planning investments in India. Over a period of time, CRISIL
Infrastructure Advisory has built a unique position for itself in these domains and is considered the preferred consultant by governments, multilateral
agencies and private-sector clients. We have extended our operations beyond India and are present in other emerging markets in Africa, Middle East
and South Asia.

CRISIL Limited CRISIL House, Central Avenue, Hiranandani Business Park, Powai, Mumbai – 400076. India Phone: + 91 22 3342 3000 Fax: + 91 22 3342 1830 www.crisil.com
LinkedIn YouTube Facebook Stay Connected | | | | Twitter
CRISIL Ltd is a Standard & Poor's company