critical care ultrasound course · the san critical care ultrasound manual justin bowra 3 how can...
TRANSCRIPT
1
THE SAN CRITICAL CARE ULTRASOUND MANUAL
JUSTIN BOWRA 1
Critical Care Ultrasound Course
Dr Justin Bowra
CCUS Manual 2:
Lung

2
THE SAN CRITICAL CARE ULTRASOUND MANUAL
JUSTIN BOWRA 2
Contents
• How can lung US help me?
• Why use LUS?
• How to do LUS: Probe, scanner settings, depth, holding the probe, where to scan
• What am I looking for? Image interpretation
• Traps to avoid in LUS
• Putting it all together:
o The clinical questions
o Matching the LUS finding to the disease
• Appendix A: Lichtenstein’s BLUE and PLAPS points

3
THE SAN CRITICAL CARE ULTRASOUND MANUAL
JUSTIN BOWRA 3
How can lung US help me?
Lung US is a comparatively recent addition to emergency US. Its systematic use was first described by
Lichtenstein in his textbook General ultrasound in the critically ill (Springer, 2002). Since then, critical care
doctors and respiratory physicians worldwide have taken it up for a number of indications including:
Diagnosis of
· pleural fluid & pleural disease
· pneumothorax (PTX),
· pulmonary oedema
· pneumonia
· abscess
· pulmonary contusion
· pulmonary infarction
Procedural guidance for
· thoracocentesis
· intercostal catheter placement
More generally in the critically ill patient, lung US is useful in the assessment of:
• Cardiac arrest
• Respiratory distress
• Shock and fluid status
Why use ultrasound?
• Pneumothorax and massive haemothorax can be rapidly fatal if not detected and treated urgently
• Plain chest radiograph (CXR) can be unreliable
• Even with experience, differentiating between conditions such as pneumonia and pulmonary oedema can
be challenging
• Lung US is easy to learn, non-invasive, rapid, repeatable and can be performed at the bedside. • Lung US is more sensitive and reliable than mobile CXR in the detection of pleural fluid: it can detect as
little as 100ml, with sensitivity >97%, and specificity 99-100%. In expert hands, lung US has been
described as 98% sensitive and 99% specific for PTX, and 85.7% sensitive and 98% specific for
pulmonary oedema.
• BUT lung US is very operator dependent! This means that it is less accurate in the hands of novice
scanners.
• Lung US improves the safety of invasive procedures
4
THE SAN CRITICAL CARE ULTRASOUND MANUAL
JUSTIN BOWRA 4
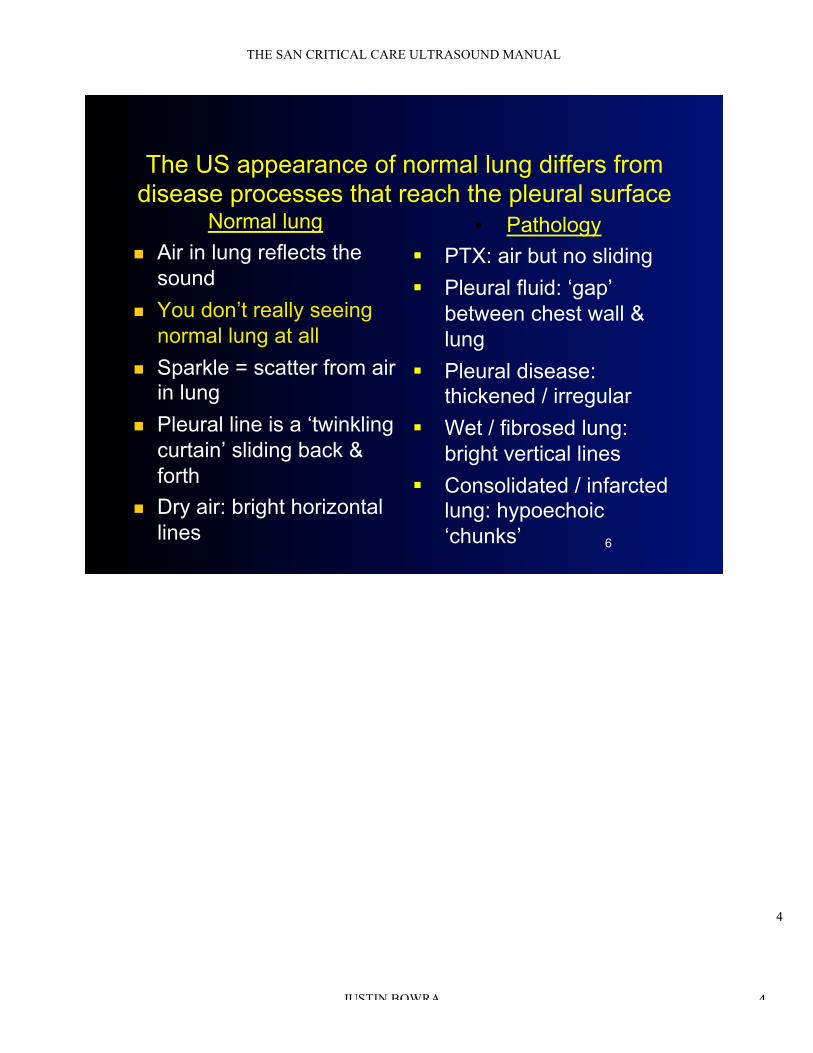
The US appearance of normal lung differs from
disease processes that reach the pleural surface Normal lung
! Air in lung reflects the
sound
! You don’t really seeing
normal lung at all
! Sparkle = scatter from air in lung
! Pleural line is a ‘twinkling
curtain’ sliding back &
forth
! Dry air: bright horizontal
lines
• Pathology
" PTX: air but no sliding
" Pleural fluid: ‘gap’
between chest wall &
lung
" Pleural disease: thickened / irregular
" Wet / fibrosed lung:
bright vertical lines
" Consolidated / infarcted lung: hypoechoic
‘chunks’ 6
5
THE SAN CRITICAL CARE ULTRASOUND MANUAL
JUSTIN BOWRA 5
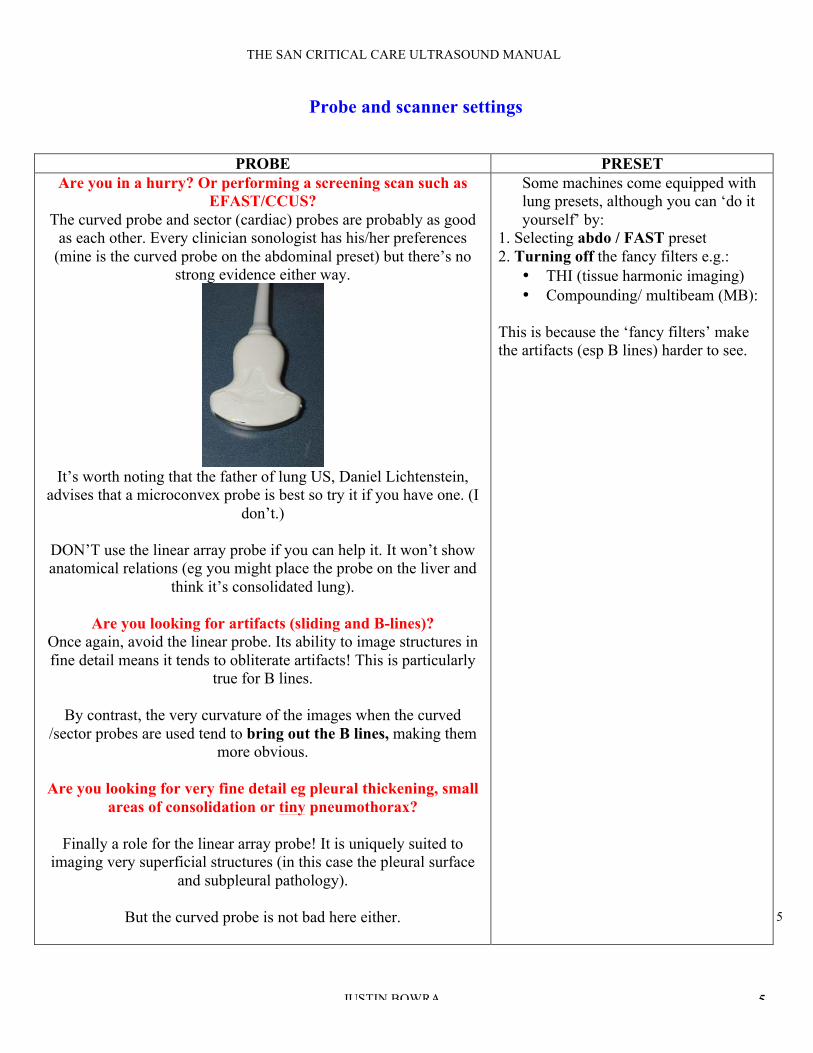
Probe and scanner settings
PROBE PRESET
Are you in a hurry? Or performing a screening scan such as
EFAST/CCUS?
The curved probe and sector (cardiac) probes are probably as good
as each other. Every clinician sonologist has his/her preferences
(mine is the curved probe on the abdominal preset) but there’s no
strong evidence either way.
It’s worth noting that the father of lung US, Daniel Lichtenstein,
advises that a microconvex probe is best so try it if you have one. (I
don’t.)
DON’T use the linear array probe if you can help it. It won’t show
anatomical relations (eg you might place the probe on the liver and
think it’s consolidated lung).
Are you looking for artifacts (sliding and B-lines)?
Once again, avoid the linear probe. Its ability to image structures in
fine detail means it tends to obliterate artifacts! This is particularly
true for B lines.
By contrast, the very curvature of the images when the curved
/sector probes are used tend to bring out the B lines, making them
more obvious.
Are you looking for very fine detail eg pleural thickening, small
areas of consolidation or tiny pneumothorax?
Finally a role for the linear array probe! It is uniquely suited to
imaging very superficial structures (in this case the pleural surface
and subpleural pathology).
But the curved probe is not bad here either.
Some machines come equipped with
lung presets, although you can ‘do it
yourself’ by:
1. Selecting abdo / FAST preset
2. Turning off the fancy filters e.g.:
• THI (tissue harmonic imaging)
• Compounding/ multibeam (MB):
This is because the ‘fancy filters’ make
the artifacts (esp B lines) harder to see.
6
THE SAN CRITICAL CARE ULTRASOUND MANUAL
JUSTIN BOWRA 6
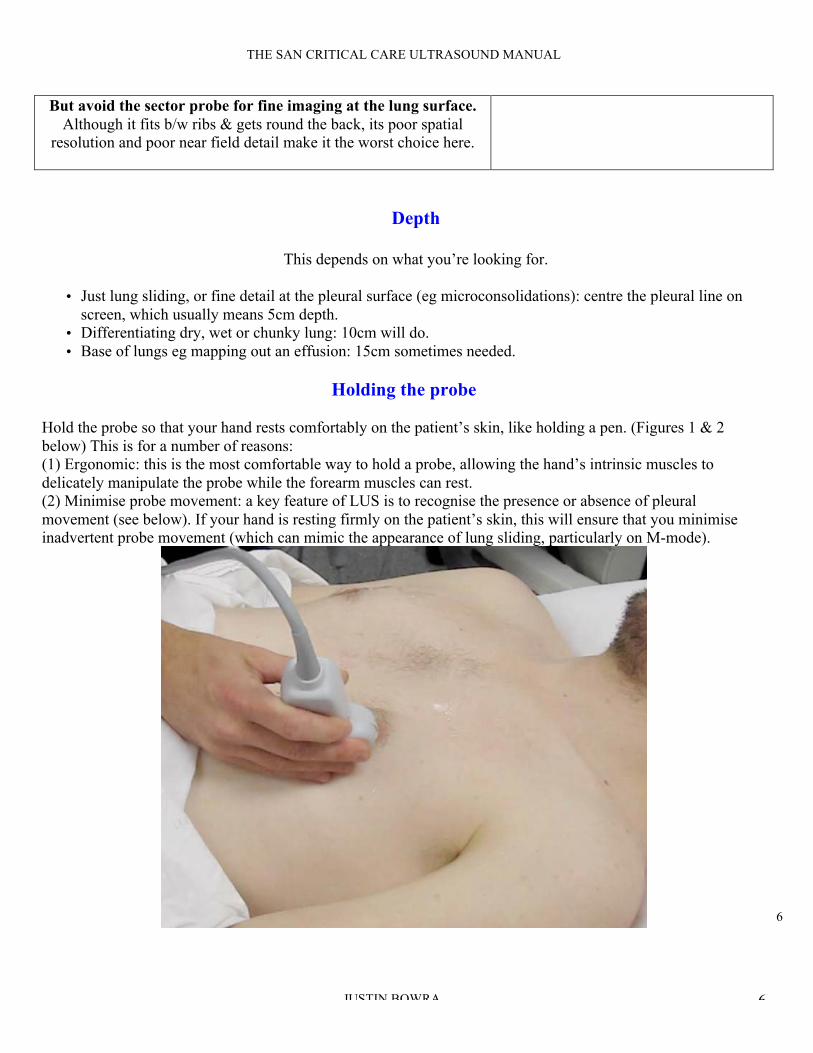
But avoid the sector probe for fine imaging at the lung surface.
Although it fits b/w ribs & gets round the back, its poor spatial
resolution and poor near field detail make it the worst choice here.
Depth
This depends on what you’re looking for.
• Just lung sliding, or fine detail at the pleural surface (eg microconsolidations): centre the pleural line on
screen, which usually means 5cm depth.
• Differentiating dry, wet or chunky lung: 10cm will do.
• Base of lungs eg mapping out an effusion: 15cm sometimes needed.
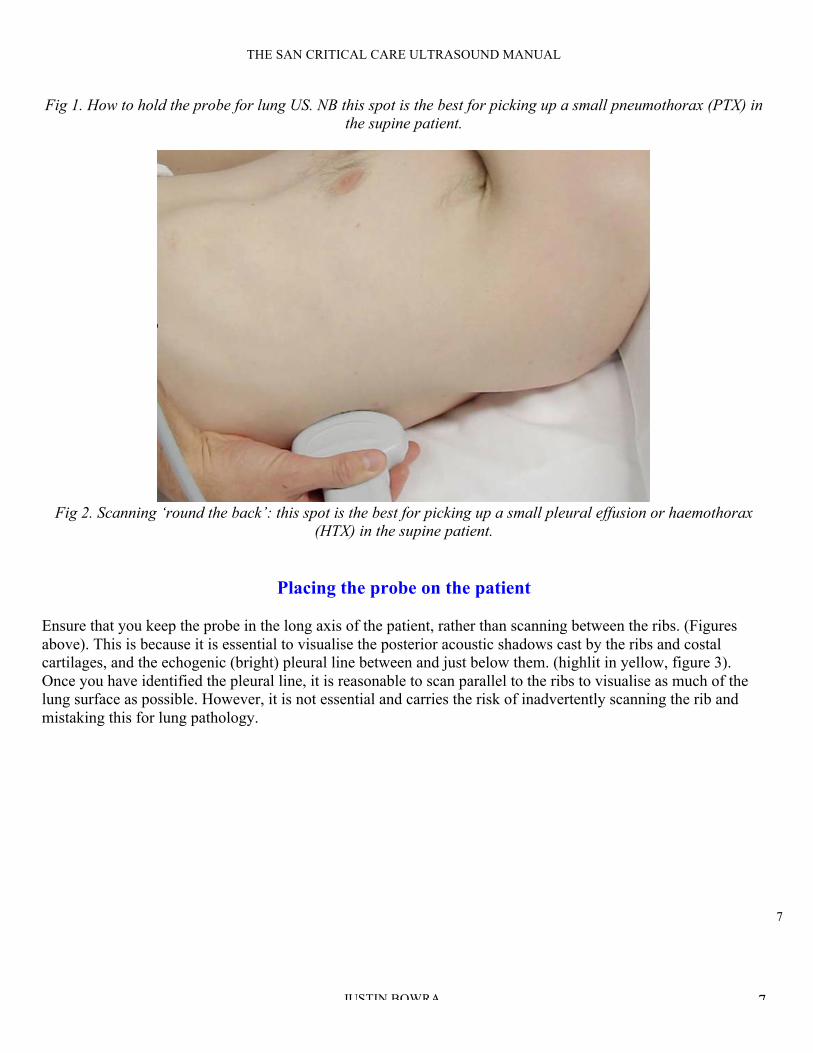
Holding the probe
Hold the probe so that your hand rests comfortably on the patient’s skin, like holding a pen. (Figures 1 & 2
below) This is for a number of reasons:
(1) Ergonomic: this is the most comfortable way to hold a probe, allowing the hand’s intrinsic muscles to
delicately manipulate the probe while the forearm muscles can rest.
(2) Minimise probe movement: a key feature of LUS is to recognise the presence or absence of pleural
movement (see below). If your hand is resting firmly on the patient’s skin, this will ensure that you minimise
inadvertent probe movement (which can mimic the appearance of lung sliding, particularly on M-mode).
7
THE SAN CRITICAL CARE ULTRASOUND MANUAL
JUSTIN BOWRA 7
Fig 1. How to hold the probe for lung US. NB this spot is the best for picking up a small pneumothorax (PTX) in
the supine patient.
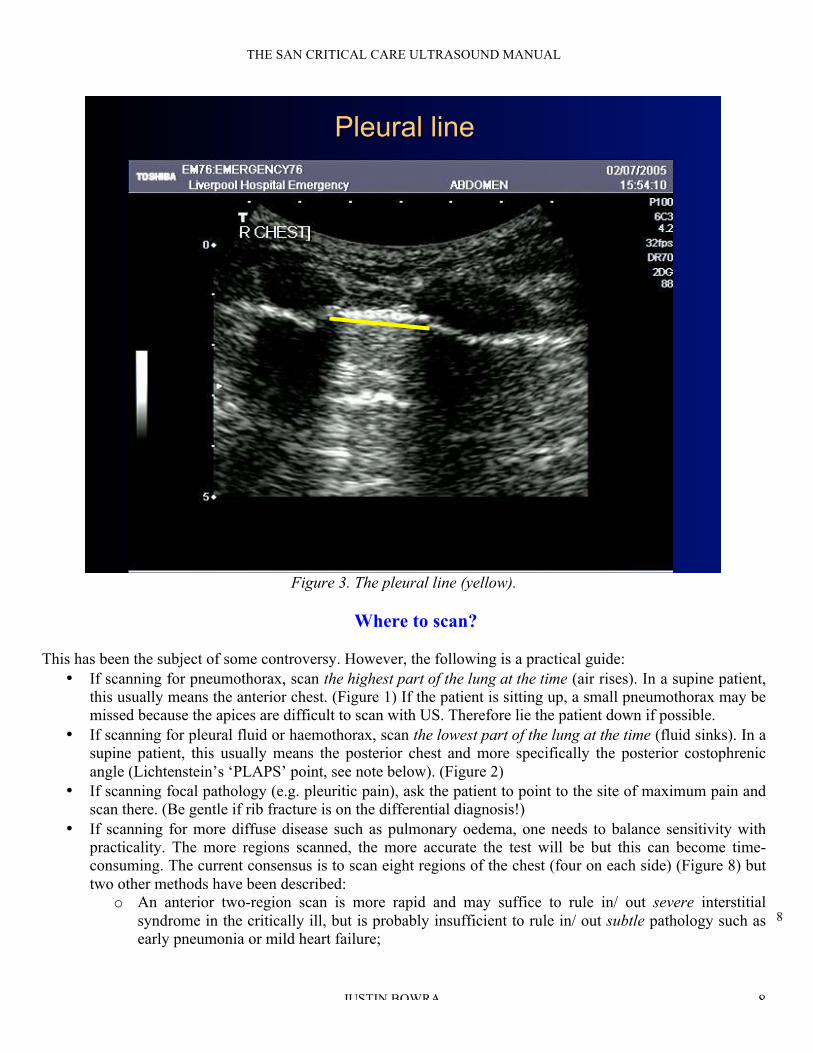
Fig 2. Scanning ‘round the back’: this spot is the best for picking up a small pleural effusion or haemothorax
(HTX) in the supine patient.
Placing the probe on the patient
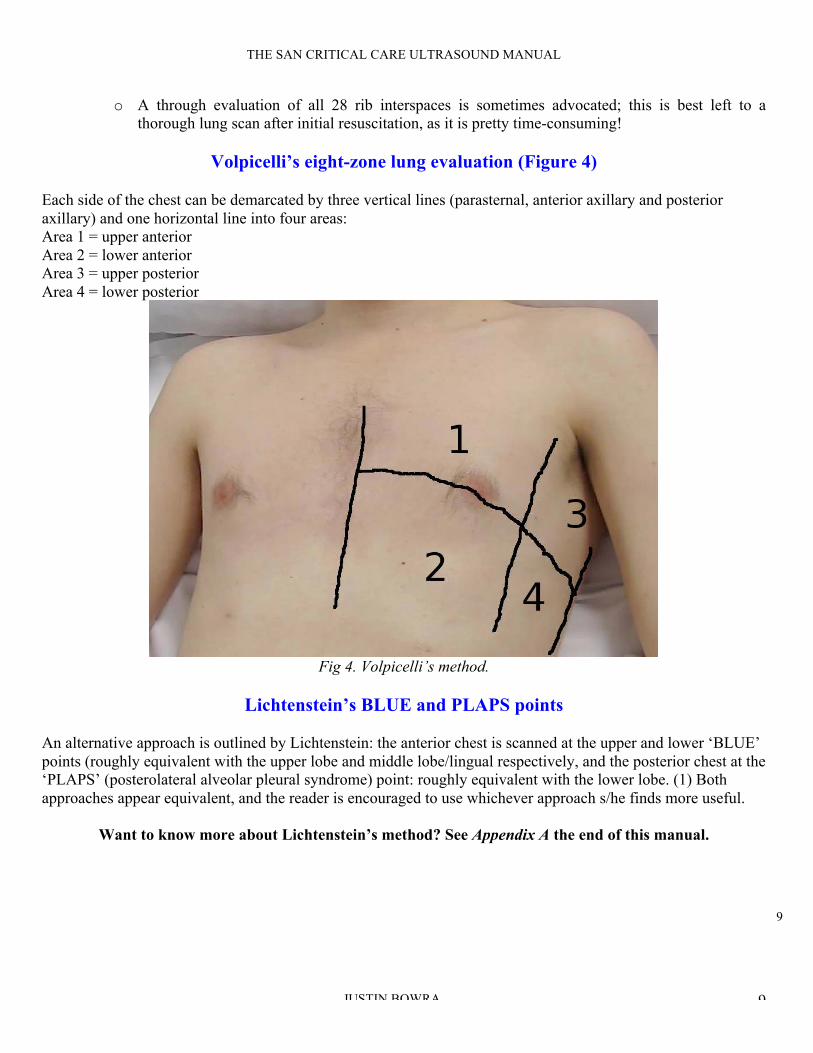
Ensure that you keep the probe in the long axis of the patient, rather than scanning between the ribs. (Figures
above). This is because it is essential to visualise the posterior acoustic shadows cast by the ribs and costal
cartilages, and the echogenic (bright) pleural line between and just below them. (highlit in yellow, figure 3).
Once you have identified the pleural line, it is reasonable to scan parallel to the ribs to visualise as much of the
lung surface as possible. However, it is not essential and carries the risk of inadvertently scanning the rib and
mistaking this for lung pathology.
8
THE SAN CRITICAL CARE ULTRASOUND MANUAL
JUSTIN BOWRA 8
Pleural line
9
Figure 3. The pleural line (yellow).
Where to scan?
This has been the subject of some controversy. However, the following is a practical guide:
• If scanning for pneumothorax, scan the highest part of the lung at the time (air rises). In a supine patient,
this usually means the anterior chest. (Figure 1) If the patient is sitting up, a small pneumothorax may be
missed because the apices are difficult to scan with US. Therefore lie the patient down if possible.
• If scanning for pleural fluid or haemothorax, scan the lowest part of the lung at the time (fluid sinks). In a
supine patient, this usually means the posterior chest and more specifically the posterior costophrenic
angle (Lichtenstein’s ‘PLAPS’ point, see note below). (Figure 2)
• If scanning focal pathology (e.g. pleuritic pain), ask the patient to point to the site of maximum pain and
scan there. (Be gentle if rib fracture is on the differential diagnosis!)
• If scanning for more diffuse disease such as pulmonary oedema, one needs to balance sensitivity with
practicality. The more regions scanned, the more accurate the test will be but this can become time-
consuming. The current consensus is to scan eight regions of the chest (four on each side) (Figure 8) but
two other methods have been described:
o An anterior two-region scan is more rapid and may suffice to rule in/ out severe interstitial
syndrome in the critically ill, but is probably insufficient to rule in/ out subtle pathology such as
early pneumonia or mild heart failure;
9
THE SAN CRITICAL CARE ULTRASOUND MANUAL
JUSTIN BOWRA 9
o A through evaluation of all 28 rib interspaces is sometimes advocated; this is best left to a
thorough lung scan after initial resuscitation, as it is pretty time-consuming!
Volpicelli’s eight-zone lung evaluation (Figure 4)
Each side of the chest can be demarcated by three vertical lines (parasternal, anterior axillary and posterior
axillary) and one horizontal line into four areas:
Area 1 = upper anterior
Area 2 = lower anterior
Area 3 = upper posterior
Area 4 = lower posterior
Fig 4. Volpicelli’s method.
Lichtenstein’s BLUE and PLAPS points
An alternative approach is outlined by Lichtenstein: the anterior chest is scanned at the upper and lower ‘BLUE’
points (roughly equivalent with the upper lobe and middle lobe/lingual respectively, and the posterior chest at the
‘PLAPS’ (posterolateral alveolar pleural syndrome) point: roughly equivalent with the lower lobe. (1) Both
approaches appear equivalent, and the reader is encouraged to use whichever approach s/he finds more useful.
Want to know more about Lichtenstein’s method? See Appendix A the end of this manual.

10
THE SAN CRITICAL CARE ULTRASOUND MANUAL
JUSTIN BOWRA 10
What am I looking for? Image interpretation
To begin: five simple questions
1. Is there lung sliding?
2. Is there pleural fluid?
3. Are there A-lines, B-lines or no lines at all?
4. Is there consolidation?
5. Is the pleural line irregaular?
1. Is there lung sliding?
• The simplest LUS sign to describe
• But can be difficult to interpret in practice
• Lung sliding = the respiratory movement of the visceral on the parietal pleura
• Resembles ‘sparkling’ / ‘twinkling’ seen at the pleural line
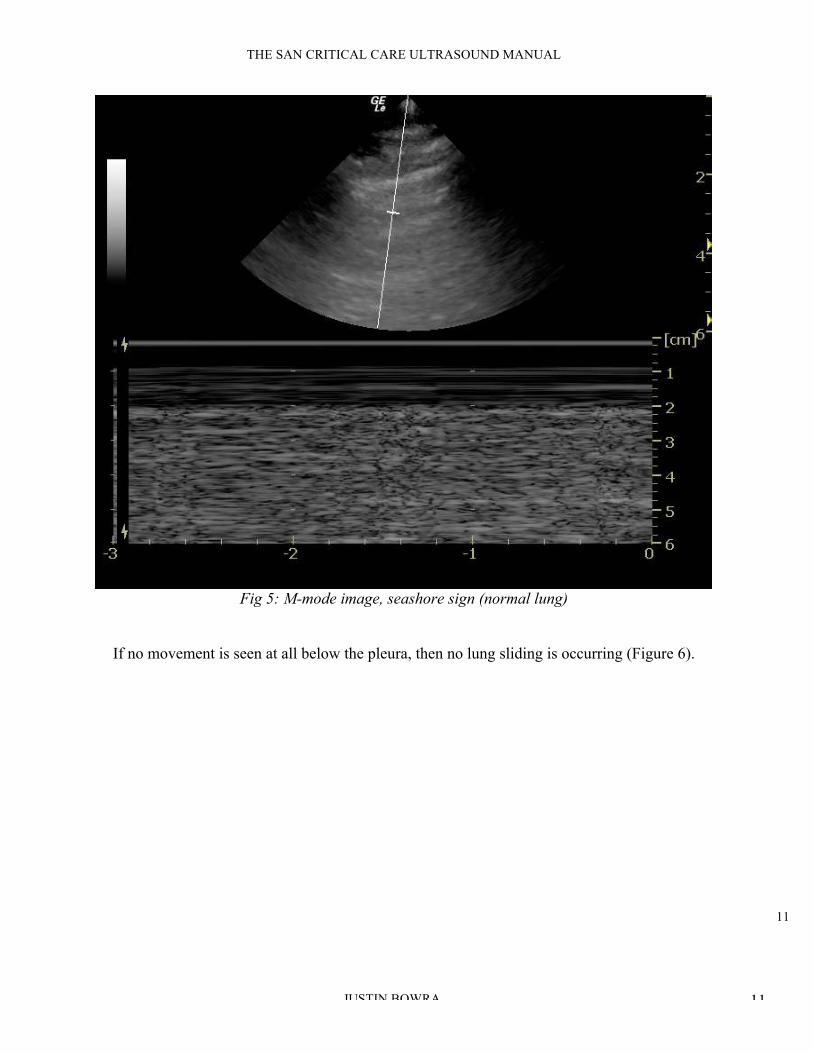
• If not obvious, M-mode (Motion mode) can be used:
a. Obtain a standard greyscale (B-mode) image of the pleural line as described above
b. Activate ‘M mode’ on your machine. On the screen, a vertical line will appear. Using the track ball/ track
pad, move the line so that it intersects the pleural line rather than the ribs.
c. M-mode is ‘Motion mode’: in other words, this creates an image of what the vertical line ‘sees’ over time
a. y-axis on an M-mode image = time
b. x-axis = the vertical line. (Figure 5)
d. If a structure is not moving, it creates a series of horizontal lines (note the horizontal lines created by the
muscle, fascia, fat and skin above the pleural line seen in figure 5.
e. If a structure is sliding back and forth (such as the visceral pleura sliding on the parietal pleura in this
context), then a ‘grainy’ image results, as in the grainy artifacts seen below the pleural line in figure 6.
11
THE SAN CRITICAL CARE ULTRASOUND MANUAL
JUSTIN BOWRA 11
Fig 5: M-mode image, seashore sign (normal lung)
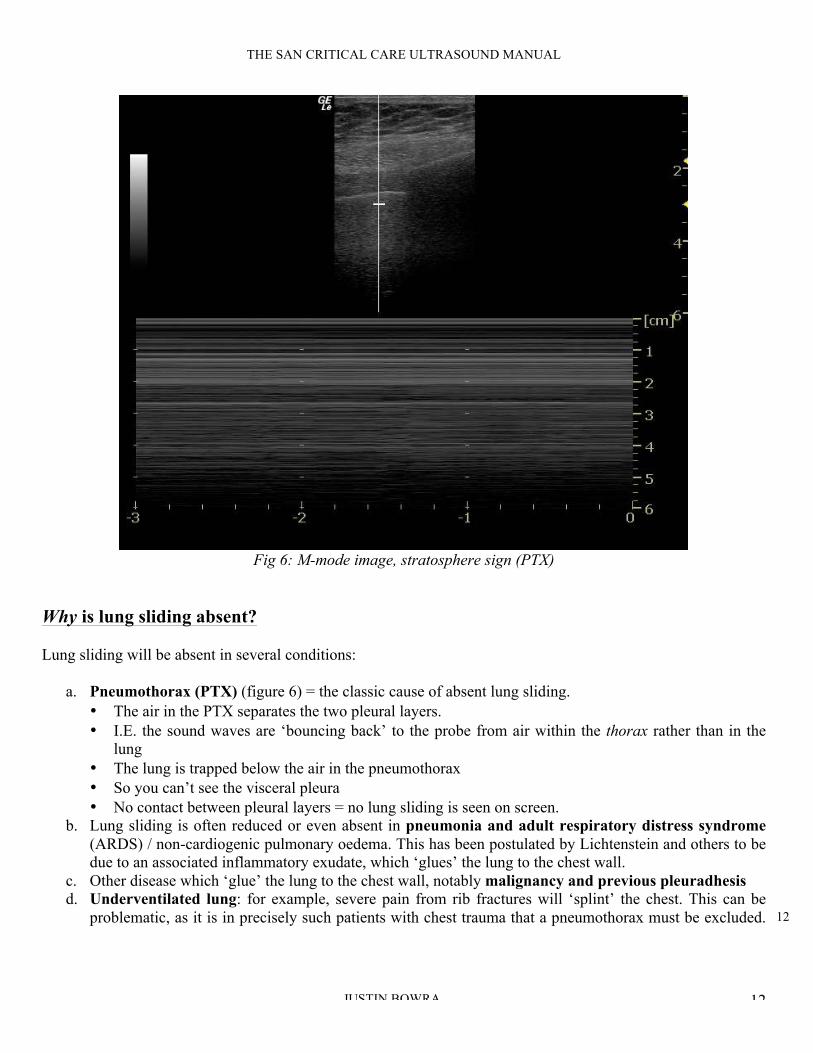
If no movement is seen at all below the pleura, then no lung sliding is occurring (Figure 6).
12
THE SAN CRITICAL CARE ULTRASOUND MANUAL
JUSTIN BOWRA 12
Fig 6: M-mode image, stratosphere sign (PTX)
Why is lung sliding absent?
Lung sliding will be absent in several conditions:
a. Pneumothorax (PTX) (figure 6) = the classic cause of absent lung sliding.
• The air in the PTX separates the two pleural layers.
• I.E. the sound waves are ‘bouncing back’ to the probe from air within the thorax rather than in the
lung
• The lung is trapped below the air in the pneumothorax
• So you can’t see the visceral pleura
• No contact between pleural layers = no lung sliding is seen on screen.
b. Lung sliding is often reduced or even absent in pneumonia and adult respiratory distress syndrome
(ARDS) / non-cardiogenic pulmonary oedema. This has been postulated by Lichtenstein and others to be
due to an associated inflammatory exudate, which ‘glues’ the lung to the chest wall.
c. Other disease which ‘glue’ the lung to the chest wall, notably malignancy and previous pleuradhesis
d. Underventilated lung: for example, severe pain from rib fractures will ‘splint’ the chest. This can be
problematic, as it is in precisely such patients with chest trauma that a pneumothorax must be excluded.

13
THE SAN CRITICAL CARE ULTRASOUND MANUAL
JUSTIN BOWRA 13
Patients with severe chronic airways disease often demonstrate reduced lung sliding, particularly if bullae
are present.
e. Unventilated lung: for example the left lung in a patient with right main bronchus intubation, or a lung
in which the main bronchus is obstructed.
2. Is there pleural fluid?
Pleural fluid is best observed at the most dependent area of the thorax (see note above on image acquisition). Its
appearance on LUS depends on its consistency:
• Transudate or an acute haemothorax = ‘echo-poor’ (dark) (Figure 7)
• Complex collections (e.g. clotted blood or established exudates) = heterogeneous appearance (Figure 8)
The key features of pleural fluid on LUS are:
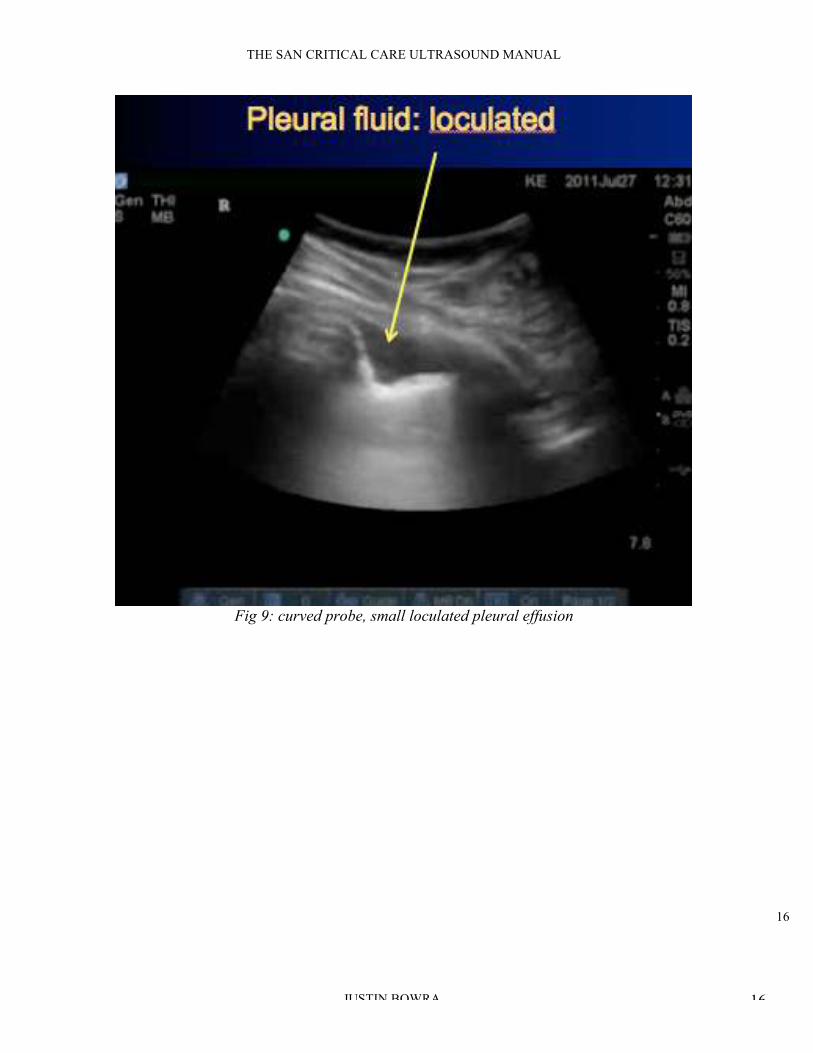
(a) Location: in the space between the parietal and visceral pleura, at the most dependent part of the thorax
(unless large). If small, it may appear simply as a ‘stripe’ between the parietal and visceral pleura. If
loculated, it may appear as a small ‘wedge’. (Figure 9) If large, it will appear as a large fluid collection in
which the lung (and even the heart) may be seen to float.
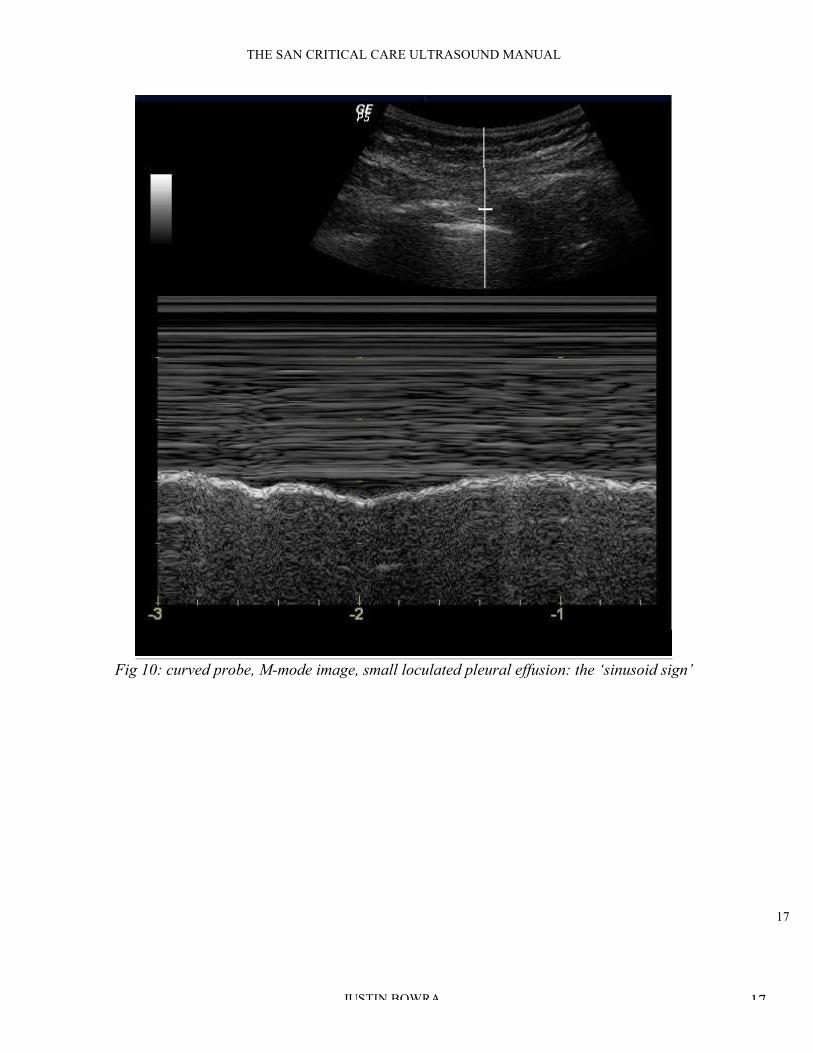
(b) Lung movement with respiration: unless the effusion has ‘glued’ the lung to the chest wall (see note
above on absent lung sliding), the lung ‘bobs’ back and forth within the effusion with respiration. This is
even visible when the effusion is small, and is sometimes rendered more obvious when using M-mode, in
which case the movement resembles a wave (Lichtenstein’s sinusoid sign). (Figure 10)

14
THE SAN CRITICAL CARE ULTRASOUND MANUAL
JUSTIN BOWRA 14
! Fig 7. Sector probe RUQ, large pleural effusion (black) above diaphragm

15
THE SAN CRITICAL CARE ULTRASOUND MANUAL
JUSTIN BOWRA 15
Fig 8: sector probe RUQ, large loculated pleural effusion
16
THE SAN CRITICAL CARE ULTRASOUND MANUAL
JUSTIN BOWRA 16
Fig 9: curved probe, small loculated pleural effusion
17
THE SAN CRITICAL CARE ULTRASOUND MANUAL
JUSTIN BOWRA 17
Fig 10: curved probe, M-mode image, small loculated pleural effusion: the ‘sinusoid sign’
18
THE SAN CRITICAL CARE ULTRASOUND MANUAL
JUSTIN BOWRA 18
3. Are there A lines, B lines or no lines at all?
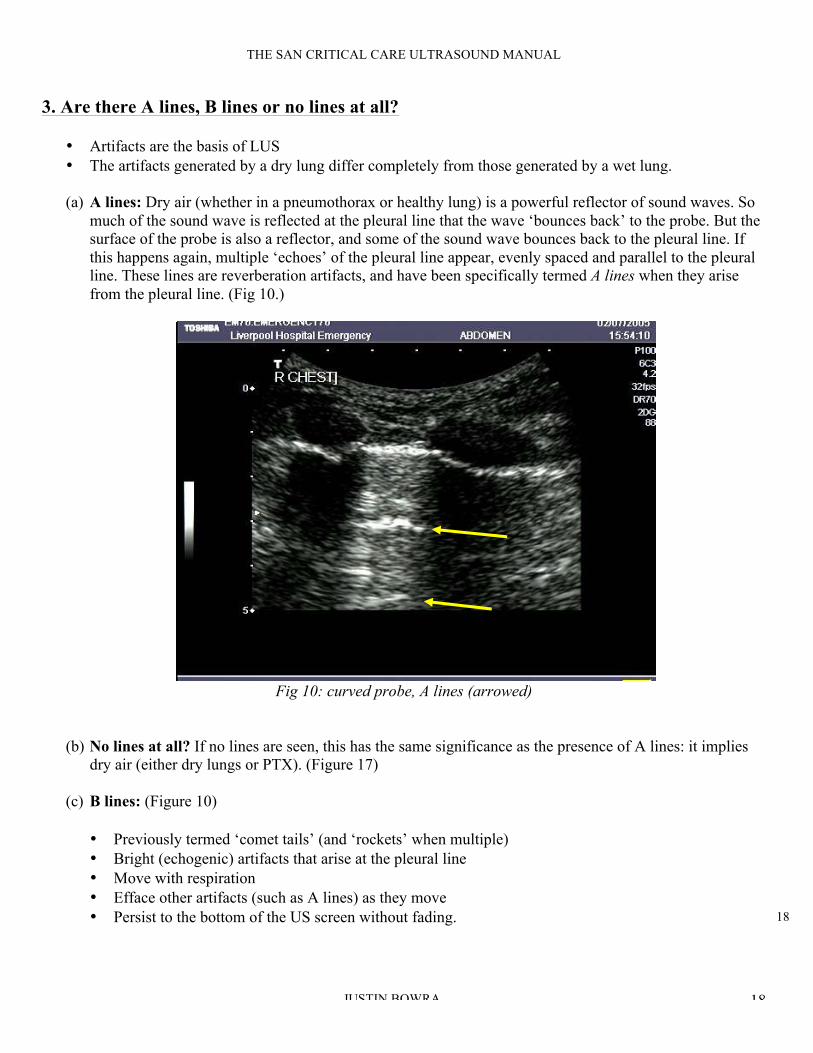
• Artifacts are the basis of LUS
• The artifacts generated by a dry lung differ completely from those generated by a wet lung.
(a) A lines: Dry air (whether in a pneumothorax or healthy lung) is a powerful reflector of sound waves. So
much of the sound wave is reflected at the pleural line that the wave ‘bounces back’ to the probe. But the
surface of the probe is also a reflector, and some of the sound wave bounces back to the pleural line. If
this happens again, multiple ‘echoes’ of the pleural line appear, evenly spaced and parallel to the pleural
line. These lines are reverberation artifacts, and have been specifically termed A lines when they arise
from the pleural line. (Fig 10.)
A lines
1
0
Fig 10: curved probe, A lines (arrowed)
(b) No lines at all? If no lines are seen, this has the same significance as the presence of A lines: it implies
dry air (either dry lungs or PTX). (Figure 17)
(c) B lines: (Figure 10)
• Previously termed ‘comet tails’ (and ‘rockets’ when multiple)
• Bright (echogenic) artifacts that arise at the pleural line
• Move with respiration
• Efface other artifacts (such as A lines) as they move
• Persist to the bottom of the US screen without fading.

19
THE SAN CRITICAL CARE ULTRASOUND MANUAL
JUSTIN BOWRA 19
! Fig 10: sector probe, B line (arrowed)
Multiple B lines (figs 11, 12) are found in two pathological conditions: pulmonary oedema and
pulmonary fibrosis. They appear to be due to changes within the interstitium of the lung itself. For this
reason, the LUS finding of multiple B lines in a lung field is termed ‘interstitial syndrome’.
Fig 11: multiple B lines (sometimes called ‘rockets’)

20
THE SAN CRITICAL CARE ULTRASOUND MANUAL
JUSTIN BOWRA 20
Fig 12: multiple B lines
Fig 13: confluent B lines
21
THE SAN CRITICAL CARE ULTRASOUND MANUAL
JUSTIN BOWRA 21
Key points about B lines:
• Interstitial syndrome is a term you may have heard of in the literature. It is specific to LUS. It is not
a clinical syndrome and in fact encompasses all the clinical syndromes that cause pulmonary fibrosis
or pulmonary oedema. (The LUS differentiation of pulmonary fibrosis and oedema is addressed
below.)
• B lines are never found in pneumothorax. They are only found when lung abuts the pleura.
Therefore the presence of even a single B line rules out a pneumothorax in that intercostal space.
Even a single B line rules out a pneumothorax at that site.
• The more B lines present, the ‘wetter’ or more fibrosed the lung (depending on the context). One or
two B lines per intercostal space can be considered normal. Three or more are considered abnormal
and are termed ‘B pattern’ (previously ‘rockets’).
You need three or more B lines in an intercostal space before that bit of lung can be called
‘wet’.
• In the presence of confluent B lines, one can estimate the percentage of the intercostal space occupied
by B lines and then divide by ten, for a rough estimation of the ‘number’ of B lines present. In figure
13, approximately 50% of the intercostal space on the right of the screen is taken up by confluent B
lines, which equates to five B lines. However, in practice this is not usually required.
• However, even multiple B lines at the most dependent areas of the lung (usually near the diaphragm)
have been observed in 25-33% of ‘normal’ individuals. I suspect this may be analogous to finding
‘incidental’ crepitations on auscultation of the lung bases of elderly patients.
Up to 1/3 of normal subjects have multiple B lines in dependent regions.
Why are there B lines?
Although everyone agrees that B lines arise from thickened lung interstitium (interstitial oedema and fibrosis)
no-one is really sure why. It has been postulated that the commingled air and fibre/fluid creates ultrasonic
interfaces that cause ‘micro-reverberations’ that persist to the edge of the screen.
22
THE SAN CRITICAL CARE ULTRASOUND MANUAL
JUSTIN BOWRA 22
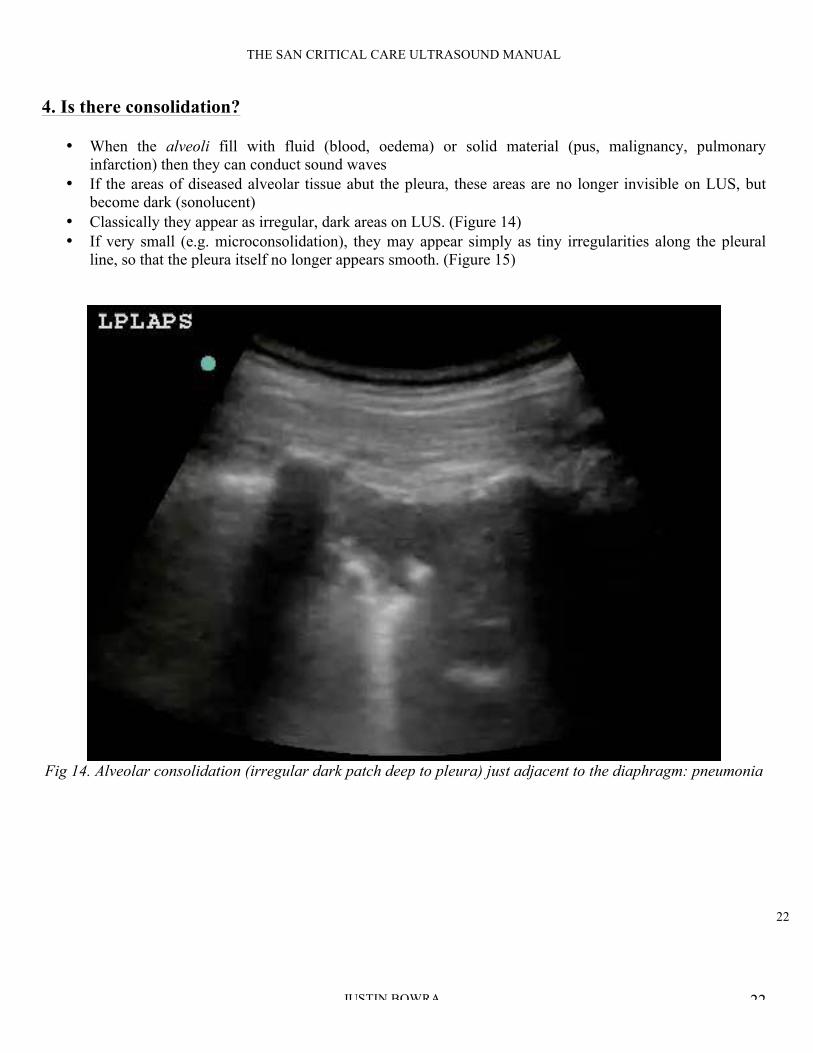
4. Is there consolidation?
• When the alveoli fill with fluid (blood, oedema) or solid material (pus, malignancy, pulmonary
infarction) then they can conduct sound waves
• If the areas of diseased alveolar tissue abut the pleura, these areas are no longer invisible on LUS, but
become dark (sonolucent)
• Classically they appear as irregular, dark areas on LUS. (Figure 14)
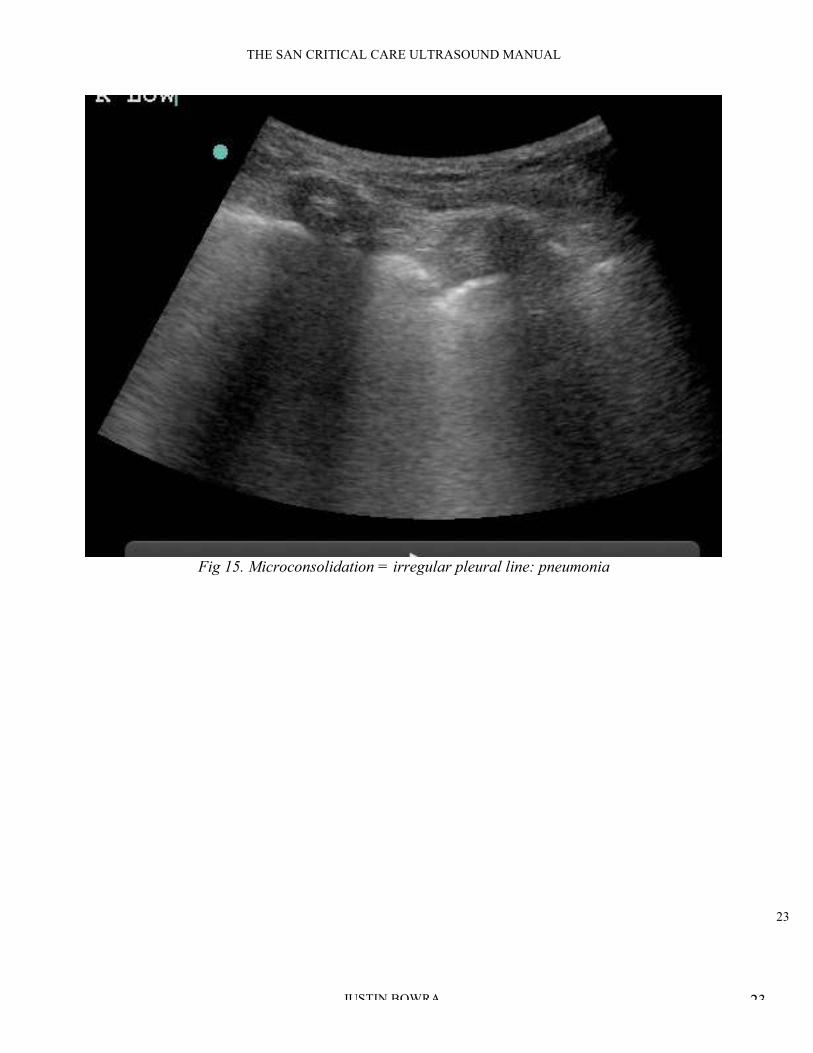
• If very small (e.g. microconsolidation), they may appear simply as tiny irregularities along the pleural
line, so that the pleura itself no longer appears smooth. (Figure 15)
Fig 14. Alveolar consolidation (irregular dark patch deep to pleura) just adjacent to the diaphragm: pneumonia
23
THE SAN CRITICAL CARE ULTRASOUND MANUAL
JUSTIN BOWRA 23
Fig 15. Microconsolidation = irregular pleural line: pneumonia

24
THE SAN CRITICAL CARE ULTRASOUND MANUAL
JUSTIN BOWRA 24
Key points: • Consolidated lung tissue appears dark (echo-poor) on LUS, but only if it abuts the pleural line. (If the
consolidated area does not extend to the pleura, it will remain invisible on LUS.) Therefore LUS can be
used to rule in pneumonia, but not to rule it out.
• The area in question may appear ‘liver-like’ (i.e. a similar echotexture), so it is crucial to ensure that the
area in question is above the diaphragm This is all the more important because pneumonic consolidation
often appears first at the portion of lung which abuts on the diaphragm.
• The deep margin of the area in question is irregular (figure 14), unlike the appearance of a loculated
pleural effusion (figure 9).
• This appearance is common to the following diseases:
o Pneumonia, acute lung injury, atelectasis
o Malignancy, abscess (in which case fluid filled areas may also be present)
o Pulmonary infarction (e.g. pulmonary embolus)
• Certain LUS features may point to one disease rather than other, such as:
o Air bronchograms (pneumonia) (figure 16)
o Fluid filled areas (necrosis in malignancy, or abscess)
o Experienced scanners use Doppler imaging to differentiate some conditions based on their
vascularity, for example:
! Pneumonia: normal vascularity preserved
! Malignancy: bizarre vascularity / areas of necrosis
! Infarct: flow only at edges
o However, that’s a little beyond the beginner.
For most clinicians, the best way to differentiate these conditions is on clinical grounds.

25
THE SAN CRITICAL CARE ULTRASOUND MANUAL
JUSTIN BOWRA 25
PLEURAL FLUID
DIAPHRAGM
AIR
BRONCHOGRAM
COLLAPSED
LUNG
Fig 16. Air bronchogram
5. Is the pleural line irregular?
In the healthy lung and in some diseases (such as PTX and cardiogenic pulmonary oedema) the pleural line is
smooth and regular. However, in some conditions it appears irregular, whether due to tiny
microconsolidations which abut the pleura (pneumonia, acute lung injury) or due to thickening of the pleura
itself (e.g. interstitial fibrosis, mesothelioma). (Figure 15)
26
THE SAN CRITICAL CARE ULTRASOUND MANUAL
JUSTIN BOWRA 26
Putting it together: the clinical questions
Many of the conditions described above share features on LUS, so it is sometimes difficult to differentiate them.
Therefore it is important to bear in mind the following principles:
• Clinical context is paramount. We are clinicians first and sonologists second. For example if there is
simply no way that the patient could have a pneumothorax, reevaluate the LUS findings and consider the
differential diagnosis.
• Although the diseases in question may share individual features, the overall pattern of LUS findings is
usually easy to differentiate. For example, both PTX and pneumonia may cause absent lung sliding, but
pneumonia will be associated with one or more of the following: areas of consolidation, multiple B-lines
(inflammatory oedema), irregular pleural line and pleural fluid. (Figure 24) None of these are found in
PTX. (Figure 16b)
Clinical context is paramount.
We are clinicians first and sonologists second.
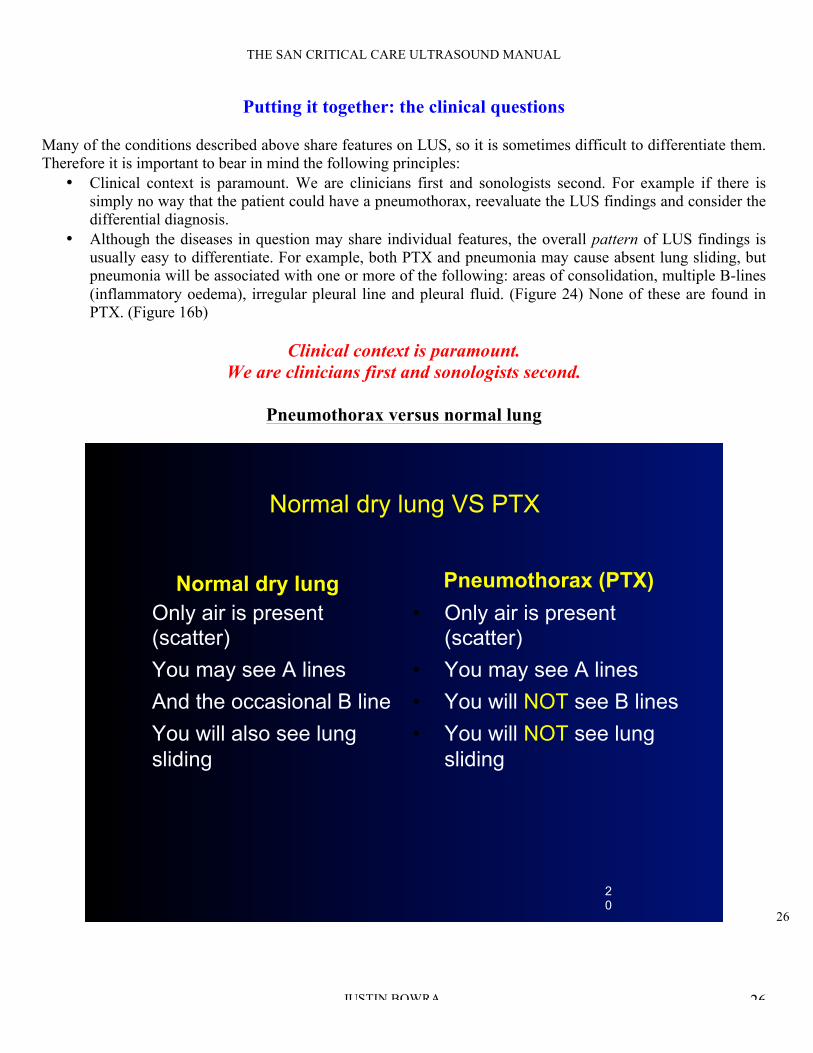
Pneumothorax versus normal lung
Normal dry lung VS PTX
Normal dry lung
• Only air is present (scatter)
• You may see A lines
• And the occasional B line
• You will also see lung
sliding
Pneumothorax (PTX)
• Only air is present (scatter)
• You may see A lines
• You will NOT see B lines
• You will NOT see lung
sliding
20
27
THE SAN CRITICAL CARE ULTRASOUND MANUAL
JUSTIN BOWRA 27
Pneumothorax versus pneumonia and other mimics
As noted above, many diseases can cause reduced or even absent lung sliding. Therefore this sign is simply not
enough to ‘rule in’ PTX.
The classic features of pneumothorax (PTX) on LUS are:
1. Absent lung sliding
2. Absent B lines: even a single B line will rule out PTX. This will often be enough to tell PTX apart from
its mimics. For example, as noted above pneumonia and acute lung injury often are associated with
multiple B lines (inflammatory oedema).
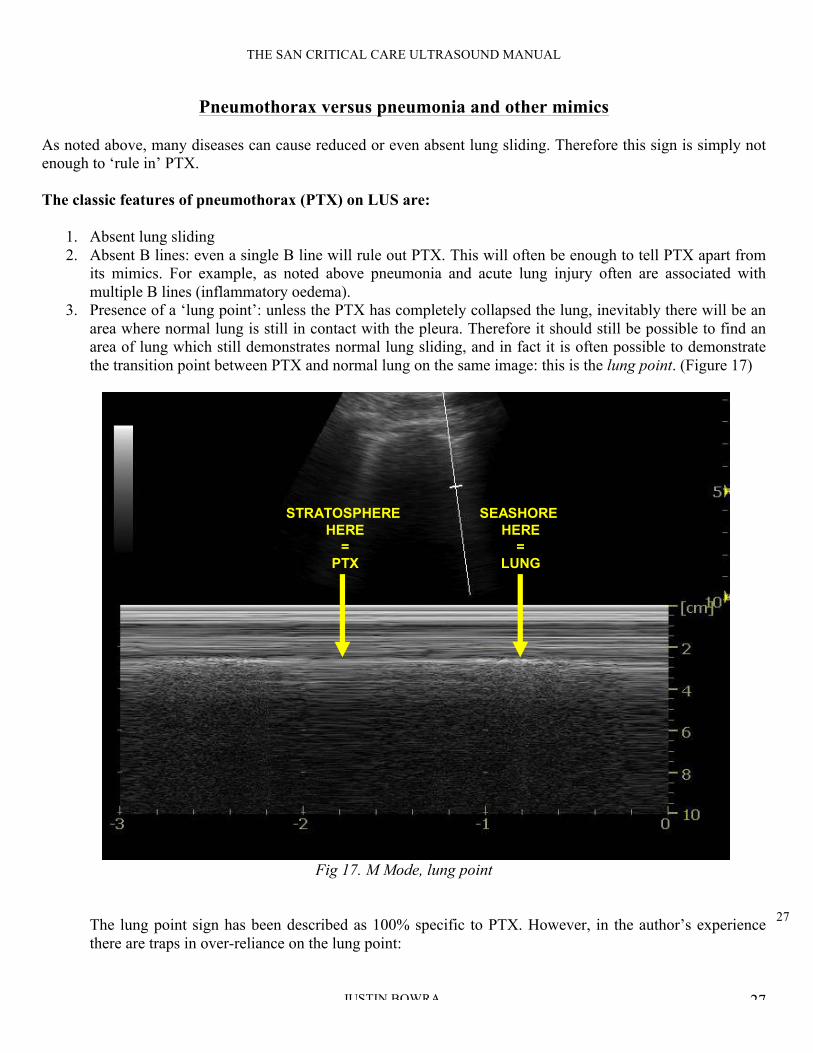
3. Presence of a ‘lung point’: unless the PTX has completely collapsed the lung, inevitably there will be an
area where normal lung is still in contact with the pleura. Therefore it should still be possible to find an
area of lung which still demonstrates normal lung sliding, and in fact it is often possible to demonstrate
the transition point between PTX and normal lung on the same image: this is the lung point. (Figure 17)
SEASHORE
HERE
=
LUNG
STRATOSPHERE
HERE
=
PTX
Fig 17. M Mode, lung point
The lung point sign has been described as 100% specific to PTX. However, in the author’s experience
there are traps in over-reliance on the lung point:
28
THE SAN CRITICAL CARE ULTRASOUND MANUAL
JUSTIN BOWRA 28
a. Simple logic states that a complete PTX will not demonstrate the lung point, because the entire
lung will be collapsed. Therefore, in precisely those patients in whom the clinician is most
concerned about PTX (severe respiratory distress) there is little or no chance of finding a lung
point.
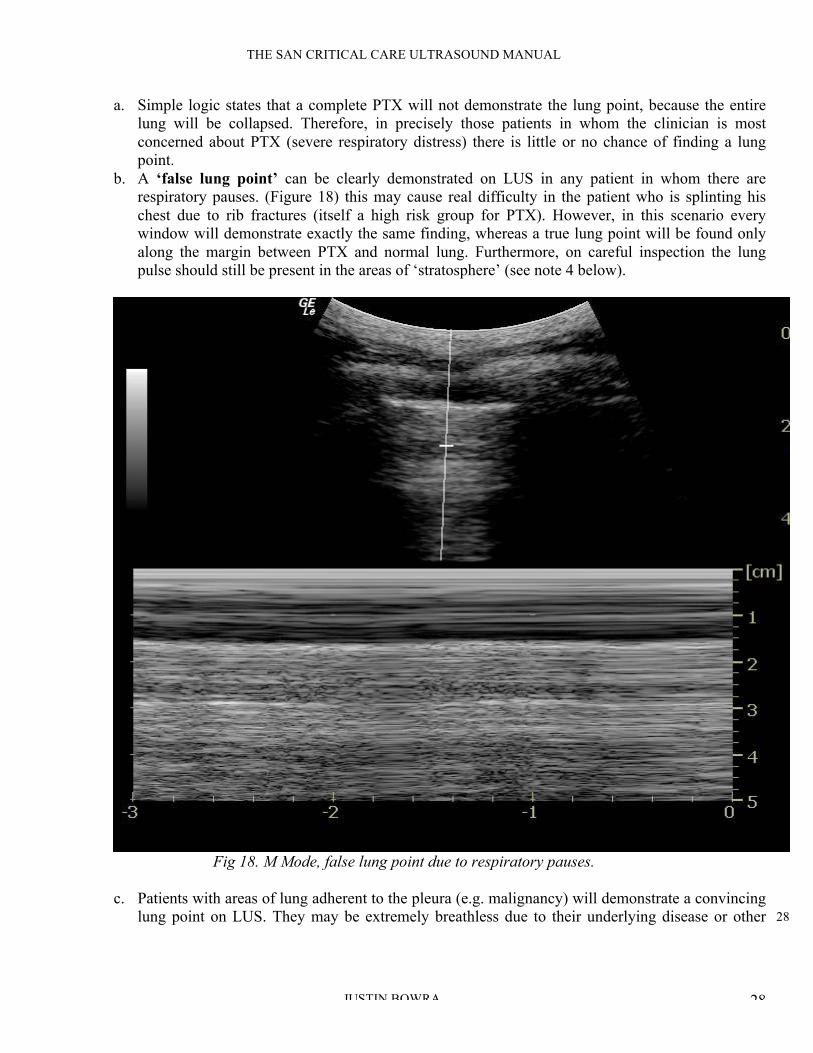
b. A ‘false lung point’ can be clearly demonstrated on LUS in any patient in whom there are
respiratory pauses. (Figure 18) this may cause real difficulty in the patient who is splinting his
chest due to rib fractures (itself a high risk group for PTX). However, in this scenario every
window will demonstrate exactly the same finding, whereas a true lung point will be found only
along the margin between PTX and normal lung. Furthermore, on careful inspection the lung
pulse should still be present in the areas of ‘stratosphere’ (see note 4 below).
Fig 18. M Mode, false lung point due to respiratory pauses.
c. Patients with areas of lung adherent to the pleura (e.g. malignancy) will demonstrate a convincing
lung point on LUS. They may be extremely breathless due to their underlying disease or other
29
THE SAN CRITICAL CARE ULTRASOUND MANUAL
JUSTIN BOWRA 29
causes such as pulmonary embolus. However, they will often demonstrate other LUS features that
rule out PTX (e.g. B lines).
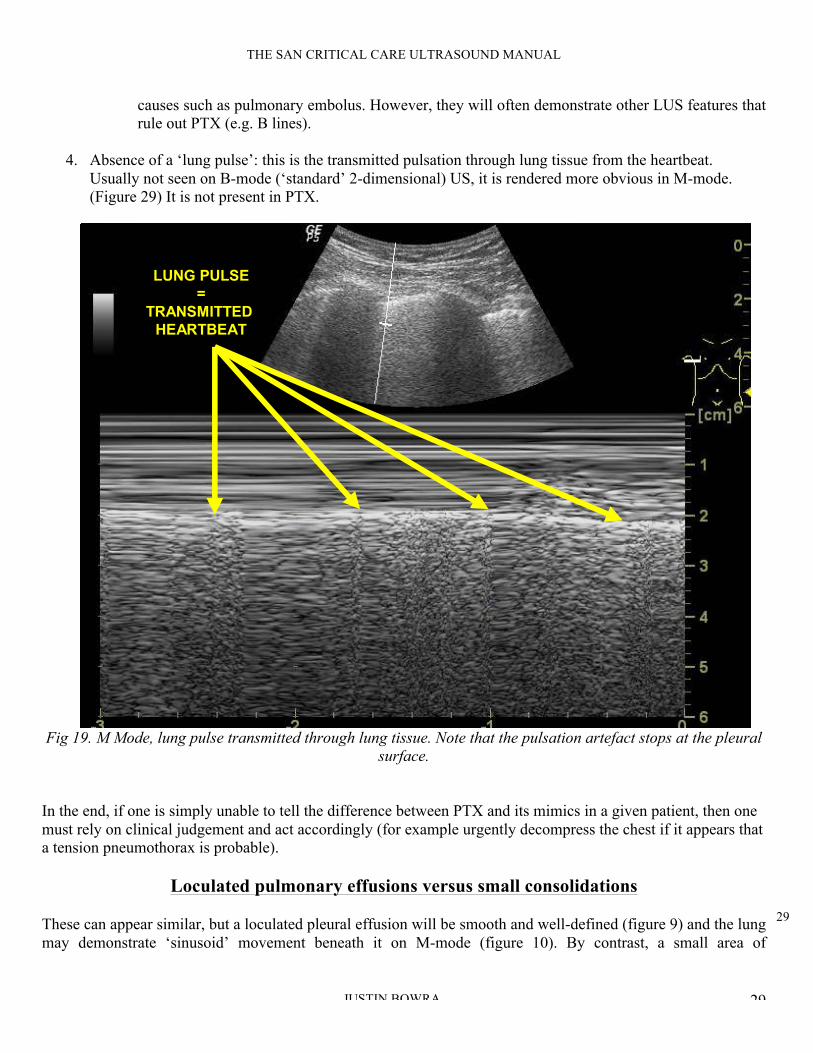
4. Absence of a ‘lung pulse’: this is the transmitted pulsation through lung tissue from the heartbeat.
Usually not seen on B-mode (‘standard’ 2-dimensional) US, it is rendered more obvious in M-mode.
(Figure 29) It is not present in PTX.
LUNG PULSE
=
TRANSMITTED
HEARTBEAT
Fig 19. M Mode, lung pulse transmitted through lung tissue. Note that the pulsation artefact stops at the pleural
surface.
In the end, if one is simply unable to tell the difference between PTX and its mimics in a given patient, then one
must rely on clinical judgement and act accordingly (for example urgently decompress the chest if it appears that
a tension pneumothorax is probable).
Loculated pulmonary effusions versus small consolidations
These can appear similar, but a loculated pleural effusion will be smooth and well-defined (figure 9) and the lung
may demonstrate ‘sinusoid’ movement beneath it on M-mode (figure 10). By contrast, a small area of

30
THE SAN CRITICAL CARE ULTRASOUND MANUAL
JUSTIN BOWRA 30
consolidation will demonstrate an irregular lower margin and perhaps some of the other signs associated (such as
comet tail artifacts), as noted above (figure 14).
Pneumonia and other causes of consolidation
As noted above it can be difficult to tell between causes of consolidation on LUS, for example multiple
pulmonary infarcts from a shower of small pulmonary emboli can mimic multiple areas of pneumonic
consolidation. If clinical assessment does not provide the answer, seek associated features of pneumonia such as
air bronchograms (highly echogenic on LUS, figure 16).
Cardiogenic pulmonary oedema versus widespread non-cardiogenic pulmonary oedema
(pneumonia, acute lung injury)
This can be a tricky one, both clinically and on LUS.
• Both demonstrate multiple B-lines.
• The key difference is that cardiogenic pulmonary oedema is hydrostatic while non-cardiogenic oedema is
inflammatory. The LUS differences are as follows:
LUS features Cardiogenic pulmonary odema Non-cardiogenic pulmonary oedema
(interstitial pneumonia/pneumonitis,
acute lung injury)
Overall pattern of
B-lines
Symmetrical, bilateral, gravity dependent
(i.e. worse at the dependent areas)
Asymmetrical (patchy)
Spared areas of
normal lung?
If mild or improving with treatment, the
apices may be spared
Spared areas of normal lung alternate with
diseased areas
Pleural effusion Often present Sometimes present
Lung sliding Often enhanced (pleural transudate
decreases friction)
Often reduced or absent (‘sticky’ pleural
exudate increases friction)
Pleural line Smooth Often irregular (due to microconsolidations)
Areas of
consolidation
Absent (unless coexistent disease) Present
Cardiogenic pulmonary oedema versus pulmonary fibrosis
Similarly, these conditions can be difficult to differentiate clinically (e.g. both may cause right heart failure) and
worse, can coexist. The LUS differences are as follows:
LUS features Cardiogenic pulmonary odema Pulmonary fibrosis
Overall pattern of
B-lines
Homogeneous. Symmetrical, bilateral,
gravity dependent (i.e. worse at the
dependent areas)
Usually nonhomogeneous. Pattern depends on
cause: may be predominantly in upper or lower
lobes
Pleural effusion Often present Often absent
Lung sliding Often enhanced (pleural transudate
decreases friction)
Usually normal

31
THE SAN CRITICAL CARE ULTRASOUND MANUAL
JUSTIN BOWRA 31
Pleural line Smooth Often thickened and irregular
Areas of
consolidation
Absent Absent
Causes of localised B-pattern
Multiple B-lines (B pattern) can arise from any cause of pulmonary oedema, such as inflammation or trauma.
Hence, if LUS demonstrates a localised area of B-pattern (multiple B lines) in an otherwise normal lung,
consider the following differential diagnoses:
• Normal subject (if present only at the most dependent areas)
• Localised pneumonia / pneumonitis
• Pulmonary contusion
• Pulmonary infarction
32
THE SAN CRITICAL CARE ULTRASOUND MANUAL
JUSTIN BOWRA 32
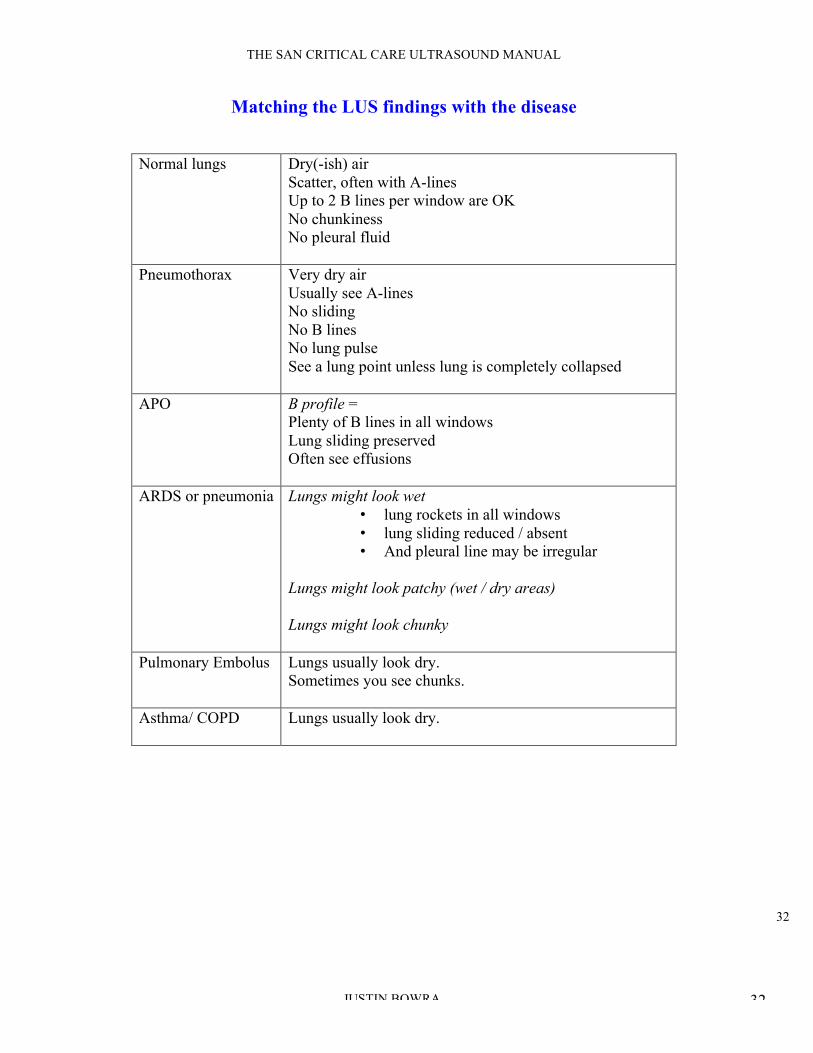
Matching the LUS findings with the disease
Normal lungs Dry(-ish) air
Scatter, often with A-lines
Up to 2 B lines per window are OK
No chunkiness
No pleural fluid
Pneumothorax Very dry air
Usually see A-lines
No sliding
No B lines
No lung pulse
See a lung point unless lung is completely collapsed
APO B profile =
Plenty of B lines in all windows
Lung sliding preserved
Often see effusions
ARDS or pneumonia Lungs might look wet
• lung rockets in all windows
• lung sliding reduced / absent
• And pleural line may be irregular
Lungs might look patchy (wet / dry areas)
Lungs might look chunky
Pulmonary Embolus Lungs usually look dry.
Sometimes you see chunks.
Asthma/ COPD Lungs usually look dry.

33
THE SAN CRITICAL CARE ULTRASOUND MANUAL
JUSTIN BOWRA 33
Traps to avoid in LUS
PTX
o False seashore sign: in the presence of chest wall movement (e.g. marked respiratory distress) or
probe movement, the entire LUS window may move, creating a ‘false’ seashore sign. Therefore
only accept a ‘seashore sign’ when it is clear that there is only movement below the pleural line.
o False lung point sign and over reliance on the lung point sign: see note above.
o Colour and Power Doppler are sometimes recommended to render lung sliding more obvious.
However, in the author’s experience there is simply too much risk of a false positive finding with
movement of the chest wall and of the probe itself, particularly for novice scanners.
o False seashore sign due to scanning the heart instead of the lung: when scanning the left chest,
one may mistake the heart’s movement artefact for lung movement (figure 27). A moment’s
reflection should suffice to remind the operator that normal lung sliding is horizontal with respect
to the probe (figure 9), unlike the heart’s movement which has a vertical component.
LUNG
SLIDING
CARDIAC
MOTION
Fig 20. M Mode, lung sliding and cardiac motion
o Missing a small PTX: this hazard is unlikely if one scans the highest part of the lungs. However,
it is still possible to miss a small ‘loculated’ PTX with this approach, so if it is considered

34
THE SAN CRITICAL CARE ULTRASOUND MANUAL
JUSTIN BOWRA 34
essential to completely rule out a PTX, one should scan as much of the lung as is possible. (Note
that this is rarely clinically indicated.)
Consolidation
o Mirror image: at the base of the lungs (ie just above the diaphragm), make sure that any apparent
‘consolidation’ is not actually mirror artifact. (Fig 21)
LIVER
MIRROR IMAGE
OF LIVER DIAPHRAGM
FIG 21. Mirror artifact: mirror image of liver tissue is seen just above the diaphragm, due to the reflector effect
of the air/fluid interface between lung and diaphragm.
35
THE SAN CRITICAL CARE ULTRASOUND MANUAL
JUSTIN BOWRA 35
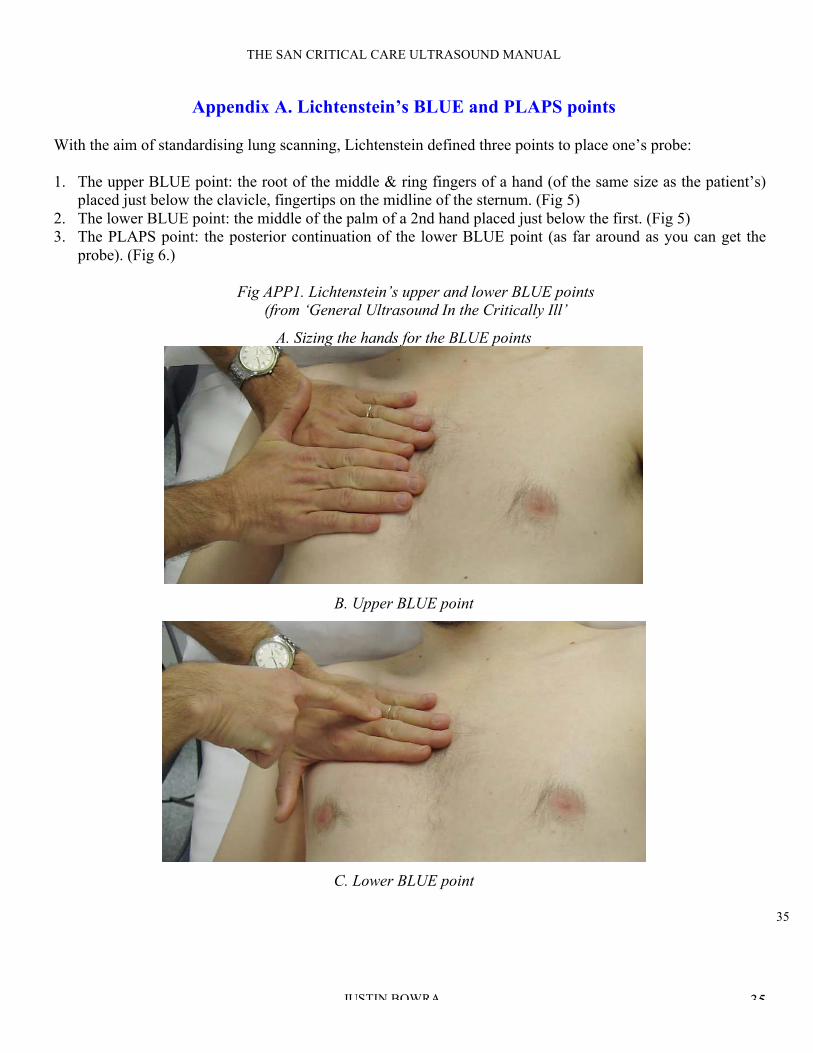
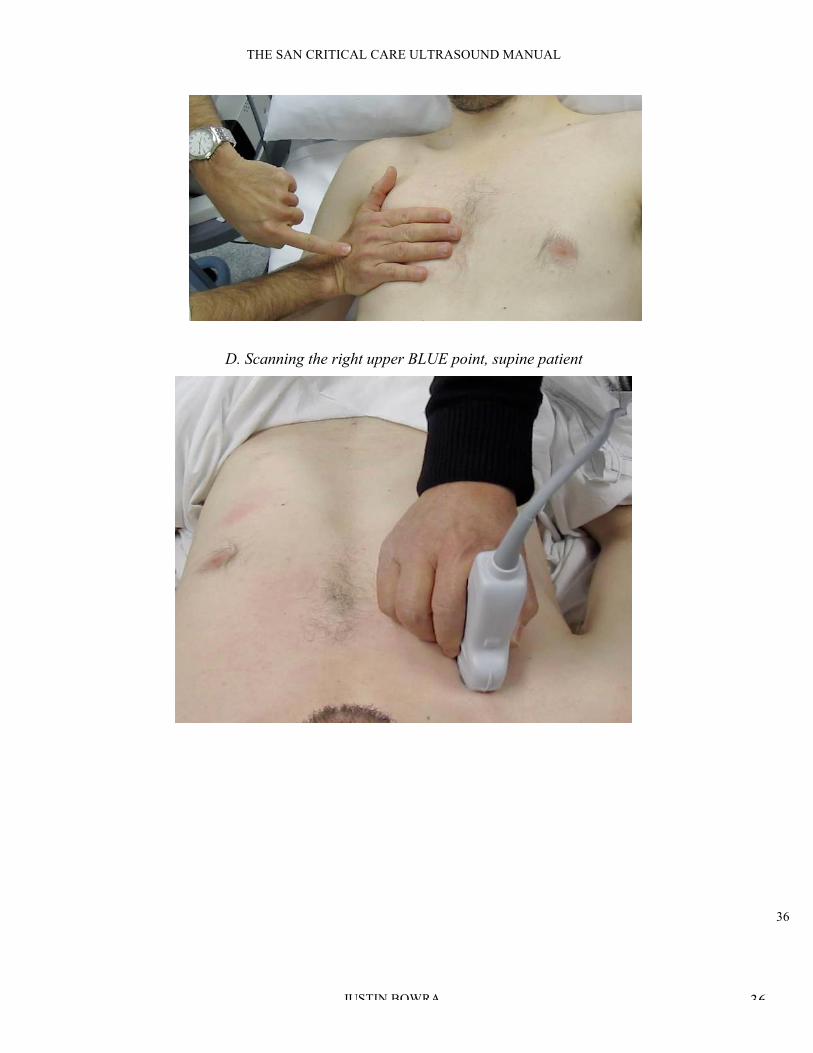
Appendix A. Lichtenstein’s BLUE and PLAPS points
With the aim of standardising lung scanning, Lichtenstein defined three points to place one’s probe:
1. The upper BLUE point: the root of the middle & ring fingers of a hand (of the same size as the patient’s)
placed just below the clavicle, fingertips on the midline of the sternum. (Fig 5)
2. The lower BLUE point: the middle of the palm of a 2nd hand placed just below the first. (Fig 5)
3. The PLAPS point: the posterior continuation of the lower BLUE point (as far around as you can get the
probe). (Fig 6.)
Fig APP1. Lichtenstein’s upper and lower BLUE points
(from ‘General Ultrasound In the Critically Ill’
A. Sizing the hands for the BLUE points
B. Upper BLUE point
C. Lower BLUE point
36
THE SAN CRITICAL CARE ULTRASOUND MANUAL
JUSTIN BOWRA 36
D. Scanning the right upper BLUE point, supine patient

37
THE SAN CRITICAL CARE ULTRASOUND MANUAL
JUSTIN BOWRA 37
Fig APP2. Lichtenstein’s PLAPS point