critical challenges for the global economy icrier new delhi, india april 20, 2007
TRANSCRIPT
Critical Challenges Critical Challenges for the Global Economyfor the Global Economy
ICRIERICRIERNew Delhi, IndiaNew Delhi, IndiaApril 20, 2007April 20, 2007
2
0
100
200
300
400
500
GDP percapita
GDP PPP(2000 US $)
ForeignDirect
Investment
Exports ofGoods andServices
TradeOpenness
1996 2006
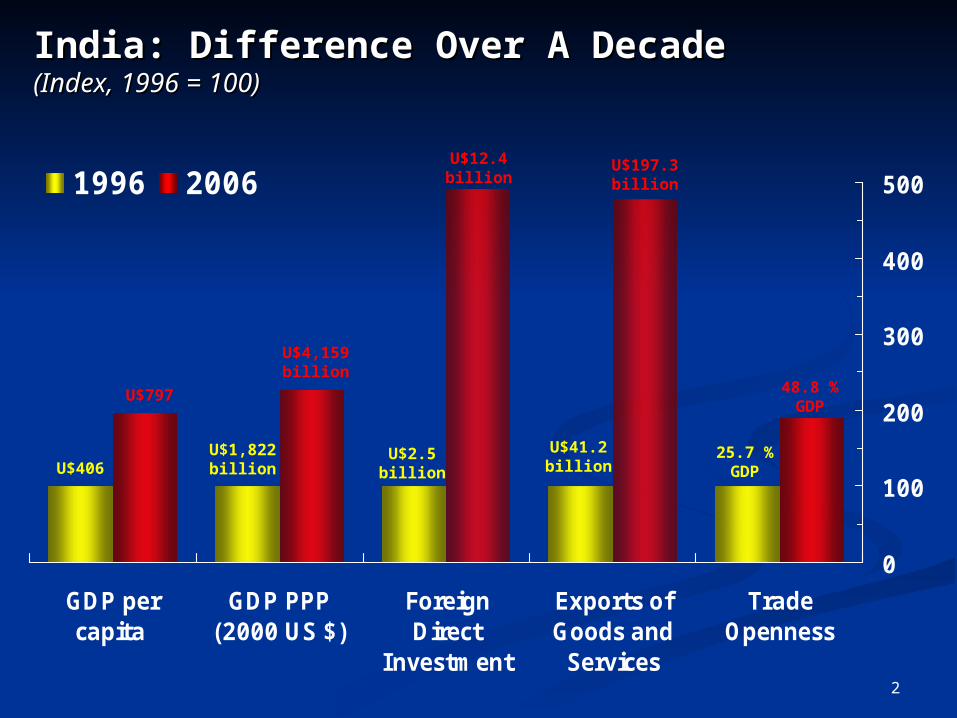
India: Difference Over A DecadeIndia: Difference Over A Decade(Index, 1996 = 100)(Index, 1996 = 100)
U$406
U$797
U$4,159 billion
U$1,822 billion
U$2.5 billion
U$12.4 billion
U$41.2 billion
U$197.3 billion
25.7 % GDP
48.8 % GDP
3
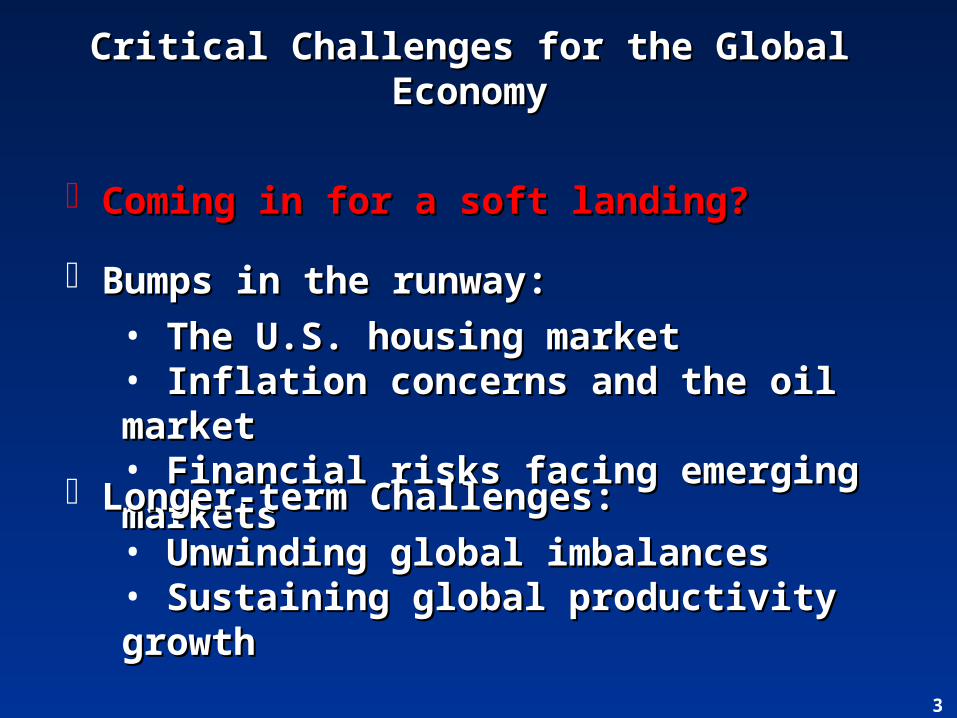
Critical Challenges for the Global Critical Challenges for the Global EconomyEconomy
Coming in for a soft landing?Coming in for a soft landing?
Bumps in the runway:Bumps in the runway:• The U.S. housing marketThe U.S. housing market• Inflation concerns and the oil Inflation concerns and the oil marketmarket• Financial risks facing emerging Financial risks facing emerging marketsmarkets
Longer-term Challenges:Longer-term Challenges:• Unwinding global imbalancesUnwinding global imbalances• Sustaining global productivity Sustaining global productivity growthgrowth
4
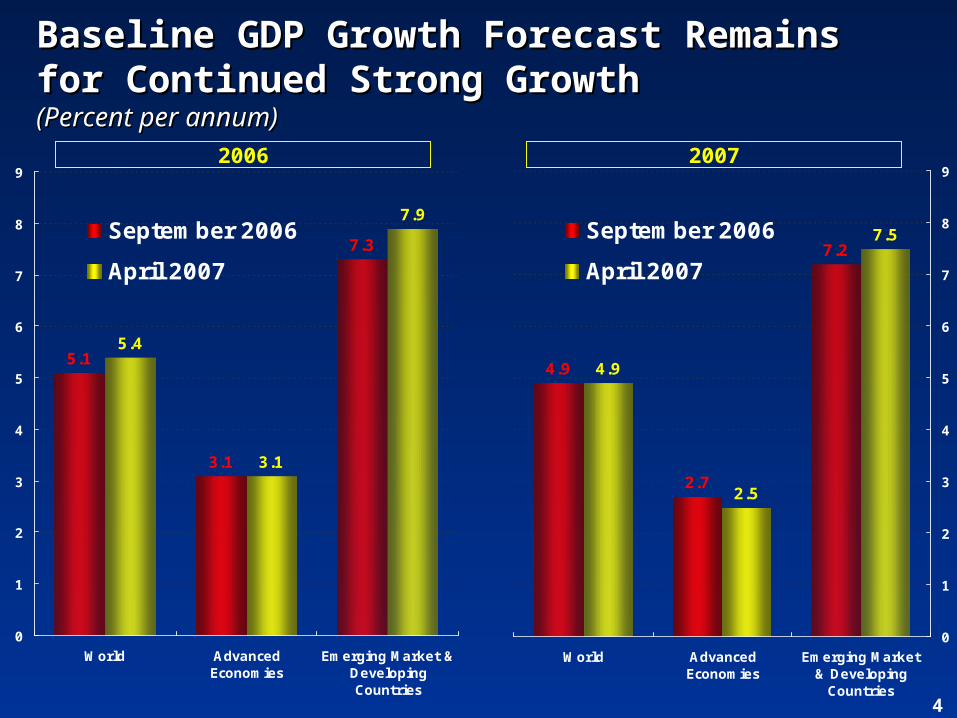
5.1
3.1
7.3
3.1
7.9
5.4
0
1
2
3
4
5
6
7
8
9
World AdvancedEconomies
Emerging Market &DevelopingCountries
September 2006
April 2007
4.9
2.7
7.2
4.9
2.5
7.5
0
1
2
3
4
5
6
7
8
9
World AdvancedEconomies
Emerging Market& Developing
Countries
September 2006
April 2007
2006 2007
Baseline GDP Growth Forecast Remains Baseline GDP Growth Forecast Remains for Continued Strong Growthfor Continued Strong Growth(Percent per annum)(Percent per annum)
5
-15
-10
-5
0
5
10
15
2003Q1 2004Q1 2005Q1 2006Q1-2
0
2
4
6
8
10
12
2003Q1 2004Q1 2005Q1 2006Q1
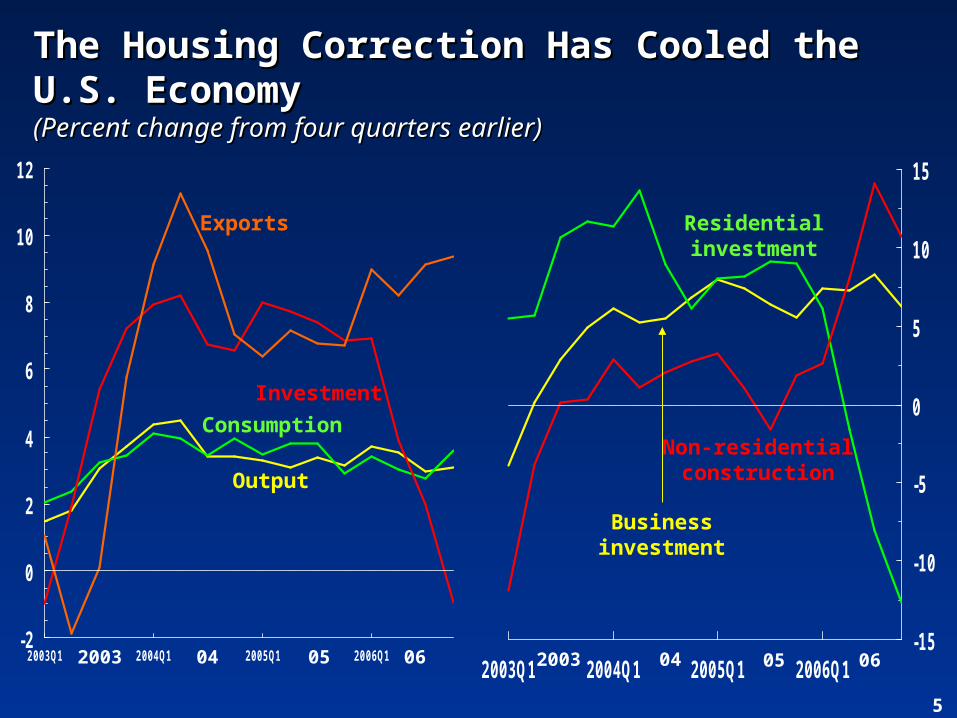
The Housing Correction Has Cooled the The Housing Correction Has Cooled the U.S. EconomyU.S. Economy(Percent change from four quarters earlier)(Percent change from four quarters earlier)
Output
Investment
Consumption
Business investment
Residential investment
Non-residential construction
2003 04 05 06 2003 04 05 06
Exports
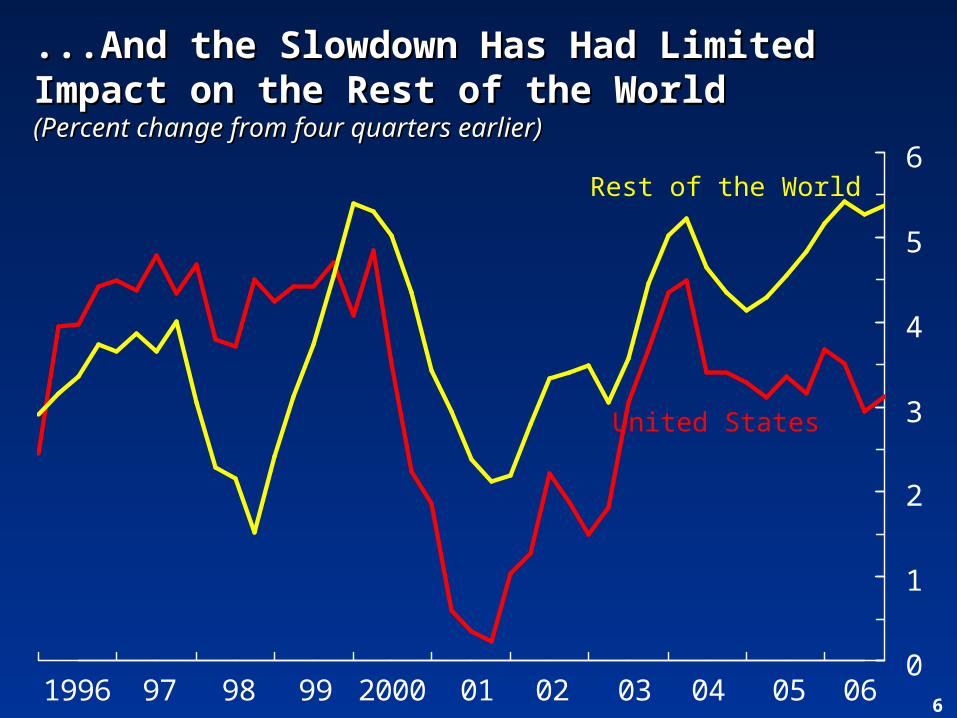
606050403020120009998971996
0
1
2
3
4
5
6
United States
Rest of the World
...And the Slowdown Has Had Limited ...And the Slowdown Has Had Limited Impact on the Rest of the WorldImpact on the Rest of the World(Percent change from four quarters earlier)(Percent change from four quarters earlier)
7
-4
-3
-2
-1
0
1
2
3
4
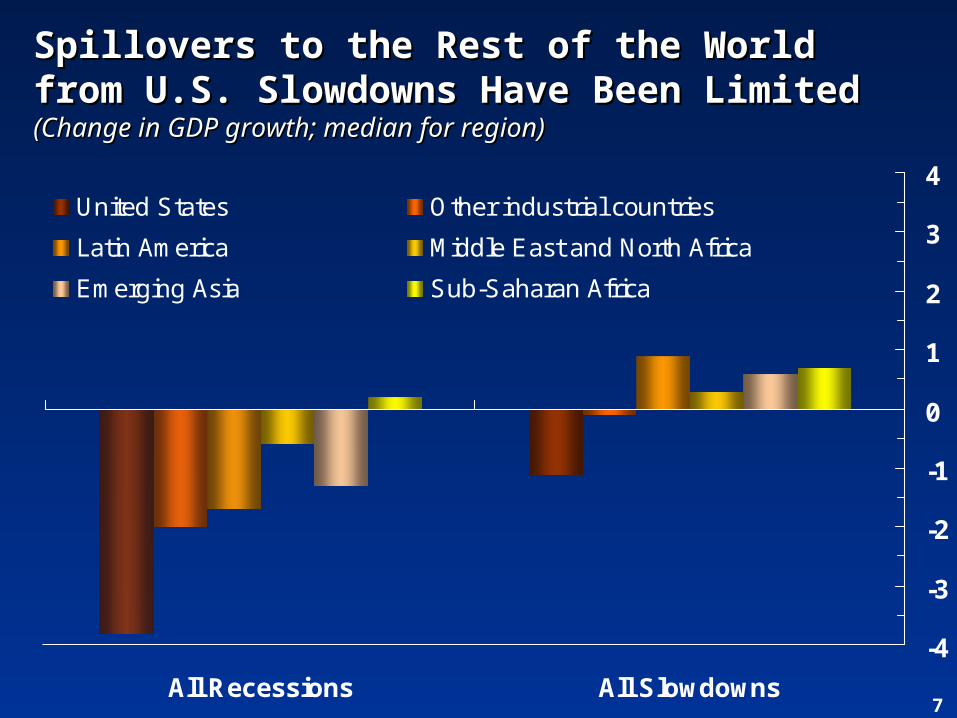
All Recessions All Slowdowns
United States Other industrial countries
Latin America Middle East and North Africa
Emerging Asia Sub-Saharan Africa
Spillovers to the Rest of the World from Spillovers to the Rest of the World from U.S. Slowdowns Have Been LimitedU.S. Slowdowns Have Been Limited(Change in GDP growth; median for region)(Change in GDP growth; median for region)
8
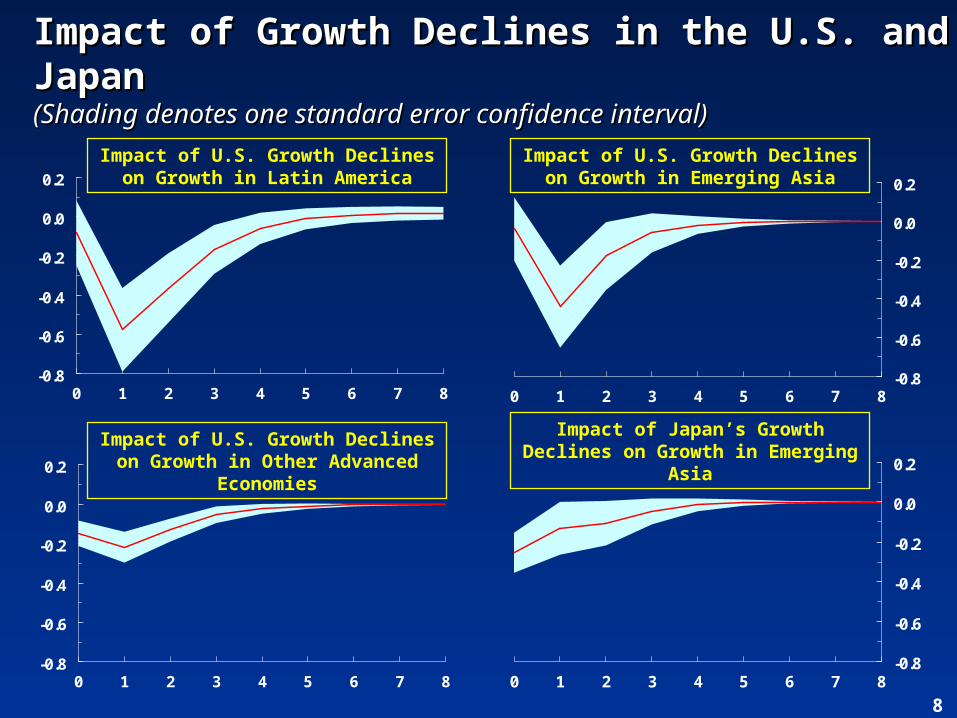
Impact of Growth Declines in the U.S. and Impact of Growth Declines in the U.S. and Japan Japan (Shading denotes one standard error confidence interval)(Shading denotes one standard error confidence interval)
-0.8
-0.6
-0.4
-0.2
0.0
0.2
0 1 2 3 4 5 6 7 8
Impact of U.S. Growth Declines on Growth in Latin America
-0.8
-0.6
-0.4
-0.2
0.0
0.2
0 1 2 3 4 5 6 7 8
Impact of U.S. Growth Declines on Growth in Emerging Asia
-0.8
-0.6
-0.4
-0.2
0.0
0.2
0 1 2 3 4 5 6 7 8-0.8
-0.6
-0.4
-0.2
0.0
0.2
0 1 2 3 4 5 6 7 8
Impact of U.S. Growth Declines on Growth in Other Advanced
Economies
Impact of Japan’s Growth Declines on Growth in Emerging
Asia
9
-1
0
1
2
3
4
5
6
7
8
9
10
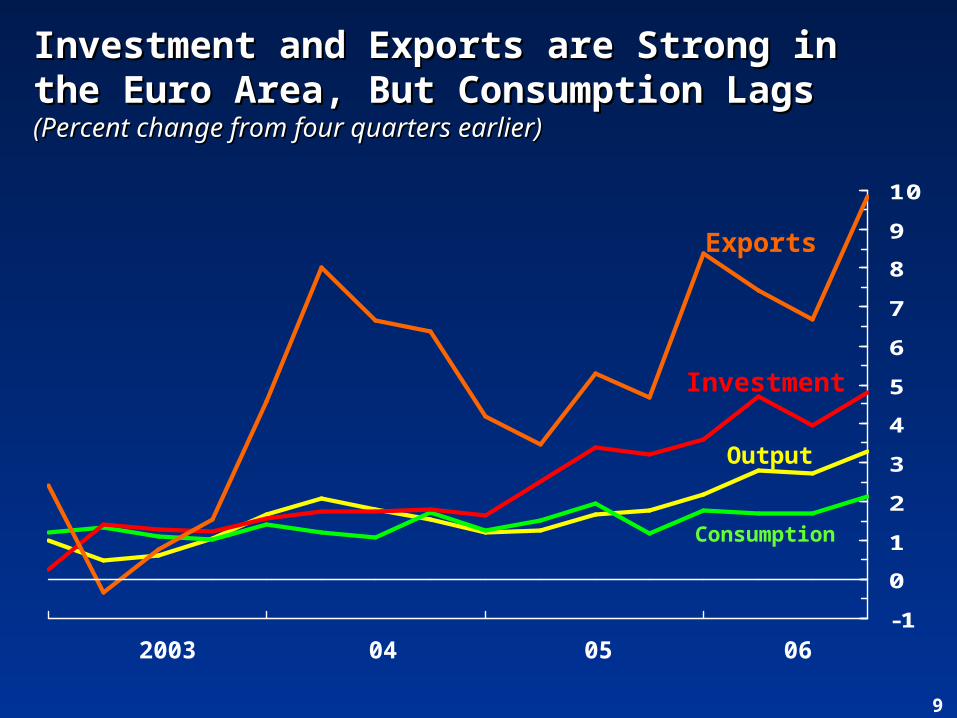
Investment and Exports are Strong in the Investment and Exports are Strong in the Euro Area, But Consumption LagsEuro Area, But Consumption Lags(Percent change from four quarters earlier)(Percent change from four quarters earlier)
Output
Investment
Consumption
2003 04 05 06
Exports
10
-3
-2
-1
0
1
2
3
4
5
6
0
4
8
12
16
20
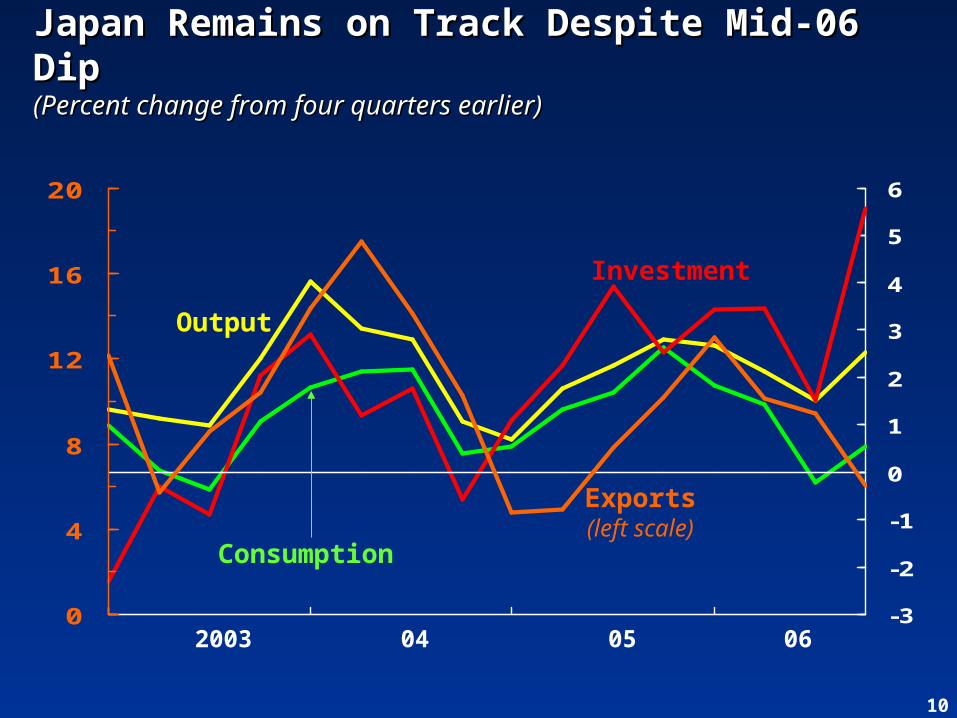
Japan Remains on Track Despite Mid-06 Japan Remains on Track Despite Mid-06 DipDip(Percent change from four quarters earlier)(Percent change from four quarters earlier)
Output
Consumption
Investment
2003 04 05 06
Exports(left scale)
11
-2
0
2
4
6
8
10
1976 82 88 94 2000 06
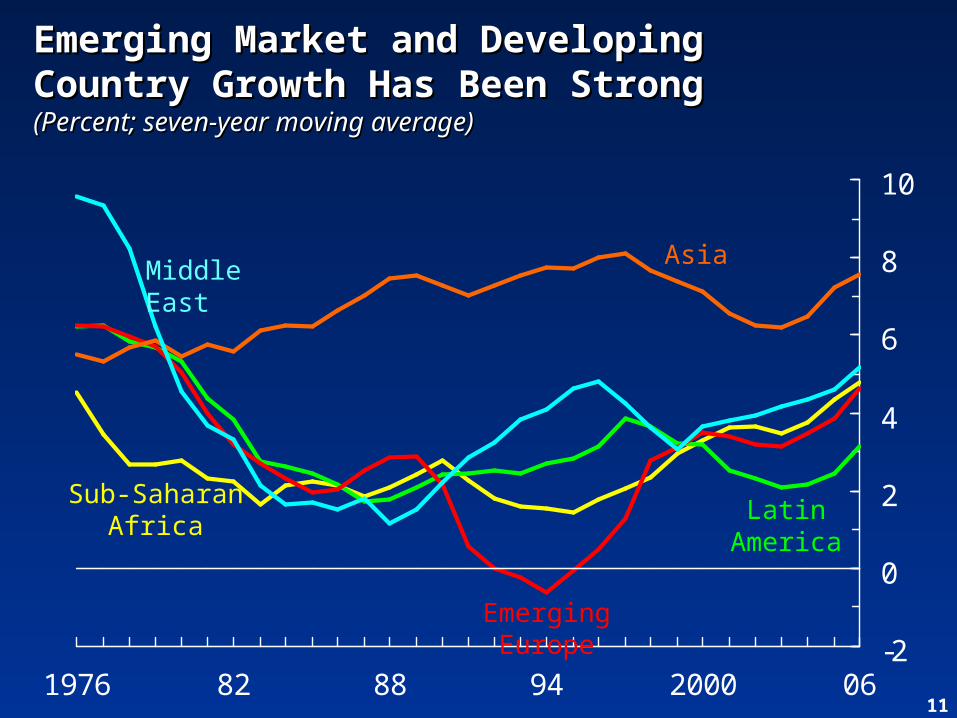
Sub-Saharan Africa
Latin America
Emerging Europe
Middle EastAsia
Emerging Market and Developing Emerging Market and Developing Country Growth Has Been StrongCountry Growth Has Been Strong(Percent; seven-year moving average)(Percent; seven-year moving average)
122003 07060504
10
20
30
40
50
60
6
7
8
9
10
11
12
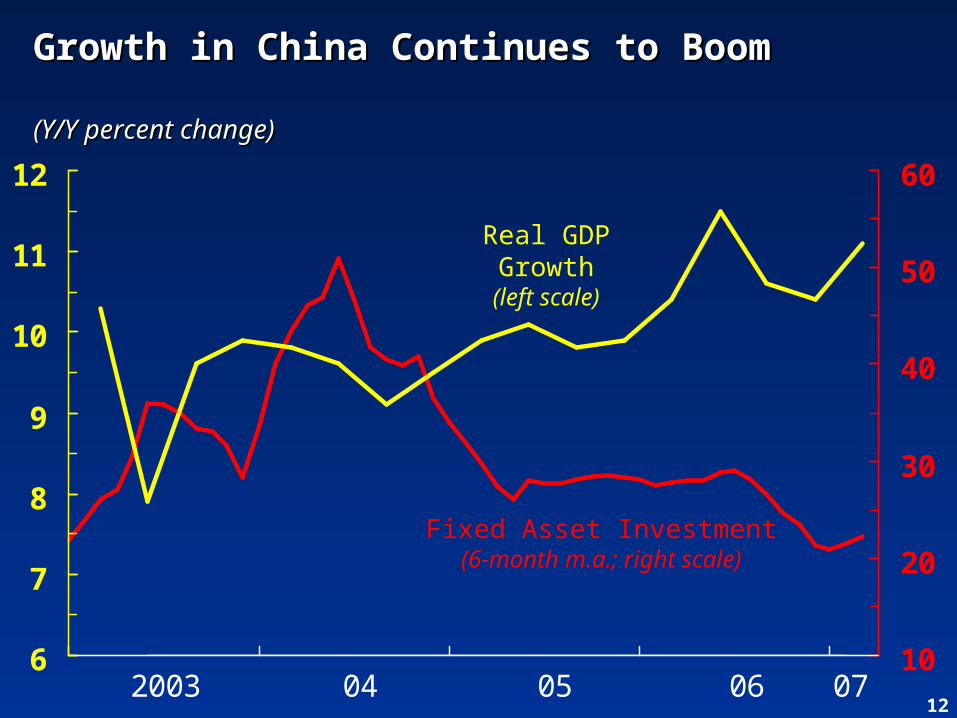
Fixed Asset Investment(6-month m.a.; right scale)
Real GDP Growth(left scale)
Growth in China Continues to BoomGrowth in China Continues to Boom
(Y/Y percent change)(Y/Y percent change)
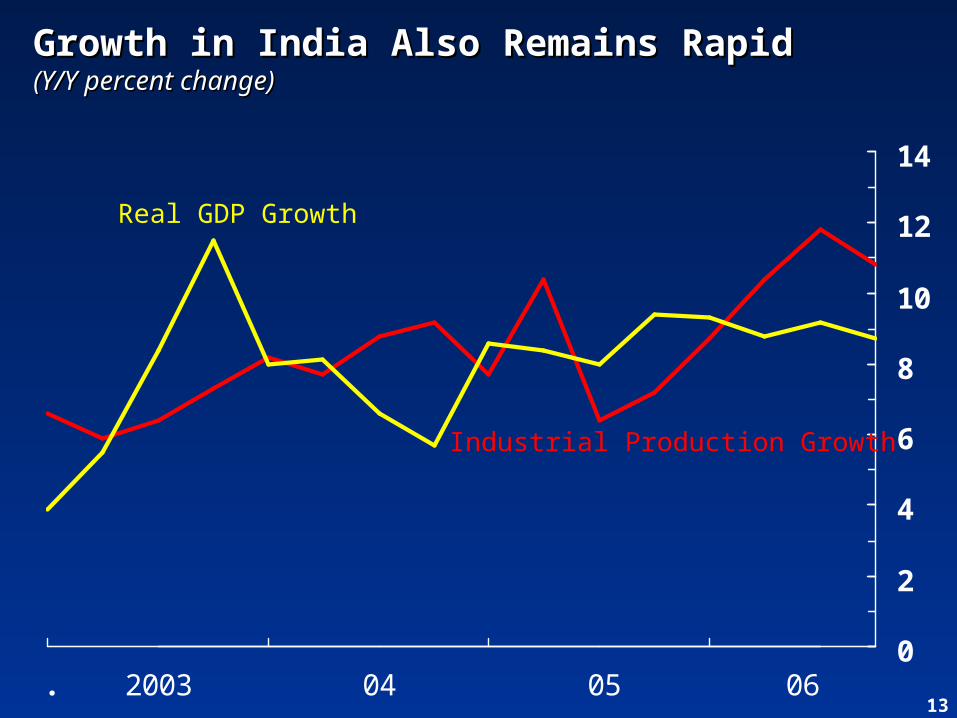
132003 04 05 06
0
2
4
6
8
10
12
14
.
Industrial Production Growth
Real GDP Growth
Growth in India Also Remains RapidGrowth in India Also Remains Rapid(Y/Y percent change)(Y/Y percent change)
14
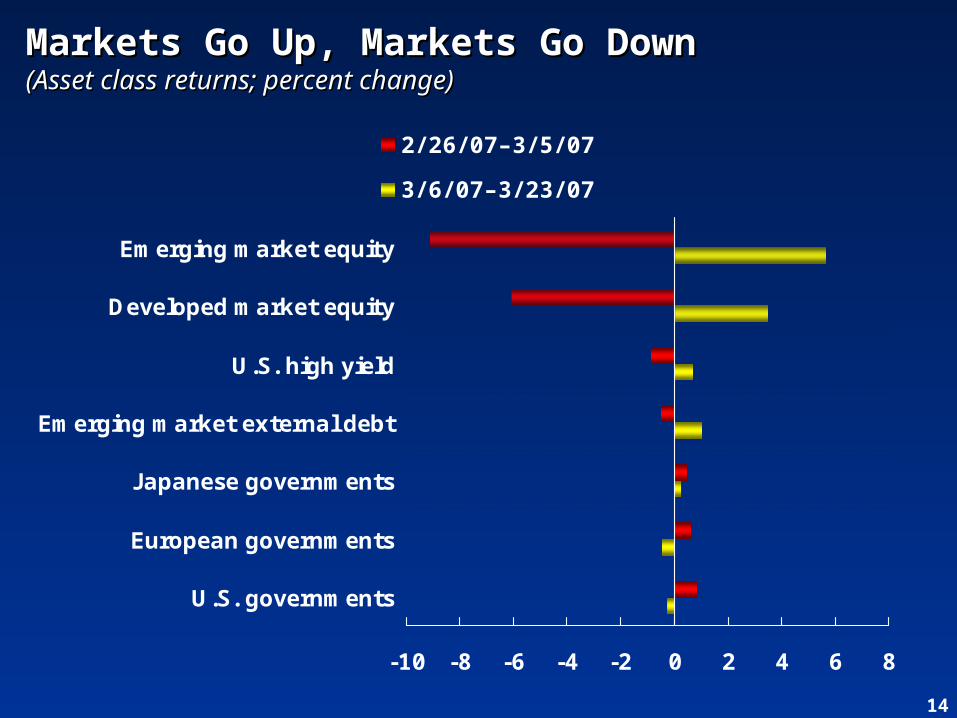
-10 -8 -6 -4 -2 0 2 4 6 8
U.S. governments
European governments
Japanese governments
Emerging market external debt
U.S. high yield
Developed market equity
Emerging market equity
2/ 26/ 07–3/ 5/ 07
3/ 6/ 07–3/ 23/ 07
Markets Go Up, Markets Go DownMarkets Go Up, Markets Go Down(Asset class returns; percent change)(Asset class returns; percent change)
15
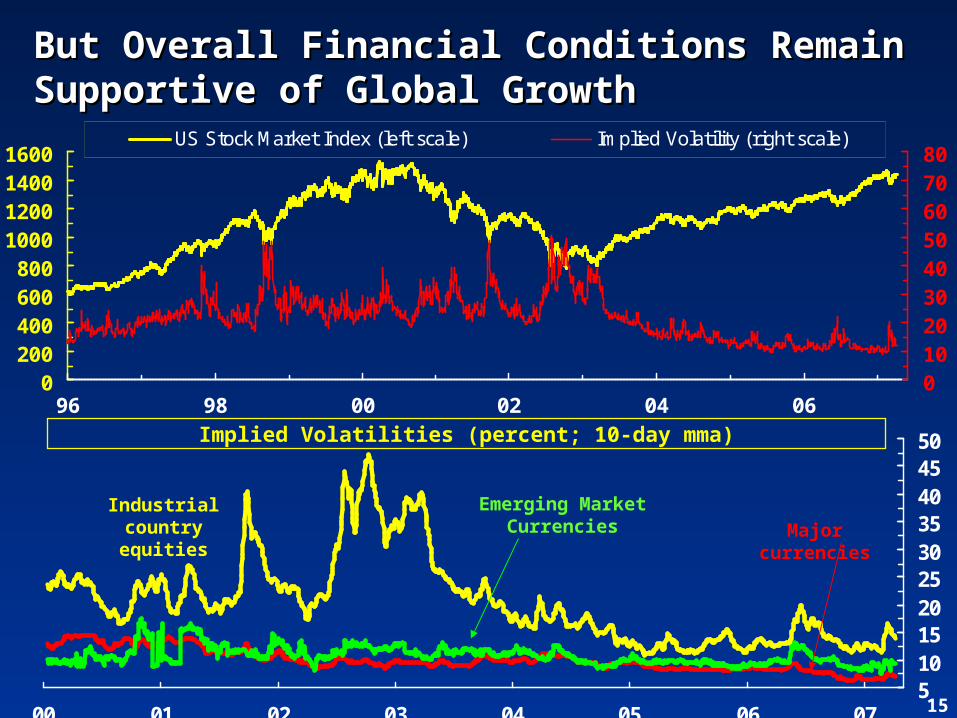
But Overall Financial Conditions Remain But Overall Financial Conditions Remain Supportive of Global GrowthSupportive of Global Growth
0200400600800
1000120014001600
96 98 00 02 04 0601020304050607080
US Stock Market Index (left scale) Implied Volatility (right scale)
5101520253035404550
00 01 02 03 04 05 06 07
Emerging Market
Currencies
Industrialcountryequities
Major currencies
Implied Volatilities (percent; 10-day mma)
16
0
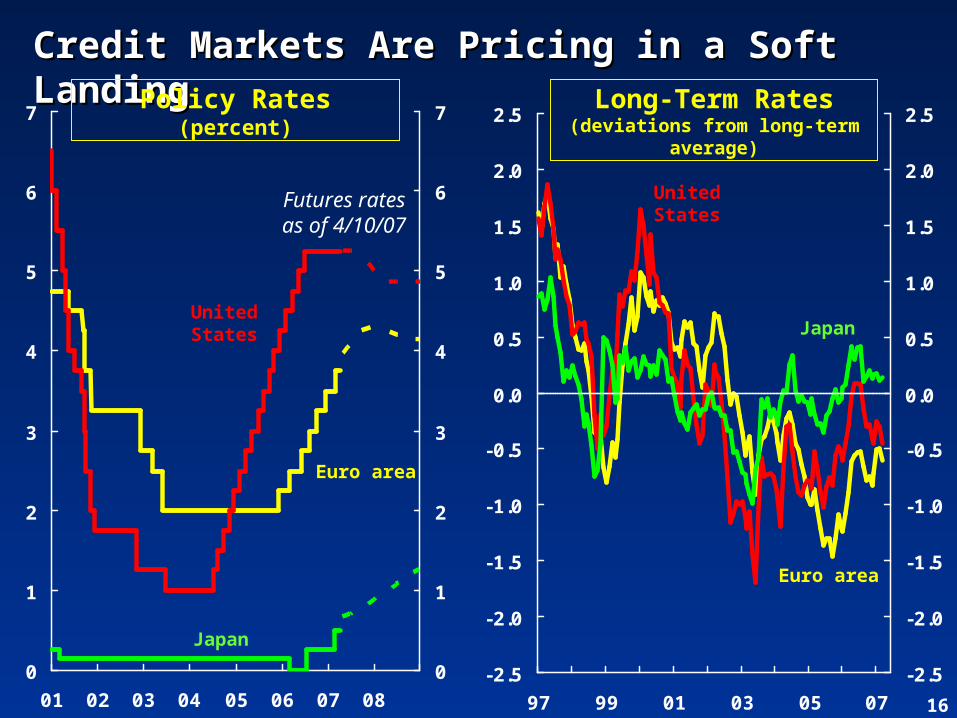
1
2
3
4
5
6
7
01 02 03 04 05 06 07 08
0
1
2
3
4
5
6
7
UnitedStates
Euro area
Japan
Credit Markets Are Pricing in a Soft Credit Markets Are Pricing in a Soft LandingLanding
-2.5
-2.0
-1.5
-1.0
-0.5
0.0
0.5
1.0
1.5
2.0
2.5
97 99 01 03 05 07
-2.5
-2.0
-1.5
-1.0
-0.5
0.0
0.5
1.0
1.5
2.0
2.5
UnitedStates
Euro area
Japan
Policy Rates(percent)
Futures ratesas of 4/10/07
Long-Term Rates(deviations from long-term
average)
17
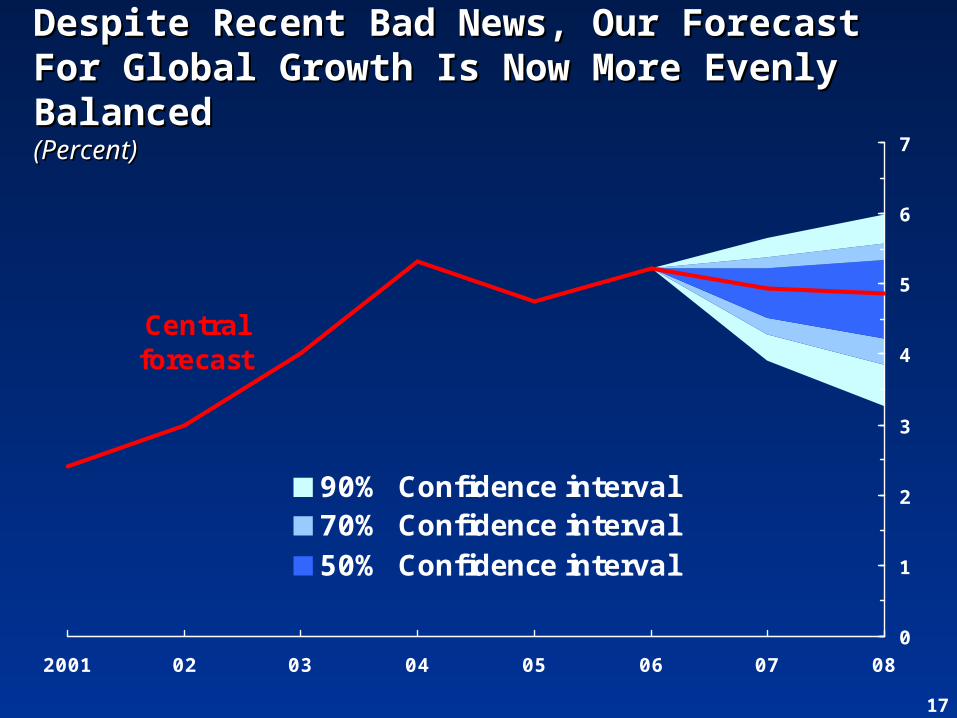
Central forecast
0
1
2
3
4
5
6
7
2001 02 03 04 05 06 07 08
90% Confidence interval70% Confidence interval50% Confidence interval
Despite Recent Bad News, Our Forecast Despite Recent Bad News, Our Forecast For Global Growth Is Now More Evenly For Global Growth Is Now More Evenly BalancedBalanced(Percent)(Percent)
18
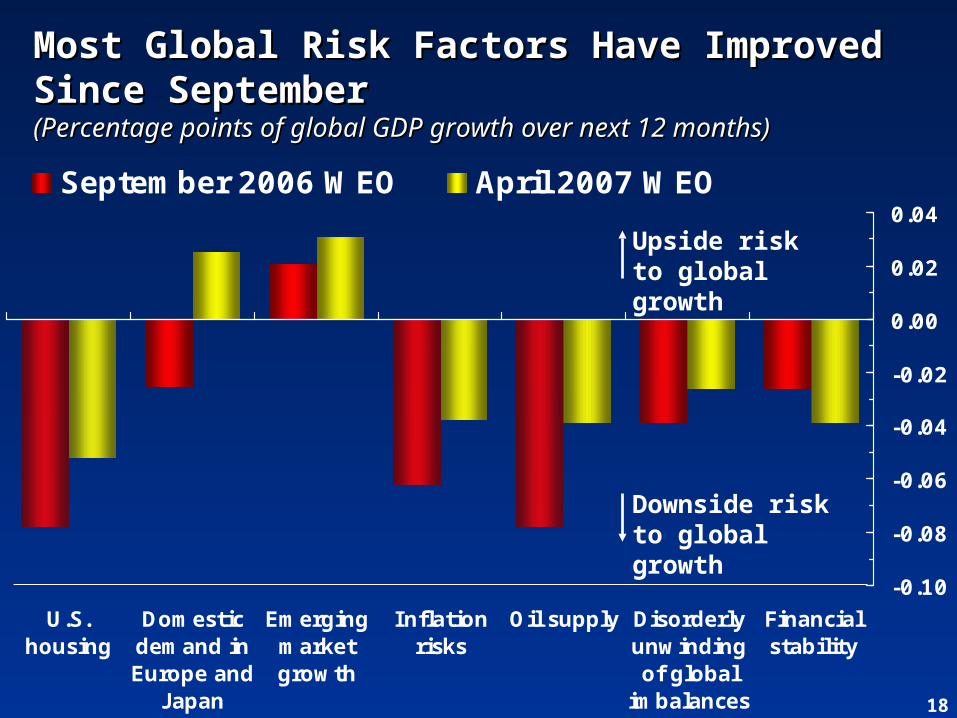
-0.10
-0.08
-0.06
-0.04
-0.02
0.00
0.02
0.04
U.S.housing
Domesticdemand inEurope and
Japan
Emergingmarketgrowth
Inflationrisks
Oil supply Disorderlyunwindingof global
imbalances
Financialstability
September 2006 WEO April 2007 WEO
Most Global Risk Factors Have Improved Most Global Risk Factors Have Improved Since SeptemberSince September(Percentage points of global GDP growth over next 12 months)(Percentage points of global GDP growth over next 12 months)
Downside risk to global growth
Upside risk to global growth
19
Critical Challenges for the Global Critical Challenges for the Global EconomyEconomy
Coming in for a soft landing?Coming in for a soft landing?
Bumps in the runway:Bumps in the runway:• The U.S. housing marketThe U.S. housing market• Inflation concerns and the oil Inflation concerns and the oil marketmarket• Financial risks facing emerging Financial risks facing emerging marketsmarkets
Longer-term Challenges:Longer-term Challenges:• Unwinding global imbalancesUnwinding global imbalances• Sustaining global productivity Sustaining global productivity growthgrowth
20
-8
-6
-4
-2
0
2
4
6
8
10
12
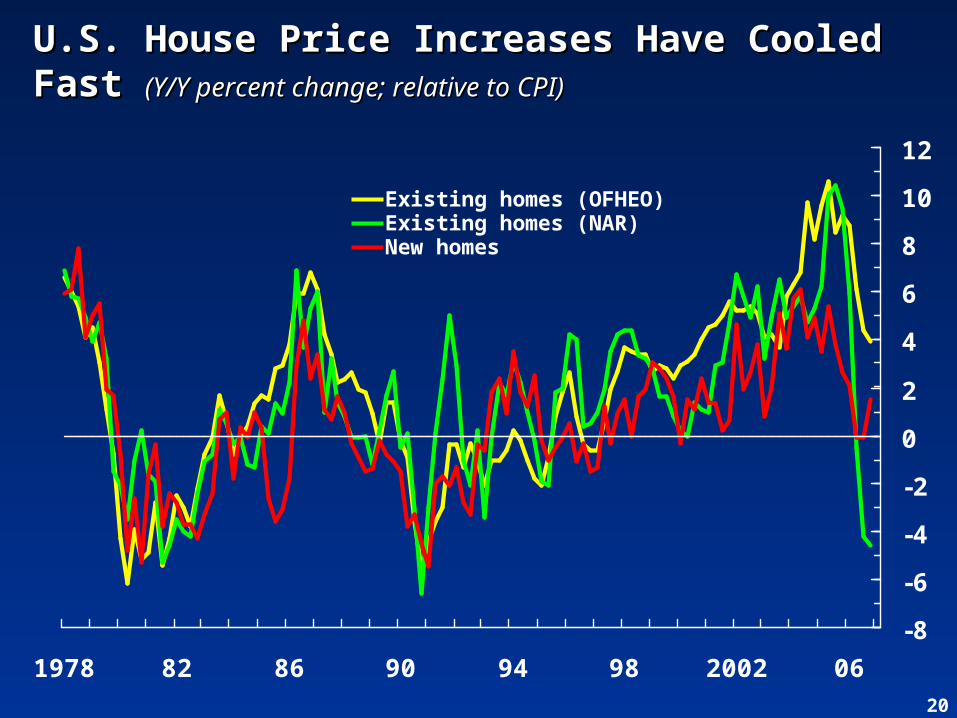
1978 82 86 90 94 98 2002 06
U.S. House Price Increases Have Cooled U.S. House Price Increases Have Cooled Fast Fast (Y/Y percent change; relative to CPI)(Y/Y percent change; relative to CPI)
Existing homes (OFHEO)Existing homes (NAR)New homes
21
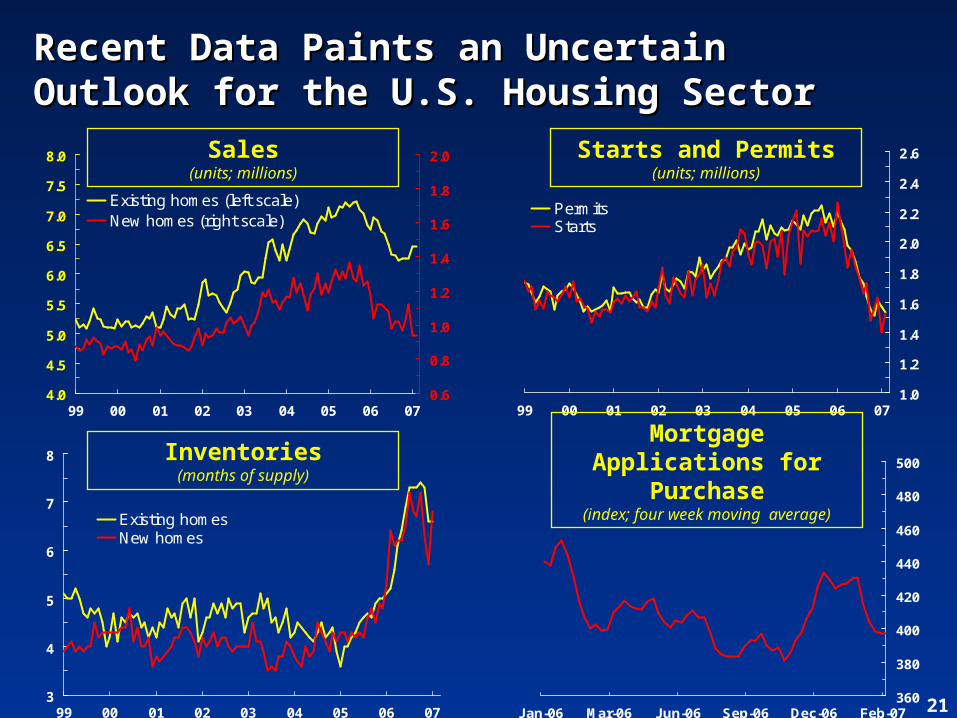
4.0
4.5
5.0
5.5
6.0
6.5
7.0
7.5
8.0
99 00 01 02 03 04 05 06 070.6
0.8
1.0
1.2
1.4
1.6
1.8
2.0
Existing homes (left scale)New homes (right scale)
1.0
1.2
1.4
1.6
1.8
2.0
2.2
2.4
2.6
99 00 01 02 03 04 05 06 07
PermitsStarts
3
4
5
6
7
8
99 00 01 02 03 04 05 06 07
Existing homesNew homes
Inventories(months of supply)
Mortgage Applications for Purchase
(index; four week moving average)
Starts and Permits(units; millions)
Sales(units; millions)
360
380
400
420
440
460
480
500
Jan-06 Mar-06 Jun-06 Sep-06 Dec-06 Feb-07
Recent Data Paints an Uncertain Recent Data Paints an Uncertain Outlook for the U.S. Housing SectorOutlook for the U.S. Housing Sector
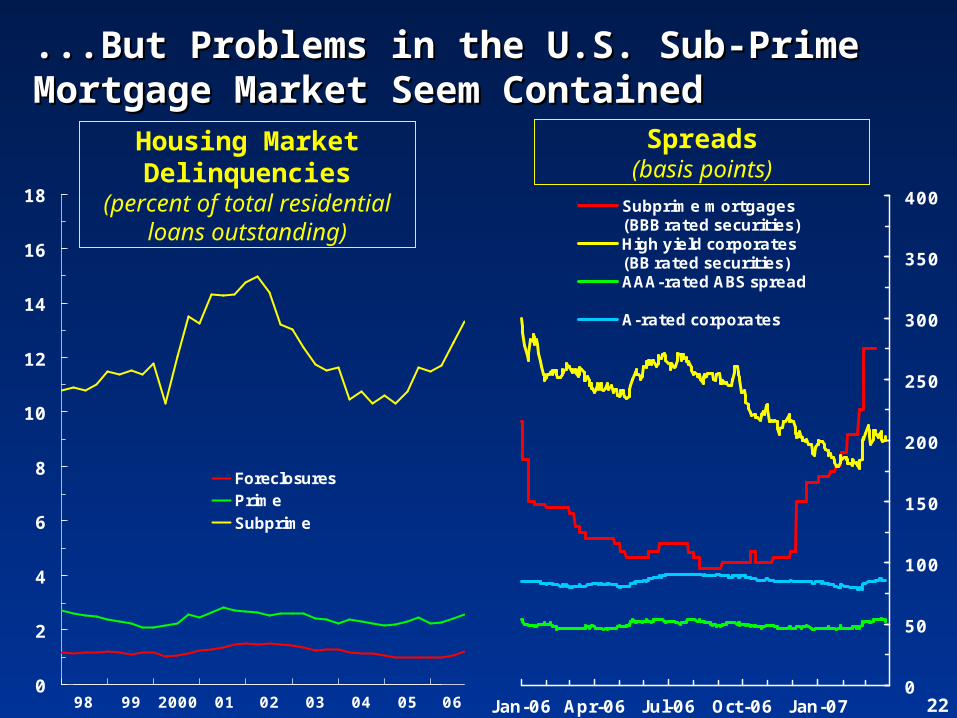
220
50
100
150
200
250
300
350
400
Jan-06 Apr-06 Jul-06 Oct-06 Jan-07
Subprime mortgages(BBB rated securities)High yield corporates(BB rated securities)AAA-rated ABS spread
A-rated corporates
...But Problems in the U.S. Sub-Prime ...But Problems in the U.S. Sub-Prime Mortgage Market Seem ContainedMortgage Market Seem Contained
Spreads(basis points)
Housing Market Delinquencies
(percent of total residential loans outstanding)
060504030201200099980
2
4
6
8
10
12
14
16
18
ForeclosuresPrimeSubprime
23
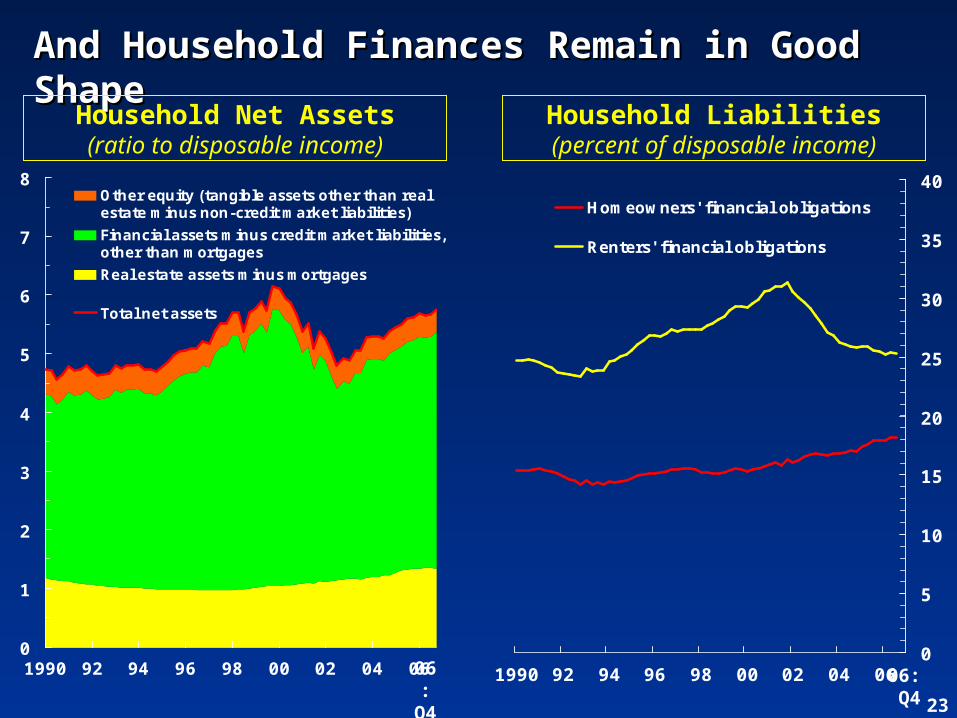
And Household Finances Remain in Good And Household Finances Remain in Good ShapeShape
0
5
10
15
20
25
30
35
40
1990 92 94 96 98 00 02 04 06
Homeowners' financial obligations
Renters' financial obligations
0
1
2
3
4
5
6
7
8
1990 92 94 96 98 00 02 04 06
Other equity (tangible assets other than realestate minus non-credit market liabilities)
Financial assets minus credit market liabilities,other than mortgages
Real estate assets minus mortgages
Total net assets
Household Net Assets(ratio to disposable income)
Household Liabilities(percent of disposable income)
06:Q4
06:
Q4
24
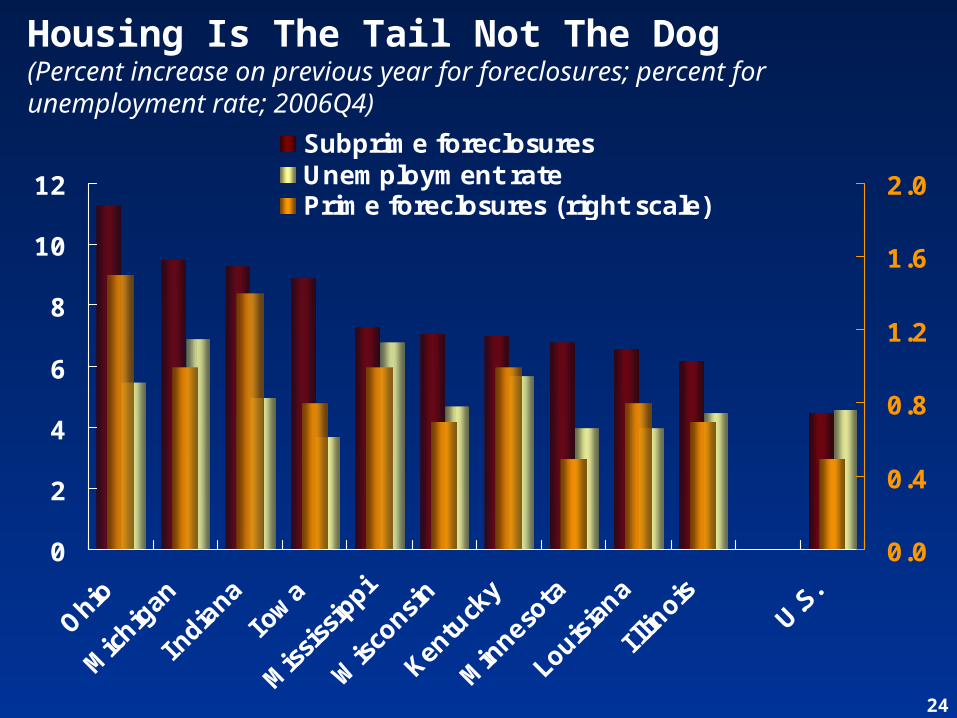
0
2
4
6
8
10
12
Ohio
Michiga
n
Indian
aIo
wa
Mississ
ippi
Wisc
onsin
Kent
ucky
Minne
sota
Louisian
a
I llinois
U.S.
0.0
0.4
0.8
1.2
1.6
2.0
Subprime foreclosuresUnemployment ratePrime foreclosures (right scale)
Housing Is The Tail Not The Dog(Percent increase on previous year for foreclosures; percent for unemployment rate; 2006Q4)
25
Critical Challenges for the Global Critical Challenges for the Global EconomyEconomy
Coming in for a soft landing?Coming in for a soft landing?
Bumps in the runway:Bumps in the runway:• The U.S. housing marketThe U.S. housing market• Inflation concerns and the oil Inflation concerns and the oil marketmarket• Financial risks facing emerging Financial risks facing emerging marketsmarkets
Longer-term Challenges:Longer-term Challenges:• Unwinding global imbalancesUnwinding global imbalances• Sustaining global productivity Sustaining global productivity growthgrowth
26
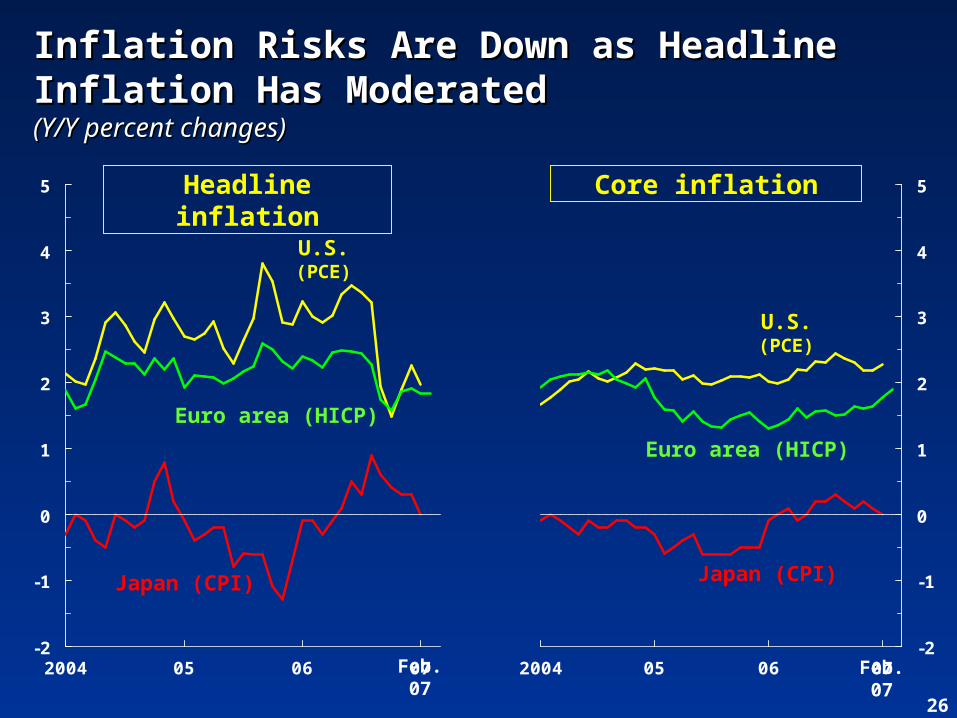
Inflation Risks Are Down as Headline Inflation Risks Are Down as Headline Inflation Has ModeratedInflation Has Moderated(Y/Y percent changes)(Y/Y percent changes)
-2
-1
0
1
2
3
4
5
2004 05 06 07-2
-1
0
1
2
3
4
5
2004 05 06 07
U.S.(PCE)
Euro area (HICP)
Euro area (HICP)
Japan (CPI) Japan (CPI)
U.S.(PCE)
Headline inflation Core inflation
Feb. 07
Feb. 07
27-4
-3
-2
-1
0
1
2
3
4
1980 85 90 95 2000 05
Emergingmarkets
Advancedeconomies
World
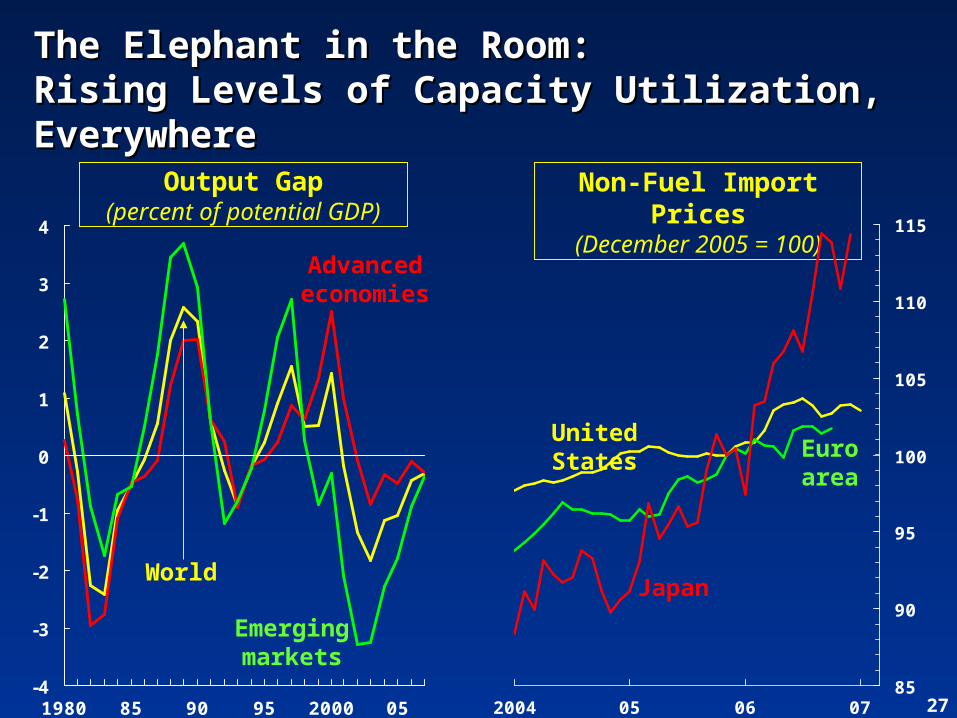
The Elephant in the Room:The Elephant in the Room:Rising Levels of Capacity Utilization, Rising Levels of Capacity Utilization, EverywhereEverywhere
Output Gap(percent of potential GDP)
Non-Fuel Import Prices
(December 2005 = 100)
85
90
95
100
105
110
115
2004 05 06 07
Euro area
Japan
United States
28
-1
0
1
2
3
4
5
6
7
96 98 00 02 04 06
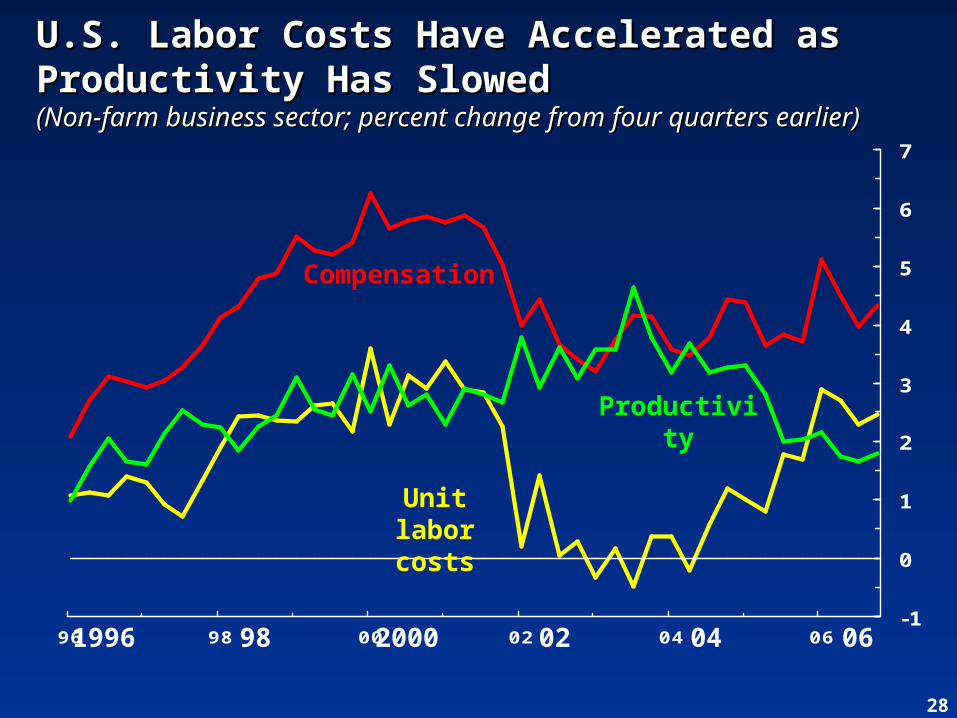
U.S. Labor Costs Have Accelerated as U.S. Labor Costs Have Accelerated as Productivity Has SlowedProductivity Has Slowed(Non-farm business sector; percent change from four quarters (Non-farm business sector; percent change from four quarters earlier)earlier)
Unit labor costs
Compensation
Productivity
1996 2000 04 060298
29
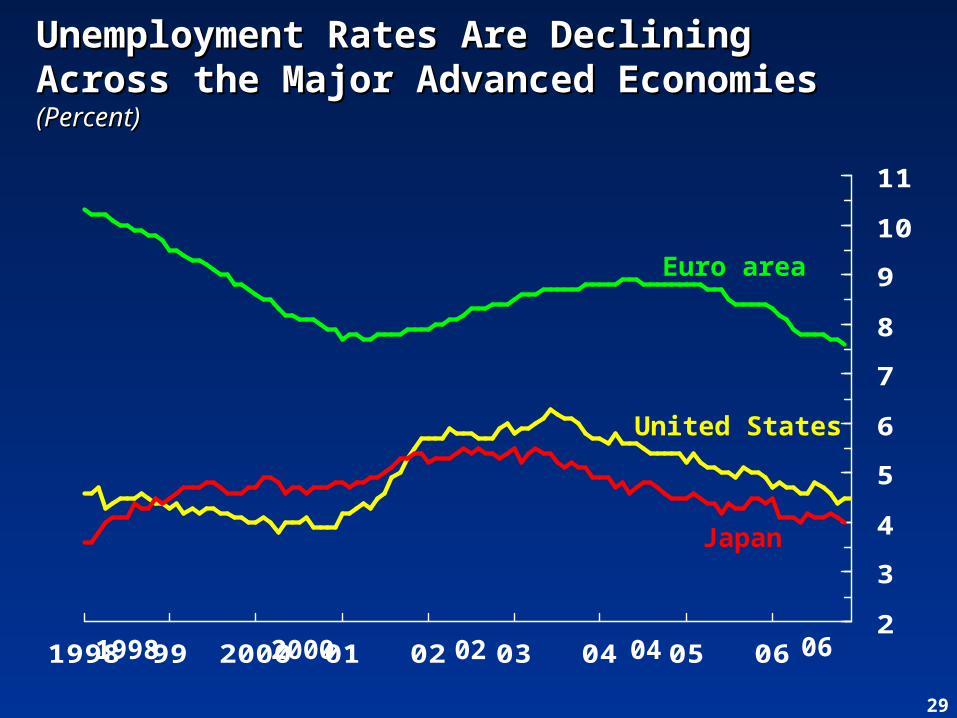
Unemployment Rates Are Declining Unemployment Rates Are Declining Across the Major Advanced EconomiesAcross the Major Advanced Economies(Percent)(Percent)
2
3
4
5
6
7
8
9
10
11
1998 99 2000 01 02 03 04 05 06
United States
Japan
Euro area
1998 02 062000 04
30
-20
-15
-10
-5
0
5
10
15
20
02:H1 02:H203:H103:H2 04:H104:H2 05:H105:H206:H1 06:H2
$ pe
r ba
rrel
cha
nge
from
pre
viou
s ye
ar
-1.0
0.0
1.0
2.0
3.0
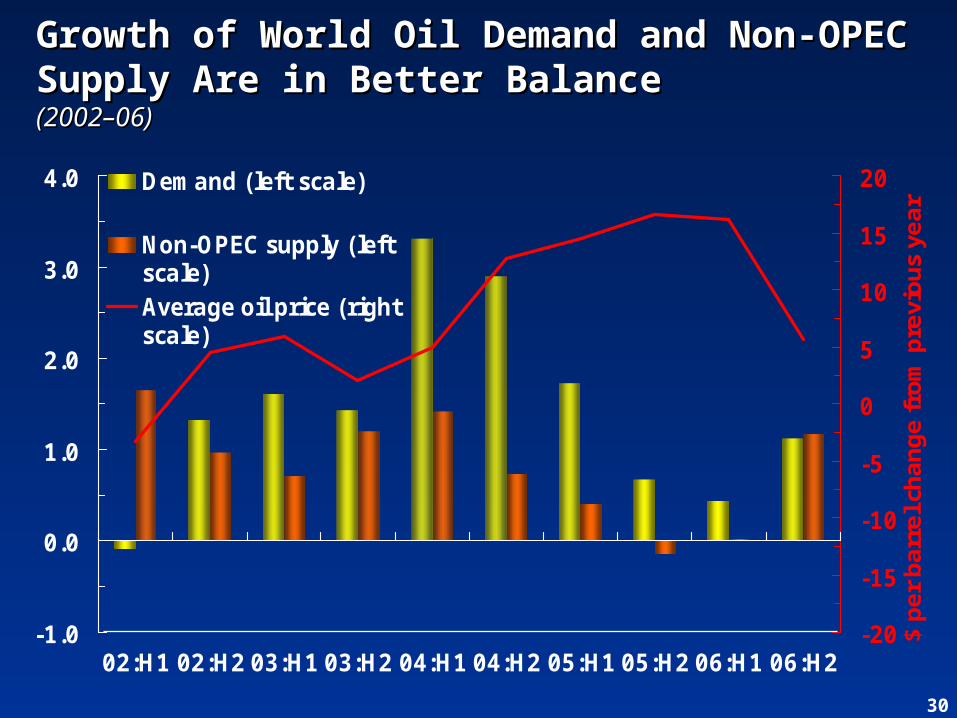
4.0 Demand (left scale)
Non-OPEC supply (leftscale)Average oil price (rightscale)
Growth of World Oil Demand and Non-Growth of World Oil Demand and Non-OPEC Supply Are in Better BalanceOPEC Supply Are in Better Balance(2002–06)(2002–06)
31
0
2
4
6
8
10
12
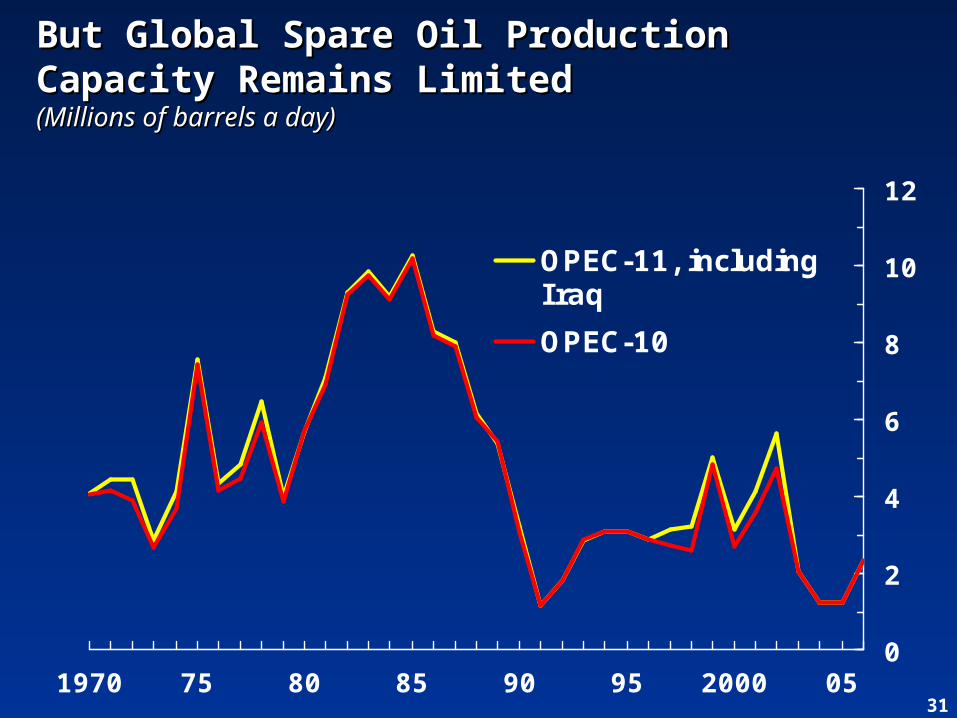
1970 75 80 85 90 95 2000 05
OPEC-11, includingIraq
OPEC-10
But Global Spare Oil Production Capacity But Global Spare Oil Production Capacity Remains LimitedRemains Limited(Millions of barrels a day)(Millions of barrels a day)
32
30
40
50
60
70
80
90
100
110
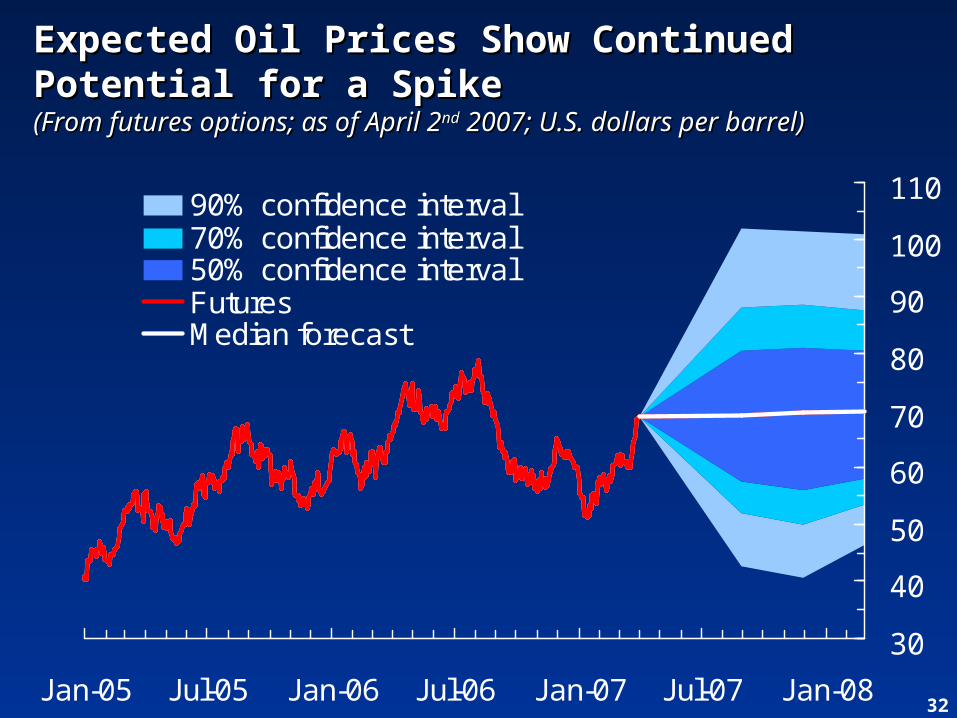
Jan-05 Jul-05 Jan-06 Jul-06 Jan-07 Jul-07 Jan-08
90% confidence interval70% confidence interval50% confidence intervalFuturesMedian forecast
Expected Oil Prices Show Continued Expected Oil Prices Show Continued Potential for a SpikePotential for a Spike(From futures options; as of April 2(From futures options; as of April 2ndnd 2007; U.S. dollars per 2007; U.S. dollars per barrel)barrel)
33
Critical Challenges for the Global Critical Challenges for the Global EconomyEconomy
Coming in for a soft landing?Coming in for a soft landing?
Bumps in the runway:Bumps in the runway:• The U.S. housing marketThe U.S. housing market• Inflation concerns and the oil Inflation concerns and the oil marketmarket• Financial risks facing emerging Financial risks facing emerging marketsmarkets
Longer-term Challenges:Longer-term Challenges:• Unwinding global imbalancesUnwinding global imbalances• Sustaining global productivity Sustaining global productivity growthgrowth
34
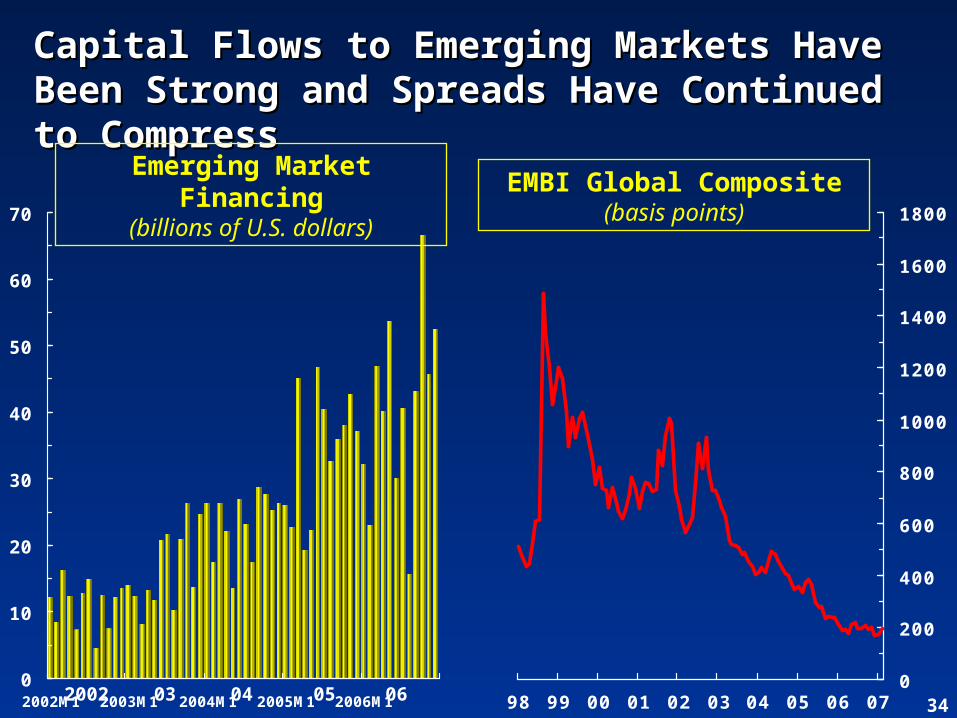
Capital Flows to Emerging Markets Have Capital Flows to Emerging Markets Have Been Strong and Spreads Have Continued Been Strong and Spreads Have Continued to Compressto Compress
0
10
20
30
40
50
60
70
2002M1 2003M1 2004M1 2005M1 2006M12002 0603 04 050
200
400
600
800
1000
1200
1400
1600
1800
98 99 00 01 02 03 04 05 06 07
EMBI Global Composite(basis points)
Emerging Market Financing
(billions of U.S. dollars)
35
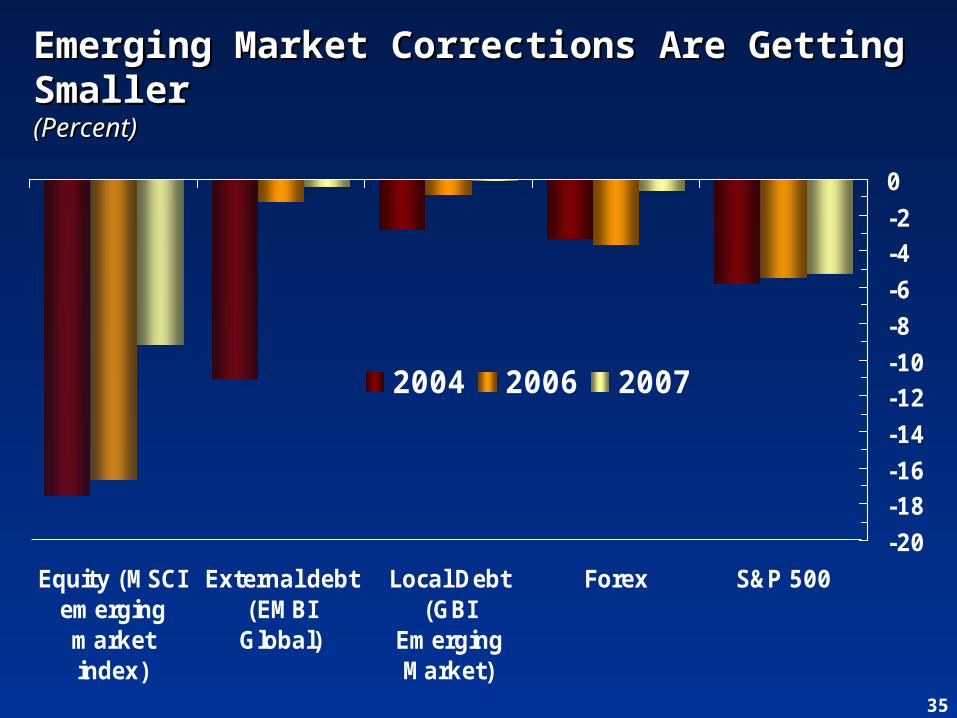
Emerging Market Corrections Are Getting Emerging Market Corrections Are Getting SmallerSmaller(Percent)(Percent)
-20
-18-16
-14
-12-10
-8
-6
-4-2
0
Equity (MSCIemergingmarketindex)
External debt(EMBIGlobal)
Local Debt(GBI
EmergingMarket)
Forex S&P 500
2004 2006 2007
36
-25
0
25
50
75
100
125
150
175
1980 85 90 95 2000 05
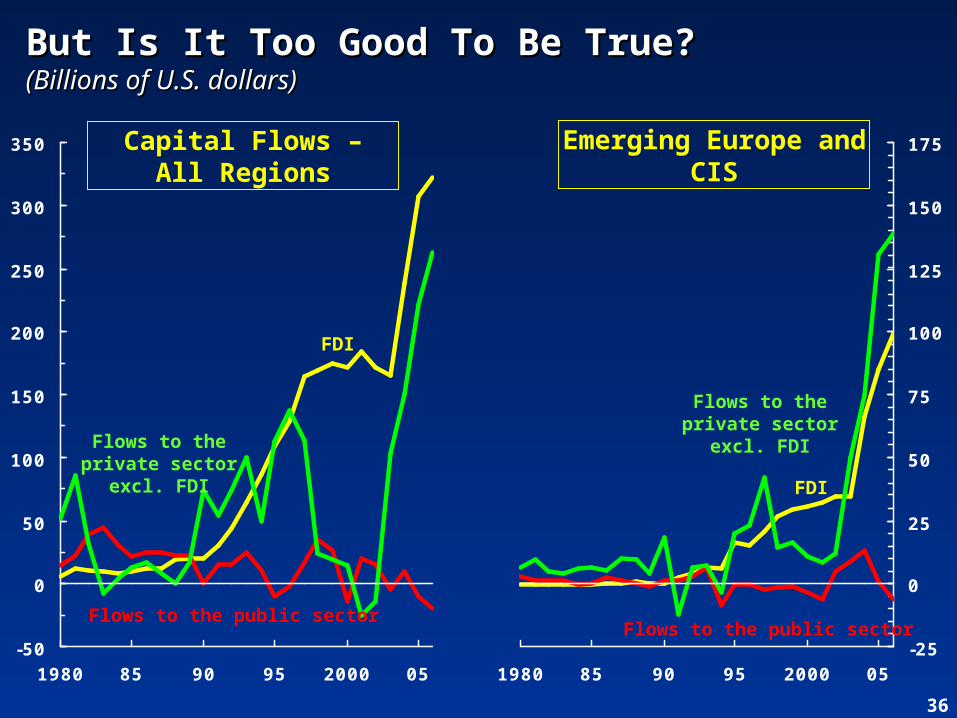
FDI
Flows to the public sector
Flows to the private sector excl. FDI
But Is It Too Good To Be True?But Is It Too Good To Be True?(Billions of U.S. dollars)(Billions of U.S. dollars)
-50
0
50
100
150
200
250
300
350
1980 85 90 95 2000 05
FDI
Flows to the public sector
Flows to the private sector
excl. FDI
Capital Flows –All Regions
Emerging Europe and CIS
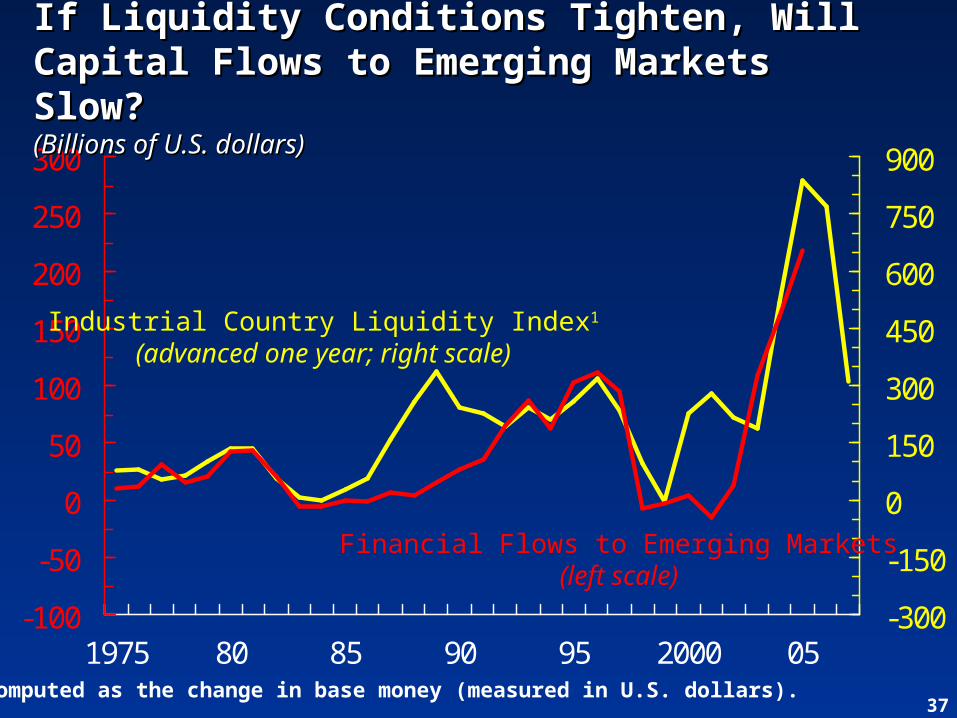
37
-300
-150
0
150
300
450
600
750
900
1975 80 85 90 95 2000 05-100
-50
0
50
100
150
200
250
300
Financial Flows to Emerging Markets(left scale)
Industrial Country Liquidity Index1
(advanced one year; right scale)
If Liquidity Conditions Tighten, Will If Liquidity Conditions Tighten, Will Capital Flows to Emerging Markets Capital Flows to Emerging Markets Slow?Slow?(Billions of U.S. dollars)(Billions of U.S. dollars)
1Computed as the change in base money (measured in U.S. dollars).
38
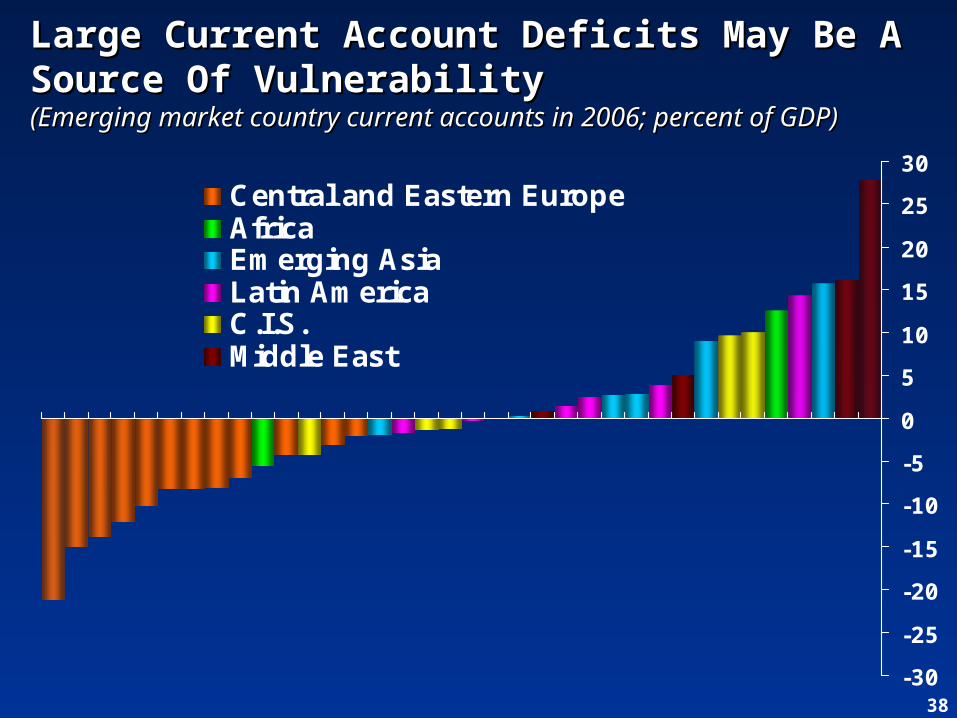
-30
-25
-20
-15
-10
-5
0
5
10
15
20
25
30
Central and Eastern EuropeAfricaEmerging AsiaLatin AmericaC.I.S.Middle East
Large Current Account Deficits May Be A Large Current Account Deficits May Be A Source Of VulnerabilitySource Of Vulnerability(Emerging market country current accounts in 2006; percent of (Emerging market country current accounts in 2006; percent of GDP)GDP)
39
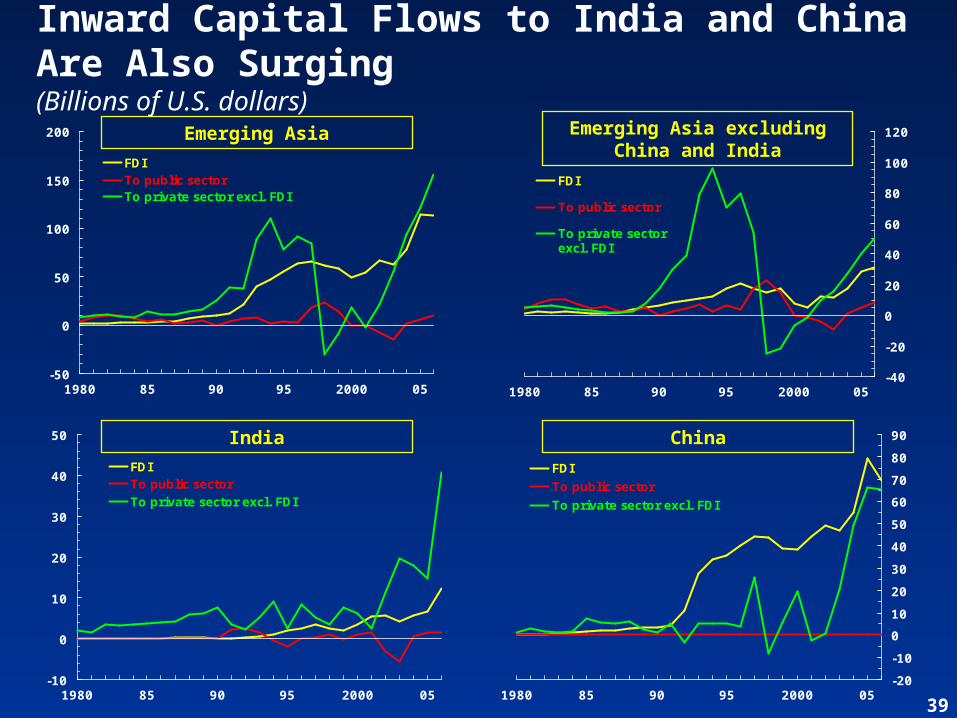
Inward Capital Flows to India and China Are Also Surging(Billions of U.S. dollars)
-50
0
50
100
150
200
1980 85 90 95 2000 05
FDITo public sectorTo private sector excl. FDI
-10
0
10
20
30
40
50
1980 85 90 95 2000 05
FDITo public sectorTo private sector excl. FDI
India
-40
-20
0
20
40
60
80
100
120
1980 85 90 95 2000 05
FDI
To public sector
To private sectorexcl. FDI
Emerging Asia excludingChina and India
-20
-10
0
10
20
30
40
50
60
70
80
90
1980 85 90 95 2000 05
FDI
To public sector
To private sector excl. FDI
China
Emerging Asia
40
Critical Challenges for the Global Critical Challenges for the Global EconomyEconomy
Coming in for a soft landing?Coming in for a soft landing?
Bumps in the runway:Bumps in the runway:• The U.S. housing marketThe U.S. housing market• Inflation concerns and the oil Inflation concerns and the oil marketmarket• Financial risks facing emerging Financial risks facing emerging marketsmarkets
Longer-term Challenges:Longer-term Challenges:• Unwinding global imbalancesUnwinding global imbalances• Sustaining global productivity Sustaining global productivity growthgrowth
41-4
-2
0
2
4
6
8
10
12
14
2000 01 02 03 04 05 06-4
-3
-2
-1
0
1
2
3
4
5
2000 01 02 03 04 05 06
-40
-30
-20
-10
0
10
20
30
40
50
60
70
2000 01 02 03 04 05 06-8
-7
-6
-5
-4
-3
-2
-1
0
1
2
3
2000 01 02 03 04 05 06
China
Saudi Arabia
Euro Area
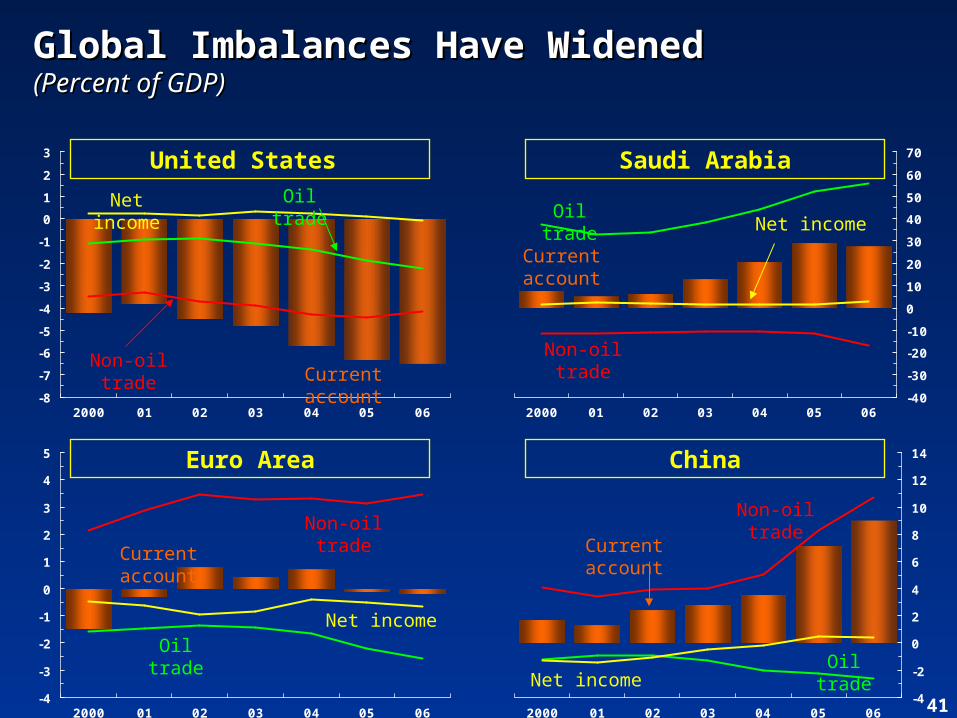
Global Imbalances Have WidenedGlobal Imbalances Have Widened(Percent of GDP)(Percent of GDP)
Oil tradeNet income
Non-oil trade
Oil tradeNet income
Non-oil trade
United States
Current account
Current account
Non-oil trade
Oil tradeNet income
Current account
Oil tradeNet income
Non-oil trade
Current account
42
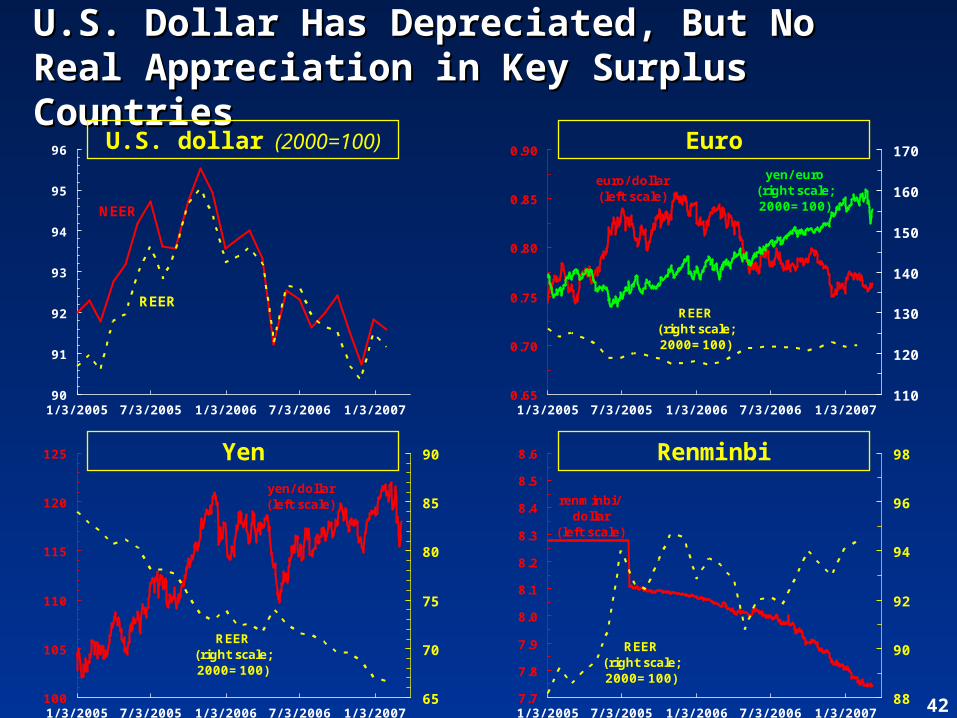
yen/ dollar (left scale)
REER(right scale; 2000=100)
100
105
110
115
120
125
1/ 3/ 2005 7/ 3/ 2005 1/ 3/ 2006 7/ 3/ 2006 1/ 3/ 200765
70
75
80
85
90
euro/ dollar (left scale)
REER(right scale; 2000=100)
yen/ euro (right scale; 2000=100)
0.65
0.70
0.75
0.80
0.85
0.90
1/ 3/ 2005 7/ 3/ 2005 1/ 3/ 2006 7/ 3/ 2006 1/ 3/ 2007110
120
130
140
150
160
170
renminbi/dollar
(left scale)
REER(right scale; 2000=100)
7.7
7.8
7.9
8.0
8.1
8.2
8.3
8.4
8.5
8.6
1/ 3/ 2005 7/ 3/ 2005 1/ 3/ 2006 7/ 3/ 2006 1/ 3/ 200788
90
92
94
96
98
NEER
REER
90
91
92
93
94
95
96
1/ 3/ 2005 7/ 3/ 2005 1/ 3/ 2006 7/ 3/ 2006 1/ 3/ 2007
U.S. Dollar Has Depreciated, But No Real U.S. Dollar Has Depreciated, But No Real Appreciation in Key Surplus CountriesAppreciation in Key Surplus Countries
Yen Renminbi
EuroU.S. dollar (2000=100)
43
-40
-30
-20
-10
0
10
20
30
40
50
60
70
2000 01 02 03 04 05 06 07 08 09 10 11 12
-4
-2
0
2
4
6
8
10
12
14
2000 01 02 03 04 05 06 07 08 09 10 11 12-4
-3
-2
-1
0
1
2
3
4
5
2000 01 02 03 04 05 06 07 08 09 10 11 12
-8
-7
-6
-5
-4
-3
-2
-1
0
1
2
3
2000 01 02 03 04 05 06 07 08 09 10 11 12
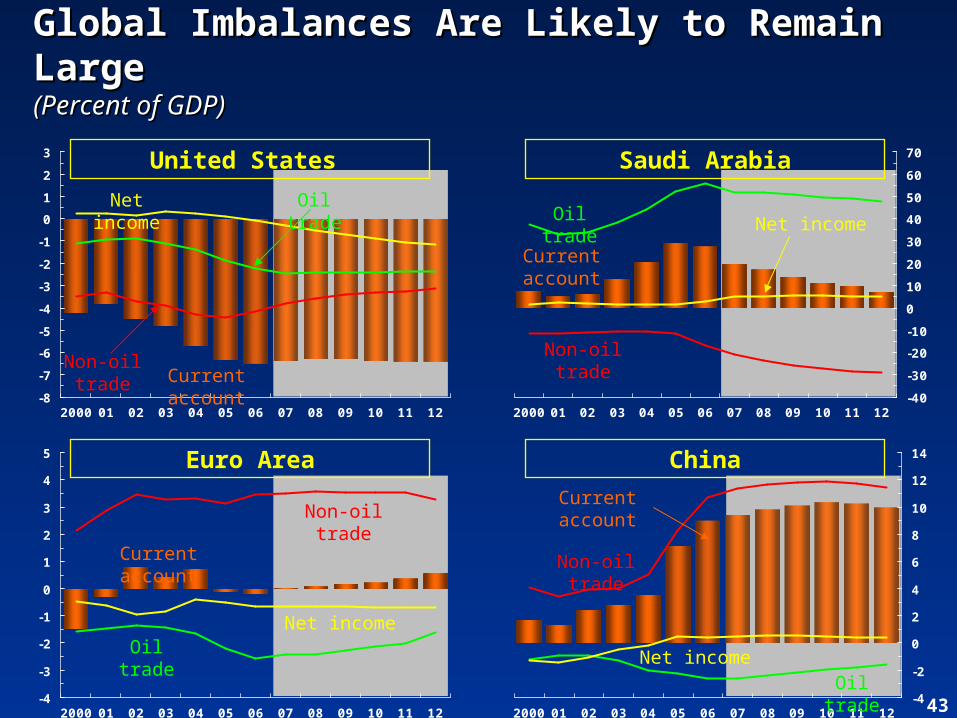
China
Saudi Arabia
Euro Area
Global Imbalances Are Likely to Remain Global Imbalances Are Likely to Remain LargeLarge(Percent of GDP)(Percent of GDP)
Oil tradeNet income
Non-oil trade
Oil trade Net income
Non-oil trade
United States
Current account
Current account
Non-oil trade
Oil tradeNet income
Current account
Oil tradeNet income
Non-oil trade
Current account
44
-15
-10
-5
0
5
10
199798 99 200001 02 03 04 05 06 07 08 09 10 11 12
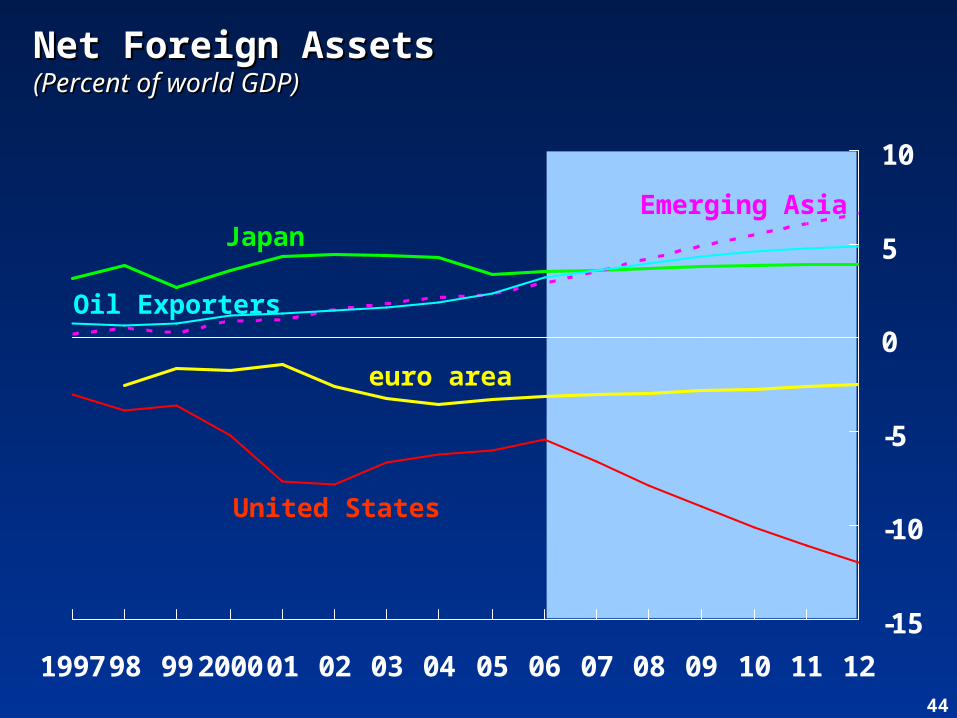
Net Foreign AssetsNet Foreign Assets(Percent of world GDP)(Percent of world GDP)
United States
Japan
euro area
Oil Exporters
Emerging Asia
45
-1
0
1
2
3
4
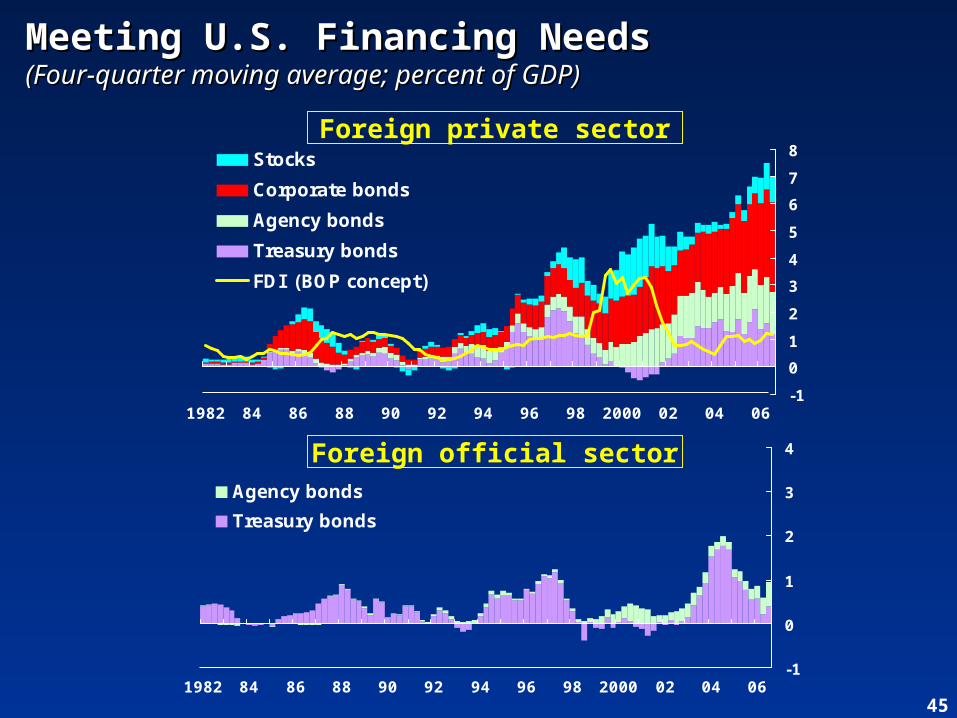
1982 84 86 88 90 92 94 96 98 2000 02 04 06
Agency bonds
Treasury bonds
Foreign official sector
Meeting U.S. Financing NeedsMeeting U.S. Financing Needs(Four-quarter moving average; percent of GDP)(Four-quarter moving average; percent of GDP)
-1
0
1
2
3
4
5
6
7
8
1982 84 86 88 90 92 94 96 98 2000 02 04 06
Stocks
Corporate bonds
Agency bonds
Treasury bonds
FDI (BOP concept)
Foreign private sector
46
Adjustment of Global Imbalances—Adjustment of Global Imbalances—How Could India Be Affected?How Could India Be Affected?
Smooth unwinding led by Smooth unwinding led by rebalancing of domestic demand rebalancing of domestic demand remains the most likely outcome remains the most likely outcome
Potential for “disorderly Potential for “disorderly adjustment”—rapid movement in adjustment”—rapid movement in exchange rates worldwide, volatile exchange rates worldwide, volatile financial conditionsfinancial conditions
Demand rebalancing in the United Demand rebalancing in the United States could imply a prolonged period States could imply a prolonged period of sub-par global growthof sub-par global growth
Risk of rising protectionist pressuresRisk of rising protectionist pressures
47
Critical Challenges for the Global Critical Challenges for the Global EconomyEconomy
Coming in for a soft landing?Coming in for a soft landing?
Bumps in the runway:Bumps in the runway:• The U.S. housing marketThe U.S. housing market• Inflation concerns and the oil Inflation concerns and the oil marketmarket• Financial risks facing emerging Financial risks facing emerging marketsmarkets
Longer-term Challenges:Longer-term Challenges:• Unwinding global imbalancesUnwinding global imbalances• Sustaining global productivity Sustaining global productivity growthgrowth
48
0
2
4
6
8
1970 75 80 85 90 95 2000 05
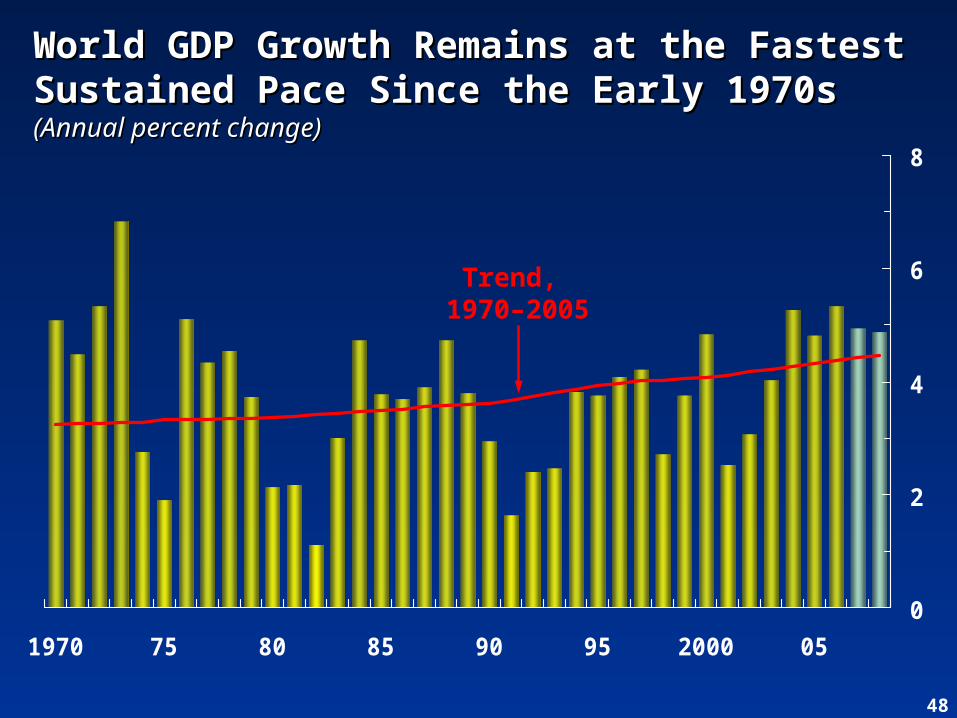
Trend, 1970–2005
World GDP Growth Remains at the Fastest World GDP Growth Remains at the Fastest Sustained Pace Since the Early 1970sSustained Pace Since the Early 1970s(Annual percent change)(Annual percent change)
49
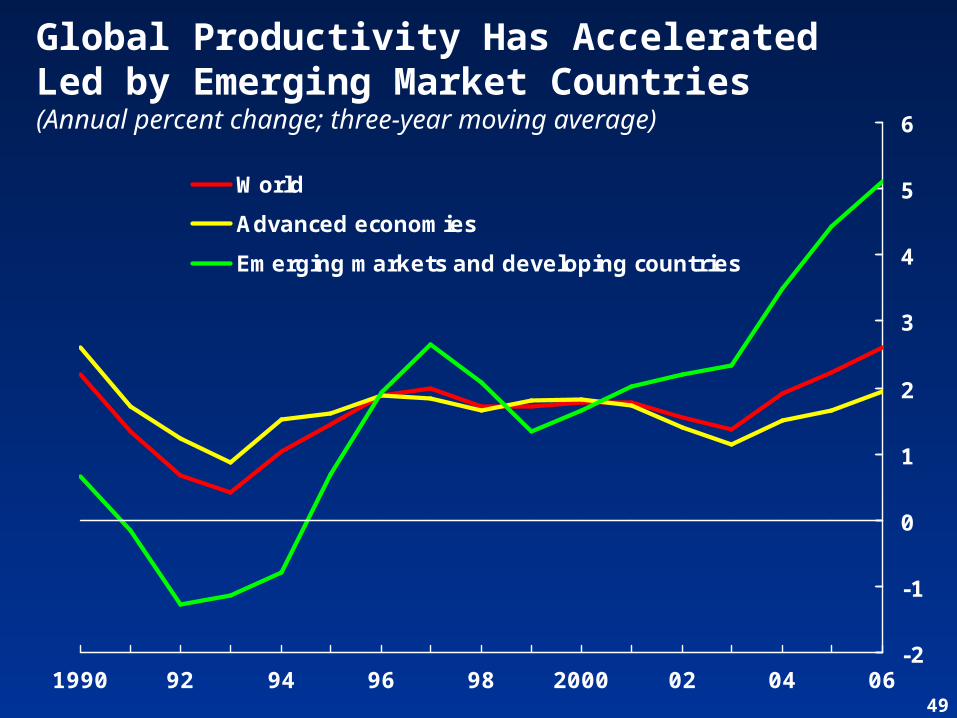
-2
-1
0
1
2
3
4
5
6
1990 92 94 96 98 2000 02 04 06
World
Advanced economies
Emerging markets and developing countries
Global Productivity Has Accelerated Led by Emerging Market Countries(Annual percent change; three-year moving average)
50
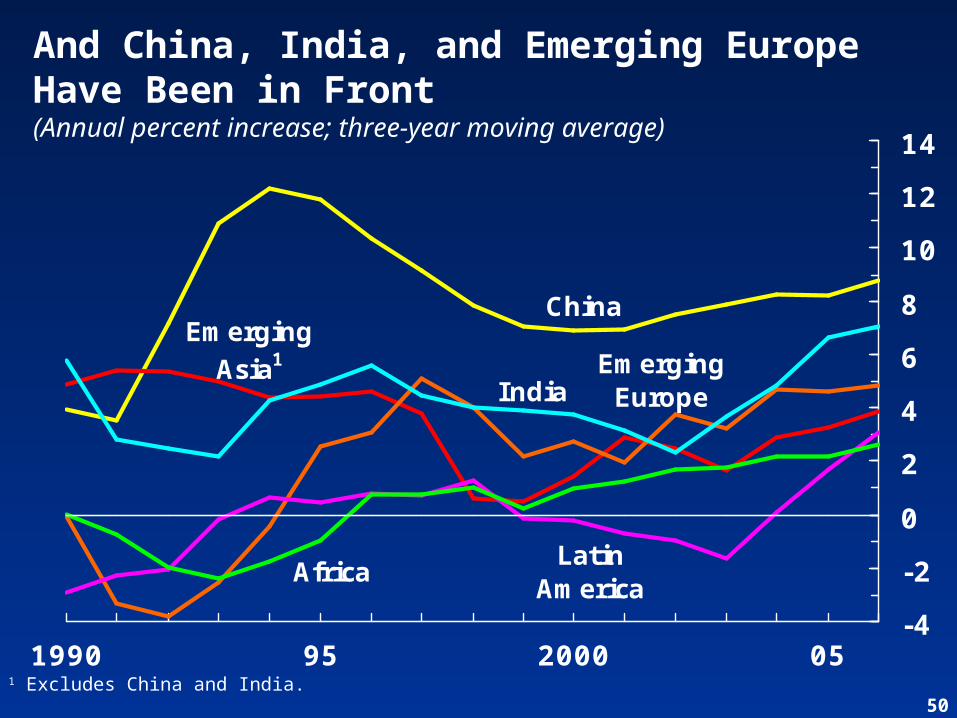
ChinaEmerging
Asia1 Emerging Europe
Latin America
Africa
India
-4
-2
0
2
4
6
8
10
12
14
1990 95 2000 05
And China, India, and Emerging Europe Have Been in Front(Annual percent increase; three-year moving average)
1 Excludes China and India.
51
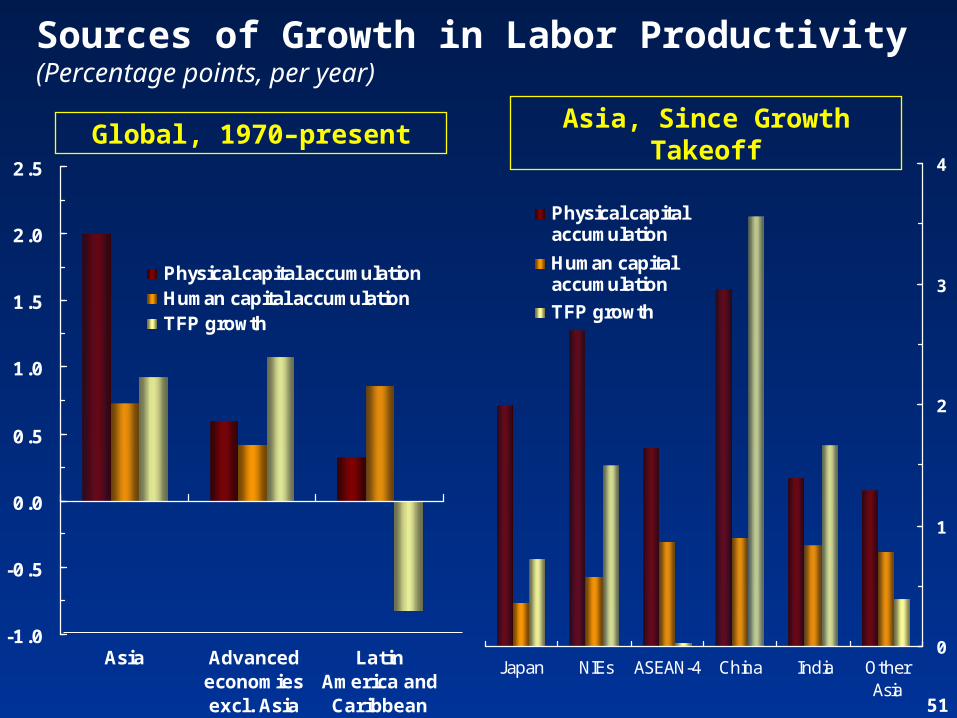
-1.0
-0.5
0.0
0.5
1.0
1.5
2.0
2.5
Asia Advancedeconomiesexcl. Asia
LatinAmerica andCaribbean
Physical capital accumulationHuman capital accumulationTFP growth
Sources of Growth in Labor Productivity(Percentage points, per year)
0
1
2
3
4
Japan NIEs ASEAN-4 China India OtherAsia
Physical capitalaccumulation
Human capitalaccumulation
TFP growth
Global, 1970–presentAsia, Since Growth
Takeoff
52
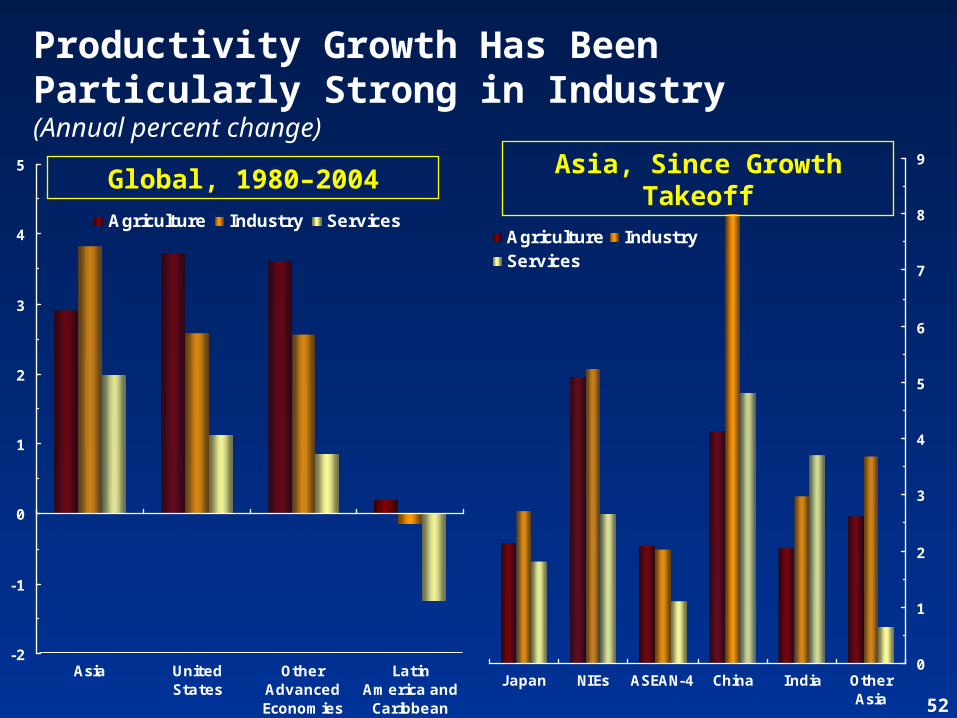
Productivity Growth Has Been Particularly Strong in Industry(Annual percent change)
-2
-1
0
1
2
3
4
5
Asia UnitedStates
OtherAdvancedEconomies
LatinAmerica andCaribbean
Agriculture Industry Services
0
1
2
3
4
5
6
7
8
9
Japan NIEs ASEAN-4 China India OtherAsia
Agriculture IndustryServices
Global, 1980–2004 Asia, Since Growth Takeoff
53
-1
0
1
2
3
4
5
6
7
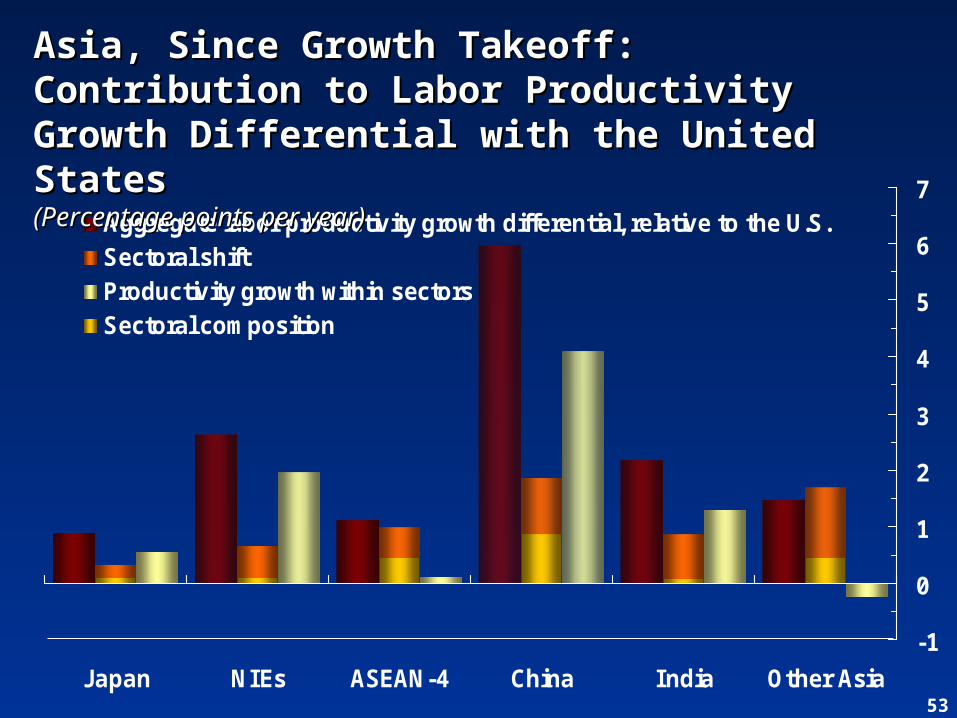
Japan NIEs ASEAN-4 China India Other Asia
Aggregate labor productivity growth differential, relative to the U.S.Sectoral shiftProductivity growth within sectorsSectoral composition
Asia, Since Growth Takeoff: Contribution Asia, Since Growth Takeoff: Contribution to Labor Productivity Growth Differential to Labor Productivity Growth Differential with the United Stateswith the United States(Percentage points per year)(Percentage points per year)
54
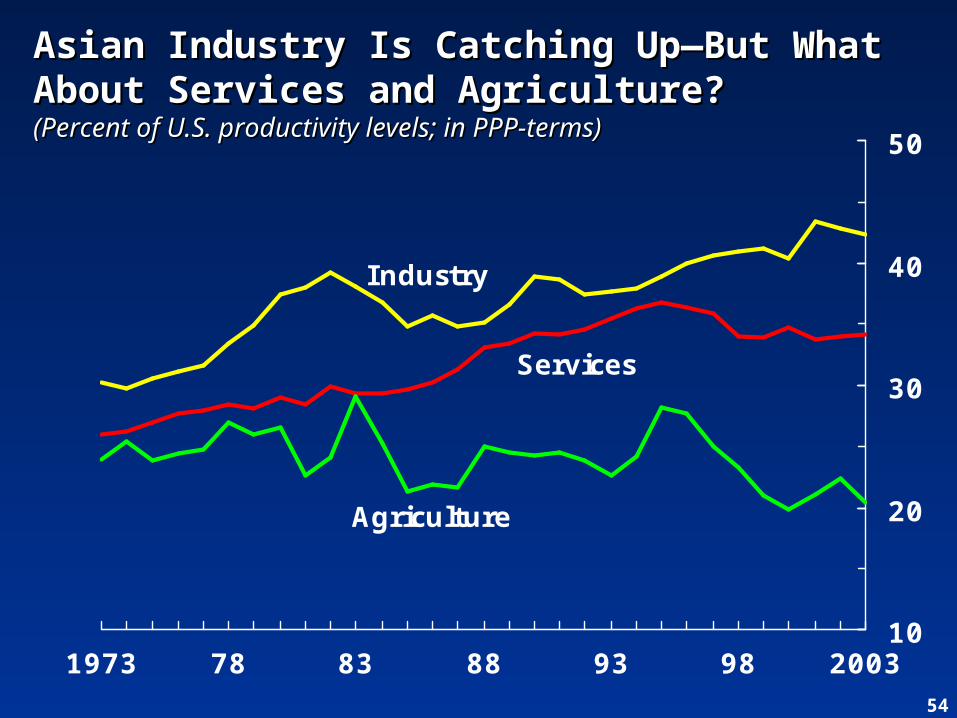
Industry
Services
Agriculture
10
20
30
40
50
1973 78 83 88 93 98 2003
Asian Industry Is Catching Up—But What Asian Industry Is Catching Up—But What About Services and Agriculture?About Services and Agriculture?(Percent of U.S. productivity levels; in PPP-terms)(Percent of U.S. productivity levels; in PPP-terms)
55
1 2 3 4 50
2
4
6
8
10
12
1 2 3 4 50
2
4
6
8
10
12
1 2 3 4 5
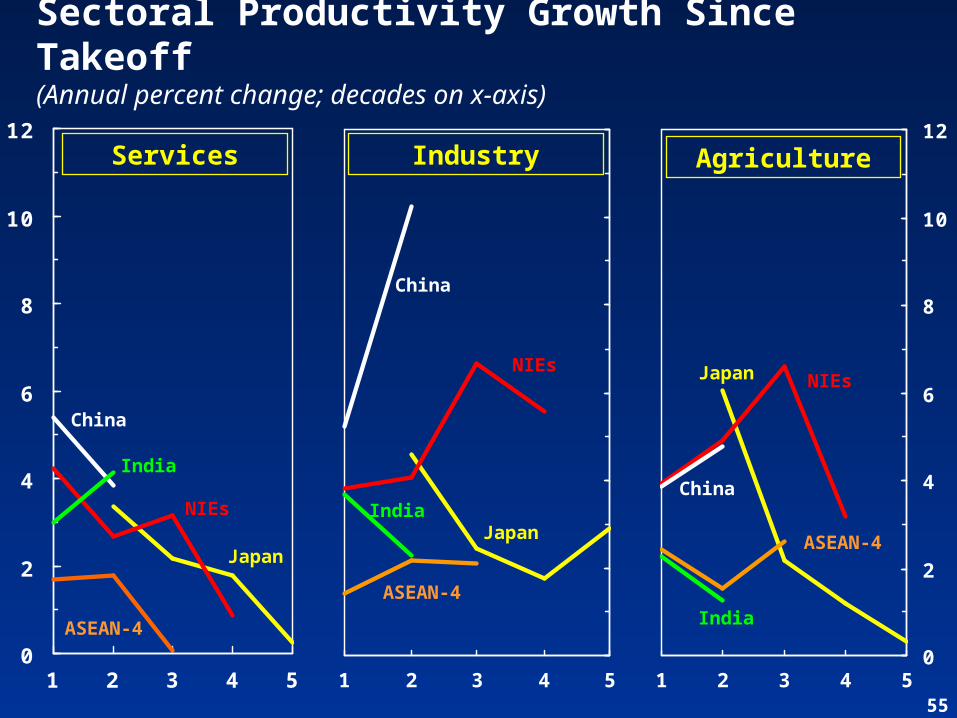
Sectoral Productivity Growth Since Takeoff(Annual percent change; decades on x-axis)
AgricultureIndustryServices
Japan
NIEs
ASEAN-4
China
India
Japan
ASEAN-4
NIEs
China
India
Japan NIEs
ASEAN-4
India
China
56
High growth countries
World
20
30
40
50
60
70
80
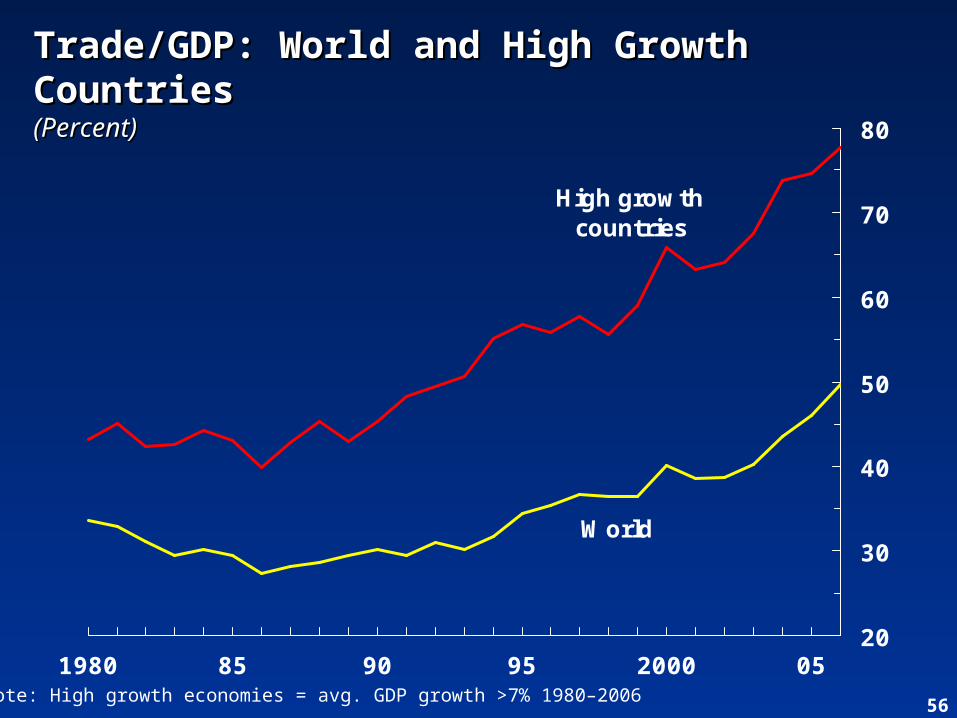
1980 85 90 95 2000 05Note: High growth economies = avg. GDP growth >7% 1980–2006
Trade/GDP: World and High Growth Trade/GDP: World and High Growth CountriesCountries(Percent)(Percent)
57
Sustaining Global Productivity GrowthSustaining Global Productivity Growth
Domestic market reforms can help to Domestic market reforms can help to sustain rapid productivity growth in sustain rapid productivity growth in emerging market and developing emerging market and developing countriescountries
Further steps to remove trade Further steps to remove trade barriers—both unilateral and barriers—both unilateral and multilateral—are also crucialmultilateral—are also crucial
But greater attention must be paid But greater attention must be paid both in advanced and developing both in advanced and developing countries to make sure that the fruits countries to make sure that the fruits of globalization are well distributedof globalization are well distributed
58
Notwithstanding recent volatility Notwithstanding recent volatility and U.S. slowdown, continued robust and U.S. slowdown, continued robust global growth still looks the most global growth still looks the most likely outcome.likely outcome.
Policy makers and financial markets Policy makers and financial markets around the world need to be ready for around the world need to be ready for surprises.surprises.
Take advantage of good times to Take advantage of good times to tackle structural impediments to tackle structural impediments to sustained growth.sustained growth.
In Conclusion:In Conclusion:

Download the WEODownload the WEO
http://www.imf.org/weohttp://www.imf.org/weo
60
Working-age
population
Total labor force
Export-weighted
labor
force1
0
50
100
150
200
250
300
350
400
1980 85 90 95 2000 05
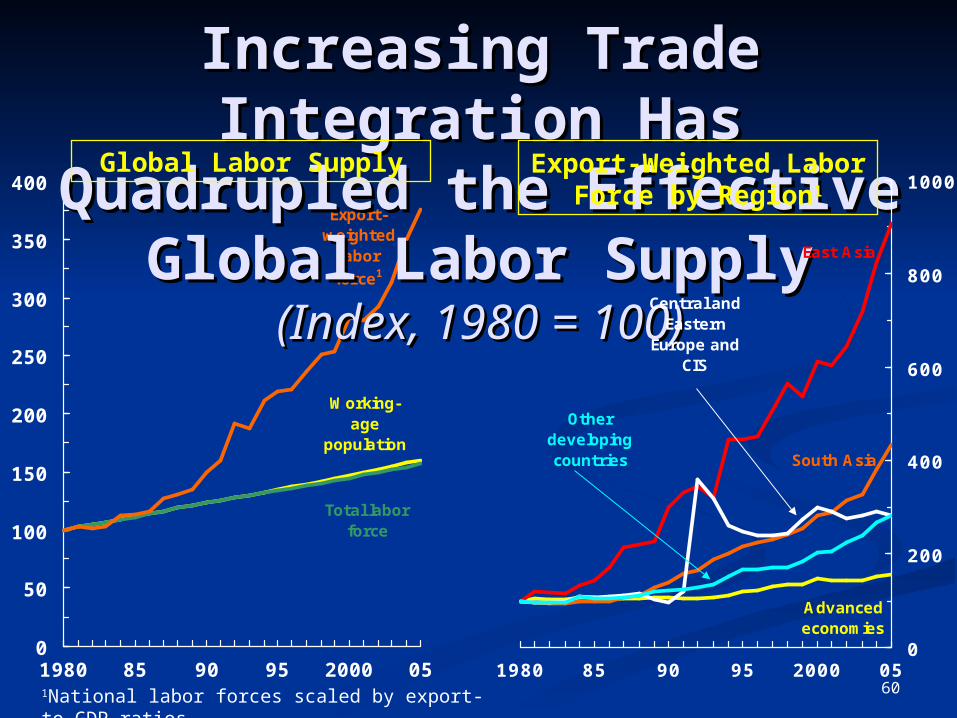
Increasing Trade Increasing Trade Integration Has Integration Has
Quadrupled the Effective Quadrupled the Effective Global Labor SupplyGlobal Labor Supply
(Index, 1980 = 100)(Index, 1980 = 100)
Global Labor Supply
Advanced economies
East Asia
South Asia
Central and Eastern
Europe and CIS
Other developing countries
0
200
400
600
800
1000
1980 85 90 95 2000 05
Export-Weighted Labor Force by
Region1
1National labor forces scaled by export-to-GDP ratios.
61
0
2
4
6
8
10
Latin America EmergingEurope
Asia Middle East Africa
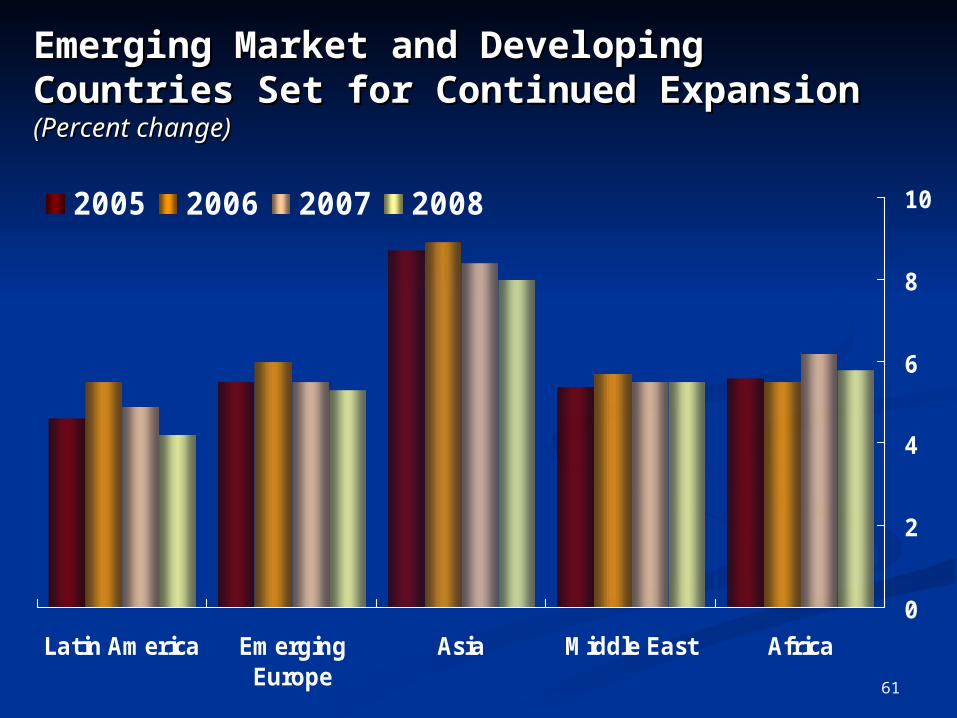
2005 2006 2007 2008
Emerging Market and Developing Emerging Market and Developing Countries Set for Continued ExpansionCountries Set for Continued Expansion(Percent change)(Percent change)
62
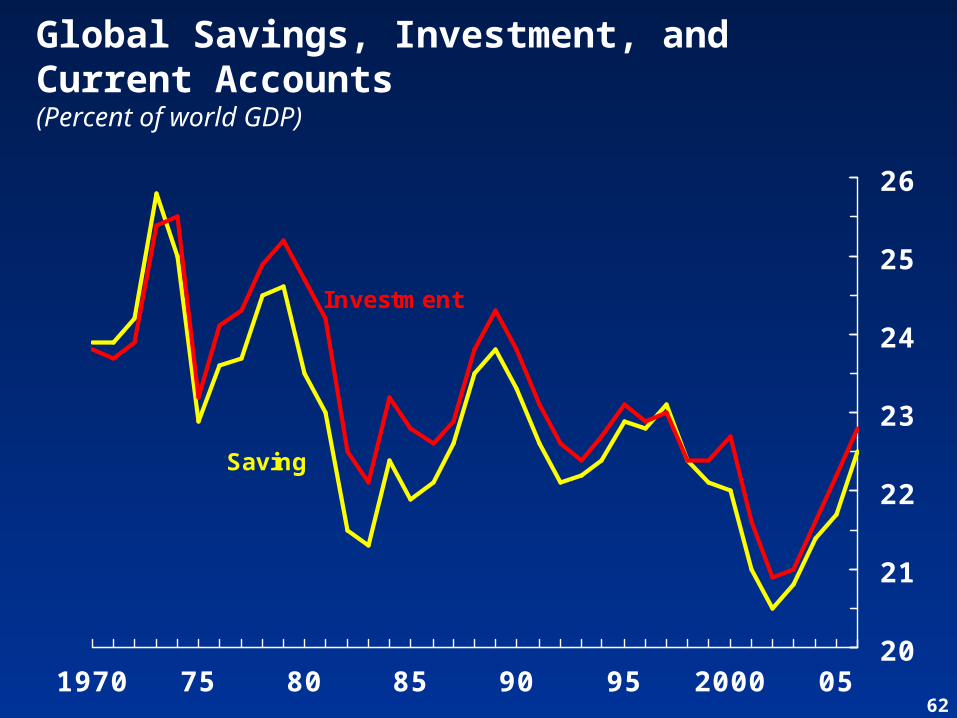
Saving
Investment
20
21
22
23
24
25
26
1970 75 80 85 90 95 2000 05
Global Savings, Investment, and Current Accounts(Percent of world GDP)
63
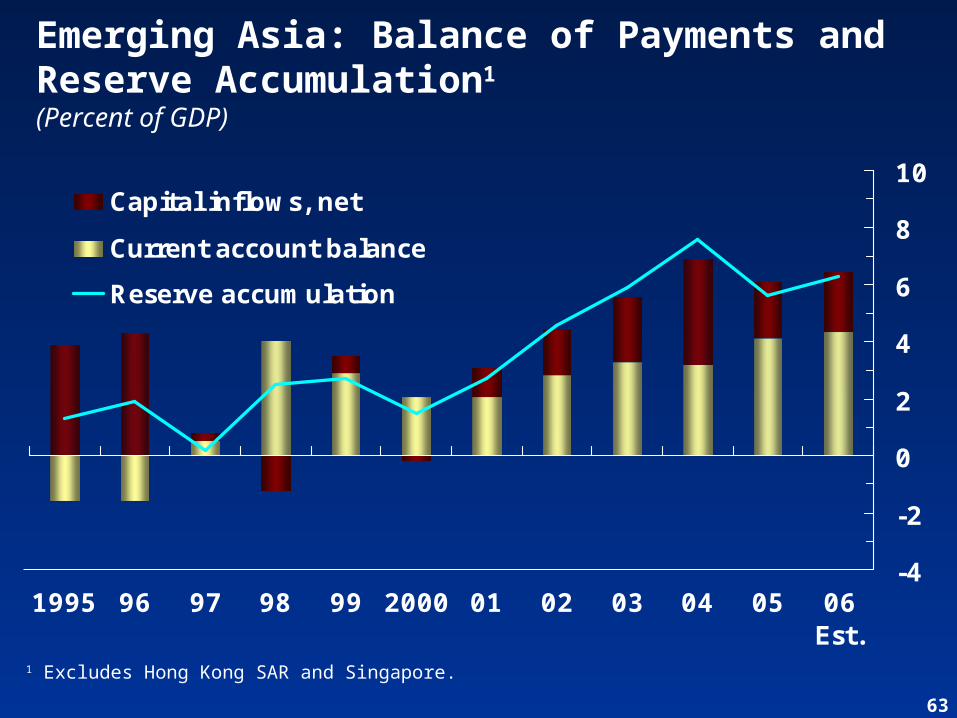
Emerging Asia: Balance of Payments and Reserve Accumulation1
(Percent of GDP)
-4
-2
0
2
4
6
8
10
1995 96 97 98 99 2000 01 02 03 04 05 06Est.
Capital inflows, net
Current account balance
Reserve accumulation
1 Excludes Hong Kong SAR and Singapore.
64
10
20
30
40
50
60
70
1970 75 80 85 90 95 2000 05-10
-8
-6
-4
-2
0
2
4
6
8
10
10
20
30
40
50
60
70
1970 75 80 85 90 95 2000 05-10
-8
-6
-4
-2
0
2
4
6
8
10
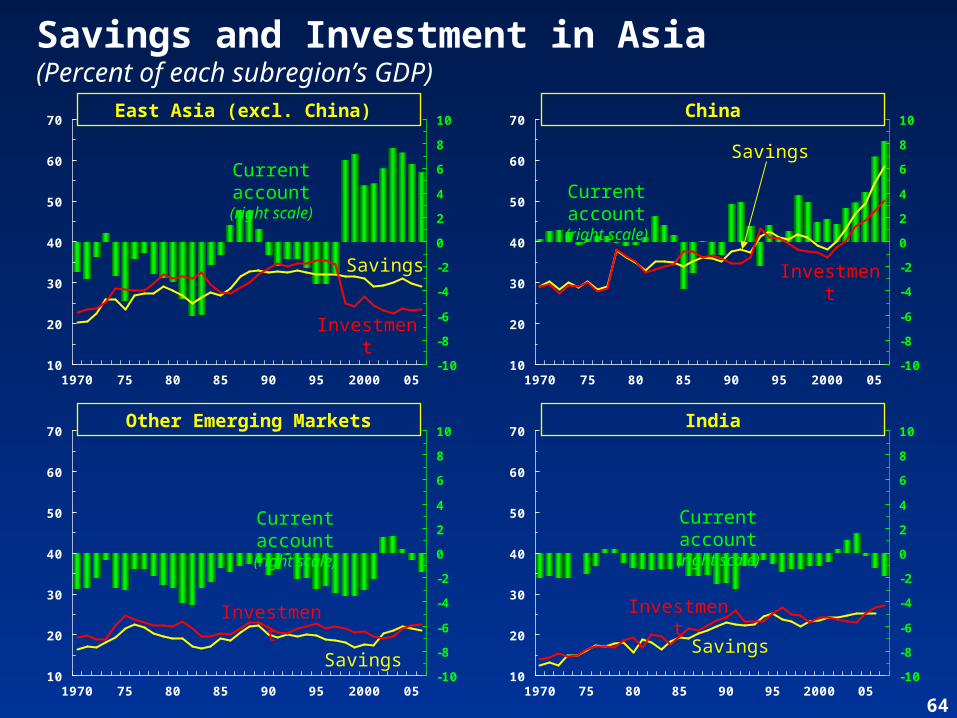
Savings and Investment in Asia(Percent of each subregion’s GDP)
Savings
Investment
IndiaOther Emerging Markets
ChinaEast Asia (excl. China)
Current account
(right scale)
Savings
Investment
Current account
(right scale)
10
20
30
40
50
60
70
1970 75 80 85 90 95 2000 05-10
-8
-6
-4
-2
0
2
4
6
8
10
10
20
30
40
50
60
70
1970 75 80 85 90 95 2000 05-10
-8
-6
-4
-2
0
2
4
6
8
10
Savings
Investment
Current account
(right scale)
Savings
Current account
(right scale)
Investment
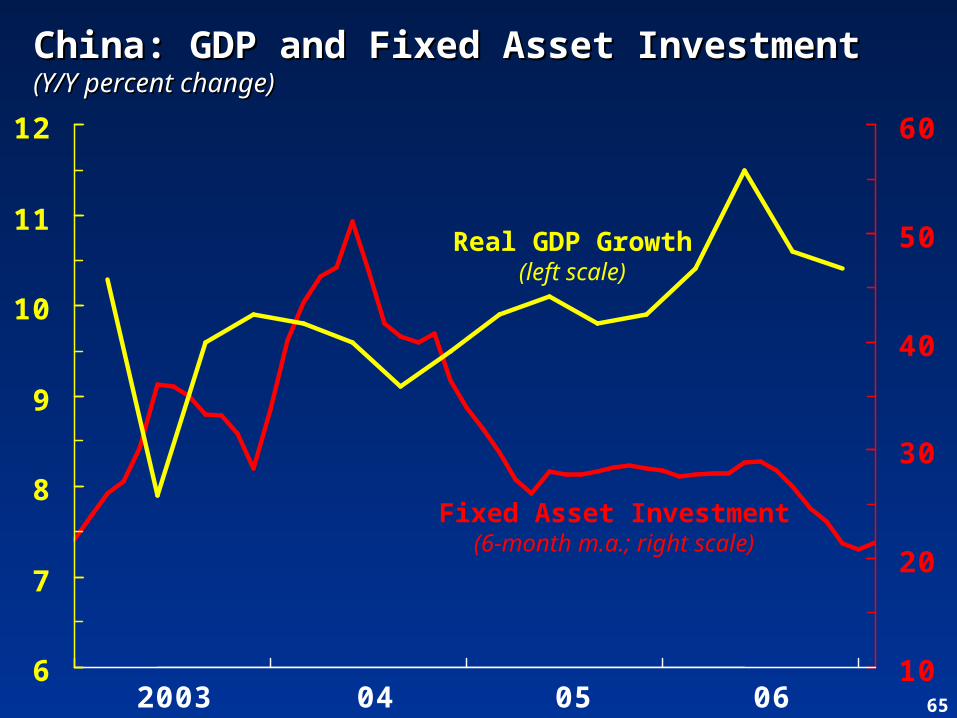
65060504200310
20
30
40
50
60
6
7
8
9
10
11
12
China: GDP and Fixed Asset InvestmentChina: GDP and Fixed Asset Investment(Y/Y percent change)(Y/Y percent change)
Fixed Asset Investment(6-month m.a.; right scale)
Real GDP Growth(left scale)
66
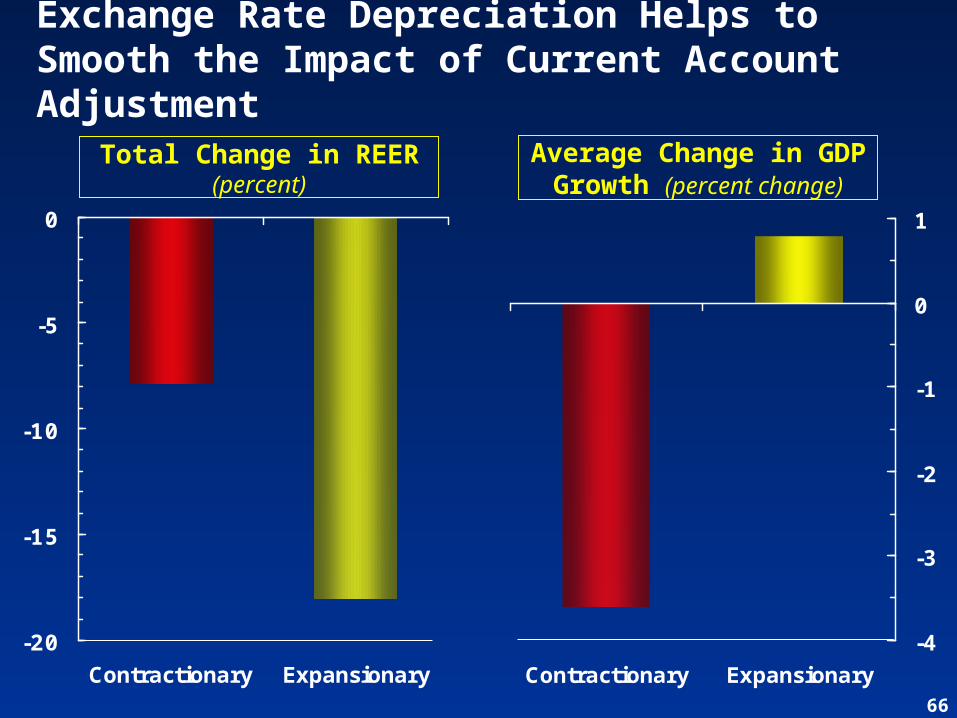
Exchange Rate Depreciation Helps to Smooth the Impact of Current Account Adjustment
-20
-15
-10
-5
0
Contractionary Expansionary
Total Change in REER(percent)
Average Change in GDP Growth (percent change)
-4
-3
-2
-1
0
1
Contractionary Expansionary
67
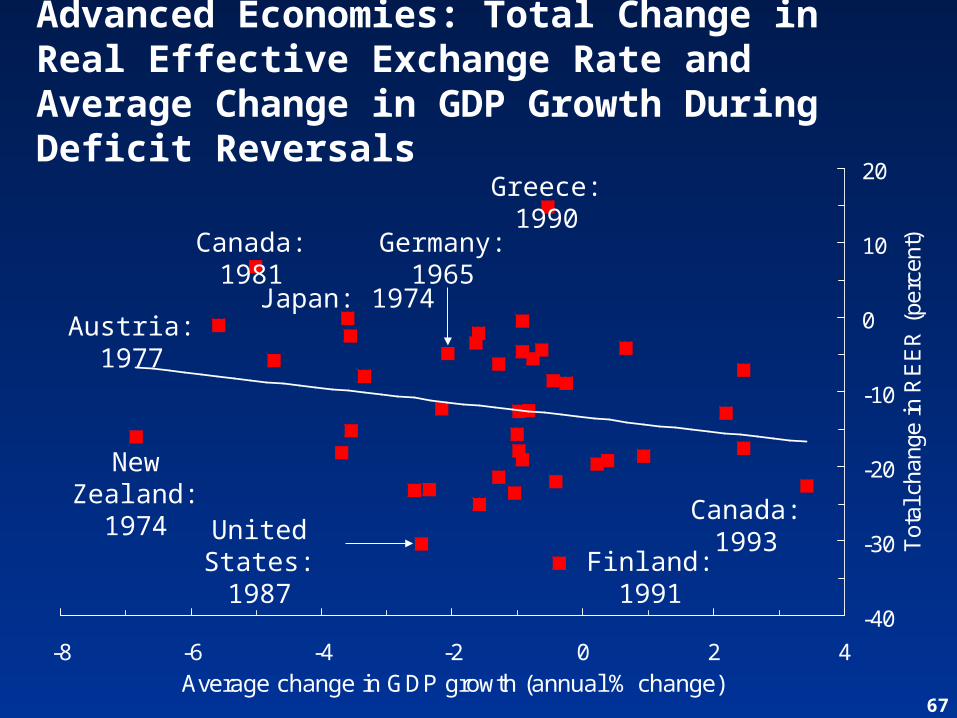
Advanced Economies: Total Change in Real Effective Exchange Rate and Average Change in GDP Growth During Deficit Reversals
-40
-30
-20
-10
0
10
20
-8 -6 -4 -2 0 2 4Average change in GDP growth (annual % change)
Tot
al c
hang
e in
RE
ER
(pe
rcen
t)
Greece: 1990
Germany: 1965
Japan: 1974
Canada: 1981
Austria: 1977
New Zealand:
1974 United States: 1987 Finland:
1991
Canada: 1993
68
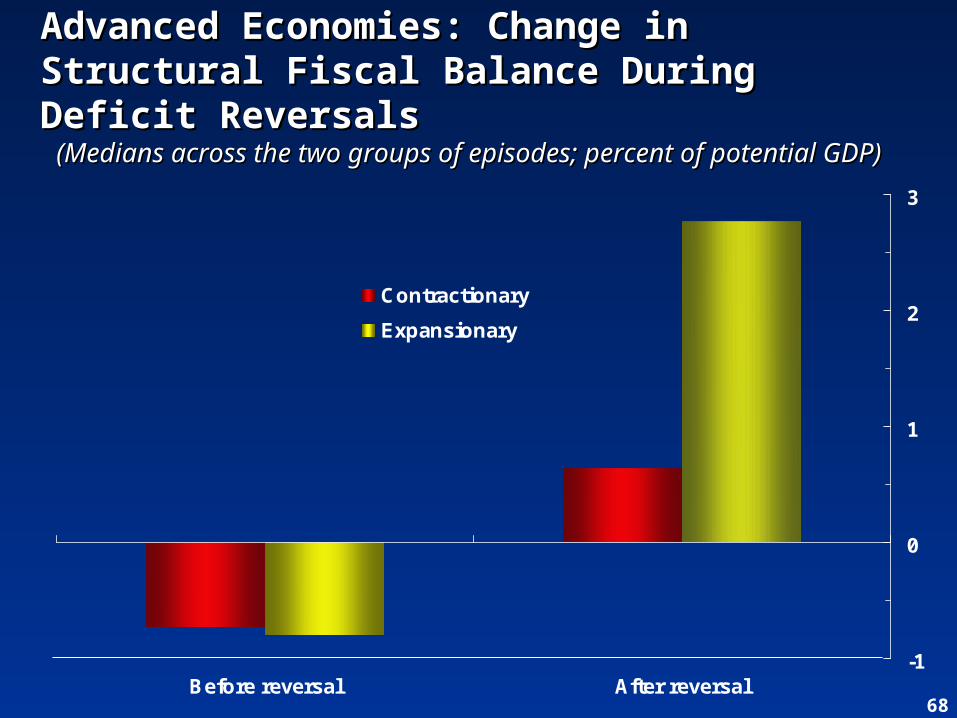
Advanced Economies: Change in Advanced Economies: Change in Structural Fiscal Balance During Deficit Structural Fiscal Balance During Deficit ReversalsReversals (Medians across the two groups of episodes; percent of (Medians across the two groups of episodes; percent of potential GDP)potential GDP)
-1
0
1
2
3
Before reversal After reversal
Contractionary
Expansionary
69
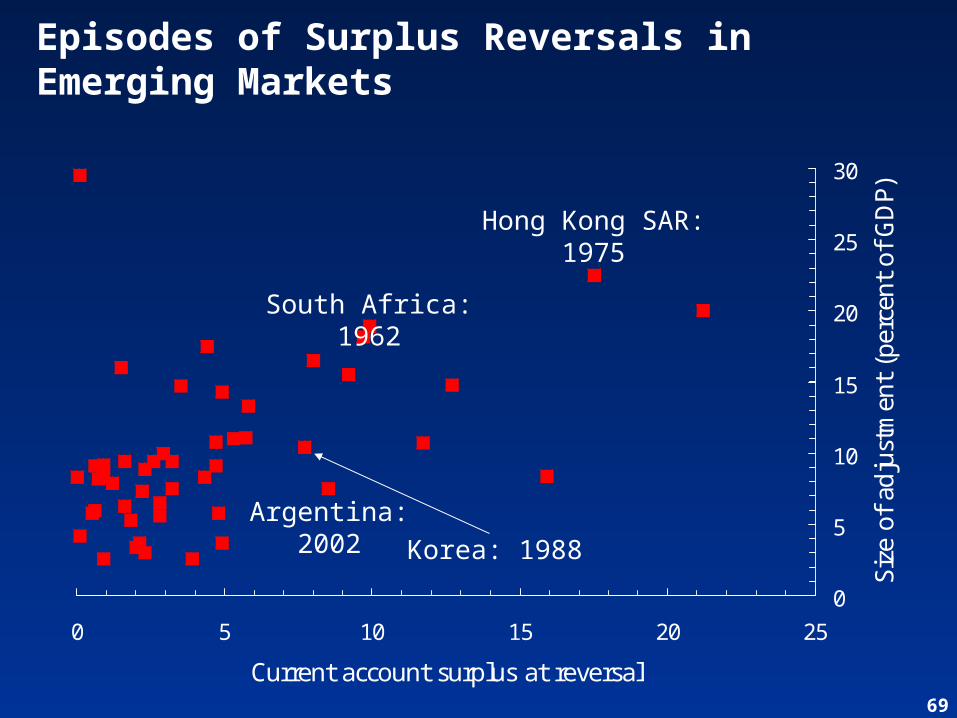
Episodes of Surplus Reversals in Emerging Markets
0
5
10
15
20
25
30
0 5 10 15 20 25
Current account surplus at reversal
Size
of ad
just
men
t (p
erce
nt o
f G
DP)
Hong Kong SAR: 1975
South Africa: 1962
Korea: 1988Argentina:
2002
70
95
100
105
110
115
-5 -4 -3 -2 -1 0 +1 +2 +3 +4 +5
0
4
8
12
16
20
24
-5 -4 -3 -2 -1 0 +1 +2 +3 +4 +5
4
6
8
10
12
-5 -4 -3 -2 -1 0 +1 +2 +3 +4 +5
2
3
4
5
6
7
8
-5 -4 -3 -2 -1 0 +1 +2 +3 +4 +5
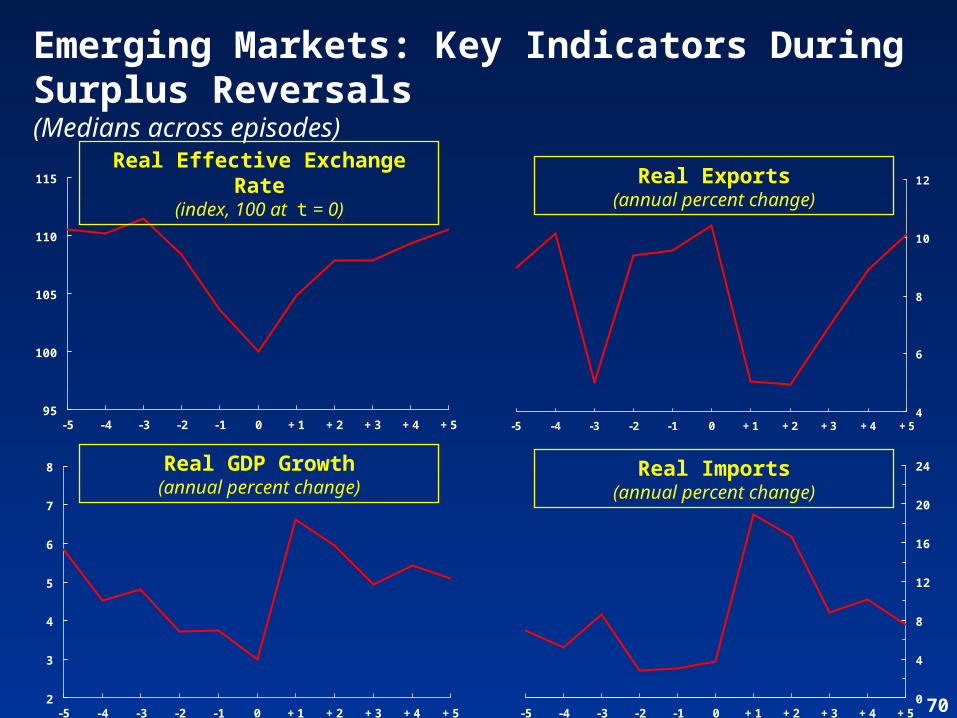
Emerging Markets: Key Indicators During Surplus Reversals(Medians across episodes)
Real GDP Growth(annual percent change)
Real Effective Exchange Rate
(index, 100 at t = 0)
Real Exports(annual percent change)
Real Imports(annual percent change)
71
-0.6
-0.3
0.0
0.3
0.6
0.9
1.2
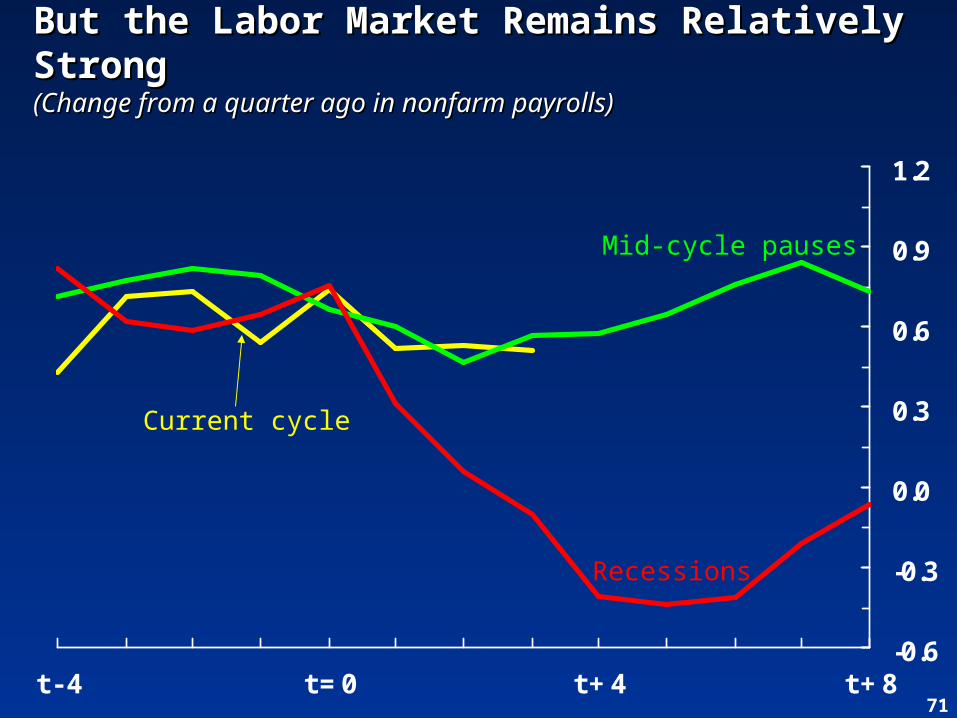
t - 4 t = 0 t + 4 t + 8
Current cycle
Mid-cycle pauses
Recessions
But the Labor Market Remains Relatively But the Labor Market Remains Relatively StrongStrong(Change from a quarter ago in nonfarm payrolls)(Change from a quarter ago in nonfarm payrolls)
72
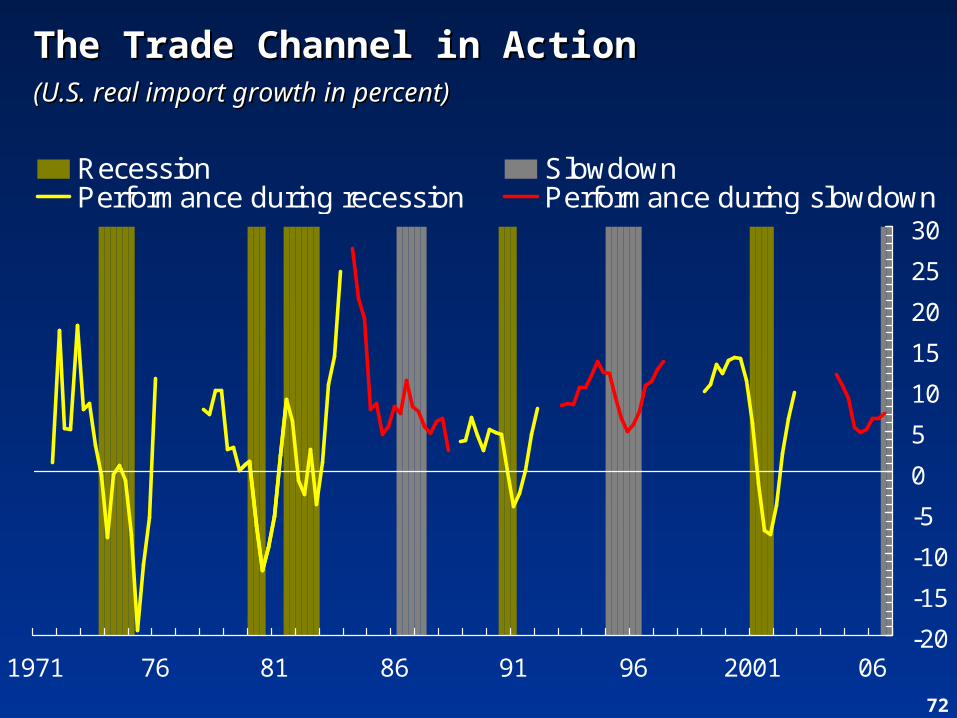
The Trade Channel in ActionThe Trade Channel in Action(U.S. real import growth in percent)(U.S. real import growth in percent)
-20
-15
-10
-5
0
5
10
15
20
25
30
1971 76 81 86 91 96 2001 06
Recession SlowdownPerformance during recession Performance during slowdown
73
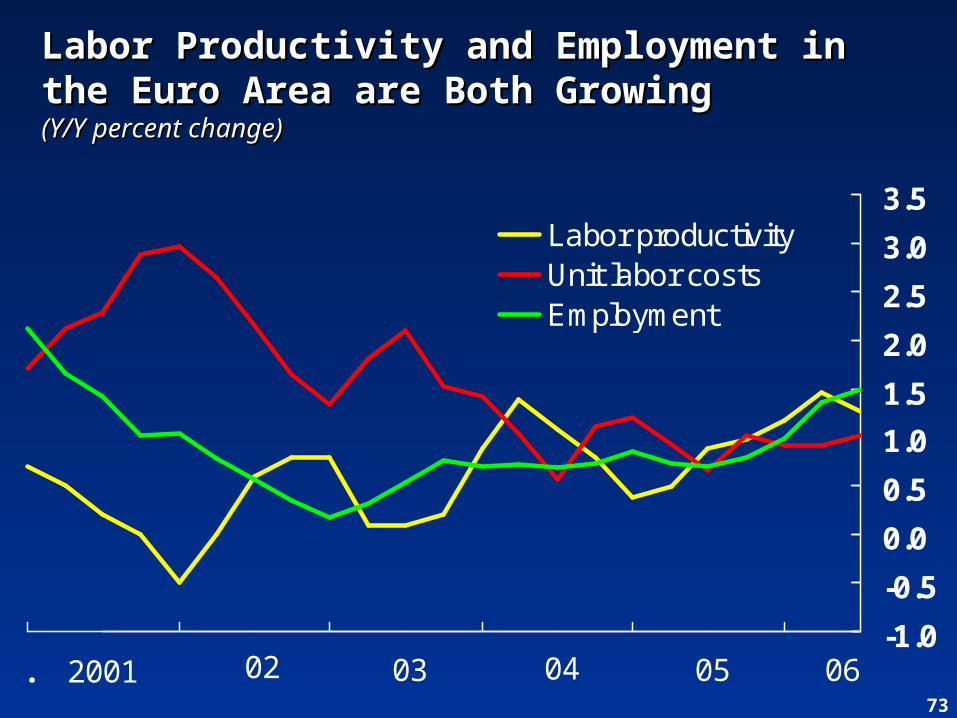
Labor Productivity and Employment in Labor Productivity and Employment in the Euro Area are Both Growingthe Euro Area are Both Growing(Y/Y percent change)(Y/Y percent change)
2001 02 03 04 05 06-1.0
-0.5
0.0
0.5
1.0
1.5
2.0
2.5
3.0
3.5
.
Labor productivityUnit labor costsEmployment
74
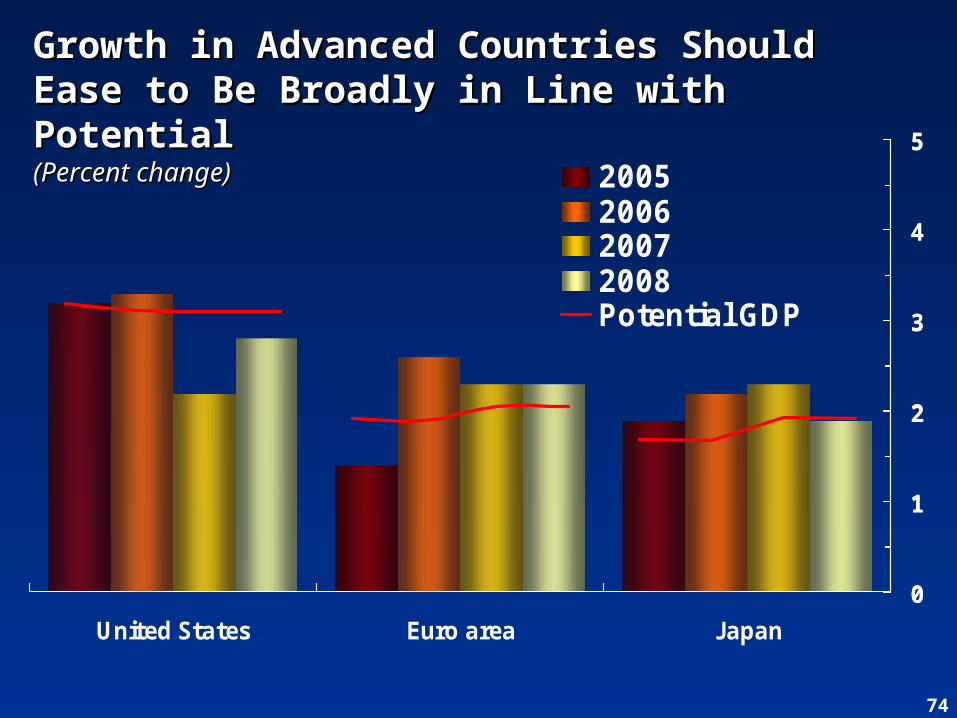
0
1
2
3
4
5
United States Euro area Japan
2005200620072008Potential GDP
0
1
2
3
4
5
Growth in Advanced Countries Should Growth in Advanced Countries Should Ease to Be Broadly in Line with PotentialEase to Be Broadly in Line with Potential(Percent change)(Percent change)
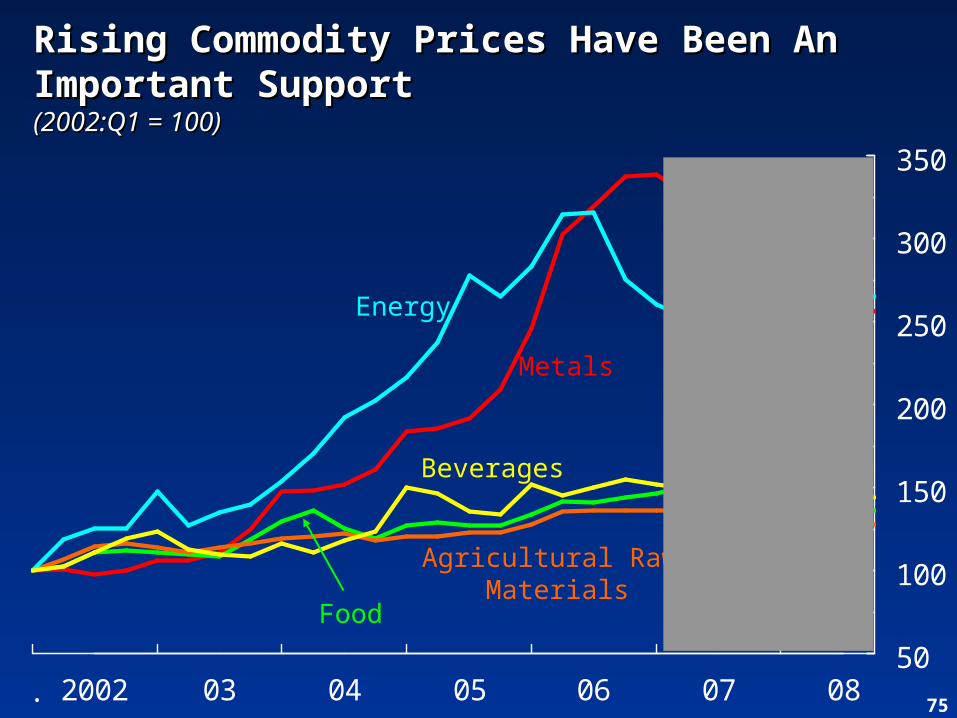
752002 03 04 05 06 07 08
50
100
150
200
250
300
350
.
Metals
Beverages
Energy
Food
Agricultural Raw Materials
Rising Commodity Prices Have Been An Rising Commodity Prices Have Been An Important SupportImportant Support(2002:Q1 = 100)(2002:Q1 = 100)
76
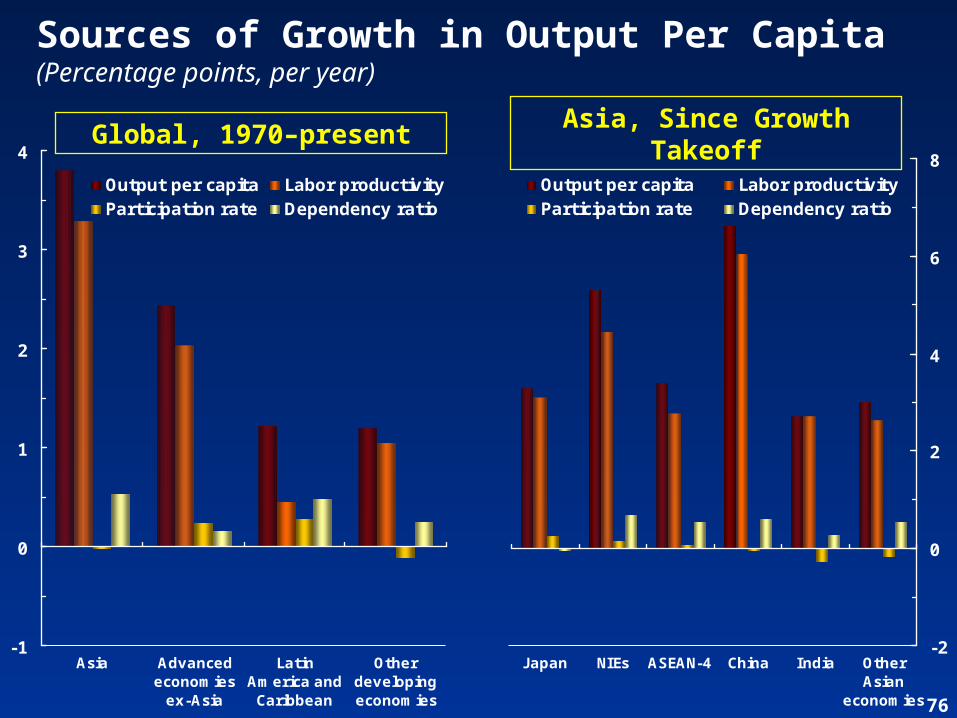
Sources of Growth in Output Per Capita(Percentage points, per year)
-1
0
1
2
3
4
Asia Advancedeconomies
ex-Asia
LatinAmerica andCaribbean
Otherdevelopingeconomies
Output per capita Labor productivityParticipation rate Dependency ratio
-2
0
2
4
6
8
J apan NIEs ASEAN-4 China India OtherAsian
economies
Output per capita Labor productivityParticipation rate Dependency ratio
Global, 1970–presentAsia, Since Growth
Takeoff
77
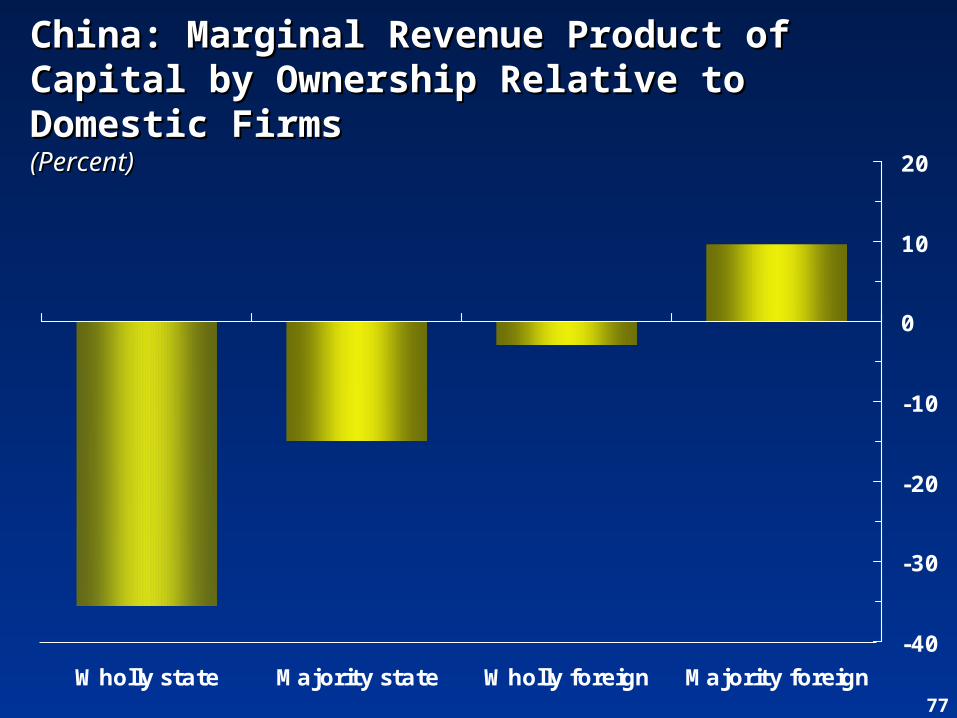
-40
-30
-20
-10
0
10
20
Wholly state Majority state Wholly foreign Majority foreign
China: Marginal Revenue Product of China: Marginal Revenue Product of Capital by Ownership Relative to Capital by Ownership Relative to Domestic FirmsDomestic Firms(Percent)(Percent)
78
-25
-20
-15
-10
-5
0
5
10
15
20
25
30
Central and Eastern EuropeAfricaEmerging AsiaLatin AmericaC.I.S.Middle East
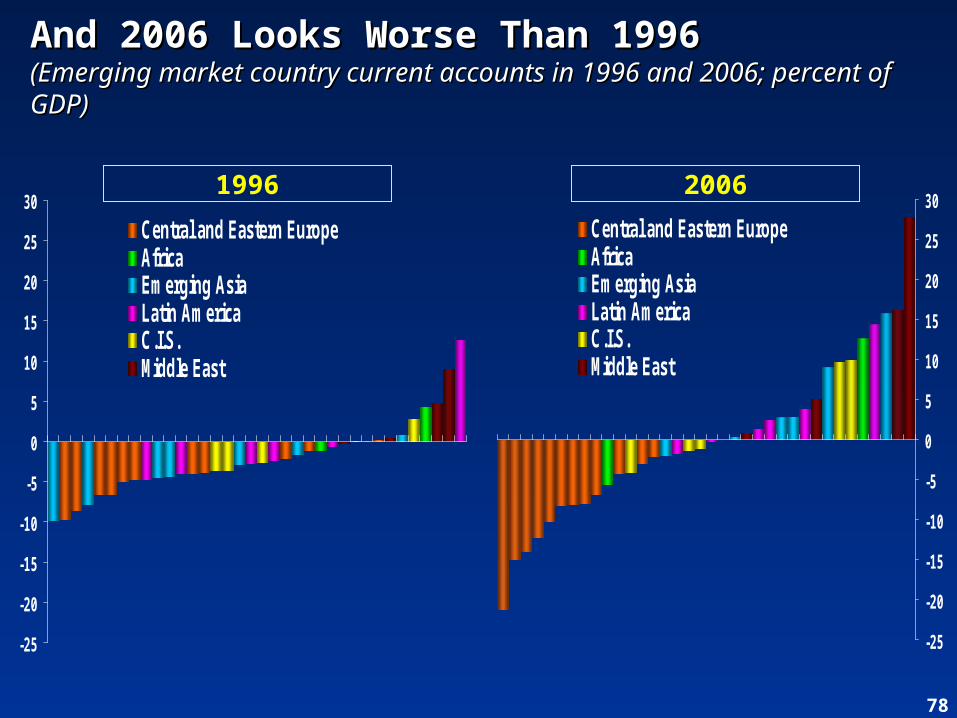
And 2006 Looks Worse Than 1996And 2006 Looks Worse Than 1996(Emerging market country current accounts in 1996 and 2006; (Emerging market country current accounts in 1996 and 2006; percent of GDP)percent of GDP)
-25
-20
-15
-10
-5
0
5
10
15
20
25
30
Central and Eastern EuropeAfricaEmerging AsiaLatin AmericaC.I.S.Middle East
1996 2006
79
80
100
120
140
160
180
200
1980 85 90 95 2000 05
Real total labor compensationReal labor compensation per workerEmployment
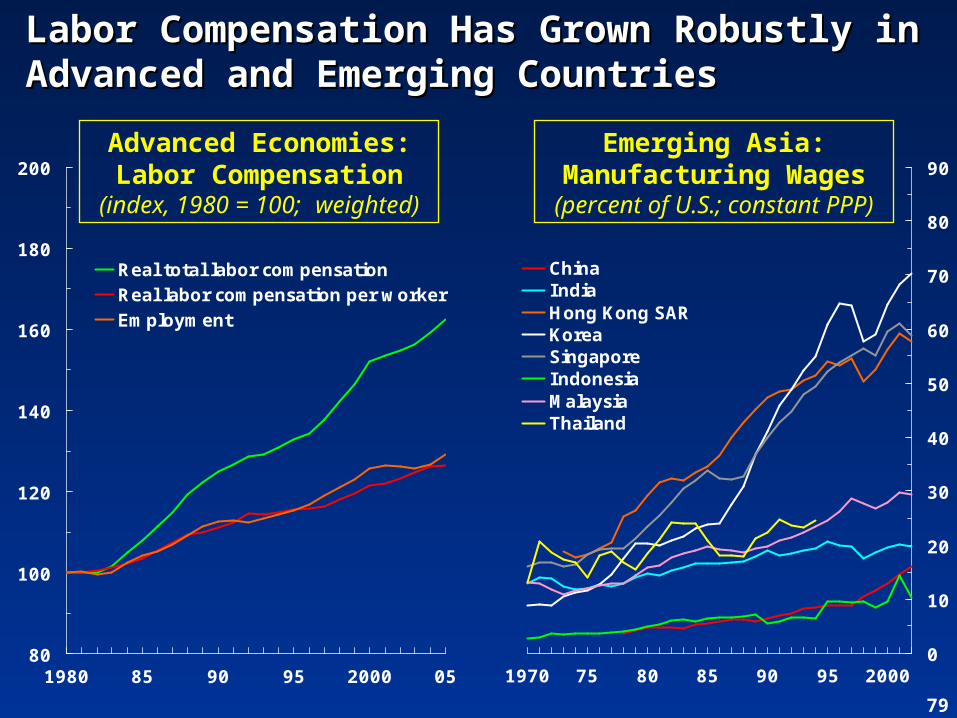
Labor Compensation Has Grown Robustly Labor Compensation Has Grown Robustly in Advanced and Emerging Countriesin Advanced and Emerging Countries
0
10
20
30
40
50
60
70
80
90
1970 75 80 85 90 95 2000
ChinaIndiaHong Kong SARKoreaSingaporeIndonesiaMalaysiaThailand
Emerging Asia: Manufacturing Wages(percent of U.S.; constant
PPP)
Advanced Economies: Labor Compensation
(index, 1980 = 100; weighted)
80
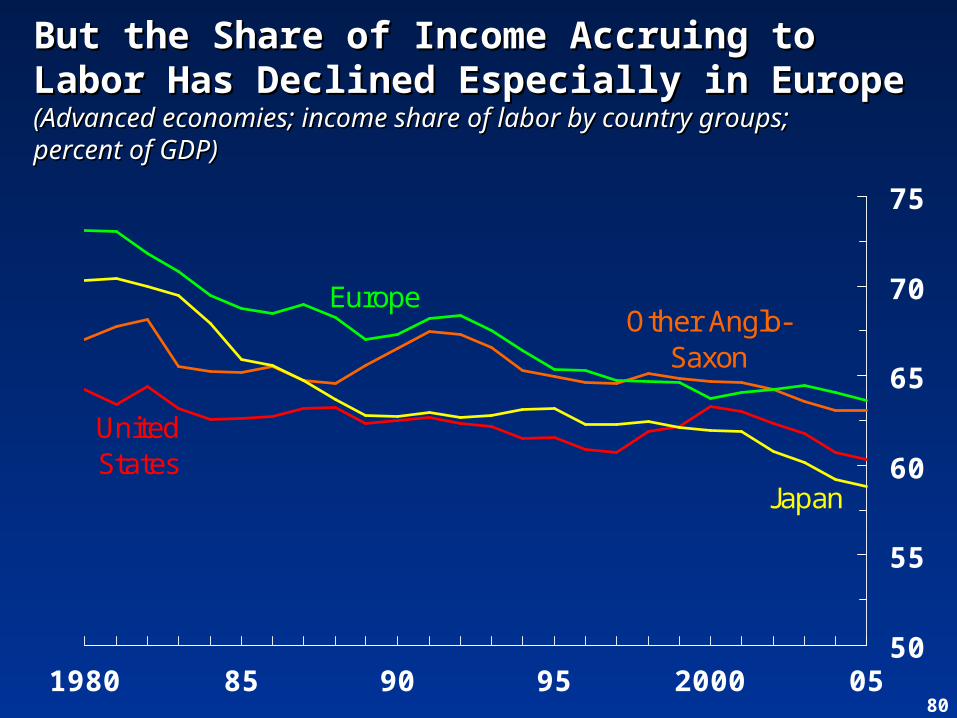
But the Share of Income Accruing to Labor But the Share of Income Accruing to Labor Has Declined Especially in EuropeHas Declined Especially in Europe(Advanced economies; income share of labor by country groups;(Advanced economies; income share of labor by country groups;percent of GDP)percent of GDP)
United States
Other Anglo-Saxon
Europe
Japan
50
55
60
65
70
75
1980 85 90 95 2000 05
81
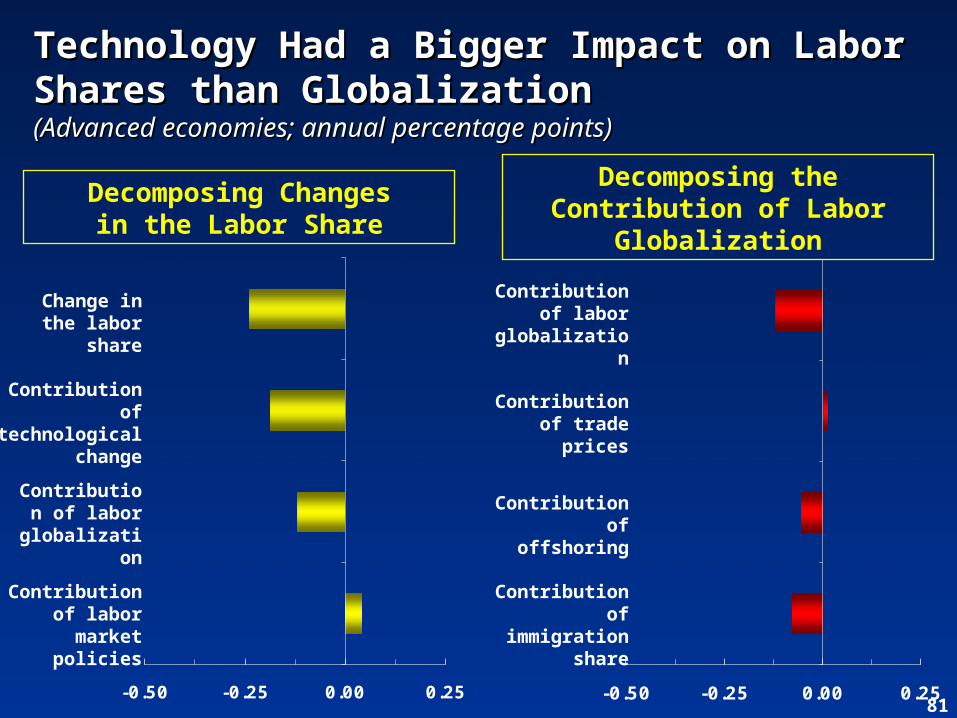
Technology Had a Bigger Impact on Labor Technology Had a Bigger Impact on Labor Shares than GlobalizationShares than Globalization(Advanced economies; annual percentage points)(Advanced economies; annual percentage points)
-0.50 -0.25 0.00 0.25
Decomposing Changesin the Labor Share
Change in the labor
share
Contribution of
technological change
Contribution of labor market policies
-0.50 -0.25 0.00 0.25
Decomposing the Contribution of Labor Globalization
Contribution of labor
globalization
Contribution of trade
prices
Contribution of offshoring
Contribution of
immigration share
Contribution of labor
globalization
82
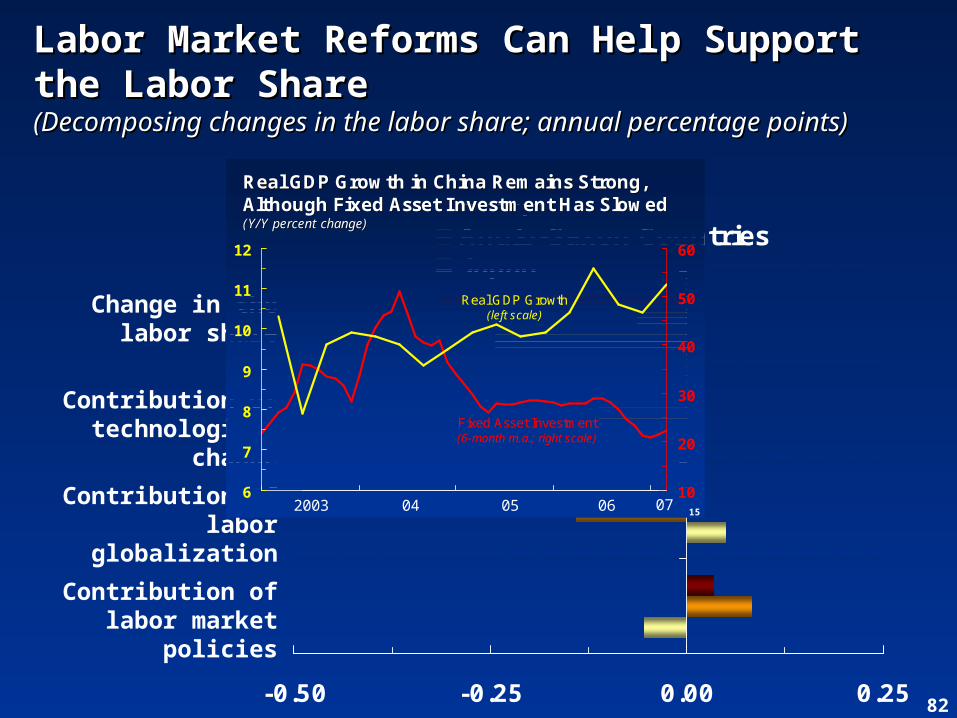
Labor Market Reforms Can Help Support Labor Market Reforms Can Help Support the Labor Share the Labor Share (Decomposing changes in the labor share; annual percentage (Decomposing changes in the labor share; annual percentage points)points)
-0.50 -0.25 0.00 0.25
EuropeAnglo-Saxon CountriesJapan
Change in the labor share
Contribution of technological
change
Contribution of labor globalization
Contribution of labor market
policies
152003 07060504
10
20
30
40
50
60
6
7
8
9
10
11
12
Fixed Asset Investment(6-month m.a.; right scale)
Real GDP Growth(left scale)
Real GDP Growth in China Remains Strong, Real GDP Growth in China Remains Strong, Although Fixed Asset Investment Has SlowedAlthough Fixed Asset Investment Has Slowed(Y/Y percent change)(Y/Y percent change)