critical thresholds and tipping points in the earth system
TRANSCRIPT
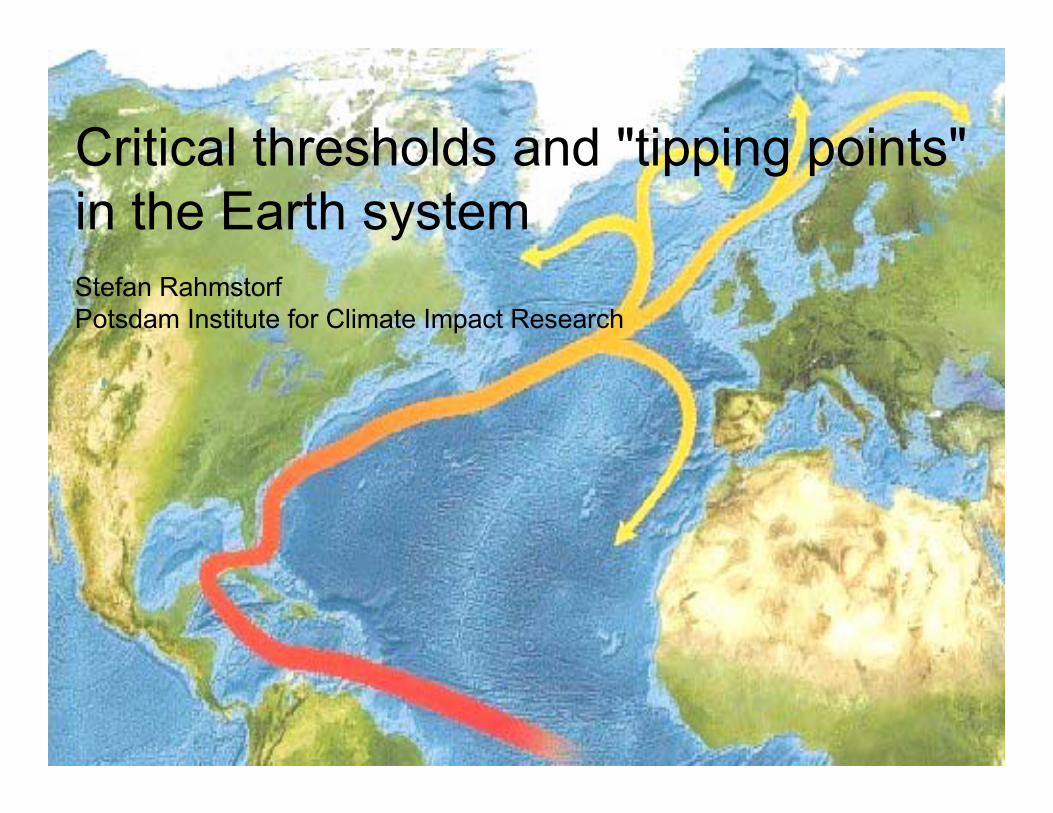
Critical thresholds and "tipping points" in the Earth system Stefan RahmstorfPotsdam Institute for Climate Impact Research
Smooth journey or bumpy ride?
Future Climate Change
Main reasons to suspect the latter:
- History of climate is very “bumpy”- Abundance of non-linearities and
threshold effects in the climate system- A number of those are not captured in
current models
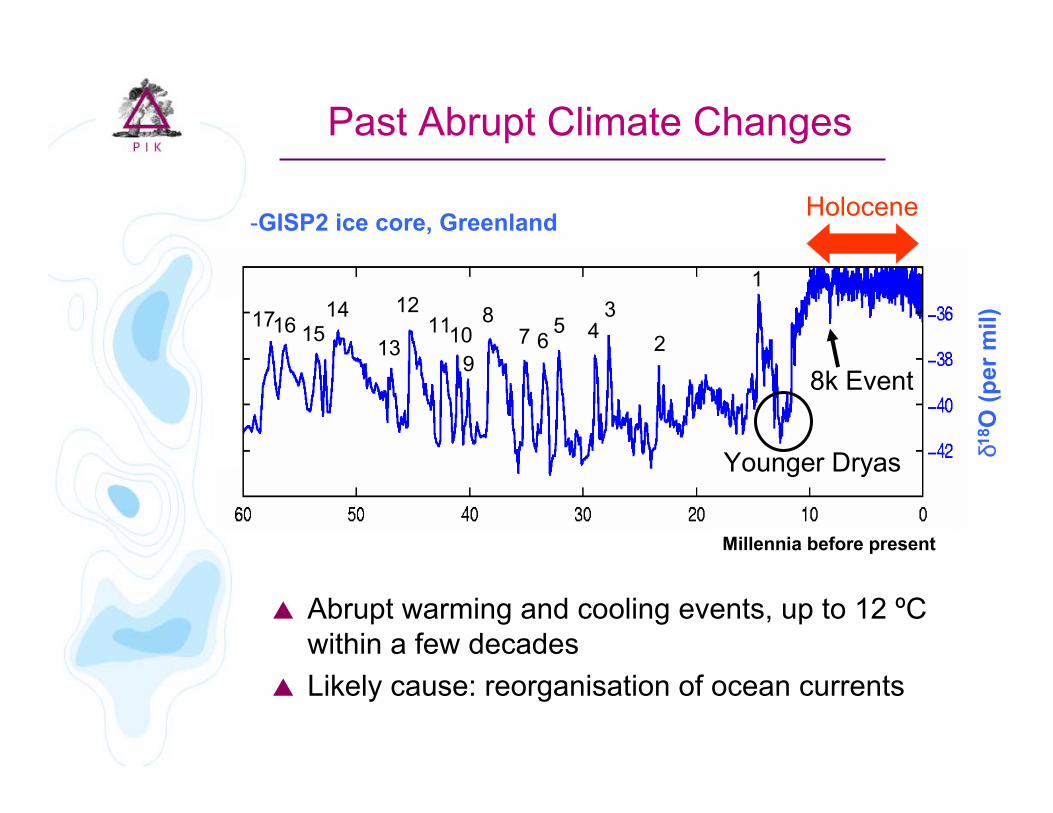
-GISP2 ice core, Greenland
112
11109
87 6
5 43
21716 15
14
13
δ18 O
(per
mil)
Millennia before present
Holocene
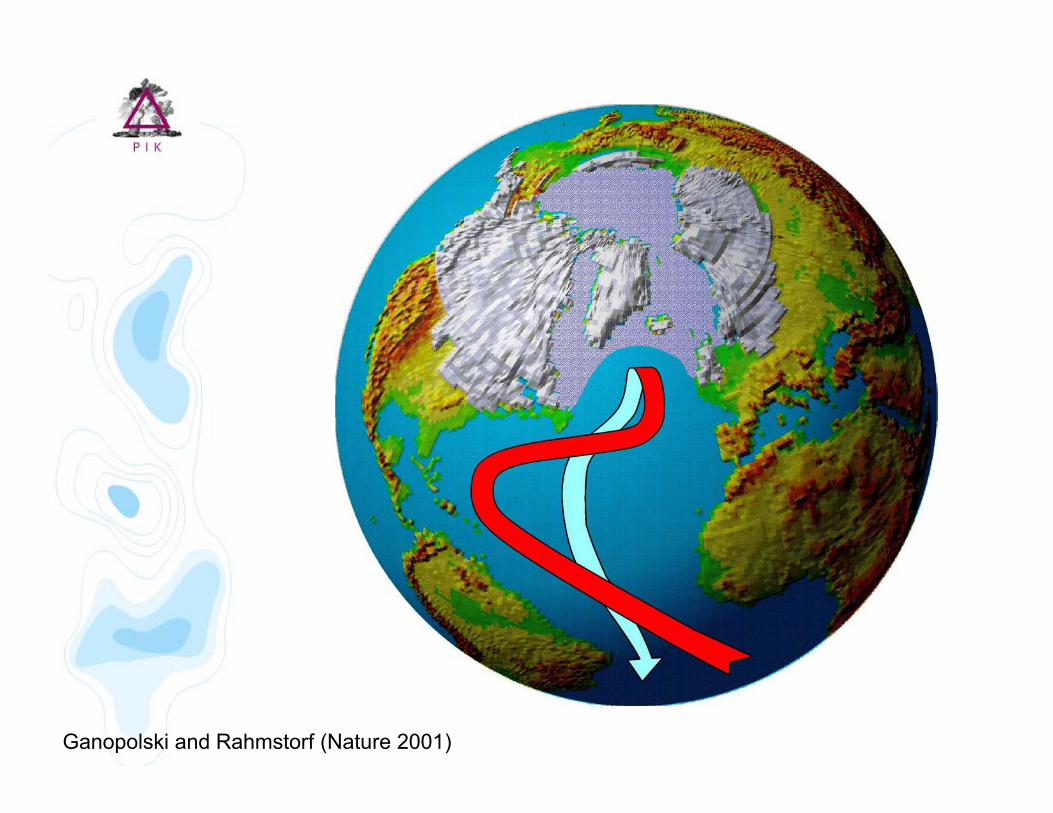
Abrupt warming and cooling events, up to 12 ºC within a few decadesLikely cause: reorganisation of ocean currents
8k Event
Younger Dryas
Past Abrupt Climate Changes

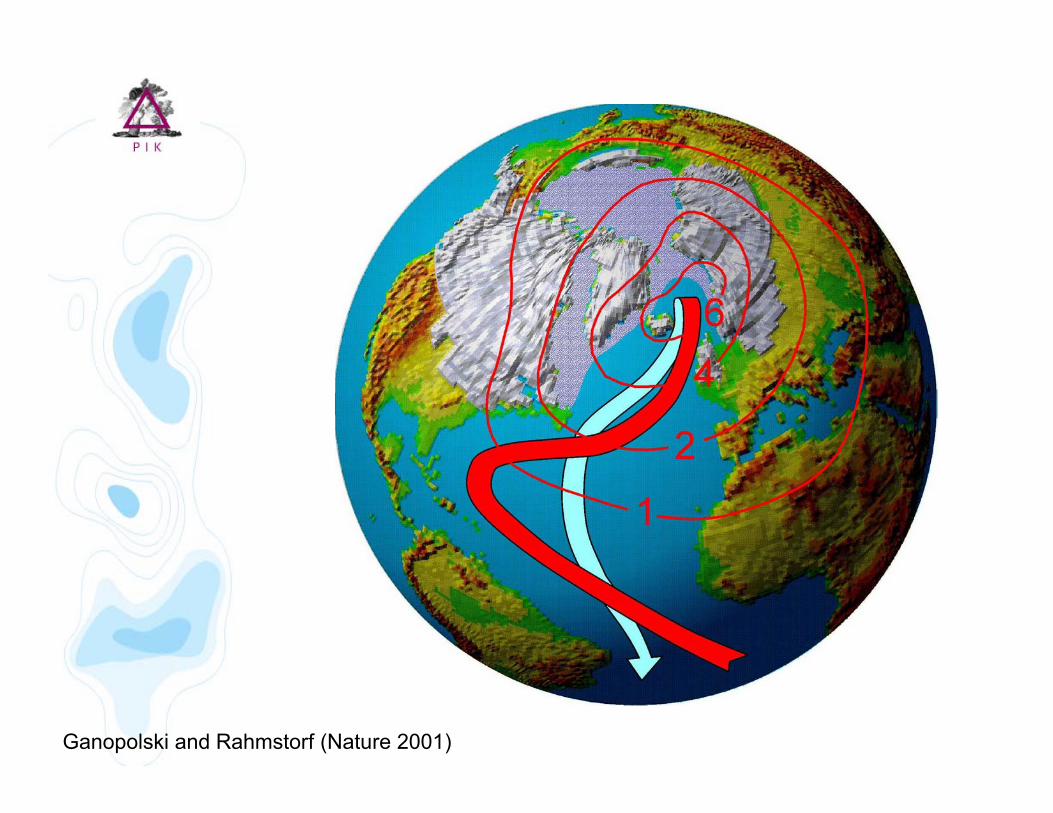
Ganopolski and Rahmstorf (Nature 2001)
Ganopolski and Rahmstorf (Nature 2001)
Ganopolski and Rahmstorf (Nature 2001)
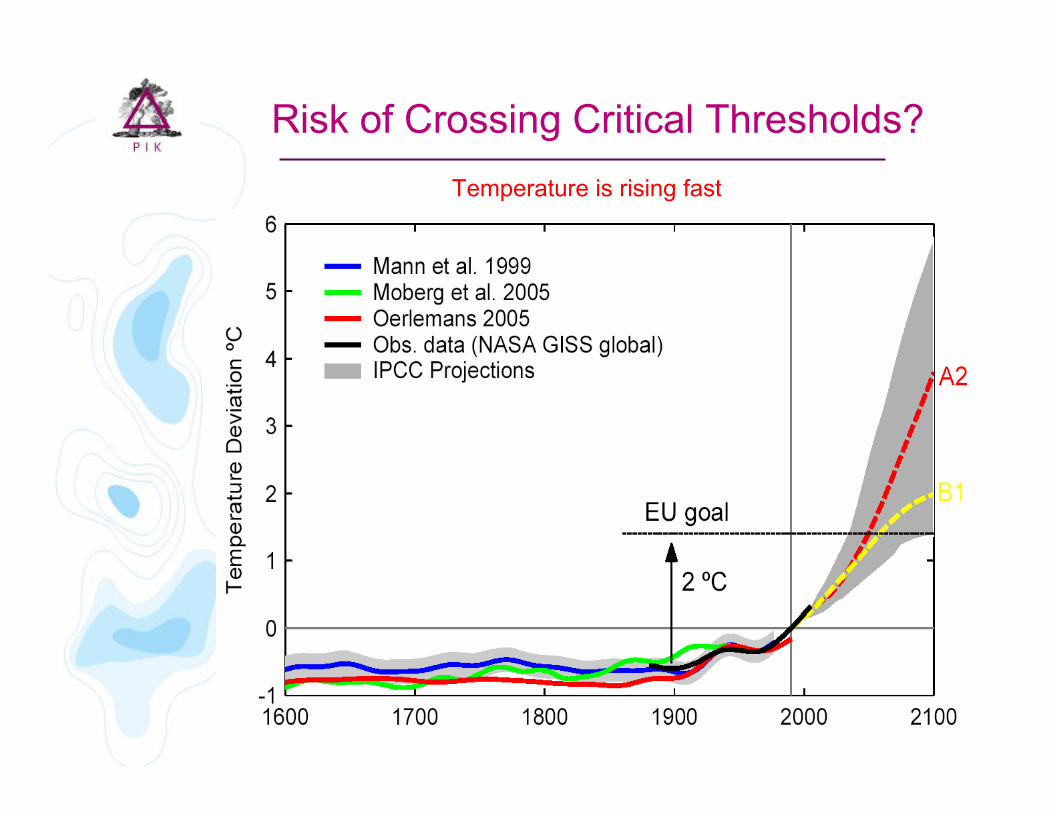
Risk of Crossing Critical Thresholds?Temperature is rising fast

Typical amount: ~ 0.1 – 0.2 SvHeinrich Events: ~ 0.1 SvRahmstorf et al. (Geophys. Res. Let. 2005)
Ocean Circulation Threshold
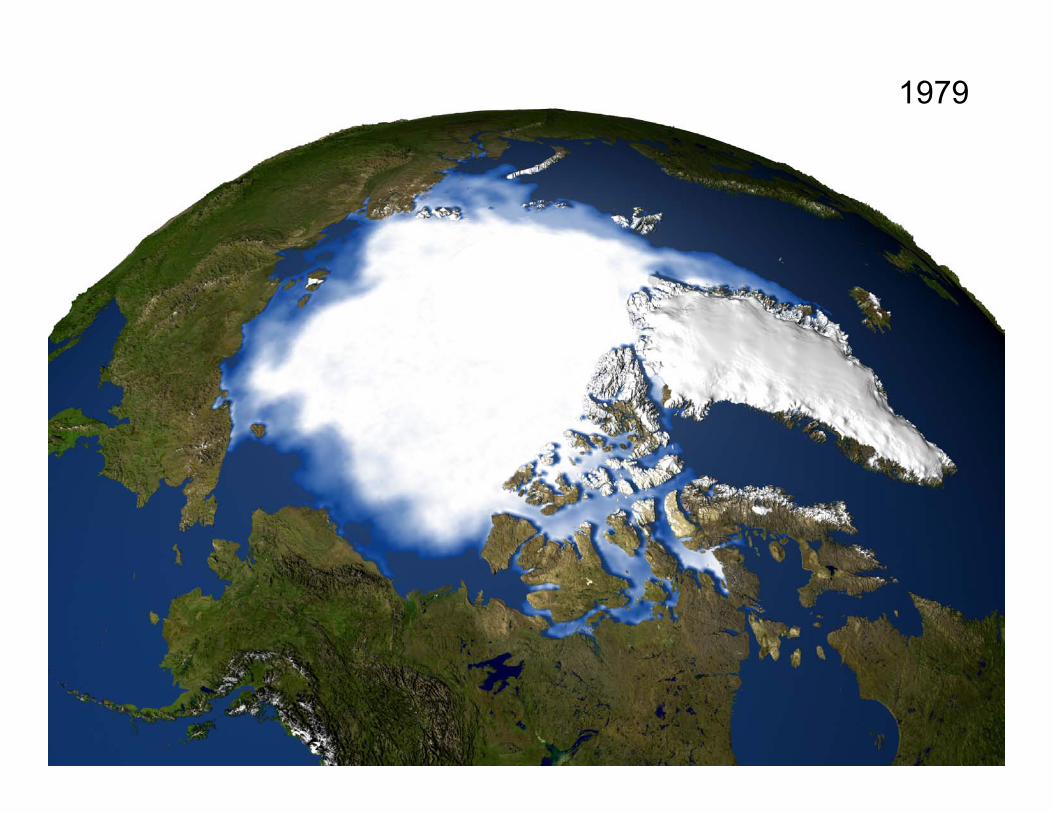
1979
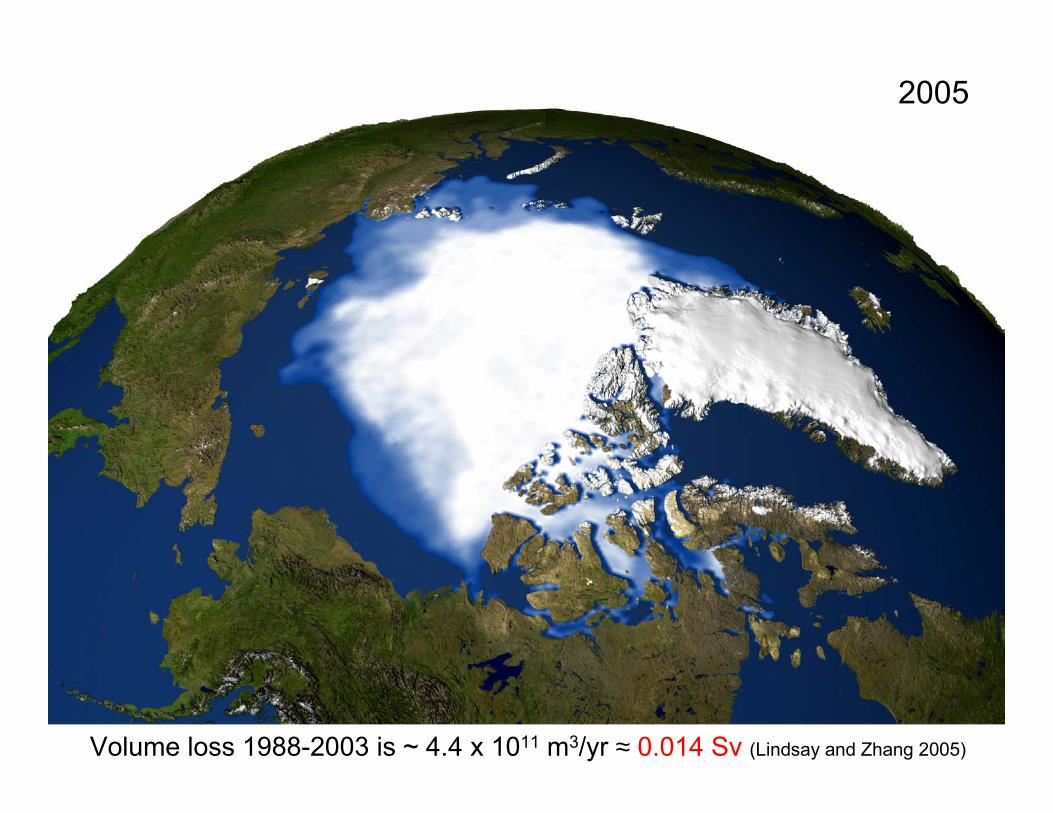
2005
Volume loss 1988-2003 is ~ 4.4 x 10¹¹ m3/yr ≈ 0.014 Sv (Lindsay and Zhang 2005)

Volume of GIS: 2.8 x 10¹⁵ m3
Time-scale 1000 years ⇒ 2.8 x 10¹² m3/yr ≈ 0.1 Sv
Meltwater from Greenland
Current volume loss:2.2 x 10¹¹ m3/yr ≈ 0.007 SvHas doubled over past decade
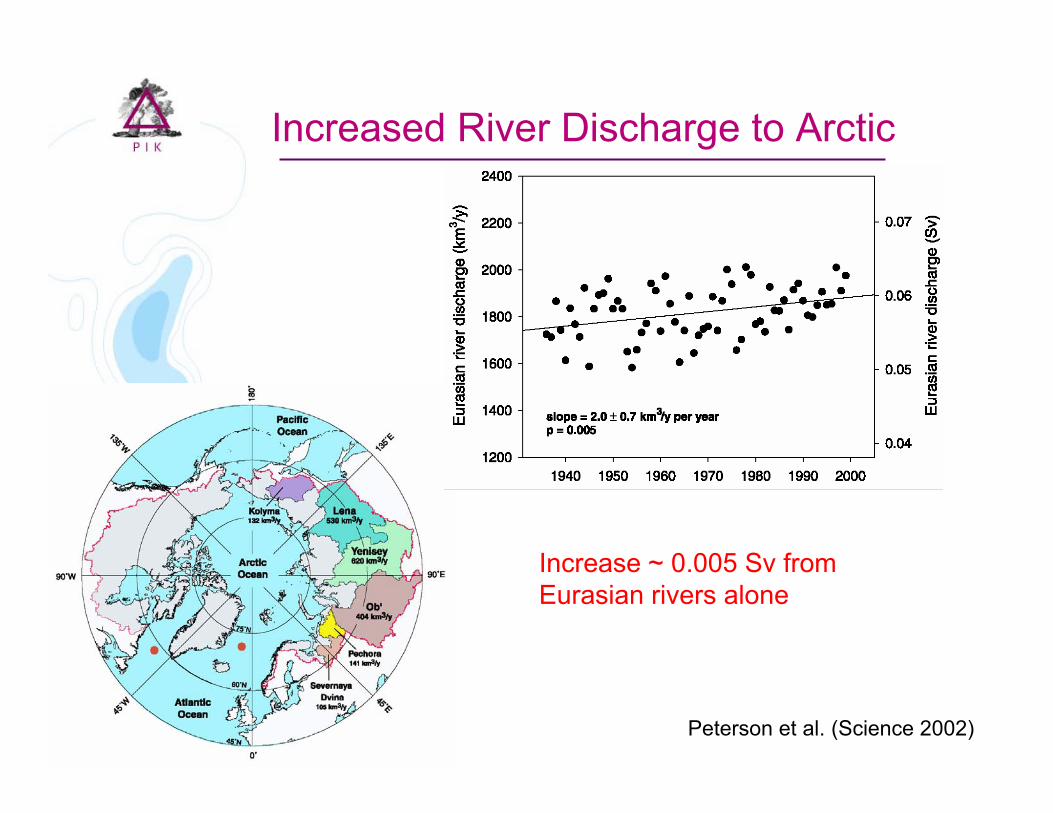
Increased River Discharge to Arctic
Peterson et al. (Science 2002)
Increase ~ 0.005 Sv from Eurasian rivers alone

Sea ice: 0.014 SvGreenland: 0.007 Sv
Eurasian rivers: 0.005 SvSum of these: 0.026 Sv
A Simple Sum
[Missing: precipitation increase,Canadian river runoff]
How much will this be after 3 or 5 ºC warming?

Observed Freshening Trend

Ice Sheet Threshold
equilibrium lineablation
accumulation
equilibrium lineablation
accumulation
smaller ice sheet
present ice sheet
Ice sheet – elevation feedback

Ice sheet response time “is of the order of centuries, not millennia”.Hansen (2005)
Volume: 2.8x10¹⁵ m3 = 7 meters of sea level
Threshold for melting: ~ 3 ºC warming
Greenland Meltdown?

Jan. 30,2002
Scambos,NSIDC
20 km
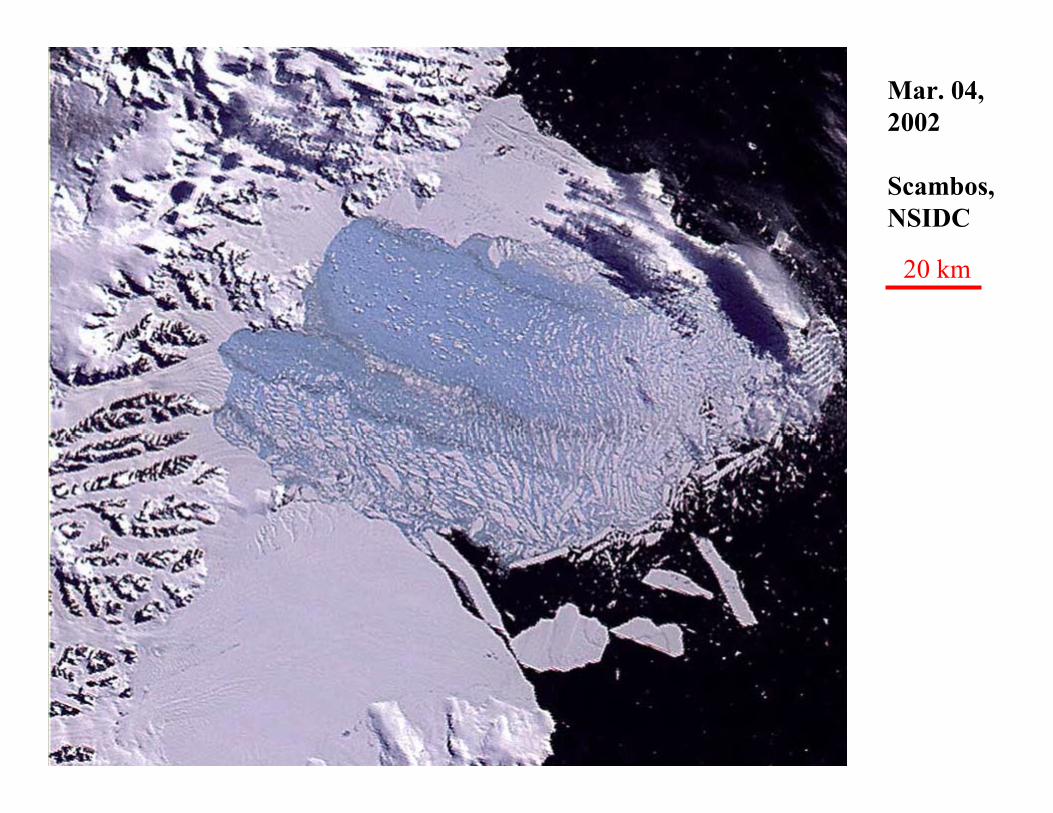
Mar. 04,2002
Scambos,NSIDC
20 km

Archer (2006)
Past Sea Level vs. Temperature

Storm Surge Risk in New York
Today: once in 100 yearsAfter 1 m sea level rise: every 3-4 years
Rosenzweig and Solecki, 2001

Based on Schellnhuber (2002)
Amazonrainforest
Sahara / Sahel
Boreal forest / tundraBoreal forest / tundra
Great plains
Arctic sea iceArctic sea ice
ENSOsource region
West AntarcticIce Sheet
Methane hydrates
Methanehydrates
Methane
DMS production and cloud albedo
NAO
NADWformation
AABWformation
Atlanticthermohaline
circulation
Greenland Ice Sheet
Acronyms:ENSO = El Nino Southern OscillationNAO = North Atlantic Oscillation
NADW = North Atlantic Deep WaterAABW = Antarctic Bottom Water
SE Asianforest
IndianMonsoon
West AfricanMonsoon
Map of Potential Tipping Points
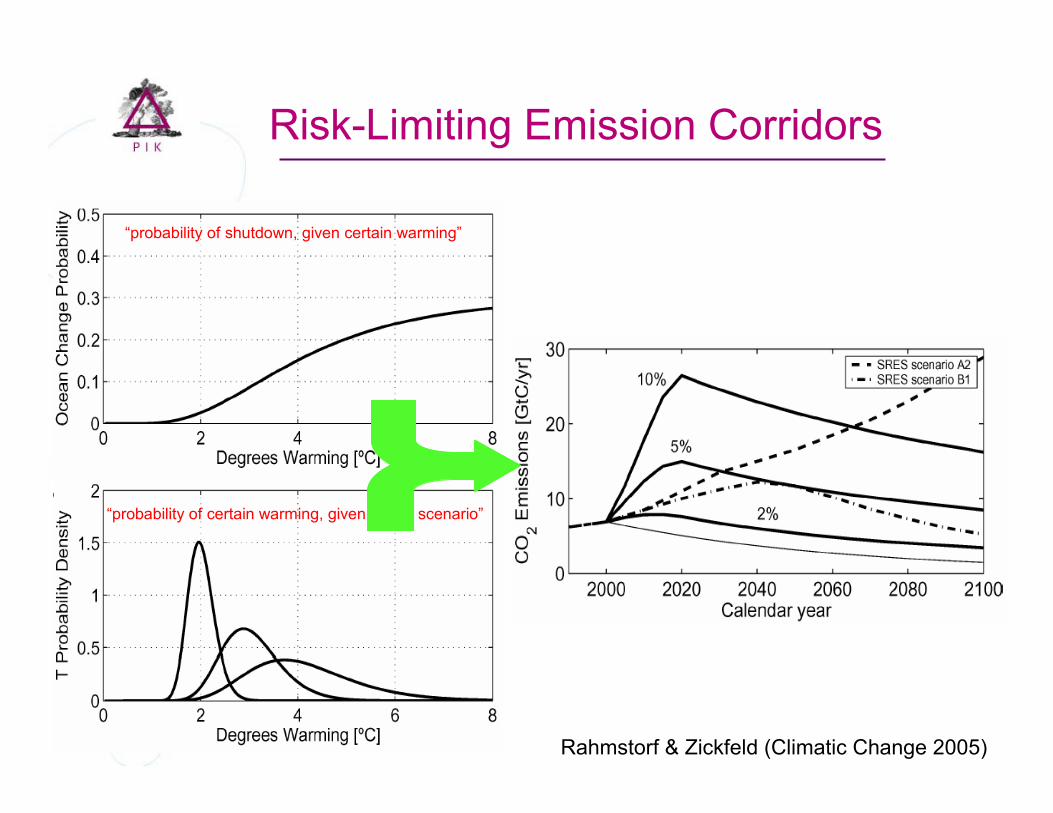
Risk-Limiting Emission Corridors
Rahmstorf & Zickfeld (Climatic Change 2005)
“probability of shutdown, given certain warming”
“probability of certain warming, given a CO2 scenario”
Science and Policy Implications
Probability of crossing critical thresholds for major qualitative changes is not negligible
Risk assessment approach is needed!
Many would consider a 5% chance of triggering high-impact tipping points “dangerous interference”
“Optimal emissions” based on smooth damage functions are questionable
Policy goal: minimise risk under uncertainty