crombie, donald stuart (1983) the physiology of the
TRANSCRIPT

Glasgow Theses Service http://theses.gla.ac.uk/
Crombie, Donald Stuart (1983) The physiology of the cavitation of xylem sap. PhD thesis. http://theses.gla.ac.uk/3475/ Copyright and moral rights for this thesis are retained by the author A copy can be downloaded for personal non-commercial research or study, without prior permission or charge This thesis cannot be reproduced or quoted extensively from without first obtaining permission in writing from the Author The content must not be changed in any way or sold commercially in any format or medium without the formal permission of the Author When referring to this work, full bibliographic details including the author, title, awarding institution and date of the thesis must be given
The Physiology of the Cavitation of Xylem Sap
by
Donald Stuart Crombie
A Thesis Submitted to the Faculty of Science,
the University of Glasgow
for the degree of
Doctor of Philosophy
February 1983

i
Acknowledgements
The work described in this thesis was performed In the Department of
Botany at the University of Glasgow. I am grateful to Professor M.B. Wilkins
for making available the facilities for the research. I am also grateful
for the guidance and encouragement of Professor J.A. Milburn (now in Australia)
throughout this project and of Dr. M.F. Hipkins in the later stages of the
project and particularly during the preparation of this thesis. The award of
a University of Glasgow Post-graduate Scholarship for the period of this work
is gratefully acknowledged. I would also like to thank:-
Mr. Alex Anderson, Mr. Noel Hynes, Mr. J. Muckersie and Mr. A. Campbell
for their expert technical assistance in the construction of
essential equipment for this work.
Professor J.R. Hillman and Dr. A.M.M. Berrie for helpful suggestions
and discussions.
Mr. T.N. Tait for assistance with photography and Ms J. Adamson for
electron micrographs.
The unfailing assistance of other members of the technical and office
staffs of the Department, especially Mrs. 1. Durant, Mr. J.
McMurray and Mrs. Anne Inglis.
Finally my thanks to Miss M.G. Cuthill for her patience and skill in
typing this thesis.
Dedication
To Peta who got me to Britain and to my parents who encouraged me to stay.
Abbreviations
Symbols
J 1
Abbreviations, Symbols and Units
A
OW
FW
gs
K
K'
I
P
liP
Q
RWC
RWC'
TW
t~
Vi
Ve
n
e
p
a
a'
'¥
'¥l
'¥ p
'¥ , p
'¥ s
Area
Dry weight
Fresh weight
stomatal conductance
relative conductivity
Permeability of shoots, approximately equal to K.A
length
balance pressure
pressure difference
flux
Relative water content
Apoplastic water fraction
Turgid weight
Half time
Volume taken up
Volume expressed
viscosity
contact angle
dens ity
surface tension
conductivity
water potential
leaf water potential
turgor potential
water potential at incipient
osmotic potential
plasmolys is

Units.
'¥ 0
s
'¥ x
i i. 1
osmotic potential at full turgor
xylem water potential
Systeme International (SI) units are used in this thesis except for
i) angles, which are given in degrees,
ii) time, which is in units of seconds, minutes and hours.
and iii) As an aid to comprehension volumes are sometimes given in non-SI units
3 3 -3 3. -3 3 of dm (1 dm = 10 m) or htres (1 litre = 10 m).
Where the figure axes include a multiplier this applies to the numerical
value entered in the figure and not to the units.
iv
Summary
Four aspects of the physiology of the cavitation of xylem sap were
studied.
i) The relationship between cavi tation and clicks detected by the acoustic
technique.
Further evidence that clicks detected using the acoustic technique
were the result of cavitation was obtained. Experiments with Acer showed
that the appearance of gas in xylem conduits was associated with clicks.
Experiments with Rhododendron showed that the production of clicks was dependent
on sap tension and not on cell turgor. On the basis of these experiments
and preceding reports in the literature clicks must now be regarded as
almost certainly being caused by cavitation.
ii) The effect of cavitation on pressure chamber measurements of water potential.
Experiments showed that cavitation di d not cause errors in pres sure
chamber measurements of water potent ial of Rhododendron leaves but was a
possible cause of error when using samples with a relatively large xylem
VOlume, for example Rhododendron shoots. The pres sure chamber could be
us ed to asses s sap tensions in cavitating leaves.
Acoustically detected cavitation was found to occur at characteri stic
sap tensions in eight species of herbs, shrubs and trees. In general
cavitation occurred at lower sap tensions in herbs than in trees (0 - 1 MPa
and> 1 MPa respectively). Acoustically detectable cavitation was
complete by sap tensions of < 3.5 MPa in all species except Fraxinus
excels ior.
iii) The factors determining the sap tension at which cavitation occurs.
The pressure required for gas to penetrate wet pit membranes in
Rhododendron stems was very close to the sap tensions causing cavitation
in Rhododendron leaves (1 - 3.0 MPa). The pressure at which gas penetrated
the p it membranes appeared to be determined by the surface tension of the

v
liquid in the pores of the pit membranes. It is propo sed that
differences in the size of the pores of the pit membrane are the cause
of the differences in sap tension at which cavitation occurs in different
species.
iv) The effect of cavitation on the flow of water in the xylem.
The permeability of Rhododendron shoots and stem segment shad
decreased almost to zero by the sap tensions at which the last clicks
\ere detected l:y the acoustic technique. Slower equilibration of wa.ter
potential s amongst leaves on shoots and a de creas e in the proport ion of
the xylem carrying sap as sap ten sions increase d also indicated that the
flow of water in the xylem had l::een disrupted. However cavitation
occurred progressively over a range of sap tensions. Sap tensions of
2 MPa, while reducing stem permeabilit y by 30-50%, failed to affect
measurably the supply of water to the leaves of Rhododendron plants.
This suggests considerable redmdancy in the supply of xylem conduits
in this species.

Contents
Page
Acknowledgements i
Dedication i
Abbreviations, Symbols and Units ii
Swnrnary iv
Chapter 1. Introduction 1-16
1.1. General introduction 1
1.2. The cohesion theory 2
1.3. Water potential and sap tension 3
1.4. Sap tension and xylem sap turgor potential 4
1.5. Exclusion of air from xylem conduits 4
1.5.1. The cell wall 4
1.5.2. The pit membrane 5
1.6. Gas phase formation in liquids 6
1.6.1. Bubble formation de novo 7
1.6.2. Bubble expansion from pre-existing nuclei 8
1.7. Observations of cavitation in xylem 9
1.8. The effect of cavitation on sap transport 10
1.8.1. Relative conductivity, K 10
1.8.2. Conductivity, 0 11
1.9. Removal of gas from embolised conduits 12
1.10. Sap tension and xylem anatomy 13
1.11. The aims of the project 15
Chapter 2. Materials and Methods 17-43
2.1. Plant material
2.1.1. Collection and hydration of samples 18

Chapter 3.
2.2. The acoustic technique for the detection of cavitation
2.2.1: Initial experiments
2.2.2. An improved acoustic apparatus
2.2.3. Conducting an acoustic experiment
2.2.4. Artifacts in acoustic experiments
2.3. Measurement of water potentials
2.3.1. Thermocouple psychrometry
2.3.2. Freezing point osmometry and refractometry of pith sap
2.3.3. The pressure chamber
2.4. Relative water content (RWC)
2.5. Sap flow in the xylem
2.5.1. Sap flow in stem segments
2.5.2. Potometric measurement of the effect of cavitation on sap transport
2.5.3. The effect of cavitation on sap transport in intact plants
2.6. Gas penetration of pit membranes
2.6.1. Gas permeability of stems
2.6.2. Expression of sap from xylem conduits
2.7. Determination of conduit length
2.8. Determination of sap flow paths
2.9. Xylem anatomy
2.10. Computation of results
Cavitation and Sap Tension
3.1. Introduction
3.2. The acoustic technique
Page
18
19
20
22
24
26
26
27
28
29
30
30
34
36
37
38
40
41
42
43
43
44-113
44
45
3.2.1. The detection of a 'click' by the 45 acoustic detector
3.2.2. The pattern of click frequency against time 46
3.2.3. Response of click frequency to changes 47 in transpiration rate

3.2.4. Click pattern and click number
3.2.5. Clicks detected at different points in a sample
3.2.6. The role of temperature during acoustic experiments
3.2.7. Discussion of sections 3.2.1.-3.2.6.
3.2.8. Observation of gas arising in xylem conduits during acoustic experiments
3.3. Determination of sap tension in leaves during acoustic experiments
3. 3.1. Introduction
3.3.2. The relation of balance pressure to RWC
3.3.3. Other methods of obtaining the relationship between balance pressure and RWC
3. 3.4. Discussion
Page
48
49
50
51
59
59
60
64
3.4. The effect of cavitation on pressure chamber 67 measurements of sap tension and leaf water potential
3.4.1. Introduction
3.4.2. The effect of cavitation on balance pressure of shoots
3.4.3. The effect of cavitation on pressure chamber measurements of ~l
3.4.4. Pressure-volume (P-V) curve analysis of the relation of balance pressure to RWC
3.5. Click frequency and sap tension
3.5.1. Introduction
3.5.2. Direct measurement of sap tension in cavitating leaves
3.5.3. Indirect measurement of sap tension in cavitating leaves
67
67
75
79
84
84
84
86
3.5.4. Cavitation during controlled development 94 of sap tension
3.6. Recovery from cavitation
3.6.1. Introduction
3.6.2. Recovery of clicks in Rhododendron by rehydration
3.6.3. Discussion
101
101
103
107

Page
3.7. Summary of chapter 3. 112
Chapter 4. Cavitation and sap transport 114-144
4.1. Introduction 114
4.2. The vascular anatomy of Rhododendron and Ricinus
4.3. The effects of cavitation on the paths of sap flow 117
4.4. The effect of cavitation on sap flow in stem 120 segments
4.4.1. Introduction 120
4.4.2. The electrical analogue and the flow of 121 water in stem segments
4.4.3. Changes in Q during experiments 122
4.4.4. The effect of cavitation on relative 124 conductivity (K)
4.4.5. Introduction of emboli into xylem by 127 injection of gas
4.4.6. Discussion 128
4.5. Cavitation and the uptake of water by shoots 130
4.6.
4.7.
4.5.1. Introduction
4.5.2. The effect of cavitation on the uptake of water by Rhododendron shoots
4.5.3. Artifacts in potometer experiments
4.5.4. Discussion
Cavitation and the maintenance of plant water status
4.6.l. Introduction
4.6.2. '¥ and g in uncavitated and cavitated RAododenaron plants
4.6.3. Permeability of stems cut from stressed whole plants
4.6.4. Discussion
Summary of chapter 4
130
131
132
138
140
140
140
142
142
144

Page
Chapter 5. Exclusion of gas fronl conduits by pit membranes 145-156
5.1. Introduction 145
5.2. First passage of gas through stems 146
5.3. Permeability of stems to gas as an indicator of 146 the pressure required to displace sap from the pores of pit membranes
5.3.1. Introduction 146
5.3.2. Permeability of Rhododendron stems to gas 147
5.3.3. Discussion 148
5.4. Expression of sap from stems by gas under pressure 149
5.4.1. Introduction
5.4.2. The pressure at which sap is expressed from stems
5.4.3. Discussion
5.5. Summary of chapter 5
149
150
154
156
Chapter 6. General Discussion 157-164
Bibliography
Appendix I. Construction, calibration and operation of the psychrometer sample chambers
A.I.I. Chamber construction
A.I.2. Calibration and operation
Appendix II. The acoustic detector
Errata
165
Al
Al
A3
A6

Chapter 1. Introduction
1.1. General introduction
Our present concepts of the movement of water through plants are based
on the cohesion theory proposed by Dixon and Joly (1894). Central to the
cohesion theory is the concept that xylem sap in plants must be able to
sustain large negative pressures (tensions) without the formation of a gas
phase (cavitation). The ability of sap to maintain these tensions depends
on the cohesive forces within the liquid and the adhesive forces between the
liquid and the walls of the xylem conduits in which it is contained.
The cohesion theory is now generally accepted as being correct in its
descriptions of the process of xylem sap transport. HowE-ver, the ability
of xylem sap to withstand the tensions required by the cohesion theory to
move water at the rates required by plants has not yet been demonstrated
with certainty.
In vitro experiments to determine cohesive limits in water have been
subject to many sources of error as well as differing interpretations.
Observations of sap movement in plants indicate that xylem conduits quite
often cease to conduct sap as they age. High sap tensions which exceed
the cohesive limits of the sap and which occur in the later part of the
summer are often held responsible for this.
This project was undertaken to determine the limits of sustainable
sap tension and to assess the importance of cavitation on the ability of
the xylem to transport water. The deve lopment of the pressure chamber
technique for determination of sap tension (Scholander et ~. , 1964 ,1965) and of
the acoustic technique for detection of cavitation in sap (!vii lburn and
Johnson, 1966) have made this study possible.

1.2. The cohesion theory
Water movement in plants appears to be determined by physical rather
than biological processes. For instance, Hales (1738) observed that the
amount of water evaporated by a potted plant was dependent on the brightness
of the sunlight reaching the plant. Strasburger (1891) showed, by using
poisons or heat to kill the living tissues of shoots, that the presence of
living cells was not necessary for transpiration to occur.
These and other observations were drawn on in the development of the
cohesion theory of sap ascent (Dixon and Joly, 1894; Askenasy, 1895; Dixon,
1914). The cohesion theory describes water movement through plants as
being a physical process dependent on inputs of energy from the environment
of the plant.
The cohesion theory is based on three tenets. They are:
a) Tension in the xylem sap is created by evaporation of water from the small
capillaries of cell walls, mainly in the leaves. This tension is trans-
mitted through the liquid of the xylem sap and causes the movement of
water from the soil to the leaves. In consequence, water moves along a
gradient of potential energy (sect. 1.3) from the soil where water is
present at higher potential.
b) Water in the xylem is stable when under hydrostatic tension whether or not
the water contains dissolved gases.
c) The cellular structure of the xylem protects sap columns under tension from
the entrance of gas which would destabilise the columns.
The cohesion theory quickly gained wide acceptance and is still considered
to be an accurate description of the means by which water moves in plants.
The main arguments against the cohesion theory concern the stability of
the sap columns under tension. These arguments are discussed below.

3
1.3. Water potential and sap tension
Dixon (1914) recognised that water moves through plants from a region
of greater potential (in the soil) to one of lower potential (the air).
In this respect water movement obeys the second law of thermodynamics.
The chemical potential of water at any point in the soil, plant or air
can be described in terms of free energy. In plant water relations the free
energy is expressed as water potential, which has units of pressure and is
obtained by dividing the free energy of water by its partial molal volume.
Total water potential at any point is the sum of component water
potentials of which the osmotic potential (~ ), and the turgor potential (~ ) s p
are usually the most important (Boyer, 1967). The component potentials due
to gravity, matrix adsorption and frictive losses are usually omitted
(Passioura, 1980; Richter, 1973) as they are small relative to ~ and ~ or p s
are difficult to measure.
Water potential (~) is therefore expressed as (Boyer, 1967)
Eqn. 1. ~ + 'l' s P
As xylem sap ~ is usually near zero (e.g. Boyer, 1967) the xylem 'l' is in s p
many cases near to the water potential at that point.
The minimum ~ attainable is that of the driest part of the environment
in which the plant lives, usually the air. The water potential of the air
falls quite rapidly with falling humidity, for instance being -94 MPa at 50%
relative humidity. The water potential occurring at any point in a plant wi 11
lie between that of the soil and the air between which the plant forms a
connection (Lange et ~., 1976).
Transpiration, soil 'l' and water flow path resistance determine sap 'l' under
steady state conditions (Richter, 1973). Sap ~ as low as -16 MPa have been p
reported for a desert plant and xylem 'l' of -4 to -7 IvlPa are not uncommon p
( Ri ch t e r, 19 76) . Typical woody plants of mesic sites may exhibit xylem sap 'l' p
of between -1 and - 3 MPa.

1. 4. Sap tension and xylem sap turgor potential
The xylem sap turgor potential, ~ , is the pressure within the sap. p
When less than the vapour pressure of the sap it can be likened to the tension
in a rope with the sap columns of the xylem being the 'rope'. As much of the
following discussion deals specifically with xylem sap ~ in its relation to p
cohesive or adhesive failure in the sap (breaking of the 'rope') xylem ~ , p
usually a negative quantity, will be replaced by the term 'sap tension', a
positive term defined as sap tension -[(~p)sap + atmospheric pressure]
= -[(0/ ) + 0.101 MPa] p sap
The correction for atmospheric pressure is necessary as the reference
state for determination of 0/ is pure water at atmospheric pressure.
1.5. Exclusion of air from xylem conduits
1.5.1. The cell wall
Xylem sap can remain in tension as only the liquid phase exists
in the conduit. At all except the very lowest sap tensions any bubble large
enough to survive immediate collapse under surface tension will expand and
rapidly occupy the entire conduit, rendering it non-conducting. Dixon and
Joly (1894) recognised the importance of the xylem structure in preventing
such a gas phase entering a conduit.
The walls of plant cells, including those of the xylem conduits, are
porous, consisting of variously arranged microfibrils with lignins, pectins
and hemicelluloses between them (Chafe, 1970; Berlyn, 1969). The remaining
spaces between the microfibrils form capillaries with radii of about 5 nm
(Preston, 1952; Nobel, 1970). Capillarity will maintain a meniscus in pores
of this size at pressure differentials of up to 29 MPa and so prevent gas
peJ~etration following expulsion of water held in the pores by capillarity.
As the lowest ~ recorded in living plants is about -16 MPa, gas entry through
cell walls by withdrawal of water from cell wall capillaries is unlikely (Richter, 1976).
Electron microscopy has shown deposits of amorphous materials on cell
walls bordering xylem conduits. These deposits would further reduce pore

5
size and increase the sap tension required to pull meniscii from the cell
walls (Schmid and Machado, 1968).
Gas may sometimes enter xylem conduits through leaf abscision scars or
wounds. Sap conduction in neighbouring conduits is then threatened by this
gas unless the gas is prevented from entering undamaged conduits. Dixon
and Joly (1894) recognised the role of the pit membranes in preventing the spread
of gas from one conduit to the next. They proposed that sap menisci were
retained in the pores of the pit membrane by capillarity.
1.5.2. The pit membrane
Electron micrographs of intervascular pit membranes of Eucalyptus regnans
(Cronshaw, 1960) and selected legumes (Schmid and Machado, 1968) fail to reveal
pores in the membrane at magnification of xlO S This implies a pore size of
:'9 10 m or less in these membranes. Such a pore would retain a meniscus against
pressure differentials of ISO MPa, far in excess of the sap tensions likely in
a living plant. Again, amorphous deposits and the 'warty layer' have been
found on intervascular pit membranes and will further reduce pore sizes
(Cronshaw, 1960; Schmid and Machado, 1968).
Evidence from particulate filtration experiments also suggests very small
pit membrane pore sizes in angiosperms. Nemec (1975) found that myelin fibres
300 nm in diameter blocked pit membranes in citrus xylem. Van Allen and
Turner (1975) reported variations in the effectiveness of dextrans in causing
blockages of vascular pit membranes of several herbaceous species. They
interpretated their findings as evidence of species related differences in
pit membrane pore sizes. Species with larger pit membrane pores would suffer
gas entry at lower sap tensions than those with smaller pores.
The effectiveness of the simple angiosperm pi t- membrane in holding menis ci
has been noted by direct observation of bubbles in soft herbs (see review by
Crafts et ~., 1949). The multiple cut experiments of Greenidge (19SSb),

6
Postlethwaite and Rodgers (1958) and Mackay and Weatherly (1973) have all
shown that water transport continued in conduits in close proximity to those
embolised by the cuts. Pits between the embolised and non-embolised conduits
were therefore effective in preventing air entry to non-embolised conduits at
pressure differentials of less than 2.6 ~Wa (Greenidge, 1955a). Gas appeared
in the xylem of the deciduous hardwoods of the Greenidge (1955a) study at sap
tensions in excess of 2.5 MPa, apparently by cavitation of sap in previously
non-embolised conduits. However, Greenidge (1955a) noted that gas did not
appear randomly over the xylem but was concentrated in discrete areas which
subsequently expanded as sap tensions rose. He offered no explanation as to
why gas should appear in localised areas rather than uniformly over the xylem.
Gymnosperms possess a highly specialized type of pit, the bordered pit,
in which a dense, apparently non-pervious torvs is surrounded by a relatively
large porous margo (of pore diameter about 0.1 ~m in Abies (Petty and Puritch,
1970) The pores of the margo are therefore too large to prevent gas entry
at sap tensions greater than 1 to 1.5 MPa. Before the menisci are dislodged
from the membrane pores the torus is moved sufficiently to block the pit
annulus and so prevent gas entry (Gregory and Petty, 1973; Chapman ~ al.,
1977). However, Bailey (1916) was able to blow air through blocks of conifer
wood by using pressures of 0.3 - 1.4 MPa. This result may be evidence of
some faulty toral sealing of the bordered pit.
1.6. Gas phase formation in liquids
A gas phase may arise within sap which is under tension. The gas phase
will expand to occupy the entire conduit if the pressure of the xylem sap is
much less than that of the vapour phase of the gas. This will usually be at
sap pressures of 0.01 MPa or less.
termed cavitation.
Gas phase formation in this manner is
Cavitation in marine and hydraulic systems, such as turbines and

7
propellers, is a common phenomenon and occurs at fluid tensions of 1 MPa or
less (Hammitt, 1980).
Cavitation is also responsible for causing the bends in divers. The
bends occur when nitrogen gas, dissolved in body fluids when diving, comes
out of solution and forms bubbles when pressure is released upon surfacing.
The bends may occur when nitrogen has been forced into solution at pressures
of as Ii ttle as 0.2 HPa above atmospheric (Walder ~ ~., 1968).
Cavitation in engineering and animal systems is therefore known to occur
at fluid tensions small by comparison with those found in plant xylem sap.
How do plants escape cavitation of their sap at tensions greatly in excess of
those at which cavitation occurs in other systems?
Cavitation may occur as a result of bubble formation de novo or from the
expansion of a bubble from a small, pre-existing nucleus.
1.6.1. Bubble formation de novo
Bubbles forming de novo may be the result of failure either of cohesive
forces between the molecules of the sap or of the adhesive forces of the bonds
between the molecules of the sap and those of the xylem conduit in which the
sap is contained.
Cohesive failure is an highly unlikely occurrence at the sap tensions
likely in plants (Greenidge, 1952; Oertli, 1971) as water has a very high
capacity for hydrogen bond formation (Nobel, 1970). Bubbles formed de novo
at sap tensions less than about 10 MPa are very likely to collapse immediately
under pressures developed by surface tension (Oertli, 1971).
Experimental determinations of cohesive limits in water are difficult
because of the difficulty of removing gas nuclei from the apparatus. Hayward
(1964), using a modified Berthelot tube, obtained maximum liquid tensions of
4 MPa. However, Briggs (1955) used a centrifugal method to obtain liquid
tensions of 20 to 30 MPa at temperatures found in biological systems. The
difference between the results obtained by Hayward and by Briggs was probably
8
due to incomplete removal of nucleation sites for bubble formation in the
Berthelot tubes used by Hayward. As sap tensions in plants from mesic sites
may be 2 to 4 MPa and those from extreme xeric sites may be 16 MPa the results
of Briggs (1955) would indicate that cohesive failure is unlikely to be the
cause of cavitation in plants.
As cell walls are formed fully wetted by precipitation from solution it
is extremely unlikely that xylem conduit walls will include nuclei from which
bubbles may expand. Also, the major constituents of cell walls, celluloses
and lignin, have structures with a high capacity for hydrogen bonding with
water so that adhesive failure is unlikely at low sap tensions (Greenidge, 1952).
However, adhesive failure may occur at low sap tensions by shearing as sap
moves over the solid cell wall surfaces (Hayward, 1967).
1.6.2. Bubble expansion from pre-existing nuclei
A small bubble may be saved from immediate collapse due to surface tension
if it is protected in a crevice (Harvey ~~., 1944). The bubble is then
stable and may survive until sap tension exceeds the surface tension restraining
the bubble in the crevice at which time the bubble will expand and cavitate
the condui t. Even short periods of high sap tension, e.g. caused by sonic
vibrations, may act cumulatively to expand a bubble sufficiently to overcome
surface tension and continue its expansion (Harvey et al., 1944).
the basis of ultrasonic degassing of water.
This is
As the formation of small bubbles is more likely than the formation of
large ones (Oertli, 1971) the presence of suitable crevices may make cavitation
more likely. Bubbles may also be carried into the xylem in crevices in small
particles contaminating the xylem sap. Such particles are unlikely to enter
with the transpiration stream because of the filtering action of cell walls,
and particularly the endodermis, of the roots, and subsequently of the pit
membranes. Nuclei may however enter as contaminants in sap retreating from

9
damaged conduits, for instance as a result of wounding. These parti c1es
will only be effective in causing cavitation if they are small enough to pass
through the pit membranes and into undamaged conduits.
1.7. Observations of cavitation in xylem
Crafts et al. (1949) review experiments in which emboli were caused to
form in the xylem of water-stressed plants by jarring the stems. Observations
of gas in the xylem of trees were made by Haines (1935). The number of gas-
filled conduits apparently increased with increasing sap tension. His results
may have included conduits which had cavitated while being prepared for viewing
although he tested for this by injections of eosin dye. Uptake of dye
indicated that the xylem conduit contained either sap under tension or gas at
reduced pressure (and therefore present as the result of recent cavitation
such as might occur during preparations for viewing). No uptake of the dye
indicated that the conduit was full of air or water at atmospheric pressure
and therefore had presumably cavitated some time before. A similar line of
reasoning was used by Milburn and McLellan (tinpub) who used different coloured
particulate and non-particulate dyes to identify water and gas-filled conduits
in Ricinus.
Cary et~. (1968) and West and Gaff (1971) cited anomalies encountered
while making plant' water potential measurements as evidence that a gas phase
appeared in the xylem conduits at about 0.3, 2.7 and 2.0 MPa of sap tension in
tomato, corn and apple respectively.
The acoustic method (Milburn and Johnson, 1966) is claimed to detect the
vibrations produced when strain ~n the elastic walls of xylem conduits containing
sap under tension is released by the formation of a gas phase. This occurs at
sap tensions of about 1.0 MPa in leaves of Plantago (Milburn and McLaughlin, 1974)
and 0.7 MPa in Ricinus (Milburn, 1973b).
The experiments described above generally involved some degree of damage

10
to the xylem prior to observations being made. As a result air was admitted
to at least some of the xylem conduits. The possibility that the gas phase
releasing sap tension enters the conduit from outside, rather than arising
within the conduit, therefore cannot be discounted.
1.8. The effect of cavitation on sap transport
The movement of sap in the xylem in response to a pressure gradient is
usually described using some form of the van den Honert (1948) electrical
analogue. This analogy likens the flow of sap to an electrical current,
increasing with increasing pressure gradient (voltage) and decreasing with
increasing resistance to flow.
Heine (1971) recognises two terms describing the flow of sap or water
through the xylem. They are relative conductivity, K, and conductivity, 0.
Relative conductivity makes a minimum number of assumptions about the
structure and function of the xylem segment in question. The xylem is
modelled as a heterogeneous porous matrix and flow through it, as expressed
by the relative conductivity,~~ derived from measurements of sap flux
resulting from an applied pressure gradient applied to the segment.
Conductivity, 0, assumes that flow in xylem can be described by the same
equations as flow in pipes. Measurement of 0 requires a knowledge of xylem
dimensions and, for a complete description of flow, the flux in each conduit.
1.8.1. Relative conductivity, K
Heine (1971) defines relative conductivity, K, as
Eqn. 2. K = Q.l.n ~P.A
in which Q = volume of fluid passing a plane at right
angles to the direction of flow per unit time.
1 the length of xylem over which the flux, Q,
occurs.
n viscosity of the fluid.
~P the pressure difference driving flow.
A the cross-sectional area of the xylem.

11
If this model adequately describes flow in the xylem, the fluid flux Q will
be linearly proportional to A, ~P and K but inversely proportional to 1.
Cavitation will result in fewer conduits in the xylem cross-section being
available for sap transport. As the total xylem area remains the same as
before cavitation, the relative conductivity of the xylem will decrease
although the ability of remaining, non-cavitated conduits to conduct may also
remain the same.
Measurement of K therefore provides a quantitative measure of the ability
of the xylem sample, as a whole, to transport water or sap. At the same time
a minimum of knowledge of the structure of the xylem in the sample is required
so that K can be calculated from simply made measurements of Q, A, 1 and ~P.
Relative conductivity and permeability
Permeability is sometimes used as a synonym for relative conductivity
(Booker, 1977).
1.S.2. Conductivity, cr
The quantity cr is defined by Heine (1971) as
Eqn. 3· = v.l F
in whi ch 1 and P are as for the calculation of K.
v = the velocity of the sap moving in the xylem.
This expression for cr applies only to xylem made up of one or more conduits
of the same dimensions as, by application of the Poiseuille equation for flow
in pipes, v is proportional to the fourth power of the pipe radius. There-
fore conduits of different radii will have very different (J values.
Conductivity can also be defined (Heine, 1971) in a form which describes
fluid movement in a manner similar to that for K but substituting the area of
vessel luminae, a, for the total xylem area A. The equation has the form
Eqn. 4. (J = ~ 6P.a

12
Again this equation must be modified for variation in conduit radii.
By measuring all conduits in each class of lumen dimension and by
calculation of a before and after cavitation it may be possible to learn more
of the effects of cavitation on sap transport in conduits of different
dimensions.
In practice it is tedious to measure all dimensions of all conduits in
a xylem section and to sort these into appropriate classes, and impossible to
establish any other than a maximum velocity for the sap. This maximal
velocity is very likely to be that in the conduits of greatest radius.
The value of measurements of a may be further reduced for studies of the
effect of cavitation on flow as there is evidence that, perhaps because of
the porosity or sculpturing of xylem conduit walls, sap flux in a single
conduit may not be simply related to the pressure driving flow (Giordano et
aI, 1978; Jeje and Zimmermann, 1979).
1.9. Removal of gas from embolised conduits
Embolism of the xylem conduits may harm a plant by restricting the ability
of the xylem to supply sufficient water for the plant's requirements. This
effect will be greatest when plant water demand is high. However, transient
water deficits are common in plants and may not result in permanent damage.
The midday minimum in ljI is a well known example of such a transient deficit
(e. g. Hinckley et al., 1975). Cavitation of xylem sap will tend to exaggerate
such phenomena but, unless flow is stopped completely or seriously impaired for
a long period, its effect will not be great. If cavitation occurs to such an adequately
extent that plant ljI cannot be maintained~restoration of conductive capacity by
refilling embolised conduits is necessary to avoid interruption to the plant's
functioning.
Bubbles In the xylem conduits will dissolve if the pressure in the bubble
is less than that exerted by hydrostatic pressure and surface tension together.
13
This will not occur if sap tension is high (Dickson and Elackman, 1938) and
will depend on the radius of the conduit containing the bubble and the
composition of the sap. If positive sap pressures occur, for instance through
root pressure, conditions may be suitable to force bubbles into solution.
Gravitational potentials may also be significant in taller plants in this
respect.
Direct visual observations of solvation of bubbles in the xylem of
Impatiens when water is made freely available have been made (Dickson and
Blackman, 1938). Crafts (1939) made similar observations of bubble collapse
in the xylem conduits of intact Ribes inerme when water stress was relieved
by rewatering. Interestingly, bubble collapse was most rapid in the narrower
conduits, possible confirmation that surface-tension-derived pressure on the
bubble is important in removal of emboli as this pressure is greatest in the
smaller conduits (Nobel, 1970).
1.10. Sap tension and xylem anatomy
Dixon (1914) recognised that the xylem is particularly suited to resist
collapse under the differential pressures occurring when the sap it contains
is under tension. The xylem is divided into a large number of small conduits
which often have heavy secondary thickening as spirals, rings or reticulate
networks on the inner surface.
The xylem of plants growing in xeric or mesic environment was compared
by Starr (1912). Specimens from a xeric environment generally had vessel
elements which were narrower, shorter and with thicker walls than those of
examples of the same species taken from a more mesic site. After examining
the xylem of a large number of species from different environments Carlquist
(1975) considered that the shorter, narrower and thicker-walled vessel
elements of plants from arid climes compared to those from wetter areas to be
an adaptation conferring tolerance of higher sap tensions on the desert plants.
Similarly he considered the shorter and narrower vessel elements of tree crowns
14
compared to those of the more basal parts to reflect the general increase in
sap tensions occurring from roots to leaves.
The apparent relationship between sap tension and vessel anatomy may be
coincidental though. Water-stress reduces the amount of photosynthate
available for wall development (Ooley, 1970; Smith, 1976) and turgor for
cell expansion (Jones and Turner, 1980; Sands and Correll, 1976). These
reductions can lead to shorter and narrower vessel element being formed.
Structural differences within plants also serve to minimise sap tensions
in the trunk and major branches during short periods of low leaf~. The
connection resistance of the petiole (e.g. Begg and Turner, 1970; Landsberg
et ~., 1976) which imposes a high sap tension gradient over a short distance
is probably due to a zone of reduced vessel diameters in the petiole (Larson and
Isebrands, 1978). A high petiolar resistance may act in series with laminal
resistances to water flow to effect a rapid reduction in guard cell water
potential when atmospheric humidity falls. This may result in a more sensltive
stomatal response to changes in evaporative demand (Tyree and Yianoulis, 1980).
Zones of constricted vessel diameter at branch points and lower xylem
permeabilities in the lower and lateral branches also serve to protect the
xylem of trunk and root from transitory high sap tensions and to determine
the distribution of water with the crown (Zimmermann, 1978) .
Considerable differences in wood anatomy occur between the gymnosperms
and the angiosperms, particularly the large porous deciduous trees, with which
they sometimes co-exist. These differences are related to the ecological
strategies for water transport in each of these groups. The deciduous trees
supply foliar water requirements through a relatively small number of long
vessels of large diameter (Zimmermam and Jeje, 1981). The large diameters
and long, uninterrupted lumina of these vessels allow high sap flow rates to
be achieved with low pressure gradients. However, the smaller number of
conduits leaves these trees susceptible to water stress if, by freezing,
15
disease or cavitation under high sap tension, these vessels are embolised.
The shorter, narrower tracheids of coni fers require greater pressure gradients
to achieve the same rates of flow as in the stems of the deciduous trees but
their greater number minimises the effect of embolism of some of them
(Zimmermann, 1974) . As a large proportion of the conducting vessels of the
deciduous trees are embolised by high sap tensions in summer (e.g. Greenidge,
19Ssa) or by freezing in winter (e.g. O'Malley, 1979) these trees must replace
their conducting vessels each spring at considerable metabolic cost (Zimmermann
and Brown, 1974). By contrast the xylem of conifers may remain active for
several years, minimising the metabolic cost of maintaining sap flow as only
part of the conductive capacity need be replaced each year. However, this
saving is achieved at the cost of higher resistances to sap flow and lower
crown water potentials or reduced rates of water transport.
1.11. The aims of the project
Reports of xylem sap cavitation occur with some frequency in the
literature, often indirectly as an aside to other work. The relation between
sap tension, xylem anatomy, sap cavitation and xylem sap flow has had little
study.
In view of the critical importance of the stability of xylem sap when
under tension to the cohesion theory and the ability of the plant to transport
water, the following research was undertaken to investigate the occurrence of
xylem sap cavitation and its effect on water transport in the plant.
This work is made possible by the development of the pressure chamber for
the rapid measurement of sap tension (Scholander ~ ~., 1964 ,1965) and of the
acoustic technique for the monitoring of cavitation in nearly intact xylem
(Milburn and Johnson, 1966).
These techniques have been used to seek answers to the following general
questions.
16
1) Are clicks detected by the acoustic technique actually due to cavitation
in the xylem? If so, at what sap tensions do they occur in different
species?
2) To what extent does cavitation affect the ability of the xylem to conduct
sap? Is the effect reversible upon supply of water at high water
potential?
3) Is the use of the pressure chamber for measuring sap tension affected by
cavi tat ion ? The pressure chamber technique is based on the assumption
that xylem sap is distributed similarly in a leaf or twig held at the
balance pressure in the pressure chamber and in the twig attached to the
plant. This may not be the case in cavitated material.
As mentioned earlier (section 1.4) a positive quantity, sap tension, which
is equal to the negative of xylem sap turgor will be used to describe the
stress to which the xylem sap is being subjected. The pressure chamber
provides a method of determining sap tension directly as ,at the balance
pressure) chamber gas pressure is equal to-~p of the sap before sampling
(section 2.1) (Scholander, 1964 ) . Balance pressure (P) is therefore equal
to -~ of the xylem sap and equal to sap tension plus atmospheric pressure. p
The acoustic technique is used to determine both the sap tensions at which
cavitation occurs and also to assess the extent to which embolism has progressed
or been reversed in samples used in other experiments.

11
Chapter 2. Materials and Methods
2.1. Plant material
Leaves, twigs or whole plants to be used for experiments were collected
from the field or grown in a glasshouse. The groups were designated as
field (F) or glasshouse (G) collections as appropriate.
Field collections: Samples were collected from the grounds of the Garscube
Estate, Bearsden, Glasgow. Samples from trees and shrubs were taken 0-3
metres above the ground and, as far as possible, from branches fully exposed
to the sun on the southern side of the plant.
Species from which field collections were made were Acer pseudoplatanus L. ,
Alnus glutinosa L., Fraxinus excelsior L., Larix decidua x kaempferi Mill.,
Plantago major L. and Rhododendron ponticum L.
Glasshouse collections: Plants were grown in 1:1:1 peat/soil/sand mixture in
free draining plastic pots or root bags of appropriate size and kept well
supplied with water.
Liquid fertilizer (Liquid Garden 'Plus', reI, Farnham, UK) was applied at
intervals.
With the exception of the Eucalyptus globulus Labill (L'Herit.) specimens
supplementary lighting was applied during the winter months. Mercury vapour
lamps (400W, 'KOLORLUX' MBFR/U, Atlas, UK) one metre above the glasshouse
bench were used.
Lycopersicum esculentum (cv, Moneymaker) Mill., Phaseolus vulgaris (cv,
Canadian Wonder) L., Plantago major L. and Ricinus communis L. were grown from
seed. Acer pseudoplatanus seedlings were bought from the Ben Reid Nurseries
Ltd., Aberdeen, UK and were 5-6 years old when used. Rhododendron ponticum
shrubs in 100 mm root bags were bought from Findlay-Clark Nurseries, in
February 1982 and used between June and July of the same year. Samples of
18
Eucalyptus globulus were taken from a 3m plant rooted in the floor of the
glasshouse. Samples were also collected from self-propagated Zebrina pumulus
L. vines growing on the floor of the glasshouse ..
2.1.1. Collection and hydration of samples
Samples were collected in the late afternoon when water potentials would
be expected to be recovering from the midday minimum. Leaves or twigs were
cut under water from the plant and recut to remove embolii. Leaves and twigs
were brought to full turgor ('hydrated') by standing overnight with the cut
surface in distilled water in an insulated box lined with wet paper towel.
Twigs too big to fit in the insulated box were enclosed in polyethylene bags
secured below the lowest leaves and the cut end of the stem supplied with
distilled water. Material was usually used within one day, and never kept
for more than two days before use.
Rehydration of material after periods of stress was by the same procedure
as described for the initial hydration of samples.
2.2. The Acoustic technique for the detection of cavitation
Cavitation was monitored as it occurred by the acoustic technique
(Milburn and Johnson, 1966; Milburn, 1973a). Vibrations, attributed to
the sudden release of wall tension due to the formation of a gas phase in a
xylem vessel and its expansion, are detected by a sensitive transducer coupled
to the xylem through a metal needle. If amplified and played through a loud
speaker each cavitation event produces a 'click' sound. Hereafter acoustically
detected cavitation events will be called 'clicks' for convenience.
The general procedure involved in conducting an experiment relating
cavitation to sap tension was to monitor click production using the acoustic
detector, and at intervals to note leaf weight (and from this and leaf dry
weight to obtain RWC). Clicks were then related to the sap tension at which
they occurred through a 'calibration' of sap tension against RWC (section 3.1)

19
compiled using leaves similar to those used for acoustic experiments.
The nature of the equipment available dictated that two methods be used
to measure weight changes during the study although treatment of the data so
compiled was the same.
2.2.1. Initial experiments
Initial experiments were conducted using equipment very similar to that
of Milburn (1973a,b) and Milburn and McLaughlin (1974). This consisted of a
magnetic microphone as the detecting transducer which was coupled to the xylem
by a steel or copper needle soldered to the armature. The signal produced by
the transducer was amplified by a battery-powered circuit which included an
adjustable band pass filter and variable gain. The amplified signal was
prepared for recording by a discriminator consisting of a trigger circuit
which, when tripped, lit an incandescent bulb. A photo-electric cell mounted
above the bulb produced an EMF which was recorded by a chart recorder.
The magnetic transduce,r and preamplifier housed with it was heavy (about
45 gms) and the shielded multicore cable connecting the preamplifier to the
main circuitry imposed a considerable resistance to flexing. As a result, it
was impossible to record changes in leaf weight of less than about 0.1 g when
weighing the leaf and transducer assembly together. Therefore the leaf had
-3 to be periodically removed from the transducer, weighed to 10 g on a sensitive
balance and replaced on the detector if small leaf weight changes were to be
measured.
This approach had several serious deficiencies. Clicks could not be
recorded while the leaf was being weighed, hampering attempts at quantification
of click production. Removing the leaf from the acoustic cabinet usually
meant a sharp reduction in transpiration so that a smooth decrease in water
content with time was probably not achieved. To minimize disruption to the
rate of water loss and to the xylem by repeated insertion of the coupling
needle, the leaf could only be weighed infrequently, in practice at intervals

20
of about fifteen minutes. Consequently, when calculating the sap tension
at which clicks occurred, errors involved in the production of a calibration
of sap tension against RWC were compounded by inaccurate knowledge of RWC of
the leaf on the probe at a given time.
The electronic equipment itself had serious deficiencies. Being battery
powered its gain did not remain constant as the batteries ran down.
Consequently, sensitivity declined gradually until the batteries were replaced,
itself an all too frequent occurrence. Although not seriously affecting
individual experiments this decline in sensitivity made comparisons of click
loudness and number between experiments impossible. The circuitry was also
prone to drift if used for long periods and would eventually require resetting
of the trimming potentiometers. The circuitry was especially unstable at the
high gains required when investigating cavitation in soft herbs.
Experiments conducted with this apparatus included the compilation of
cavitation profiles for Rhododendron ponticum, Eucalyptus globulus, Fraxinus
excelsior and incomplete experiments using Pelargonium zonale and Zebrina
pumulus made in 1979 and the early part of 1980.
2.2.2. An improved acoustic apparatus
A new apparatus was required which would satisfy the following require-
ments: a) Have a detector (transducer and coupler) which was light enough
and connected to the amplifier stages by sufficiently flexible wires to enable
-3 leaf weight changes of 10 g or less to be followed when the leaf and detector
were suspended from a balance during experiments.
b) Have a sufficient range of gain and discriminator settings to detect
clicks in soft species and to give maximum click frequencies less than that at
which clicks become difficult to separate on the recorded charts.
c) Have a facility for suppressing noise at low discriminator
threshold settings.
d) Preferably have a multiple channel design so that more than one
21
experiment may be run at a time.
The arrangement which was arrived at satisfies all these requirements. Its
design is sketched in figure 1 and the complete circuit described in appendix 1.
The heavy magnetic transducer of the Milburn apparatus has been replaced
by a much lighter (about 5g) detector made by glueing the coupling needle to
the stylus of a cheap ceramic record player pick-up cartridge (an X5H Stereo
cartridge (BSR, Warley, UK) was used). The preamplifier stage has been moved
to a metal case separate from the detector and connected to it by 40 gauge
(.122 mm) enamelled copper wire. The light detector supported from the balance
arm is now sufficiently free to follow changes of 10-3g in leaf weight. A
shielded multiflex cable leads from the preamplifier box to the main amplifier
in which the signal is led through the filter circuits and further amplified
before entering the discriminator dircuits. Any signals appearing simultan(see below)
eously on both channelsiwere cancelled against each other by an anticoincidence
circuit. Output connections before the anticoincidence circuit enabled the
reference and primary detector channels to be run as separate acoustic detection
devices, each with its own discriminator.
The arrangement was found to constitute an aerial for electromagnetic trans-
missions. Consequently at high sensitivity it could only be used inside a
Faraday cage. Fortunately the metal walls of the soundproofei box in which it
\~as housed formed such a cage. The incandescent lamp used to speed trans-
piration during experiments was shielded by a steel gauze, and metal parts of
the balance and the preamplifier box were also earthed through the Faraday cage.
The acoustic detectors must be isolated from external vibrations, not only
from the air as sound or draughts, but also through the bench. To this end
the acoustic detectors were housed in a double walled metal box with 50 mm of
fel t soundproofing between the walls. The box floor and door were of wood
overlaid with cotton wool. The box stood on layered piles of fibre matting and
soft foam plastic at each corner. The whole Was supported on its own table in
a quiet part of the laboratory.

7 !
~ , , ~ ~
-
~ I--.. 2A 3A 4A 8 2
~ -
5 --.... -- 6
~ v 2B 38 48
1~~ -
~ -~ -::~ I 4 •
Figure 1. Schematic diagram of the acoustic detector. A leaf was mounted on the transducer (lA) suspended from a balance (7) and transpiration accelerated by an incandescent lamp (8). Transducer output was amplified in preamplifier (x3600) (2A) and main amplifier (x8) (3A) stages and' clicks' selected by a threshold discriminator (4ft.). Outputs from the active channel (A) and an identical 'control' channel (8) were cancelled against each other in an anti-coincidence circuit (5) before 'clicks' were automatically recorded (6).

22
The detector was suspended by two lengths of stiff light wire hooked
together and passing through a 10mm hole in the cei ling of the cabinet to the
suspension point of a gravimetric balance weighing to 10-4g .
The electronics, except for the detectors, preamplifiers and the chart
recorders, were on a separate bench to minimize vibration and reduce electro-
magnetic interference. The second channel of the amplifiers was used as a
reference to detect background noises and cancel them from the output of the
detector carrying the leaf. A detector similar to the first was positioned
with its needle touching the wooden floor of the box for this purpose.
Stimulation of transpiration
Transpiration by leaves in the box was very slow unless speeded by use of
an incandescent lamp. Tungsten filament lamps of 25 to 150 Watt output were
used as appropriate to give experimental durations of 1-2 hours. These lamps
gave a radiation load at the leaf surface of 30-150 W m~2 (measured by
Kipp Solarimeter, Kipp and Zonen Ltd., Delft, Holland).
2.2.3. Conducting an acoustic experiment
Before conducting detailed experiments from which limiting sap tensions
were to be derived a number of brief experiments were run using similar material.
These trials were necessary for (1) the setting of discriminator thresholds
such that the maximum recorded click frequency was at about 40-50 clicks per
minute (the maximum frequency at which clicks could be separated on the chart
record) and so obtain the greatest resolution of clicks from the background
noise. (2) to change the lamp if necessary so that experiments would take
one or two hours to complete. This order of magnitude in the duration of the
experiments was necessary to obtain sufficient resolution in changes of RWC
during the experiment to be able to use RWC as the basis from which to determine
sap tensions in the leaf on the acoustic probe. (3) to establish the highest
sap tension to which the relation of balance pressure (P) to RWC need be

23
determined.
Fully detailed acoustic experiments were conducted as follows:
An hydrated leaf was weighed to obtain its turgid weight. The leaf was then
quickly mounted on the acoustic detector by inserting the detector needle into
the xylem of the petiole or stem. Leaves were usually hung from the needle
of the acoustic detector as shown in figure 1. Heavier shoots which might
damage the detector transducers were hung from the arm of the balance and the
detector attached unweighted to the stem.
The lamp, amplifier and chart recorder were switched on and noise levels,
particularly due to 50 Hz mains hum, checked to be within tolerable limits.
Detector sensitivity was checked by lightly brushing the detector needle with
a hair (Milburn and Johnson, 1966).
The weight of the leaf was noted at intervals and the experiment stopped
when click frequency had fallen to a frequency small compared to that at the
frequency maximum earlier in the experiment. Leaf weight was noted more
frequently when the change in weight was rapid (at the beginning of the
experiment) than when the rate of loss had declined towards the end of the
experiment. Concurrence of clicks with events being recorded by the chart
recorder was checked at intervals during the experiment by using a pair of
headphones.
Experiments conducted with deeply dissected (e.g. Fraxinus and Lycoper
sicum) or soft (e.g. Plantago, Ricinus) leaves suffered particularly from
rubbing noises. In these cases the laminal parts were held separate by
holding them against a light wire frame by using small pieces of putty.
After the experiment the leaf was dried for two days at 363K and then
weighed. Clicks were read from the recorded traces and summed over intervals,
usually of four minutes. Manual counting of clicks from the recorder charts,
although tedious, was preferred to full automatic recording as brief periods
of noise, for example due to electrical faults or unusual activity in the
laboratory, could be distinguished from clicks on the recorder chart and left
out of the summation.

24
The records of click frequency, leaf weight and time were put onto
computer file for later calculation of limiting sap tensions.
2.2.4. Artifacts in acoustic experiments
The acoustic technique is subject to several types of error which may
influence the interpretation of experiments and should therefore be borne in
mind when interpreting the chart record of an experiment.
Spurious noises arising either inside or outside the sample on the
acoustic detector are the major errors to which the acoustic technique is
sub j ect.
External noises are the result of vibrations of sufficient magnitude to
trigger the active channel discriminator but not that of the reference channel.
Airborne noises (e.g. aircraft overhead, whistling or shouting) were the worst
sources of this type of noise. Floor-borne vibrations (people walking or
working nearby) were usually successfully cancelled out by the anticoincidence
circui t.
The second class of external noises was electrical in origin. Mains
frequency hum was a serious problem, particularly when low discriminator
thresholds were used, but could be suppressed by the shielding and earthing
procedures detailed above and by use of the filters built into the amplifiers.
Noises arising wi thin the specimen include tissue noises (Milburn and
Johnson, 1966) and noises due to the rubbing against each other of parts of
the sample on the acoustic detector.
Tissue noises are usually quiet by comparison to clicks and could be
successfully avoided by suitable setting of discriminator thresholds. Tissue
noises could not be avoided this way when leaves of soft herbs (Lycopersicum,
Pelargonium and Phaseolus) were used as clicks are also very quiet in these
specIes. Manual monitoring of cli cks was often necessary with these species.
Tissue noises sound quite different to clicks (Mi Iburn and Johnson, 1966) and
can be successfully separated from clicks in this way.

25
Rubbing noises were quite as loud as clicks and sound very similar.
Manual recording of clicks and high discriminator thresholds will not
therefore separate noises due to the rubbing of leaf parts from clicks.
Selective removal of leaves of leaflets was successful in reducing these
noises to low levels in Rhododendron shoots and the trifoliate leaves of
Phaseolus. In the case of Larix removal of needles could not be used to
prevent rubbing noises without removing almost the entire transpiring surface.
Rubbing noises in Fraxinus, Lycopersicum and Plantago could be prevented by
holding each leaflet or the edges of the lamina against a light wire frame
as described above. This method of preventing rubbing also prevents damage
to the xylem occurring when parts are excised.
Failure to obtain good contact between the detector needle and the sample
xylem was a problem with species in which the xylem occurs in many small
vascular strands. Zebrina is one such and the cereals in general are another
group for which a diffuse xylem is a problem. All that can be done is to
take care to position the needle in as many vascular strands as possible and
use the greatest detector sensitivity possible.
The drying of areas around the site of the detector needle insertion might
result in a change in the efficiency of the transfer of xylem-borne vibrations
to the detector needle, effectively altering the amplitude required by a click
to pass the discriminator. Attempts to detect clicks by holding a detector
against the outside of the stem or petiole, and thereby avoiding damage to the
xylem and epidermis, were unsuccessful. In almost all cases damping of
vibrations by soft tissues between the xylem and the detector prevented
detection of clicks. Removing these soft tissues to place the detector
directly against, but not into the xylem, caused much more rapid drying of
tissues around the site at which the detector was mounted than elsewhere in
the leaf. Because of this uneven drying it was impossible to determine the
sap tension within the sample.
Considering the problems of gaining adequate contact of the detector with
26
xylem, and of drying around the detector mounting site, a needle attached to
the detector was thought the best method available for coupling the transducer
to the xylem.
2.3. Measurement of Water Potentials
Routine measurements of plant water potentials were made using the
pressure chamber (Scholander ~ ~. ,1964 ,1965) and the dewpoint thermocouple
psychrometer (TCP) (Campbell et ~., 1973). Freezing point osmometry was
used in the early stages of the project for measuring solute concentrations,
but was superceded by the thermocouple psychrometers when they became available.
2.3.1. Thermocouple Psychrometry
Water potentials (~) were measured using a Wescor Dewpoint Microvoltmeter
(Wescor Inc., Logan, Utah) (Campbell et ~., 1973) coupled either to a Wescor
C-51 sample chamber or sample chambers built for the proj ect to a design
supplied by Dr. W.J. Davies of the Department of Biological Sciences, The
University of Lancaster. The construction, calibration and operation of the
chambers are detailed in appendix l.
2.3.1.a. Leaf water potentials (~ll. Leaves were prepared for sampling by
wiping them with a wet towel to remove surface contaminants and then allowed
to dry for at least 20 minutes before sampling. A paper punch was used to
cut 6mm diameter leaf discs from halfway along the lamina and midway between
the midrib and edge of the lamina. Leaf discs were quickly sealed into the
sample chambers and equilibrated for 18-20 hours at 293K. Changes in ~l as
a result of metabolic activity in the leaf discs, or slow leaks from the
chambers, may have occurred over these long equilibration times. However,
these possible errors were considered small and preferable to unknown changes
in ~l which might result from abrasion of the leaf surface to achieve more
rapid equilibration (Talbot et ~., 1975).
27
2.3.l.b. Leaf solute potential (~ ). s
Leaf solute potentials (~ ) were s
measured after destruction of cell membranes, and hence turgor, by freezing.
Leaf discs were frozen in liquid nitrogen, warmed briefly between thumb and
forefinger and replaced in the sample chambers to equilibrate before measure-
ment of ~ . s
Equilibration after freezing was obtained within two hours,
approximately one tenth the time required when using living leaf discs.
Time courses for equilibration of leaf discs in the psychrometer sample
chambers are shown in figure 2.
Cell turgor (~ ) was calculated as the difference between leaf and solute p
water potentials, i.e.
~ p ~l ~
s (e. g. Bennett ~ ~., 1981)
2.3.l.c. Xylem sap osmotic potential. Xylem sap was expressed from leaves
or shoots in the pressure chamber by applying an overpressure of about O. 5 ~1Pa.
Expressed sap was absorbed onto 6mm discs of Whatman number 1 filter paper.
The discs were enclosed in small plastic film envelopes to minimize evaporation
during collection.
Erroneously low sap ~ was measured if small quantities of sap were s
absorbed onto the paper discs. This problem has been attributed to adsorption
of sap water onto the components of the paper, resulting in a concentration of
solutes in the remaining unbound sap (Markhart et ~., 1981). This artifact
was avoided by collecting a sufficient volume of sap so that sap could be
squeezed from the paper disc by light finger pressure.
2.3.2. Freezing point osmometry and refractometry of pith_~
Osmotic potentials of sap samples were estimated from measurement of
freezing point depression and refractive index of aliquots of expressed sap.
Assumptions were then made as to the solutes present in the sap and measure-
ments of osmolWjty used to derive ~ . s
Freezing point depression was measured using a Knauer semi-micro
osmometer (Herbert Knauer and Co., Berlin, West Germany) calibrated with

---rtJ ~ L ---~
4
3
2
1 .--~
~--- ---~ ---~~ ~~~ -~J- -- --- ----Ol~--~----~--~----~--~--~
o 10 20 30 40 50
Figure 2. chambers. O. f4 IvIPa.
TIME (h)
Equilibration of Rhododendron leaf discs in the new psychrometer Both leaf discs were cut from a single leaf of balance pressure
28
sodium chloride solutions of known osmolali ty (Weast, 1981).
The refractive index of expressed sap samples was measured using an Abbe
Refractometer (Otago Optical Works, Tokyo, Japan) and the refractive index
expressed re lati ve to that of water.
2.3.3. The pressure chamber
Two Scholander-type pressure chambers (Scholander ~ ~., 1964 ,1965) of
internal dimensions SS x 120 mm and 30 x 300 mm were used. Two Bourdon
pressure gauges with ranges 0-6 MFa and 0 4.14 ~fPa were used interchangeably
with the two pressure chambers. The gauges were calibrated at the beginning
of the project and checked against each other at intervals during it.
The pressure chambers were initially pressurised with air from diving
cylinders. A change to oxygen-free nitrogen was made later to minimise adverse
effects of high oxygen partial pressures on cells (Tyree ~ ~., 1973; Jones
Pers. comm.). However, Tyree ~~. (1973) also warn of the effects on leaves
of long periods of exposure to nitrogen at high pressure. Experiments testing
for adverse effects of using nitrogen or aIr In the pressure chamber when making
prolonged or repeated measurements of balance pressures are described in
section 3.3.
Water loss from samples In the shorter pressure chamber was minimised by
lining the internal walls of the chamber wi th damp paper towel. The small
internal diameter of the taller chamber required that chamber humidity be
maintained by admitting gas through a pad of wet paper towel over the gas port
as paper towel on the chamber walls interfered wi th the mounting of samples
in this chamber.
When deriving the relation of balance pressure to relative water content
(section 2.4.1) leaves were not enclosed in plastic bags when inside the
pressure chamber. This omission speeded work but, as leaf weights were
measured upon removal from the chamber soon after measuring balance pressure,

4
7 III
Figure 3. The use of the pressure chamber to control sap tensions in a
leaf during acoustic experiments. The leaf .... 'as positioned in the pressure
chamber (4) and the acoustic detector (6) inserted into the petiole either
above or below the rubber bung (5) sealing the leaf into the pressure chamber.
Damping materials were placed under the pressure chamber (7) and the acoustic
detector to reduce noise. Sap tensions in the leaf could be altered by
increasing or decreasing chamber pressure by knoW1 amounts by use of inlet
and exhaust valves (1,2) and the pressure gauge (3).

29
without allowing large weight changes due to evaporation.
When measuring balance pressure for purposes other than that mentioned
above, leaves were sealed into small plastic bags, prehumidified by breathing
into them, before mounting in the pressure chamber to prevent changes in water
potential between sampling and obtaining the balance pressure (Jones and
Higgs, 1979).
The length of stem or petiole protruding from the pressure chamber was
kept to between 5 and 10 mm to minimise errors caused by non-pressurisation
of part of the sample (Slavik, 1974). Samples were sealed into the pressure
chamber by inserting the petiole or stem through a slit cut into the rubber
bung sealing the sample port in the lid of the pressure chamber. Gas leaks
around the sample where it passed through the seal were prevented by caulking
the space around the petiole with a commercial sealing compound. Blu-tak
(Bostik Ltd., Leicester, UK) and Terostat (obtained from the Grace Container
Equipment Centre, Elveden Rd., London, UK) were used for this.
In view of the low water potentials involved in this study, equilibration
errors were thought likely if balance pressures were raised rapidly. Pressure
-1 was therefore raised at about .005 MPa $, , a rate which minimized inequi libria
arising due to differences with which parts of a sample may exchange water with
the xylem (Tyree et ~., 1978 ). After the first expression of sap the
pressure was released by 0.1 - 0.2 MPa and slowly increased again. When the
pressure at which sap reappeared at the cut surface was the same on successive
measurements the balance pressure was noted. Balance pressures were measured
to within ± .01 MPa although end points were less definite in some species,
particularly the herbs.
2.4. Relative Water Content (RWC)
Relative water content (RWC) was defined in the same way as the relative
turgidity
i.e.
of WeatherlY (1950)
RWC LW - OW TW - OW
x 100%

where LW = leaf weight measured during an experiment, TW = turgid weight is
leaf weight at full turgor (achieved by overnight hydration) and DW = dry
weight (after drying for two days at 363K).
2.5. Sap flow in the xylem
2.5.1. Sap flow in stem segments
A quantitative study of the effect of cavitation on the ability of xylem
to conduct sap was made using stem segments of Rhododendron and Ricinus.
The relative conductivity (K) of the stem segment was defined as follows
(Heine, 1971) and has the units (m2)
Eqn. 5. K = Q·1.9 !:lP.A
in which
A = total cross-sectional area of xylem (m2)
1 = length of liquid flow path (m)
11 = liquid viscosity (Pa s)
!:lP = pressure difference causing flow CPa)
Q liquid flux entering or leaving the stem 3 -1 = segment (m s ).
2.S.l.a. Calculating K
A. Photographs of the apical end of the stem segments were taken and
xylem area measured by weighing cut-out traces of the xylem in the cross section.
It was thought that, as the limiting resistance to flow was most likely to be in
the part of the segment with the least xylem, measuring the xylem area at the
narrower end of the segment would give the best measure of the effect of xylem
area on flow.
1. Liquid flow was assumed axial, making 1 equal to the length of the
stem segment, which was measured to ± 0.2 mm.
n. As water was used as the permeating fluid viscosity could be taken
from standard tables, assuming that eluates from the stem and matric forces
in the smaller pores through which the water flowed had negligible effect on
viscosity. As the viscosity of water is temperature dependent, experiments
31
were conducted in a growth room in which temperature was controlled to
25 ± lC At this temperature the viscosity of pure water is 0.8904 x 10- 3
Pa s-l (Handbook of Chemistry and Physics, Weast (1981).
~P. A simple apparatus was constructed by which a constant head of water
could be supplied to the stem segment whose permeability was being measured.
The apparatus included an inlet potometer for measurement of Q (see below).
The apparatus is illustrated in figure 4.
A constant head of water was maintained by a float tank receiving water
from a header tank at a higher level. Hydrostatic pressures were measured
by two water manometers connected near the inlet and outlet ends of the stem
segment. The manometers were of 2mm internal diameter glass tubing held
against a metre rule. The position of the meniscus in each manometer could
be read to ± 0.5mm against the wooden ruler to which the manometers were
secured. ~P was calculated from the difference in height between the menisci.
Hydrostatic heads were typically 0.75 to 0.77 m.
Q. Flow of water through the stem segment was measured on the inlet side
by a bubble potometer taped to a metre rule. The position of the bubble
could be read to ± 0.5mm if flow was slow and with somewhat less precision if
flow was rapid. Bubble position was adjustable by two water-filled syringes
mounted in T-pieces at either end of the potometer. The potometer was
-9 3 calibrated as recording a volume passage of 7.59 x 10 m of water per metre
of bubble movement. A similar potometer was originally installed to
measure flow from the stem segment. However, it was found that eluates from
the stem quickly contaminated the narrow potometer causing the bubble to
stick, resulting in intermittent rather than constant flow. Consequently
efflux was measured by collecting water in a phial on the weighing pan of a
milligram balance. A layer of light oil on the surface of the water in the
phial prevented evaporation.

32
Connections between tanks, potometers and the collection phials were of
Smm Tygon tubing. Joints were sealed by stretching latex tubing over them.
Stem segments under test were also connected into the apparatus by latex tubing
stretched over the ends of the segment and the corresponding influx or efflux
ends of the Tygon tubing.
Glassware was cleaned at intervals by washing with chromic acid and the
Tygon tubing washed with 70% ethanol.
The apparatus was thoroughly flushed with distilled and filtered water
after cleaning and reassembly.
The output end of the stem segment could, if required, be connected to
a vacuum source rather than to the collection phial. In this way water flow
rates at pressure differentials greater than those attainable by hydrostatic
head alone could be measured. Vacuum was measured by a mercury manometer to
± 0.5 mm and the total pressure differential causing flow calculated as the
sum of hydrostatic head at the inlet side of the segment and the vacuum on
the outlet.
2.S.1.b. Purification and degassing of water. Booker (1977) has listed the
steps that must be taken in the preparation of water to be used for permeability
experiments if reliable results are to be obtained.
Water was therefore prepared by the method of Edwards (1980) which satisfies
the requirements laid down by Booker (1977).
Distilled water under a 2m head was passed through two inline filters.
The first (Whatman Gamma 12-03) prevented passage of particles larger than
0.3 ~m and the second, a nitrocellulose millipore membrane (Sartorius Type
SMl1309) supported on a closely drilled perspex plate, removed particles down
to 0.1 ~m. The filtered water was stored in a glass vessel until used.
Immediately before use the water was degassed by sonication under vacuum.
The water, in a 5 litre Buchner flask, was held under vacuum by an Edwards
high vacuum pump (Edwards High Vacuum Ltd., Crawley, England) with the tip of

1 2
8-
6 7 I
9
Figure 4. Constant head apparatus for measuring the relative conductivity
of stem segments. A reservoir (1) supplies water to a flat tank (2) which
maintains a constant hydrostatic head of water. The flow of water into a
stcem segment (7) mounted in the apparatus by latex rubber sleeves (6) is
measured by observing the movement of a bubble (4) in a potometer (5). The
position of the bubble is adjusted by water filled syringes (3). The
pressure drop across the specimen is measured by inlet and outlet manometers
(8) and the flow from the sample is measured gravimetrically (9).

:)3
the ultrasonic generator probe (MSE model Nl14 ultrasonic generator) passed
through the rubber bung sealing the flask and in contact with the water.
Sonication at 25 kH2 caused immediate considerable frothing which declined
after a few minutes. The water was considered degassed when only occasional
bubbles formed in the water.
Because of the large surface area of water exposed to air in the float
tank air quickly redissolved into the degassed water. However, so little
water was actually used in each experiment that the 20-25 x 10- 6 m3 of v..ater held
separate from the air in the Tygon tubing (and therefore not absorbing gases)
between the float tank and stem segment was sufficient to last for several
hours. The apparatus was refilled with degassed water after at most three
hours of use.
2.5.1.c. Preparation of stem segments for measurement of K. Segments were
cut underwater from shoots and40mm trimmed to remove emboli from ends which
had been exposed to air. The bark was stripped from the segment, the ends
pared smooth with a razor blade and the segment. connected into the permeabi li ty
apparatus. The connections were checked for leaks or contained air and the
exposed parts of the stem heavily smeared with lanoline after the segment had
been lifted from the water.
2.5.1.d. Determination of water flow paths. After measurement of Q, the path
of water movement in the stem was stained by injecting decolorised basic
fuchsin (section 2.8) into the permeating water. The dye was allowed to
flow through the stem for 10 minutes before the segment was removed from the
apparatus.
After photographing the apical end of the segment for determination of
xylem area the segment was sectioned to determine the pattern of dye staining
in the xylem.
34
2.S.1.e. The flow of water through stems at increasing pressure differentials.
By use of increasing vacuum the flow of water into stem segments at pressure
differentials between 0.007 and 0.05 MPa could be measured.
Flow at higher pressure differentials was measured using the pressure
chamber.
A stem segment was mounted in the pressure chamber 'such that 80-100 cm
of its length was inside the chamber and dipped into a phial of distilled and
filtered water. Collection of water from the end outside the chamber was
facilitated by a length of latex tubing fixed over the end and emptying into
a small phial. Water was collected over one or two minute intervals as the
chamber pressure was raised in increments from 0 to 4.14 MPa. Exudation
volumes were determined by weighing the collection phials before and after a
collection.
2.5.2. Potometric measurement of the effect of cavitation on sap transport
Water uptake into shoots was modelled on the van den Honert electrical
analogy (1948) as was water flow through stem segments in section 2.5.1. The
analogy applied was that of a capacitor charging through a resistance and not simply
the flow of current through a resistance as in 2.5.1.
The major difference in calculation of K for the xylem of shoots compared
to that of stem segments concerned the measurement of the pressure difference
(6P) causing flow. Other differences concerned the length and xylem cross-
sectional area through which flow was occurring.
Because the stems of Rhododendron shoots taper from base to apex and as
the leaves (postulated as the sinks to which water moved, see below) were
distributed along this tapering stem, a meaningful value for the area of the
xylem cross-section was thought to be unobtainable.
A modified form of the equation for calculation of relative conductivity
which omitted the area factor was proposed to measure the ability of shoot
stems to conduct water. A new term, Kl, was defined as
Eqn. 6. Q.l. n l'.P
35
Kl is therefore in units of m4 (i.e. m2 x
1 1 ffi2 ) .
The symbols have the same meaning as for the calculation of K in section
2.5.1. although, because shoots rather than stem segments were used, their
measurement was slightly different.
2.5.2.a. Calculation of Kl.
1. The distance 1 could not be measured as the length of the stem as the
major sinks for water taken up, the leaves, were distributed over a considerable
distance along it. What was thought to be a reasonable nominal value for 1
was obtained by measuring the distance between the cut end of the stem and the
middle of the zone of petiolar insertions.
n. These experiments were conducted in a laboratory lacking temperature
control. Temperatures varied between 293 and 298K;iuring experiments.
-3 Consequently, an approximate value of 10 Pa s was used in calculations
1 of K •
l'.P. The electrical analogy proposed to describe water uptake by a shoot was
that of a capacitor charging through a resistance. In such a system the
vOltage difference between voltage source and capacitor decreases according
to an exponential decay of the form
Eqn. 7. E - -bIt a * e
The pressure differential between shoot protoplast and the free water
supplied to the shoot in potometric experiments was similarly described.
However, because of the complexity of the structure of the shoot two different
capacitances charging through different resistances were postulated (section
4.3) .

36
~. The long arm. of the potometer was held against graph paper ruled at
millimetre intervals. The rate of water uptake by the stem was then found
by using a stop-watch to time the movement of the meniscus in the potometer
over the graph paper. The position of the meniscus could be determined to
± 0.5 mm at normal flow rates and somewhat less certainly at very high fluxes.
-9 3 Potometer calibration was 3.8 x 10 m for each metre of meniscus movement.
2.S.2.b. Measuring water uptake by shoots and leaves. Shoots were prepared
for mounting on the potometers by cutting 40mm underwater from the end of
the stem to remove emboli and the bark cut back for 20mm more to leave a
smooth xylem surface against which a good seal could be made. The cut surface
was pared smooth with a razor blade. The exposed xylem was connected to the
potometer by slipping a short length of latex tubing over both the short arm
of the potometer and the exposed end of the xylem. All operations were
carried out under filtered water (section 2.S.I.b) to prevent air entry to the
xylem. The shoot had previously been sealed into a plastic bag to prevent
transpiration. Only the end of the stem protruded from the bag. The shoot
was now taped to a flat support to prevent movement. If desired, the support
could be moved vertically so that the shoot could be dipped into a waterbath.
Experiments were timed from the first underwater cut.
Leaves were mounted similarly after cutting from the stem underwater.
The arrangement is shown in figure S.
2.5.3. The effect of cavitation on sap transport in intact plants
Potted Rhododendron plants in a glasshouse were used for this study.
The plants were subjected to slowly developing sap tension by withholding
water over a period of 2-4 weeks. Plants were divided into three classes,
non-cavitated, cavitated, and cavitated and recovered (by restoring water at
field capacity by twice daily watering for three or five days).
Relative conductivity of the xylem was measured on excised stem sections

4
1 3
2 5 6 7
Figure 5. Potometer measurement of the rate of water uptake by shoots. Movement of the mm ISCUS (3) in the long arm of the potometer (1) over graph paper (2) was used to measure the rate of water uptake by a shoot connected to the potometer by a rubl:er sleeve (6) and enclosed in a plastic bag (7) to prevent transpiration. The long arm of the potometer can be refilled from the reservoir (4) without admitting air to the xylem by using the three-way tap (5).
37
by the method of section 2.5.1.
The effect of cavitation on the ability of the plant to maintain its
water status was investigated by comparisons of the leaf water potentials and
stomatal conductance of transpiring potted plants in each of the three classes
above. These indicators of plant water status were measured at two hourly
intervals over a sunny day in July 1982.
Stomatal conductance was measured using a Li-Cor Diffusive Resistance
Meter (Lambda Instruments Corp., Lincoln, Nebraska) calibrated in the laboratory
using a water bath as set out in the instrument manual.
Water potential was measured by the pressure chamber (section 2.3.3).
Sap tension was measured by taking the balance pressure of leaves which had
been enclosed in small plastic bags wrapped in aluminium foil (*Tumer, 1981)
for at least twenty minutes before sampling.
Relative humidity and air temperature were measured at intervals by
measurement of wet and dry bUlb temperatures. Continuous records of relative
humidity and air temperature were made by a thermohygrograph (Casella, London)
on the glasshouse bench.
Radiant energy flux was measured by a Kipp and Zonen integrating solari
meter (Kipp and Zonen Ltd., Delft, Holland) situated on the roof of the
laboratory some 50 metres from the glasshouse.
2.6. Gas penetration of pit membranes
Sap tension will be rapidly released when a gas phase appears in the
conduit. The rapid release of sap tension will occur irrespective of
whether the gas phase arises within the conduit or enters from outside
through pit membranes. Clicks detected by the acoustic technique will occur
in either case as they are (supposedly) caused by elastic recoil of the cell
walls.

38
Experiments were therefore conducted to investigate the penetration of
pit membranes by gas under pressure with the aim of determining whether clicks
occurred as the result of cavitation of the xylem sap in a conduit or by gas
entry through the pit membranes.
Gymnosperm wood is unsuitable for such studies as aspiration of the tori
of the bordered pits will close the pit aperture with a non-porous plug and
so prevent gas entry (Dixon, 1914; Bailey, 1916; Petty, 1970).
Angiosperm wood lacks the complex bordered pits of the gymnosperms.
Gas entry into conduits is prevented by retention of sap in the very small
pores of the pit membranes (Dixon, 1914).
Rhododendron stems were used for these experiments as
i) the sap tension at which clicks occur was known;
ii) the vascular pits are of the angiosperm type and lack tori;
iii) xylem vessel lengths were sufficiently short (section 3) that stem
segments with only a very few conduits lacking at least one pit membrane
were of convenient length for use in the pressure chamber;
iv) the stems were strong enough to resist crushing in the pressure chamber
seals and did not include non-xylary spaces which might pass gas.
2.6.1. Gas permeability of stems. The retention of sap in the pit membranes
against high gas-sap pressure differentials can be tested for by applying gas
under increasing pressure to one side of a wet pit membrane and noting the
rate of gas flow through the membrane. The forcing of sap from the membrane
resul ts in pores being opened to the passage of gas with the consequent
increase in the measured rate of gas flow.
Unbranched shoots of up to three years growth were collected and hydrated
as described previously (section 2. ].1.). After pretreatments (see below) the
stems were prepared for measurement as follows. The terminal leafy portion
of the shoot was removed and the bark and leaves of previous seasons stripped
from the stem.
blade.
The ends of the stem section were planed smooth using a razor

39
The stem was weighed and then wrapped in Sellotape before being overlaid
by wet paper towel secured by more tape to restrict evaporation. The stem
was mounted in the pressure chamber with 40-50 rom of stem inside the chamber.
Restricting the amount of stem inside the chamber was necessary to minimise
Hammel-type sap expression from living tissues subjected to pressure inside
the chamber.
Nitrogen gas entering the chamber was humidified by passage through a
pad of wet paper towel over the gas port.
The resulting gas flow through the stem was measured as shown in figure 6.
Gas emerging from the stem was collected into a flexible tube connected to
the end of the stem by a length of latex tubing.
gas
Gas flux rate was determined by noting the time taken for the collected
to displace a set volume (5 x 10⁻⁴ m3) of saturated brine solution from
an inverted measuring cylinder. Gas was channelled to the top of the cylinder
through a glass tube to prevent bubbling which made observation of levels in
the cylinder difficult. A Mittyvac (Neward Enterprises, Cucamonga, California)
hand operated vacuum pump was used to restore the brine to the top mark between
experimen ts . A three-way tap and independently operating vents enab led brine
levels to be adjusted without disturbing the connections to the stem and rapid
switching of gas flow from vent to the measuring cylinder.
The resistance of the system to gas flow was very low by comparison with
even the lowest of the stem resistances and could not be measured under even
the smallest pressures used in experiments.
The rate of gas flow through the stem was expressed as units of volume of
3 -1 brine displaced per second (m s ) by measuring the'transit time' taken for
the brine levels to fall between marks on the measuring cylinder being used in
this calculation.
Gas flow through the stem was measured at increments of increasing and
decreasing pressure over one or more cycles for each stem.
40
2.6.2. Expression of sap from xylem conduits
Gas penetration of pit membranes not only increases the gas permeability
of the stem; entry of gas into a conduit will displace the water already in
that conduit. If the living tissues of that stem do not have large water
deficits, or are separated from the sap in the xylem conduits by high resis
tances to lateral flow, most of this displaced water will be expelled from
the low pressure end of the stem. Measurement of the volume of water
expressed for each increment of pressure will reveal at what pressure gas
enters the xylem conduits.
Stems were mounted in the pressure chamber as described, and chamber
pressure increased in 0.18 or 0.35 MPa increments.
Immediately that pressure was raised, a plastic phial containing paper
tissue was placed on the exposed end of the stem to absorb the expelled water.
The tubes were changed at two-minute intervals and immediately capped by
clipping a larger, snug-fitting phial over the open end to prevent evaporation.
The capped phials were then weighed and the amount of absorbed water found by
subtraction of the tare weight of the phial and its cap.
Sap collection was continued until the collection over two minutes was
less than 5% of the running total for that pressure increment. Evaporation
of collected water from the open phials and from the stem (section 3.8.3),
particularly at high pressures, made continuation of collections past this
time counter-productive.
The amount of sap collected was summed for each increment and expressed
as a percentage of the total collection volume for that stem.
The effect of changing surface tension on gas penetration of pit membranes
Surface tension in aqueous solutions is lowered by the addition of
surfactants, such as detergents and soaps, or organic solvents, such as
alcohols. It was thought that adding strong detergents to the transpiration stream
might have serious deleterious effects on the membranes of living cells in
the stem. Cell debris and contents whi ch might accumulate on pit membranes

A 3
J------4
2 B
5
~
Figure 6. A Measuring the flow of gas through stems. Gas passing through a stem in the pressure chamber (2) was collected over brine in an inverted measuring cylinder (5). By U!'B of two and three-way taps (3) and a vacuum line (4) the measuring cylinder could be quickly refilled with brine.
~ (Inset). Separation of gas flowing from the pith (hatched area) and xylem (plain area) of Rhododendron stems.

41
could be released. Alcohols, especially the higher alcohols, were
considered probably to be less toxic in their effects on plant tissues. A
range of surface tensions could also be readily obtained by adjusting the
concentration of alcohol in the solutions.
Ethanol has been shown to have limited toxic effects on the xylem
structure, at least in the short term, by Mishagi ~~. (1978). However,
its volatility may lead to rapid changes in concentration when large volumes
of gas are passing in nearby conduits in stems. N-butanol was therefore
selected to reduce sap surface tension. The surface tensioffi of the solutions
used are given in table 1.
Table 1. Surface tensions and approximate water potentials of permeating
solutions transpired by shoots. Values of surface tensicn are from
the International Critical Tables; Washburn (1926) for <3 temperature of
Surface Tens~on (Pa m x 10- )
Water Potential (MPa)
Water
71. 2
o
5.4% :-.laCl 10% N-butano 1 4% N-butano 1
74.4 27.0 48
-4.37
These liquids were introduced into the xylem by substituting them for
water in the transpiration stream of shoots transpiring on the laboratory
bench. A three-hour transpiration period was settled on as being sufficient
for perfusion of the solution without being so long that possible toxic effects
of the solutions would be severe.
2.7. Determination of Conduit length
A knowledge of the length of xylem conduits in the stems and leaves of
plant material used to establish the effect of cavitation on sap transport was
necessary, for instance in the selection of the lengths to be trimmed from

42
bench dried shoots to remove air embolised conduits. The knowledge is also
useful in interpreting the results of these and the acoustic experiments.
Conduit length was determined by injection of Indian ink into xylem
conduits.
Indian ink was filtered three times through Whatman number one qualitative
filter paper and diluted to 1/40 of its original concentration. This
dilution gave a suitable volume of filtrate with which to conduct experiments,
reduced the probability of clogging of conduits as a result of water loss
through walls rather than the ends of the conduits (Handley, 1936), and reduced
the likelihood of cell damage by preservatives in the undiluted ink.
The size of particles in the ink was measured from photomicrographs taken
using a transmission electron microscope (plate 1). Maximum and minimum
particle dimensions measured from these photographs were 46 ~m and 17 ~m
respectively.
ShoDts or leaves were hydrated (section 2.1) and the dilute ink suspension
supplied to the cut petiole or stem to ascend with the transpiration stream.
After injection material was hand~sectioned at intervals and the number of ink_
containing conduits counted using a microscope.
2.8. Determination of Sap Flow Paths
The conduits conducting sap were determined by injection of decolorised
basic fuchsin.
Basic fuchsin was prepared by addition of 10 ml of 10% sodium meta
bisulphite to 100 ml of 0.1% aqueous basic fuchsin (Talboys, 1955). The
solution lost its red colour over several hours but a light yellow colour (due
to impurities in the dye - Coleman, 1938) remained.
The solution was stored in an airtight jar. A light precipitate formed
with time. Care was taken not to disturb this precipitate when taking dye
for infusion into stems.

Plate 1. Particles of Indian ink from the filtered and diluted suspension
used to measure length of xylem conduits (xI05).
-1V-
ov-
+1 V-50 ms
PI ate 2. Oscilloscope traces of clicks detected in Rhododendron leaves
by the acoustic detector fitted with ceramic transducers.

43
2.9. Xylem anatomy
Petioles from leaves similar to those used in acoustical experiments
were stored in 2.5% formalin (Dimond, 1966) and embedded in paraffin wax
after dehydration through an alcohol series terminating in N-butanol
(Johansen, 1940).
25 ~m thick transverse sections of these petioles were cut by rotary
microtome, the wax removed with xylol and the sections stained with toluidine
blue. Photomicrographs were taken using a Zeiss Photomicro-system 2 (Carl
Zeiss, Oberkochen, West Germany) camera microscope.
2.10.. Computation of results
Experimental data were entered onto files held on the University of
Edinburgh Regional Computing Centre 1CL2900 computer at the Kings Buildings,
Edinburgh.
Statistical calculations were made by calls to the M1N1TAB package
(Minitab Project, Pennsylvania State Univ., Pennsylvania). More complex
curves were fitted by NAG (Numerical Algorithms Group Ltd., Oxford, UK)
routines as in the programme described by Hipkins (1978).

44
Chapter 3. Cavi tation and Sap Tension
3.1. Introduction
The acoustic technique and the pressure chamber were used to investigate
the relationship between cavitation and sap tension in detached leaves and
shoots of a number of species of herbs, shrubs and trees.
In the past investigations into the occurrence of cavitation of the xylem
sap have been based on observations of (a) the presence or absence of gas in
xylem conduits or (b) the conduction of dyes in the xylem. These methods
were discussed in the introduction (Chapter 1).
Two techniques are now available which, by their combination, allow the
occurrence of cavitation to be monitored in almost undisturbed xylem, and the
sap tension at which cavitation occurs to be found. These are the acoustic
technique (Milburn and Johnson, 1966; Milburn 1973a) and the pressure chamber
(Scholander et al., 1964,1965) respectively.
The acoustic technique has been used to investigate cavitation of xylem
sap in Pyrus (West and Gaff, 1971), Plantago (Milburn and McLaughlin, 1974),
Ricinus (Milburn and Johnson, 1966; Milburn 1973a, 1973b) and in Eucalyptus
(Crombie, unpublished) and Lycopersicum (Nonhebel, pers. comm.).
The relation of cavitation to sap tension was determined accurately in
only two of the above studies. These were for Lycopersicum (Nonhebel, unpub.)
and Plantago (Milburn and McLaughlin, 1974).
The work reported in this chapter had two major aims: (a) to accumulate
more direct evidence of the link between clicks and cavitation than is already
available and (b) to determine the sap tensions at which cavitation occurs in
a wide range of species.
The results are presented in five sections, each dealing with a different
aspect of the techniques used and the results obtained:-
Section 3.2. The acoustic technique.
Section 3.3. Determination of sap tensions in leaves during acoustic experiments.
45
Several methods by which the pressure chamber could be used to estimate
sap tensions in leaves cavitating on the acoustic detector were evaluated.
Section 3.4. The effect of cavitation on pressure chamber measurements of sap
tension and leaf water potential.
Section 3.5. Sap tensions causing cavitation.
The results of acoustic experiments (section 3.2) are combined with those
obtained using the pressure chamber (section 3.3) to obtain estimates of the
sap tension at which cavitation occurs in the leaves of a number of plants.
Section 3.6. Recovery of leaves, shoots and whOle plants from cavitation.
3.2. The acoustic technique
3.2.1. The detection of a 'click' by the acoustic detector
Plate 2 shows oscilloscope traces of clicks detected in a Rhododendron
leaf. The traces are typical of many which were viewed in this way and are
very similar to those obtained using Ricinus (Milburn and Johnson, 1966).
The waveforms begin abruptly and are irregular in both frequency and
duration. Typically a click will consist of one to three high amplitude
cycles followed by a rapid decline. The frequency of the 'click' appeared to
be governed, at least in part, by the geometry of the detector and was usually
lower for detectors fitted with long (20-40 mm) than for those with short
(5-10 mm) needles. The frequency of clicks detected in Rhododendron leaves
using ceramic transducers was typically 500-600 Hz. This was low by comparison
with the 800-1000 Hz for clicks in Ricinus leaves detected using a magnetic
detector (Milburn and Johnson, 1966).
Clicks could be detected in samples (leaves or shoots) of all the species
(section 2.1) with which experiments were conducted. However, there were
considerable differences in the 'loudness' of clicks between species.
Loud clicks were typical of woody species (Acer, Alnus, Eucalyptus,

Fraxinus, Larix and Rhododendron). Softer, but still readily detectable,
clicks were found mainly in the soft herbs (Lycopersicum, Phaseolus, Plantago,
Ricinus) .
Very soft clicks which required special precautions for their eetection
were found in leaves of Pelargonium and leafy stems of Zebrina. Because of
difficulties in detecting clicks in these two species, experiments using them
were not continued.
3.2.2. The pattern of click frequency against time
The results of a typical acoustic experiment are shown in figure 7. A
Rhododendron leaf was used in the experiment shown. T~e pattern of-results was
typical of those found in leaves of all species.
Immediately after mounting.no clicks are detected. I
After an interval,
which varied from only a few minutes to half-an-hour or more depending on the
species and experimental conditions, click frequency rose rapidly to a pronounced
maximum. A slow decline in frequency then occurred. The time taken until no
more clicks were detected took from one to three or more hours, again depending on
the species and the experimental conditions. Within this overall pattern of
the rise and decline in click frequency considerable variation in the number of /
clicks being detected over a short interval could occur.
This general pattern of click frequency with time is similar to that
reported for Ricinus (Milburn and Johnson, 1966), Lycopersicum (Nonhebel, unpub.)
and Malus (West and Gaff, 1976).
Maximum click frequencies generally varied in accordance with the rate of
transpiration by the leaf, being higher if transpiration was rapid than if
transpiration was slow.
Leaf weightswere measured at intervals during acoustic experiments (section 2)
and, by using dry weights obtained later, were then converted to RWC. The
decline in RWC of the leaf on the acoustic probe is also shown in figure 7.
From inspection of plots of the type shown in figure 7 it was apparent that

100 70 • n
• r t---«
• n 90 A - If)
~
'" 0 - --3 80
.. +-• :3 ..
0::: ::J c: -t-CD
70 (j') -0
0 50 100 TIME (min)
Figure 7. Typical pattern of click frequency (-) and RIVe (e) found in
acoustic experiments. A Rhododendron leaf was used in the experiment shown.
41
click frequency was related to the RWC at a particular time as click rate was
low until the RWC had fallen by an amount which appeared to be characteristic
of each species.
The pattern of click frequency during acoustic experiments was considered
to be the only reliable basis for analysis of experimental results. The
number of clicks detected was of relatively little importance in analysing
experiments because of limitation; in the acoustic technique (see below).
3.2.3. Response of click frequency to changes in transpiration rate.
The results of experiments demonstrating the rapid response of click
frequency to changes in transpiration rate are shown in figure 8.
Rhododendron leaves and shoots were used in these experiments which were
conducted as follows.
a) A Rhododendron leaf was mounted on the acoustic detector and click
production monitored as its rate of transpiration was altered by switching off
and on again the 60W incandescent lamp used to accelerate leaf water loss.
b) A 200rnrn long shoot with a cluster of leaves at one end was fitted with an
acoustic detector inserted into the xylem of the stern at the other, leafless
end. There was approximately lOOrnrn of leafless stern between the acoustic
detector and the first leaf of the apical cluster.
Water loss was accelerated by a 60W incandescent bulb. When clicking had
become established transpiration was stopped by immersing the shoot in light
paraffin oil. Oil was used as the large shoot retained sufficient heat to
continue transpiring for a considerable time after the lamp had been switched
off (section 3.2.6). Transpiration resumed when the shoot was removed from
the oil and oil wiped from the leaves using a tissue.
The appearance of small translucent patches on the leaves indicated that
s orne very limited oil inj ecti on of the laminae had 0 ccurred.
Click frequency declined rapidly when transpiration by the leaf was slowed

A 200
-c .-E
~ 100 U1 ~ H ~ LJ
o
. ~
TIME 100 (min)
~rJ\ 200
B 150
-c 'E 100 ....j----(/) ~
~ 50 LJ
o 80 TIME (min)
160
Figure 8. The effect of changes in the rate of transpiration on cl ick frequency :in a Rhododendron leaf CA) or shoot (B). Bars at the top of the figures indi cate:
\~ite bar - transpiration occurring, being accelerated by incandescent lamp. Black bar - transpiration held low by switching off lamp CA) or immersing in light paraffin oil (B),

48
by switching off the lamp (figure 8a) and recovered when the lamp was switched
on again. Similar changes were found in the click rate of the shoot when
immersed in or removed from the oil (figure 8b).
The rapid response of click frequency to changes in transpiration rate was
similar to that observed in Ricinus by Milburn (l973a).
3.2.4. Click pattern and click number
Figure 9 shows the patterns of click frequency against time recorded at
different detector sensitivities in an experiment using a single Rhododendron
leaf.
It was impossible to use the same detector sensitivities to record clicks
in the leaves of all species used in acoustic experiments because of differences
in loudness of clicks between species. Moreover, the efficiency of transmission
of clicks from the xylem to the needle of the acoustic detector depended on the
contact obtained between the needle and the xylem. It was impossible to obtain
the same contact when mounting different leaves. Therefore it was necessary to
know whether the pattern of clicks detected was altered by changes in detector
sensitivity.
To do this, a Rhododendron leaf was mounted on the acoustic probe in the
usual manner. The detector output was split and led into both channels
of the acoustic detector. The dis criminator thresholds of each channel were
then set to very different levels, one to record the maximum number of clicks
which could be separated on chart records of the experiment, the other to record
just sufficient to be able to determine the pattern of click frequency against
time. The results of one such experiment are shown in figure 9.
The pattern of clicks detected was very similar for both discriminator
thresholds despite very different total click numbers recorded by each during
the experiment. This is in accord with the observations reported by Milburn
(1973b) and Crombie (unpub.) that in Ricinus and Eucalyptus maculata respec
U tively th~t number of clicks detected appears to rise exponentially as

49
discriminator thresholds are reduced. This was attributed to damping of
transmission of clicks originating away from the detector mounting site
(Mi lburn, 1973b) and was not thought to reflect cavitation at different specific
sap tensions by different conduit populations.
As the pattern of clicks detected during acoustic experiments appeared not
to be affected by the setting of discriminator thresholds, these could be set
to give a convenient detection frequency for each experiment (section 2.2.3).
Variation in recorded click numbers also occurred as detector output was
partly dependent upon the loading of the detector transducer elements.
Differences in sample weights and the angles at which the sample hangs from the
detector needle will affect the amplitude of signals passed to the discriminator
circui ts.
In the longer term strains imposed on the transducer elements during
mounting and removal of samples, and by overloading during experiments, resulted
in a decline in transducer sensitivity. This decline can be retarded by using
long needles on the detectors so that samples can be mounted and removed with
a minimum of stressing of the transducer elements and by hanging the detector
from heavy samples (such as shoots) instead of the sample from the detector so
that stress to the transducer elements is minimised.
3.2.5. Clicks detected at different points in a sample
In figure 10 are shown the results of an experiment in which two acoustic
detectors were used to record cavitation at different points in a Rhododendron
shoot.
As it seemed likely that most of the clicks recorded using a detector
inserted into the xylem of a sample (leaf, shoot or whole plant) would have
occurred in the immediate vicinity of the detector, these experiments were
conducted to ascertain whether the pattern of click frequency against time
differed from place to place within the sample.
Rhododendron shoots 150-200 mm long were fitted with two acoustic detectors;

200
c .-E
-:t
-- 100 V) ~ LJ ~
---1 LJ
o 50 100
TIME (min)
Figure 9. Clicks detected at different discriminator thresholds. The
output of a single transducer in contact with the petiolar xylem of a
Rhododendron' leaf was taken to both channe Is of the acoustic detector.
150
The discriminator of one channel was put at a low threshold setting (A) and
the other at a high threshold setting (B).
Figure 10.
-c E
60
-:t 40 ---
o· ... o 100
TIME
: ....
200 ( min)
300
Clicks detected at different points in a Rhododendron shoot.
One detector (-----) was mounted near the cut end of a 200rnrn Rhododendron
shoot, the other ( ..... ) in the petiole of a leaf about 100rnrn away from
the first.

50
one mounted in the petiole of a leaf in the terminal cluster, the other into
the xylem of the stem near its cut end. Clicks detected at each site were
recorded on a twin channel chart recorder.
The experiment was repeated seven times with similar results in each case.
The patterns of click frequency against time were the same for detectors
inserted at both sites. This was despite the number of clicks detected at one
point being up to 3-4 times that detected by the other detector over the same
interval on some occasions.
Clicks detected by one of the detectors often corresponded to clicks
detected by the other, indicating transmission of the click vibrations over
substantial distances. However, many of the clicks were unique to one or the
other of the detectors irrespective of which detector recorded the most clicks
during the course of the experiment.
In general many more clicks were recorded by a detector inserted into the
stem of the shoot than into a petiole on the same shoot. It could not be
determined if this was due to better conduction of vibrations in the more solid
xylem of the stem than of the petiole or because of a greater number of cavita
tion events occurring in the stem.
3.2.6. The role of temperature during acoustic experiments
Figure 11 shows cavitation profiles (section 3.5) drawn from the results of
acoustic experiments conducted with or without prior warming of the sound
proofed box in which the experiments were conducted.
These experiments were conducted to test whether differences in trans
piration rates between experiments conducted at different temperatures might
affect the results obtained.
There was no observable difference in the cavitation profiles drawn using
data from acoustic experiments conducted in 'cold' (cabinet temperature 293-298K)
or 'hot' (cabinet temperature 307-309K) conditions.
In addition, it was feared that leaf temperatures high enough to cause leaf

40
~ o 20
- --
1 2 3 SAP TENSION (MPa)
Figure 11. The effect of temperature on determinations of the sap tensions
causing cavitation. The cavitation profiles (section 3.5) were drawn up
using data from acoustic experiments using Rhododendron leaves and starting
when the acoustic cabinet was at room temperature (293-298 K) ( ) or
had been warmed for half an hour and the inside temperature was about
3 08 K (- - -- - ) •

damage might result from the use of an incandescent lamp to stimulate trans
piration.
Leaf and air temperatures during acoustic experiments were measured
using thermocouples soldered from 0.024mm chromel and constantan wire. The
temperature of a Rhododendron leaf mounted on the acoustic detector was
monitored by a thermocouple held against the side away from the incandescent
lamp speeding transpiration. A second thermocouple positioned in the air
several centimetres away and shielded from the lamp by a square of aluminium
foil measured air temperature.
The results showed that during an acoustic experiment leaf and air
temperatures rose to 30~SK and 308 K respectively over the first hour, and
remained at these levels for the remainder of the experiment. \fuen the cabinet
door was opened, air temperature fell rapidly to ambient but leaf temperature
only fell by about O.SK, suggesting that leaf temperature was conditioned
mainly by radiation load from the lamp, as suggested by Milburn (1973a).
As leaf temperature remained within reasonable limits, no efforts were
made to control either leaf or cabinet air temperature during acoustic
experiments. However, the lamp used to speed transpiration by the leaf was
usually switched on half-an-hour or more before starting experiments so that
the balance on top of the sound-proofed cabinet would not suffer changes in
tare readings as it warmed up during experiments.
3.2.7. Discussion of sections 3.2 - 3.6
The acoustic technique. Before using the acoustic technique to investi-
gate the sap tension at which cavitation occurs, it was necessary to know the
limitations in the technique itself. The results which have been presented
confirm those obtained by earlier workers (Milburn and Johnson, 1966; Milburn,
1973 a and b; Milburn and McLaughlin, 1974; and Nonhebel, unpub.) who used a
variety of material (Ricinus, Plantago and Lycopersicum) for their experiments.
Rhododendron ponticum was used for most of the experiments because it

52
produced loud clicks with a minimum of accompanying noises (for instance, from
rubbing of leaf parts), experiments using it ran over convenient times (two
three hours) and the leaves and sterns were mechanically tough.
The pattern of click frequency with time during acoustic experiments was
similar to that reported for leaves of other species (see above). Also the
rapid onset of a click and of the apparent dependence of the frequency of the
detector output signal on the geometry of the leaf and detector combination
are similar to the results obtained using Ricinus leaves on a more massive
magnetic transducer (Milburn and Johnson, 1966). It was decided that a simple
discriminator acting on,. the amplitude of the detector output would be sufficient
for automating the recording of cavitation. The variability in the frequency
and duration of transducer signal output for each click was thought to preclude
any selection of signals by methods based on their frequency or duration.
The selection of clicks on the basis of loudness compounded the variability
in the number of clicks recorded, which was already present due to differences
in the contact of the detector needle and the xylem, the weighting of the
detector elements and the performance of the detector transducers.
However, the pattern of clicks detected did not seem to depend on the
loudness of the clicks selected for recording. This confirms the results
obtained using Ricinus (Milburn, 1973b). Because the pattern of clicks generated
during acoustic experiments was not dependent on the detector sensitivity
(section 3.2.4) or on the placement of the detector in the xylem (section 3.2.5),
it was considered that, if the pattern of clicks was used, it was possible to
use the acoustic detector to compare cavitation phenomena between leaves of
different species.
The rapid response of click frequency to changes in transpiration rate is
very simi lar to that recorded in Ri cinus (Mi lburn, 19 73a) . This was taken as
evidence that sap tensions were likely to be nearly equal in all parts of the
xylem of the sample, as was concluded by Milburn (l973a). In addition, the
rapid response was also taken to indicate that cell and xylem water potentials
were not far from equilibrium. This is important as sap tension in leaves

during acoustic experiments can then be calculated using the relation of sap
tension to RWC for similar leaves in which cell and xylem water potentials
were in equilibrium (section 3.5).
3.2.S. Observation of gas arising in xylem conduits during acoustic experiments
In figure 12 and plate 3 are presented the results of an experiment in
which the appearance of gas in the conduits of an Acer shoot was recorded at
the same time that clicks were monitored by the acoustic detector.
The experiment required for its execution plant stems in which the xylem
was sufficiently translucent that bubbles in individual conduits could be
observed. The xylem must also be able to be exposed with a minimum of mani
pulation and damage to the stem. It was advantageous if the material produced
loud clicks and could be quickly stressed to cavitating sap tensions.
Branches of Acer pseudoplatanus met all these requirements.
Bubbles could also be seen in the xylem of Pelargonium stems. However,
this species was unsuitable for this experiment as (a) the clicks produced were
very quiet and (b) the rate of water loss under moderate conditions was so slow
that over the long periods necessary for experiment the exposed xylem became
opaque.
(a) Clicks and the appearance of gas in xylem conduits
Figure 12 and plate 3 show the results of an experiment conducted using an
Acer shoot. In June 1982 branches 1-1.5 m in length were cut underwater from
8-9 year old Acer plants growing in the grounds of the laboratory. The branches
were hydrated (section 2.1.1) overnight before experiments. Before experiments
began the shoots were trimmed to leave 100-150 mm of the previous year's shoot
below the node between that and the current season's growth.
Two branches were held against a stiff board by adhesive tape and 40mm of
xylem of the current season's shoot growth exposed by peeling back the bark.
One shoot was set to transpire Indian ink suspension (section 2.7), and the

54
other distilled water from.02dm3phials.
the ends of the shoots exposed to air.
Care was taken that at no time were
One channel of the twin channel acoustic detector was connected to the
xylem of each shoot by inserting the detector needle into the stern about 40rnrn
above the exposed part of the xylem. By inserting the needles from the side
it was possible to mount the detectors without damaging the xylem strands
exposed lower on the stems.
A photographic lamp speeded transpiration by the shoots and provided light
for photography.
Photographs were taken at intervals (indicated in figure 12) and click
production by each shoot monitored continuously.
Unfortunately the background noise levels were very high because the
experiments had to be conducted outside the sound-proofed box. Consequently,
discriminator thresholds were set at high levels and detected click frequencies
were correspondingly low. Also, the detector channel monitoring the control
shoot (transpiring distilled water) was functional for only part of the
experiment.
Because of these problems the results shown in figure 12 are not as clear
as they might be. An indication of the high noise levels during the experiment
is seen from the apparent synchrony between patterns of clicks detected in the
control and dehydrating shoots (figure 12). Aural monitoring of both detector
channels at intervals confirmed that many 'click'-like noises were heard on the
channel monitoring the dehydrating shoot but were almost entirely absent from
the control shoot. Very high levels of rubbing noises could be heard on both
channels as the shoots moved slightly against the backing board.
The increase in the contrast of the vascular strands against the green
ground tissue of the stems is easily seen as the experiment progresses (plate 3).
At the same time there is an increase in the number of noises recorded by the
acoustic detector. The first appearance of gas between parts B and C of plate 3
occurs at the same time as click frequency first starts to rise (figure 12).
The increasing contrast between the vascular strands of the sterns and the ground

30
c20 E
--Vl ~ LJ =:J 10 u A
o
B t
c t
D t
90
TIME (min)
E f
180
Figure 12. Click frequency in Acer shoots transpiring Indian ink (-----) or
distilled water (-----). Part of the record of clicks in the shoot transpiring
distilled water is missing because of an equipment fault.
the times at which the photographs of plate 2 were taken.
40
30
-20 c E
10 -:t --Vl ~ LJ 20 >-<
3 .--J U
10 2
00 20 40 TIME (MINUTES)
60
The arrows indicate
5 4
80
Figure 13. Click frequency in Acer leaves until removed from the acoustic
detector. Balance pressures of leaves removed from acoustic detector when
click frequency was:
a) rising
Leaf 1 - 0.35 MPa
Leaf 2 - 1.03 MPa
b) near maximal
Leaf 3 - 1.13 MPa
Leaf 4 - 1.37 MPa
c) declining
Leaf 5 - 0.90 MPa

Plate 3. The appearance of gas in the vascular bundles of Acer shoots when
water stressed. The shoot of the left is transpiring Indian ink, that on
the right distilled water. The photograph.<=; were taken at the times indicated
in figure 12. At the end of the experiment air was admitted into the vascular
strands of both stems by cutting notches in the stem.
The presence of gas in the xylem conduits is indicated by a lighter
colour of vascular strands. This is first seen in the shoot transpiring
Indian Ink in part C and develops progressively in D and E. No gas is
seen in the xylem of the shoot transpiring distilled water until air was
deliberately admitted into the conduits by notching the xylem (part F). ( x 2)

55
tissue seen in parts O-E of plate 3 is concurrent wi th a continuing high
click rate. At the end of the experiment the contrast between the vascular
strands and the ground tissue in water stressed stems is seen to be very
similar to that occurring when air is admitted to the xylem of a previously
unstressed stem (plate 3, part F). The similarity of appearance between
conduits in stems which have been cavitated by imposition of high sap tension
and those to which air haS been admitted strongly suggests that the increasing
contrast is due to the appearance of a gas phase in the xylem.
At the end of the experiment the shoot transpiring Indian ink suspension
was severely wilted and a leaf removed from it found to have a balance pressure
of 1. 10 MPa. The shoot transpiring distilled water was still unwilted and a
leaf removed from it had a balance pressure too low to be accurately assessed
by the gauge on the pressure chamber (i. e balance pressure was less than 0.05 MPa) .
. (b) Testing for entry of air into xylem condui ts
Two Acer shoots similar to those used above were retrimmed under water so
that only 4Smm of stem remained below the node separating the current and
previous seasons' growth. The shoots were then set to transpire the Indian ink
suspension (section 2.9) until the leaves had dried to brittleness (this
occurred if the shoot was set to transpire the ink suspension on a laboratory
bench overnight).
When these stems were sectioned ink was seen to occupy the vessels of both
the current and the previous seasons' xylem in a section cut approximately lSmm
below the node separating the current and previous years' extension growth. In
another section cut lSmm above the node no ink was found.
These results were taken as evidence that the apical movement of ink in
the transpiration stream was halted in the region of the node. This was
presumed to be due to the presence of pit membranes in the node.
Also, as the leaves of the stems dried to brittleness (which did not happen
at leaf balance pressures between 0 and 1. 37 MPa), wi thout ink being drawn through

these pit membranes, the experiment was taken as indicating that the pit
membranes did not rupture when subjected to differential pressures of as much
as 1.37 MPa. If the membranes had ruptured ink would have passed to the
vessels in the xylem of the current year's shoot. This did not happen in
this experiment or in the acoustic experiment described previously.
(c) The balance pressure of cavitating Acer leaves
Figure 13 shows the results of an experiment conducted to determine the
approximate sap tensions at which clicks occurred in leaves from shoots similar
to those used in the preceding experiment.
Acer leaves from shoots similar to those used in the preceding experiments
were mounted separately on the acoustic detector and click production monitored.
Leaves were removed from the acoustic detector and their balance pressures
determined when (a) clicks were just beginning, (b) were occurring near the
maximal frequency and (c) click frequency had begun to decline after the
maximum.
The balance pressures of the leaves for which click production was
monitored are given in the legend to figure 13.
Clicks were first heard in leaves when balance pressures were slightly
in excess of 1 MPa and had started to fall by the time balance pressure had
reached 1.3 MPa.
3.2.9. Discussion
The evidence linking acoustically detected clicks to cavitation of xylem
sap is mainly circumstantial. Dehiscence of fern sporangia was reported to
be accompanied by a 'click' (Milburn and Johnson, 1966). The click was
presumed to be due to cavitation of sap in the cells of the sporangial wall
although it may also have been caused by the elastic recoil of the opening
sporangium.
An audible click was associated with the fracture of water in sealed glass

57
tubes (Dixon, 1914) but the direct linking of clicks (detected by the acoustic
detector) to cavitation of xylem sap has not yet been achieved. In the
experiments cited by Crafts ~~., 1949) there was no record of audible clicks
occurring in conjunction with the appearance of gas in the xylem.
Milburn and Johnson (1966) linked acoustically detected clicks to
cavitation of xylem sap on the basis of circumstantial evidence, including a
decrease in the rate of water uptake by Ricinus leaves stressed to the same
extent as those in which clicks occurred (Milburn, 1966). Later work
(Milburn, 1973 a and b; Milburn and McLaughlin, 1974) showed that (a) clicks
were apparently not all due to tissue fracture, (b) their frequency could be
altered by changing the rate at which sap tension changed, (c) the recovery
of clicks in previously dried material was not immediate and was not dependent
on whether non-xylem tissues were alive or dead.
The results of experiments with Acer (section 3.2.8) have shown that gas
appeared in the vascular strands of young shoots at the same time that clicks
were detected in the shoot. It was unlikely that the gas could have entered
from the cut end of the shoots as (a) the cut end was submerged under the
surface of a liquid (diluted Indian ink) and (b) a similar shoot transpiring
distilled water maintained its water potential, indicating that the vessels
of the basal end of the shoot were still able to conduct water and were not
embolised by gas admitted to the conduits during preparation for the experiment.
Also, as Indian ink did not appear in the vascular strands of the shoot, it
was unlikely that the pit membranes of the node between the current and previous
years' shoots had ruptured to admit air to the parts of the xylem under
observation.
Experiments also showed that clicks were detected in the Acer shoot and
in leaves detached from similar shoots at sap tensions of between 0.9 and 1.2
MPa. This is slightly lower than the sap tensions at which cavitation was
expected in Acer (table 8). However, cavitation was found to occur at lower
sap tensions in immature than in mature Rhododendron leaves (table 9). As
the Ac.er samples used in the above experiment were not yet fully mature (they

58
were sampled early in the summer) the slightly lower sap tensions at which
cavitation occurs in these experiments may have been a reflection of this
immaturity.
Although gas appeared in the xylem at the same time as clicks were
detected, and at a time when sap tensions were comparable to those at which
clicks were detected in leaves, it was not possible to link the appearance of
gas in individual conduits to a particular 'click' for two main reasons.
Firstly, the xylem in each strand consisted of considerable numbers of vessels
overlying each other and also overlaid by fibres and parenchuma. It was
therefore unlikely that one should be watching, or be able to see, a particular
conduit at the time that it cavitated.
Secondly, the acoustic detector had been mounted so that its needle was
inserted into different vascular strands than those which were exposed for
observation. Although the vibrations produced by cavitation in a conduit in
one strand may have been detectable by the acoustic detector mounted in
another (section 3.2.5), they would be expected to be very much fainter than
those occurring in the strand into which the detector had been mounted and may
not have been passed by the discriminator.
Although the experiments linking clicks to the appearance of gas in Acer
xylem provide more direct evidence that clicks are the result of sap cavitation
than do the experiments conducted by Milburn (see above), the direct linking
of a click to a single observed cavitation event has not yet been achieved ..
In addition, although the experiments with Indian ink indicate that the gas
observed in the xylem did not enter from the cut ends of the conduits, the
experiment did not help to resolve whether the gas entered the xylem from
elsewhere, for instance from gas filled fibres or wounds, or arose entirely
within the conduit.
59
3.3. Determination of sap tension in leaves during acoustic experiments
3.3.1. Introduction
Sap tension in samples on the acoustic detector can be estimated in several
ways. These may involve measurement of sap tension of the leaves at intervals
during acoustic experiments, the rehydration of leaves from acoustic experiments
and measurement of balance pressure during a subsequent drying cycle, or the
measurement of sap tension and clicks in different groups of leaves.
Sap tensions can be found from balance pressure measurements if certain
conditions are met. The most important condition is that the distribution
of water in the leaf is the same when the leaf is held at the balance pressure
as it was before excision from the plant. This relation may be altered by
entry of air into the xylem conduits as the leaf is dried on the laboratory
bench or by the evacuation of water from xylem conduits after cavitation.
Refilling of conduits emptied by either process may cause over-estimation of
the turgor component (and therefore sap tension) of the sap in the remaining
water fi lled conduits. This problem is investigated in the next section
(3.4.2) .
The most direct way of measuring sap tension during acoustic experiments
would be to measure the water potential of the leaf on the acoustic detector
psychrometrically as the experiment progresses. Sap tension can then be
calculated from the difference between ~l and the osmotic potential (~s) of
the sap (Boyer, 1969).
In practice this method is unsatisfactory for several reasons. It is
unlikely that the thermal stability required for the successful use of psychro
metric methods will be obtained under the conditions used for acoustic
experiments (Campbell and Campbell, 1974). Periodic sampling of leaf discs
for measurement of ~l in separate psychrometer chambers causes damage to the
leaf and results in uneven drying across the lamina. In addition, considerable
6U
variability in ~l is known to occur across the leaf (Masip, 1979; Campbell
et al., 1966) so that the calculated sap tension will be partly dependent on
from which part of the leaf the sample was taken.
By contrast, the pressure chamber can be used to obtain averaged sap ~ p
for the leaf more quickly than can the psychrometric technique.
The pressure chamber can be used to measure sap ~ in leaves removed from p
the detector during acoustic experiments. However, this approach is limited
by the infrequency with which sap ~ can be determined during experiments. p
In addition, errors in sap pressure determinations may be caused by damage to
the leaf xylem caused by mounting on the acoustic detector (Slavik, 1974).
It is therefore desirable that indirect methods be used to assess the sap
tensions in leaves during acoustic experiments. This aim was accomplished by
drawing up calibration curves of sap ~ against RWC for leaves of each species p
used in acoustic experiments. As changes in leaf RWC during acoustic
experiments were known this calibration could then be used to estimate the
sap tensions in these leaves.
The pressure chamber can be used to derive the relation of sap tension to
RWC of the leaves from acoustic experiments or from other, similar leaves.
Moreover, the relationship can be derived by detailed study of a few leaves
or by a less intensive study of many.
It was decided that the best way of obtaining a useful calibration of sap
tension against RWC for this study was to measure at intervals the balance
pressures of many leaves as they transpired on a laboratory bench. The
reasons for selection of this technique and the rejection of other possible
methods are given below.
3.3.2. The relation of balance pressure to RWC
Calib~ation curves of balance pressure against RWC for leaves of the
species used in acoustic experiments are shown in figurffi 14 and 15.
Hydrated leaves similar to those used in acoustic experiments were allowed

Figure 14. 'Calibration curves' relating balance pressure (P) to RWC for
leaves of all species for which cavitation profiles were constructed. In
the case of Acer, Plantago and Rhododendron only one example of the relation
is shown as the several collections made differed only slightly.

3.5 ACER 3.0
2.5
2.0
1.5
1.0
0.5
o. 0 i&.--'------'----'_~__'____'" _ _'___'
90 80 70 60 50 40 30 20
3.0
2.5
ro 2.0 0... :L Q. 1.5
1.0
0.5
0.0
R\.JC (I.)
EUCALYPTUS
... ....+ • . . ..
. . + ..
+ + •
ro CL ::L -Q.
3.5
3.0
2.5
2.0
1.5
1.0
0.5
ALNUS
" .. . " " + +
."
o. 0 1::-...<'---'---'---'--'-~_'_-'--~.4--~
4.5
4.0
3.5
3.0
ro CL 2.5 ::L Q. 2.0
1.5
1.0
O.S
95 90 85 80 75 70 65 60 55 50 45 40 R'.JC (I.)
FRAXINUS
+ +
•
. ..... .... +
+ + + .... • + • ... .
.
90 80 70 60 50 40 30 o. 0 l*-~:---::-~:-:--'-_-'-_'----L._
90 80 70 60 SO 40 30
ro 0... :L -Q.
0.8
0.6
0.4
0.2
R\.JC (I.)
LYCO P ERSICUM .. . • + . .. +. . .+
++ ;+
• ~ +
o. 0 ~~'---"'--""---'---'---'--'---'---' 95 90 85 80 75 70 65 60 55 50
R\.JC (I.)
3.5 RHODODENDRON 3.0
2.5
~ 2.0 :L Q. 1.5
1.0
0.5
(OCTOBER
0 •. 0 L-.A ____ --'--..&--'---'---____ -----..---&---'--'
95 90 65 60 75 70 65 60 55 50 45 40 R\JC (%)
ro CL ::L -Q.
R\JC (I.)
3.0 PLANTAGO (G) 2.5
2.0
1.5
1.0
. . . ..
95 90 85 80 75 70 65 60 55 SO 45 40
1.6
1.4 RICINUS 1.2
1.0
0.6
0.6
0.4
0.2
• . .
R\JC (%)
..
o. 0 ~----'----'----'--_'--------' 95 90 65 60 75 70
R\JC (%)

3
to
t 2 • A
0
ro • 0-2: t,
0
0-1
o~--~--~----~--~----~--~ 100 80 60 40
5
4
ro 0- 3 ~
0- 2
1
RWC ( % )
It.
•
6.
It. • 0
fj
o----~----~--~----~----~--~ 100 80 60
RWC
Figure 15. The relation of balance pressure (P) to RWC of a) Acer
and b) Fraxinus leaves constructed from experiments using air (0) or
40
nitrogen (~) in the pressure chamber. Open symbols indicate a first
balance pressure measurement with a particular leaf, closed symbols,
subsequent measurements.

61
to transpire on the laboratory bench and their balance pressures measured at
intervals. An exact duplication of drying rates of leaves used in acoustic
experiments and those used in drawing up the relation of sap tension to RWC
was not attempted. It was considered that (a) sap tensions and 0/1
were
probably close to equilibrium in leaves drying rapidly on the acoustic
detector (section 3."'. 3) as well as in those drying more s lowly on the laboratory
bench and that (b) any inequilibria in the relation caused by drying rates
would probably disappear in the time taken to make a balance-pressure measure
ment.
Multiple measurement of balance pressure on each leaf
Several balance pressure measurements were made with each leaf, unless it
had been damaged on a previous measurement, in which case the leaf was discarded.
As is seen in figure 1Sb multiple use of Fraxinus leaves in this manner
did not result in an observable change in the relation of balance pressure to
RWC from that found when leaves were used only once. This was found to be
true for all species except those with very soft petioles (e.g. Lycopersicum
and Ricinus) which were almost always damaged by the pressure chamber seal.
Two factors capable of causing changes in the relation of leaf balance
pressure and RWC were thought worthy of further investigation. These were
i) temperature changes occurring during pressurisation and depressurisation
of the pressure chamber and
ii) narcosis and anaerobis which might occur if the leaf is held at high
pressures for long periods in the pressure chamber.
i) Temperature changes in the pressure chamber
Figure 16 shows the result of an experiment conducted to measure the
changes in leaf temperature occurring during a typical balance pressure
measuremen t. Chrom~l-constantQn thermocouples were held against a Rhododendron
leaf or left free in the ai r of the pressure chamber. A pressure cycle at
rates of pressure increase and decrease similar to those used in measuring
balance pressure and extending to a maximum pressure of 4.14 ~Wa was undertaken.

TIME (min)
O~_1~~2 __ ~3~ O~~1 __ ~2 __ ~3 __ ~4 __
298
LEAF TEMP--+--1
AIR TEMP----i
t o 1
P (MPa)
273
268
t 4 0
P(MPa) Figure 16. Temperature changes occurring during measurement of balance
pressure of a Rhododendron leaf. Only the most extreme changes in
temperature are shown. Records of leaf and air temperature when pressure
is falling have been separated slightly to improve clarity.
--

u-
Temperature changes were greatest when the first increments of pressure
were applied or the last increments released. Air temperature was more
variable than leaf temperature (figure 16). The maximum increase in air
temperature was .1.SK whereas the maximum for the leaf was 1. 3K. When pressure
was released both leaf and air temperatures fell markedly, the leaf to 27S.4K,
the air to 266.SK. The leaf returned to room temperature within 3 minutes if
left in the pressure chamber and within a minute if removed from the chamber
immediately that pressure was released, the usual procedure when constructing
the calibration curves.
There did not appear to be discernible adverse effects caused by multiple
determinations of balance pressure on a single leaf (figure 15). Temperature
measurements during a typical pressure cycle indicated that, as long as the
rate of pressure increase was slow, temperature increases during an experiment
were of only a few degrees (figure 16). Temperature changes during pressure
release were much greater with chamber air temperature falling to well below
freezing. Leaf temperature fell less, probably due to the thermal mass of
the leaf (Puritch and Turner, 1973) and did not fall below freezing.
These temperature changes were short lived and apparently did not affect
the relationship of balance pressure to RWC.
ii) Effects of exposure to gas at high pressure
Figure 17 shows the effect on leaf balance pressure of prolonged exposure
of leaves to air at high pressure. Calibrations of balance pressure against
RWC drawn up using air or nitrogen are shown in figure 15.
Leaves of Acer, Fraxinus and Rhododendron were exposed on the laboratory
bench to develop water deficits and then mounted in the pressure chamber.
Evaporation from the leaves whilst in the pressure chamber was minimised both
by enclo2ing the leaf in a small, prehumidified plastic bag, and by lining
the pressure chamber with moist paper towel (Jones and Higgs, 1980; Tyree et
~, 1978).
The chamber was pressurised with air and the balance pressure determined.
The pressure was then released by 0.1-0.2 MPa and maintained at this leve 1.

--
o 1 2 TIME
3 4 (hours)
5
Figure 17. The effect on leaf balance pressures of long periods of
exposure to high pressures of air (closed symbols) or nitrogen (open
symbols).
o Acer
f:., Fraxinus
o Rhododendron
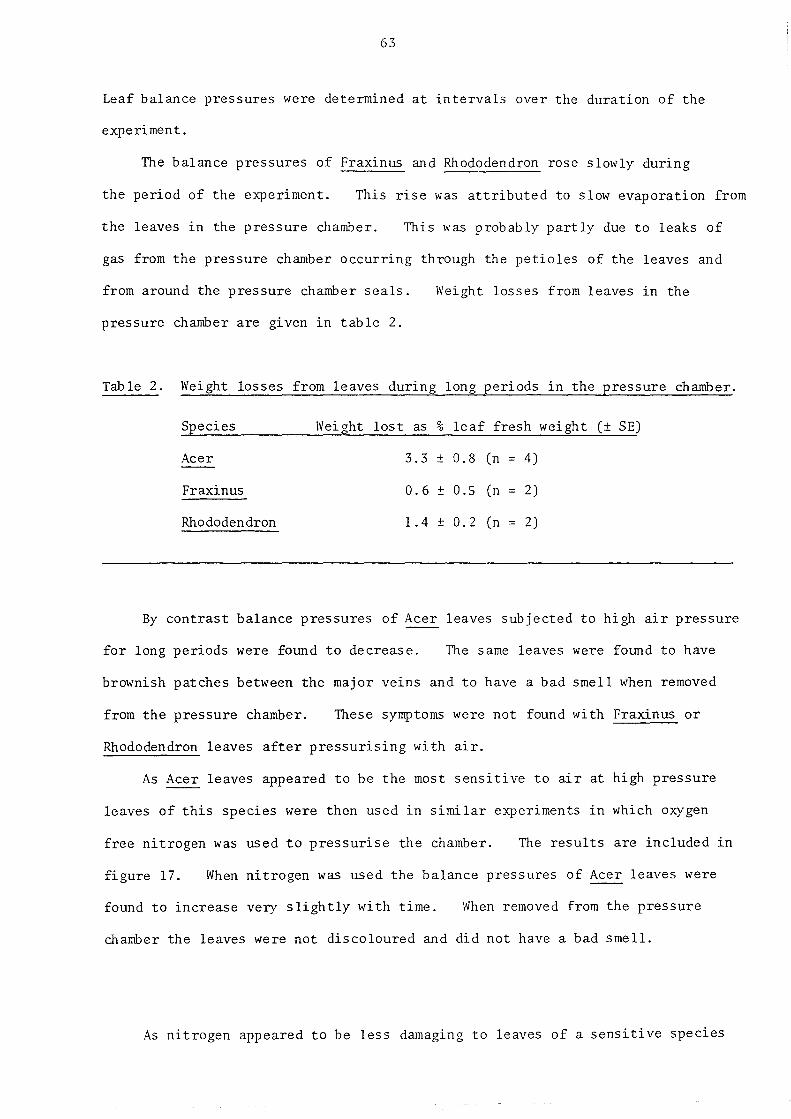
63
Leaf balance pressures were determined at intervals over the duration of the
experiment.
The balance pressures of Fraxinus and Rhododendron rose slowly during
the period of the experiment. This rise was attributed to slow evaporation from
the leaves in the pressure chamber. This was probab ly part ly due to leaks of
gas from the pressure chamber occurring through the petioles of the leaves and
from around the pressure chamber seals.
pressure chamber are given in table 2.
Weight losses from leaves in the
Table 2. Weight losses from leaves during long periods in the pressure chamber.
S]2ecies Weight lost as % leaf fresh weight (± SE)
Acer 3.3 ± 0.8 (n 4)
Fraxinus 0.6 ± 0.5 (n = 2)
Rhododendron 1.4 ± 0.2 (n = 2)
By contrast balance pressures of Acer leaves subjected to high air pressure
for long periods were found to decrease. The same leaves were found to have
brownish patches between the major veins and to have a bad smell when removed
from the pressure chamber. These symptoms were not found with Fraxinus or
Rhododendron leaves after pressurising wi th air.
As Acer leaves appeared to be the most sensitive to air at high pressure
leaves of this species were then used in similar experiments in which oxygen
free nitrogen was used to pressurise the chamber. The results are included in
figure 17. When nitrogen was used the balance pressures of Acer leaves were
found to increase very slightly with time. When removed from the pressure
chamber the leaves were not discoloured and did not have a bad smell.
As nitrogen appeared to be less damaging to leaves of a sensitive species
64
such as Acer than was air, nitrogen was used for most balance measurements
made during this project and for all studies requiring that the samples be
held at pressure for long periods.
Short-term effects of gas on balance pressure measurements
Comparisons of balance pressure measurements made using air or nitrogen
were undertaken using leaves of Acer, Fraxinus, Plantago and Rhododendron.
There did not appear to be any differences in the relation of balance pressure
to RWC arising from the use of air or nitrogen in the pressure chamber.
Therefore it was considered that calibrations of leaf balance pressures
against RWC drawn up using air in the early part of the project could be
safely used in analysis of the relation of sap tension to cavitation (section
3.5) and compared with those drawn up later when nitrogen was used in the
chamber.
3.3.3. Other methods of obtaining the relationship between balance
pressure and RWC
Attempts were made to obtain the relation of leaf balance pressure to RWC
by constructing pressure-volume (PV) curves (Scholander et ~., 1964) and by
rehydrating leaves from acoustic experiments. These techniques were subject
to considerable experimental errors (discussed below) which could be avoided
by intermittent measurement of balance pressure of similar leaves drying on
the laboratory bench. Also, these techniques were generally concerned with
obtaining a detailed relation of balance pressure to RWC in a single leaf.
Their application to a sufficient number of leaves to show the range of
variability within material would be extremely tedious.
i) Construction of P-V curves
The relation of balance pressure to RWC can be obtained by forcing the
leaf to lose water by applying overpressure in the pressure chamber. This
method also allows more detailed curves to be constructed than the less frequent
65
measurements of balance pressure of leaves drying on the laboratory bench
allow.
P-V curves were constructed for Rhododendron leaves by the procedure of
Tyree et~. (1978). Expressed sap was collected in small plastic phials
stuffed with paper tissue which was capped by a larger phial immediately after
termination of the sap collections.
It was found that evaporation (section 4.5, table 15) from leaves in the
pressure chamber and from the collection phials precluded the use of this
technique for accurately deriving the relation of balance pressure to RWC at
~l between full turgor and the point of incipient plasmolysis (section 3. 4 .4).
In addition, the volumes of sap expressed over pressure increments of 0.18 MPa
were small (tab Ie 15) and evaporation errors were compounded by balance errors.
Construction of P-V curves as a means of obtaining the relation of sap
tension to RWC was therefore rejected because of the problem of evaporative
water loss. Moreover, the time necessary to derive the relationship in the
number of leaves necessary to know the degree of variability between leaves
would limit that which could be devoted to other work.
ii) Rehydration of leaves from acoustic experiments
In figure 18 are shown the results of experiments designed to test the
feasibility of rehydrating leaves from acoustic experiments for subsequent
determination of the relation of balance pressure to RWC.
Acer and Fraxinus leaves were dehydrated on the laboratory bench to the
balance pressures indicated in the legend of figure 18. 10mm was then trimmed
under water from the petioles to remove gas emboli and the leaves stood with
their petioles in phials of distilled water in a humid atmosphere (section 2.1)
to rehydrate. At intervals the leaves were removed from rehydration, blotted
dry and weighed before returning for further rehydration. At the end of the
experiments the leaves were dried and their water contents (expressed as
percentages of their water content before stressing) calculated.
Acer leaves quickly regained their lost water content and thereafter

f-- 90 ~
:0 0'
-----------_ .. _--_. __ ._---
A
U I '
& 100r -~~ :j=-S--- ':: --r------~ j I --4------ ---------------10---- = I) - B
~jlB -- §
iI
80~,---,-1' __ -------.J
TIME OF REHYDRATION (HOURS)
Figure 18. Rehydration of leaves after water stress. Water content
during rehydration was calculated using the water content before
stres sing as 100%.
Le af bal an ce pres sures before rehydrati on:
A. Fraxinus: A 0 MPa B. Acer: A 1.37 MPa
B 0 IT B 0.0 " C 0.32 lv!P a C 1.19 IT
0 0.28 " 0 1. 36 '11
E 2.50 11
F 1.72 "

66
remained at, or very close to, their weights before being stressed.
Fraxinus leaves were slower to rehydrate and severely stressed leaves had
not recovered their initial weights after 24-25 hours of rehydration. In
addition, lightly and unstressed Fraxinus leaves took up more water than had been
lost during the rehydration period.
Rehydration of leaves was therefore rejected as a means of estimating sap
tensions in those leaves during acoustic experiments as it was evident from
even a small number of trials that the time taken for leaves to recover lost
water varied greatly between species and with the magnitude of the original
stress imposed. Also, whereas some species (Acer in the experiment) recovered
only the water lost during drying others (Fraxinus) regained more than was lost,
possibly indicating growth (Milburn and Weatherly, 1971). Although not
investigated in these species, it was possible that even in those leaves which
recovered only the water lost during stress, the relation of balance pressure
to RWC may have altered (for instance due to osmotic adjustment in response to
the original stress) between the first and second drying cycle. Because in
many species cavitation in some species started while cells retained some
turgor (section 3.5) even small differences in the recovery of leaves from
water deficits may cause relatively large errors in calculation of sap tensions
in cavitating leaves.
In addition, errors in balance pressure determination may result from the
damage to the xylem caused by the needle of the acoustic detector (Slavik, 1974;
Nonhebel, pers. comm.).
3.3.4. Discussion
Calibrations of leaf balance pressure against RWC were constructed using
leaves dried after excision for all the species for which the relationship
between cavitation and sap tension was to be determined. In every case it
was possible to draw a calibration line through the data. Scatter around the
calibration line was moderate and for most species a line could be drawn such

0/
that almost all data points fell within ± 0.2 MPa of it (e.g. figure 15).
Variability tended to increase as balance pressures increased. This was
partly due to difficulty in obtaining accurate balance pressure measurements
in severely water stressed leaves, but may have been a reflection of differences
in the desorption isothermsof individual leaves at low ~l'
It was considered that the calibrations of leaf balance pressure against
RWC were not likely to be in error due to artifacts arising from either
repeated determination of balance pressures using the same leaf or the use of
either air of nitrogen to pressurise the chamber. It was apparent, however,
that considerable care had to be taken to minimise mechanical damage to leaves
in the pressure chamber and also to restrict the use of air to experiments in
which the leaf was held at high pressure for only short periods.
Other methods of obtaining the relation of sap tension to leaf water
content were rejected as they were found to be subject to greater possible
error than was determination of the relationship by using a number of leaves
stressed after excision.
3.4. The effect of cavitation on pressure chamber measurements of sap tension
and leaf water potential
3.4.1. Introduction
The use of the pressure chamber to measure sap tension and, by allowing
for the osmotic potential (~s) of the xylem sap~ leaf water potential (~l) is
based on several assumptions.
Firstly, it is assumed that xylem and cell water potentials equilibrate
rapidly. It is probable that this is the case in small samples such as leaves
(Scholander, 1964) although quite long periods may be required before equili
brium is attained in larger samples, particularly if they have been subjected
to an initial overpressure (Tyree and Dainty, 1973).
Secondly, and of particular importance to this study, is the assumption

68
that the distribution of water in a sample held at its balance pressure is the
same as in the sample before it was detached from the plant. This will not
be so if normally empty voids in the xylem or other tissues become filled with
water when balance pressure measurements are made.
For leaves or shoots slmjected to water stress after removal from the
plant, as in the work reported here, these voids may take four forms.
They may be
a) xylem vessels emptied as water retreats from the cut surface until
held by the pit membrane (Scholander et al., 1965).
b) spaces in the xylem (e.g. embolised vessels and fibres) or in
other tissues (e.g. interstitial spaces in the pith) (Boyer, 1967).
c) water-stressed tissues in the sample (Ritchie and Hinckley, 1971).
d) conduits emptied by sap cavitation.
The investigations reported below were carried out to assess the use of
the pressure chamber to measure sap tensions and ~l in leaves and shoots at
cavitating sap tensions.
3.4.2. The effect of cavitation on balance pressure of shoots
The balance pressures of Rhododendron shoots and of leaves from these
shoots were compared at sap tensions ranging from near zero to greater than
those suspected of causing cavitation (figure 19).
The effect of cavitation on balance pressure measurements was investigated
in this manner as the relative xylem volume, and therefore the extra pressure
required to fill cavitated conduits before sap will appear at the cut end of
the xylem, is greater in shoots than in leaves.
Rhododendron shoots were hydrated overnight, trimmed to a stem length of
200mm and the apical bud removed. This left approximately 120-150 mm of
leafless stem with a cluster of mature leaves at one end. The shoots were
weighed and left to develop sap tensions by transpiring on ~he laboratory bench.
When the desired degree of stress had been achieved the shoot was sealed into

5
4
1
Figure 19.
• •
", .......... / ....
•
I "-I ' f \ , ,
/ \
• •
I \ I \ I \ I \
I , I \
I \ // ,
• •
.. 2 3
.. .
LEAF P (MPa) 4 5
Comparison of balance pressures of Rhododendron shoots with the
balance pressures of leaves from the shoots. The continuous line indicates a
1:1 relationship between the two. The broken line indicates the approximate
relationship between cavitation and sap tension in Rhododendron leaves.

69
a plastic bag to equilibrate overnight at room temperature.
After equilibration the shoot was weighed again, one leaf removed and
balance pressure of both the leaf and shoot determined simultaneously using
two pressure chambers controlled from a single gas admission valve.
and shoot balance pressures are compared in figure 19.
Leaf
Chamber pressure was increased particularly slowly (at about 0.002 -
.003 MPa s-l) to minimise errors due to inequilibrium within the shoot (Tyree
and Dainty, 1973).
After measurement of its balance pressure the single leaf was sampled
for psychrometric determination of ~l' Sap osmotic potentials were also
determined using sap expressed by overpressuring leaves or shoots in the
pressure chamber after their balance pressure had been measured.
At balance pressures between 0 and 2 MPa shoot balance pressures were
only slightly higher than leaf balance pressures (figure 19). As leaf balance
pressures increased above 2 MPa, shoot balance pressures increased more rapidly
with increasing water deficit than did that of leaves from the shoot. By the
time leaf balance pressures had risen to 4 MPa shoot balance pressures were in
excess of 6 MPa, the highest pressure which could be measured with the gauges
available.
a) Artifacts causing high shoot balance pressures
It was possible that the difference between leaf and shoot balance
pressures was an artifact caused by
i) non-equilibration of water potentials within the shoot when balance
pressures were determined,
or ii) evaporation from the shoot while in the pressure chamber.
i) Non-equilibration in the pressure chamber
Too fast a rate of pressure increase may result in over-estimation of
balance pressure which subsequently falls to its correct value as equilibrium
is attained (Waring and Cleary, 1967; Boyer and Gorashy, 1971). In table 3
are presented the results of experiments in which Rhododendron shoots were

70
brought to their apparent balance pressures at a rate of pressure increase of
-1 .002 - .003 MPa s and subsequently held at pressures just below this for
periods of from several minutes to several hours. At intervals the pressure
was increased again to obtain the balance pressure.
It was found (table 3) that shoot balance pressure increased at a rate of
0.1-0.4 kPa s-l over the period for which the shoot was held near its balance
pressure.
Table 3. Apparent balance pressures of Rhododendron shoots held at just below
the pressure at which sap appears at the end of the stem. Time is
taken from that of the first appearance of sap at the cut end of the
stem.
Shoot number
1 2 3 4
Time P Time P Time P Time P (min) (MPa) (min) (MPa) (min) (MPa) (min) (MPa)
0 3.45 0 3.98 0 3.45 0 3.2
4 3.60 7 4.10 7 3.53 40 3.4
6 3.60 9 4.20 16 3.55 60 3. 7
8 3.70 130 4.05
11 3.75 180 4.45
13 3.75
22 3.80
The results of similar experiments using Rhododendron leaves have been
shown in figure 17.
As shoot balance pressures increased rather than decreased when the shoot
was held at pressure, it appears that the di fference between leaf and shoot
balance pressures was not the result of inequilibration during balance pressure
measurements.

71
ii) Evaporation from the shoot
Evaporation from the shoot in the pressure chamber could result in a
fall ln ~l and hence in higher shoot balance pressures.
Weight losses by shoots during balance pressure determinations were
determined in three cases. These showed that 10-lSg shoots lost a mean of 0.3g
in weight over this period.. This was about 4% of the turgid water content of
these shoots. However, the stern held at near its balance pressure for three
hours (table 3) was found to have lost 1.47g in weight over this period,
amounting to 17% of the water content of the turgid twig.
In Rhododendron leaves a 4-5% fall in RWC will increase leaf balance
pressure by about 0.2 MPa, a 17% decrease by about 0.5 MPa (figure 14). By
extending these findings from leaves to shoots it appears that evaporation from
shoots was insufficient to account for the observed increase in shoot balance
pressure.
Increasing amounts of gas were found to be blown through the sterns of shoots
as chamber pressure increased and may have caused some of the evaporation
occurring during balance pressure measurements.
However, evaporation rates were insufficient, even in shoots maintained
at high pressure, to account for the magnitude of the differences between leaf
and shoot balance pressures which were found.
Evaporative water losses increase balance pressures by lowering cell ~,
including that of the leaves. Therefore balance pressures of leaves on the
shoot would be expected to increase during balance pressure measurements of the
shoots if the higher shoot balance pressures were due to evaporation. The
balance pressures of leaves sampled before or after the shoot balance pressure
was measured were compared (table 4) to see if this occurred.
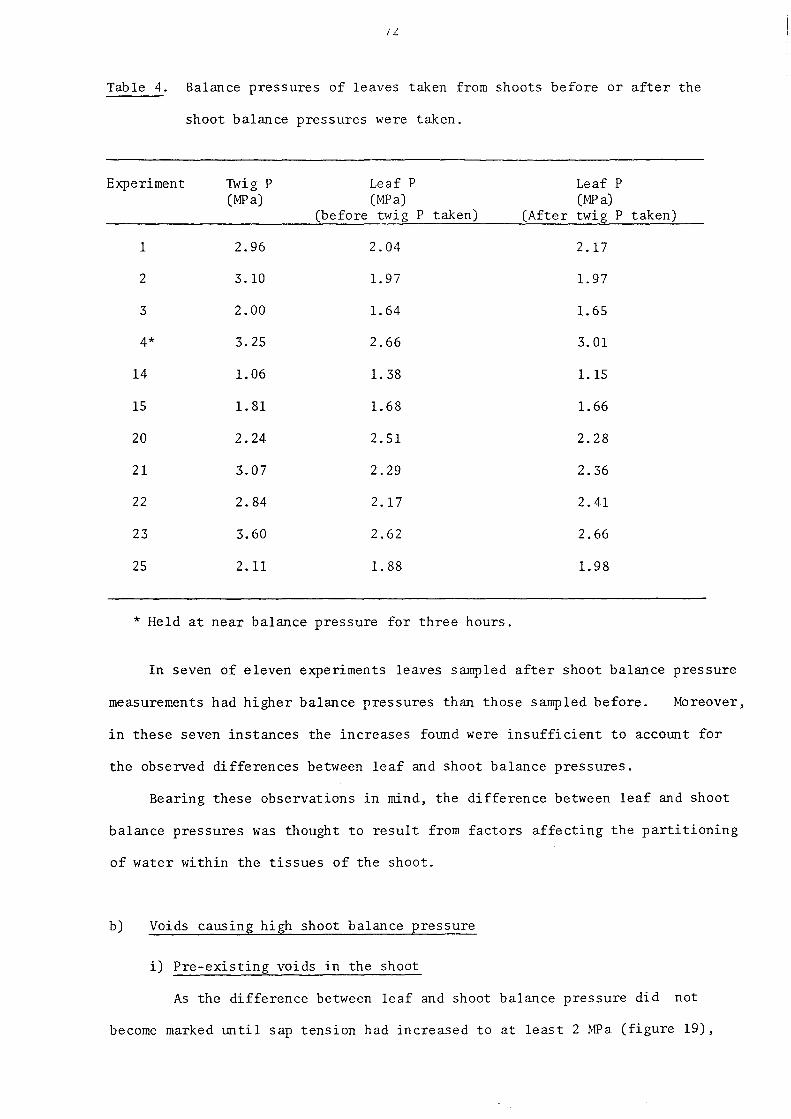
IL
Table 4. Balance pressures of leaves taken from shoots before or after the
shoot balance pressures were taken.
Experiment Twig P Leaf P Leaf P (MPa) (MPa) (MPa)
(before twig P taken) (After twig P taken)
1 2.96 2.04 2.17
2 3.10 1. 97 1.97
3 2.00 1.64 1. 65
4* 3.25 2.66 3.01
14 1.06 1. 38 1.15
15 1. 81 1.68 1.66
20 2.24 2.51 2.28
21 3.07 2.29 2.36
22 2.84 2.17 2.41
23 3.60 2.62 2.66
25 2.11 1. 88 1.98
* Held at near balance pressure for three hours.
In seven of eleven experiments leaves sampled after shoot balance pressure
measurements had higher balance pressures than those sampled before. Moreover,
in these seven instances the increases found were insufficient to account for
the observed differences between leaf and shoot balance pressures.
Bearing these observations in mind, the difference between leaf and shoot
balance pressures was thought to result from factors affecting the partitioning
of water within the tissues of the shoot.
b) Voids causing high shoot balance pressure
i) Pre-existing voids in the shoot
As the difference between leaf and shoot balance pressure did not
become marked until sap tension had increased to at least 2 MPa (figure 19),
73
it was unlikely that the difference was due to the filling of large voids
existing in a turgid or moderately stressed shoot. Such voids, be they
intercellular spaces or empty xylem conduits, constitute relatively large
diameter capillaries which will empty of sap as ~l falls over the first few
tenths of a megapascal.
The extra pressure required to express the sap needed to fill these spaces
before sap returns to the end of the shoot will therefore be necessary even
when the shoot has been subjected to little water stress (Scholander et ~. ,
1965 ). Moreover, as the volume of voids of this type is fixed, no great
changes in the extra pressure required is to be expected as the shoots become
progressively more water stressed. The early onset of differences between
shoot balance pressure and ~l resulting when pre-existing void spaces in the
shoot must be filled before sap returns to the end of the shoot has been
demonstrated in Rhododendron roseum shoots (Boyer, 1967). Moreover, Boyer
was able to see sap expressed from the xylem entering the pith of R. roseum,
a flow which was not observed in these experiments with R. ponticum.
The slightly higher shoot than leaf balance pressures found at balance
pressures between 0 and 2 MPa (figure 19) may have resulted from the filling
of the small voids created as sap retreated from the cut end of the stem as
the shoot dried from full turgor.
However, as the difference between R. ponticum shoot and leaf balance
pressures increased markedly as sap tension rose above 2 MPa (figure 19), it
was apparent that the void volume in these shoots was increasing as water
deficits increased. Such increases in void volume will occur if xylem conduits
are progressively emptied by cavitation. However, the differences in leaf and
shoot balance pressure may also occur if water expressed by gas pressure acting
on one group of cells flows to rehydrate other cells which are at a lower
pressure, for instance in the stem protruding from the pressure chamber (Waring
74
and Cleary, 1967).
ii) Increases in void volume caused by cavitation
Cavitation in shoots and leaves of R. ponticum is known to occur at
sap tensions of 1.4 - 2.5 MPa (section 3.5). This range of sap tensions
includes that at which the difference between leaf and shoot balance pressures
is seen (fugure 19).
The volume of the xylem luminae in the R. ponticum shoots used in these
experiments was not measured. However, Rivett (1920) estimates that the
lumina constitute about 20% of the xylem cross-section in similar R. ponticum
shoots.
It has been shown that even the small xylem volumes of seedlings
may contain sufficient water to cause marked changes in cell water potentials.
Cary et al. (1968) showed that ~ of corn and tomato seedling increased by up --to 0.25 and 0.1 MPa respectively when the xylem was deliberately embolised
(by cutting the stem) to make the xylem water available to the cells at
atmospheric pressure.
Water contained in the relatively large lumen volume of a Rhododendron
shoot may therefore be sufficient to keep ~ 1 high (nearer to zero): and cause
the observed differences between leaf and shoot balance pressures.
iii) Rehydration of cells by water expressed from elsewhere in the shoot
It was found that gas escaped through the xylem of Rhododendron
shoots in the pressure chamber. Therefore, steep gradients in gas pressure
existed in the stem xylem with pressure being at that of the chamber at one
end and at atmospheric at the other end. This gradient in gas presure, and
mechanical support of the xylem itself, may be sufficient to maintain the
xylem pith at a lower pressure than that to which the cells of the leaves and
epidermis are subjected. Consequently, ~ of the pith cells may be lower than
that of cells, e.g. in the leaf, which are exposed to the full chamber
pressure (Tyree and Hammel, 1972). As the pith and leaf cells are in hydraulic
contact through the xylem and cell wall water, water may therefore flow from

75
the cells at chamber pressure to the pith which is at lower pressure.
In this case the extra pressure required to return water to the cut end
of the stem will depend on the volume and desorption characteristics of both
the pith and the cell populations donating water to the pith as well as on
the pressures to which each is subjected (Tyree and Hammel, 1972). The
deviation of leaf and shoot balance pressures becomes marked at about the same
'¥ as that at which leaf turgor was reduced to zero (about 1. 9 MPa, table 7).
The difference between leaf and shoot balance pressures may therefore be due
to loss of turgor by the cells of the leaves at lower chamber pressure than
those of the pith which are protected from the full chamber pressure.
Such water exchange between the foliage and the pith has previously been
invoked as an explanation of the differences found between the balance
pressures of needles and twigs of several species of conifers (Ritchie and
Hinckley, 1971).
On the basis of the evidence obtained using Rhododendron ponticUID it was
impossible to determine whether cavitation or water uptake by partly
pressurised pith cells was responsible for the observed differences between
leaf and shoot balance pressure. However, it was considered most unlikely
that the difference was due to voids existing in shoots before they were
subjected to water stress.
3.4.3. The effect of cavitation on pressure chamber measurements of '¥I
a) Leaves from plants in the field
The results of experiments (described in section 2.4.2) in which balance
pressures and thermocouple psychrometer measurements of '¥l were compared are
shown in figure 20. '¥l determined by the pressure chamber and by psychrometry
are in reasonable agreement over the range of leaf balance pressures used in
these trials (0 to 3.5 MPa).
Most of the variation about the line of equality of pressure chamber and
pSychrometer measurements of '¥l was probably due to variations in psychrometer

3 • • -ru • CL •• 2: • • - • • CL 2 LL « w 0 ---1
1 •
o~--·----~------~~------~---o -1 -2 -3
(MPa)
Figure 20, 'Field' Rhododendron, Comparison of leaf balance pressure (P)
and leaf water potential (0/1) determined psychrometrically, All 1 eaves
were from water stres sed shoots, Open symbols indicate five s amp 1 es from
the same leaf. The diagonal line indicates a 1:1 relationship between
P and IjIl'

76
measurements. Psychrometer measurements of ~l of several leaf discs cut
from the same leaf showed differences of up to 1. 5 MPa in 'JI l between samples
(figure 20).
No sudden change in the relation of balance pressure to '¥l which might
be caused by cavitation was fotmd (West and Gaff, 1971).
The equality of balance pressure and psychrometer measurements of 'JIl
suggests that in Rhododendron leaves
i) balance pressure measurements yielded good estimates of '¥l
and ii) cavitation of xylem sap did not cause identifiable errors when the
pressure chamber was used to measure sap tension.
b) Leaves from plants in the glasshouse
The relation of balance pressure to '¥1 was also investigated using
Rhododendron plants growing in pots in the glasshouse.
Leaves were stressed in one of two ways for this experiment.
i) Starting in late June 1982, plants were denied water and leaves sampled
for balance pressure measurements at intervals of several days as stress
increased. The leaves were enclosed in small plastic bags for about
twenty minutes before removal from the plant to minimise post-excision
changes in '1'1 (Turner, 1981). After obtaining the balance pressure the
leaves were sampled for psychrometer determination of '¥l.
ii) Leaves were cut from well-watered plants and allowed to transpire on the
glasshouse bench before measurement of balance pressure and '1'1.
The results of both i) and ii) are included in figure 21.
At low balance pressures '1'1 was lower than the corresponding balance
pressure would indicate. At high balance pressure the opposite was true and
'JI l was higher (nearer zero) than the balance pressures indicated.
Results were similar whether leaves were stressed on or off the plants.
The relation of balance pressure to '1'1 obtained in this experiment was
different to that fotmd when the same comparison was made using leaves from a
plant growing in the field.

2 o 0 000
- • • • 0
ro ··o~o 0.... 0
~ 0 - .. 0 ...
0.... • LL 1 « w -.-.J • • • • • •
• 0 0 -1 -2
~l (MPa)
Figure 21. 'Glasshouse' Rhododendron. Comparison of leaf balance
pressure (P) and leaf water potential (~l) determined psychrometrically.
o Leaves from water stressed plants.
• Leaves dried on bench after cutting from well-watered plants.
The diagonal line indicates a 1:1 relationship between P and ~l'

77
It is possible that the psychrometer values of fl were in error because
of the effects of wounding during sampling. Talbot et al. (1975) have shown
that wounding during sampling for the psychrometer may cause fl to rise (become
less negative) by up to 1 MPa. The magnitude of this effect seems to depend
on both the species and the ratio of cut surface to sample volume.
The leaves from plants in the glasshouse were less glabrous, smaller and
thinner than those of plants in the field. As a result, leaf discs punched
from leaves of glasshouse plants often had ragged edges, whereas those from
the field plants, being thicker and stiffer, were cut more cleanly. The
higher ratio of damaged cell surface area to total sample volume in the leaves
from glasshouse plants may have been responsible for the appearance of wounding
effects on fl in leaves from the glasshouse plants, but not in the leaves from
the field.
c) Psychrometer determinations of turgor
Calculations of leaf turgor (~ ) were made using psychrometer data obtained p
using glasshouse plants. The results were very scattered and, because of the
effects of wounding during sampling on f l , may bear little resemblance to those
occurring in healthy leaves. For these reasons the f values calculated in p
this manner could not be compared with ~ values obtained from pressure chamber p
measurements and will not be discussed further.
d) Osmotic potential of xylem sap
i) From turgid leaves
Balance pressures may be approximated to fl if xylem sap 'fIs is near
zero (Duniway, 1971; Boyer, 1967). Determinations of ~s of sap expressed
from leaves of each of the species for which the relation of balance pressure
to RWC was derived were carried out. The result s are pres ented in table 5.

78
Table 5. Osmotic potential of xylem sap expressed from turgid leaves of
the species used for acoustic experiments.
Species '¥ (MPa) Number of s samples (± S.E.)
Acer - 0.14 ± .07 6
Alnus _.07 ± .03 4
Eucalyptus -.07 ± .00 3
Fraxinus -.06 ± .02 3
Lycope rs i c urn -.06 ± .01 2
Plantago -.22 ± .08 3
Rhododendron -.07 ± .14 13
Ricinus -.07 ± .02 2
FPO - Freezing point osmometer.
Tep - Thermocouple psychrometer.
Method used for determination
FPO
Tep
FPO
Tep
Tep
Tep
Tep
Tep
The accuracy with which psychrometric determinations of '¥ can be made s
declines as '¥ rises above -0.1 MPa toward zero. s However, values of '¥l
measured in this range were considered accurate enough to indicate that '¥s of
the sap samples were in the range 0 - -0.1 MPa.
The only species fotmd to have sap '¥ of below -0.1 MPa were Acer and s
Plantago. It was almost certain that sap collections from Plantago were
contaminated by exudate from cut cells at the end of the fleshy petiole.
As xylem sap '¥ was near zero in most of the species tested, balance s
pressure measurements were used to estimate '¥l in these species (Duniway, 1971;
Boyer, 1967). Even in those species in which sap '¥s was less than -0.1 ~Wa
(in Acer and Plantago) the errors in '¥l due to '¥s of the sap would be a
relatively small fraction of the total in severely water stressed leaves and
so were neglected.

79
ii) From water stressed leaves and shoots
The sap ~ values presented in part (a) of this section were obtained s
by expressing sap from turgid leaves. However Boyer (1967) has reported
that sap ~ may ch&'ge as samples become water stressed. s Such a change may
affect the use of the pressure chamber for making measurements of ~l. Changes
in ~ of xylem sap in response to imposed water stress were examined using s
Rhododendron shoots which had developed water stress by transpiring on the
laboratory bench. The results are presented in figure 22.
~ is between -.01 and -.03 MPa until leaf water potential falls below s
approximately -2 MPa. At ~l lower than -2 MPa sap ~s declines rapidly,
reaching -0.18 MP a as 'PI falls to about -2.5 MP a. Even at ~l of -2.5 MPa ~s
is still a small part of ~l. However,'if ~s continues to fall with 'PI a
di version of ~ 1 determined by the psychrometer and by the pressure chamber
will eventually become evident. However, such a difference had not yet
occurred when 'PI had fallen to -3.5 MPa (figure 20).
It was concluded that for Rhododendron pressure chamber measurements of ~l
were unlikely to be in error even at low 'PI (high balance pressures) because
of changes in the osmotic potential of the xylem sap.
3.4.4. Pressure-volume (P-V) curve analysis of the relation of balance
pressure to RWC
Noises similar to the clicks attributed to cavitation have been
reported to have occurred in wilting leaves even when the sap is not in
tension (Milburn, 1973a).
Before conducting experiments to investigate the relationship between
clicks and cell turgor it was necessary to find the water potentials at which
the leaves used in acoustic experiments lost turgor. This could not be found
by psychrometry, at least in Rhododendron (section 3.4.3),so P-V curve analyses
of balance pressure data already obtained for these species (section 3.3) were
undertaken.

P LEAF (MPa)
0° 1 2 3
• ~
• -& -0·1 :L -0... « • (f)
~-0'2
- 0·3'------------01
Figure 22. Osmotic potential (~ ) of xylem sap expressed from Rhododendron s leaves and shoots of balance pressures between 0 and 3 MPa.
80
The P-v curve analyses were carried out assuming that leaf balance
pressures were an accurate reflection of ~l (section 3.4.3).
These analyses were made using plots of the inverse of balance pressure
(lip) against RWC (figure 23). The results are presented for all ~pecies in
table 6 and for Rhododendron at different times of the year in table 7.
The first value obtained (by inspection of the pressure-vol ume P -v curve
plots) was ~ " the water potential at which cell turgor was first reduced to p
zero, sometimes called the point of incipient plasmolysis (Tyree et ~., 197:))
The second and third values, ~ 0, the solute potential of leaf cells at full s
/
turgo~ and RWC, the fraction of apoplastic water, were then found by fitting
a linear least squares regression line to the points at RWC lower than that
at ~p', ~ 0 was found from the intercept of the line with the y-axis (at s 1 100% RWC) and RWC' by the intercept on the x-axis (at I P = 0).
Tables 6 and 7 also present the ratio of leaf dry weight to turgid weight
for each species.
An obvious feature ln these analyses was the frequency with which
negative apoplastic water contents were calculated and the sometimes very low
regression coefficients for the lines relating lip to RWC. Only three species,
Alnus, Lycopersicum and Rhododendron, were found to give positive RWC'. The
low regression coefficients were in part due to low numbers of balance pressure
determinations at low ~l' and much of the difference must be attributed to
variability between leaves in the samples.
In Rhododendron there was a decrease in ~ I with the onset of winter in both p
years during which samples were collected. This amounted to a 0.5 MPa fall
(from -1.79 to -2.34 MPa) between December 1979 and January 1980 in the ~l at
which cell turgor became zero, and 0.2 ~Wa (-1.79 to -2.03 MPa) between June
1980 and January 1981. Over the same periods ~so fell by 0.26 and 0.05 MPa
respecti ve ly. The apoplastic water fraction (RWC') increased with leaf age
in both years, as did the dry weight : turgid weight ratio (remembering that the
change to the new season's leaves in samples was between July and October).

Figure 23. Calculation of water relations parameters from inverse
pressure-volume (P-V) curves. The point of incipient plasmolysis (IJ! ') P
was fOlmd first by identifying the junction of the linear and curved parts
of the P -v curves. Initial osmotic potential (lJ!s 0) and apoplastic water
content (RWC') were found from a least -squares regres sian fitted to points
of IJ! less than IJ! '. The data shown were obtained from Rhododendron leaves p
collected in October, 1981.
81
Immature Rhododendron leaves did not form a very uniform group. This
was be cause, whi Ie the immature leaves were softer, smaller and lighter in
colour than the older 'mature' leaves, there was considerable variability in
development between individual leaves within this general group.
Within the group of 'immature' leaves the relatively high 'I' ' (-1.00 MPa) and p
low dry weight : turgid weight ratio (20%) are notable.
The results of these analyses, and especially the values of 'I' 0 and RIVC', s
may be in error for several reasons. 'I' I was chosen from an assessment of the p
1 relation of Ip to RWC and is therefore subjective (Tyree and Hammel, 1972).
The values of 'I' 0 and RWC' depend on the value chosen for 'l' ' as the line s p
from which they are calculated was fitted through points at '1'1 below 'I'p'
(figure 23).
The sometimes very low regression coefficients of the line relating lip
to RWC was due in part to variability between the desorption isotherms of
individual leaves and also to fitting a regression line through a relatively
low number of points.
To remedy the above problems it is necessary to construct the pressure-
volume curveS using single leaves or shoots in a Hammel-type expression
experiment (e.g. Tyree et ~., 1973; Tyree et al., 1978), by in situ
monitoring of changes in '1'1 of a transpiring shoot (Richter, 1978) or by frequent
sampling for '1'1 measurement from a shoot (Talbot et ~., 1975).
However, it was possible that the low, sometimes negative values of RWC'
which were found may have resulted from over-estimation of '1'1 by the pressure
chamber at high leaf water stress. The fall in 'I' of xylem sap expressed from s
Rhododendron leaves and shoots as '1'1 falls below -2 MPa is an indication that
this might occur.
It is known that cell membranes may be damaged by water stress (Simon, 1974)
and that as a result they become increasingly permeab Ie to electrolytes
(Scherbakova and Kacperska-Palacz, 1980; Leopold et al., 1981). Al ternati vely,
cell membranes may be damaged by conditions in the pressure chamber (e.g.
Tyree et ~., 1978) with similar results.
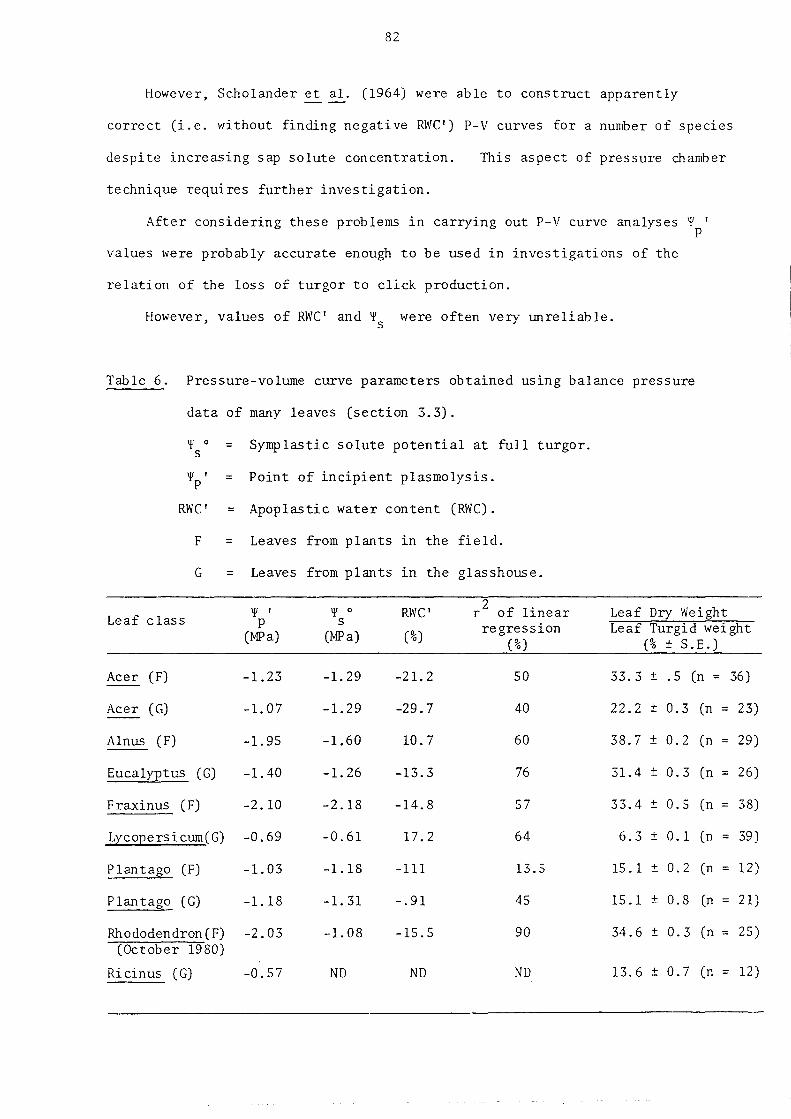
82
However, Scholander et~. (1964) were able to construct apparently
correct (i.e. without finding negative RWC') P-V curves for a number of species
despi te increasing sap solute concentration. This aspect of pressure chamber
technique requires further investigation.
After considering these problems in carrying out P-V curve analyses ~ , p
values were probably accurate enough to be used in investigations of the
relation of the loss of turgor to click production.
However, values of RWC' and ~ were often very unreliable. s
Table 6. Pressure-volume curve parameters obtained using balance pressure
data of many leaves (section 3.3).
~ 0 = Symplastic solute potential at full turgor. s
~p' = Point of incipient plasmolysis.
RWC' = Apoplastic water content (RWC).
F = Leaves from plants in the field.
G = Leaves from plants in the glasshouse.
Leaf class
Acer (F)
Acer (G)
Alnus (F)
Eucalyptus (G)
~ , p
(MPa)
-1.23
-1.07
-1.95
-1. 40
Fraxinus (F) -2.10
Lycopersicum(G) -0.69
Plantago (F) -1.03
Plantago (G) -1.18
Rhododendron (F) -2.03 (October 1980)
Ricinus (G) -0.57
~ 0
s (MPa)
-1. 29
-1. 29
-1.60
-1. 26
-2.18
-0.61
-1.18
-1. 31
-1. 08
NO
RWC'
(%)
-21.2
-29.7
10.7
-13.3
-14.8
17.2
-111
-.91
-15.5
NO
r2 of linear regression
(%)
50
40
60
76
57
64
l3.5
45
90
NO
Leaf Dry Weight Leaf Turgid weight
(% ± S. E.)
33. 3 ± . 5 (n = 36 )
22.2 ± 0.3 (n = 23)
38.7 ± 0.2 (n = 29)
31.4 ± 0.3 (n = 26)
33.4 ± 0.5 (n = 38)
6. 3 ± O. 1 (n = 39)
15.1 ± 0.2 (n 12)
15.1 ± 0.8 Cn 21)
34.6 ± 0.3 Cn = 25)
13.6 ± 0.7 Cn = 12)
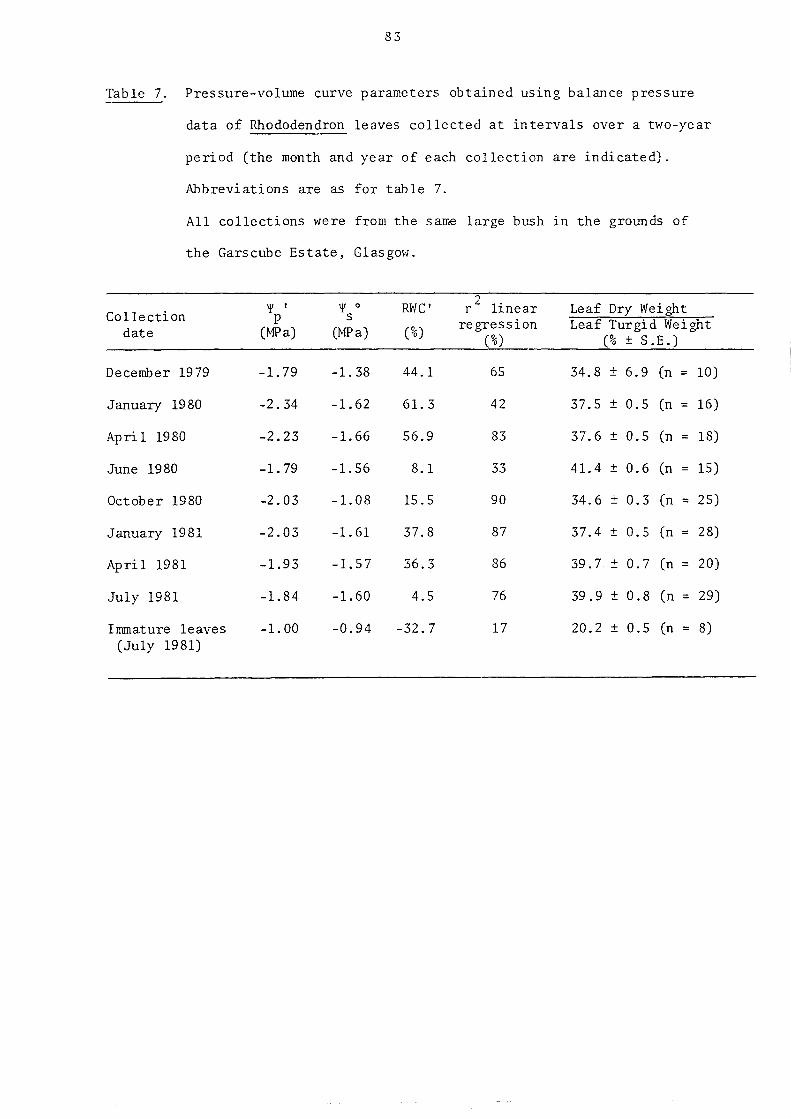
83
Table 7. Pressure-volume curve parameters obtained using balance pressure
data of Rhododendron leaves collected at intervals over a two-year
period (the month and year of each collection are indicated).
Abbreviations are as for tab Ie 7.
All collections were from the same large bush in the grounds of
the Garscube Estate, Glasgow.
Collection date
December 1979
January 1980
April 1980
June 1980
October 1980
January 1981
April 1981
July 1981
Immature leaves (July 1981)
'¥ I
P (MPa)
-1. 79
-2.34
-2.23
-1. 79
-2.03
-2.03
-1.93
-1.84
-1.00
'¥ 0
s (MPa)
-1.38
-1.62
-1.66
-1.56
-1.08
-1. 61
-1. 5 7
-1.60
-0.94
RWC'
(%)
44.1
61. 3
56.9
8.1
15.5
37.8
36.3
4.5
-32.7
2 . r hnear regression
(%)
65
42
83
33
90
87
86
76
17
Leaf Dry Weight Leaf Turgid Weight
(% ± S.E.)
34.8 ± 6.9 (n = 10)
37.5 ± 0.5 (n = 16)
37.6 ± 0.5 (n = 18)
41.4 ± 0.6 (n = 15)
34.6 ± 0.3 (n = 25)
37.4 ± 0.5 Cn = 28)
39.7 ± 0.7 (n = 20)
39.9 ± 0.8 (n = 29)
20.2 ± 0.5 (n = 8)
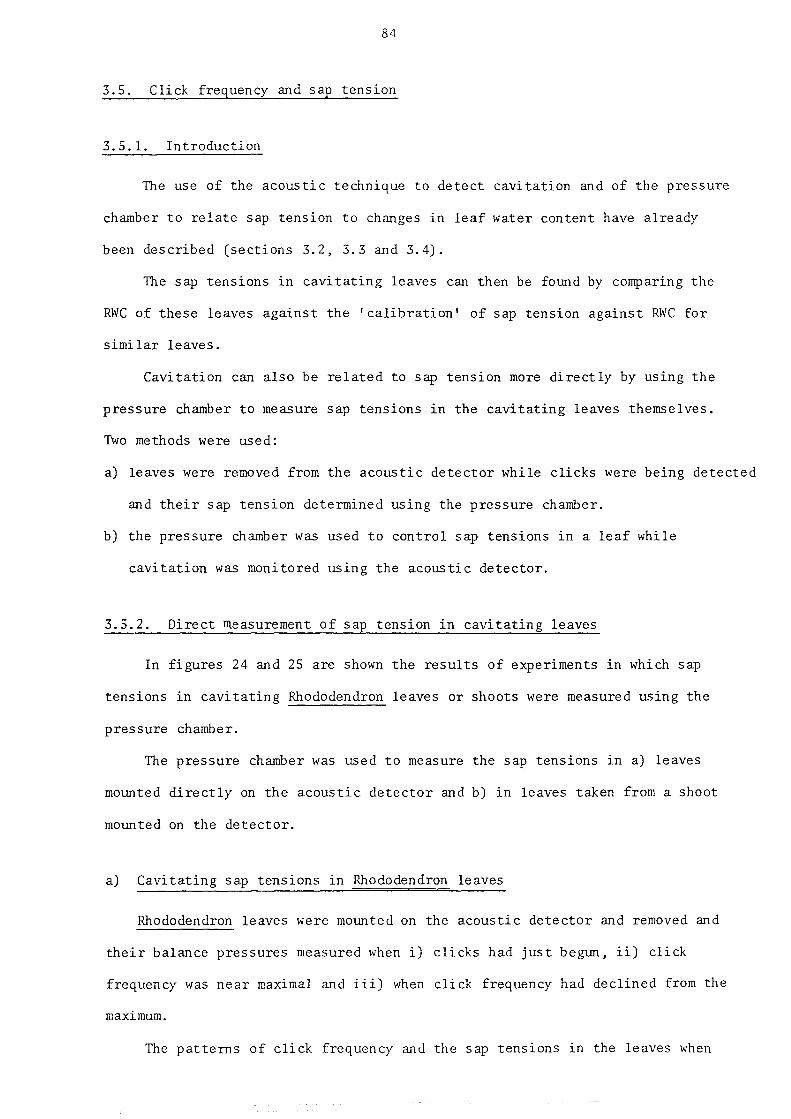
84
3.5. Click frequency and sap tension
3.5.1. Introduction
The use of the acoustic technique to detect cavitation and of the pressure
chamber to relate sap tension to changes in leaf water content have already
been described (sections 3.2, 3.3 and 3.4).
The sap tensions in cavitating leaves can then be found by comparing the
RWC of these leaves against the 'calibration' of sap tension against RWC for
simi lar leaves.
Cavitation can also be related to sap tension more directly by using the
pressure chamber to measure sap tensions in the cavitating leaves .themselves.
Two methods were used:
a) leaves were removed from the acoustic detector while clicks were being detected
and their sap tension determined using the pressure chamber.
b) the pressure chamber was used to control sap tensions in a leaf while
cavitation was monitored using the acoustic detector.
3.5.2. Direct measurement of sap tension in cavitating leaves
In figures 24 and 25 are shown the results of experiments in which sap
tensions in cavitating Rhododendron leaves or shoots were measured using the
pressure chamber.
The pressure chamber was used to measure the sap tensions in a) leaves
mounted directly on the acoustic detector and b) in leaves taken from a shoot
mounted on the detector.
a) Cavitating sap tensions in Rhododendron leaves
Rhododendron leaves were mounted on the acoustic detector and removed and
their balance pressures measured when i) clicks had just begun, ii) click
frequency was near maximal and iii) when click frequency had declined from the
maximum.
The patterns of click frequency and the sap tensions in the leaves when

100
If) w f-:::J Z >---<
2.::
--:t
" 50 If)
~ U >-----I
/ /2 -J U
5
o 10 o 20 0 20 TIME (MINUTES)
Figure 24. Determination of sap tensions causing cavitation by finding the balance pressures of cavitating leaves. Click production in Rhododendron leaves was monitored and leaf balance pre ssure s determined when cl ick frequency was a) ri sing, b) near maximal or c) falling. The balance pre ssure s obtained \\e re Cl ick frequency: a) rising
Leaf 1 Leaf 2
1. 41 MPa 1. 74 MPa
h) ne ar maximal Leaf 3 = 1. its MPa Leaf 4 = 2.10 ~1Pa
c) fall ing Leaf 5 2 . 72 MPa Leaf 6 = 2.52 MPa

c E
-.j-
---
1 50
o~~----~----~ o 100
3
150
100
50
2
50 A
t
100
4 100
50
o~~~----~--~ o DC...::w"'--~_.I...--...1 __ -.J
o 100
TIME o 100
( h )
Figure 25. Determination of sap tensions causing cavitation by removing
leaves from cavitating shoots. Rhododendron shoots were collected in
February 1981 and mounted on the acoustic detector. Click production was
monitored as the shoots dried. At the times indicated by arrows leaves
were removed for balance pressure determinations.
The balance pressure s found were:
Shoot 1
A 1. 2 MFa
Shoot 2
A
Shoot 3
A 1.55 MPa
End 2. 2 ~lPa B
1. 41 MPa
1. 86 MPa End 2.1 MPa
fud 2.1 MPa
Shoot 4
A
B
1. 43 MPa
1. 92 MPa
End 2.1 MPa

85
the experiments were terminated are given in figure 24 and its legend.
Examination of the petioles of Rhododendron leaves removed from the acoustic
detector showed that the vascular strand split longitudinally for a short
distance above and below the point of insertion of the needle. Except for
conduits adjoining the split other xylem conduits in the vascular strand
appeared undamaged. Leaves were not replaced on the acoustic detector after
a balance pressure measurement.
b) Cavitating sap tensions in Rhododendron shoots
The pattern of clicks detected in 150-200 mm long Rhododendron shoots
transpiring on the acoustic detector are shown in figure 25. At the times
indicated leaves were removed and their balance pressures determined.
are presented in the legend to figure 25.
Discussion
These
Cavitation began and was most frequent at sap tensions of about 1.4 and
2 MPa respectively in both leaves which had been mounted on the acoustic
detector themselves or had been cut from shoots on the acoustic detector.
The similar results obtained when leaves were taken from the needle of the
acoustic detector or from a shoot (and were therefore free of xylem damage
inflicted by the needle of the acoustic detector) are an indication that in
Rhododendron balance pressures are little affected by damage inflicted by the
needle of the acoustic detector. However the balance pressures of leaves of
other species may be affected by mounting on the acoustic detector. Balance
pressures of Lycopersicum may be reduced by 0.3 MPa or more by damage inflicted
by the needle of the acoustic detector (Nonhebel, pers. comm.). Moreover,
removal of the damaged section of the petiole or stem is not possible as errors
may also result from this (Ritchie and Hinckley, 1975).
The balance pressures of leaves removed from the acoustic detector can
therefore be used to determine the sap tensions at which cavitation occurs if
the effect of damage caused by mounting on the acoustic detector is taken into

86
account.
However, the technique has only limited usefulness in defining the range
of sap tensions over which clicks occur because of the subjectivity involved
in determining when click frequency is maximal and when the ability of the
sample to produce clicks has been exhausted.
3.5.3. Indirect measurement of sap tension in cavitating leaves
Sap tensions characteristic of the relation of cavitation to sap tension
in leaves are given for all species in table 8 and for Rhododendron at different
times of the year in table 9.
After examining the pattern of click frequency against time (section 3.2.2)
four methods by which the relation of cavitation to sap tension might be
characterised for each plant species were adopted.
illustrated in figure 26.
These methods are
a) Construction of a 'cavitation profile' by summing the number of clicks
occurring over successive known increments in sap tension.
b) Calculation of the sap tension by which a known fraction of the number of
clicks detected during an acoustic experiment were accumulated (10 and 50%
fractions were used).
c) Calculation of the sap tension at the time at which click frequency was
maximal.
d) 'Averaging' of profiles within a group of experiments to obtain a 'mean'
profile for that class of leaves.
The selection of the time at which click frequency was maximal and by which
given fractions of the total number of clicks had occurred was straight-forward,
as was the use of the calibration of sap tension against RWC to find the sap
tension in leaves at these times.
Cavitation profiles were constructed as follows (figure 26).
The calibration curves of sap tension against RWC were used to convert the
desired increments of sap tension (usually 0.2 MPa) to increments in RWC:

A 100 70 n I t--4
90 ('I - A
~ V1 0 '" - -3 80 +-
:3 0::::
::J C ~
70 ro (f) -
t, t~ 0
0 50 100 TIME (min)
30 B 30 C Vl ~ u
20 >--1
VJ ---1 20 ~ LJ LJ ......... ---1 LJ 10 0 ~ ~ 0 0
n 0 va 1 2 3 0 1 2 3 SAP TENSION (MPa) SAP TENSION (MPa)
Figure 26. Determination of the sap tensions at which cavitation occurs.
The RWC, and hence sap tension, at which clicks begin or are most frequent
is found by inspection of plots such as are shown in A. Cavitation
profiles (B) are derived by selecting increments of RWC (Rl
- R2) corresponding
to a desired sap tension increment and summing the clicks detected during the
time (t 1 - t 2) taken for RiVC to change by the desired increment. Several
cavitation profiles may be combined to obtain an 'average' profile (C).

Figure 27. (Two pages). Cavitation profiles of leaves of species used in
acoustic experiments. Up to twelve profile s are given for each species to
show the differences found between profiles of individual leaves. Only one
set of cavitation profiles is shown for t hos e species for which two or more
collections were made as resul ts were generally similar for all collections.
Note that although 0.2 MPa sap tension increments were used when calculating
cavitation profil es of the woody species, the proportion of clicks occurring
over each increment has been divided by two to enable easy comparisons to 1:e
made with the profiles of t he herbs which were cal culated using 0.1 MPa sap
tension increments.
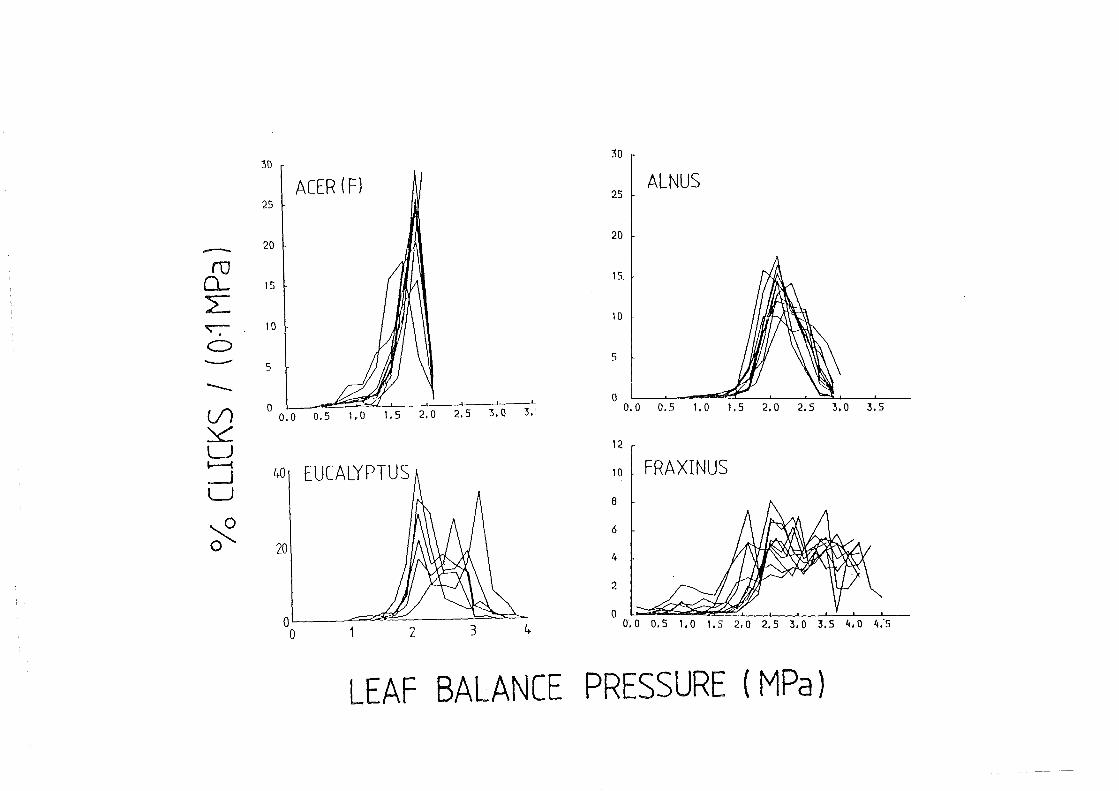
30 30
ACER (F) ALNUS 25
25
20 - 20
ro 0.... 15
15
2: 10 ~ 10
0 -- 5 5
--If) O~, , , , l-
0.0 0.5 1.0 1.5 2.0 2.5 3.0 3 • ~ o
0.0 0.5 1.0 1.5 2.0 2.5 3.0 3.5
~ LJ
12
~ 4D1 EUCALYPTUS -1 10 L FRAXINUS
LJ 8
~ 0 20 6
4
2
01 ~ ~ o 2 3 4
o 0.0 0.5 1.0 1.5 2,0 2.5 3.0 3.5 4.0 4:5
LEAF BALANCE PRESSURE (MPa)

-m 0.. 2: ~ o
50
16
40
35
30
25
20
15
lQ
5
o 0.0
-- 24 ___ 22
l/) :?:L: LJ ~
--.J LJ
~ o
20
18
16
14
12
10
8
6
4
2
o
0.2 0.4
RHODODENDRON
(APRIL 1981)
0.6 0.8
80
PLANTAGO (F)
60
40
20
01.-,. ~', '. 0.00.20.4 0.6 0.8 1.0 1.2 1.4 1.6 I~B 2.0 2.22.4
S5
50
4'5
40
3S
30
25
20
IS
10
5
RICINUS
o ~~'-JI ____ ~I~'==±= __ J-___ L __ -J ____ L-~
0.0 0.5 1.0 1.5 2.0 2.5 3.0 3.5 0.0 0.2 0.4 0.6 0.8 1.0 1.2 1.4 1.6 1~8
LEAF BALANCE PRESSURE (MPa)
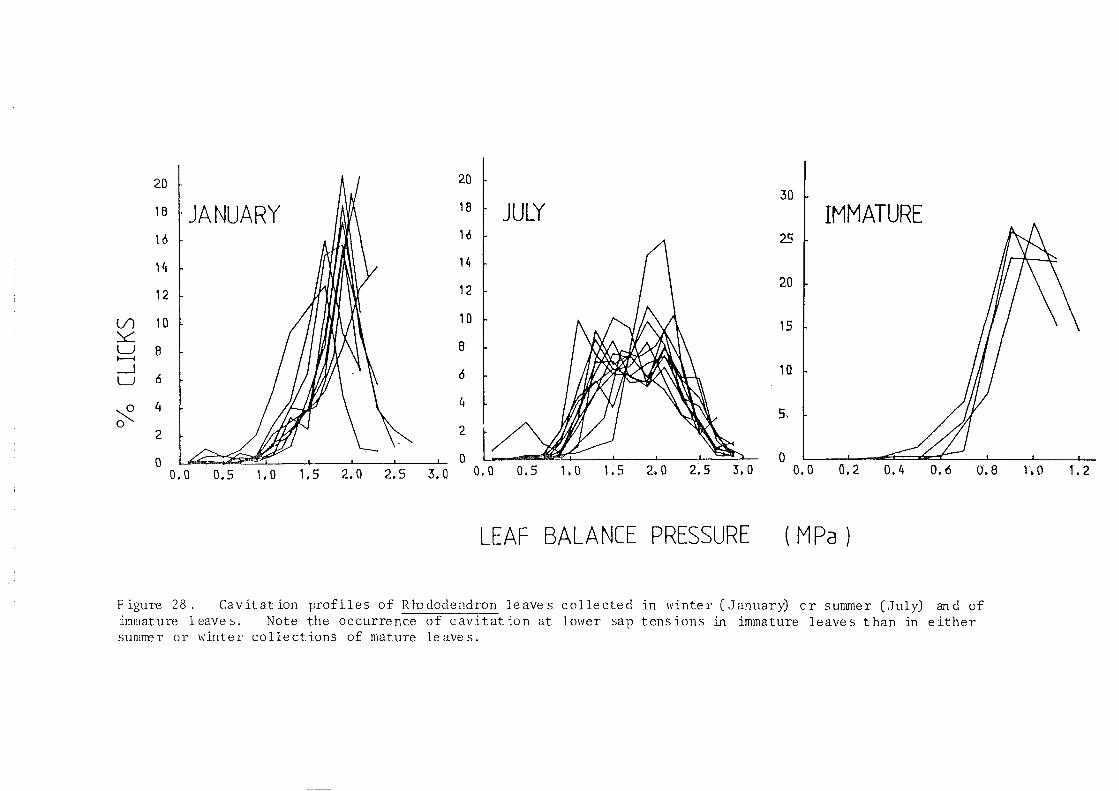
20 ~ h I 2.0 30
18 ~ JANUARY
J~/ 18 l JULY IMMATURE
16 t 16 2.5 A
14 14
12 I 20 12
l/) 10 10 r 1\ . /""'///\V\ 15 ::x::: LJ 8 8 t---I
-.J 6 I I //1/ DiJf:J:X fu't\. \ \ 1Q LJ 6
~ 4 4 111M 11 ~"'. S,
0 2. 2
0 0 1/ ~ I I~ 0 0,0 0.5 1.0 1,5 2.0 2.5 3,0 0.0 0.5 1.0 1.5 2.0 2.:5 3,0 0,0 cr. 2 0,4 0.6 0.8 1',0 1.2
LEAF BALANCE PRESSURE ( MPa )
Figure 28. Cavitation profiles of Rrododendron leaves collected in winter (January) or summer (July) and of jmmature leaves. Note the occurrence of cavitation at lower sap tensions in immature leaves than in either sumn-er or winter collections of mature leaves.

87
These increments in RWC were then applied to the data of changes in RWC of the
leaf on the acoustic detector to find the times between which sap tensions rose
by the desired amounts. Clicks recorded over these time intervals were summed
and reduced to proportions of the total number for the experiment. The results
could be presented as a histogram (e.g. figure 26) although for most purposes
line graphs drawn to the midpoints of each sap tension increment sufficed
(figures 27 and 28) .
Cavitation profiles were 'averaged' by finding the mean proportion of
clicks occurring over each tension increment for all experiments in the group.
Results were presented as histograms (e.g. figure 26). In order that profiles
could be averaged, all profiles had to be calculated over the same range of
sap tensions, requiring that a 'cut-off' point to sap tensions be imposed.
This limited the maximum sap tensions to which profiles could be calculated.
Discussion
Of the four methods used, the cavitation profile was considered to provide
the best description of the relationship between cavitation and sap tension.
Inspection of the profiles yielded the sap tensions at which a) cavitation began,
b) cavitation was maximal and c) cavitation had ceased. Other methods yielded
only point values of sap tensions.
a) Cavitation profiles. Certain features appeared to be common to the
cavitation profiles of all species used in these experiments. Cavitation began
and reached its maximum incidence at about the same sap tensions in all leaves
of the same species or class. This conformity often extended to the
proportion of the total number of clicks recorded during the experiment which
occurred over each increment in sap tension (e.g. figures 27 and 28).
The shape of the cavitation profiles appeared to be largely unaltered by
changes in the size of the sap tension increment used in their calculation
(figure 29). Upper and lower limits to the size of the tension increments
which could be used were set by the range of sap tensions over which clicks

V) ~ LJ t--i
--.J LJ
~ 0
15
10
5
o .................. . o
0'1 MPa 0·2 It
0·5 II
1
SAP TENSION
1
'.
'. '.
1 1
\
'.
2 (MPa)
3
Figure 29. The effect of changing tre increments of sap tension used in
calculating cavitation profiles on the shape of the profiles obtained.

00
occurred and by the variability of click frequency about the general trend
(section 3.2.2) respectively.
Because of slight differences in the relation of sap tension to RWC, and
also differences in the sap tensions at which cavitation occurred between
leaves, cavitation profiles of leaves were shifted to slightly higher or lower
sap tensions. Consequently averaging of profi les (method d) often resulted in
large standard errors for the proportion of clicks which occurred over each
sap tension increment (fi.gure 26). It could also result in a misleadingly
broad profi Ie if the individual profi les were particularly narrow (e. g. Acer,
certain Rhododendron collections) or variable in the sap tensions at which they
peaked (Eucalyptus).
Averaging of profiles was therefore of relatively little use when comparing
the sap tensions at which cavitation occurred in different species.
A brief discussion of the results obtained for each species is given below.
i) Acer, Alnus, Eucalyptus and Rhododendron all had relatively narrow,
symmetrical cavitation profiles with a single, pronounced peak over which
40-80% of the total number of clicks for the experiment were detected. In
three species (Acer, Alnus and Rhododendron) cavitation began at sap tensions
between 1 and 1.5 MPa and peaked 0.3 to 0.5 MPa higher at around 2MPa.
Eucalyptus, whose profiles were more variable than those of the other three
species, started to cavitate at sap tensions of 1.5-2 MPa and peaked at around
2 . 6 MP a (t ab 1 e 8).
ii) Fraxinus was the only species which was found to have rather flat 'plateau
type' cavitation profiles which lacked an obvious peak. Cavitation started at
sap tensions of 1.5 - 2.0 MPa and continued at a near constant level as sap
tensions rose from 2.5 to 4.5 MPa.
iii) Lycopersicum, Plantago and Ricinus were more variable in the shape of their
profiles than were leaves of woody species. This was because the estimation of
sap tensions was proportionately less precise in leaves of herbs than in trees,

i.e., although cavitation occurred at sap tensions between 0.3 and 1 MPa in
herbs (cf. 1.5 - 2.5 MPa in woody plants) sap tension could only be determined
to ± 0.2 MPa in both cases. In addition, noise levels often increased in the
later stages of experiments using herbs. These noises occurred as leaves
wilted and parts of the lamina rubbed together. This was a problem with
Lycopersicum and Ricinus. Other tissue noises occurred when parts of the
lamina dried to brittleness, a particular problem with Ricinus.
Despite these constraints the tabulated values for sap tensions at the
peak of cavitation profiles of these species will not be in error by more than
± 0.2 MPa.
The peaks for Lycopersicum and Ricinus occur at 0.2 and 0.8 MPa respectively.
These are about one third of those found in leaves from trees and from Rhodo
dendron. Cavitation profiles of Plantago peaked at sap tensions of about
1.7 MPa, a result more typical of the woody species than of the soft herbs.
iv) Rhododendron leaves sampled at different times of the year.
Mature Rhododendron leaves from all collections began to cavitate at sap
tensions of 1.1-1.5 MPa. Their cavitation profiles all peaked at around 2 MPa.
Variability between leaves was greater during the summer than the winter
(figure 28). This may have been due to differences in the relation of sap
tension to RWC in leaves, perhaps depending on the maturity of each leaf.
Because of limitations in the accuracy with which sap tensions could be
determined, experiments using Rhododendron cannot be taken to indicate differences
in the sap tensions at which cavitation occurs at different times of the year,
despite being subjected to temperatures below freezing in winter (table 9).
Cavitation in immature Rhododendron leaves occurred at sap tensions
approximately half those at which cavitation occurred in mature leaves (approxi
mately 0.7 MPa compared to 2 MPa respectively (table 9)).
v) Leaves from plants in the field or in the glasshouse. Characteristic sap
tensions and cavitation profiles obtained using Acer and Plantago leaves from
plants growing in the field or glasshouse were similar (table 8).

90
Differences between the characteristic tensions listed for each population
in table 8 (up to 0.15 MPa in Acer and 0.3 MPa in Plantago) were believed to be
due to inaccuracies arising from use of a single calibration line to relate sap
tension to RWC for many slightly different leaves and to the calculation of
cavitation profiles over relatively large increments of sap tension. They do
not represent real differences in the sap tensions causing cavitation in each
group.
The differences in cavitating sap tensions found between species in these
studies are therefore believed to be due to the characteristic of each species
and not to whether the plants from which they were taken were growing in the
glasshouse or in the field.
b) Sap tensions by which 10 and 50% of clicks for the experiment have been
recorded
The sap tension by which a small fraction, in this case 10%, of clicks
have occurred is an indicator of the minimum sap tensions at which cavitation
occurs in a leaf.
The accuracy of the estimate will depend on whether or not the ability of
the leaf to produce clicks was exhausted by the end of the experiment. This
is best known from a consideration of the cavitation profile of that experiment.
As in the majority of species most clicks occur over a narrow range of sap
tensions errors in estimating the sap tension at which cavitation starts will
probably be small if experiments are continued until the sap tensions at the
peak of the cavitation profile have been exceeded.
Errors may be larger if cavitation occurs over a wide range of sap tensions
with only a modest fraction of the total click number occurring over each
increment of sap tension, as in Fraxinus, or if the decline in click frequency
is masked by high levels of noise, as in Lycopersicum and Ri cinus.
In such cases it may be better to obtain the lowest sap tensions causing
cavitation by inspection of the patterns of click tensions against time rather

Yl
than by calculation of the tensions when a small fraction of the total number
of clicks have been detected.
The calculation of the sap tensions by which 50% of the potential of the
sample to cavitate has been exhausted is subject to similar artifacts as have
been described for determinations of minimum cavitating sap tensions by
calculation of the tensions by which 10% of clicks have occurred.
The sap tension by which 50% of clicks had occurred was in good agreement
with those at which the peak of the cavitation profiles occurred (tables 8 and 9).
c) Sap tension when click frequency is maximal
Sap tensions when click frequency is maximal during an acoustic experiment
aTe in reasonable agreement with those at which cavitation profiles peak in all
species except Fraxinus (table 8).
In Fraxinus, which has a plateau-type of cavitation profile (figure 27), sap
tensions at the maximum click frequency are at the lower end of the range of
sap tensions over which cavitation occurs. This may be the result of a
decrease in the rate at which sap tension is increasing, either as the result
of a reduction in transpiration rate (section 3.2) or as the rate at which ~l
changes ,with RWC fall s after the 10 ss of turgor in the leaf (figure 14).
The sap tension at which click frequency is maximal was
considered to be an acceptable indicator of the sap tension around which the
occurrence of cavitation is greatest. The method cannot be used to resolve
the range of sap tensions over which cavitation occurs, the determination of
which requires the construction of cavitation profiles.
From a consideration of the experiments reported above it appears that
the most complete description of the relation of cavitation to sap tension is
obtained by construction of a cavitation profile. Estimates of the
sap tensions around which most cavitation in the leaf occurs can be made by
finding the sap tensions at which click frequency is maximal. However, this
method cannot be used to discriminate between a low click frequency caused by
near exhaustion of the ability of the sample to produce clicks and the

92
effects of a slow rate of water loss. As a survey technique for finding the
sap tension at which cavitation begins or is most likely, this technique is
useful.
Table 8. Characteristic sap tensions of cavitating leaves of different species
and populations of eight species of herbs, shrubs and trees. The
methods by which the values have been calculated are as described in
the text of sections 3.5.1 and 3.5.3. Values are ± S.E.
Species a. b. c. d. Maximum at which fraction Tension As (c) but click of total clicks occur increment from averaged
Acer (F)
Acer (G)
Alnus (F)
Eucalyptus (G)
Fraxinus (F)
LycoEersicum (G)
Plantago (F)
Plantago (G)
Rhododendron (F)
(July 1981)
Ricinus (G)
Abbreviations
frequency 10% 50% with most cli cks profile
1.72 ± .03 1.35 ± .05 1.70 ± .03 1. 78 ± .00 1.8 (n
1. 59 ± .52 1. 33 ± .08 1. 57 ± .03 1.60 ± .00 1.6 (n
1. 95 ± .10 1.72 ± .22 2.07 ± .02 2.00 ± .07 2.0 (n
2.52 ± .06 1.71 ± .03 2.19 ± .04 2.59 ± .07 2.6 (n
2.00 ± .50 1. 92 ± .14 2.89 ± .09 2.84 ± .02 3.4 (n
0.15 ± .04 0.13 ± .01 0.30 ± .02 0.21 ± .04 0.25 (n
1.59 ± .07 1.27 ± .13 1.62 ± 0.9 1. 68 ± .09 1.8 (n
1. 73 ± .02 1.58 ± .08 1. 81 ± .05 1. 73 ± .05 1.8 (n
1. 78 ± .10 1.59 ± .06 2.00 ± .06 2.09 ± .08 2.2 (n
0.37 ± .18 0.36 ± .02 0.67 ± .04 0.76 ± .06 0.6 (n
F Leaves collected from plants growing in the field.
G - Leaves collected from plants growing in the glasshouse (section 2.1).
= 10)
= 7)
= 11)
= 19)
= 10)
= 9)
= 6)
- 13)
= 12)
= 13)

Table 9. Characteristic sap tensions of cavitating Rhododendron leaves sampled at intervals over two years.
Methods and abbreviations are as for table 8. Temperatures are monthly means (sum of dai 1y minimum
and maximum divided by two). Temperatures were measured at Glasgow Airport.
Characteristic SaE Tensions (MPa S.E.) Temperatures
a. b. c. d. Sampling Maximum click Fraction of total clicks Increment with Averaged profile Monthly !v!onth1y
Date freguency 10% 50% most clicks wi th mos t cli cks mean minimum
December 1979 1.48 ± .08 0.69 ± .06 1.27 ± .03 1.45 ± 0.20 1.6 (n = 5) 3.8 5.6
January 1980 NO 1.31 ± .11 0.93 ± .11 2.4 ± 0.35 2.2 (n = 4) 1.7 9.4
April 1980 2.26 ± .21 1.41 ± .08 2.02 ± .06 2.18 ± 0.10 2.2 (n = 9) 8.7 1.7
June 1980 1. 35 ± .05 1.24 ± .05 1.82 ± .07 2.12±0.13 1.9 (n = 8) 12.9 5.0
October 1980 1.21 ± .55 1. 05 ± .06 1.62 ± .05 1.7 ± 0.10 2.0 (n = 14) 8.1 5.0
January 1981 1. 46 ± .06 1.24± .01 1.74± .05 1.68 ± 0.38 2.0 (n = 10) 4.5 5.6
April 1981 1. 66 ± .10 1.16 ± .18 1.97 ± .06 2.12 ± 0.08 2.1 (n = 12) 7.9 4.4
July 1981 1.78 ± .10 1.59 ± .06 2.00 ± .06 2.09 ± 0.08 2.2 (n = 12) 14.3 4.4
Immature leaves 0.72±.03 0.69 ± .01 0.9 ± .31 0.80 ± 0.00 0.8 (n = 4) 14.3 4.4
(July 1981)

94
3.5.4. Cavitation during controlled development of sap tension
The results of experiments designed to separate the effects of sap tension
and loss of turgor in causing clicks are shown in figure 31.
As discussed in sections 2.2 and 3.2, clicks detected by the acoustic
detector occur in conjunction with other, 'tissue'noises. Clicks have also
been reported to occur when osmotic solutions supplied to the xylem cause the
leaf to wilt without the development of sap tensions (Milburn, 1973a). An
inspection of figure 30 also shows that the sap tensions at which clicks are
most frequent are often close to those at which incipient plasmolysis (~ " p
section 3.4.4) occurs.
The possibility that clicks and cell turgor might be related, and in
particular that clicks might be noises produced by cells pulling apart as they
lose turgo~ clearly needs investigation.
The loss of cell turgor and the development of sap tension were separated
using the pressure chamber.
Cell turgor was reduced to zero by overpressurising the leaf to force
water from the cells. After equilibration at the desired pressure, sap tension
can be imposed in a controlled manner by lowering the pressure in the chamber
(Tyree and Hammel, 1972).
Sap tension can then be calculated from the difference between the balance
pressure of the leaf after equilibration and the chamber pressure.
Rhododendron leaves were used for these experiments because a) the sap
tensions at which click production is maximal and those at which turgor is reduced
to zero are close in leaves of this species, and b) leaves of this species have
desirable mechanical properties (loud clicks, tough, crush resistant petiole,
and are small enough to fit into the pressure chamber without touching the sides).
A turgid Rhododendron leaf was mounted in the pressure chamber and an
acoustic detector mounted in the petiole as shown in figure 3. The experiments
were conducted outside the sound-proofed cabinet normally used for acoustic
experiments. To reduce noise to acceptab Ie levels the pressure chamber was
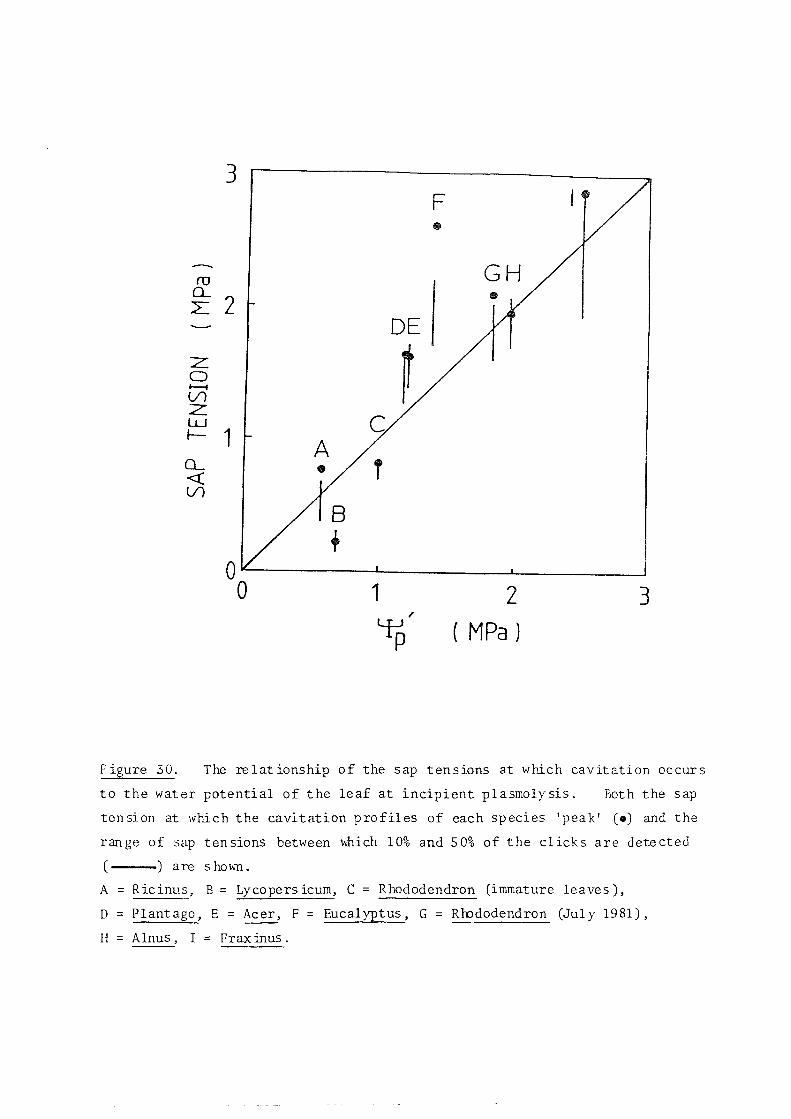
3
ru
~2
z o t--4 V) Z w ~1
Q <t: V)
F
GH
c A
T
o--------~------~------~ o 1
LfP , 2
( MPa ) 3
Figure 30. The relationship of the sap tensions at which cavitation occurs
to the water potential of the leaf at incipient plasmoly sis. Both the sap
tension at which the cavitation profiles of each species 'peak' (e) and the
range of sap tensions between .... hich 10% and 50% of the clicks are detected
( ) are shown.
A = Ricinus, B = Lycopersicum, C = Rhododendron (immature leaves),
o = Plantago, E = Acer, F = Eucalyptus, G = Rlndodendron (July 1981),
H = Alnus, I = Frax inus .

95
supported on layered piles of cotton wool and fibre matting and the acoustic
detector supported on another pad of cotton wool.
It was found that clicks could only be recorded automatically as chamber
pressure fell. Bubb ling of sap on the end of the petiole as pressure was
increased caused so much noise that clicks were undetectable above the back-
ground noise. With great care sap could be removed from the petiole as it was
expressed, lowering noise levels sufficiently for clicks to be monitored
aurally. Click-like sounds were heard as chamber pressure increased, but were
very few compared to the many heard as pressure fell.
A typical result of experiments in which previously turgid Rhododendron leaves
had been equilibrated at high chamber pressure and click production monitored
as chamber pressure was released are shown in figure 3la.
Few clicks were detected until sap tension was Slightly in excess of 2 MPa
after which the frequency of clicking rose sharply. Click frequency declined
as sap tension rose above 3.5 MPa (figure 3la). A burst of 'cliCKS' occurring
over the last I MPa increase in sap tension was due to noise caused by visible
movements of the rubber bung sealing the leaf into the pressure chamber.
Results similar to those shown in figure 3la were found in eight other
experiments in which the leaf had been equilibrated at balance pressures in
excess of the sap tensions known to cause clicks to be produced in leaves on
the acoustic detector.
Equilibration at pressures lower than those causing cavitation
The results of an experiment in which the leaf was first equilibrated at a
chamber pressure below the sap tension at which clicks are first detected in
Rhododendron leaves (about 1.2 ~Wa, table 9) and the pressure slowly released,
are shown in figure 31b. Except for the brief burst of noise caused by
movement of the rubber bung as the last of the pressure was released, clicks
could not be detected above the background noise.
When the same leaf was then equilibrated at a pressure equivalent to

ru 0... :L
z o >--4
VI Z
~ 0... <l: Vl
5
4
3
2
1
A
. •
• • • •
• •
r 40
20
3,.-/ ------------------,
a 2
•
1 • •
•
•
•
•
• •
H .. •
• • ••
3 c
20
2
10 1
40 n I I---i
n A VI -----. +:3 20 :J'
00 AD 50 ~O 150 10 o 1 V\./\I lat \..j '--J 'I 10 /T I I 41,\1111 V 10
o 50 100 150 o 50 100 150
TIME (min) TIME (min) TIME (min)
Figure 31. The occurrence of clicks when sap tensions are controlled using the preS!3Ure chamber. A. Single cycle up to pressure greater than the sap tension causing cavitation. Th(; noil.e over the last·minutes of the
experiment s is an artifact. B. Two pressure cycles, the first to less than cavitating sap tensions, the second to greater. The fall of pressure on
the second cycle \Vas halted for a short time as indicated (I-{). C. Two pressure cycles,both to greater than cavitating sap tensions.
96
greater than the sap tension at which cavitation occurred clicks were produced
as sap tensions rose above 1.5 MPa.
with similar results in each case.
This experiment was repeated three times
Interrupting the rise in sap tension when clicking is established
Also shown in figure 3lb is the effect on click rate of temporarily
stopping the rise in sap tension by halting the decline in chamber pressure.
Click frequency fell immediately the fall in chamber pressure was halted and
resumed quickly when pressure started to fall again. Noise due to movement
of the rubber bung is apparent over the last 8-10 minutes of the experiment.
The rapid response of click frequency to a halt in the decrease of chamber
pressure indicated, by reasoning analogous to that for the effect of changes
in transpiration rate on click frequency (section 3.2.3), that xylem water
potential and chamber pressures were close to equilibrium.
Click production on a second cycle to greater than cavitating sap tension
In figure 3lc are shown the results of an experiment in which a
Rhododendron leaf was taken through two pressure cycles, both resulting in sap
tension greater than those required to induce cavitation. Clicking is clearly
evident as sap tension rises above 1 MPa on the first pressure cycle, but is
entirely absent on the second cycle.
Calculation of cavitation profiles
Figure 32 shows cavitat ion profiles calculated from pressure chamber
experiments (including those shown in figures 32 and 34) which resulted in
greater than cavitating sap tensions being produced in leaves. The last few
minutes of the experiment were left out of the calculations to exclude noises
caused by movement of the rubber bung.
For clarity only five of nine profiles are shown as the profiles obtained
from pressure chamber experiments were more variable than those obtained from

20
10
~ o
A II I I
I \ I I
I ~ t~ I I I I i I If _,# lr
,- .i :, ; \
. I \ \i \ , ' \
I r·. \ I l I '" 1/
I' I l
r--l .,.j ~~ .1' I
I
I
\
\
\ \ \
" ...... o~~~'~~=-c-=--~·~····~·-·~··~~--~--~
o 1 2 3
SAP TENSION (MPa)
Figure 32. Cavitation profiles of Rhododendron leaves derived from
experiments in which changes in sap tension were controlled using the
pressure chamber.
The results of experiments with four different leaves (indicated by
different lines) are shown.

97
experiments conducted in the usual manner (e.g. figure 27). The sap tensions
at which the 'peak' occurred in individual experiments are given in table 10.
The mean value of the sap tension at which the 'peak' of these cavitation
Table 10. Sap tension at midpoint of the 0.2 MPa increment in sap tension
over which the greatest proportion of clicks occurs in acoustic
experiments in which sap tension was controlled using the pressure
chamber.
Experiment Sap tension at 'peak' of cavi tation profile (MPa)
1 2.4
2 2.4
3 1.4
4 2.2
5 1.9
6 2.8
7 3.2
8 2.0
9 2.3
x ± S.E. 2.29 ± 0.17
profiles occurs should be compared with the value of the same parameter obtained
from experiments of the normal type conducted using leaves sampled at about the
same time of year (July 1981), i.e. 2.09 ± 0.08 MPa (table 9).
Changes in leaf balance pressure during experiments
As can be seen in figure 31, the sap tension calculated for a second
pressure cycle was less than that on the first. The difference was due to a
decrease in leaf balance pressure measured after chamber pressure had been
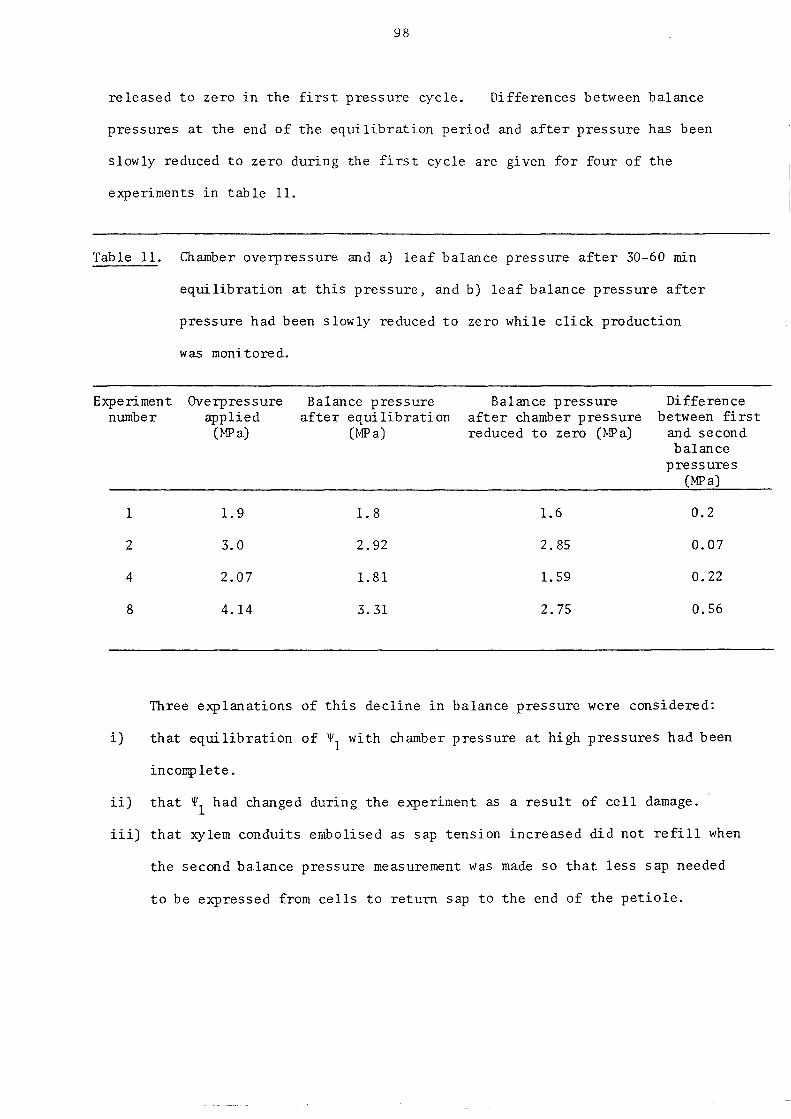
released to zero in the first pressure cycle. Differences between balance
pressures at the end of the equilibration period and after pressure has been
slowly reduced to zero during the first cycle are given for four of the
experiments in table 11.
Table 11. Chamber overpressure and a) leaf balance pressure after 30-60 min
equilibration at this pressure, and b) leaf balance pressure after
pressure had been slowly reduced to zero while click production
was monitored.
Experiment Overpressure Balance pressure Balance pressure Difference number applied after equilibration after chamber pressure between first
(MPa) (MPa) reduced to zero (~IP a) and second balance
pressures (MPa)
1 1.9 1.8 1.6 0.2
2 3.0 2.92 2.85 0.07
4 2.07 1. 81 1. 59 0.22
8 4.14 3.31 2.75 0.56
Three explanations of this decline in balance pressure were considered:
i) that equilibration of '1'1 with chamber pressure at high pressures had been
incomp lete.
ii) that '1'1 had changed during the experiment as a result of cell damage.
iii) that xylem conduits embolised as sap tension increased did not refill when
the second balance pressure measurement was made so that less sap needed
to be expressed from cells to return sap to the end of the petiole.

99
i) Errors in balance pressure determinations
This was thought to be the most likely cause of error in calculation of
sap tensions.
Errors in measurement of the balance pressure after equilibration at high
chamber pressure were considered to be more likely than were errors in balance
pressures measured later when chamber pressure had fallen slowly to atmospheric.
This was despite the apparently constant balance pressures over several minutes
after 30-60 min equilibration at high pressure. Studies of the kinetics of
sap expression from leaves (section 4. 5) had shown that leaves were slow to
attain a new equilibrium after imposition of a large pressure increment.
Moreover, Jones and Higgs (1980) found that the balance pressures of leaves which
had lost water by transpiration were lower than those from which water had been
forced by overpressure in the pressure chamber. They also attributed the
difference between balance pressures to inequilibration of ~l with chamber
pressure after a large pressure increment had been applied.
It was unlikely that the second measurement of leaf balance pressure was
erroneously low as experiments had shown that balance pressure measurements of
Rhododendron leaves were not subject to misequilibration errors if pressure
was raised at .005 MFa s-l, as was the case in this instance (section 3.3.2).
ii) Changes in 1Ji1 of leaves in the pressure chamber
Leaves may have been damaged by long periods at high pressure in a
nitrogen atmosphere. However, experiments had shown that the balance
pressures of similar leaves held at high air pressures (and hence at high partial
pressure of nitrogen which comprises 70% of the air) were unchanged (section
3.3.2). Alternatively, the cells may have become anaerobic in the pure nitrogen
atmosphere (Tyree et al., 1978). Cell damage, as shown by increased leakage
of solutes to the xylem sap (figure 22), may also have occurred as a result of
reduced leaf water status alone (Scherbakova and Kasperska-Palacz, 1980;
Leopold et ~., 1981).

100
iii) Changes in xylem volume
The third possibility considered was that conduits embolised by cavitation
did not refill when the second balance pressure measurement was made, so that
less sap needed to be expressed from cells to return sap to the end of the
petiole (Slavik, 1974). However, the results of experiments comparing the
balance pressures of leaves and shoots showed that such conduits probably would
refill on a second balance pressure measurement. In addition, cavitation had
little capacity to affect balance pressure measurements of sap tension in
leaves (section 3.4).
Discussion
Cavitation profiles drawn from pressure chamber experiments peaked at sap
tensions around 2.3 MPa. This compares favourab ly wi th the peak at 2.1 MFa
(table 9) of profiles drawn from the data of experiments in which sap tensions
increased as the leaves transpired. However, the cavitation profiles of
pressure chamber experiments were more variable in shape and the sap tensions
at which they peaked than were those from experiments in which the leaf lost
water by transpiration.
Few clicks were detected as the cells of the leaf lost turgor. However,
many clicks were detected when, through a decline in chamber pressure, sap
tensions had increased to magnitudes similar to those at which clicks began in
transpiring leaves.
Therefore, it seeIl'.5 that clicks are produced when a critical sap tension
is achieved and are not the result of loss of cell turgor.
The assertion by Mil burn (1973a) that clicks detected in Ricinus leaves
wilted by infusion of solutions of low osmotic potential were not caused by
loss of cell turgor therefore seems to be justified.
The cause of the few clicks heard as chamber pressure increased is unknown.
They may have been due to movement of the pressure chamber seal as pressure
increased, or to compression of leaf tissues by high gas pressures.

101
The great er variabi Ii ty 1 n the ca vi tati on profi les obtained from pressure
chamber experiments compared to those from normal acoustic experiments was
thought to be an artifact resulting from errors 1n the calculation of sap
tensions. These errors were apparently caused by incorrect measurements of
balance pressure after equi Iibration of the leaf at high pressure. They were
not due to large inequilibria between sap tension and the falling chamber
pressure during experiments.
These errors in balance pressure measurements will result in over-estimates
of the sap tensions at which cavitation occurs. However, as the inequilibria
which are probably responsible for the overestimation disappear slowly over the
entire duration of the experiment, it is not possible to correct the results by
substituting the second balance pressure measurement when calculating sap
tensions.
3.6. Recovery from cavitation
3.6.1. Introduction
The effect of cavitation on plant water status depends not only on how
many and which conduits cavitate, but also on for how long the conduits remain
embolised.
If embolisms exist for only a short period before collapsing it is possible
that even extensive cavitation will have little lasting effect on the ability
of the xylem to supply the water requi rements of the plant (Milburn and
McLaughlin, 1974).
Recovery of water conduction in a cavitated plant can take two forms:
a) If emboli are not redissolved the capacity to conduct water can be
recovered only by laying down new xylem conduits, as happens every spring
in some deciduous ring-porous trees such as Acer (Kozlowski and Winget, 1963).
b) If emboli are dissolved, the conduction of water in the xylem can be
restored without producing new xylem conduits.

102
The acoustic technique provides a useful means of testing for removal of
emboli from xylem conduits. TIlis is because the clicks detected by the
acoustic detector are produced when strain in condui t walls is released by
cavitation of the contained sap. If the conduit contains a bubble the sap
cannot come under tension as the bubb Ie wi 11 expand. Therefore the walls of
the conduits will not deform and store the energy which produces the 'click'
detected when sap tension is released by cavitation.
The recovery of the abi Ii ty of leaves to produce cli cks and, by the above
argument, to sustain cohesive sap transport has been investigated in leaves of
Lycopersicum (Nonhebel, pers. comm.), Plantago (Milburn and McLaughlin, 1974)
and Ricinus (Milburn, 1973a).
In these studies the abiIi ty of leaves, which had almost ceased to produce
clicks in one drying cycle, to produce clicks could be partly recovered by
supplying water at atmospheric pressure to the xylem for several hours. The
recovery was enhanced if water was supplied tmder positive pressure or if the
gas pressure in the embolised condui ts was lowered before supplying water.
Information on the recovery of sap columns in intact plants from
cavi tation is lacking although it has been sugges ted that cavitation and
recovery, aided by root pressure, may be a common diurnal phenomenon in some
herbs (Milburn and McLaughlin, 1974).
In the experiments described below the recovery of sap column continuity
in cavitated leaves, shoots and whole plants was studied in Rhododendron by
using the acoustic technique.
It had already been established (section 3.5) that cavitation, as indicated
by the acoustic technique, occurred at sap tensions of 1.2-3.0 MFa in both
leaves and shoots of Rhododendron

103
3.6.2. Recovery of cli cks In Rhododendron by rehydration
Obtaining leaves of known sap tension
When investigating recovery from cavitation it was necessary to be able to
assess the sap tensions in leaves without taking balance pressure measurements
of the leaves themse 1 ves as some cavitation emboli might dissolve during balance
pressure measurements. The experimental approach adopted was to measure balance
pressures and assess recovery from cavitation on different leaves from the same
shoot.
Shoots were allowed to deve lop water s tress by transpiration on the laboratory
bench before sealing into plastic bags to equilibrate for thirty minutes.
After equilibration groups of leaves were cut from the stem and their balance
pressures determined simultaneously by mounting them together in the split-bung
seal of the pressure chamber.
Variation in balance pressure between leaves sampled at mean balance
pressures below 1.5 IvIPa were very small and of magnitudes comparable to the
accuracy with which pressure could be read from the pressure gauge (about ± 0.01
MPa) . Variability within groups increased as mean balance pressure increased
above 1.5 MPa. When mean balance pressure had risen to 2.7 MPa the balance
pressures of some leaves wi thin the group were found to be as much as 0.25 tvIPa
from the group mean.
This degree of variabili ty was acceptable since, for the purposes of these
experiments, it was sufficient to know whether or not sap tensions in the
leaves were in excess of those required to cause cavitation.
In rehydration experiments variations in sap tension between leaves used
for acoustic experiments and for balance pressure measurements were minimised
by using adjacent leaves. This precaution was especially important when the
rehydration of shoots was being studied. Variation between individual leaves
from a rehydrated shoot was greater than between leaves taken from the same
shoot before rehydration. This aspect is discussed further in section 4. S.

104
a) Rehydration of leaves
Figure 33 shows the results of experiments in which the recovery of the
continui ty of sap columns in cavitated leaves supplied with distilled water
at atmospheric pressure was monitored using the acoustic technique.
Leaves were cut under water and set to rehydrate in a humid atmosphere
with their petioles in distilled water. At intervals leaves were removed
in pairs and one placed on the acoustic detector to monitor clicking as the
leaf dried and the other used for balance pressure determination.
were then dis carded.
The leaves
Figure 33 A and B are records of clicks produced by leaves from shoots of leaf
balance pressure 0 and 1.22 MPa respectively without an intervening period
of water uptake after excision. In both cases the patterns of click
production are very similar to those described for uncavitated leaves in
section 3.2.2.
Figure 33C shows data from a leaf sampled from a shoot of leaf balance pressure
3.15 MPa and therefore expected to be almost fully cavitated. The
inability to detect clicks above the background noise supports this
supposition.
Figure 33D. Leaf removed from a shoot of balance pressure 3.15 MPa and
rehydrated for two hours. A few clicks occurred in a small peak.
Leaves hydrated for a similar period had balance pressure of 0.05-0.10 MPa.
After four hours rehydration (figure 33E) clicks are detected in a pattern
similar to that of uncavitated leaves although the number of clicks
detected is lower. Balance pressure of similar leaves was 0.0-0.05 MPa.
After 16 and 43 hours rehydration (figure 33 F and G) respectively clicks
occur, but a longer initial delay was found (cf. figure 7).
None of the leaves in the above experiments showed discoloration or
brittle areas on the lamina, suggesting that the leaves had not been seriously
harmed by the water stress to which they had been subjected.
Results very similar to those described above were found in two other trials.

40
30
20
-c E -j"
---- 30
Vl ~ 20 LJ ~
-1 10 LJ
20
10
50 100
TIME (min)
A--S·· __ ··_·_-
c
0
E
F--G _. __ ._"
150
Figure 33. The recovery of click production in cavitated leaves rehydrated
after excision from the shoot.
A Turgid, leaf balance pressure:: 0-0.05 MPa.
B :: Stressed, but not cavitated leaf, leaf balance pressure
C :: 'Cavitated' (maximum balance pressure:: 3.15 MPa).
1. 22 MPa.
D 'C<lvitated'
E :: 'Cavitated'
(as in B), rehydrated 2 hours, balance pressure = 0.05-0.1 MPa.
(as in 8), rehydrated 4 hours," .. :: 0 -0.05 t-.1Pa.
F
G
'Cavitated' (as in B), rehydrated 17 hours,
'Cavitated" (as in £3), rehydrated 43 hours,
"
"
" "
a - 0.05 MPa.
= U - O. 05 MPa.

105
b) Rehydration of shoots
The results of an experiment investigating the recovery of sap columns in
leaves attached to 150-200 mm long cavitated Rhododendron shoots are presented
in figure 34. The experiment was conducted four times in all, with a different
shoot on each occasion.
shown in figure 34.
Results in all four experiments were similar to those
A shoot was stressed to greater than cavitating sap tension and
equilibrated in a sealed plastic bag overnight. Leaves were then sampled for
measurement of balance pressure and the ability to produce clicks. 40mm of
the stem was then trirrnned under water to remove emboli and the stem set in a
humid atmosphere with its end in distilled water to rehydrate. At intervals
Pairs of adjacent leaves were cut and their balance pressures and ability to
produce clicks determined.
Figure 34A. Clicks produced by a leaf cut from the shoot after stressing to
subcavi tating tension (leaf balance pressure 1.31 MPa). The pattern of
clicks produced is typical of that for uncavitated leaves (section 3.2.2).
Figure 34 Band C. Leaves sampled from the shoot stressed to leaf balance
pressure of 3.10 MPa before rehydration (B) or after three and a half
hours of rehydration (leaf balance pressure 2.63 MPa) (C). No clicks
could be detected above the background noise in either case.
Figure 340. Leaves from the same shoot after rehydration for twenty-two hours
(leaf balance pressure 0.0-0.05 MPa). The pattern of click generation
was similar to that in previously uncavitated leaves although the initial
increase in click frequency occurred later and was more drawn out than
usual for unstressed leaves.
The same procedure as that described above was used later in the project
when investigating the effect of cavitation on sap transport. In none of
these experiments could clicks be detected in leaves which had not recovered
their balance presSures to less than 0.05 ~Wa after a period at cavitating

c E
-.j"
--
60
40
20
--A -- - -- B ".'.'.'.'. C
-·-0
,.. , '-
40 80 TIME (min)
~ .-\ /. ( \ i \ . v \ / .
/ \ I \
\ L
\
120
Figure 34. The recovery of click production in leaves attached to shoots.
Leaf from:
A - Uncavitated but stressed shoot. Balance pressure ~ 1.31 ~Wa.
B 'Cavitated ( shoot. ((
C
D
(( (( re hydrated 3.5 hours. (( (( (( (( 22 h:>urs "
(( 3.19 ~a. (( = 2.63 MPa.
(( 0-0. 05 MPa.
106
sap tension.
c) Rehydrati on of plan ts
In figure 35 are presented the results of experiments in which the
recovery of leaves on whole plants from cavitating water stress was investigated.
Potted Rhododendron plants were subjected to increasing water stress over
a five week period in June and July 1982. Recovery from cavitation was
assessed when the plants were watered twice daily to keep the soil in the pots
at near field capacity. Experiments were carried out in duplicate. Resul ts
were similar in both cases.
Figure 35A. Clicks produced by a leaf from a plant on the normal glasshouse
watering cycle (maximum daily balance pressure 0.5-0.6 MPa; chapter 4).
Click frequency rose very quickly and as quicklY fell again. This was followed
by a long period over which the low click frequency declined still further.
Figure 35B. Leaf from moderately stressed plant (leaf balance pressure 1.66
MPa; diurnal changes in balance pressure were almost absent at this level of
stress (section 4.6). After an initial delay click frequency peaked in a similar
way to that in experiments with uncavitated leaves (section 3.2.2).
Figure 35C. Leaf from a severely stressed plant (leaf balance pressure 2.37
MPa) . Except for a brief burst of clicks or noise immediately after mounting
on the acoustic detector clicks could not be detected above the background noise.
Figure 35 D and E. Leaves from a plant subjected to severe water stress
(maximum leaf balance pressure attained was 2.33 MPa) and rehydrated for (D) two
days 6Jaximum leaf balance pressure over the day that the leaf was sampled was
0.3 MPa), or (C) seven days (maximum daily balance pressure 0.55 MPa). No
clicks were detected in either case.
Clicks in last expanded leaves
Clicks were difficult to detect in the mature leaves (about one year old)
used for the experiments with potted plants described above (figure 35).
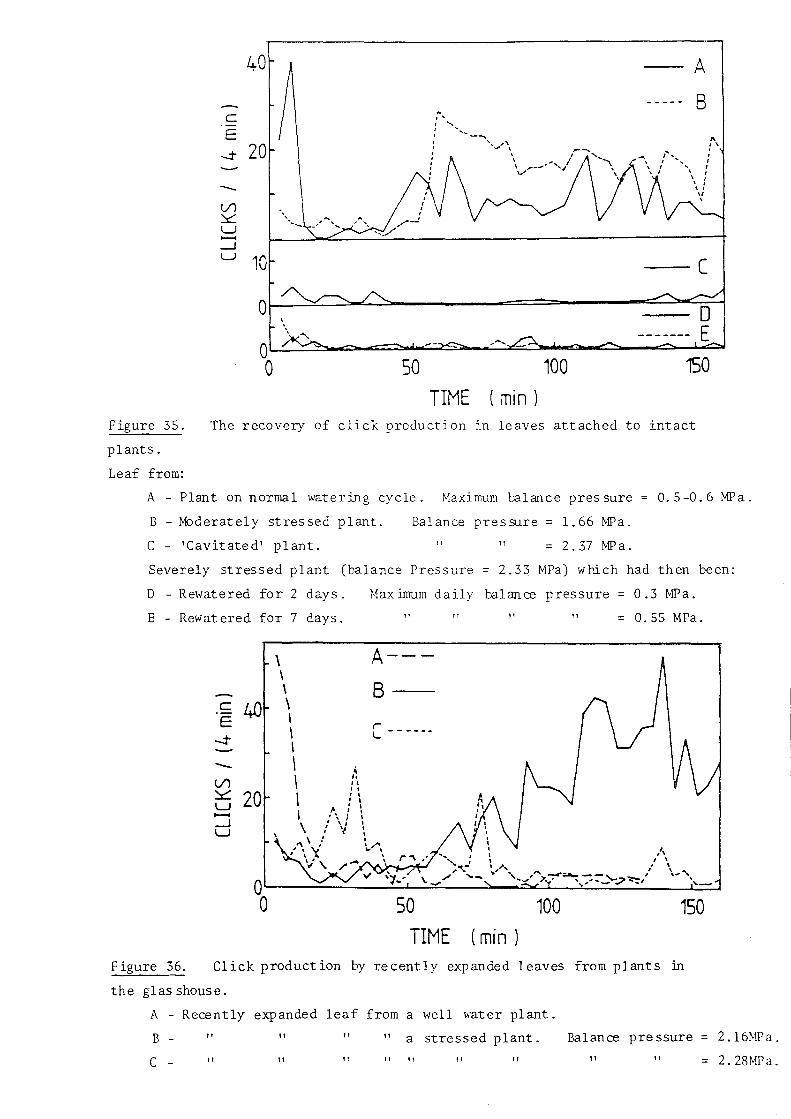
40
c E
-.j- 20
-Vl Y:: LJ ...... ~ LJ 10
0
0 0
,
50 100 TIME (min)
A
B ,.. I \ I
I I ,
c
150
Figure 35.
plants.
Leaf from:
The recovery of click production in leaves attached to intact
A Plant on normal watering cycle. 1>1aximum r.alance pres sure O. 5 -0 . 6 MP a .
B Moderately stressed plant. Balance pressure 1.66 MPa.
C 'Cavitated' plant. " II = 2.37 r-.1Pa.
Severely stressed plant (balance Pressure 2.33 MPa) whch had then been:
D Rewatered for 2 days. Maximum daily balance pressure = 0.3 l>1Pa.
E Rewat ered for 7 days. ,. II " 11 0.55 MFa.
\ A---\ \ B
c 4fJ \ E \
-.j- \ C ------I - \ 4
Vl \ I,
" I I
Y:: \ I, I ,
LJ , ...... \ , ,
~ \ I
LJ , , , '.A ... , ,t, , , I ,
I , ,".>= -;-I'~ :::-_""..;> ~ J'
, \ .... "'\
0 , ,,-
0 SO 100 150 TIME (min)
Figure 36. Click production by recently expanded leaves from plants in
the glas shouse.
A - Recently expanded leaf from a well water plant.
B
C
II II " 11 a stressed plant. Balance pressure = 2.16MPa.
11 " " tf 1f " " " " 2. 28MPa.

107
These leaves were smaller and softer than those which had ex-panded in the three
months prior to these experiments. Clicks could be more easily detected in
the younger leaves than in the older. Because there were comparatively few
recently expanded leaves on the plants, the older leaves were used for most of
the experiments.
Typical results of experiments using these younger leaves are shown in
figure 36. The pattern of clicks detected in the last expanded leaves from
a well watered plant (fugure 36A) was similar to that found in older leaves
from similar plants (figure 3SA).
When the plants were water-stressed (balance pressures 2.16 and 2.28 MPa,
figures 36B and C respectively) there was a longer delay between mounting on
the detector and the detection of the first clicks than in leaves from 36A.
3.6.3. Discussion
a) Recovery of clicks
The ability to detect clicks in leaves which had been subjected to severe
water stress was recovered when water at atmospheric pressure was made
available to the xylem of either the water-stressed leaves or the shoot to
which they were attached.
Recovery was not immediate. Moreover, recovery took longer if the leaves
were left attached to shoots than if detached leaves were supplied with water.
In leaves, the ability to produce clicks was partly recovered after two hours
of hydration and almost fully recovered after four hours. In shoots little
or no recovery was found after three and a half hours rehydration but recovery
appeared complete after twenty-two hours.
Comparison of the balance pressures of leaves (or leaves from shoots)
rehydrated for similar periods showed that clicks were not recovered until the
leaf balance pressure had fallen below 0.05 MPa. As this was near the lower
limit to which chamber pressure could be read accurately from the Bourdon gauge,
t he actual balance pressure in leaves before reconstitution of sap columns may
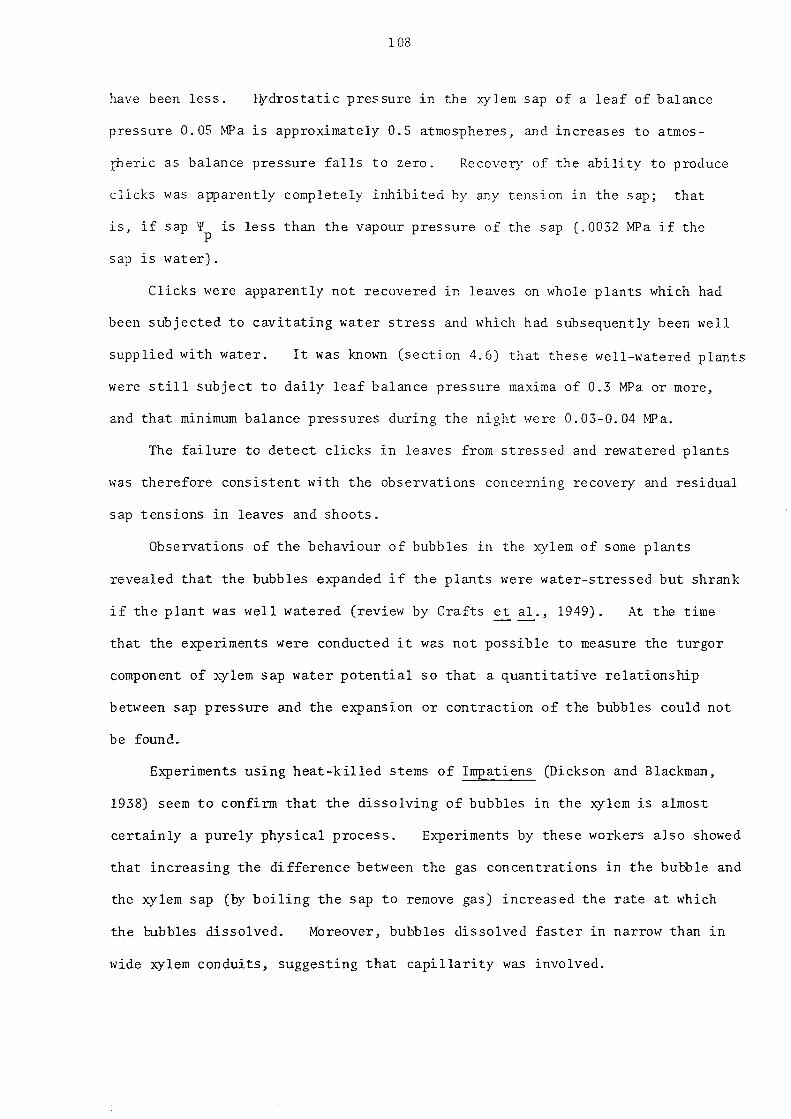
108
have been less. l:ij"drostatic pressure in the xylem sap of a leaf of balance
pressure 0.05 MPa is approximately 0.5 atmospheres, and increas es to atmos-
:t=heric as balance pressure falls to zero. Recovery of the ability to produce
clicks was apparently completely inhibited by any tension in the sap; that
is, if sap '¥ is less than the vapour pressure of the sap (.0032 MPa if the p
sap is water).
Clicks were apparently not recovered in leaves on whole plants which had
been subjected to cavitating water stress and which had subsequently been well
supplied with water. It was known (section 4.6) that these well-watered plants
were still subject to daily leaf balance pressure maxima of 0.3 MPa or more,
and that minimum balance pressures during the night were 0.03-0.04 MPa.
The failure to detect clicks in leaves from stressed and rewatered plants
was therefore consistent with the observations concerning recovery and residual
sap tensions in leaves and shoots.
Observations of the behaviour of bubbles in the xylem of some plants
revealed that the bubbles expanded if the plants were water-stressed but shrank
if the plant was well watered (review by Crafts et ~., 1949). At the time
that the experiments were conducted it was not possible to measure the turgor
component of xylem sap water potential so that a quantitative relationship
between sap pressure and the expansion or contraction of the bubbles could not
be found.
Experiments using heat-killed stems of Impatiens (Dickson and Blackman,
1938) seem to confirm that the dissolving of bubbles in the xylem is almost
certainly a purely physical process. Experiments by these workers also showed
that increasing the difference between the gas concentrations in the bubble and
the xylem sap (by boiling the sap to remove gas) increased the rate at which
the bubbles dissolved. Moreover, bubbles dissolved faster in narrow than in
wide xylem conduits, suggesting that capillarity was involved.
109
b) The physical basis of recovery from cavitation
If the bubble is to dissolve spontaneously the pressure inside the bubble,
PB, must be less than the pressure tending to compress it (Epstein and Plesset,
19 5 0) . The latter will be the sum of the hydrostatic pressure, PH' and the
capillary pressure, PC' developed by surface tension at the meniscus around
the bubble in the conduit.
Ideally (Eqn. 8) PH (atmospheric pressure - balance pressure) so that if
the balance pressure is zero, as in a fully turgid leaf
= ( 0133 MPa - 0)
= :O.1013MPa.
Pc can be calculated from the formula for capillary rise,
i.e. Eqn 9. h
20 cos8 -r~g-- in which h height of liquid column (m)
o = surface tension of liquid (Pa m- l )
8 wetting angle between liquid and capillary
r = radius of the capillary (m)
density of the liquid (kg. m-3)
and g gravitational acceleration (m s -2)
By multiplying both sides of equation 9 by (Pg) the pressure generated by
surface tension in the capillary (PC) is obtained.
20 cos 8 = h:pg =
r Eqn. 10.
-3 -1 Assuming xylem sap to be water (0 = 72 x 10 Pa m ) and the xylem conduit walls
to be fully wetted (8 = 00), Pc is dependent on the capillary radius.
Radial diameters of vessels in a two year old stem of Rhododendron were
measured and found to range between 20 and 40 ~m. Pc in such capillaries will
range from 0.0072 MFa to .0144 MPa.
If the bubble occupying the xylem conduit has recently formed by cavitation
it will contain only water vapour at its vapour pressure (Huber, 1956),
i.e. = 0.0032 MPa.
For a bubble in the narrowest xylem vessels

110
r = 10)lm
therefore Pc .014 MPa.
If the bubb Ie is to collapse
PH > (P B - P ) C
so that PH > (.0032 - .014) MPa
PH > -.0108 MPa.
Therefore, by eqn. 8
Balance pressure < .0905 MPa
Bubbles in wider conduits, in which Pc is lower, will collapse at lower
maximum balance pressures than those in narrower conduits.
Diffusion of gases dissolved in the xylem sap into the bubble will raise
PB and restrict its collapse to lower balance pressures than if it contains only
water vapour.
If the xylem sap is saturated with air
= 0.1013 MPa
and the bubble will not dissolve if sample balance pressure is greater than
0.014 MPa (eqn. 8).
If the sap is in equilibrium with gas pressure in the wood (which may be
up to 0.2 MPa (MacDougal et ~., 1929)) a PH higher than atmospheric may be
required to dissolve the bubble.
Conditions may be made more favourable for the collapse of bubbles in the
xylem by lowering PB (by using vacuum to extract gas from the embolus) or by
increasing PH (by root pressure or by use of the pressure chamber (Milburn 1973a,
Milburn and McLaughlin, 1974).
c) Collapse of bubbles in xylem conduits
The longer time taken to restore clicks to leaves which are still attached
to the shoot as compared to isolated leaves may have been due to the extra time
taken to raise sap ~ to near zero in the shoots. p
The shoots requi re more
water to be taken up to alleviate water deficits (and so reduce sap tension)

III
than do leaves, but this water must be taken up through a long stem in addition
to the leaf petioles. Friction in the xylem conduits, form drag at the pit
membranes (Jeje and Zimmermann,1979) and lateral transport of water to satisfy
water deficits of the pith, xylem parenchyma, cambium and epidermis (e.g. Namken
~ ~., 1971) will all combine to keep sap \jf in the xylem of shoots low for p
extended periods. The kinetics of the rehydration of shoots and further
evidence that xylem emboli do not dissolve until sap is at near atmospheric
pressure are discuss ed in section 4.5.
d) Transpiration and click frequency
The short delay between the start of an acoustic experiment and the
occurrence of the peak in click frequency in leaves which were taken from
unstressed whole plants and used without rehydration was different to the
response of leaves hydrated prior to experiments. The rapidity with which
clicks occur in this situation has been attributed to pre-existing sap tensions
in the plant which may be just below those required to cause cavitation, or
which may already have resulted in partial cavitation before the leaf was
excised (Hilburn and McLaughlin, 1974).
It was known that sap tensions were of 0.3-0.6 MPa in the plants from
which the leaves were cut (section 4.4). It was unlikely that cavitation
occurred in these leaves at sap tensions below a minimum of about 1.2 MPa
(section 3.5). It was therefore thought likely that the rapid rises in sap
tension occurring in the several minutes between the time that the leaves were
sampled and when they were mounted on the acoustic detector were responsible
for the rapid onset of clicking. Very rap id changes in balance pressure
immediately after leaf excision have also been reported in sorghum (Turner and
Long, 1980).

112
A curious aspect of the results of these experiments (figures 33, 34, 35)
is the tendency for the delay between the beginning of the experiment and the
beginning of clicking to increase when the leaf or shoot has been subjected to
a cycle of water stress and rehydration.
The longer delay could be the result of increased stomatal resistance in
leaves which had been subject to water stress. Because of this delay,
experiments had to be continued for longer than was normally necessary when
using unstressed material. Failure to extend the duration of the experiments
could have resulted in the conclusion that clicks were not recovered by
rehydration.
This problem shows the limitations of the use of patterns of clicks
against time to assess the recovery of plant material from cavitation.
Without relating click frequency to changes in sap tension, or at least in
water content, it is difficult to separate low click frequency due to the
effects of cavitation from low click frequency due to slow increases m sap
tension.
In discussing these experiments the occurrence of a peak in click frequency
was taken to indicate recovery from cavitation. The number of clicks detected
was considered to provide extra evidence of the extent of recovery but, for
the reasons discussed in section 3.2, was considered to be less important.
Ideally, investigations into the recovery of clicks should aim to
reproduce the cavitation profiles (section 3.5) of the leaf.
3.7. Summary of chapter 3
(1) The acoustic technique was successfully applied to the determination of
the sap tension at which cavitation occurs in eight species of trees,
shrubs and herbs.
Cavitation began at sap tensions of l-l.S MPa in leaves of Acer,
Alnus, Eucalyptus, Fraxinus, Plantago and Rhododendron. Cavitation was
113
most frequent at sap tensions of 1.7-3 MPa in these species. Cavi tation
began at sap tensions of 0.1 !vlPa In Lycopersicurn and Ricinus and was most
frequent at sap tensions of 0.3-0. 7 ~1Pa.
Sap tensions at which cavitation occurred increased as leaves
matured and, in Rhododendron, were unaffected by low winter temperatures.
(2) Dissolving of cavitation emboli appeared to be dependent on attaining
near atmospheric pressures in xylem sap. Thus the ability to produce
clicks could be recovered by rehydrating cavitated, detached Rhododendron
shoots or leaves, but not by rewatering intact plants.
(3) Experiments showed that gas appeared in the xylem of Acer shoots at the
same time that clicks were detected in the same shoot, and that the
majority of clicks produced in Rhododendron leaves were produced as sap
tension increased, not as cell turgor decreased.
(4) No evidence of errors in pressure chamber estimates of '¥ 1 due to
cavitation were found in Rhododendron leaves although differences between
shoot and leaf balance pressures at sap tensions above 1.8 MPa may have
been caused by cavitation in the xylem of the shoot sterns.

114
Chapter 4. Cavitation and sap transport
4.1. Introduction
Cavitation of xylem sap results in the affected xylem conduits becoming
gas filled and therefore unab Ie to take part in cohesive sap transport.
However the cellular construction of the xylem prevents the spread of cavitation
emboli beyond the conduits in which they are formed and so reduces the effect
of a single cavi tation event on sap transport in the xylem as a whole (Dixon
and Joly, 1894). The effect of cavitation on sap transport therefore depends
on the degree of redlmdancy of conduits in the xylem as well as On the number
of cavitation events. As yet no studies have investigated the effect of
cavi tation caused by known sap tensions on the flow of water in the xylem.
The experiments described in this chapter were designed to measure the effects
of cavitation (inferred from measurements of sap tension and knowledge of the
sap tensions causing cavitation (section 3.5)) on the permeability of the xylem
of Rhododendron ponti cum. Ricinus communis was also used for some preliminary
trials but, for reasons discussed below, was not used in large scale experiments.
The effects of high sap tensions on the permeability of the xylem of
Rhododendron was investigated in i) segments of stem, ii) shoots and iii) whole
plants. The three sets of experiments were necessary because, although
measurement of the factors from which permeability can be calculated is easier
and more accurate in smaller samples, there is an increasing tendency for
cavitation emboli to dissolve as the sample size is decreased and, as
resistances to water movement are also decreased, sap pressures rise. In
whole plants and shoots sap pressure can only rise to atmospheric hut in stem
segments sap pressure will exceed this as water is supplied from a small
hydrostatic head.
These experiments were undertaken specifically to investigate the flow of
sap in water-stressed material. In this respect they are different to
previous studies which have measured xylem permeability in unstressed material
115
(e.g. Farmer, 1918; Peel, 1965; Zimmermann, 1978) or material which had been
thoroughly rehydrated before measurements were made (e.g. Edwards, 1980;
Megraw, 1967; and Tyree and Zimmermann, 1971).
The effect of high sap tensions on the conduction of sap in the xylem was
also investigated by using stains to identify the parts of the xylem in which
sap was being carried. Dyes have been used previously to observe changes in
sap conduction in trees in response to water stress (Greenidge, 1955a;
Kozlcwski and Winget, 1963) but the sap tensions causing these changes were
not fully determined in these studies.
4.2. The vascular anatomy of Rhododendron and Ricinus
When designing or interpreting the results of permeability experiments
it was necessary to know something of the arrangements of the tissues and the
length of the xylem conduits in the samples used. Experiments measuring the
length of the xylem conduits in stems of both Rhododendron and Ricinus were
therefore conducted. The results of these experiments and a brief description
of the anatomy of the stems of each species are given below.
Experiments with Rhododendron were conducted using the current season's
shoots (sampled between January and July, and classified as 'one year old') or
the previous season's growth ('two year old'). Similar experiments were
conducted using 4-6 month old Ricinus plants grown in the glasshouse.
a) General anatomy
The Rhododendron shoots produced each year are 200-400 mm long and consist
of a length of leafless stem with a cluster of leaves at the apical end. In
cross-section the stems consist of a thin bark overlying a hollow cylinder of
wood around a large central pith. The wood is composed solely of fibres and
vessels (Rivett, 1920) and is frequently traversed by rays one or two cells
wide. The leafless part of the stem tapers gradually towards the apical end.
Ricinus stems, consisting of the length between the roots and the first

116
leaf, were 0.4 to 1.0 m long. They consisted of a hollow cylinder of A~lem
overlaid by a thin bark and surrounding a very large pith, sometimes having
a central pore.
b) Length of conduits in stems
One and two year old Rhododendron shoots and a Ricinus shoot were set to
transpire diluted and filtered Indian ink suspension (section 2.8) overnight.
At the end of this period leaves from the Rhododendron shoots had balance
pressures between 0.6 and 1.0 MPa and the leaves on the Ricinus shoot had dried
to brittleness. Both the elevated balance pressures of the Rhododendron leaves
and the death of the Ricinus leaves were taken as evidence that the transport
of water in the xylem had been blocked by ink drawn to the ends of the xylem
conduits.
The Rhododendron stems were sectioned at 5mm intervals and the number of
conduits containing ink in each section counted (figure 37a). An analysis of
the results, analogous to that of Zimmermann and Jeje (1981), of all six stems
showed that most xylem conduits terminated within 45-50 mm of the cut end of
the stems and that less than 1% of the conduits extended more than 100mm from
this end of the stem (figure 37b). Results were similar in three two year old
shoots (both years' xylem) and in three one year old shoots.
Ink was found in vessels of the Ricinus stem as high as the first leaf.
No other analysis of the results was carried out.
c) Length of conduits in leaves
Rhododendron leaves were set to transpire the Indian ink suspension overnight.
On the basis of experience with shoots it was assumed that ink had been drawn
to the ends of the conduits in the petioles by the end of this period. The
petioles were sectioned 4mm from the cut end and at the base of the lamina
(typically 8-12 mm from the cut surface) and the number of conduits containing
ink in each section counted.
Ink was found only in the thin-walled, large diameter conduits (presumed
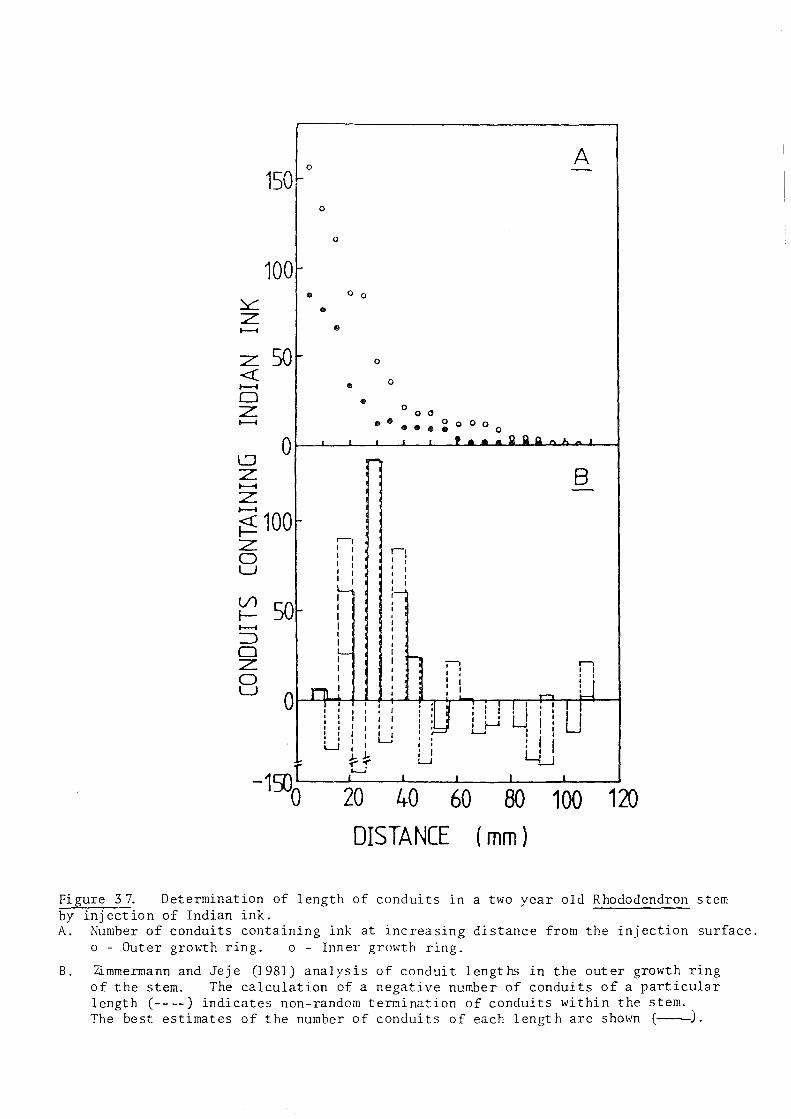
150~
100r-
Z 50f« ~
o z ~
o
o
CD
CD
A
o
o 0
• o
CD o
o 0 0
•• ••• ~oooo
L.:J Z
O~_L-·-J __ ~ __ L-_~l_~!.~LA.L~~QL~Q~~n.~~~ __ ~
~
Z ~
~ 100~ z o LJ
V1 I-~
r-, , I I I I I , I I I I
I I
r-, , : I I I , , , :-'
I ' I : , I
I ,
B
~ : I ':: n
::J o :z o LJ
I I I I _ U:, I n I ": I r-. Or-~'!'~"~"~'I'~"'-:~I ~~:L~U:~'~~:~:~I-~!,~II-+:~~~U!~!~--~
I I I, " " U I: 11'1" I, J I'l 1 : : I LJ :, t, I I LJ I I I ,
: I , ! U LJ "-LJ -150~--~'----~1----L---_~'--~'~--~ o 20 40 60 80 100 120
DISTANCE ( mm )
Figure 37. Determination of length of conduits in a two year old Rhododendron stem by injection of Indian ink. A. Number of conduits containing ink at increasing distance from the injection surface.
o - Outer growth ring. 0 - Inner growth ring.
B. Zimmermann and Jeje (1981) analysis of conduit lengths in the outer growth ring of the stem. The calculation of a negative number of conduits of a particular length (----) indicates non-random termination of conduits within the stem. The best estimates of the number of conduits of each length are shown (----).
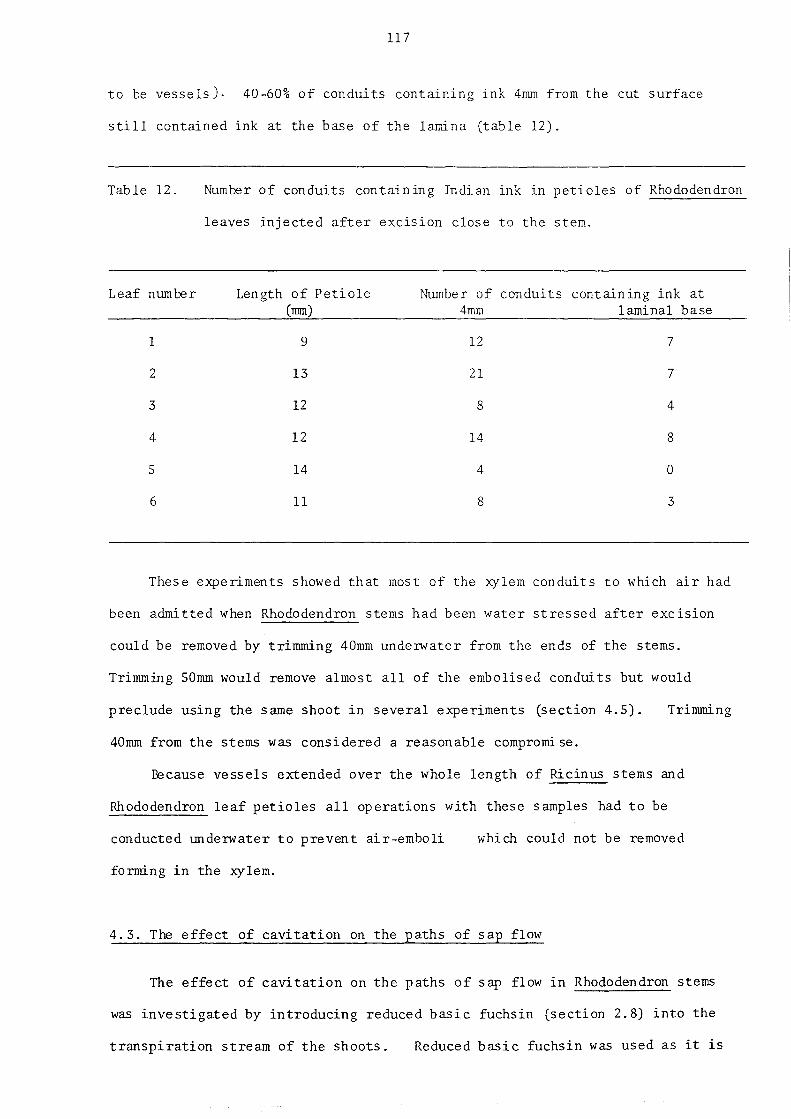
117
to be vessels). 40-60% of conduits containing ink 4mm from the cut surface
still contained ink at the base of the lamina (table 12).
Tab Ie 12. Number of conduits containing Indian ink in petioles of Rhododendron
leaves injected after excision close to the stem.
Leaf number Length of Petiole Number of conduits containing ink at (mm) 4mm laminal base
1 9 12 7
2 13 21 7
3 12 8 4
4 12 14 8
5 14 4 0
6 11 8 3
These experiments showed that most of the xylem conduits to which air had
been admitted when Rhododendron stems had been water stressed after excision
could be removed by trimming 40mm underwater from the ends of the stems.
Trimming 50mm would remove almost all of the embolised conduits but would
preclude using the same shoot in several experiments (section 4.5). Trinuning
40mm from the stems was considered a reasonable compromi se.
Because vessels extended over the whole length of Ricinus stems and
Rhododendron leaf petioles all operations with these samples had to be
conducted underwater to prevent air-emboli which could not be removed
forming in the xylem.
4.3. The effect of cavitation on the paths of sap flow
The effect of cavitation on the paths of sap flow in Rhododendron stems
was investigated by introducing reduced basic fuchsin (section 2.8) into the
transpiration stream of the shoots. Reduced basic fuchsin was used as it is

118
known to stain only tissues near to those In which sap is flowing (e. g.
Petty, 1970).
a) Shoots
Rhododendron shoots v.ere allowed to develop sap tension (indicated by
measurement of leaf balance pressure) by transpiration on the laboratory bench
and then trimmed underwater (section 4.2.3) to remove xylem conduits containing
air. The end of the stem was then transferred from ~mter to a phial of
reduced basic fuchsin, care being taken that a drop of water remained on the
cut end during the transfer so that air was not admitted to the xylem. An
uncavitated shoot (balance pressure = 0.83 MPa) and one cavitated shoot
(balance pressure 4 MPa) were Ie ft to transpire the stain for eight hours and
a second cavitated shoot (balan ce pressure 4 MPa) was allowed to transpire
the stain overnight. Then stems \'iere cut at intervals and the staining of
the xylem examined (plates 4A, 4 Band 4C re specti vely).
In the uncavitated stem the stain occurs in almost continuous bands,
interrupted only by unstained leaf traces and rays, in the early wood of each
year's growth.
In cavitated stems, whether transpiring the stain for eight hours or over
night (plate s 4 Band 4C), the stain occurs in patches, these patches being
rennants of the bands seen in uncavitated stems. Often a coloured spot was
found to be due to stain carried in a single, isolated ves~l.
The fi bres were unstained in all experiments.
Stain carried in the vessels did not travel as far up the stems of
cavi tated shoots as in the stems of uncavitated shoots.
b) Leaves
Leaves were cut underwater from shoots and set to transpire reduced basic
fuchsin for 30 seconds or 5 min. The pattern of staining was the same in both
cases. Sections cut from the petioles of uncavitated and cavitated leaves
after infusion of the stain are shown in plate 5.

Plate 4. Staining of xylem in Rhododendron stems by reduced basic fuch s:in.
A) Uncavitated sooot (balance pressure = 0.83 MPa), stained 8 hour s, section
cut at 1,5,10,15,20,30,50,100 mm.
B) Cavitated s hoot (balance pre ssure > 4 MPa), st ained 8 hours, sections cut
at 0,5,10,15,20,25,35 mm.
C) Cavitated shoot (balance pressure> 4 MPa), stained overnight, sections cut
at 0,5,10,15 mm.
ex 4.5)

« u

A B -
Plate S. Staining patterns in petioles of Rhododendron leaves transpiring
reduced basic fuchsin. (Approximately x 60)
A. Uncavitated leaf (balance pressure = 0.,..0.05 MPa).
B. Cavitated leaf (balance pressure = 2.76 MPa) .
C. Cavitated and rehydrated leaf (maximum balance pressure after stress
2.76 MPa, balance pressure after 19 hours rehydration = 0-0. 05 ~IPa) .
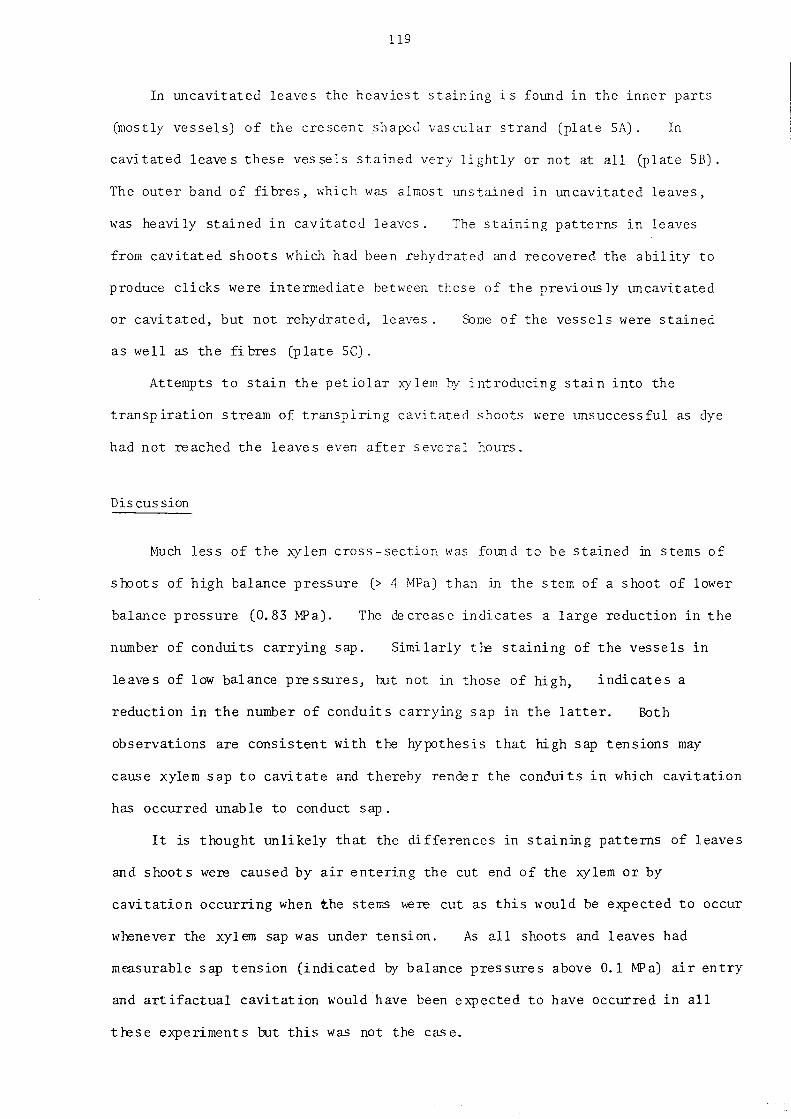
119
In uncavitated leaves the heaviest staining is found in the inner parts
(mostly vessels) of the crescent shaped vascular strand (plate SA). In
cavi tated leave s these ves sels stained very li ghtly or not at all (plate SB).
The outer band of fibres, which was almost unstained in uncavitated leaves,
was heavily stained in cavitated leaves. The staining patterns in leaves
from cavitated shoots which had been rehydrated and recovered the ability to
produce clicks were intermediate between those of the previous ly uncavitated
or cavitated, but not rehydrated, leaves. . Some of the vessels were stained
as well as the fi bres (plate SC).
Attempts to stain the petiolar xylem by introducing stain into the
transpiration stream of transpiring cavitated shoots were unsuccessful as dye
had not reached the leaves even after several hours.
Discussion
Much less of the xylem cross -section was found to be stained in sterns of
shoots of high balance pressure (> 4 MPa) than in the stern of a shoot of lower
balance pressure (0.83 MPa). The de creas e indicates a large reduction in the
number of conduits carrying sap. Similarly tre staining of the vessels in
leaves of low balance pressures, but not in those of high, indicates a
reduction in the number of conduits carrying sap in the latter. Both
observations are consistent with the hypothes is that high sap tensions may
cause xylem sap to cavitate and thereby rencle r the conduits in which cavitation
has occurred unable to conduct sap.
It is thought unlikely that the differences in staining patterns of leaves
and shoots were caused by air entering the cut end of the xylem or by
cavitation occurring when the sterrs here cut as this would be expected to occur
whenever the xylem sap was under tension. As all shoots and leaves had
measurable sap tension (indicated by balance pressures above 0.1 MPa) air entry
and artifactual cavitation would have been expected to have occurred in all
trese experiments but this was not the case.
120
The staining of the fibres of petioles of leave s of high balance pressure
but not in those with low was an unexpected result and suggested that a) when
vessels are un able to conduct sap some flow may occur in the fibres and b)
cavi tation occurs at higher sap tensions in fibres than in vess els.
Rehydration of cavitated shoots, known to restore the ability of leaves
to produce clicks (section 3.6), also restored sap flow to some of the petiolar
vessels. This is additional evidence for the hypothesis that !clicks! are
the result of cavitation of xylem sap.
The changes in stained areas, particularly in stems, were so large that
measurable effects on the flow of sap through the stems might be expected.
Experiments conducted to measure these reductions are discussed in sections
4.4, 4.5 and 4.6.
4.4. The effect of cavitation on sap flow in stem segments
4.4.1. Introduction
The staining experiments of section 4.3 have shown that in highly stressed
Rhododendron shoots less of the xylem carries sap than in mooorately stressed
shoots. It was suggested that this reduction in conducting area was due to
cavitation of the sap in the xylem, and that the decrease in the conducting
area of the xylem may have measurable effects on the permeability of the stems.
In the experiments described below the effect of high sap tensions on the
flow of sap in the ). . .'ylem was assessed by measuring the permeability of stem
segments cut from shoots over a wide range of balance pres sures.
The perrreabi1 ity of the xylem was measured :in terms of its relative
conductivity (K) (Heine, 1970), defined as
Equation 2 K
QlI} 6P A
The symbols are as defined in section 1.S.1.
Tlle us e of stem segments has advantages for the study of the effects of
cavi tation on sap transport.

121
a) The parameters required for the calculation of K, i. e.
flow path length (1), xylem area (A), pressure causing flow U~P), and sap
flux (Q), are easily measured.
b) Because the segment is relatively short it is unlikely to have
differences in hydraulic conductivity along its length. I:bwever the
di sadvantages of us ing stem segments are twofold. Firstly cavitated conduits
may refill as the liquid used to assess flow is at near atmospheric pressure
and secondly, the xylem may become clogged by small particles or bubbles
carried in the water us ed to make the measurements. However, as conduits may
take several hours to refill (section 3.6) and as clogging can be minimised by
filtration and degassing of the water used in experiments (Booker, 1977) it may
be possi ble to deterw.ine the effects of cavitation on xylem permeability by
us ing stem segments.
Experiments were conducted using segments of Rhododendron and Ricinus stems.
4.4.2. The electrical analogue and the flow of water in stem segments
As both the length (1) of the stem segments and the pressure (6P) used
to drive the flow of water through them were varied in these experiments it was
thought desirable to demonstrate that equation 2 did describe adequately the
dependence of K on 1 and 6P. It would also have been desirable to test that
the relation also held for xylem area (A) but it was not possible to control
xylem area in the segments used in these e)..'Periments.
The results of experiments to test the dependence of Q (and hence K) on
increase in direct proportion to 6P over
1 in figure 39. Q was found to (f/~lI,.e 3ft fi, c)
the range 0-4.14 MPai This was
6P are shown in figures 38 and 43 and on
similar to the results of Sucoff et~. (1965). Moreover, when extrapo lated,
the line passed close to the origin indicating that end effects could be
neglected when calculating K (Zimmermann and Jeje, 1981). An irreversible S
decline in Q at high @ was sometimes found (figure 381) This was due to
clogging of xylem which occurred when large volumes of water were pass ed through

2~J ----------------------------~
/ -r--0 ~
X ~
(Y\ V> 1 E -dl / ~ ~ I
0,,,, I J I I
o 1 2 3 4 6P (MPa)
Figure 38.
The effect of changes in the pressure driving flow
(lip) on the flow of water (Q) through Rhododendron stem
segments.
1-0
-0'0 ~
X ~
tf)
(Y\
EO·5 -d
00 STEM
5 10 LENGTH ( m-1 )
Figure 39.
The effect of reductions of stem length (1)
on the flow of water (Q) through Rhododendron stem segments.
122
the stems. This could be greatly reduced by prefiltering the water used by
passing it through 200 -300 mm lengths of Rhododendron stem.
Q was found to increase slightly less rapidly than predicted when
Rhododendron stems were shortened (figure 39). This was thought to result
from slow, progressive clogging of the xylem occurring over the long (3-4 hours)
duration of the experiments. As the observed deviations from the expected
relationship were small, K values measured in stem segments 100-150 rum long
could be compared directly. Stem segments shorter than 95 mm were not used
in permeability experiments. Such segments may contain a significant number
of conduits which extend over the length of the segment without an intervening
pit membrane and which may therefore constitute a low resistance (hence high K)
pat h for water flow.
Xylem areas could not be determined with great accuracy because of
difficulty in delimiting the inner edge of the ring of xylem where it met the
pith. The error resul ting from this was proportionally greatest in one year
old stems in which the ring of xylem was thinnest. It was estimated that
errors in measurement of xylem areas were usually about 5-10% but could be
higher when using very th in stems.
4.4.3. Changes in Q duri ng experiments
There are three causes of changes in the rate of flow of water through
the stem segments used in these experiments:
i) clogging of xylem conduits and pit membranes by small particles and
bubbles carried in the permeating water.
ii) refilling of conduits by water under the small positive pressures used
to drive flow.
iii) changes in the rate of water uptake by water stressed tissues in the
stem segments.
It was found that, except for a short period of rapidly changing flow
immediately after the stems were mounted in the permeability apparatus, both

123
the flow into (Q. ) and out of (Q ) short sterns from unstressed and stressed ill out
shoots remained nearly constant for at least an hour (figures 40 and 41) . The
changes in flux found in the first few minutes of experiment were believed to
te mainly d~ to elastic relaxation of the latex tubing used to seal sterns into
the permeability apparatus. A cyclical variation of slightly less than
11 3 -1. ± 1 x 10- m s ln measured flux rates was caused by cycling in the
temperature (by ± 2KJ of the room in which experiments were conducted.
Clogging and refilling of conduits was therefore not a problem when using
Rhododendron stem segments to assess the effect of cavitation on xylem
permeab ili ty.
It has been suggested that tyloses forming in response to cutting of stems
(Murmanis, 1975) might reduce stem permeability (Edwards, 1980; Booker, 1977).
As no tyloses were seen in sections cut from the stems of Rhododendron shoots
kept for up to four days after sampling, tylose formation was not expected to
be a factor affecting the permeability of the stews used in these experiments.
Satisfaction of water deficits in stem segments
Flow of water to satisfy the water deficits of the living cells in stem
segments cut from water stressed shoots will result in elevated Q. and ln
depressed Q . out
Because of the large proportion of Rhododendron stem segments
occupied by pith and xylem the flow to satisfy water deficits of these cells
has the potent ial to caus e errors in measurements of stem permeability.
Flow to satisfy internal water deficits of a water stressed Rhododendron
stem 492mm long was shown to be sufficient to cause water to flow into both ends
of the stem (figure 41). This uptake declined over several hours, as shown by
a slow return to efflux from the downstream end of the stem.
Water uptake by cells in water-stress ed stems was found to te a pro blem
only when long stems were used. IY stri Wing bark from stem segments and,
bearing in mind that Q a 1-1, by using short stem segments (100-150 mm long) it
was pos sible t.o reduce water uptake by water-stress ed t issues in the stems to

12~----------------------------~
~
~ 8 0 ~
x I"
Vl rn
E - 4
-4~----~----~~----~----~~ o 10 20 30 40
TIME (min)
Figure 40. The flow of water into (open s}meols) and out of (closed symbols)
short segments of one year old Rhododendron stem from which the bark has been
removed and the exposed xylem smeared wi th lanolin.
/c" A From an uncavitated shoot (balance pressure = 1.22MPa, I = 113mm).
0, • From a cavitated shoot c " " 2.48MPa, I = 132mm).

-
d
Figure 41.
_ t,
0
8 l- t, t, t.
CC !::.
- !::. !J.
6 !J.
I- 0
0 -4-
-a a a 0 o <:x:t) 00
00 0 0 00 o
a 000
a a o
o a
a a
o
o
a a a
a
• •• • •••• .... .-• •• ()r------------,.~~.----.--~-~---.-.--.------------------------------~
.;' ~
-2-~
-4--
0
•
•
• -.. • •
• • •
SO 100 150 TIME (min)
The flow of water into (open symbols) and out of (closed symbols)
a long Rhododendron shoot.
6., A _ Turgid shoot (balance pressure = 0-0.05 MPa) 450mm long including
one and two year old stems and wi th leaves still attached.
0, • - The same stem after stressing (balance pressure = 2.46 MPa) followed
by removal of leaves and trimming of 40mm from each end of the stem.

124
a negl igible part of the t otal flow through the sterns (e. g. figure 40).
The remaining differences between Q. and 0 (e. g. figure 40) were due In 'out
to leaks at the seals joining stems into the permeabil ity apparatus and
evaporation from the barkless stems even though they were smeared with lanolin.
The effect of thes e remaining errors was minimis ed by averaging Q. and Q In out
to obtain Q for cal cuI at ion of K. As leaks, evaIXHation, and uptake by water
stressed tissue s will tend to raise Q. and decrease Q t errors caused by In ou
them will be at least partially cancelled against each other by this procedure.
The effect of the cycling of temperature was minimized by averaging fluxes
measured over 20 to 30 minutes, eXCluding the first ten minutes of each
experiment.
4.4.4. The effect of cavitation on relative conductivity (K)
The effect of cavitation on K was investigated in segments of sterns of
Rhododendron and Ricinus.
The flow of water was measured through stern segments cut from shoots which
had been a) stre ssed to less than cavitating sap tensions, b) stressed to
greater than cavitating sap tensions or c) cavitated and rehydrated.
a) R r.ododendron
The majority of experiments were conducted us ing one and two year old
shoots but a small number of three year old sterns were al so us ed. Segmen ts
were cut from the leafless parts of each season's growth to avoid complications
caused by leaf traces.
The selection of a value of sap tension at which to divide sterns into the
cavitated and uncavitated classes was subjective. After consideration of the
cavitation profiles of Rhododendron leaves (figure 28), a sap tension of 1.8 MPa
(balance pressure = 1.9 MPa) was cho sen. It is within ± 0.1 MPa of this
tension that the greatest increase in the incidence of cavitation occurs.
After stress ing on the laboratory bench shoot s were equili brate d in plastic bags
for 30 minutes before leaves were sampled to as_"ess sap tension (section 3.6).

125
Some s hoots were then returned to rehydrate for 18-24 or 42 -48 rDurs before
stem segments were cut for permeability experiments.
The resul ts of these experiments are presented in table 13. The re suI ts
obtained using one and two year old shoots subjected to increasing sap tensions
only are srovm in figure 42.
i) Increasing sap tension
The results obtained were quite variable (figure 42). There was no sharp
de cline in K which would indi cate extens ive cavit ation occurring over a narrow
range of sap tensions. However a general decline in K occurred as sap tensions
rose above about 1 MPa. The flow of water through the xylem had almost ceased
at sap tensions of around 4 MP a. Stern segrnm ts cut from shoots which had been
maintained at high Ie vels of water deficit for a day were less permeable than
those whose permeability had been measured soon after developing stress (table
13). This was associated with slightly higher sap tensions (by 0.2-0.4 MPa)
in shoots kept at high water deficits for a long period and was not necessarily
caused by stabilisation of cavitation emboli during the period when the stems
were kept at high tension.
ii) Rehydration of stress ed stems
The permeability of stem segments from s roots which had bren stressed and
rehydrated were similar to those of sterns which had not been stressed at all.
The recovery of permeability was similar whether sterns had been set to rehydrate
immediately upon attaining high sap tensions or a day later and was the same or
only slightly greater in sterns rehydrated for two days rather than one (table
13). Balance pressures of all shoot s, whether rehydrated for one or for two
days, were between 0 and 0.05 MPa.
iii) Flow paths in stern segments
Whm stained with reduced bas ic fuchsin no differences in the patte rns of
stainin g of the xylem of stern segments cut from non cavitated or cavitated

PAGE MISSING
IN ORIGINAL
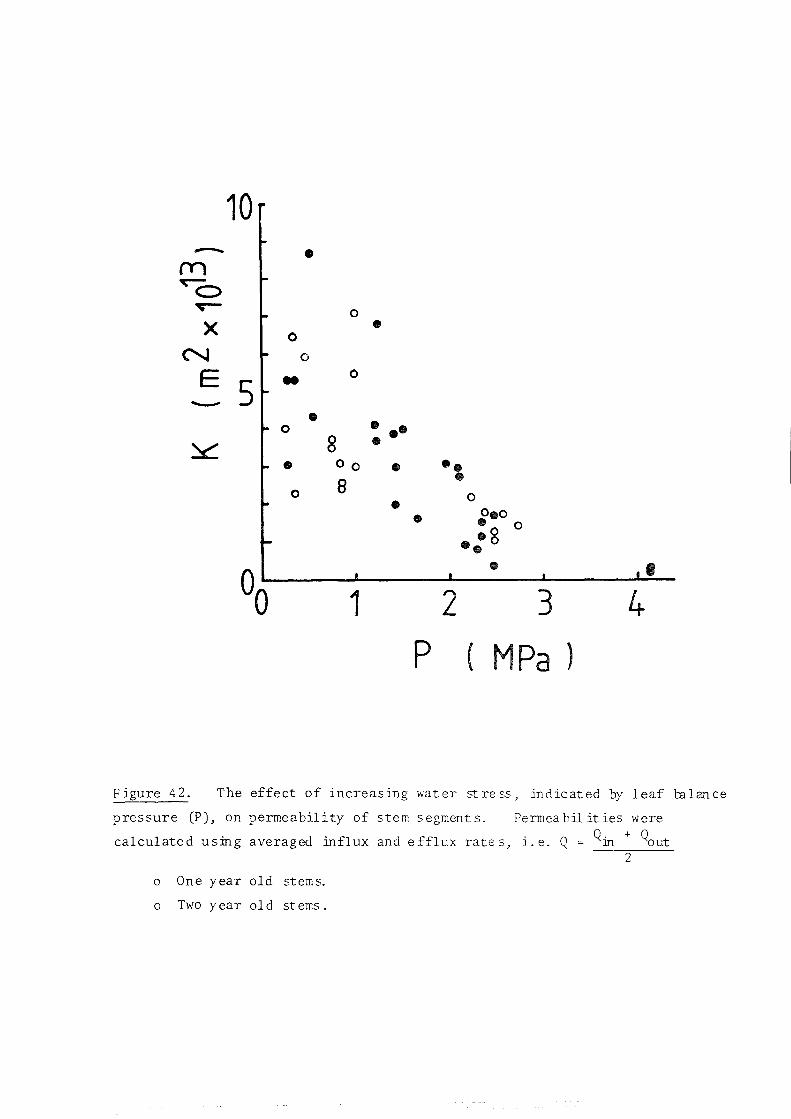
10 - • (Y") ~o ~ 0
x • 0
N 0
E .. 0
5 - • • 0 •• 8 • • 00 • -,
8 0 0 - 0.0 - - 0 • -g • - • 00 1 2 3 4
P ( MPa )
Figure 42. The effect of increasing water stress, indicated by leaf balance
pressure (P), on permeability of stem segments. Permeabilities were
calculated using averaged influx and efflux rate s, j. e. Q = Qin + ~ut 2
a One year old stems.
a Two year old stems.

TABLE 13 .
Age of
shoot
(years)
1
2
Permeability of stem segments cut from one, two and three year old Rhododendron shoots. Three permeability values are given for each stem class
a) K. - calculated from Q. (see text) ln ln
K out - calculated from Q t (see text) ou b)
Average K K. + K ln out c)
Q Shoots of sap tensions below 1.8 MPa were classed as 'uncavitated', those of higher sap tensions as 'cavitated'.
Values are S.E. (number of experiments) * Values for 3 year old stems omitted
----
K (m2
x 1013
)
Uncavitated Cavitated K measured Cavitated and rehydrated Cavitated and rehydrated immediately a day later
Immediately Delayed overnight 1 Day 2 Days 1 Day 2 Days
+ + + + + + + K. 5.0 - 0.5 (13) 3.6 - 0.9 (3 ) 1.8 - 0.4 (5) 4.7 - 1.4 (7 ) 6.9 - 0.6 (2) 5.1 - 0.2 (3 ) 5.2 - 1.2 ln
K out
+ 3.6 - 0.6 (11 )
+ 1.6 - 0.8 (3 )
+ 0.8 - 0.5 (7 ) +
3.9 - 1.4 (7 ) - + b.1 - 1.1 (2 ) + 4.4 - 0.3 (3 )
+ 4.7 - 1.2
+ + + + + + + Aver. K 4.7 - 0.6 (11 ) 2.0 - 0.9 (3) 1.3 - 0.5 (5 ) 3.8 - 1.4 (7 ) 6.5 - 0.8 (2) 4.7 - 0.2 (3) 5.0 - 1.2
+ + + (4 ) ·K. 4.9 - 0.6 (11 ) 2.2 - 0.3 (3 ) 1.2 - 0.4 - - - -ln
K out
+ 3.8 - 1.2 (11 )
+ 1.5 - 0.3 (3 )
+ 0.9 - 0.3 (4 ) - - - -
+ Aver. K 4.3 - 0.5 (11 ) +
1.8 - 0.2 (3 ) +
1.1 - 0.3 (4 ) - - - -
(5 )
(5 )
(5 )
I

TABLE 13 (contd.)
uncavitated Immediately Delayed overnight 1 Day 2 Days 1 Day 2 Days
+ (3 ) 3 K. 4.2 - 2.4 2.7 (1 ) 0.5 (1 ) - - - -~n
+ (3) 1.1 (1 ) - 0.2 (1 ) K 3.9 - 2.3 out
+ 0.1 Aver. K 4.1 - 0.9 (3 ) (1 )
+ (27 ) + (6) * +
All K. 4.9 - 0.4 3.1 ~ 0.8 1.5 - 0.3 (9 ) ~n
measure-+ + +
ments K 3.7 - 0.6 (25) 1.5 - 0.3 (6 ) 0.9 - 0.3 (9 )
I
out + (25 ) + (6 ) +
Aver. K 4.4 - 0.4 1.8 - 0.2 1.1 -0.3 (9)
+ + + K. 1.7-0.3 (15) * 6.5 - 0.6 (9) 5.1 - 0.2 (8 ) ~n
+ - + 0 + K 1.2 - 0.2 (15 ) 5.3 - .9 (9 ) 4.4 -- 0.3 (8 ) out
+ Aver. K 1.6 - 0.2 (15 ) +
5.7 - 0.7 (9 ) + 4.8 - 0.2 (8)
+ K. 6.3 - 0.2 (17 ) ~n
+ K 4.5 - 0.3 (17 ) out
Aver. K + 4.8 - 0.2 17) --~ --_ .. _- ---- .-----~----.- ... --.-.-.---- .. ---.--- .. - --_._ .. _._ .... _-

127
shoots could be found in sections cut 10 and 40rnm from the inlet ends.
one year old stems almost the entire xylem cross-sectim was stained.
year old stems mly the earlywood of each year's growth was stained.
In
In two
b) Ricinus: Seven permeabil ity experiments us ing Ricinus st ens
from plants of leaf balance pre ssures bet\..een 0 and 1.4 MPa were conducted.
The result s were very variable and no consistent effects of high sap
tensions on tre permeability of these stems could be found. Because of this,
and because flow of water to the large pith and its central pores may have reen
affecting results, no further experiments with Ricinus were attempted.
4.4.5. Introduction of emboli into xylem by injection of gas
In the experiments described above the filling of xylem conduits by
emboli formed by cavitation has been suggested as the cause of decreases i:r,
stem permeability and of the conducting area of the xylem. The experiments in
this section were conducted to demonstrate that embolisms introduced into the
xylem artificially had effects on sap conduction similar to those of high sap
tensions.
The pre ssure chamber was used a) to fill xylem conduits with nitrogen gas
and b) to refill the conduits with water (by the procedure of section 2.5.1).
A 100mm segment of Rl:ododendron stem was cut from a shoot of balance
pressure 2. 29 ~1Pa, mounted in the permeability apparatus and the flow of water
through it measured after each of the following sequence of treatment s:
a) 6 hours submerged under dis ti lIed water at atmos pheric pressure.
b) apply ing nitrogen gas at 2.5 MPa pre ssureto one end for 6 minutes.
c) passing filtered water through the stem at 0.5 ~a pressure for
20 minutes, 40 minutes or 60 minutes.
Typical re suI ts are shown in figure 43.
From balance pressure measurements it was known that the stem was partially
cavitated at the beginning of the experiment. After six hours of re hydration
st em ~rmeability had increas ed by 3m, indicating some refilling of crn duits

-~ o
1-5
x 1-0 I (/)
(Y'"')
E -d 0·5
o 1 2 L\P
5
Figure 43. The effect of inj ection of gas or water on the flow of water
through a segrrent of Rhododendron stem.
A - Immediately after cutt ing from water stres sed plant (balance pressure
= 2.29 MPa).
B - After 6 hour s soaking in dist illed water.
C - After inj ect ion of nitrogen gas at 2.5 MPa for 5 minute s.
o E
F
" " "
" "
"
" wat er at 0.5 MPa for 20 minutes.
" " " 0.5 MPa " 40 minutes.
" " " 0.5 MPa " 60 mi nut e s .
The pressure driving the flow of water (liP) was varied between 0.007 and 0.05 MPa
by applying a vacuum to the out let end of the stem segment.
128
in the s egmen t. Injection of nitrogen reduced flow of water through the
stern almost to zero. Forced refilling of xylem conduits by injection of water
under pressure increased the ability of the stem to pass water. In the three
experimen ts of th is series the flow of water through the sterns was increased to
2 to 2.5 times that when flow through the segment was first measured. This
is a similar degree of recovery of permeability to that found when cavi tat ed
Rrododendron shoots were rehydrated (table l3). In two of the exp eriments,
including that of figure 43, an apparent upper limit to the permeability of
the stem segments was reached after several injections of water under pressure.
This may be because all conduits in the stem have become refilled and are now
carrying water or because clogging of the xylem was preventing further increases
in sap flow.
4.4.6. Discussion
Uncavitated R rododendron stems were found by the above experiments to have
-13 2 relative conductivities of about 5 x 10 m (table 13). These were only
slightly lower than the 6 x 10-13 m2 determined for Rhododendron ponticum by
Farmer (1918).
The permeability of Rhododendron stems decreased as sap tensions increased
but returned to near that of unstressed stems when rehydrated for a day or
more (table 13). Stem permeability decreased over the entire range of sap
ten sions between 0 and 4 MPa but tre most marked decreases occurred at sap
ten si ons between 1 and 3 MPa. Similar, although larger and more rap id, changes
in perneability can be induced by injecting gas or water under pressure into
stems (fi gure 43). These results are in broad agreement with those of acoustic
experimEnts (sections 3.5 and 3.6) and are consistent with the hypothesis that
cavitation occurring at sap tensions between 1 and 2.5 MPa renders xylem con:luits
una ble to conduct sap.
I-bwever it is not possible to discOtmt the alternative hypothesis that
cavitation or air entry occurring during preparation of the samples for
permeability measurements was responsible for decreases in permeability. The

broad range of sap tensions over which the decreases in permeability occur may
therefore only indicate that artifacts (and especially cavitation caused by
cutting of stems) are more likely to occur at high rather than at low sap tensions.
This possibility may be tested by subjecting sap in the xylem to knO\\'J1 sap
ten sions and then by rehydrating shoots so that sap tensions fall but, by not
allowing sap pressure to become posi ti ve, preventing cavi tat ion emboli
dis sol ving (sect ion 3.6), and cutting stem segments from both cavitated and
uncavitated shoots or plants at a time when sap tensions are uniformly low.
This approach was attempted in experiments with whole plants (section 4.6) and
indicates that the observed decreases in permeability were not due to cavitation
occurring during preparation.
The similarity of staining patterns in stem segments from shoots of high
and low sap tensions (section 4.4.5) is in contrast to the results of the
staining experiments using shoots (section 4.3). There are two possible
explanations but, in the absence of further evidence, no choice can be made
between them.
Firstly, both acoustic and permeability experiments show cavitation to
occur progressively as sap tensions increase. Therefore, at sap tension s
between I and 3 MPa, a sufficient number of conduits may remain 1.lllcavitated
for the stained areas around them to overlap and to give the appearance that the
stain was carried in all conduits. However the shoots used in section 4.3 had
sap tensions of over 4 MPa and cavitation would be almost complete at these sap
tension s (table 9). The stained areas aro1.llld the remaining sap -filled conduits
would not overlap and much of the xylem will remain unstained with only spots
of colour around the few remaining uncavitated conduits.
Al tern at ively, because permeabil ity experiments were conducted using water
at greater than atmospheric pressure, emboli may have been compressed or
partly dissolved during the experiments and so admitted stain to even cavitated
conduits. However even a small bubble will prevent flow through t he large pit
fields at the end of the conduits. Therefore flow from the conduit must be
through the high resistances of the bordered pits on the walls of the conduits,
130
resulting in the lewer penneabilities of stems from s1-oots of high sap tensions.
4.5. Cavi tat ion and the uptake of water by shoots
4.5.1. Introduction
The experiments described in section 4.4 show stem penneab ility to decrease
as water deficits increase. Ibwever there were indications, for instance in
staining patterns, that conduits were at least partially refilled during these
experiments. Refilling of conduits occurring during permeability measurements
can be avoided by reducing the pressure of the xylem sap to less than that of
the bubbles in the xylem conduits (secti on 3.6).
A reduction in sap pressure occurs whenever moving sap passes a resistance
to flow (Richter, 1973). Form drag at pit membrane s and friction at ce 11
walls are two such resistances (1Yree and Zimmermann, 1971). Measurements of
conduit lengths have shown that most of the water taken up by. Rhodode~drQn shoots
will have to pass through a pit membrane within 40mm of entering through the
cut end of the shoot (section 4.2). In the course of passing these pit
membranes pressure within the sap will be reduced and cavitatim emboli in the
remainder of the xylem will be prevented from dissolving for as long as a
sufficient gradient of pressure, caused by continued uptake of water, is
maintained.
Because the gradient of water potential which drives water uptake -starts
to fall as soon as any water is taken up by the shoot a method of determming
the rate of water uptake by the shoots at a time of known, uniform shoot water
potential was required. This was achieved by us ing an electrical an al ogte ,
based on the charging of a capacitor through a resistor, to describe water
uptake by a shoot (Landsberg et al., 1976). From this model the rate of water
uptake by the shoot at the time water was first supplied to the shoot CLe.
when the water stresse d shoot was first trimmed under water, t = 0) was
calculated. The initial rate of water uptake CQ) was then combined with

131
measurements of shoot length, 1, (section 2.5.2) and shoot water potential, liP,
(obtained from leaf balance pressure measurements (section 3.6)) to obtain K',
a measure of stem permeability (defined by equation 6) and equivalent to the
relative conductivity, K, multiplied by the area of xylem in the stem of the
shoot.
Eqn. 6. K'
Q at t = 0 depends only on the permeability of the shoot and the gradient
of water potentials between the potometer and the cells of the shoot.
Therefore Q, and K' determined from it, are independent of the size of the shoot,
allowing K' values to be used to compare the permeabili ties of shoots from
whi ch leaves or portions of s terns have been cut.
4.5.2. The effect of cavitation on the uptake of water by Rhododendron shoots
Potometers were used to measure water uptake by uncavi tated, cavitated
and rehydrated shoots as described in section 2.5.2.
By using long shoots it was sometimes possible to measure water uptake
several times on a single shoot which had been subjected to successive
treatments.
Water uptake by one such shoot is shown in figure 44. Water uptake
increased as sap tensions rose from 1. 46 to 1. 92 MPa but decreased when a
further increase from 1. 92 to 2.43 MPa was imposed. Reduced rates of water
uptake by shoots subjected to high sap tension were found in all five
experiments of this type.
That the rates of water uptake by shoots were reduced even though the
gradient of water potential driving the uptake has increased suggests that
the resistance to the flow of water in the stem has increased. By assuming
that the change in resistance occurs in the xylem the effect of high water
deficits on water uptake by shoots was quantified by calculating K' for each
experiment.
Because of the likely complexity of water exchange within the shoot during
Figure 44. The effect of water stress on the uptake of water cy
Rhododendron shoot s.
A. Cumulat ive volumes of water (V) takEn up by the same shoot after
st ressing to successively higher levels.
l} Leaf balance pressure ::: 0.46 MPa.
2) Leaf balance pres sure ::: 1. 92 MPa.
3) Leaf balance pre ssure ::: 2.43 MPa.
B. The fit of the ftmction described by the two capacitor model of water
uptake by !:hoot 5 to the data of experimEn t two 0 f part A.

-x
m E
-0 ~o ~ x ~
IV)
m E -
d
10
o
8
6 •
4
2
A
B
•
50
TIME (min)
100
o~-------------~~~~ 100 o 50
TIME (min)

132
rehydration (Tyree and Dainty, 1973), water uptake by the shoot was des cribed
using as a model two capacitors, each charging through a separate resistor
(equation 11).
Eqn. 11. Q -b t
(al - e 1 + -b t a
2• e 2)
A computer-assisted least-squares procedure was used to find the best
fit of this function to the data of each experiment and to calculate Q at t O.
The results of these analyses are shown in table 14 and figure 45. In
most cases 95% confidence intervals in the rate of water uptake at t = 0, i. e.
Q in equation 11, were ± 20% or less of the value of Q (e.g. table 14).
Increasing sap tension to between 1.5 and 3 MPa resulted in decreases in
K' of at least 60% and usually of 80-90%. Overnight rehydration restored K'
only slightly (figure 45). In several instances shoots which had been
rehydrated overnight were used in two potometer experiments only hours apart.
K' values were similar in both measurements, an indication that shortening the
stem did not greatly affect the K' value calculated for each shoot. The large
changes in K' found in shoots as water stress increased were therefore probably
caused by something other than the trimming of the shoot between experiments.
4.5.3. Artifacts in potometer experiments
i) Faults in technique
Leaks from the potometer were prevented by tying a loop of string around
the latex rubber tube where it overlay the stem. Evaporative losses from
shoots on the potometers were about 3 x 10- 12 m3 s-l (0.2 ~l min-I) and were
therefore negligible in comparison to the uptake of water by the shoot.
Cavitation may have occurred when the water stressed shoots were being
trimmed prior to connection to the potometers (Crafts, 1939). Such cavitation,
if it had occurred, was not thought to have had a significant effect on the
results of these experiments as such recently formed emboli would contain only
water vapour at low pressure (Huber, 1956) and would collapse almost immediately
when water at atmospheric pressure was made available t h o t e xylem. That the

Table 14. The calculation of the permeability (K') of Rhododendron shoots from the electrical analogue.
The function used to determine the rate of uptake of water at the beginning of potometer experiments
was (equation 11) -bt -bt Q = (al . e 1 + a
2. e 2). Shown are the results and the derived parameters from
which K' was calculated for two shoots. K' values for other experiments are summarised in figure 45.
(See section 2.5.2 for derivation of K')
Shoot Maximum Rehydration K'±95% confidence LW a 1 bl
a2 b
2 number sap ten sion period, if any 4 inrgrval (m3 s- l xlO lO ) (s -lxl0 3) (m3 s -lxlO lO ) (s -lxl 04 ) (MPa) (hours) (m xlO) (mm) (MPa)
8 a 0.46 0 1. 34± .14 200 0.46 2.8 ± 0 .3 2.1 ± .5 0.3 ± 0.2 0.3 ± 2.4
b 1. 92 0 O. 77± .04 160 1.92 6.2 ± 0.8 2.2 ± .5 3.0± 0.8 3.4 ± 1. 0
l'0 C 2.43 0 0.22±.03 120 2.43 2.8 ± 0.5 3.0 ± .7 1.6 ± 0.1 3.4 ± 1.0 l'0 r-<
20 a 2.39 0 0.37±.11 145 2.39 3.0 ± 1.8 3.8±3.1 3.0 ± 0.6 2 .7 ± O. 9
b 2 .39 20 0.92±.12 105 0.40 3.0±0.4 5.0 ± 0.8 0.7 ± 0.1 5.2 ± 0.9
c 2.39 20 1.03±.29 65 0.39 5.5 ± 1.7 10.1 ± 1.6 0.6±0.1 5.8 ± 0.7
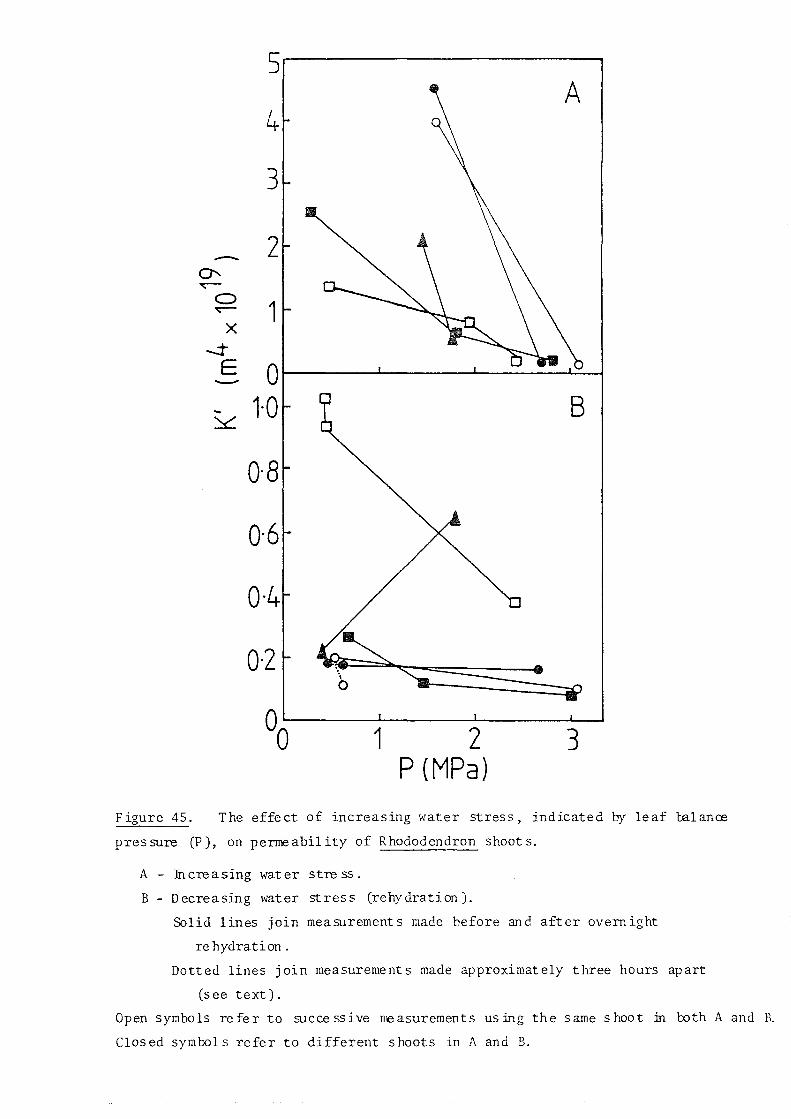
5~------------------~
4
3
- 2 0'-~
0 1 ~
x -.j-
E 0 -- lO B :::::e:
0-8
0-6
0-4
0-2
00 1 2 3 P (MPa)
Figure 45_ The effect of increasing water stress, indicated by leaf talance
pressure (P), on permeability of Rhododendron shoots_
A - Jncreasing water stress_
B - Decreasing water stress (rehydration)_
Solid 1 ines join measurement s made before an dafter overn ight
re hydration _
Dotted lines join measurements made approximately three hours apart
(see text)_
Open symbols refer to successive neasurements using the same shoot :in both A and B.
Clos ed symbol s refer to different s hoots in A and B.

134
permeability of shoots which had been subjected to high sap tensions but then
rehydrated was as low as in shoots at high sap tension supports the view that
cavitation during sample preparation can be disregarded as a source of error
in these experiments.
ii) The electrical analogue and water exchange by small samples
Of more concern were the inadequacies of the capacitor-resistor model
used in determining the initial rate of water uptake by shoots.
There is no reason to suspect that the kinetics of water exchange depends
on whether water is flowing into or out of the cells of the leaf or shoot. A
study of the kinetics of sap expression by a leaf or shoot subjected to over-
pressure in the pressure chamber may therefore be used to test the applicability
of the capacitor analogy to the uptake of water by similar samples. Leaves
were used in the following experiments because evaporation from them could be
limited more effectively than could evaporation from shoots. HJwever, as
I eaves are smaller and simpler in structure than shoots, a simpler model might
describe water exchange by leaves than shoots (Tyree and Dainty, 1973).
Turgid Rhododendron leaves were mounted in the pressure chamber and
subjected to three pressure increments. After each increment sap expressed
from the petiole was collected over timed intervals and the rate of sap
. I:Ne d . d expresslon, M' etermlne. The cumulative volumes of sap collected in one
such experiment are shown in figure 46. A least-squares fit of the function
. -bt (, . d described by equation 7, l.e. E = a.e , to the expression data I.0btame after
each pressure increment) was found and the values for the co-efficients a and b
and the half time of the expression (= 0.693 calculated (table 15)). b
The high regre ss ion co-efficients for the experiments indicate that water
exchange between the xylem and ce 11 s of leave s in response to a suddenly
establ ished gradient of 'l' is clos ely analogous to a single capacitor charging
through a resistor. However leaves are relatively small, homogenous structures
when compared to s roots. Therefore a model using two (as in the experiments
de scribed above) or three capacitor resistance pairs may be more appropriate to

15
-co 0 ~
~10 E -~
5
20 TIME
40 (min)
60
B
C
A
80
Figure 46. Cumulat ive volumes of sap expres sed from a single, initially
turgid, Rrododendron leaf after the following pressure increment:
A 0.03 - 0.21 MPa.
B 0.21 - 1.93 MPa.
C 1.88 - 2.06 MPa.
The lower pressure in each increment was the balance pressure of the leaf
measured immediately before the pressure increment was applied.

discuss ions of water exchange by shoots even though each cell populat ion in
the shoot may be adequately modelled by a single capacitor/resistor pair (Tyree
and Dainty, 1973; Roberts, 1979).
iii) Complexity of water exchange within the shoot
It was assumed when applying the analogy of several capacitor-resistor pairs
to water uptake by a shoot that the water potentials of all cells of the cell
populations represented by each capacitor-resistor pair changed in unison. In
fact, as shown by comparison of the balance pressures of adjacent leaves (table
-1 15) steep gradients of water potential (up to 7 MPa m ) could exist along
rehydrat ing shoots. Moreover, local restrictions within the shoot can furtler
complicate the rehydration of tle shoot. For example the slow rehydration of
leaf 1 on shoot 13 (see table 16) was the result of its petiole being bent wr,en
the shoot was mounted on the potometer.
Table 15. The kinetics of sap expression by a Rhododendron leaf subjected to
Expression
a
b
c
three successive increments in chamber pre ssure. The function
- bt E = a. e was fitted to the rate of sap express ion by the leaf afte r
each pressure increment. The parameters a, b, and the half-time
of the expression, tv of tle fitted function are shown. 2
Al so given
are the total volume of sap expressed by each expression, Ve, and
the evaporative loss from the leaf, as % Ve.
llP (MPa)
0.34-D.21
0.21-1. 86
1. 79-1.97
1.4
14.3
.2
7.5 922
6.7 1022
2.9 2432
r2 of least square fit of function
to data
59
96
92
Ve (g)
.022
.156
.053
Evaporat ion (% Ve)
TotalVe= .232 5.6

136
Table 16. Balance pressures of adjacent leaves about 10mm apart cut from
within the terminal cluster of leaves of Rhododendron shoots
rehydrating on potometers from the original balance pressures and
for the times indicated.
Balance pre ssures of leaves Shoot Initial leaf Durat ion of from within terminal cluster number balance pres sure rehydrat ion ( numbered from basal end) (MPa)
(MPa) (min) 1 2 3
14 2.18 15 0.79 1.03 1.36
13 2.17 52 o .88 0.55 O. &)
12 2.84 64 1.55 2.28
The electrical analogy used in the calculation of K', i.e. of a res istor
(the stem) passing a current (the flux of water) also assumed that the sinks to
which h~ter was flowing were in a small group contacting the xylem at a single
point at a distance from the supply of water. However, as shown in the
follow ing experiments, the sinks to which water flow s are distributed along
the stem as well as being in the leaves and probably include the bark, pith and
xylem parenchyma.
Four Rhododendron shoot s were stressed until leaf balance pressures were
bet ween 1. 7 and 3 MPa and then connected to the potometers in the usual way.
After 30- 4) minute s all the leave s were removed from the shoots, causing an
immediat e mean reduct ion of 4)% (S .E. = ± 5%) in the rate of wate r uptake by
the shoots (fi gure 47). In two of the experiments the bark was subsequently
removed as well, reducing water uptake by 25% and 33% respectively below that
prior to removal of the bark.
Finally, if shoots have been water stressed for a long period, water may
also be taken up to satisfy 'growth deficits' which may occur in the stem
(Mil burn and Weatherly, 1971).
The complexity of water exchange wi thin shoots was probably the maj or
re strict ion on the accuracy of the potometric technique for asses sing the

OJ
~
'1f)0-2 m
E
d 0-1
A 00
50
TIME (min
100 )
150
Figure 47. Reductions in the rate of water uptake by a Rhododendron shoot
(initial balance pressure = 2.17 MPa) when:
A - All Ie aves removed.
B - Bark removed.
--&: 0·2 2::
-o Vl
+1
o r-0·2 o
OO' -.... - OO' ....
I
1 MEAN LEAF P
....
T T ..I. 1
L.
I
2 3 ( MPa )
Figure 48. The difference between balance pres sures of leave s sampled at
the same time from shoots which had been equilibrated in plastic bags for
30 minutes after stres sing on the la boratory bench.

137
effect s of cavitat ion on xylem permeabil ity.
However the difference s in permeabil it ie s betWEen treatments were thought
to be sufficiently large that the 1 imitations of the model of water uptake
used was not 1 ikely to affect the val idity of the conclusions drawn from its use.
iv) Problems in det ermining tp
Two small problems were found when determining sap tension in shoots.
a) Balance pressures of leaves attached to highly stressed shoots failed to
equalize during the half hour equilibration period before sampling (see section
3.6.2), making measurements of sap tension less precise as water deficits
increased. Differences in balance pressure s between leaves were small up to
balance pres sure of 2 MPa but increased rap idl y as water deficit s rose beyond
this (figure 48).
b) A second problem was found when attempting to obtain balance pressures of
1 eave s from rehydrated shoots. Balance pressures of some leaves from these
shoots fell ave r several minutes un til a constant but much lower balance pres sure
was obtained (table 17).
Not all leaves, even amongst those from the same rehydrated shoot, showed
this fall in balance pressure and no similar problems were encountered when
using leaves from \vater-stre ssed shoots which had not been rehydrate d. The
cause of this fall in balance pressures was not known. Leaves stow ing this
behaviour were omitted from cal cuI at ions of the mean balance pres sure (1Il) used
in calculations of K' .
Table 17. Apparent succes sive balance pres sures (measured 30-60 seconds apart)
Shoot number
SOl
55 (1) 1
55 (2)2
1 Shoot
of leave s from stressed and rehydrated Rhododendron shoots.
Balance pressure before re hydration
(MPa)
Mean leaf balance pre ssure after
rehydrati on (MPa)
Succes sive balance pres sure of one leaf from rehydrated shoot
(MPa) Measurement number
1 234 5 6 7
2.86 0.59 1.00 0.90 0.76 0.62 0.28 0.55 0.55
2.50 0.74 0.67 0.62 0.52 0.32 0.35
2.50 0.23 1. 03 0.69 0.41 0.35 0.14
rehydrated for 20 hours; 2 Shoot re hydrated for 48 hours

138
4 . 5 . 4 . 0 is cu ss io n
The rate at which Rludodendron sroots took up water was found to decline
as sap tensions rose a1::ove 1. 5 MPa. This decline occurred even though the water
potential gradients driving flow had increased. In quantifying the reduction
in the rate uptake of water it was assumed that the reduction in the rate was
due to changes in resistances located entirely within the stem. In thi sway
it was sho\~n that the permeability of the stem had decreased by at least 60%
and usually by 80% or more as sap tension rose towards 3 MPa from around 1.5 MPa
or les s.
These decreases in xylem permeability are in accordance with the hypothesi s
that cavitation occurring at sap tensions above about 1.5 MPa may be extensive
enough to re strict the flow of water in the xylem.
This agree s with the results of acoust ic (section 3.5) and staining
experiments (section 4.3) which indicate that cavitation can occur at similar
sap tensions and with measurements of the permeability with stem segments
( sect ion 4.4). It also agrees with the increasing differences between leaf
balance pressures (section 4.5.3) which show major decreases in xylem
permeabil ity at similar sap tensions.
It is interesting to compare the permeabil ity of Rhododendron shoots with
those of stem segments, not only to show the effect of high sap tensions on
each but also as an aid to speculation as to the contri bution of the xylem to
the total resistance to the flow of water in the shoot.
Since, from equations 2 and 6
K' = K.A
then, by assuming a nominal area for tre xylem in the stems of Rhododendron
shoots, it is possible to estimate K for the stems of these shoots for comparison
with that obtained using stem segments. The area a f the xy 1 em at the ap ical
ends of segments of one year old stems used in section 4.4 ranged from 2 - 10 x
10-6 m2 with a typical area of around 5 x 10⁻⁶ m2 . Dividing K' of slightly
stressed shoots (maximum value about 5 x 10-19 m4) therefore gives a K valm,
139
-13 2 for comparison with that of stern segments, of atout 1 x 10 m with a range
-13 2 from 0.5 to 2.5 x 10 m.
Permeabilities of shoots calculated in this way are about 25% of those of
st ern se gmen t s . This argues strongly that a large proportion (about 75% if the
values for K' of shoots are about right) of the resistance to water uptake by
the water stressed cells of a shoot is between the xylem of the stern and the
ce 11 s t hemsel ves. This is a much greater proportion of the total resistance
than the 30% estimated by Tyree ~ a1. (1975) to lie between the xylem ani cells
of Tsuga shoots. The dis crepancy lIlay be due to faults in calculating K' or to
a very much lower resistance to flow in the vessels of Rrododendron than :in the
tracheids of Tsuga.
The failure of the permeabil ity of water stressed shoots to recover when
rehydrated was in contrast to acoust ic (sect ion 3.6) and permeabil it y ( sect ion
4.4) eA'Periments which showed that rehydration did refill the xylem conduits
and re store xylem permea bil ity .
If the failure to recover permeability is not an artifact it may be evidence
that cavitation emtoli in sterns are not completely dissolved by overnjght
rehydrat ion. Such partially dissolved emboli would expand to occupy and block
the whole xylem conduit wren the shoot was subj ected to slight water stress
prior to mounting on the potometers. Such reduce d emboli would not expand :in
stern segments in which permeability was measured using water at near atmospheric
pre ssure. However it is difficult to see why the xylem conduits of the leaves
would not also remain unfill ed in such a case. Clarification of this problem
may require measurement of water flow through shoots under steady state
conditions along the lines of experiments conducted by Hammel (1967) and
Landsberg ~ a1. (1976).

140
4.6. Cavitation and maintenance of plant water status
4.6.1. Introduction
The effects of cavitation on the transport of sap in the xylem should
ideally be invest igated in intact plants. In this way artifacts caus ed by
cavitation occurring as samples are prepared for measurements are avoided.
MJreover, in the absence of root pre ssure, cavitation emboli w ill be unl ikely
to dissolve (Zimmermam and Brown, 1971).
Assessing the effects of cavitation on sap transport in whole plants
requires accurate neasurements of water fluxes and pressure gradients in the
xylem. Such measurement s are often difficult to make. Howeve r, the effect
of cavitation on sap transport in intact plants could be o1:served qualitatively
by assessing the ability of He xylem to supply sufficient water to maintain
transpiration and water potentials of the plants.
In the experiment s de scribed below two indicators of plant water status,
water potent ial 0¥) and stomatal conductance (gs) were measured in potted Rhodo
dendron plants which 11ad been a) maintained on a normal watering schedule,
b) denied water so that sap tens ions high enough to cause cavitation
developed, or c) denied water (so that cavitat:ing sap tensions were developed)
and then re watered for up to five days.
It was expected that extensive cavitation would i) result in lov..er leaf water
potentials in cavitated than in uncavitated plants if stomatal conductance was
unaltered or that ii) water potentials would be maintained at the expense of
transpiration (stomatal conductance would be reduced).
4.6.2. '1'1 and gs in uncavitated and cavitated Rhododendron plants
Potted Roododendron plants in the glasshouse were stressed by withoolding
water for up to five weeks. Diurnal cycling of talance pressure was absent
from plants which had been denied water for more than a few days. Stomatal
conductances of these plants were too low to be measured.
After stressing to cavitating sap tens ions (balance pressure> 1.9 MPa),

141
plants were rewatered and kept at near field capacity by twice daily waterings
for three or five days before an experiment in which leaf balance pressure and
stomatal conductance were measured at intervals over an entire day.
Leaf balance pressures were measured on four leaves from each plant at
each sampling. Two of these leaves had been enclosed in small plastic bags
and covered with aluminium foil for about an hour before sampling. This
procedure allo .... Bd '1'1 to equilibrate with the water potential of the xylem sap
('1' ) (Turner and Long, 1980). x
As the 0 smotic potential of xylem sap was known
to be near zero (section 3.4.3) the balance pressures of the uncovered leaves
were equated with leaf water potentials.
Stomatal conductance was measured on three leaves.
~1ean values of leaf balance pressure and stomatal conductance for each
plant during the day are shown in figure 49. This figure also shows the
courses of relative humidity (Rl-·I) , temperature (T) and incident radiation for
the day. Highest night-time water potentials of all three treatments occurred
just before dawn and were between 0.05 and 0 tv!Pa. Exudation of sap, indicating
night-time root pressures, was never observed. Similarly all plants exhibited
minimum '1'1 immediately before the plants were watered for the first time (at
1100 hours BST (British Summer Time)). 'I' was seldom more than 0.1 MPa les s 1
than'!' during the daylight hours. x 'I'x and '1'1 equilibrated quickly as darkness
fell.
Minimum'l'x (nearly -0.6 MPa) and '1'1 (-0.8 lvlPa) was found in plants which had not
previously been subjected to water stress. Plants which had been stressed and
rewatered three days earlier showed the least decline in '1'1 and'l'x (0.3 MPa)
during the day. Decreases in '1'1 and'!' in plants rewatered for five days were x
intermediate between those of the other two groups. The smallest differences
between '1'1 and 'I'x were found in those plants which had been rehydrated for the
shortest period. In these plants '1'1 and'!' x were usually within 0.02 MPa of each
other even when stomatal conductance was highest and the conditions for
transp iration (low RH, high temperature) were mo st favourable.

Figure 49. Course of leaf balance pressures (P) and stomatal conductance
(gs) of potted Rhododendron plants during 8-9 July 1982.
Leaf balance pressures were used to measure leaf water potential (open
symbol) and, by preventing transpiration, xylem turgor (closed symbols).
Similar lines refer to the same plants in measurements of stomatal conductance
and balance pressure.
NC = Plant maintained on normal watering schedule.
CR5 = Plants cavitated by stressing to sap tensions above 1. 9 MPa,
rewatered for 5 days.
CR3 = Plants cavitated by stressing to sap tensions above 1.9 tvlPa,
rewatered for 4 days.
stomatal conductance (m -1 102) gs = s x
IR Incident radiatior.( -21. -1 ) = MJm
P = Balance pressure (MPa)
RH = Relative humidity (go)
T = Temperature (0 K)
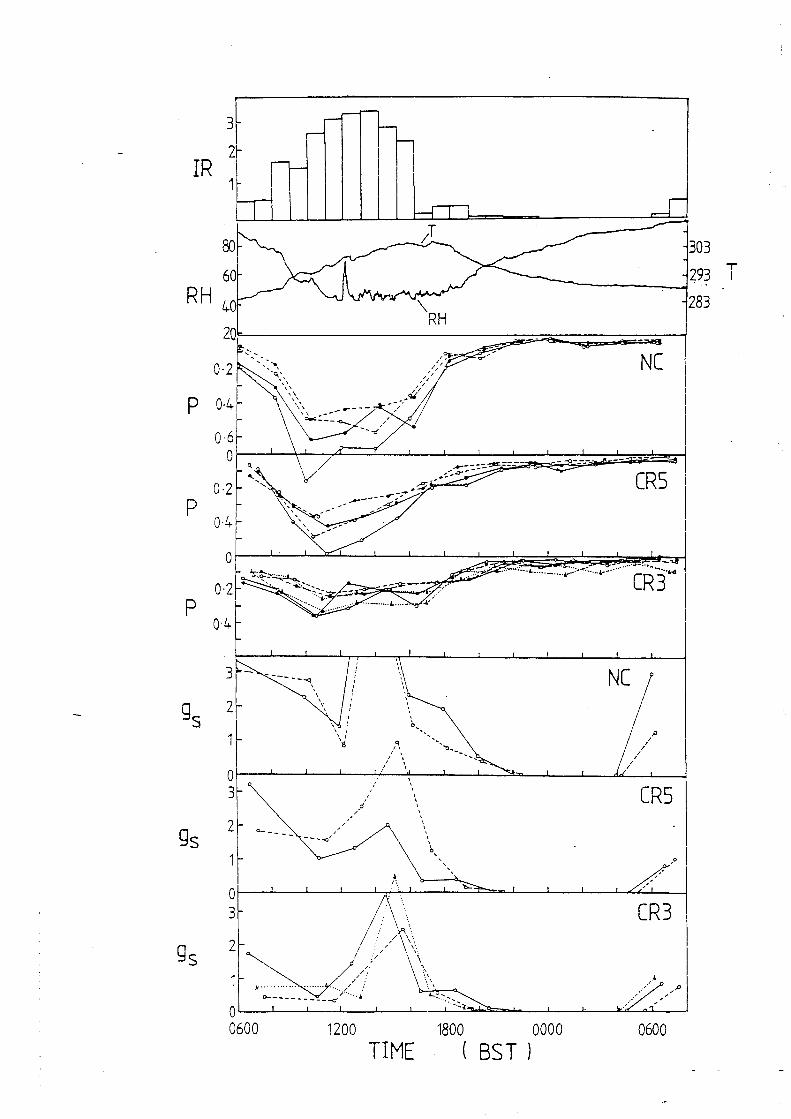
00
60
RH 40
0·2
P 0·4
0·6 0
0·2 P
0·4
0
P 0·4
3
9S 2
gs
"-
---- ---q, \ , \
303 ____ --l29~ T
283
NC
CR5
.... _< ......... _ .... ;;::.< ...•.•.......... 6~3-:''''
CR5
CR3
....... ,/'.,0
OL--L--L-~--L-~--~~=-~~--~~~L-~
0600 1200 1800 0000 0600 TIME ( SST)

142
Stomatal conductance was too low to be neasured during the hours of
darkness but increased quickly at dawn. Stomatal conductance of all plants
declined from the time of the first measurement (just after 0600 hours) until
the plants were rewatered at 1100 hours after which marked rises in stomatal
conductance were observed.
The highest stomatal conductanc.es and the greatest response to watering
were found in those plants which had not previously been subjected to water
stre s s. The lowest stomatal conductances were found in plants which had been
highly stressed and rewatered for only three days. Plant s which had teen
stressed and re watered for five days were inte rmediate in re sponse between those
which had not been stressed and tho se v.hich had teen stres sed and rewatered
for three days.
4.6.3. Permeability of sterns cut from stressed whole plants
St em segments 100 to 150 mm long were cut from one or two year old shoots
of the potted Rrododendron plants the day after the all-day experiment de scribed
above. The results of these experiments are given in figure 50. The
permeabil ity of shoots from plants which had not experienced sap tensions of
over 1.8 MPa were comparable to those of uncavitated sterns of similar age cut
from the bush in the laboratory grounds (table 13).
K was found to be lower in sterns from plant s of sap tensions greater than
1. 8 MPa than in plants of lower sap tens ions. K was lower still in stems
sampled from plants which had been subjected to high sap tensions and then
re watered for four days.
4.6.4. Discussion
The original aim of this experirrent, to assess the effect of cavitation on
sap transport in intact plants, was not achieved. This was because after-
effects of water stress modified the response of stomata to plant water status.
This after-effect limited maximum stomatal ccnductances for several days after

7
6
- 5 rn ~
0 ~
4 x N
E 3 -~
2
1
o '----'--_...L.----A.--.--J!
NC C R4 Figure 50. The effect of water stressing of whole Rhododendron plants on
the permeability of stems. Stem segments were cut at interval s as sap
tensions increased and four days after the plants had been rewatered.
NC - Not cavitated (balance pressure < 1.9 MPa)
C - Cavitated (!! !! > 1.9 MPa)
R4 Four days after plants were rewatered (minimum daily balance pressure =
o -0.5 MPa)
Closed symbols = Relative conductivity calculated from flow into stem
segments.
Open symbols Relative conductivity calculated from flow out of stem
segments.

143
the plants had been rewatered.
The after-effect of stre ss and the time taken for it to disappear (five days
or more) were similar to the re suIts of experiments with Nicotiana and Vicia
which had been subjected to severe water stress and re -supplied with water
(Fischer ~ ~., 1970). It has been shown that most of the prolonged reduction In
stomatal aperture is due to change s in the guard cells themselves (Fischer 1970)
and is not caused by decrea~d permeability of the xylem.
Without concurrent measurements of stomatal conductance, tran spiration and
water potential it is therefore im}X>ssible to identify short-term decreases in
xylem cnnductivity from the results of experiments of this type. I-bw eve r t he
similarity of '¥ 1 and stomatal conductance of plants re v.atered for five days to
those of the unstressed plants is an indication that the ability of the xylem
to supply the water requirements of the leaves in the long term was not
seriously impaired by the period of water stre ss. This is in agreement with
the observation that even tre most severely wilted plants quickly recovered WlEn
rewate re d and subsequent ly appeared similar to plant s which had not bEen ~ re ssed.
Measurements had indicated that high sap tensions had reduced stem
permeability to 20 - 30% telow that of similar stems from unstres~d plants.
A similar reduction in permeability was also found after the stressed plants
had been rev.atered for several days (figure 50).
Tre apparent contradiction of the measurements of '¥ and stomatal conductance
(which showed that the xylem was still able to supply the water requirements of
tre Ie ave s) by the re sults of the permeabil ity experiments may be reconcile d by
remembering that a) cav it at ion occurs progressive 1 y over a range of incre asing
sap tensions (section 3.5) and b) high levels of redmdancy are usual in the
supply of xylem conduits (e.g. Mackay and Weatherly, 1973; Zimmermann and Brown,
1971) .
The failure of the permeabil i ty of stem segments to re cover when the water
stre ss;d plant s were rewatered was in agreement with the findings that the
ability of the leaves to produce clicks was not recovered either (section 3.6).

144
That recovery might not have been possible because of failure of sap pressure
to increase sufficiently for xylem emboli to dissolve has already been
discussed (section 3.6).
The cause of the continued decline in permeability of stems when water
stre ssed plants had been rewatered was unkno',\lJ1. Be cause of al terat ions to the
permeability apparatus it was only JXlssible to measure the flux of water
Entering these .st ems (Q. ). ln
As these rewatered stems were unlikely to take
in much water to relieve internal water deficits (section 4.4) Q. may have ill
been low relat ive to Qin
of shoots of the same permeability but higher water
deficits. However such differences have been srown to be negligible in the
stem segJrents of this size so that the continued downward trend in permeability
is probably corre ct.
It is possible, although unlikely, that the decrease in permeability was
the result of tylose invasion of cavitated xylem conduits. Previous
ob servat ions had sho wn that tyloses did not deve lop in Rhododendron shoot s
detached from the plant (sect ion 4.4) .
4.7. fummary of chapt er 4.
The effe ct of righ sap ten sions on the p ermeab il ity of xylem of Rrododendron
was :in ve .st igat ed us ing st em se gment s, shoot s or whol e pI ant s. Decreases in the
area of the xylem conducting sap and in the permeability of the xylem \\ere
found as sap tens ions :in cre ased. It is proposed that these changes '.\ere due
to progressive cavitation of xylem conduits occurring as sap tensions increased
above about I MPa.

145
Chapter 5. Exclusion of gas from conduits by pit membranes
5.1 Introduction
A fundamental part of the cohe sian theory is that gas is prevented from
entering sap-filled xylem conduits by sap retained in the small pores of the
pit membranes by cap illarity (0 ixon and Jol y, 1894).
in section 1.5.2.
This has teen di scussed
It has been suggested that differences in the size of pores in pit
membranes may te a factor determin ing the suscepti bil i ty of different spec ie s
to wilt diseases (Van Allen and Turner, 1975). If such differences in pore
size do exist they may also have a role in determining the pressure differentials
at which gas may cross wet pit membranes and enter xylem conduits. The
pressure differential required to expel sap from the pores of the pit membrane
depends upon the radius of the pore and the surface tension of the sap. Air
will therefore penetrate the pit membranes irrespective of wrether the pressure
differential is established by high external gas pressure or high internal sap
tension. The pressure at which too conduit tecomes gas filled depends only
o~ the size of the largest pore in the membrane as any gas entering 1:y this
pore will immediately expand to occupy the entire- conduit (section 3.6).
The experiments reported· below "''ere carried out to determine the pres sure
d.ifferential required to force sap from the pores of the pit membranes of
Rhododendron stems and to relate this to the sap tension at which cavitation
occurs in the same species.
The work was in three parts:
5.2) Determining the pressure at which gas first passes through a segment of
stem.
5.3) Gas permeability of stems as an indicator of the pressure required to
displace sap from the pores of pit membrane s.
5.4) The expression of sap from stems as an indicator of the pres sure required
146
to displace sap from the pores of the pit membranes.
5.2. First passage of gas through stems
Ni trogen gas coul d be pass ed through 200 -4 00 mm long Rhododendron stems
at pressures of less than 0.1 MPa. Thi s \A.aS sho\-\n by mount ing the stems in
the pres sure chamber and collecting the gas emerging from the end of the
stem outside the pressure chamber 1lllder water.
Passage of gas at such low pressures indicates that some xylem conduits
extended over even the longest stems used (Greenidge, 1955a; Zimmermann and
Jej e, 1981). These experirrents indicate that vessels in Rhododendron stems
were longer than the 110 mm indicated by injection of Indian ink (section 4.2).
As the maximum vessel length in Rlododendron stems was greater than that
of stems suitable for mounting in the pressure cham1::er this simple type of
experiment could not be used to find the pressure required to force sap from
the pores of the pit membranes.
5.3. Permeability of stems to gas as an indicator of the pressure required to
displace sap from the pores of pit membranes
5.3.1. Introduction
Progressive expulsion of sap from the pores of pit membranes will open more
and more paths to gas flow and increase flow of gas through the stern (Yao and
Stamm, 1967).
Moreover, it has been shown that a linear relationship exist s between the
quotient of the gas flux Q(m3s-1 ) divided by the pressure driving gas flow,
LIP, (i.e. Q/LlP) and LIP wh=n gas is forced through an 1lllchanging, homogeneous
resistance such as a ceramic plate (Adzurni, 1937) or a microporous filter
membrane (Yao and Stamm, 1967). When gas flows through a complex series of
resistances, such as is comprised by the pit membranes and trach=id lumina of

147
Abies (Petty and Puritch, 1970) or several woods laid together (Smith and
Banks, 1971), gas flow will be complexly determined by the sum of the
resistances in the series. However, at pressures above about 0.05 tvlPa one
of the resistances will usually dominate and Q/6P will appear to be linearly
related to t,p (e.g. Smith and Banks, 1971).
As expulsion of sap from the pores of the pit membranes will increase the
permeability of the stem to gas Q/6P will increase more rapidly with increases
in 6P than would be the case if the permeability of the segment had remained
unchanged.
A curvilinear rather than linear relationship would therefore exist between
Q/6P and 6P. Such a curvilinear relationship between Q/6P and 6P will be
observed irrespective of whether or not some vessels in the stem segment are
initially open across the whole length of the segment.
Sect i on 5. 3 . 2 . Perrreability of Rroclodendron stems to gas
Figures 51 and 52 show the results (expressed as the relationship between
Q/ t,p and 6P) of experiments in whi ch the flow of nitrogen gas through Rhodo-
dendron stems was measured over one or more cycles of stepwise increases and
decreases in pressure between 0 and 4.14 tvlPa. Each stem was usually subjected
to two pressure cycles.
The hysteresis in the relation of Q/t,P to 6P, with Q/t,P being higher when
6P was falling than when increasing for the first time, was found in all twenty
three experiments of this type. Q/6P increased less on a second pressure cycle
than on the first and the relation of Q/6P to 6P, instead of being markedly
curvilinear as on the first pressure cycle, was often nearly linear (e.g. figure
52) .
On eight occasions stems which had been used in the above experiments were
rehydrated by soaking them overnight in distilled water. The flow of gas
through the rehydrated stems was then measured (figure 51). Rehydration
returned Q/6P to values similar to those found on the first cycle of pressure.

40r-----------------,
-'-D
~30 x "1m
CL L
-.:-:-
IV) 20 rn
E -CL
~ 10 A d
1 2 3 4 ~P (MPa)
Figure 51'. The flow of gas through a Rhododendron stem.
A - Fres h stem. (Arrows indicate whether pressure is rising or fall ing. )
B - After drymg in air.
C - Aft er oven drying at 90°C.

- 7 '-0 0 ~
x 6 ~ co 0....
5 L "I
(/) (Y")
E -0-<J
2 --<3
1
o 1 2 3 i1P(MPa)
Figure 52. The flow of gas through a Rhododendron stem.
The arrows indicate when pressure is increasing or decreasing.
o First pressure cycle with fresh twig.
/::, Second II II " II II
o First pre ssure cycle aft er overnight rehydration.
4
When LW \V3.S decreasing in the second half of the pressure cycle Qj LW was
sometimes, as in figure 52, slightly Ie ss than when the flow of gas through
the stem was measure d for the first time. This was attri luted to contamination
of the xylem, pro ba bly by bacteria, occurring during rehydration.
5.3.3. Discussion
The curv il ine ar reI ation 0 f cy lip to LIP and the hy ste res is found on a fi rst
pressure cycle is evidence that the permeability of the stems to gas increased
as pressure increased. As QjllP does not fall to its initial value when
pressure is reduced, it is unlikely that the increase in QjllP was the result of
elastic deformation of stnlctures within the stem. Also the reduction of QjllP
to its original values by rehydration (figure 52) shows that the increase in
the gas permeability of the stem was not the result of mechanical damage,
including elastic de format ion and rupture of pi t membranes, occurring during
the first cycle of increasing pressure.
The curvilinear relationship of QjllP to LIP on the first cycle of increasing
pressure is consistent with the hypothesis that sap is progressively expelled
from pit membrane pores of smaller diameter as pressure is increased. The
hysteres is in the relation of Qj LIP to 6P indicate s that thes e pores do not
refill as pressure falls. In addition, the smaller increases in Qjtc,P and the near
linear relation of Qj LIP to tc,p found on a second pre ssure cycle (figure 52),
indicate that most pit membrane pore s too large to retain sap against the applied
pre ssure are emptied on the first pressure cycle.
The linear relationship of Qj LIP to tc,p found when using air or oven-dried
stems (figure 52) and in some moist stems on a second pres sure cycle (figure 51),
is evidence that, as assumed when designing this exper:itrent, viscous flow of gas
occur s over the range of pressures used in this exper:itrent. Moreove r , it shows
that if the permeability of the stem to gas flow is unchanging, even though
composed of several distinct resistances in combination, a linear relation of
Q/lIP to LP is to be expected over the range of pressures used in these experiments
and as shown by &nith and Banks (1971). A curvilinear relation of the type
found in figures 51 and 52, therefore, indicates a change in the permeability of

149
the stems.
The increased gas permeability of the stems may have been due in part to
evaporation of water from the stems by the gas passing through them. Although
the rate of gas flow through a stem held at a pressure of 1.4 MPa did not
increase over a two hour period, increases in the rate of flow with time were
often found at higher pressures. It was thought that these increases were due
to evaporation of sap from the angular crevices formed where fibri Is overlie each
other at the edges of the pit membrane pores. Although such evaporation will
be unlikely to open new pores to gas flow it will increase the area available to
flow in those already open, and thereby increase the flow of gas at a given
pressure (Stamm, 1935).
Because of evaporation at high pressures the hysteresis In Q/6P with changes
in 6P, although indicating that sap is forced from the pores of the pit
membranes, cannot be used to determine the sizes of these pores. Such an
analysis would be nearly impossible even in the absence of evaporation, as pores
will probably vary in size both within and between individual pit membranes.
5.4. Expression of sap from stems by gas under pres sure
5.4.1. Introduction
Expulsion of sap from the pores of pit membranes will admit gas to the
conduit behind the membrane. Because the gas is under pres sure any sap in the
conduit will be forced from it, either to be taken into other partly filled
conduits or water-stressed cells, or to be expressed from the low pressure end
of the stem. Measurement of the gas pressure at which sap is first expressed
from the end of a stem mounted in the pressure chamber will therefore enable
calculation of the size of the largest pores in the pit membranes.
This method of calculating the sizes of the pores is independent of
measurements of gas flow through the stems. In addition, because all the sap
in the conduit is expelled when the first gas enters, continued expression of
sap at successively higher gas pressures will indicate the existence of conduits

150
bounded by pit membranes of successively smaller pore sizes.
The role of capillarity in determining the pressure at which sap will be
forced from pi t membranes can be shown by altering" the" surface- tenS ion
of the sap in the stems. The pressure needed to displace sap from the
capillaries of the pit membranes will, if equation 10 holds, be proportional to
the surface tension of the liquid in those capillaries.
5.4.2. The pressure at which sap is expressed from stems
a) After transpiring water
Stems from shoots brought to full turgor by uptake of distilled water were
mounted in the pressure chamber. The sap expressed after successive pressure
increments was collected by absorbing onto tissue paper in plastic phials
(section 2.6.2).
The collections of sap made after each pressure increment, as pressure
increased from 0 to 4.14 MPa, are shown in figure 53a.
In four of five experiments a major expression of sap occurred as pressure
rose from 1.38 to 1.73 MPa. In the fifth experiment of this series the
expression began at chamber pressures between 1. 03 and 1. 38 MPa. In three
experiments this phase of the expression had become minimal or ceased at chamber
pressure of 3.5 MPa, and in the remaining two experiments had begun to decline
by this pressure.
In subsequent experiments (figure S3b ,c,d) the accuracy of the estimation
of the pressure at which the first expression of sap occurred was improved by
reducing pressure increments from 0.34 MPa (SO psi) to 0.17 MPa (25 psi) at
pressures between 0 and 2 MPa.
In two of the experiments shown in figure 53a, sap was also collected in
relatively large volumes over the first 0.34 or 0.69 MPa of applied pressure.
This expression occurred over a narrow range of pressures and had declined to
near zero by the pressure at which the major phase of exudation began. This
Figure 53. The expression of sap from Rhododendron stems. Histograms show
sap collections after each pressure increment as a percentage
of the total expres sion for the shoot. In instances where pressure increments
were reduced from 0.34 to 0.17 MPa the expressions over small increments are
shown in black.
Experiments were made after shoots had been taking up:
A. Distilled water (0:: 71 x 10-3 Pa m)
B. 1 ~lolal NaCl ( 74 x 10-3 Pa m)
C. 4% N -butanol ( 48 x 10- 3 Pa m)
10% N -butanol ( -3 o . :: 27 x 10 - Pa m)
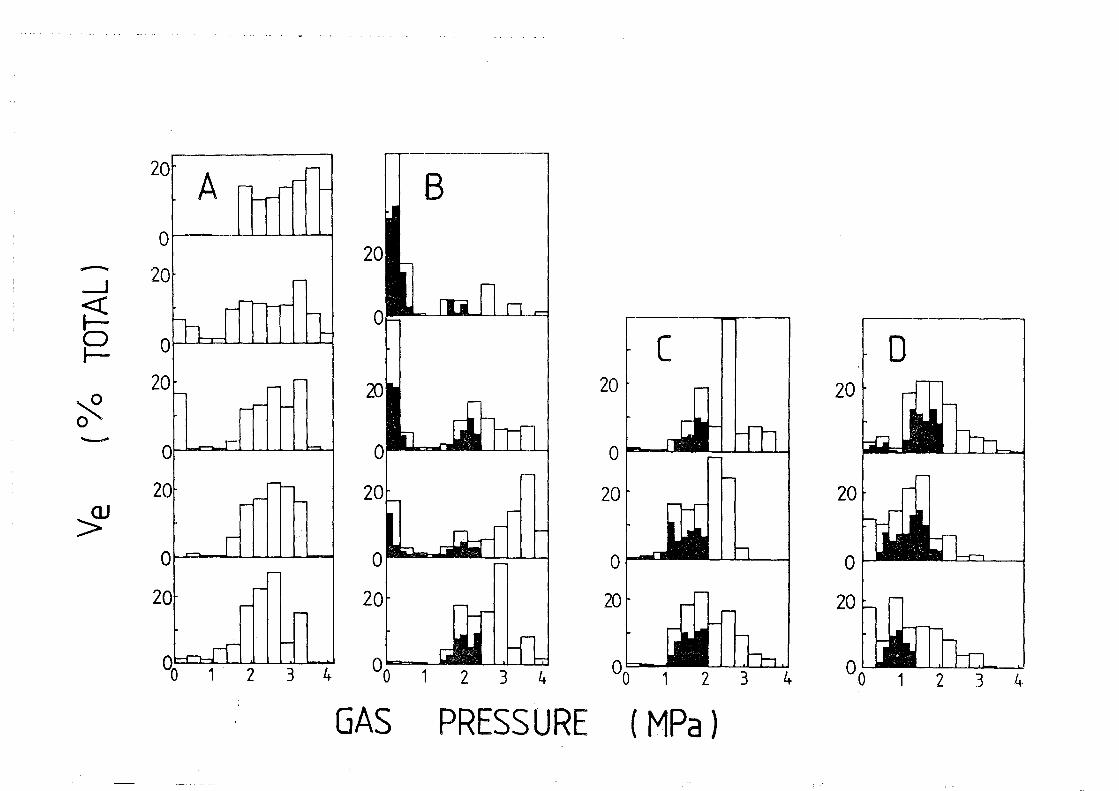
--1
~ 0 r-
~ 0 -
~
20
0
20
0
20
0
20
o 20
A B
20
0~1'7!11111
20
OM l-=i I ,I 1 ,I " 0 01234 01234
c 20
Opr- 1-
20
0"'-"-
20
00 1
GAS PRESSURE ( MPa )
20
20
o 20
o
On 1 2 3 4

151
first expression was thought to be of sap from xylem conduits which had been
opened when the stem had been cut. Because of the relatively large diameters
of the lumina of the xylem conduits little gas pressure is required to overcome
capi llari ty and to force the sap from them.
This first, brief expression is also seen In many other e)..-periments (figure
531b, c, d) . Slight differences in stem size and preparative technique were
believed to be the cause of de difference s in the size of t hi s first expre ss ion
from different shoots. Allowing air to enter the cut end of transpiring shoots
for several minutes before removing the stem for experiments will tend to remove
sap from conduits open at the basal end of the stem and result in a smaller
initial expression of sap.
b) After transpiring a strong osmotic solution
Two explanations for the expulsion of sap at chamber pressures of 1.4-1.7 MPa
were considered. One, that gas was penetrating pit membranes at these
pressures, has already been discussed (section 5.4.1).
However, it was also possible that the major phase of sap expression was due
to a pressure-volume curve type of expression from cells in the stem subjected
to increasing gas pressure (Scholander et ~., 1964; Tyree and Hammel, 1972).
If this is the case, then the largest volume of sap to be expressed by an
increment in chamber pressure will be found close to the pressure at which cell
turgor is reduced to zero, i.e. the point of incipient plasmolysis.
It is known from balance pressure data that incipient plasmolysis in
Rhododendron leaves occurs at leaf balance pressures of about 1.7 MPa (section
3. 4 . 4, tab Ie 7). The expression of sap from stems at chamber pressures of
1.4-1. 7 MPa might therefore represent the first large expression of sap from
cells Which have lost their turgor.
These two possibilities can be separated by reducing cell turgor to zero
before applying gas under pressure to the stems.
Cell turgor was reduced to zero by setting the stems to transpire 1 :il
NaCl solution (lJ's = -4.37 t.1Pa) for three hours before cutting the stem for the
152
experimen t. As the surface tension of a 1 ml NaCl solution (74.4 x 10- 3 Pa m- l
at 298°K) is not very different to that of water at the same temperature
(71.2 x 10- 3 Pa m- l ) the gas pressure required to express sap from the capillaries
of pit membranes is virtually unaffected by substituting the salt solution for
distilled water in the transpiration stream. However, as cell turgor is zero
at this water potential (table 7) sap will be expressed in large volumes from
cells as soon as gas pressure is applied. The expression beginning at 1.4 -
1.7 MPa would be absent.
That the living cells of the stems had lost their turgor after three hours
of transpiring the salt solution was tested for by measuring ~l of leaves from
the shoots. In addition, the osmotic potential of sap expressed from these
stems was also measured. Both ~l and ~s were measured using the thermocouple
The results are presented in table 16. psychrometers.
Table 16. ~l and ~s of leaf discs and xylem sap respectively from Rhododendron
shoots which have been transpiring 1 ml NaCl solution (~ = -4.37 MFa) s
Shoot
1
2
3
4
on a laboratory bench for three hours. Sap was collected by applying
pressure to one end of stem segments mounted in the pressure chamber.
The pressures applied to make the expressions are indicated in the table.
~l (MPa)
- 0.45
- 0.86
- 0.57
- 1.44
~ xylem sap s
Pressure applied to make sap collection from stems o - 0.34 (MPa) 1.38 - 1. 72 (MPa)
- 1. 60 - 2.08
- 3.24 - 2.67
As can be seen, neither ~l nor sap ~s fell to that of the salt solution.
This was probably the result of di lution of the transpired salt solution by water
153
already present in the leaves and xylem.
However, sap 'l's was generally lower than that by which Phododendron leaves
have lost all turgor . (about -1. 7 MPa). Assuming that the cells of the
xylem are nearly in equilibrium with the osmotic potential of the xylem sap,
'I' of the living cells of the stem has been reduced sufficiently to eliminate
turgor.
The results of expression experiments using stems from shoots prepared
similarly to those of table 16 are presented in figure 53b.
The expression of sap beginning as chamber pressure rose from 1. 4 - 1. 7 MP a
was found in all four experiments.
Because of the large initial expression in three of the four stems of this
experiment, the possibility that sap expression was linked to the loss of turgor
by these stems cannot be completely discounted. However, it was thought that
sap was not expressed from stems as the result of turgor. This was because
i) in all four experiments shown in figure 53b sap was expressed over a range
of pressures, beginning at 1.4 to 1.7 MPa, similar to that found in stems which
had been transpiring distilled water.
ii) Some stems had litt Ie or no express ion of sap at low pressure.
iii) Sap expulsion from stems ceas ed wi thin eight minutes of the increment in
pressure. This was much shorter than would have been expected if sap had been
expressed from cells (e. g. Tyree and Dainty, 1973).
Moreover, the length of stem inside the chamber was deliberately kept short
to minimize the effect of chamber pressure on the living tissues of the stem.
c) After transpiring solutions of reduced surface tension
The surface tension of sap in the stems of Rhododendron shoots was lowered
using aqueous solutions of N-butanol (table 1). The solutions were infiltrated
into the xylem by supplying them to the cut ends of shoots transpiring on the
laboratory bench. It was assumed that the N-butanol solutions had occupied
the lumina of the conducting xylem conduits after three hours of transpiration.

154
The results of expression experiments using sterns supplied with aqueous
butanol solutions of 10% (V/V) (surface tension = 27 Pa m x -3 10 ) or 4% (V/V)
-3 (surface tension = 48 Pa m x 10 ) are shown in figures 53c and 53d respectively.
In both cases the pressure at which the major expression of sap occurred
was reduced compared to shoots which had transpired only distilled water.
When 4% N-butanol solution had been supplied, the major phase of sap
expression began at chamber pressures between 1.03 and 1.21 MP a in two cases
and 0.86 and 1.03 MPa in the third. These pressures are approximately 2/ 3 of
those at which sap is expressed from stems containing distilled water.
When 10% N-butanol (i.e. saturated aqueous solution) had been supplied,
sap expression began at around 0.5 MPa in two sterns and 1 MPa in the third.
The pressure incremen1S used were too large to define the pressure at which the
first expression of sap occurred to an accuracy of more than ± 0.2 tvfPa. Thus
-3 reducing surface tension by nearly two-thirds (from 71 to 28 x 10 Pa m) also
reduces by two-thirds the pressure required to force sap from the AJlem (from
1. 5 to 0.5 MPa).
5.4.3. Discussion
The aim of establishing the pressure differentials at which sap will be
forced from the pores of the pit membranes of Rhododendron sterns was
successfully accomplished by noting the pressures at which sap was expressed
from sterns.
Sap was found to be expressed from the stems ~rom shoots which had been
transpiring distilled water) over a range of pressures beginning at around
1. 4 MPa. Although there was considerable variability in the pressure at which
the last sap was expressed from the stems, expression had fallen to very low
levels, or started to decline, at chamber pressures of around 3.5 MPa.
This is a similar range of pressure differentials across pit membranes to
those at which clicks are detected in Rhododendron leaves (leaf balance pressures
of 1.4 to 3 MPa, June 1980, table 9). It may therefore be possible that
155
cavitation detected in leaves by the acoustic method occurs as the result of
gas entering xylem conduits from outside, rather than the formation of the
gas phase within conduits. Such gas may be al ready pres ent in stems in
embolised conduits, probably mainly in the non-conducting fibres, but also in
cavitated vessels, or it may enter stems through weather checks or other wounds
In the wood.
The pressure at which sap is first expressed from the stems can be used
to determine the radii of the pores of the pit membranes by application of
equation 10 (section 3.6).
Equation 10. Pc = 20' cos 8
r
In this case the capillary pressure is equivalent to the gas pressure at
which sap is forced from the pores of the pit membranes. However, the pores
of the pit membrane are not circular, as they are actually the spaces between
the cellulose fibrils of which the pit membrane is constructed. Therefore,
equation 10 can only be used to obtain an equivalent radius of the actual pore
dimensions (Petty, 1972).
Sap is first expressed from stems at gas pres sures of about 1. 4 MPa.
-3 Rearranging equation 10 and substituting 1.4 ~Wa for Pc and 71 x 10 Pa m
for a, r =
142 x 10-3
1.4 x 10⁶
100 nm
Similarly, from the pressure at which the last pit membranes are penetrated by
gas, re 3.5 MPa, the largest pores in these membranes have a radius of 41 nm.
The largest pores of this range are about the same size as the pores in bordered
pits of Abies (Petty and Puritch, 1970) and slightly smaller than in the heart-
wood of a number of other conifers (Stamm, 1929). The largest pores in the
pit membranes with the smallest pore size (about 40 nm) are less than half that
of the mean in several conifers. These calculated radii are for the largest
pores in the pit membranes. Most pores may be much smaller than this (Stamm,
1929).

l::>b
These estimates of membrane pore sizes were calculated on the assumption
that retention of sap in these pores can be adequately described by equation 10.
Experiments in which the surface tension of sap in these conduits was altered by
adding N-butanol have shown the pres sure required to force sap from the pit
membrane to be proportional to the surface tension of the sap, as predicted by
equation 10. The assumption that sap is retained in these pores by capillarity
therefore seems justified.
Section 5.5. Summary of Chapter 5.
Tre pressure required to force sap from the pores of the pit membranes of
Rhododendron stem was invest igated. Gas was found to penetrate the pores of
the pit membranes at pressures of about 1.4 - 3.5 MPa. These are similar to
those at which cavitation occurs in Rhododendron, and it is suggested that
cavitation in detached leaves and shoots of this species occurs when gas
penetrates the pit membranes. The increase in xylem permeability caused by
high gas pressures is reversible and therefore not due to mechanical damage to
xylem conduits by high gas pressures.

157
Chapter 6. General Discussion
The results of the experiments described in Chapters 3 to 5 may be used
to attempt to answer the three problems stated at the beginning of this thesis:
i) are clicks caused by cavitation of xylem sap and, if so, at what sap tension
does it occur, ii) does cavitation affect pressure chamber measurements of
plant water potential and iii) what is the effect of cavitation on the flow of
sap in the xylem. In addition, a further question may be answered: how does
the gas phase arise in the cavitating conduit?
New evidence that acoustically detected clicks are the result of cavitation
was obtained in two exp er imen ts. In the first the appearance of gas in Acer
stems was co-incident with the detection of clicks (section 3.2.7). In the
second, the production of clicks by Rhododendron leaves was shown to be dependent
on sap tension and to be independent of cell turgor (section 3.5.3). Tris new
evidence complements the circumstantial links between cavitation and i)
increases in sap tension and rehydration ~1ilburn and Johnson, 1966; Milburn,
1973a, b; Milburn and 1'-kLaughlin, 1974), ii) the dehiscence of fern sporangia
(Mil burn and Johnson, 1966; Stocker, 1952) and iii) changes in the rate of
water uptake by Ricinus leaves (Milburn, 1966) which have been obtained
previously. Although a 'click' has yet to be directly associated with the
occurrence of a bubble in a xylem conduit it now seems well established that
clicks are caused by cavitation of sap in xylem conduits. Louder clicks were
found in woody samples than in more succulent ones. This is believed to be
because of better conduction of vibrations in hard, woody tissues than in soft
ones. However clicks produced at higher sap tensions (as in trees) might
also be expected to be louder than those produced at lower sap tensions (as in
herbs) because of the greater energy stored in the deformed walls of the
conduits containing sap under high tensions than low.
Cavitation was not found to affect pressure chamber measurements of water
potential in Rhododendron leaves (section 3.4.3). However differences between
balance pressures of Rhododendron shoots and leaves which became apparent as
lSi)
leaf balance pressures rose above 2 MPs were tentatively attributed to
cavitation (section 3.4.2). These results are in contrast to those for
Malus leaves (West and Gaff, 1971) and Rhododendron roseum shoots (Boyer, 1967)
but are similar to those obtained with many other species (Ritchie and Hinckley,
1975). It is thought that cavitation of xylem is unlikely to have measurable
effects on balance pressure if the xylem contains only a small fraction of the
total water content of the sample. This is probably the case in leaves but
not in shoots, which have a large volume of xylem in the stern. The pressure
chamber could therefore be used to determine the sap tensions in leaves during
investigations of the relationship between cavitation and sap tension.
The sap tensions at which cavitation occurs in species of herbs, shrubs
and trees were determined using the acoustic detector and the pressure chamber.
From the results of these experiments cavitation profiles relating cavitation
to sap tension were drawn up (section 3.5). The cavitation profiles of all
species except Fraxinus were bell-shaped with most clicks being detected over
a relatively narrow range of sap tensions. In general cavitation occurred
at lower sap tensions ln herbs than in trees (table 8). With the exception of
Fraxinus clicks were not found at sap tensions above 3.5 MPa. Cavitation has been
shown to occur at similar sap tensions in intact plants (table 18). The cavitating
sap tensions determined using the acoustic detector and the pressure chamber were
therefore though to be reliable estimates of the sap tensions causing cavitation
in whole plants.
The sap tensions causing cavitation in the species used in this study are
low by comparison to those at which cohesive failure of sap is to be expected
on theoretical grounds (Oertli, 1971). In addition the apparently reliable
experiments of Briggs (1955) showed cavitation of water in glass tubes to occur
at tensions of about 30 MPa, ten times those found in this study. The
comparatively low and, between species, variable sap tensions causing cavitation
in plants also suggests that cavitation in the xylem is not the result of tensions
exceeding the limits to cohesion within the sap. The limits to sap tension
might be determined by differences in the construction of the xylem conduit of
each species. The materials in the cell wall and the solutes in the sap itself

lS~
will determine the limits to adhesion between the sap and the conduit walls.
The size of the pores of the pit membrane and walls will determine the sap
tension at which gas can enter the conduit and the maximum size of any small
bubbles entering as entrained nuclei on particles in the sap. Other aspects,
such as the sculpturing and deformability of the conduit walls, may also be
involved.
There are several reasons for suspecting that cavitation occurs when gas
is drawn through the pit membranes and into a sap-filled conduit. Firstly,
the experiments of chapter 5 have shown gas to penetrate the wet pit membranes
of Rhododendron sterns at about the same pressure differentials which exist when
cavitation occurs (1 - 3.0 MPa). Moreoever the pressure at which gas penetrated
the pit membranes varied in direct proportion to changes in the surface tension
of the sap wetting the pit membranes. Both the results are expected if sap
held in the pores of the pit membranes by surface tension was preventing the
passage of gas. The report that clicks were heard when Slightly stressed
Ricinus leaves were supplied with ethanol (surface tension = 22.8 x 10- 3 Pa m- l )
~1ilburn, 1973a) is also consistent with this proposal. In intact plants there
is likely to be enough gas in embolised fibres and ininterstitial spaces,
entering the xylem through wounds or in cavitated conduits to initiate
cavitation of neighbouring sap filled conduits in this way.
Differences in the sap tensions at which sap cavitates in different species,
in young and mature xylem or even in single leaves, may be due to differences
in the size of the pores in the pit membranes. Larger pores will allow gas to
enter and cavitate the conduit at lower sap tensions than will smaller pores.
Species-related differences in the size of the pit membrane pores have already
been cited as a factor determining the susceptibility of different species to
wilt diseases (Van Allen and Turner, 1975). The same differences might also
determine the sap tension at which each cavitates.
The proposal that the tensions at which cavitation occurs are determined
by differences in the structure of the pit membrane may be tested by repeating
the experiments of chapter 5 with another species, for instance tomato, in

lbU
which cavitation occurs at a much lower sap tension than in Rhododendron.
The experiments of chapter 5 indicated that the largest pores in the pit
membranes of Rhododendron were 0.2 to 0.08 ~m in diameter. This is nearly
the same size as has been found in many gymnosperms by the same technique
(Stamm, 1929). If the scheme proposed above is correct gymnosperms will
cavitate at the same sap tension as angiosperms with similar pit membrane pore
si zes, despite occlusion of the pit annulus by the torus. What then is the
function of the bordered pits of gymnosperms if not to prevent cavitation at
high sap tension? The bordered pits may be an adaptation minimizing the risk
of cavitation caus ed by freezing and not by high sap tensions. It has been
proposed by Hammel (1967) that toral occlusion prevents the release of pressure
in tracheids when the sap that they contain freezes. Upon thawing the bubble
of gas forced out of solution by freezing is forced back into the solution by
this pressure before the sap comes under tension. In the absence of the bubble
cavitation cannot occur. Angiosperm vessels, which lack bordered pits, are
cavitated by freezing (O'Malley, 1979).
However Sucoff (1969) has suggested that flow of water from some·
thawing conduits to other thawing conduits may delay the imposition of sap
tensions in the latter long enough for bubbles to dissolve. The conduits losing
water (estimated to be about 10% of the total number conducting sap before
freezing) will be cavitated.
The effect of cavitation on the flow of sap in the xylem of Rhododendron
was investigated in whole plants, shoots and segments of stem (chapter 4).
The permeability of shoots and stem segments was reduced by 60% or more as sap
tensions increased above 1 MPa. Sap had almost ceased to flow in the xylem
of samples which had been subjected to sap tensions of about 4 MPa. However,
because of considerable variability in the permeability of individual stems, it
was not possible to determine the exact relationship between the permeability
of the xylem and sap tension.
In Rhododendron cavitation occurs at sap tensions of from 1 to slightly
over 3 MPa. The decrease in

161
stem permeability over the same range of sap tensions complements the
occurrence of cavi ta tion over a similar range of sap tensions. Moreover,
the failure of cavitation to interrupt the supply of water to the leaves of
whole plants (section 4.6) suggests that there is a considerable oversupply
in the provision of xylem vessels in this species.
A high degree of redundancy of xylem conduits may occur in many plants
(e.g. Mackay and Weatherly, 1973). Such redundancy might enable the supply
of water to the leaves to continue almost unaffected by cavitation of a number
of the conduits carrying sap. Ho\\'ever extensive cavitation occurring at high
sap tensions and affecting a high proportion of conducting conduits would
eventually disrupt sap flow sufficiently to restrict the supply of water to
the leaves. In Rhododendron this would be expected to occur if sap tensions
exceeded about 2 MPa, the tension around which most cavitation occurs (section
3.5). Extensive cavitation, resulting in reduced stem permeability, may be
the cause of slow equilibration of water potentials on Rhododendron shoots at
sap tensions above 2 MPa (section 4.5). It has been suggested that extensive
cavitation may 'isolate' some sap filled conduits by ringing them with
cavitated, and therefore non-conducting, conduits (Milburn and Johnson, 1966).
Further reductions in the water potential of the sap in these remaining
conduits can only occur by movement of water in the high resistance pathways of
the cell walls (Nobel, 1970). The water potentials of the sap in these
conduits may therefore lag behind changes in leaf water potential, delaying
cavitation of the sap in the remaining sap-filled conduits. A plateau-type
cavitation profile, such as was found in Fraxinus, might result.
this is highly speculative.
However
Further work on the effect of high sap tension on xylem permeability is
required in two areas. Firstly, experiments must be designed to preclude the
possibility of cavitation occurring when water-stressed material is prepared
for permeability experiments (Crafts ~~., 1949). This might be done by
measuring the permeability of the xylem in intact plants. Alternatively all
manipulations may be carried out on rehydrated samples, in which sao tensions

162
are low, so that the possibility that artifactual cavitation might occur is
reduced. This would require controlled rehydration of samples which have been
subjected to cavitating sap tensions so that emboli in the xylem do not dissolve.
Secondly, experiments should be conducted to determine the effect of cavitation
on the water balance of whole plants. Oversupply of xylem conduits may serve
to protect the water supply of the leaves from the effects of limited episodes
of cavitation; whole plant studies are a way of determining if this is so.
From the permeability studies with Rhododendron it is reasonable to suggest
that sap tensions must exceed those at the peak of the cavitation profile to
affect seriously the flow of water in the xylem. How likely are plants in the
field to experience sap tensions of this magnitude? According to Richter (1976)
trees on mesic sites, such as those trees used in these studies, will seldom be
subjected to sap tensions above 1.7 to 2 MPa. This is similar to the sap
tensions at which the peaks of the cavitation profiles of leaves of the trees
used in this study occur (section 3.5). Extensive cavitation may therefore
occur occasionally in these species and require periodic replacement of the
conducting xylem. However as sap may also be cavitated by winter freezing
(Zimmermann and Brown, 1971) the requirement for annual replacement of the
conducting xylem can not be attributed to high summer water deficits alone.
In contrast to trees, some herbs cavitate at relatively low sap tensions,
e.g. 0.3 and 0.8 MPa in Lycopersicum and Ricinus respectively. But, from the
examples given by Richter (1976), sap tensions in herbs are likely to be of the
same order as those occurring in trees. Extensive cavitation in some herbs
is therefore likely and may even be a daily occurrence (Milburn and McLaughlin,
1974). It will almost certainly be impossible for such herbs
to grow new vessels to replace those which have cavitated. Sap flow in the
cell walls, although possible (e.g. Scholander et al., 1955), will encounter
very high resistances to flow (Nobel, 1970) and may not be sufficient to supply
leaf water requirements without serious reductions in leaf water potential.
Flow in the xylem can therefore be maintained only if cavitated xylem conduits
are refilled. This may occur when sap pressure is raised above that of the

163
cavitation emboli, for instance by root pressure (Milburn and McLaughlin, 1974).
Refilling of cavitated conduits in leaves or shoots supplied with water at or
above atmospheric pressure has already been demonstrated (section 3.6, Milburn
and Johnson, 1966; Milburn and McLaughlin, 1974). Cavitated conduits in
trees are unlikely to be refilled as the height of trees often exceeds that to
which root pressure can raise sap (Zimmermann and Brown, 1971).
The occurrence of cavitation in plants of very dry environments has not
been investigated. Such plants may develop sap tensions of about 10 MPa
(Richter, 1976) which would be expected to cause serious disruption of sap flow
in all of the species used in this study. There is some evidence that
cavitation occurs at higher sap tensions in plants (e.g. Eucalyptus (table 18),
Fraxinus ornus (Milburn, pers. comm.)) from areas where droughts are frequent
than in plants from areas with milder climates. If this is so study of
cavitation in these plants, together with a study of their vascular anatomy, may
be useful in isolat ing the factors which determine the sap tensions at which
cavitation occurs in different plants. More generally study of cavitation in
plants typical of particular environments will help our understanding of the
importance of cavitation to t he long term water relations of the plant. The
ability of plants to 'adapt' or 'acclimatise' to particular environments by
modifying the structure of the xylem as suggested by Carlquist (1975) (see
section 1.10), or in other ways, may be a fruitful area for future research.
The experiments described in this thesis have shown that cavitation occurs
in plants at sap tensions that may occasionally occur in their xylem. That
cavitation does occur does not invalidate the cohesion theory of Dixon and Jo1y
(1894) as cavitation is likely' to Be-either infrequent or reversible, depending
9n the species. However this study has identified some of the factors limiting
the cohesive ascent of sap in plants.

164
Table 18. Cavitating sap tensions found in other studies, some of which used
methods other than acoustic detection to determine limiting sap
tensions. Where possible, the sap tensions found to cause
cavitation in the same species in this study are also included.
Spec ies
Acer saccharum
Sap t ens ions causing
cavitation (MPa)
2.5
Eucalyptus maculata 3.5 - 4.5
Cotton (Gossypium hirsutum?)
Lycopersicum esculentum
" "
11 "
Malus sylvestris
Plantago major
" It
Ricinus communis
" It
Corn (Zea mays ?)
1.0 - 2.5
0.3-4.5+
0.3 - 1.0
0.2 0.4
1.4 - 2.0
1.0- 1.2
1.4 1.9
0.2 0.9
0.4 - 0.8
2.5 - 3.85
Method used in
determinat ion
Dye inj ect ion
Acoustic detector and in situ hydrometer
Gas flow through stems frozen to preserve emboli
Comparison of 1, before and after xylem was cut
Acoustic detector and pressure chamber
It It
Acoustic detector, thermocouple psychrometer and pressure chamber
Acoustic detector and pressure chamber
" " It " It It
Comparison of 11 before and after xylem was cut
Reference
Greenidge (1955a)
Crombie and Milburn (1980)
Byrne et al. (1977)
Cary et al. (1967)
Nonhe be 1 (pers. comm.)
This study
West and Gaff (1976)
Milburn and McLaughlin (1974)
This study
Milburn (1973b)
This study
Cary et al. (1967)

165
BI B LI OGRAPHY
Adzumi, H. 1937. On the flow of gases through a porous wall. Bull. Chern.
Soc. Japan. 12 304-312.
Askenasy, E. 1895. Ueber das Saftsteigen. Bot. Cent. 62 : 237-238. Cited
in: Crafts, A.S., Currier, H.B. and Stocking, C.R. (1949) Water in the
physiology of plants. Chronica Botanica Company, Waltham, Mass.
Bailey, I.W. 1916. The structure of the bordered pits of conifers and its
bearing upon the tension hypothesis of the ascent of sap in plants.
Bot. Gaz. 62 : 133-142.
Begg, J.E. and Turner, N.C. 1970. Water potential gradients in field tobacco.
Plant Physiol. 46 : 343-346.
Bennett, J.M., Boote, K.J. and Hammond, L.C. 1981. Alterations in the
components of peanut leaf water potential during desiccation. J. Exp.
Bot. 32 : 1035-1043.
Berlyn, G.P. 1969. Microspectrophotometric investigations of free space in
plant cell walls. Am. J. Bot. 56 : 498-506.
Booker, R.E. 1977. Problems in the measurement of longitudinal sapwood
permeability and hydraulic conductivity. N.Z. J. For. Sci. 7 : 297-306.
Boyer, J.S. 1967. Leaf water potentials measured with a pressure chamber.
Plant Physio1. 42 : 133-137.
1969. Measurement of the water status of plants. Ann. Rev.
Plant Physio1. 20 : 351-364.
Boyer, J.S. and Ghorashy, S.R. 1971. Rapid field measurement of leaf water
potential in soybean. Agron. J. 63 : 344-345.
Briggs, L.J. 1955. Maximum superheating of water as a measure of negative
pressure. J. App1. Phys. 26 : 1001-1003.

166
Byrne, G.F., Begg, J.E. and Hansen, G.K. 1977. Cavitation and resistance to
water flow in plant roots. Agric. Meteorol.18 : 21-25.
Campbell, G.S. and Campbell, M.D. 1974 : Evaluation of a thermocouple
hygrometer for measuring leaf water potential in situ. Agron. J. 66
24-27.
Campbell, E.C., Campbell, G.S. and Barlow, W.K. 1973. A dewpoint hygrometer
for water potential measurement. Agric. Meteorol. 12 : 113-121.
Campbell, G.S., Trull, J.W. and Gardner, W.H. 1968. A welding technique for
Peltier thermocouple psycruometers. Soil Sci. Soc. Am. Proc. 32 :
087-889.
Campbell, G.S., ?ollinger, W.D. and Taylor, S.A. 1966. Sample changer for
thermocouple psychrometers : Construction and some applications.
Agron. J. 58 : 315- 318.
Carlquist, S. 1975. Ecological strategies of xylem evolution. Univ. Calif.
Press. Berkeley, Los Angeles, London.
Cary, J.W., Jensen, M.E. and Fisher, H.D. 1968. Physical state of water in
plant xylem vessels. Agron. J. 60 : 167-169.
Chafe, S.C. 1970. The fine structure of the collenchyma cell wall.
Planta 90 : 12-21.
Chaney, W.R. and Kozlowski, T.T. 1977. Patterns of water movement in intact
and excised stems of Fraxinus americana and Acer saccharum seedlings.
Ann. Bot. 41 : 1093-1100.
Chapman, D.C., Rand, R.H. and Cooke, J.R. 1977. A hydrodynamical model of
bordered pits in conifer tracheids. J. Thero. BioI. 67 : 11-24.
Coleman, L.C. 1938. Preparation of leuco basic fuchsin for use in the Feulgen
reaction. Stain Technol. 13 : 123- 4.
Crafts, A.S. 1939. Solute transport in plants. Science 90 : 337-338.
Crafts, A.S., Currier, H.B. and Stocking, C.R. 1949. Water in the physiology
of plants. Chromica Botanica Co. Waltham, Mass. U.S.A.
C' b' 0 S d '!'lh J A ]980. The PhvsioloQ:Y of sap cavitation in ,rom Ie, ',' an 1'1 urn, ~ . . . ".
di fferent plants. In: Abstracts, II Congress, Federation of European Soci et ies
of Plant Physiology, Santiago de Comrostela, August 1980. Abstract 71J.
167
Cronshaw, J. 1960. The fine stnrcture of the pits of Eucalyptus regnans
(F. Muell.) and their relation to the movement of liquids into the wood.
Aust. J. Bot. 8 : 51-57.
Dickson, H. and Blackman, V.H. 1938. The absorption of gas bubbles present in
xylem vessels. Ann. Bot. 2 : 293- 299.
Dimond, A.E. 1966. Pressure and flow relations in vascular bundles of the
tomato plant. Plant Physiol. 41 : 119-131.
Dixon, H.H. 1914. Transpiration and the ascent of sap in plants.
and Co. Ltd. London.
Macmillan
Dixon, H.H. and Joly, J. 1894. On the ascent of sap. Ann. Bot. 8 : 468-470.
Ooley, D. 1970. Effects of simulated drought on shoot development in
Liriodendron seedlings. New Phytol. 69 : 655-673.
Duniway, J.M. 1971. Comparison of pressure chamber and thermocouple
psychrometer determinations of leaf water status in tomato.
Physiol. 48 : 106-107.
Plant
Edwards, W.R.N. 1980. Flow of water in trees. Ph.D. Thesis, Edinburgh
Univ., U.K.
Epstein, P.S. and Plesset, ~1.S. 1950. On the stability of gas bubbles in liquid
gas solutions. J. Chern. Phys. 18 : 1505-1509.
Farmer, J.B. 1918. On the quantitative differences in the water conductivity
of the wood in trees and shrubs.
218-250.
Proc. Roy. Soc. London Ser. B 90 :
Fischer, R.A. 1970. After-effects of water stress on stomatal opening
potential II : Possible causes. J. Exp. Bot. 21 386-404.
Fischer, R.A., Hsiao, T.C. and Hagan, R.M. 1970. After effects of water stress
on stomatal opening potential I. Techniques and magnitudes.
21 371-385.
J. Exp. Bot.
Giordano, R., Salleo, A, Salleo, S. and Wanderlingh, F. 1978. Flow in xylem
vessels and Poiseuille's law. Can. J. Bot. 56 : 333-338.

168
Greenidge, K.N.H. 1952. An approach to the study of vessel length In
hardwood species. Am. J. Bot. 39 : 570-574.
Greenidge, K.N.H. 1955(a). Studies in the physiology of forest trees. II.
Experimental studies of fracture of stressed water columns in transpiring
trees. Am. J. Bot. 42 : 28-37.
1955(b). Studies in the physiology of forest trees. III.
The effect of drastic interruption of conducting tissues on moisture
movements. Am. J. Bot. 42: 582-587.
Gregory, S.C. and Petty, J.A. 1973. Valve action of bordered pits In conifers.
J. Exp. Bot. 24 : 763-767.
Haines, F.M. 1935. Observations on the occurrence of air in conducting tracts.
Ann. Bot. 49 : 367-379.
Hales, S. 1738. Vegetable staticks. Vol. 1. Cited in: Crafts, A.S.,
Currier, I-I.B. and Stocking, C.R. 1949. Water in the physiology of plants.
Chronica Botanica Co. ~altham, Mass.
Hammel, H.T. 1967. Freezing of xylem sap without cavitation.
42 : 55-66.
Hammitt, F.G. 1980. Cavitation and rnultiphase flow phenomena.
International Book Co., New York.
Plant Physiol.
McGraw Hill
Handley, Vi.R.C. 1936. Some observations on the problem of vessel length
determination in woody dicotyledons. New Phytol. 35 : 456-471.
Harvey, E.N., Barnes, O.K., McElroy, W.D., Wr~teley, A.H., Pease, D.C. and
Cooper, K.W. 1944. Bubble formation in animals. Part 1. Physical factors.
J. Cell Compo Physiol. 24 : 1-22.
Hayward, A.T.J. 1964. Measuring the extensibility of liquids. Nature (London)
202 : 481-482.
1967. Tribonucleation of bubbles. Br. J. Appl. Phys. 18 :
641-644. Cited in Hayward (1971) Negative pressure in liquids - can it be
harnessed to serve man? Am. Scientist 59 : 434-443.
lb::!
Heine, R.W. 1971. Hydraulic conductivity in trees. J. Exp. Bot. 22 : 503-5ll.
Hinckley, T.M., Schroeder, M.O., Roberts, J.E. and Bruckerhoff, D.N. 1975.
Effect of several environmental variables and xylem pressure potential on
surface resistance in white oak. For. Sci. 21 : 201-211.
Huber, B. 1956. Die Gefaslei tung. In: Ruhland, W. (Ed.) Handbuch der
Pflanzenphysiologie, Vol. III. (1956). Springer-Verlag, Berlin, Gottingen,
Heidelberg.
Jeje, A.A. and Zimmermann, M.H. 1979. Resistance to water flow in xylem vessels.
J. Exp. Bot. ::D : 817-827.
Johansen, D.A.J. 1940. Plant microtechnique. McGraw-Hill Book Co. Inc., New
York and London.
Jones, H.G. and Higgs, K.H. 1979. Water potential - Water content relationships
in Apple leaves. J. Exp. Bot. 30 : 965-970.
1980. Resistances to water loss from the mesophyll
cell surface in plant leaves. J. Exp. Bot. 31 : 545-553.
Jones, M.M. and Turner, N.C. 1980. Osmotic adjustment in expanding and fully
expanded leaves of sunflower in response to water deficits. Aust. J.
Plant Physiol. 7: 181-192.
Kozlowski, T.T. and Winget, C.H. 1963. Patterns of water movement in forest
trees. Bot. Gaz. 124: 301-311.
Kyriakopoulos, E. and Richter, H. 1977. A comparison of methods for the
determination of water status in Quercus ilex L. Z. Pflanzenphysiol.
82 : 14-27.
Landsberg, J.J., Blanchard, T.W. and Warrit, B. 1976. Studies on the movement
of water through Apple trees. J. Exp. Bot. 27 : 579-596.
Lang, A.R.G. 1967. Osmotic coefficients and water potentials of sodium chloride
solutions from 0 to 40°C. Aust. J. Chern. 20 2017-2023.
Lange, O.L., Kappen, L. and Schulze, E-D. (Eds). 1976. Water and Plant Life:
Problems and Modern Approaches.
York.
Springer-Verlag, Berlin, Heidelberg, New

l/U
Larson, P.R. and Isebrands, J.G. 1978. Functional significance of the nodal
constricted zone in Populus deltoides. Can. J. Bot. 56 : 801-804.
Leopold, A.C., Musgrave, M.E. and Williams, K.M. 1981. Solute leakage resulting
from leaf desiccation. Plant Physiol. 68 1222-1225.
MacDougal, D.T., Overton, J.B. and Smith, G.M. 1929. The hydrostatic-pneumatic
system of trees: Movement of liquids and gases. Carnegie Instn. Publ. No.
397. Cited in: Huber, B. (1956) Die Gefasleitung. In: Ruhland, W. (Ed)
Handbuch der Pflanzenphysiologie Vol. I II, 541- 58 2. Springer-Verlag,
Berlin, Gottingen, Heidelberg.
Mackay, J.F.G. and Weatherly, P.E. 1973. The effect of transverse cuts through
the stem of transpiring woody plants on water transport and stress in the
leaves. J. Exp. Bot. 24 : 15-28.
Markhart, A.H., Sionit, N. and Siedow, J.N. 1981. Cell wall water dilution:
an explanation of apparent negative turgor potentials.
1722-1725.
Can. J. Bot. 59 :
Masip, J.M.F. 1979. Water use and productivity of fruit trees: Effects of
soil management and irrigation. Ph.D. Thesis, Univ. of London, U.K.
Megraw, R.A. 1967. A hydrodynamic particulate approach to pit membrane pore
size distribution. For. Prod. J. 17 : 29-37.
Milburn, J.A. 1966. The conduction of sap. I. Water conduction and cavitation
in water stressed leaves. Planta 69 : 34- 42.
1973(a) Cavitation in Ricinus by acoustic detection: Induction
in excised leaves by various factors. Planta 110 : 253-265.
1973 (b) Cavitation studies on whole Ricinus plants by acoustic
detection. Planta 112 : 333- 342.
Milburn, J.A. and Johnson, R.P.C. 1966. The conduction of sap. II. Detection
of vibrations produced by sap cavitation in Ricinus xylem. Planta 69 :
4)-52.
Milburn, J.A. and McLaughlin, M.E. 1974. Studies of cavitation in isolated
vascular bundles and whole leaves of Plantago major L.
861- 571.
New Phytol. 73
1/1
Milburn, J .A. and Weatherly, P.E. 1971. 111e influence of temperature on the
process of water uptake by detached leaves and leaf discs.
70 : Y29-938.
New Phytol.
Misaghi, I.J., De Vay, J.E. and Duniway, J.M. 1978. Relationship between
occlusion of xylem elements and disease symptoms in leaves of cotton plants
infected with Verticillium dahliae. Can. J. Bot. 56 : 339-342.
Murmanis, L. 1975. Form of tyloses in felled Quercus rubra. Wood Sci. and
Technology 9 : 3-14.
Namken, L.N., Bartholic, J.F. and Runkles, J.R. 1971. Water stress and stem
radial contraction of cotton plants (Gossypium hirsutum L.) under field
conditions. Agron. J. 63 : 623-627.
Nemec, S. 1975. Vessel blockage by myelin forms in citrus with and without
rough-lemon decline symptoms. Can. J. Bot. 53 : 102-108.
Nobel, P.S. 1970. Introduction to Biophysical Plant Physiology.
and Co. : San Francisco.
W.H. Freeman
Oertli, J .J. 1971. The stability of water under tension in the xylem.
z. Pf1anzenphysio1. 65 : 195-209.
O!Malley, P.E.R. 1979. Xylem sap flow and pressurisation in Acer pseudo-
platanus L. Ph.D. Thesis, The University of Glasgow, U.K.
Passioura, J. B. 1980. The meaning of Matric Potential.
1161-1169.
J. Exp. Bot. 31
Peel, A.J. 1965. On the conductivity of the xylem in trees. Ann. Pot. 29
119-130.
Petty, J.A. 1970. Permeability and the structure of the wood of Sitka spruce.
Proc. R. Soc. London Ser. B. 175 : 149-166.
1972. The aspiration of bordered pits in conifer wood. Proc. R.
Soc. London Ser B. 181 : 395- 406.
Petty, J .A. and Puri tch, G.S. 1970. The effects of drying on the structure and
permeability of the wood of Abies grandis. Wood Sci. Technol. 4 : 140-154.

1IL
Postlethwait, S.N. and Rodgers, B. 1958. Tracing the path of the transpiration
stream in trees by use of radioactive isotopes. Am. J. Bot. 45 : 753-757.
Preston, R.D. 1952. Movement of water in higher plants. In: Deformation and
flow in biological systems. A. Frey-Wyssling (Ed) pp 257-321. North
Holland Publ. Co., Amsterdam.
Puritch, G.S. and Turner, J.A. 1973. Effects of pressure increase and release
on temperature within a pressure chamber used to estimate plant water
potential. J. Exp. Bot. 24 : 342-348.
Richter, H. 1973. Frictional potential losses and total water potential in
plants : are-evaluation. J. Exp. Bot. 24 : 983-994.
1976. The water status in the plant : Experimental evidence.
In: Lange, O.L., Kappen, E. and Schulze, E-D. (Ed). Water and Plant Life
Problems and modern approaches (1976) pp 42-58. Springer-Verlag, Berlin,
Heidelberg, New York.
1978. Water relations of single drying leaves Evaluation with a
dewpoint hygrometer. J. Exp. Bot. 29 : 277-280.
Ritchie, G.A. and Hinckley, T.M. 1971. Evidence for error in pressure bomb
estimates of stem xylem potentials. Ecology 52 : 534-536.
1975. The pressure chamber as an instrument
for ecological research. Adv. Ecol. Res. 9 : 165-254.
Rivett, M.F. 1920. The anatomy of Rhododendron ponticum L., and of Ilex
aquifolium L., in reference to specific conductivity.
525-550.
Ann. Bot. 34
Roberts, S.W. 1979. Properties of internal water exchange in leaves of Ilex
opaca Ait. and Cornus florida L. J. Exp. Bot. 30 : 955-963.
Sands, R. and Correll, R.L. 1976. Water potential and leaf elongation in
radista pine and wheat. Physiol. Plant. 37 : 293-297.
Scherbakova, A. and Kacperska-Palacz, A. 1980. Modification of stress avoidance
and stress tolerance in rape hypocotyls pretreated by dehydration.
Abstract No. 2561. In: Proceedings: II Congress of the Federation of
European Society of Plant Physiology, Santiago de Compostela.

173
Schmid, R. and Machado, R.D. 1968. Pit membranes In hardwoods - Fine structure
and development. Protoplasma 66 : 185-204.
Scholander, P.F., Haw~el, H.T., Hemmingsen, E.A. and Bradstreet, E.D. 1964.
Hydrostatic pressure and osmotic potential in leaves of mangroves and some
other plants. Proc. Nat. Acad. Sci. U.S.A. 52 : 119-125.
Scholander, P.F., Hammel, H.T., Bradstreet, E.D. and Hemmingsen, E.A. 1965.
Sap pressure in vascular plants. Science 148 : 339-346.
Scholander, P.F., Love, W.E. and Kanevisher, J.W. 1955. The rise of sap in
tall grapevines. Plant Physiol. 30 : 93-104.
Simon, E.W. 1974. Phospholipids and plant membrane permeability. New Phytol.
73 : 377-420.
Slavik, B. 1974. Methods of Studying Plant Water Relations. Spring-Verlag,
Berlin, Heidelberg, New York.
Smith, C.J. 1976. Adaptations to environmental change in Picea sitchensis
seedling-changes in photosynthesis, growth and substrate availability.
Ann. Bot. 40 : 1003-1015.
Smith, D.N.R. and Banks, W.B. 1971. The mechanism of flow of gases through
coniferous wood. Proc. R. Soc. London Ser. B. 177 : 197-223.
Stamm, A.J. 1929.
23-67.
The capillary structure of softwoods. J. Agric. Res. 38
1935. The effects of changes in the equilibrium relative vapour
pressure upon the capillary structure of wood. Physics 6 : 334-342.
Starr, A.M. 1912. Comparative anatomy of dune plants. Bot. Gaz. 54 : 265-305.
Stocker, O. 1952. Grundis der Botanik. Springer, Berlin. Cited in:
Zimmermann, M.H. and Brown, C.L. Trees: Structure and function (1971)
pp 188-190. Springer-Verlag, New York, Heidelberg, Berlin.
Strasburger, E. 1891. Ueber den Bau und die Verrichtungen der Leitungebahnen in
den Pflanzen. Fischer, Jena. Cited in: Zimmermann, M.H. and Brown, C.L.
(1971) Trees: Struct\~'!"e and function. Springer-Verlag, New York,
Heidelberg, Berlin.

1 1'+
Sucoff, E. 1969. Freezing of conifer xylem and the cohesion-tension theory.
Physiol. Plant. 22 : 424-431.
Sucoff, E.I-, Chen, P.Y.S. and Eossfeld, R.L. 1965. Permeability of unseasoned
xylem of northern white cedar. For. Prod. J. 15 : 321-324.
Talbot, A.J.B., Tyree, M.T. and Dainty, J. 1975. Some notes concerning the
measurement of water potentials of leaf tissue with specific reference to
Tsuga canadensis and Picea abies. Can. J. Bot. 53 : 784-788.
Talboys, P.W. 1955. Detection of vascular tissues available for water transport
in the hop by colourless derivatives of basic dyes.
510.
Nature, London 175 :
Turner, N.C. 1981. Correction of flow resistances of plants measured from
covered and exposed leaves. Plant Physiol. 68 : 1090-1092.
Turner, N.E. and Long, M.J. 1980. Errors arising from rapid water loss in the
measurement of leaf water potential by the pressure chamber technique.
Aust. J. Plant Physiol. 7 : 527-537.
Tyree, M.T. and Dainty, J. 1973. The water relations of hemlock (Tsuga
canadensis). II. The kinetics of water exchange between the xymplast and
apoplast. Can. J. Bot. 51 : 1481-1489.
Tyree, 1Yl. T. and Hammel, H. T. 1972. The measurement of the turgor pressure and
the water relations of plants by the pressure bomb technique.
Bot. 23 : 267-282.
J. Exp.
Tyree, M.T. and Yianoulis, P. 1980. The site of water evaporation from sub
stomatal cavities, liquid path resistances and hydroactive stomatal closure.
Ann. Eat. 46 : 175-193.
Tyree, M.T. and Zimmermann, M.H. 1971. The theory and practice of measuring
transport coefficients and sap flow in the xylem of red maple stems (Acer
rubrum). J. Exp. Bot. 22 : 1-18.
Tyree, M.T., Caldwell, C. and Dainty, J. 1975. The water relations of hemlock
(Tsuga canadensis). V. The localisation of resistances to bulk water flow.
Can. J. Bot. 53 : 1078-1084.

175
Tyree, M.T., Dainty, J. and Benis, M. 1973. The water relations of hemlock
(Tsuga canadensis). 1. Some equilibrium water relations as measured by the
pressure bomb technique. Can. J. Bot. 51 : 1471-1480.
Tyree, M.T., MacGregor, M.E., Petrov, A. and Upenieks, M.l. 1978. A comparison
of systematic errors between the Richards and Hammel methods of measuring
tissue-water relations parameters. Can. J. Bot. 56 :2153-2161.
Van Allen, N.K. and Turner, N.C. 1975. Changes in Alfalfa stem conductance
induced by Carynebacterium insidiosum toxin. Plant Phys io1. 55 : 559- 561.
Walder, D.N., Evans, A. and Hempleman, H.V. 1968. Ultrasonic monitoring of
decompression. Lancet 1 : 897-898.
Waring, R.H. and Cleary, B.D. 1967. Plant moisture stress Evaluation by
pressure bomb. Science 155 : 1248-1254.
Washburn, E.D. (Ed) 1926. International Critical Tables. 1st Edition. McGraw
Hill Book Co. Inc., New York, London.
Weast, R.C. (Ed) 1981. Handbook of Chemistry and Physics, 62nd Edition.
CRe Press, Baton Rouge.
Weatherly, P.E. 1950. Studies in the water relations of the cotton plant. 1.
The field measurement water deficits in leaves. New Phytol. 49 : 81-97.
1963. The pathway of water movement across the root cortex and
leaf mesophyll of transpiring plants. In: Rutter, A.G. and \Vhitehead,
F.H. (Eds). The water relations of plants (1963) pp 85-100. Blackwell
Sci~ntific Publications, Oxford.
West, D.W. and Gaff, D.F. 1971. An error in the calibration of xylem-water
potential against leaf-water potential. J. Exp. Bot. 22 : 342-346.
1976. Xylem cavitation in excised leaves of Malus
sylvestris Mill. and measurement of leaf water status with the pressure
chamber. Planta 129 : 15-18.
Yao, J. and Stamm, A.J. 1967. Validity of Determining pit pore sizes in
softwoods by surface tension resistance with rate of flow. For. Prod. J.
17 : 33-40.
176
Zimmennann, M.H. 1974. Long distance transport. Plant Physiol. 54 : 472-479.
1978(a). Hydraulic architecture of some diffuse-porous trees.
Can. J. Bot. 56 : 2286-2295.
1978(b). Vessel ends and the disruption of water-flow in
plants. Phytopathology 68 253-255.
Zimmermann, M.H. and Brown, C. L. 1971. Trees: Structure and function.
Springer-Verlag, New York, Heid~lberg, Berlin.
Zimmermann, M.H. and Jeje, A.A. 1981. Vessel-length distribution in stem of
some American woody plants. Can. J. Bot. 59 : 1882-1892.

Al
Appendix 1. Construction, calibration and operation of the thermocouple
psych rometer s amp Ie ch ambe rs
Six psychrometer chambers suitable for use with the HR-33T Dewpoint
Microvoltmeter (Wescor Inc., Logan, Utah) were built according to a design
supplied by Dr. W.J. Davies of the Biological Sciences Department of the
University of Lancaster.
The design of the chambers is illustrated in figure A.I.I. The
chambers are in two parts, both mi lIed from one inch (25.4 mm) brass rod.
A.I.I. Chamber construction
A 6 rnrn diameter by I rnrn deep circular recess in the lower half of the
chamber serves as the sample chamber. A similar recess In the upper half
contains the thermocouple for making water potential (~) measurements. A
I mm wide by 0.5 mm deep groove concentric to the central recess holds a
rubber sealing ring whidl closes the chamber when forced against the smooth
surface of the lower half of the chamber.
The chamber halves are aligned by two screws passing through holes
drilled in the top and bottom chamber halves. Removal of all except the
terminal part of the screw's thread allows the chamber halves to slide freely
on them. The chambers were sealed by sliding the halves together along the
screws. A consistent sealing pressure was obtained by a small compression
spring mounted on a plate between the screws. The sealing pressure exerted
by the spring could be adjusted by a nut on the treaded portion of one of the
screws. Once adjusted, the sealing pressure was fixed by glueing the nut to
the screw. The other end of the plate slid into a groove cut into the second
screw. The spring is an addition to the design supplied by Dr. Davies.
Surfaces, particularly those inside the sample chamber, were milled as
smooth as possib Ie and hard chromed to minimise adsorption of water during
equilibration and measurement of ~ (Dixon, pers. comm.).
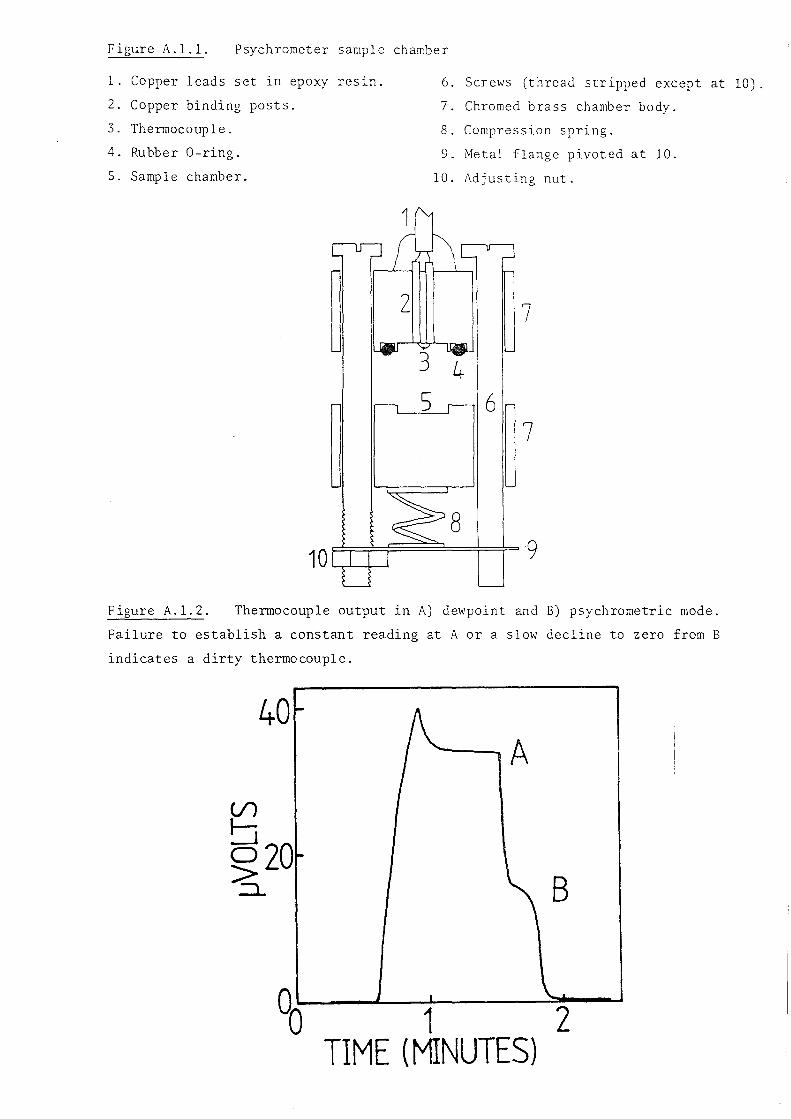
figure A.I.I. Psychrometer sample chamber
l. Copper leads set in epoxy resin. 6. Screws (thread stripped except at
2. Copper binding posts. 7. Chromed brass chamber body.
3. Thermocouple. 8. Compression spring.
4. Rubber O-ring. 9. Metal flange pi voted at 10.
S. Sample chamber. 10. Adjusting nut.
2 7
6 7
Figure A.I. 2. Thermocouple output in A) dewpoint and B) psychrometric mode.
Failure to establish a constant reading at A or a slow decline to zero from B
indicates a dirty thermocouple.
40 A
B
00 1 2 TIME (MINUTES)
10) .
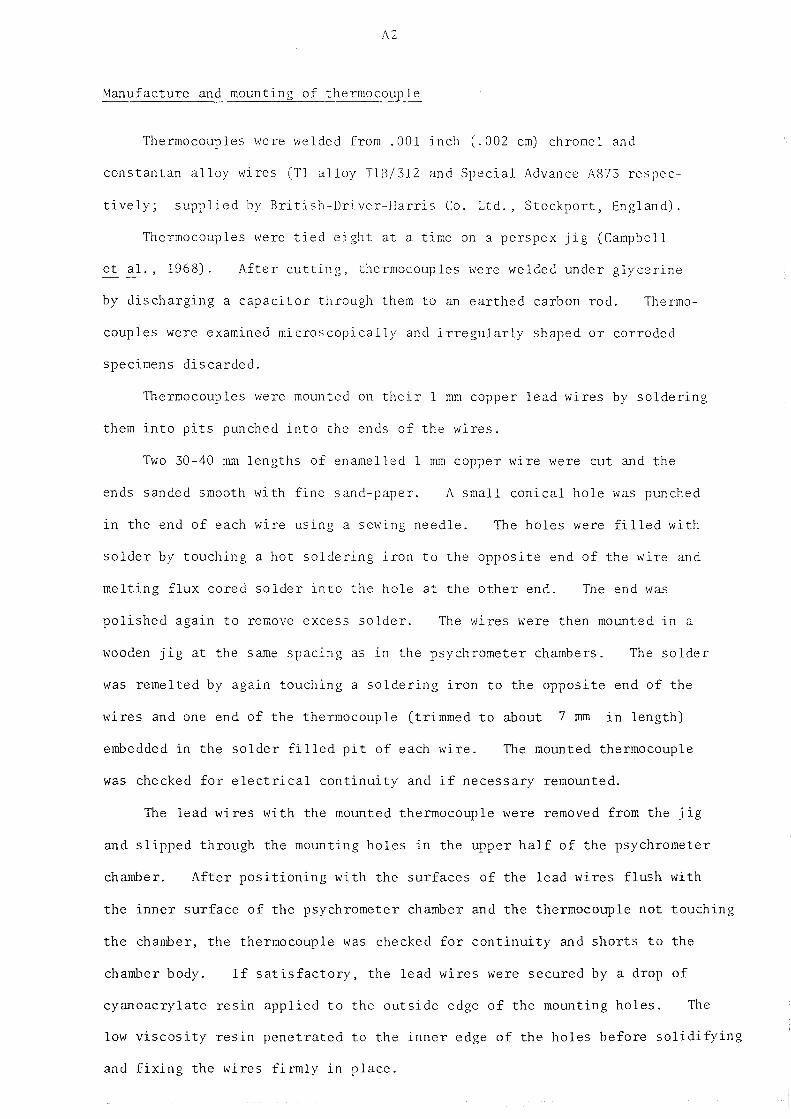
A2
Manufacture and mounting of thermocoup Ie
Thermocouples were welded from. 001 inch (.002 cm) chromel and
constantan alloy wires (Tl alloy TlB/312 and Special Advance A873 respec-
ti vely; supplied by Bri tish-Dri ver-Harris Co. Ltd., Stockport, England).
Thermocouples were tied eight at a time on a perspex jig (Campbell
et al., 1968). -- After cutting, thermocouples were welded under glycerine
by discharging a capacitor through them to an earthed carbon rod. Thermo-
couples were examined microscopically and irregularly shaped or corroded
specimens discarded.
Thermocouples were mounted on their 1 mm copper lead wires by soldering
them into pits punched into the ends of the wires.
Two 30-40 mm lengths of enamelled 1 mm copper wire were cut and the
ends sanded smooth wi th fine sand-paper. A small conical hole was punched
in the end of each wire using a sewing needle. The holes were filled with
solder by touching a hot soldering iron to the opposite end of the wire and
melting flux cored solder into the hole at the other end. The end was
polished again to remove excess solder. The wires were then mounted in a
wooden jig at the same spacing as 1n the psychrometer chambers. The solder
was remelted by again touching a soldering iron to the opposite end of the
wires and one end of the thermocouple (trimmed to about 7 mm in length)
embedded in the solder filled pit of each wire. The mounted thermocouple
was checked for electrical continuity and if necessary remounted.
The lead wires with the mounted thermocouple were removed from the jig
and slipped through the mounting holes in the upper half of the psychrometer
chamber. After positioning with the surfaces of the lead wires flush with
the inner surface of the psychrometer chamber and the thermocouple not touching
the chamber, the thermocouple was checked for continuity and shorts to the
chamber body. If satisfactory, the lead wires were secured by a drop of
cyanoacrylate resin applied to the outside edge of the mounting holes. 111e
low viscosity resin penetrated to the inner edge of the holes before solidifying
and fixing the wires firmly in place.

A3
Mounting of the thermocouples in solder as described was preferred to
mounting in slits cut into the lead wires, as in the Wescor devices, as it
was easier to clean the thermocouple chambers if mounted In this way.
Spurious EMF's generated by the extra junctions with the solder were not
found to be a prob lem in operating the chambers.
Cleanliness of the psychrometers was critical for their successful
operation.
The psychrometers were washed in 5% Lipsol detergent solution (LIP
(Equipment and Services) Ltd., Shipley, England) and rinsed twice under
running distilled water. After rinsing, a drop of water was deliberately
left in the thermocouple chamber. This drop was blown off the thermocouple
by using a commercial freezing aerosol (Fison's Freezing Aerosol Spray,
Fison Scientific Apparatus, Loughborough, England), carrying the last traces
of contaminant with it. Cylinder compressed air was used initially for
this operation but was found to contaminate the thermocouple, possib ly through
deposition of oils from the regulators or tubing used.
The rubber sealing ring was washed separate ly by the same procedure and
remounted in the chamber after both had been dried.
Cooling co-efficients (n ) of the thermocouples (i.e. the thermocouple v
EMF resulting when the temperature of the junction is altered by passing a
current through the junction) were between 65 and 80 ~V when read from the
microvol tmeter as directed by the Wescor manual. This value remained
constant over the two years over which the psychrometers were used. n of v
these thermocouples is comparable to the 50-60 ~V of similar junctions supplied
by Wescor.
A.l.2. Calibration and Operation
The chambers were calibrated using NaCl solutions soaked onto 6 mm discs
of Whatman number one fi 1 ter paper. A range of calibration solutions with
water potentials between 0.0025 MPa and 4.5 MPa "ere obtained using the tab les

1\4
of Lang (1967). Calibration solutions between zero and the lowest of those
quoted by Lang (1967) were estimated from a straight line interpolation of ~I
against salt concentration through these known points. At low concentrations
the relation between salt concentration and \jl is very nearly linear, and no
appreciable error is incurred in using the straight line approximation.
The Wescor WR-33T Oewpoint tvlicrovoltmeter was operated in accordance with
the procedure laid out in the operating manual with one exception, the setting
of the initial cooling cycle. To avoid t jumps t in calibration which might
occur when a standard, short cooling time for measuring high \jl values was
changed to a longer interval for measuring samples of low \jl a two stage
procedure was adopted. A first cooling cycle was run and the approximate
dewpoint noted. The condensed droplet was then evaporated from the thermo-
couple by a brief heating cycle and the chambers left for several
minutes to re-equilibrate. A second cooling operation fOllowed, this time
to 5 ]JV beyond the approximate de\-Jpoint of the first cycle. The dewpoint
reading on this second cycle was noted and the calibration for the chamber
consulted to obtain the sample water potential.
Microvolt measurements for a single sample were replatable to ± 0.1 ]JV.
Variability was slightly greater at higher (less negative) \jl and accuracy
fell rapidly at \jl higher than -0.1 MPa.
Psychrometer sensi ti vi ty in the dewpoint mode was between 6.5 and 7 ]JV
-1 MPa for all six sample chambers. Psychrometric sensitivity (produced by
steady-state evaporation from the thermocouple junction) was approximately
half this. Thermocouple EMF during a dewpoint and subsequent psychrometric
measurement of \jll above a 0.8 Molal NaCl solution is shown in figure A.1.2.
The two-part construction of the psychrometer chambers resulted in a
slow rate of thermal equilibration of the psychrometers and left them sensitive
to gradients in temperature. Consequently control of temperature was
essential to obtain accurate measurements of water potential. The psychro-
meters were equilibrated in metal centrifuge tubes extended by plastic
cylinders submerged in a water bath maintained at 293±O. 5 K by a Grant Flow

AS
Cooler (FIllS, Grant Instruments Ltd., Cambridge, UK). The centrifuge tubes
were plugged with cotton-wool during equilibration to further reduce thermal
gradients.
Earth loops between psychrometers in the water bath and the dewpoint
microvoltmeter caused serious errors unless dissipated by connecting the
water bath and microvoltmeter to a common ground.

Appendix II. The acoustic detector
The acoustic detector is a device for amplifying the vibrations produced
by the cavitation of xylem sap. The detector used in these experiments had
additional circuits for the reduction of extraneous noises and to enable
automatic recording of cavitation.
With the exception of the power supply and the final stages of the anti
coincidence circuit all circuits were duplicated, to give two identical
detectors working in parallel. Although both channels were sometimes used
to detect cavitation in different samples one detector was usually used as a
'control' to detect extraneous noise in the laboratory, as well as electrical
noise. The output of the 'control' channel was subtracted from that of the
'active' channel to give an output free of false events.
In the circuit diagrams below only one of each pair of circuits is shown.
Resistors used were 1/3 watt, 5%, of the carbon film.
Capacitors < 10 F were polyester, > 10 F were aluminium electrolytic
with the exception of the tuning capacitors of the monostable multi
vibrator circuit (circuit 4) which were tantalum.
All resistances are given in ohms.
Circuit 1. Power supply.
Outputs ± 12 V., + 5 V.
C1 ' 470 vF.
C2
11
C3 = 11
C4 = "
C5 = ,.
01 lN4l48
02 = BZY83C 5.6 V

L1 = LM78L12
L2 LM79Ll2
R1 = 150 0.
R2 220 0.
R3 = 100 0.
T1 TIP3055
T2 BFY51
W W04 400 V, 1 Amp Bridge Rectifier
Circuit 2. Head amp. (gain x2000)
C1 47 nF
C2 47 nF
C3 = 2 ex 47 nF
C4 100 nF
IC1 LM324
R1 = 820 K 0.
R2 = 1.8 K
R3 = 270 K
R4 = 68 K
R5 = 68 K
R6 = 820 K
R7 = 8.2 K
R8 270 K

C ircui t 1 .
L1
o v
o+..A---V -1 2 V
Circui t 2.
Ie (1 (2
~9 rei
R1
~
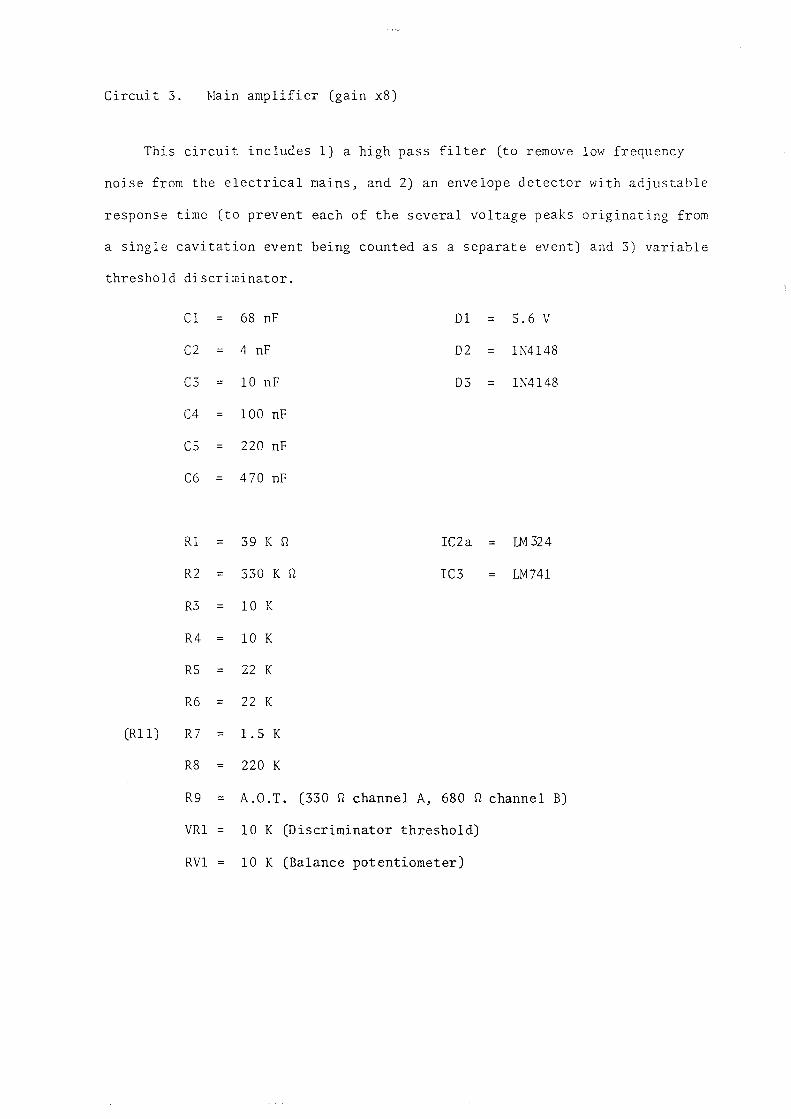
Circuit 3. lvlain amplifier (gain x8)
This circuit includes 1) a high pass filter (to remove low frequency
noise from the electrical mains, and 2) an envelope detector with adjustable
response time (to prevent each of the several vOltage peaks originating from
a single cavitation event being counted as a separate event) and 3) variable
threshold discriminator.
(Rl1)
Cl = 68 nF
C2 = 4 nF
C3 = 10 nF
C4 100 nF
C5 220 nF
C6 470 nF
Rl = 39 K rt
R2 = 330 K rt
R3 10 K
R4 10 K
R5 = 22 K
R6 = 22 K
R7 = 1.5 K
R8 = 220 K
R9 = A.O.T. (330 rt channel A,
01 = 5.6 V
02
03
IC2a
1C3
=
IN4148
IN4148
LM 324
LM741
680 rt channel B)
VRl 10 K (Discriminator threshold)
RVl 10 K (Balance potentiometer)

Circuit 3,
<>-'BC6 - • o-J (3
o-J (1 R6
R4 Q~ 01. I Ir j- I I . (4
- 0-11 1(5 . . . IC2
o-J f-1f trf+'>--tLv~f U3 rtv Kb~ I L·;:~2J1 IC2 - RV2 03
-R3- R6
R1

I\~J
Circuit 4. Anti-coincidence circuit. Dual monostable multivibrators are
used to shape pulses passed by the threshold discriminators of the main
amplifier (circuit 3). The same circuits then act with a nand gate to
eliminate signals appearing within 100 ms of each other on both channels.
IC4 LM74123 (dual monostable multivibrators)
ICS = LM74123
IC6 = LM74123
IC7 = LM740 0
Time constants;
IC4 (a) 10 ].IF,
IC4 (b) 1 ].IF,
ICS (a) 10 ].IF,
rcs (b) 10 ].IF,
II II
II II
(quad nand gate)
22 K S1, 50 K S1 preset
2.2 K S1, 10 K S1 preset
22 K S1, 50 K S1 preset
47 K S1
IC6 (a,b) 10 ].IF, 47 K S1
"
"

Circuit 4.
QI; A2 CHAN A 8 r : Q 2 1---------,
(0) J (bJ
IC4
Qr I B2~--~--------~ CHAN 8 r"-____ • 81 (a): (b)
QI J Q IC5
CHAN 8 CHAN A
IC7 (c)
R)-CLR -L rC4;5
IC7(d)
~CLR IV_ - IC6

Errata
Throughout the text butan-l-ol has been referred to as N-butanol.
Throughout the text for 'Weatherly' read 'Weatherley'
Missing reference: Hipkins, M.F. (1978) Kinetic analysis of the
chlorophyll fluorescence inductions from chloroplasts blacked with
3-(3,4-dichlophenyl)~1,1-dimethylurea. Biochim. Biophys. Acta
502: 514-523