crop diversity on traditional great plains wheat...
TRANSCRIPT

Crop Diversity on Traditional Great Plains Wheat Farms
By Pilja P. Vitale, Francis M. Epplin, Kristopher L. Giles, Norman C. Elliott, Paul A. Burgener, and Sean P. Keenan
IntroductionPrior to implementation of the 1996 Farm Bill (Freedom to Farm Bill), the vast majority of cropland in the western Great Plains of the U.S. was either seeded to continuous monoculture wheat or was in a wheat-fallow rotation. The most economical means for producing wheat in the region, given the available technology, included some tillage operations. Tillage was used to manage weeds and diseases, and to prepare a seedbed.
ABSTRACT
Historically, the vast majority of cropland in the western Great Plains was either seeded to continuous monoculture wheat or was in a wheat-fallow rotation. The objective of this paper is to determine the combined effects of crop diversity and tillage systems on wheat grain yield and net returns for farms in the traditional wheat region of the western Great Plains. Farm level data were obtained for four crop production seasons. Crop diversity was relatively more important to system economics than the type of tillage used. Net returns per acre were greater on farms that included a diversified cropping system.
Pilja P. Vitale is a Research Assistant and Francis M. Epplin is a Professor, both in the Department of Agricultural Economics at Oklahoma State University. Kristopher L. Giles is a Professor in the Department of Entomology & Plant Pathology at Oklahoma State University. Norman C. Elliott is Location Coordinator and Research Leader with the USDA, ARS, SPA, in Stillwater, Oklahoma. Paul A. Burgener is an agricultural lender with Platte Valley Bank in Scottsbluff, Nebraska. Sean P. Keenan is an Environmental Analyst with Bio-West in Logan, Utah.
2014 JOURNAL OF THE ASFMRA
145

2014 JOURNAL OF THE ASFMRA
146
The 1996 change in federal policy that eliminated the requirement of seeding wheat base acres to wheat to maintain eligibility for program payments enabled farmers to plant crops other than wheat on wheat base acres, and enabled them to rotate crops without jeopardizing federal crop subsidies. Changes in tillage, seeding, and weed control technology have enabled more intensive cropping in the region. Improvements in drills and air seeders facilitate successful plant establishment in fields with substantial surface residue. Tillage systems that reduce the risk of soil erosion from more intensive cropping plus the development of chemical herbicide systems that provide alternatives to tillage for managing weeds have made it technically feasible for producers in the region to reduce the number of tillage operations, and to diversify beyond continuous wheat.
Agronomists have long advocated that farmers use crop rotations to diversify their cropping operations to help manage weeds, diseases, insects, and soil fertility. Designed experiments to compare the side-by-side performance of one or more multi-year crop rotations with one or more monocropping systems are substantially more expensive and more difficult to execute than monocrop studies. In addition, depending on the number of crops in the rotation, the field research may require a number of years. Only a limited number of crop rotation studies have been conducted in the traditional wheat production region of the western Great Plains.
Zentner et al. (2002) found that a four-year spring wheat-flax-winter wheat-pea rotation generated greater net returns than a wheat-fallow system in
the Canadian Prairies. Lyon et al. (2004) reported that rotations including wheat and forage crops produced greater net returns per acre than traditional wheat-fallow systems in Nebraska. Bushong et al. (2012) found that expected net returns of a two-year winter canola-winter wheat rotation exceeded the net returns of a continuous winter wheat system in Oklahoma.
Soil scientists recommend that farmers maintain surface residue to mitigate soil erosion. However, experiment station studies conducted in Oklahoma have found that when wheat is grown year after year in the same field, grain yield is often reduced when a substantial quantity of wheat residue from the previous wheat crop is retained on the surface (Daniel et al., 1956; Zingg & Whitfield, 1957; Harper, 1960; Davidson & Santelmann, 1973; Heer & Krenzer, 1989; Epplin et al., 1994; Epplin & Al-Sakkaf, 1995; Decker et al., 2009; Vitale et al., 2011). In continuous wheat production systems, more disease inoculum is present on wheat residue left above the soil surface with no-till than with conventional tillage. With a disease such as take-all root rot, increased residue results in increased amounts of inoculum because the fungus that causes take-all survives on the residue (Edwards et al., 2006; Decker et al., 2009). Foliar diseases such as tan spot and stagonospora glume blotch are also more common in continuous wheat fields that have surface residue from the previous year’s crop (Edwards et al. 2006). As a consequence, under Oklahoma conditions, the expected grain yield from no-till continuous wheat is lower than the expected grain yield from continuous wheat produced on soils with less surface residue at planting.

2014 JOURNAL OF THE ASFMRA
147
The economic consequences of diversified cropping systems across tillage systems for farms in the western Great Plains have not been fully explored. The objective of the research reported in this paper is to determine the combined effects of crop diversity and tillage system on wheat grain yield and net returns for farms in the traditional wheat region of the western Great Plains.
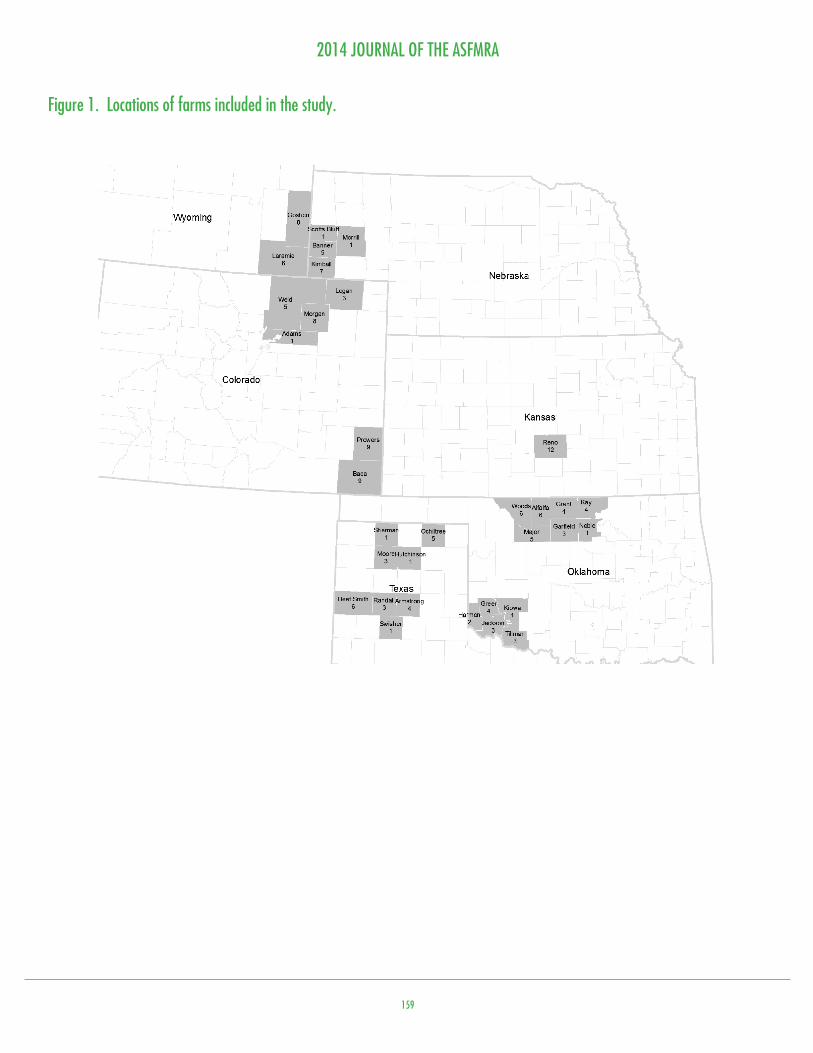
Data and MethodsCooperative extension service county educators, managers of farmer owned cooperatives, and executives from producer organizations helped to identify farmers for participation in this study. These participants were a non-random sample of wheat producers in the Western Plains. Data were obtained from a series of face-to-face interviews conducted with 141 farmers over four complete cropping seasons from 2002 through 2005. Counties in which the farms are headquartered and the number of farms surveyed per county are shown in Figure 1. Each of the farm managers attended a group annual meeting. A comprehensive on-farm interview was conducted annually on each farm to obtain detailed information about the farming operations for the year.
The data provided in the farm surveys were used to prepare detailed cost and return enterprise budgets for each crop for each farm for each year (AAEA Task Force, 2000). Total revenue produced by all crops, including hay and forage, included direct revenue (yield times price), government payments (direct, counter cyclical, and loan deficiency), and crop insurance. Total costs included labor, fuel, repairs, seed, fertilizer, herbicide, hired custom operations,
crop insurance premiums, overhead, operating interest (variable cost items), and depreciation, interest, and taxes, housing, and insurance (machinery fixed cost items). Overhead cost was included to account for shop utilities, supplies, tools, and pickup truck expenses. It was computed by multiplying variable cost before interest by 0.04. Operating interest was charged to account for the opportunity cost of annual operating capital. Land costs were excluded. Machinery and truck costs were computed based on agricultural machinery management engineering and cost parameters (ASAE, 2002). Draft copies of each of these budgets were returned to the farmers who were asked to review and verify the information, check for errors, and provide corrections as warranted. Corrections provided by the farmers were incorporated and final budgets were produced for all crops.
During the four years the weighted-average U.S. farm price received for hard red winter wheat was relatively stable ranging from $2.71 per bushel for the 2001-2002 crop year, to $3.29 per bushel for the 2004-2005 crop year. Other grain prices were also relatively stable during this time period with the weighted-average U.S. farm price received for corn ranging from $2.00 to $2.42 per bushel (USDA 2012). Changes in relative crop prices that result in changes in the relative profitability of crops would be expected to motivate growers to change crop acre allocations.
Tillage was defined based on the reported number of tillage operations. Tillage was separated into three discrete groups: no-till, minimum till, and conventional till. A farm was classified as no-till

2014 JOURNAL OF THE ASFMRA
148
if the land was not tilled on the farm over the four years. A farm was classified as conventional till if the producer reported three or more tillage passes prior to seeding a crop. Farms that did not fit into the no-till or conventional till categories were designated as minimum till. Information regarding the level of surface residue at planting was not obtained. Depending on the type of tillage, it is possible that a farm classified as conventional tillage could have planted some crops into substantial surface residue. Also, based on the method of classification, a farm classified as conventional tillage, may have used no-till for some crops. For example, a farm that used three or more tillage passes prior to planting wheat, but then followed wheat with no-till soybeans was classified as a conventional tillage farm. Many of the surveyed producers produced crops in addition to wheat which is the predominate crop grown in the western plains. A continuous variable for diversity was defined based on the proportion of wheat plus fallow acres relative to total crop and fallow acres. Additionally, the farms were classified into three discrete groups. The groups are described as wheat-only, some diversity, and full diversity based on the ratio of the area of wheat and fallow acres relative to total crop and fallow acres. Farms that fell in the upper 25 percent of the diversification ratio were classified as wheat-only. Farms that fell in the lower 25 percent of the diversification ratio were classified as full diversity. Those farms in the middle 50 percent were classified as some diversity.
Regression analysis was used to determine the effect of tillage and crop diversity on wheat grain yield
and net returns. Four annual observations were obtained from each of the 141 farms producing a panel (time series and cross section) data set. The SAS PROC MIXED procedure was used to estimate the models. Tillage, crop diversity, state, and years were included as fixed effects. The individual farms were treated as random effects. The base regression model is:
Yieldit = f (year, state, tillage, crop diversity) (1)
where Yieldit is wheat grain yield (bushels per acre) produced on farm i in year t; year refers to dummy variables, one each for years 2002, 2003, and 2004 with 2005 omitted; state refers to dummy variables, one each for Colorado, Kansas, Nebraska, Oklahoma, and Texas with Wyoming omitted; crop diversity refers either to a continuous variable ranging from one to zero of the proportion of wheat plus fallow acres relative to total crop and fallow acres or to dummy variables, one each for wheat-only and some diversity with full diversity omitted. Tillage by crop diversity interaction terms were also included.
A similar model was formulated to estimate net returns.
Net Returnsit = f (year, state, tillage, crop diversity) (2)
where Net Returnsit is the net returns (dollars per acre) across all crops grown on farm i in year t.
ResultsTable 1 includes a summary of the number of farms included in the sample categorized by state, by
2014 JOURNAL OF THE ASFMRA
149
tillage system, and by their average wheat acres. Sixteen percent of the producers used no-till throughout each of four years for all crops grown on their farm. All crops seeded on the no-till farms were directly seeded into residue for each of the four growing seasons. In Colorado, 97 percent reported using no-till or minimum till. However, 76 percent of the Oklahoma producers reported using conventional tillage. Eight (23%) of the Colorado farms used no-till, 26 (74%) used minimum till, and one (3%) used conventional tillage. The no-till farms cropped an average of 2,811 acres with 37 percent seeded to wheat. The 26 Colorado minimum till farms cropped an average of 1,593 acres with 43 percent seeded to wheat.
In all states but Texas, a greater proportion of land was cropped to wheat on conventional tillage farms than on no-till farms. On Oklahoma farms that used conventional tillage, 84 percent of the total land area cropped was seeded to wheat. However, only 49 percent of the land on the Oklahoma no-till farms was seeded to wheat.
Diversification was defined in terms of the proportion of crop acres seeded to wheat and fallowed relative to total crop acres (Table 2). The least diversified 25 percent of the producers were classified as wheat-only. More than 94 percent of the crop acres on these farms were either seeded to wheat or fallowed. The middle 50 percent of the producers in terms of diversification were categorized in the some diversity group. On these “some diversity” farms, 73-81 percent of the crop acres were either seeded to wheat or in fallow. The most diversified 25 percent were classified as “full
diversity.” On these farms, 42-56 percent of the cropland was either seeded to wheat or in fallow. Cropping was most diversified in Kansas with 75 percent of the Kansas farms included in the full diversity group. Wyoming was least diversified with 43 percent of the Wyoming farms included in the wheat-only group.
Table 3 includes results of the regression models for wheat grain yield as a function of tillage and crop diversity. Model 1 includes discrete variables for tillage and crop diversity. The model did not find any significant factors affecting wheat grain yields except for year and state. Model 2 includes the continuous variable for crop diversity. This model did not find any significant factors affecting wheat grain yield. Model 3 includes a set of tillage by diversity interaction terms. Both no-till and minimum till by wheat-only interaction terms have negative (but insignificant) signs. The interaction between no-till and some diversity is significantly positive. Based on the log likelihood values, Model 3 has more explanatory power than either Model 1 or Model 2.
Table 4 includes the findings from the regressions for net returns per acre across all crops grown on the farm as a function of tillage and crop diversity. All net return models show that tillage and crop diversity significantly affected net returns. By Model 4, conventional tillage was associated with significantly greater net returns than either no-till or minimum till, and farms in the full diversity category had significantly greater net returns per acre than farms in the wheat-only and some diversity categories. This result is consistent with

2014 JOURNAL OF THE ASFMRA
150
that reported by Decker et al. (2009) who found that the net return from continuous grain-only wheat was greater from conventional till plots than from no-till plots in Oklahoma.
Based on Model 5, which uses a continuous variable rather than discrete variables for crop diversity, net returns across all crops were increased by an average of $0.50 per acre per year for every one percent decline in the proportion of wheat and fallow acres to total cropped acres. Model 6 includes tillage by diversity interaction terms. Each of these terms is statistically significant and based on the log likelihood value, Model 6 has more explanatory power than either Model 4 or Model 5.
Table 5 shows marginal effects of tillage and crop diversity on wheat grain yield (based on Model 3) and net return (based on Model 6). Tillage did not significantly affect wheat grain yield. However, yields were significantly greater on the full and some diversity farms than on the wheat-only farms. This finding is consistent with that reported by Williams et al. (2000, 2012) who found that the wheat grain yield in continuous wheat system was lower than that of a wheat–sorghum rotation. Similarly, Bushong et al. (2012) found that wheat yields in a canola–wheat rotation were greater than wheat yields of continuous wheat.
Based on Model 6, the expected net return on farms in the full diversity category was greater than farms in the wheat-only and some diversity categories by $26/acre. This result is consistent with that reported by Zenter et al. (2002), Lyon et al.(2004), Willams et al. (2012), and Bushong et al. (2012).
Table 6 includes a summary of the expected grain yield, based on model 3, and the expected net returns, based on model 6, across the three tillage and three crop diversity groupings. Most of the yields across the nine categories are not significantly different. The predicted yields for conventional tillage for both wheat-only and full diversity farms are greater, but not significantly so, than for no-till farms. However, the predicted wheat grain yield from the no-till some diversity group was significantly greater than that from the minimum till some diversity group.
Based on Model 6, predicted net returns of the conventional till full diversity group are greater than those of both the no-till full diversity and minimum till full diversity groups by $56 and $64, respectively. The predicted net returns of the full diversity conventional tillage group are significantly greater than those of the conventional tillage some diversity group. The models suggest that farms with more diversified cropping systems generate greater net returns per acre. Eight farms are included in the full diversity conventional tillage category. Four of these eight farms were located in Kansas, three in Oklahoma, and one in Texas. In addition to wheat, all eight produced grain sorghum, six produced alfalfa, three produced corn, and two grew cotton. ConclusionThe objective was to determine the combined effects of crop diversity and tillage system on wheat grain yield and net returns for farms in the traditional wheat region of the western Great Plains. Data were obtained from each of four production seasons across a sample of 141 farms across six

2014 JOURNAL OF THE ASFMRA
151
states. Based on the regression models estimated, predicted wheat grain yields were similar across each of three tillage categories and each of three levels of cropping diversity. A variety of tillage systems are observed on farms in the region. This suggests that wheat grain yield response does not differ greatly across tillage system.
The major finding of the study is that based on the estimated regression equations, cropping diversity is associated with greater expected net returns per acre. The predicted net returns across all crops grown on the farms were found to be greater for farms in the full diversity category across all three levels of tillage. Predicted net returns were found to be $64/acre greater for farms in the full diversity conventional tillage group than for wheat-only conventional tillage farms. Similarly, predicted net returns were found to be $5/acre ($10/acre) greater for farms in the full diversity minimum till (no-till) group than for wheat-only minimum till (no-till) farms. Diversified cropping systems may require
more management skills and time. One limitation is that the cost data do not include a charge for management. In particular, crops such as alfalfa and cotton require more management than wheat. A second limitation is that cropping opportunities are constrained on some farms by the available soil resources and prevailing climate. Opportunities to diversify are not the same across farms.
The findings suggest that farms in the region could benefit by identifying and implementing economically viable cropping alternatives that fit in a rotation with wheat. Additional experiments are warranted to identify potential crops for inclusion in crop rotations for the region and to compare the side-by-side performance of multi-year crop rotations with continuous wheat. Appropriately designed crop rotation studies are substantially more expensive and more difficult to execute than monocrop pstudies. However, the additional cost of these experiments should be weighed against the potential economic impact, which is considerable.
2014 JOURNAL OF THE ASFMRA
152
References
AAEA Task Force. 2000. Commodity Costs and Returns Estimation Handbook. A Report of the AAEA Task Force on Commodity Costs and Returns.
ASAE Standards. 2002. Agricultural Machinery Management 49th Ed. EP496.2. St. Joseph, Mich.: ASAE.
Bushong, J.A., A.P. Griffith, T.F. Peeper, and F.M. Epplin. 2012. Continuous Winter Wheat Versus a Winter Canola-Winter Wheat Rotation. Agronomy Journal 104, 324-330.
Daniel, H.A., M.B. Cox, and H.M. Elwell. 1956. Stubble Mulch and Other Cultural Practices for Moisture Conservation and Wheat Production at the Wheatland Conservation Experiment Station, Cherokee, Okla., 1942–1951. USDA-ARS Production Research Report 6, Washington, DC.
Davidson, J.M., and P.W. Santelmann. 1973. An Evaluation of Various Tillage Systems for Wheat. Oklahoma Agricultural Experiment Station Bulletin B-711. Stillwater.
Decker, J. E., F.M. Epplin, D.L. Morley, and T.F. Peeper. 2009. Economics of Five Wheat Production Systems with No-Till and Conventional Tillage. Agronomy Journal 101, 364-372.
Edwards, J., F. Epplin, B. Hunger, C. Medlin, T. Royer, R. Taylor and H. Zhang. 2006. No-till wheat production in Oklahoma. Ext. Facts PSS-2132. Oklahoma Coop. Ext. Serv., Stillwater.
Epplin, F.M., G.A. Al-Sakkaf, and T.F. Peeper. 1994. Impacts of Alternative Tillage Methods for Continuous Wheat on Grain Yield and Economics: Implications for Conservation Compliance. Journal of Soil and Water Conservation 49, 394–399.
Epplin, F.M. and G.A. Al-Sakkaf. 1995. Risk-efficient Tillage Systems and Program Participation Strategies for Land Subject to Conservation Compliance. Review Agricultural Economics 17, 275–285.
Harper, H.J. 1960. A 17-year Comparison of Four Methods of Tillage for Winter Wheat in a Rotation. Oklahoma Agricultural Experiment Station Bulletin B-535. Stillwater.
Heer, W.F. and E.G. Krenzer. 1989. Soil Water Availability for Spring Growth of Winter Wheat (Triticum aestivum L.) as Influenced by Early Growth and Tillage. Soil and Tillage Research 14, 185–196.

2014 JOURNAL OF THE ASFMRA
153
Lyon, D.J., D.D. Baltensperger, J.M. Blumenthal, P.A. Burgener, and R.M. Harveson. 2004. Eliminating Summer Fallow Reduces Winter Wheat Yields, but Not Necessarily System Profitability. Crop Science 44, 855-860.
U.S.D.A. National Agricultural Statistics Service. Quick stats. 2001-2012.
Vitale, J.D., C. Godsey, J. Edwards and R. Taylor. 2011. The Adoption of Conservation Tillage Practices in Oklahoma: Findings from a Producer Survey. Journal of Soil and Water Conservation 66, 250-264.
Williams, J.R., T.W. Roth, and M.M. Classen. 2000. Profitability of Alternative Production and Tillage Strategies for Dryland Wheat and Grain Sorghum. Journal of Soil and Water Conservation 55, 49-56.
Williams, J.R., M.J. Pachta, K.L. Roozeboom, R.V. Llewelyn, M.M. Claassen, and J.S. Bergtold. 2012. Risk Analysis of Tillage and Crop Rotation Alternatives with Winter Wheat. Journal of Agricultural and Applied Economics 44, 561-576.
Zingg, A.W. and C.J. Whitfield. 1957. A Summary of Research Experience with Stubble Mulch Farming in the Western States. USDA Technical Bulletin No. 1166. Washington, DC.
Zenter, R.P., G.P. Lafond, D.A. Derksen, and C.A. Campbell. 2002. Tillage Method and Crop Diversification: Effect on Economic Returns and Riskiness of Cropping Systems in a Thin Black Chernozem of the Canadian Prairies. Soil and Tillage Research 67, 9-21.

2014 JOURNAL OF THE ASFMRA
154
Table 1. Number of farms included in the sample and average wheat planted acres by tillage system by state, 2002- 2005.
Table 2. Number of farms included in the sample and level of crop diversity by state.

2014 JOURNAL OF THE ASFMRA
155
Table 3. Regressions for wheat grain yield response to tillage, crop diversity, production year, and state (bu./acre/year).

2014 JOURNAL OF THE ASFMRA
156
Table 4. Regressions for net returns across all crops response to tillage, crop diversity, production year, and state ($/acre/year).

2014 JOURNAL OF THE ASFMRA
157
Table 5. Effect of tillage and crop diversity on wheat grain yield and net returns.

2014 JOURNAL OF THE ASFMRA
158
Table 6. Combined effect of tillage and crop diversity on wheat grain yield and net return, 2002-2005.
2014 JOURNAL OF THE ASFMRA
159
Figure 1. Locations of farms included in the study.