crop production budgets for proposed crops on the … production budgets for proposed crops on ......
TRANSCRIPT

APPENDIX H
Crop Production Budgets for Proposed Crops on the Fort Apache Indian Reservation
ENTRIX
FEBRUARY 2007
Appendix H: Crop Production Budgets for the Proposed Crops on the Fort Apache Indian
Reservation Draft Report
Prepared for White Mountain Apache Tribe
Whiteriver, AZ
By ENTRIX, Inc.
12009 N.E. 99th Street, Suite 1410 Vancouver, WA 98682-2497
October 16, 2006

Attorney-Client Communication ENTRIX, Inc. ● i Privileged, Confidential Information
Table of Contents
Overview H-1
Crop Prices H-2
Organic Tree Fruits ......................................................................................................................H-5 Organic Vine Crops .....................................................................................................................H-7 Berries ..........................................................................................................................................H-8 Other Organic Fruits and Vegetables.........................................................................................H-10 Organic Field Crops...................................................................................................................H-13 Livestock Inputs.........................................................................................................................H-14 Christmas Trees .........................................................................................................................H-14 Hybrid Poplars ...........................................................................................................................H-15
Production Summaries for Selected Crops H-16
Crop Budgets H-19
Indices H-56
References H-58
Attorney-Client Communication ENTRIX, Inc. • H-1 Confidential, Privileged Information
Overview
Crop production budgets were developed for the crops selected for the proposed irrigation project on the Fort Apache Indian Reservation (Reservation). The main source for production costs of operations is a variety of U.S. Agricultural Extension Services, mainly in the Southwestern United States. These budgets were modified to reflect organic production practices, and conditions specific on the Reservation. Agronomy reports from Dr. Walser (Appendix A), Dr. Glover (Appendix B), Dr. Fisher (Appendix C), and Dr. Mexal (Appendix E) were used to identify specific fertility requirements and other recommended production practices. For a description of why the enterprise budget method was implemented in this analysis, see Section 5.3.1 in the main report.
Crop revenues were generated from the estimated yield potential on the Reservation for the crop in question and estimated prices for the crop. The yields used in the crop budgets are consistent with the estimates by the agronomy specialists in their reports. Price data was collected from a variety of sources, and is discussed in more detail below.

Attorney-Client Communication ENTRIX, Inc. • H-2 Confidential, Privileged Information
Crop Prices
The price of an agricultural commodity is influenced by many factors, including the following: consumption patterns; production levels; the availability of substitutes; and weather conditions. Estimating crop prices is a difficult, but necessary part of determining the feasibility of a particular crop on the Reservation.
In this economic analysis, crop prices are determined by analyzing past prices received by farmers in the southwestern region of the United States if these prices are available. When data specific to the Southwest is not available, national data or personal communication (with industry experts) have been relied upon. The approach used to estimate prices is the application of a normalized, average seven-year price. This normalized, average seven-year price is calculated by first normalizing all prices to the 2005 price level using the Consumer Prices Index (CPI), then eliminating the maximum and minimum values, and finally, averaging the remaining five normalized values.1 This calculated price is referred to as the normalized adjusted price.
Seven years of price data have been collected (where available) for each selected crop in the Southwest or other relevant region. This information is used to identify trends as well as price differences among crops within a market area. For some crops, price data is incomplete or nonexistent for a particular state (such as that which transpired with data collection in Arizona). Incomplete or nonexistent price data often occurs when the crop is not commonly grown in the state or has not been tracked by the Department of Agriculture for that particular state. In these cases, the prices reported in other nearby states (such as New Mexico, Utah, or Colorado) provide an indication of the prices that agricultural producers on the Fort Apache Indian Reservation can expect to receive. When regional data is not available national data is relied upon as an indicator of prices that can be expected on the Reservation.
1 The Producer Price Index is from the Bureau of Labor Statistics, base year 1982, and it is provided in Section H.5 Below.

Attorney-Client Communication ENTRIX, Inc. • H-3 Confidential, Privileged Information
Another method of obtaining price data is to contact industry associations or individual firms for information. Table H-1 shows the sources of price data used in this economic analysis.
Table H-1 Sources for Price Data
Group Crop Source
Fruit Tree Organic Apple New Mexico NASS state bulletin data for conventionally produced apples
Organic Peach Colorado NASS state bulletin data for conventionally produced peaches
Organic Cherry Ag Prices, NASS, USDA – farm gate prices for conventionally produced cherries
Vines Organic Grape Personal communication with Rod Keeling, Arizona Wine Growers
Other Fruits and Vegetables
Asparagus Ag Prices, NASS, USDA – farm gate prices for conventionally produced asparagus
Cantaloupe Arizona NASS state bulletin data for conventionally produced cantaloupes
Onion Arizona NASS state bulletin data for conventionally produced onion
Chili Pepper Arizona NASS state bulletin data for conventionally produced chili peppers
Berries Blackberry (processed) Personal Communication with Brian Quigley, Cascadian Farms
Blackberry (fresh) Organic Business News price list Raspberry (processed) Personal Communication with Brian Quigley,
Cascadian Farms Raspberry (fresh) Organic Business News price list
Field Crops Organic Wheat Lynn Clarkson, Clarkson Grain Company Organic Blue Corn Lynn Clarkson, Clarkson Grain Company Organic Soybeans Lynn Clarkson, Clarkson Grain Company
Livestock Inputs Organic Oats Price is tied to returns on beef operation Organic Alfalfa Price is tied to returns on beef operation Organic Grain Corn Price is tied to returns on beef operation Organic Feed Barley Price is tied to returns on beef operation Organic Silage Price is tied to returns on beef operation
Agro Forestry Christmas Tree (Wholesale) Personal Communication with Scott Raitz, Tim Mitchell’s Christmas Trees, Arizona
Christmas Tree (U-Cut) National Christmas Tree Organization Hybrid Poplar Studies conducted by:
Catherine Mater, Mater Engineering GreenWood Resources Mason, Bruce & Girard

Attorney-Client Communication ENTRIX, Inc. • H-4 Confidential, Privileged Information
Prices received for organic crops generally carry a premium compared to prices received for similar, conventionally produced crops. The premium may be partially attributed to differential production costs, as organic production tends to be more labor intensive (and thus expensive). The premium may also be due, in part, to the relative supply and demand of organic products, which have generally resulted in higher profits to organic farmers.
Organized collection of price data for organic products has been limited, thus preventing in-depth analysis of market trends in prices, margins, and price premiums for organic foods—particularly as they compare with trends for conventional foods. Several studies of farm-level, wholesale, and retail organic price data, collected by private and nonprofit organizations, show significant premiums for organic fruits, vegetables, grains, and milk in the 1990s and beyond. These studies include, but are not limited to, the following findings: 2
1. The USDA tracked wholesale organic price premiums for two fresh vegetables between 1989 and 1992 and found average prices for organic produce that were generally double that of conventional produce prices (USDA, ERS, 2003)
2. Monthly farm gate price premiums for several major organic fruits and vegetables consistently exceeded 100 percent between 1992 and 1996 (Vandeman, 1998).
3. Supermarket scanner data showed similar price premiums for frozen organic vegetables during the 1990s (Glaser et al., 1998).
4. Greene and Calvin found an average price premium of 14 percent for organic mesclun mix and 110 percent for organic carrots for a 14-month period during 1996 and 1997(Greene and Calvin, 1997).
5. Sok and Glaser found an average price premium of 130 percent for organic broccoli, 125 percent for organic carrots, and 10 percent for organic mesclun lettuce at the wholesale level (Sok and Glaser).
The studies referenced above indicate a wide range of price premiums for organic commodities—from 10 percent to 130 percent above conventional prices. In this analysis, a conservative price premium for organic commodities over conventionally produced commodities is assumed, in the event that an organic price is not available.
2 Oberholtzer, Lydia, Carolyn Dimitri, and Catherine Greene, “Price Premiums Hold on as US Organic Produce Market Expands,” United States Department of Agriculture, VGS-308-01, May 2005.

Attorney-Client Communication ENTRIX, Inc. • H-5 Confidential, Privileged Information
Organic Tree Fruits
One of the proposed crops for the conceptual irrigation plan is organic apple. In this analysis, it is assumed that prices received for apples produced in New Mexico are representative of prices that the White Mountain Tribe could receive for production of organic apples. The New Mexico prices represent conventional apple production, as no organic apple prices are reported for the area.
Table H-2 Prices Received for Apples, New Mexico
(cents / pound)
Year Reported Price
Updated Price (2005)
1998 21.00 25.16
1999 25.00 29.31
2000 25.40 28.81
2001 31.80 35.07
2002 32.60 35.39
2003 30.70 32.59
2004 41.80 43.22
Normalized Adjusted Average 32.23
Organic Premium Price 35.46
Source: National Agriculture Statistics Service (NASS), New Mexico Annual Publication, accessed online at http://www.nass.usda.gov/nm/nmbulletin/57_04.pdf *Numbers may not sum properly due to rounding
A premium of 10 percent is applied to the price below in deriving the organic price of apples that can be expected from production on the Reservation. As there are 850 pounds of apples in one bin, the price per pound in the above table is adjusted in the crop budget to reflect the bin price of $301.37.3
Peach prices specific to Arizona are not available, as there are very few peach orchards in the state. This lack of orchards is largely due to the fact that many of the potential peach growing areas are located in climates that are too warm for peaches to thrive. The high elevation of the Reservation provides cool evenings during the growing season, which is ideal for tree fruit production and unique to Arizona. Peach price data has been obtained online from the Colorado NASS price database and is
3 850 x $.3546 = $301.37 / bin

Attorney-Client Communication ENTRIX, Inc. • H-6 Confidential, Privileged Information
used as a representative price for peaches grown at the Reservation. The table below shows the conventional prices as reported by the Colorado NASS.
Table H-3 Prices Received for Peaches, Colorado
(dollars / ton)
Year Reported Price Updated Price (2005)
1999 1,280 1,501
2000 940 1,066
2001 1,080 1,191
2002 1,130 1,227
2003 1,220 1,295
2004 944 976
2005 1,080 1,080
Normalized Adjusted Average 1,172
Organic Premium Price 1,289
Source: National Agriculture Statistics Service (NASS), Colorado Annual Publication, accessed online at http://www.nass.usda.gov/Statistics_by_State/Colorado/Publications/Annual_Statistical_Bulletin/index.asp *Numbers may not sum properly due to rounding
In this economic analysis, it is assumed that the organic premium is 10 percent over conventional prices. As there are 25 pounds of peaches in one box, the price reported in Table H-3 is adjusted to reflect a box price of $16.11.4 This is significantly higher than the national average for prices received by growers, published in the Fruit and Tree Nut Yearbook by the Economic Research Service (ERS). The national adjusted, normalized average of peaches during this same time period was $8.16 per box or $8.98 with the ten percent premium. Based on these two data sources, the price range for organic peaches ranges from $8.98 per box to $16.11 per box. The average price of $12.55 per box was used in this analysis as the representative price for organic peaches from the Reservation.
Published cherry data specific to the Southwestern United States is not available. Therefore, this analysis relies upon national price data for fresh cherries that is published by the ERS in their Fruit and Tree Nut Yearbook. (The ERS is a branch of
4 (1,289/2000) x 25 = $16.11

Attorney-Client Communication ENTRIX, Inc. • H-7 Confidential, Privileged Information
the USDA.) The table below shows published prices for conventionally produced fresh cherries over the past seven years.
Table H-4 Prices Received for Fresh Cherries, ERS
(dollars / ton)
Year Reported Price
Updated Price (2005)
1998 1,520 1,821
1999 1,500 1,758
2000 1,900 2,155
2001 1,590 1,753
2002 1,940 2,106
2003 1,700 1,804
2004 2,060 2,130
Normalized Adjusted Average 1,924
Organic Premium Price 2,116
Source: Economic Research Service, Fruit and Tree Nut Yearbook, accessed online at http://usda.mannlib.cornell.edu/usda/ers/89022/tab-b11.xls *Numbers may not sum properly due to rounding
The organic premium price (shown above) is presented as price per pound in the crop budgets. There are 2,000 pounds of fresh cherries in one ton; therefore the cherry price per pound—after applying the ten percent organic premium—is calculated to be $1.06 per pound.5
Organic Vine Crops
The grape prices reported by NASS for the state of Arizona represent the mix of wine, raisin, and fresh grape production in the state. To obtain a more accurate price that is specific to wine grapes, the Arizona Wine Growers Association (AWGA) was contacted. The AWGA suggested that high-end wine grapes would likely sell for $2,000 per ton.6 This price estimate is based on conventional production, and it is likely that organic wine grapes would support a premium price. In fact, in the published budget for University of California, Davis (UCD) reports that the price
5 (1,924 / 2,000) x 1.1 = $1.06
6 Personal Communication with Rod Keeling, Arizona Wine Growers Association, December 15, 2005.

Attorney-Client Communication ENTRIX, Inc. • H-8 Confidential, Privileged Information
received for organic cabernet sauvignon wine grapes is $3,928 per ton.7 In this economic analysis, a conservative price estimate of $2,000 per ton is used. The AWGA also indicates that it is often difficult for wineries to find Arizona-grown wine grapes, as most of the wine grapes are estate-bottled by the grower.8
Berries
The Arizona NASS office and the New Mexico NASS office do not track prices or production data for any type of berry. In this analysis, the production of blackberries and raspberries for both fresh market and commercial processing are considered. The two different markets require distinctly different production methods, and they each bring in different prices.
Fresh red raspberries and blackberries are sold in small units that weigh six to eight ounces each. Washington State and the state of Oregon are both the primary, berry-producing states; thus, they also have the most price data on conventionally produced berries. Another source for price data that is specific to organic commodities is The Organic Business News. The Organic Business News Price Report is published weekly and reports on the latest farm gate and wholesale prices for a variety of organic commodities, including both organic red raspberries and organic blackberries. In this economic analysis, the data from The Organic Business News was relied upon as being a good representation of the types of prices that can be expected for fresh berry production on the Reservation. According to The Organic Business News published reports, the price of organic raspberries and blackberries have remained unchanged during the summer of 2005, at $28 per flat.9 A flat holds 12 containers, and each of these containers weighs 8 ounces. Therefore, one flat weighs a total of 6 pounds. The price per pound used in this analysis is $4.67 per pound for fresh market organic raspberries and blackberries.10
Machine-harvested berries are strictly for processing, as are the handpicked berries that do not make the grade for the fresh market. Processed berries can be sold for a variety of products. Individually Quick Frozen (IQF) berries are the type of processed berries with the highest market value. According to Brian Quigley at Cascadian
7 Weber, Edward, Karen Klonsky and Richard De Moura, Sample Costs to Produce Organic Wine Grapes, Cabernet Sauvignon, North Coast Region, Napa County, GR-NC-05-O, University of California Cooperative Extension, 2005.
8 Personal Communication with Rod Keeling, Arizona Wine Growers Association, December 15, 2005.
9 Organic Business News Price lists, June 2006 – September 2006.
10 $28 / 6 lbs = $4.67 per pound

Attorney-Client Communication ENTRIX, Inc. • H-9 Confidential, Privileged Information
Farms, growers can expect to receive between $1.00 and $1.50 per pound for their IQF berries, depending on the type. Purée berries generally bring in between $0.95 and $1.25 per pound, depending on whether the seeds are taken out, or if the berries are sieved with the seeds in. Straight pack berries are another form of processing that can be done. Straight pack berries generally bring in $1.00 per pound. Juice berries are generally the lowest quality berry and tend to fetch $.75 per pound.11 Table H-5 shows the prices of organic red raspberries and blackberries by process type.
Table H-5 Processed Prices for Organic Red Raspberries
and Blackberries
Processed Type Form Price per Pound
IQF Crumble $1.00
Whole & Broken $1.25
"A" $1.50
Juice $0.75
Purée Sieved with seed $0.95
Seeds out $1.20
Straight Pack $1.00
Average Price for Processed Raspberries $1.09
Average Price for Processed Blackberries $1.15
Average Processed Price for Hand-Picked $0.85
Source: Personal Communication with Brian Quigley, Cascadian Farms, July 17, 2006.
In this analysis, it is assumed that machine-harvested raspberries would receive a price equivalent to a straight average of the processed berry options shown in Table H-5. Processed Blackberries carry a higher average price per pound because it is assumed that more of the berries go toward IQF instead of juice. The prices in the above table are a conservative estimate. For further discussion on the IQF process see Section 5.6.6 of the Main Report.
Additionally, it is assumed that hand-picked berries deemed unsuitable for the fresh market can be used as purée, sieved with seed or juice. Thus, the estimated price for these berries is the average of the two process types, or $.85 per pound.
11 Personal Communication with Brian Quigley, Cascadian Farms, July 17, 2006

Attorney-Client Communication ENTRIX, Inc. • H-10 Confidential, Privileged Information
Other Organic Fruits and Vegetables
Asparagus price data has not been available on a state-by-state basis in the Southwestern United States. Therefore, the national data published by ERS in the Vegetable Yearbook is relied upon in this analysis. Asparagus prices are reported for fresh asparagus on a season average basis. The hundred weight (cwt) prices in the table below are reflective of the national season average price that asparagus growers receive at the first point of sale.
Table H-6 Prices Received for Asparagus, ERS
(dollars / cwt) Year Reported Price Updated Price (2005)
1999 131.00 153.57
2000 117.00 132.70
2001 140.00 154.39
2002 110.00 119.42
2003 105.00 111.45
2004 122.00 126.13
2005 97.50 97.50
Normalized Adjusted Average 128.65
Organic Premium Price 141.52
Source: Agricultural Prices, NASS, USDA. *Numbers may not sum properly due to rounding
The organic premium price in Table H-6 above is presented on a per pound basis in the crop budget; this price assumes a 10 percent price premium for organic production. Because there are 100 pounds per cwt the asparagus, price per pound is calculated to be $1.42.
Price data for cantaloupe is available from the state of Arizona through the NASS web site. The data is specific to the state of Arizona, and includes both the spring and fall harvests in one season-wide, average price. Table H-7 shows the hundred weight (cwt) prices received for cantaloupe in Arizona, according to the NASS. The normalized, adjusted average price from this data is used to represent the anticipated price for cantaloupe on the Reservation.

Attorney-Client Communication ENTRIX, Inc. • H-11 Confidential, Privileged Information
Table H-7 Prices Received for Cantaloupe, Arizona (NASS Obtained)
(dollars / cwt) Year Reported Price Updated Price (2005)
1998 16.1 19.29
1999 13.8 16.18
2000 19.6 22.23
2001 17.9 19.74
2002 13.8 14.98
2003 15.5 16.45
2004 14.1 14.58
Normalized Adjusted Average 17.33
Organic Premium Price 19.06
Source: Annual Statistical Bulletin, Arizona NASS, accessed online at
http://www.nass.usda.gov/Statistics_by_State/Arizona/index.asp *Numbers may not sum properly due to rounding
The price in Table H-7 assumes an organic price premium of 10 percent; therefore, the per hundred weight (cwt) price of cantaloupe is $19.06. This figure is the price used in the crop budgets to calculate the net returns for the proposed irrigation system.
Price data for onions is available from the state of Arizona through the NASS web site. The data is specific to the state of Arizona, and it includes both the spring and fall harvests combined in one season-wide, average price. After applying a price premium of 10 percent for onions being certified as organic, the normalized adjusted price from this data is used to represent the anticipated price for onions produced on the Reservation (see Table H-8).

Attorney-Client Communication ENTRIX, Inc. • H-12 Confidential, Privileged Information
Table H-8 Prices Received for Onions, Arizona (NASS Obtained)
(dollars / cwt) Year Reported Price Updated Price (2005)
1997 12.60 15.33
1998 15.30 18.33
1999 11.40 13.36
2000 5.80 6.58
2001 8.00 8.82
2002 8.35 9.06
2003 9.89 10.50
Normalized Adjusted Average 11.42
Organic Premium Price 12.56
Source: Annual Statistical Bulletin, Arizona NASS, accessed online at
http://www.nass.usda.gov/Statistics_by_State/Arizona/index.asp *Numbers may not sum properly due to rounding
The organic onion price used in the production budgets is $12.56 per cwt. In addition to onions, chili peppers are commonly grown in the Southwestern United States. The NASS data for the state of Arizona has been used to develop the price for chili peppers. The normalized, adjusted average price from this data is used to represent the anticipated price for chili peppers on the Reservation (see Table H-9).
Table H-9 Prices Received for Chili Peppers, Arizona (NASS Obtained)
(dollars / cwt) Year Reported Price Updated Price (2005)
2000 27.2 30.85 2001 28.3 31.21 2002 14.5 15.74 2003 23.8 25.26 2004 32.8 33.91 2005 33.7 33.70 Normalized Adjusted Average 30.06 Organic Premium Price 33.06
Source: Annual Statistical Bulletin, Arizona NASS, accessed online at
http://www.nass.usda.gov/Statistics_by_State/Arizona/index.asp *Numbers may not sum properly due to rounding

Attorney-Client Communication ENTRIX, Inc. • H-13 Confidential, Privileged Information
Growers in Arizona receive a normalized, adjusted average price for chili peppers of $30.06 per cwt. The organic premium price shown in Table H-9 includes a 10 percent increase, which brings the price to $33.06 per cwt.
Organic Field Crops
Prices for specialty crops such as organic blue corn are not generally reported by the United States Department of Agriculture (USDA) National Agricultural Statistics Service (NASS). Organic blue corn is grown on contract, whereby a contract is agreed upon between the grower and the grain company before the crop is seeded. The price data used in this analysis has been obtained from Clarkson Grain Company, a firm that is actively working with the Tribe to identify organic growers in the White Mountain area that would be available to grow organic blue corn, wheat, and soybeans.
Organic blue corn is used in several products, including chips and tortillas. Organic blue corn is becoming more popular because of its unique, natural color. Clarkson Grain Company reports that growers in the White Mountain area could expect to receive a price of approximately $7.40 per bushel for organic blue corn.12
Organic wheat is a food grain used to produce organic breads, pastas, and pastries. In this economic analysis, organic wheat is used as a rotational crop with organic blue corn and organic soybeans, as organic standards call for three organic crops to be used in rotation. Organic wheat can fetch prices that are double that of conventional wheat prices.13 In this analysis, an estimated price of $6.00 per bushel has been obtained from Lynn Clarkson at Clarkson Grain Company.
Organic soybeans are also a food and feed grain that is used in a wide variety of food products and feeds. In this analysis, it is used in rotation with organic blue corn and organic wheat. Organic soybean prices have been shown to be more than double their conventional counterpart. In this analysis, a price of $12.00 per bushel is assumed for organic food soybeans; this price has also been obtained from Lynn Clarkson.14
12 Personal Communication with Lynn Clarkson, Clarkson Grain Company, December 12, 2005.
13 Yates, Scott, “Wheat Growers find Organic is Worth the Hassle”, Capital Press, February 10, 2004.
14 Personal Communication with Lynn Clarkson, Clarkson Grain Company, December 12, 2005.

Attorney-Client Communication ENTRIX, Inc. • H-14 Confidential, Privileged Information
Livestock Inputs
The organic crops grown to support the organic beef operation (organic corn silage, organic feed barley, organic oats, and organic grain corn) are priced in this analysis based on the anticipated profit that the Tribe could attain from an organic beef operation. The expenses of the crop production are considered input costs. The derived farm level prices for the organic forages and grains used as inputs to the organic beef operation are reported in Table H-10 below.
Table H-10 Organic Forage and Grain Prices Obtained
Crop Price Unit
Organic Alfalfa $218.49 Ton
Organic Corn for Grain $5.77 Bushel
Organic Corn for Silage $43.82 Ton
Organic Oats $6.47 Bushel
Source: Refer to Appendix G for more information on the organic beef operation.
This economic analysis makes a primary assumption (in regard to the forage and grain crops used by the organic beef operation) that the beef operation and the organic grain operation are co-dependant on each other. Without the grain operation, an organic feedlot would not be feasible. The returns to the feedlot, therefore, can be attributed to the organic forage and grain production that would make it possible.
Christmas Trees
Prices for Christmas tree crops are not quoted by the United States Department of Agriculture (USDA) National Agricultural Statistics Service (NASS). In order to define an average or typical price received for Christmas trees, price information has been obtained directly from distributors and Christmas tree associations. A price range between $13 per tree to $19 per tree is used in the analysis for wholesale Christmas Trees; this price is primarily based on the wholesale price of Douglas fir trees in 2005.15 Douglas fir is considered a low value tree; therefore, the price used in this analysis represents a conservative price that could be received for trees produced on the Reservation. The proposed Christmas tree plantation is modeled as a mix of fir and spruce trees.
15 Personal Communication with Scott Raita, Tim Mitchell’s Christmas Trees, January 3, 2006.

Attorney-Client Communication ENTRIX, Inc. • H-15 Confidential, Privileged Information
A consumer survey for the National Christmas Tree Association reports on the mean dollars paid for Christmas trees. Data is available from 2001 through 2005. A normalized average of the mean dollars paid for real trees is found to be $37.83 in 2005 dollars. This price of $37.83 per tree is used as the price for the U-Cut operation of the Christmas trees on the Reservation. Table H-11 shows the price data obtained from the consumer surveys for the National Christmas Tree Association.
Table H-11 Price Data for Christmas Trees
2001 2002 2003 2004 2005 Adjusted Average
Real Trees $31.90 $32.90 $33.80 $42.60 $41.90
UPDATED* $35.18 $35.72 $35.88 $44.04 $41.90 $ 37.83
Source: National Christmas Tree Association, Consumer Surveys, accessed online at; http://www.christmastree.org/statistics_consumer.cfm#retail *Updated using the CPI for all items
Hybrid Poplars
Appendix J and K have discussion on the prices used in this analysis for hybrid poplar. In determining the stumpage value of the proposed hybrid poplars in the plantation a delivered log price of $450 per mbf (thousand board feet log scale) was used. This is the typical delivered log price for the Fort Apache Timber Company (FATCO).16
Prices for hybrid poplar after milling were derived by Catherine Mater and are reported in Appendix K. The price for dimension lumber is set at $400 per mbm (thousand board feet lumber scale), and the price for select and better lumber is set at $1,000 in this analysis. See appendix K for more information pertaining to these estimates.
16 See Appendices J and K for further information.

Attorney-Client Communication ENTRIX, Inc. • H-16 Confidential, Privileged Information
Production Summaries for Selected Crops
Crop enterprise budgets have been developed for each of the crops selected for the proposed irrigation project. The enterprise budgets estimate the typical costs for production practices on representative farms. Several budgets have been influenced by, or primarily based on, "Arizona Crop Cost and Return Estimates", a study published by the University of Arizona.17 The published enterprise budgets from the University of California, Davis have also been used as a production practice guide and as representative cost information.18 The livestock input costs and production practices have been derived from organic rotational crop budgets from North Dakota State University Extension Service.19 A poplar plantation management group, GreenWood Resources, Inc, has developed the hybrid poplar production practices and costs. The Christmas tree production practices have been developed with the assistance of the Christmas tree specialist, Dr. Jim Fisher, and a budget has been developed through the use of published data from New Mexico State University. Other university budgets have also been used as a base for various permanent crops. Table H-12 shows the primary sources of crop enterprise budget information for the production methods used by the representative crops.
17 University of Arizona Extension, Arizona Field Crop Budgets, accessed online at http://ag.arizona.edu/AREC/ext/budgets/counties.html.
18 University of California, Davis, Department of Agriculture and Resource Economics, Cost and Return Studies, accessed online at http://www.agecon.ucdavis.edu.
19 Swenson, Andrew, Brad Brummond and Ron Haugen, Farm Management Planning Guide, Organic Crop Budgets for South Central North Dakota, Section VI, Region 5, January 2003.

Attorney-Client Communication ENTRIX, Inc. • H-17 Confidential, Privileged Information
Table H-12 Primary Sources of Crop Enterprise Budget Information
Group Crop Primary Source
Fruit Tree Organic Apple Washington State University Publication, 2002
Organic Peach University of California, Davis Publication, 2004
Organic Cherry University of California, Davis Publication, 2005
Vines Organic Grape University of California, Davis Publication, 2005
Berries Blackberry (processed) University of California, Davis Publication, 2005
Blackberry (fresh) University of California, Davis Publication, 2005
Raspberry (processed) University of California, Davis Publication, 2005
Raspberry (fresh) University of California, Davis Publication, 2005
Other Fruits and Vegetables Asparagus University of California, Davis Publication, 2004
Cantaloupe University of Arizona Publication, 2001
Onion University of California, Davis Publication, 2006
Chili Pepper University of Arizona Publication, 2001 University of California, Davis Publication, 1995
Field Crops Organic Wheat North Dakota State University Publication, 2003
Organic Blue Corn North Dakota State University Publication, 2003
Organic Soybeans North Dakota State University Publication, 2003
Livestock Inputs Organic Oats North Dakota State University Publication, 2003
Organic Alfalfa National Sustainable Agriculture Information Service Publication, 2003
Organic Grain Corn North Dakota State University Publication, 2003
Organic Feed Barley North Dakota State University Publication, 2003
Organic Silage North Dakota State University Publication, 2003
Agro Forestry Christmas Tree (Wholesale)
New Mexico State University Publication, 1989
Christmas Tree (U-Cut)
New Mexico State University Publication, 1989
Hybrid Poplar Reports from the following sources: Mater Engineering GreenWood Resources Mason, Bruce & Girard

Attorney-Client Communication ENTRIX, Inc. • H-18 Confidential, Privileged Information
Although some of the crop budgets used in this analysis are derived from the enterprise budgets of other regions, they have been modified based on assumptions regarding labor and interest rates, as well as conditions specific to the Reservation (see below for crop budget details.) Section 5.6 in the main report as well as Appendices A – D, and J describe production practices for selected crops. The budgets reported below summarize these practices and provide cost details and return data.

Attorney-Client Communication ENTRIX, Inc. • H-19 Confidential, Privileged Information
Crop Budgets

Attorney-Client Communication ENTRIX, Inc. • H-20 Confidential, Privileged Information
Table H-13 Cherry Establishment and Production Cost and Returns (2 pages)
Establishment Full Prod NPV Annual
Year 1st 2nd 3rd 4th 5th-25th
lbs per acre 0 0 1,500 8,000 13,000 186,529 10,712
Brine or Processed 0 0 300 1,600 2,600 37,306 2,142
Fresh Market 0 0 1,200 6,400 10,400 149,223 8,570
Brine or Processed Price 0 0 0 0 0 3 0
Fresh Price Received 0 0 1 1 1 1.06 1.06
GROSS RETURNS 0 0 1,321 7,044 11,447 256,205 9,392
Planting Costs:
Land Preparation: Rip 2X (custom) 250 0 0 0 0 243 14
Land Preparation: Disc 2X 16 0 0 0 0 16 1
Land Preparation: Laser Level (custom) 150 0 0 0 0 146 8
Plant: Survey, Plant, Paint Trees, Wrap (Replant Yrs 2+) 185 1 1 3 3 225 13
Trees: 272 Per Acre @ $6.65 each (Replants Yrs 2-3, 1. Yrs 4+, 2) 1,809 7 7 13 13 1,959 112
TOTAL PLANTING COSTS 2,410 8 8 16 16 2,588 149
Cultural Costs:
White Clover Cover Crop 48 0 0 0 0 47 3
Prune & Train 174 218 262 305 349 5,665 325
Prune: Shred Brush 0 0 0 7 7 102 6
Organic Insecticide 0 153 153 363 417 6,318 363
Pollination: (2 hives) 0 0 0 100 100 1,458 84
Soil Amendments (sulfur, potassium, etc) 50 50 50 311 311 4,677 269
Weed: Disc 5X (Yrs 1-3, 2 passes/middle) 45 45 45 0 0 127 7
Weed: Mow Middles 5X (1 pass per middle) 0 0 0 27 27 394 23
Growth Regulator: Gibberellic Acid Spray (ProGibb) 0 0 0 69 69 1,006 58
Fertilize: 4 ton compost manure 92 92 92 92 92 1,110 64
Other Labor Machine 109 120 123 147 151 2,523 145
Other Labor Non-Machine 29 148 201 265 387 5,894 338
Pickup Truck Use 64 64 64 64 64 1,114 64

Attorney-Client Communication ENTRIX, Inc. • H-21 Confidential, Privileged Information
Establishment Full Prod NPV Annual
ATV Use 50 50 50 50 50 871 50
TOTAL CULTURAL COSTS 662 940 1,039 1,800 2,024 31,799 1,826
Harvest Costs:
Pick & Haul 0 0 201 1,074 1,745 25,032 1,438
Pack, Cool 0 0 425 2,267 3,683 52,850 3,035
Sell 0 0 66 352 572 8,212 472
TOTAL HARVEST COSTS 0 0 692 3,692 6,000 86,095 4,944
Interest On Operating Capital 177 231 331 648 75 2,299 132
TOTAL OPERATING COSTS/ACRE 3,248 1,180 2,071 6,157 8,115 122,781 7,051
Cash Overhead Costs:
Office Expense 120 120 120 120 120 2,090 120
Organic Certification 0 0 7 35 57 821 47
Liability Insurance 7 7 7 7 7 122 7
Sanitation Fees 23 23 23 23 23 401 23
Property Insurance 13 13 14 16 16 271 16
Management 104 104 104 104 104 1,817 104
Investment Repairs 61 61 61 65 65 1,121 64
TOTAL CASH OVERHEAD COSTS 328 328 336 371 393 6,642 381
TOTAL CASH COSTS/ACRE 3,577 1,508 2,407 6,527 8,508 129,423 7,432
Non-Cash Overhead Costs (Capital Recovery):
Buildings 77 77 77 77 77 1,341 77
Packing and Cooling Facility 40 40 40 40 40 705 40
Shop Tools 19 19 19 19 19 331 19
Ladders - 50 Each 0 0 32 32 32 496 28
Fencing 15 15 15 15 15 269 15
Equipment 72 89 100 121 123 2,037 117
TOTAL NON-CASH OVERHEAD COST/ACRE 224 241 284 305 307 5,179 297
Opportunity Cost 0.80 0.80 0.80 0.80 0.80 13.9 0.80
TOTAL COST/ACRE FOR THE YEAR 3,801 1,750 2,692 6,833 8,816 134,615 7,731
NET RETURNS / ACRE -3,801 -1,750 -1,371 211 2,631 121,590 1,662
Primary Source: Grant, Joe and Janet Caprile, William Coates, Karen Klonsky, and Richard DeMoura, Sample Costs to Establish an Orchard and Produce Sweet Cherries, San Joaquin Valley North, 2005.

Attorney-Client Communication ENTRIX, Inc. • H-22 Confidential, Privileged Information
Table H-14 Peach Establishment and Production Cost and Returns (2 pages)
Establishment Production NPV Annual
Year 1st 2nd 3rd 4th 5th-20th Yield: 25 Pound Boxes Per Acre 0 0 200 500 900 10,672 717Price 13 13 13 13 13 187 12.55GROSS RETURNS 0 0 2,509 6,273 11,292 133,888 8,999 Planting Costs: Land Preparation - Slip Plow (Custom) 336 0 0 0 0 327 22Land Preparation - Disc 3X (Custom) 58 0 0 0 0 56 4Land Preparation - Put Up Borders 5 0 0 0 0 5 0Land Preparation - Level (Custom) 120 0 0 0 0 117 8Land Preparation - Float 2X (Custom) 17 0 0 0 0 17 1Plant - Layout, Plant Trees (Custom) 94 0 0 0 0 91 6Trees - 272 Per Acre 1,830 3 0 0 0 1,779 120TOTAL PLANTING COSTS 2,460 3 0 0 0 2,391 161Cultural Costs: Insect: insecticidal soap, spinosad, summer oils, pyrethrum, neem oil 100 281 428 466 466 6,369 428Pruning and Training Trees 611 262 393 480 523 7,466 502Shred Prunings 0 10 12 12 12 171 11New Zealand White Clover (12 lbs seed / ac) 31 0 0 0 0 30 2Nitrogen, 125 lbs (6 ton manure), 3rd year replaced by clover 147 147 74 37 37 791 53Rope Trees 0 0 41 60 60 756 51Thin Fruit: Hand 0 0 87 436 523 7,207 484Weed: Furrow Middles 4 4 4 4 4 57 4 Weed: Mow Middles 5X (1 pass per middle) 0 0 0 27 27 325 22Fertilizer: Fall Foliar Zinc (Zinc sulfate) 11 13 13 13 13 197 13Prop: Limbs/Branches 0 0 0 0 64 719 48Pickup: Business Use 70 70 70 70 70 1,044 70ATV: Irrigation & other 47 47 47 47 47 701 47Other Machine Labor 0 0 0 0 247 2,755 185Other Hand Labor 0 0 0 0 603 5,831 392TOTAL CULTURAL COSTS 1,020 833 1,169 1,652 2,697 34,418 2,313Harvest Costs: Pick Fruit 0 0 262 523 829 9,953 669

Attorney-Client Communication ENTRIX, Inc. • H-23 Confidential, Privileged Information
Establishment Production NPV Annual
Haul to Shed 0 0 16 39 71 838 56Pack and Cool Fruit 0 0 650 1,625 2,925 34,683 2,331Sell 0 0 125 314 565 6,694 450TOTAL HARVEST COSTS 0 0 1,053 2,501 4,389 52,169 3,507Interest On Operating Capital 248 376 615 100 2,429 163Cash Overhead Costs: Office Expense 62 62 62 62 62 929 62 Organic Certification 0 0 13 31 56 669 45 Liability Insurance 7 7 7 7 7 71 5 Property Insurance 5 5 5 5 5 100 7 Sanitation Fees 8 8 8 8 8 114 8 Investment Repairs 21 21 21 21 21 315 21 Management 104 104 104 104 104 1,552 104TOTAL CASH OVERHEAD COSTS
207 207 220 239 264 3,752 252
Capital Recovery Cost: Shop Building 40 40 40 40 40 601 40Packing Facility 40 40 40 40 40 602 40Land 0 0 0 0 0 0 0Fuel Tank and Pump 3 3 3 3 3 43 3Shop Tools 12 12 12 12 12 186 12Fencing 15 15 15 15 15 230 15Equipment 39 48 74 99 99 1,344 90TOTAL NON-CASH OVERHEAD COST/ACRE
151 160 186 211 211 3,005 202
Opportunity Cost 0.80 0.80 0.80 0.80 0.80 11.90 0.80TOTAL COST/ACRE FOR THE YEAR
4,039 1,452 3,004 5,219 7,661 98,177 6,599
NET PROFIT/ACRE -4,039 -1,452 -495 1,055 3,630 35,711 2,400
Primary Source: Day, Kevin, and Harry Andris, Karen Klonsky, and Richard DeMoura, Sample Costs to Establish and Produce Peaches for the Fresh Market, San Joaquin Valley South, University of California Cooperative Extension, 2004.

Attorney-Client Communication ENTRIX, Inc. • H-24 Confidential, Privileged Information
Table H-15 Apple Establishment Cost and Returns
1 2 3 4 5 6-20 NPV Annual
Yield (tons) 0 0 5 10 15 20 232.36 15.62Price ($ per ton) 709 709 709 709 709 709 709 709
TOTAL GROSS RETURNS 0 0 3,545 7,091 10,636 14,182 164,762 11,075
Variable Costs Soil Sample 13 0 0 0 0 0 13 1Clean Up & Disk 167 0 0 0 0 0 162 11Custom Ripping 111 0 0 0 0 0 108 7Layout & Stake Material 56 0 0 0 0 0 54 4Golden Trees 2,319 0 0 0 0 0 2,251 151Custom Plant Trees 232 0 0 0 0 0 225 15Companion Seed 21 0 0 0 0 0 20 1Rent Seeder 11 0 0 0 0 0 11 1Mulch 1,143 0 0 0 0 0 1,109 75Superior Oil 0 3 4 6 6 7 84 6White Clover Cover Crop 48 0 0 0 0 0 47 3Composted Manure 123 123 123 0 0 0 347 23Microthiol 0 21 18 29 32 22 320 21Lime Sulfur 0 0 0 0 0 19 196 13Solubor 0 0 8 4 5 5 64 4Dipel 0 0 12 25 19 20 260 17Calcium Chloride 0 0 6 10 7 8 98 7Zinc Sulfate 0 0 7 0 0 0 7 0Gopher Getter 1 1 1 1 1 2 22 1Rent Beehive 0 0 34 37 40 42 532 36Landscape Fabric 0 1,047 0 0 0 0 987 66Trellis Material 725 0 0 0 0 0 703 47Mow Middles 27 27 27 27 27 27 402 27Tape & Twine 7 55 24 52 57 60 796 54Prune 218 218 0 0 523 523 6,258 421Pheromone Dispensers 0 0 106 115 125 132 1,672 112Hand Thin 0 0 109 218 327 436 5,067 341Picking 0 0 436 698 1,047 1,396 16,294 1,095Packing Material (boxes) 0 0 88 176 263 351 4,080 274Packing and Cooling 0 0 162 324 486 649 7,535 506Tree Train Material 250 0 0 0 0 0 242 16

Attorney-Client Communication ENTRIX, Inc. • H-25 Confidential, Privileged Information
1 2 3 4 5 6-20 NPV Annual
Tractor Repair 19 17 27 66 66 55 739 50Tractor Fuel / Lube 22 20 33 80 79 66 893 60Machinery Repair 90 91 99 161 164 168 2,276 153Machine Fuel / Lube 31 31 27 95 103 109 1,383 93Other Labor 1,608 1,314 1,641 1,534 1,837 1,896 26,772 1,799Interest 416 587 759 566 192 221 4,598 309Overhead 448 150 109 175 209 201 3,085 207
TOTAL VARIABLE COSTS 8,107 3,704 3,859 4,400 5,616 6,416 89,715 6,030
Fixed Costs Tractor Depreciation 33 29 48 118 117 98 1,314 88 Tractor Interest 36 32 53 129 128 107 1,441 97 Tractor Insurance 2 2 4 9 9 7 96 6 Tractor Taxes 7 6 11 26 26 21 288 19 Packinghouse Facility 40 40 40 40 40 40 602 40 Machine Depreciation 179 183 179 306 323 338 4,539 305 Machine Interest 181 183 170 322 341 358 4,768 321 Machine Insurance 12 12 11 21 23 24 317 21 Machine Taxes 25 25 24 53 56 59 772 52 Organic Certification 0 0 18 35 53 71 824 55 Fencing 12 12 12 12 12 12 177 12 Management 104 104 104 104 104 104 1,552 104TOTAL FIXED COSTS 632 631 673 1,176 1,230 1,239 16,692 1,122
Opportunity Cost 0.80 0.80 0.80 0.80 0.80 0.80 11.90 0.80TOTAL COSTS 8,739 4,336 4,533 5,577 6,847 7,656 106,418 7,153NET RETURNS -8,739 -4,336 -987 1,514 3,789 6,526 58,344 3,922
Primary Source: Glover, Jerry and Herbert Hinman, John Reganold, and Preston Andrews, A Cost of Production Analysis of Conventional vs. Integrated vs Organic Apple Production Sytems, Washington State University, 2002.

Attorney-Client Communication ENTRIX, Inc. • H-26 Confidential, Privileged Information
Table H-16 Asparagus Costs and Returns (2 pages)
Yr 1 Yr 2 Yr 3 Yr 4-15 NPV Annual
Yield (Lbs) 0 750 2,250 4,000 39,203 3,284
Price 0 1.42 1.42 1.42 1.42 1.42
TOTAL GROSS RETURNS 0 1,061 3,184 5,661 55,479 4,647
Land Preparation
Stubble dis / ring roller 24 0 0 0 23 2
Subsoil 2nd gear 43 0 0 0 42 4
Disc 2x 12 0 0 0 12 1
Tri plane 12 0 0 0 11 1
Border, Cross check & break 23 0 0 0 22 2
Disc 2x 12 0 0 0 12 1
Tri plane 12 0 0 0 11 1
Laser Level 48 0 0 0 47 4
Fertilize, spreader 118 0 0 0 115 10
list 16 0 0 0 15 1
shape beds 10 0 0 0 9 1
Plant 118 0 0 0 114 10
Move beds, 3x 14 0 0 0 14 1
Weed Control 553 0 0 0 537 45
Cultivate 14 0 0 0 14 1
Spike 2x 11 0 0 0 10 1
Lillston 1x 13 0 0 0 13 1
Insect Control 4x 10² 0 0 0 99 8
Chop or swath fern 1x 0 24 24 24 264 22
Burn Fern 0 3 3 3 32 3
Flail Scalp 0 12 12 12 137 11
Rotovate - shape beds 0 26 26 26 285 24
Spike 1x 0 11 11 11 116 10
Cultivate 2x 0 14 14 14 158 13
Fertilize and furrow out 2x 130 130 130 130 1,552 130
Fish Fertilizer 0 250 250 250 2,740 230
Weed Control 2x 0 1,094 1,094 1,094 11,995 1,005

Attorney-Client Communication ENTRIX, Inc. • H-27 Confidential, Privileged Information
Yr 1 Yr 2 Yr 3 Yr 4-15 NPV Annual
Disease Control 2x 0 11 11 11 121 10
Insect Control 6x (3 early, 3 late) 0 10 10 10 105 9
Interest 74 185 316 127 1,696 142
Packinghouse 40 40 40 40 483 40
General Office Overhead 73 79 88 79 944 79
General Farm Maintenance 44 47 53 47 567 47
Management 53 53 53 53 641 54
Organic Certification 0 5 16 28 277 23
Fencing 15 15 15 15 184 15
Cut, haul, pack, cool, and sell - 350 1,050 1,867 18,295 1,532
Opportunity Cost 0.80 0.80 0.80 0.80 10 0.80
TOTAL COSTS 1,586 2,362 3,218 3,844 41,723 3,495
NET RETURNS -1,586 -1,300 -34 1,817 13,756 1,152
Primary Source: Meister, Herman, Sample Costs to Establish and Produce Asparagus, UC Cooperative Extension, 2004.

Attorney-Client Communication ENTRIX, Inc. • H-28 Confidential, Privileged Information
Table H-17 Costs and Returns to Establish and Produce Wine Grapes
Yr 1 Yr 2 Yr 3 Yr 4-20 NPV Annual
Gross Returns Yield (Ton) 0 0 3 5 4.2
Price 2,000 2,000 2,000 2,000 2,000 2,000
TOTAL GROSS RETURNS 0 0 5,000 10,000 125,064 8,406
Land Preparation: Clear Land and Rip (Custom) 500 0 0 0 485 33
Fertilizer: Soil & Nematode Test 41 0 0 0 40 3
Trellis: Build & Install 3,274 0 0 0 3,179 214
Fence: Build deer fence 0 0 0 0 0 0
Plant 3,113 159 0 0 3,172 213
TOTAL LAND PREP. & PLANTING COSTS 6,928 159 0 0 6,876 462
Cultural Costs: Prune: Hand Prune 0 44 153 174 2,283 153
Prune/Train: Tie canes/Shoot Position/Thin 349 349 349 916 12,023 808
Weed: Cultivate Vine Row 70 70 70 70 1,049 70
Weed: Mowing 37 37 37 37 557 37
Erosion Control - Materials/Labor 200 200 200 200 2,975 200
Prune: Chop Prunings 0 0 14 14 175 12
Fertilize: Manure - 5 tons/acre 80 80 80 80 1,190 80
Disease: Mildew (Thiolux Sulfur) 2x 0 0 38 38 498 34
Disease: Mildew (Sulfur Dust) 5x 0 11 51 51 669 45
Disease: Mildew (Serenade) 1x 0 0 43 43 554 37
Insect: Insecticidal Soap 0 132 132 132 1,836 123
Pickup 58 58 58 58 856 58
ATV 11 11 11 11 167 11
TOTAL CULTURAL COSTS 806 992 1,236 1,825 24,831 1,669
Harvest Costs: Pick 0 0 267 500 6,267 421
Haul 0 0 3 5 65 4
TOTAL HARVEST COSTS 0 0 270 505 6,331 426
Assessments:
Organic Fees/Certification 0 0 25 50 625 42
Interest On Operating Capital 445 511 599 88 2,519 169

Attorney-Client Communication ENTRIX, Inc. • H-29 Confidential, Privileged Information
Yr 1 Yr 2 Yr 3 Yr 4-20 NPV Annual
TOTAL OPERATING COSTS 8,178 1,662 2,130 2,467 41,183 2,768
Cash Overhead Costs: Office Expense 300 300 300 300 4,463 300
Liability Insurance 18 18 18 18 268 18
Property Insurance 109 109 109 109 1,622 109
Sanitation 39 39 39 39 580 39
Management 104 104 104 104 1,552 104
Investment Repairs 129 129 129 129 1,921 129
TOTAL CASH OVERHEAD COSTS 699 699 699 699 10,406 699
Non-Cash Overhead: Shop Building 0 18 18 18 250 17
Packinghouse 40 40 40 40 602 40
Shop/Field tools 0 11 11 11 153 10
Fencing 8 8 8 8 113 8
Equipment 0 365 365 365 5076 341
TOTAL NON-CASH OVERHEAD COSTS 48 442 442 442 6,194 416
Opportunity Cost 0.80 0.80 0.80 0.80 11.90 0.80
TOTAL COSTS 8,928 2,805 3,273 3,611 57,796 3,885
NET RETURNS -8,928 -2,805 1,727 6,389 67,268 4,521
Primary Source: Marcum, Daniel, Carol Fall, Karen Klonsky, and Richard De Moura, Sample Costs to Establish and Produce Wine Grapes, UC Cooperative Extension, 2005.

Attorney-Client Communication ENTRIX, Inc. • H-30 Confidential, Privileged Information
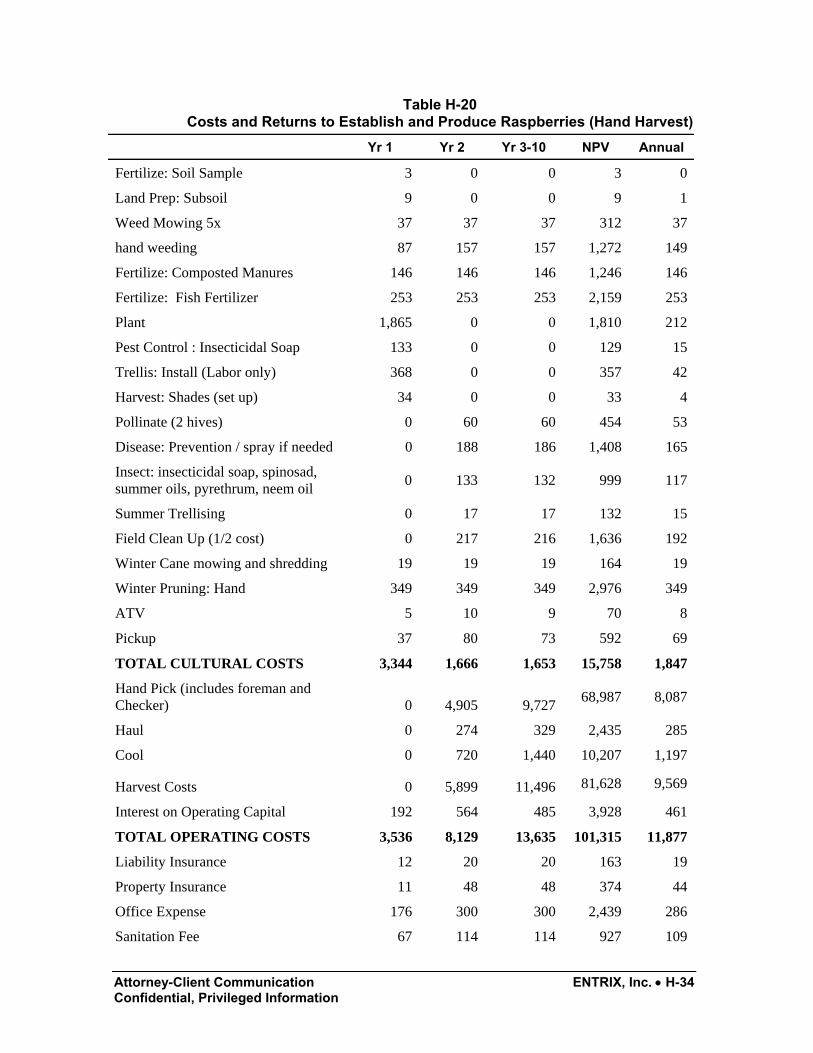
Table H-18 Costs and Returns to Establish and Produce Blackberries (Hand
Harvest)
Yr 1 Yr 2 Yr 3-10 NPV Annual
Soil Sample 3 0 0 3 0
Land Prep: Subsoil 9 0 0 9 1
Weed Mowing 5x 37 37 37 312 37
hand weeding 87 157 157 1,272 149
Fertilize: Composted Manures 146 146 146 1,246 146
Fertilize: Fish Fertilizer 253 253 253 2,159 253
Plant 2,505 0 0 2,432 285
Pest Control : Insecticidal Soap 133 0 0 129 15
Trellis: Install (Labor only) 368 0 0 357 42
Harvest: Shades (set up) 34 0 0 33 4
Pollinate (2 hives) 0 60 60 454 53
Disease: Prevention / spray if needed 0 188 186 1,408 165
Insect: insecticidal soap, spinosad, summer oils, pyrethrum, neem oil 0 133 132 999 117
Summer Trellising 0 2,181 2,181 16,485 1,933
Field Clean Up (1/2 cost) 0 217 216 1,636 192
Winter Cane mowing and shredding 19 19 19 164 19
Winter Pruning: Hand 698 698 698 5,953 698
ATV 5 10 9 70 8
pickup 37 80 73 592 69
TOTAL CULTURAL COSTS 4,333 4,178 4,166 35,709 4,186
Hand Pick (includes foreman and Checker) 0 1,951 9,270 63,178 7,406
Haul 0 242 329 2,404 282
Cool 0 300 1,440 9,811 1,150
Harvest Costs 0 2,493 11,039 75,393 8,838
Interest on Operating Capital 249 453 968 7,076 829
TOTAL OPERATING COSTS 4582 7124 16173 118,178 13,854
Liability Insurance 12 20 20 163 19
Office Expense 176 300 300 2,439 286
Sanitation Fees 67 114 114 927 109
Attorney-Client Communication ENTRIX, Inc. • H-31 Confidential, Privileged Information
Yr 1 Yr 2 Yr 3-10 NPV Annual
Food Safety Audit 0 28 28 212 25
Organic Certification 0 49 234 1,593 187
Property Insurance 11 48 48 374 44
Investment Repairs 49 95 95 766 90
Management 167 167 167 1,428 167
TOTAL CASH OVERHEAD COSTS 482 821 1,006 7,900 926
Buildings 0 132 132 998 117
Packing Facility 40 40 40 345 40
Trellis 0 30 30 227 27
Shop / Hand Tools 0 46 46 348 41
Fencing 8 8 8 65 8
Equipment 0 317 317 2,396 281
TOTAL NON-CASH OVERHEAD COSTS 48 573 573 4,379 513
Opportunity Cost 0.80 0.80 0.80 7 1
TOTAL COSTS/ ACRE 5,114 8,519 17,753 130,464 15,294
Yield - Fresh Market (Lbs) 0 2,000 9,600 65,406 7,668
Price - Fresh market 4.66 4.66 4.66 4.66 4.66
Yield - Processed (Lbs) 0 500 2,400 16,351 1,917
Price - Processed 0.85 0.85 0.85 0.85 0.85
TOTAL GROSS RETURNS 0 9,745 46,776 318,690 37,360
NET RETURNS -5,114 1,226 29,023 188,226 22,066
Primary Source: Bolda, Mark and Laura Tourte, Karen Klonsky, and Richard De Moura, Sample Costs to Produce Fresh Market Raspberries, Central Coast Region, U.C. Cooperative Extension, 2005.

Attorney-Client Communication ENTRIX, Inc. • H-32 Confidential, Privileged Information
Table H-19 Costs and Returns to Establish and Produce Blackberries (Machine
Harvest) Yr 1 Yr 2 Yr 3 Yr 4-10 NPV Annual
Soil Sample 3 0 0 0 3 .3
Land Prep: Subsoil 9 0 0 0 9 1
Weed Mowing 5x 37 37 37 37 312 37
hand weeding 87 157 157 157 1,272 149
Fertilize: Composted Manures 146 146 146 146 1,246 146
Fertilize: Fish Fertilizer 253 253 253 253 2,159 253
Plant 2,505 0 0 0 2,432 297
Pest Control : Insecticidal Soap 133 0 0 0 129 15
Trellis: Install (Labor only) 368 0 0 0 357 42
Harvest: Shades (set up) 34 0 0 0 33 4
Pollinate (2 hives) 0 60 60 60 454 53
Disease: Prevention / spray if needed 0 188 186 186 1,408 165
Insect: insecticidal soap, spinosad, summer oils, pyrethrum, neem oil 0 133 132 132 999 117
Summer Trellising 0 2,181 2,181 2,181 16,485 1,933
Field Clean Up (1/2 cost) 0 217 216 216 1,636 192
Winter Cane mowing and shredding 19 19 19 19 164 19
Winter Pruning: Hand 349 698 698 698 5,614 658
ATV 5 10 9 9 70 8
pickup 37 80 73 73 592 69
TOTAL CULTURAL COSTS 3,984 4,178 4,166 4,166 35,370 4,146
Machine Pick 0 1,527 3,030 3,030 21,488 2,519
Haul 0 242 329 329 2,404 282
Cool 0 300 1,440 1,440 9,811 1,150
HARVEST COSTS 0 2,069 4,799 4,799 33,703 3,951
Interest on Operating Capital 229 707 552 331 3,280 385
Air Spray Freezing - IQF 0 25 120 120 818 96
TOTAL OPERATING COSTS 4,213 6,979 9,637 9,415 73,171 8,578
Liability Insurance 12 20 20 20 163 19
Property Insurance 11 48 48 48 374 44

Attorney-Client Communication ENTRIX, Inc. • H-33 Confidential, Privileged Information
Yr 1 Yr 2 Yr 3 Yr 4-10 NPV Annual
Office Expense 176 300 300 300 2,439 286
Sanitation Fees 67 114 114 114 927 109
Food Safety Audit 0 28 28 28 212 25
Organic Certification 0 11 66 66 444 52
Picker Machinery 0 154 154 154 1,161 136
Management 167 167 167 167 1,428 167
Investment Repairs 49 95 95 95 766 90
TOTAL CASH OVERHEAD COSTS 482 937 991 991 7,911 927
Buildings 132 132 132 132 1,126 132
Building with Cooler / IQF tunnel 42 42 42 42 345 40
Trellis 0 30 30 30 227 27
Shop / Hand Tools 46 46 46 46 392 46
Fencing 8 8 8 8 65 8
Equipment 0 317 317 317 2,396 281
TOTAL NON-CASH OVERHEAD COSTS 226 573 573 573 4,552 534
Opportunity Cost 0.80 0.80 0.80 0.80 6.82 0.80
TOTAL COSTS/ ACRE 4,923 8,490 11,202 10,981 85,641 10,040
Yield 0 2,500 12,000 12,000 81,757 9,584
Price 1.15 1.15 1.15 1.15 1.15 1.15
TOTAL GROSS RETURNS 0 2,875 13,800 13,800 94,021 11,022
NET RETURNS -4,923 -5,615 2,598 2,819 8,380 982
Primary Source: Bolda, Mark and Laura Tourte, Karen Klonsky, and Richard De Moura, Sample Costs to Produce Fresh Market Raspberries, Central Coast Region, U.C. Cooperative Extension, 2005.
Attorney-Client Communication ENTRIX, Inc. • H-34 Confidential, Privileged Information
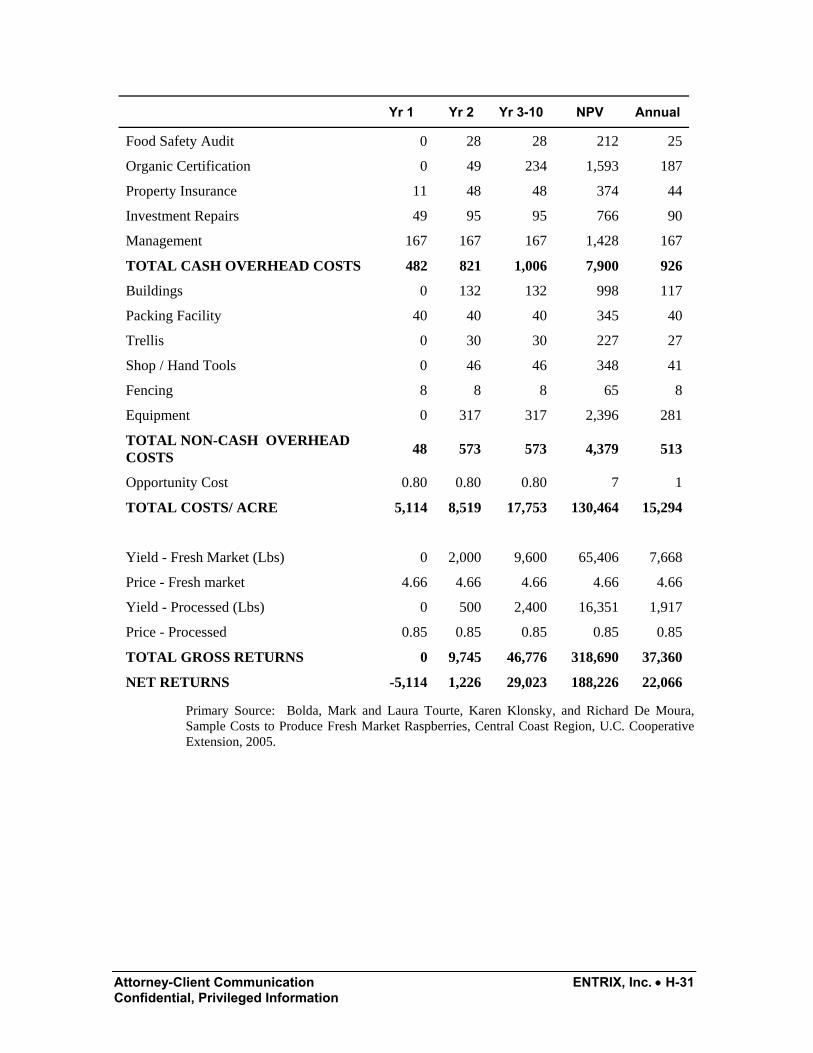
Table H-20 Costs and Returns to Establish and Produce Raspberries (Hand Harvest)
Yr 1 Yr 2 Yr 3-10 NPV Annual
Fertilize: Soil Sample 3 0 0 3 0
Land Prep: Subsoil 9 0 0 9 1
Weed Mowing 5x 37 37 37 312 37
hand weeding 87 157 157 1,272 149
Fertilize: Composted Manures 146 146 146 1,246 146
Fertilize: Fish Fertilizer 253 253 253 2,159 253
Plant 1,865 0 0 1,810 212
Pest Control : Insecticidal Soap 133 0 0 129 15
Trellis: Install (Labor only) 368 0 0 357 42
Harvest: Shades (set up) 34 0 0 33 4
Pollinate (2 hives) 0 60 60 454 53
Disease: Prevention / spray if needed 0 188 186 1,408 165
Insect: insecticidal soap, spinosad, summer oils, pyrethrum, neem oil 0 133 132 999 117
Summer Trellising 0 17 17 132 15
Field Clean Up (1/2 cost) 0 217 216 1,636 192
Winter Cane mowing and shredding 19 19 19 164 19
Winter Pruning: Hand 349 349 349 2,976 349
ATV 5 10 9 70 8
Pickup 37 80 73 592 69
TOTAL CULTURAL COSTS 3,344 1,666 1,653 15,758 1,847
Hand Pick (includes foreman and Checker) 0 4,905 9,727 68,987 8,087
Haul 0 274 329 2,435 285
Cool 0 720 1,440 10,207 1,197
Harvest Costs 0 5,899 11,496 81,628 9,569
Interest on Operating Capital 192 564 485 3,928 461
TOTAL OPERATING COSTS 3,536 8,129 13,635 101,315 11,877
Liability Insurance 12 20 20 163 19
Property Insurance 11 48 48 374 44
Office Expense 176 300 300 2,439 286
Sanitation Fee 67 114 114 927 109

Attorney-Client Communication ENTRIX, Inc. • H-35 Confidential, Privileged Information
Yr 1 Yr 2 Yr 3-10 NPV Annual
Food Safety Audit 0 28 28 212 25
Organic Certification 0 94 184 1,308 153
Management 167 167 167 1,428
167
Investment Repairs 49 95 95 766 90
TOTAL CASH OVERHEAD COSTS 482 866 957 7,615 893
Buildings 0 132 132 998 117
Packing Facility 40 40 40 345 40
Trellis 0 30 30 227 27
Shop / Hand Tools 0 46 46 348 41
Fencing 8 8 8 65 8
Equipment 0 317 317 2,396 281
TOTAL NON-CASH OVERHEAD COSTS 48 573 573 4,379 513
Opportunity Cost 0.80 0.80 0.80 6.82 0.80
TOTAL COSTS/ ACRE 4,068 9,569 15,166 113,316 13,284
Yield - Fresh Market (Lbs) 0 3,600 7,000 49,710 5,828
Price - Fresh market 4.66 4.66 4.66 4.66 4.66
Yield - Processed (Lbs) 0 2,400 5,000 35,346 4,144
Price - Processed 0.85 0.85 0.85 0.85 0.85
TOTAL GROSS RETURNS 0 18,816 36,870 261,695 30,679
NET RETURNS -4,068 9,247 21,704 148,379 17,395
Primary Source: Bolda, Mark and Laura Tourte, Karen Klonsky, and Richard De Moura, Sample Costs to Produce Fresh Market Raspberries, Central Coast Region, U.C. Cooperative Extension, 2005.
Attorney-Client Communication ENTRIX, Inc. • H-36 Confidential, Privileged Information
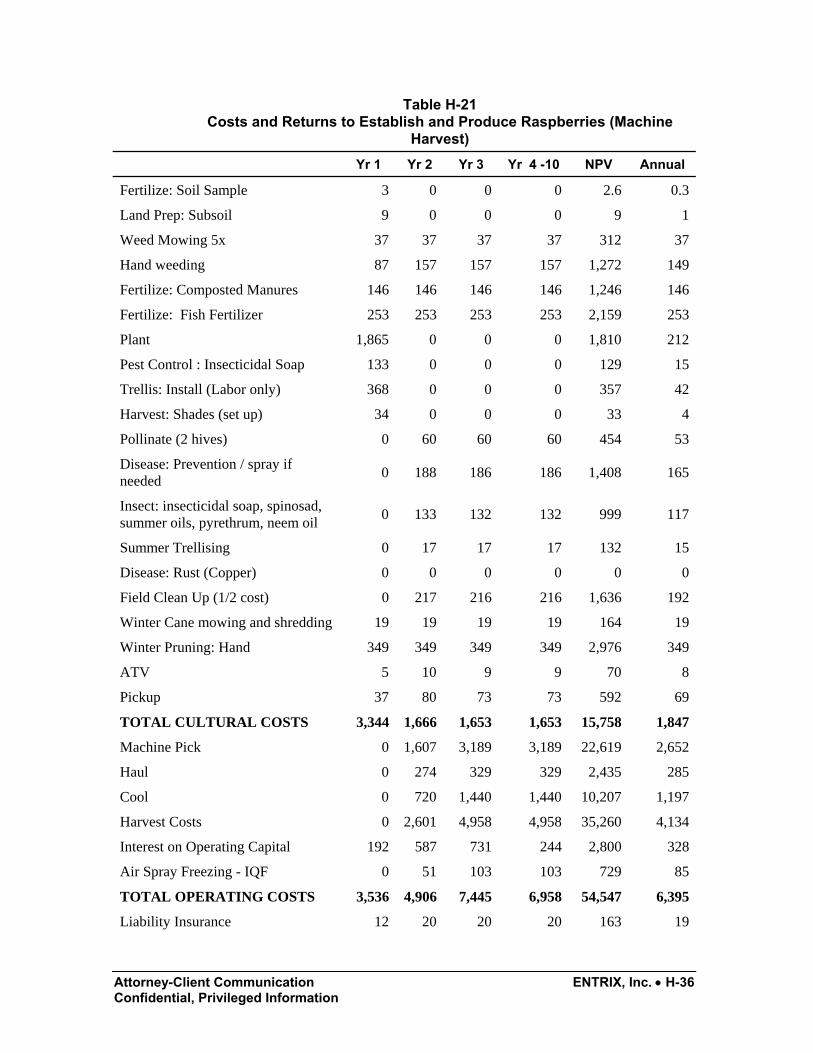
Table H-21 Costs and Returns to Establish and Produce Raspberries (Machine
Harvest) Yr 1 Yr 2 Yr 3 Yr 4 -10 NPV Annual
Fertilize: Soil Sample 3 0 0 0 2.6 0.3
Land Prep: Subsoil 9 0 0 0 9 1
Weed Mowing 5x 37 37 37 37 312 37
Hand weeding 87 157 157 157 1,272 149
Fertilize: Composted Manures 146 146 146 146 1,246 146
Fertilize: Fish Fertilizer 253 253 253 253 2,159 253
Plant 1,865 0 0 0 1,810 212
Pest Control : Insecticidal Soap 133 0 0 0 129 15
Trellis: Install (Labor only) 368 0 0 0 357 42
Harvest: Shades (set up) 34 0 0 0 33 4
Pollinate (2 hives) 0 60 60 60 454 53
Disease: Prevention / spray if needed 0 188 186 186 1,408 165
Insect: insecticidal soap, spinosad, summer oils, pyrethrum, neem oil 0 133 132 132 999 117
Summer Trellising 0 17 17 17 132 15
Disease: Rust (Copper) 0 0 0 0 0 0
Field Clean Up (1/2 cost) 0 217 216 216 1,636 192
Winter Cane mowing and shredding 19 19 19 19 164 19
Winter Pruning: Hand 349 349 349 349 2,976 349
ATV 5 10 9 9 70 8
Pickup 37 80 73 73 592 69
TOTAL CULTURAL COSTS 3,344 1,666 1,653 1,653 15,758 1,847
Machine Pick 0 1,607 3,189 3,189 22,619 2,652
Haul 0 274 329 329 2,435 285
Cool 0 720 1,440 1,440 10,207 1,197
Harvest Costs 0 2,601 4,958 4,958 35,260 4,134
Interest on Operating Capital 192 587 731 244 2,800 328
Air Spray Freezing - IQF 0 51 103 103 729 85
TOTAL OPERATING COSTS 3,536 4,906 7,445 6,958 54,547 6,395
Liability Insurance 12 20 20 20 163 19

Attorney-Client Communication ENTRIX, Inc. • H-37 Confidential, Privileged Information
Yr 1 Yr 2 Yr 3 Yr 4 -10 NPV Annual
Property Insurance 11 48 48 48 374 44
Office Expense 176 300 300 300 2,439 286
Sanitation Fee 67 114 114 114 927 109
Food Safety Audit 28 28 28 28 239 28
Organic Certification 0 26 66 66 458 54
Picker Machine 0 154 154 154 1,161 136
Investment Repairs 49 95 95 95 766 90
Management 167 167 167 167 1,428 167
TOTAL CASH OVERHEAD 510 951 991 991 7,953 932
Buildings 132 132 132 132 1,126 132
Building with Cooler / IQF tunnel 40 40 40 40 40 40
Trellis 0 30 30 30 227 27
Shop / Hand Tools 0 46 46 46 348 41
Sprinkler Pipe (5 acre sets) 0 0 0 0 0 0
Irrigation System (filtration) 0 0 0 0 0 0
Pump & Well 0 0 0 0 0 0
Fencing 8 8 8 8 65 8
Equipment 305 305 317 317 2,680 314
TOTAL NON-CASH OVERHEAD COSTS 485 561 573 573 4,791 562
Opportunity Cost 0.80 0.80 0.80 0.80 6.82 0.80
TOTAL COST/ ACRE 4,532 6,419 9,011 8,524 67,297 7,889
Yield (Lbs) 0 6,000 12,000 12,000 85,056 9,893
Price 1.09 1.09 1.09 1.09 1.09 1.09
TOTAL GROSS RETURNS 0 6,557 13,114 13,114 92,954 10,897
NET RETURNS -4,532 138 4,104 4,590 25,657 3,008
Primary Source: Bolda, Mark and Laura Tourte, Karen Klonsky, and Richard De Moura, Sample Costs to Produce Fresh Market Raspberries, Central Coast Region, U.C. Cooperative Extension, 2005.

Attorney-Client Communication ENTRIX, Inc. • H-38 Confidential, Privileged Information
Table H-22 Chili Pepper Costs and Returns
Gross Returns Quantity Unit Price per Unit
Total Value
Jalapeno 1100 box 3.31 3,637
Operating Costs
Composted Manure 1 ton 26
Plant Peppers 1 acre 216
Soft Rock Phosphate 25 lb P205 25
Fish Fertilizer 1 acre 245
Sulfate of Potash 10 lb K 1
Hand Weed 3 passes / ac 225
Harvest Labor (non-machine) 5 hours 44
Harvest Labor (machine) 3 hours 31
Harvest Material and Hauling 1 acre 101
Marketing 1,100 box 1,256
Machine Labor 12.98 hours 132
Non-Machine Labor 33.8 hours 295
Fuel - gas 1 gallon 2
Fuel - diesel 24.99 gallon 61
Lube 1 acre 5
Machinery Repair 1 acre 29
Int. on Operating Capital 6.33% 85
TOTAL OPERATING COSTS 2,778
Fixed Costs
Office Expense 34
Liability Insurance 29
Property Insurance 9
Investment Repairs 62
Shop Building Depreciation and Interest 10
Shop Tools Depreciation and Interest 3
Fuel Tanks and Pump Depreciation and Interest 1
Equipment 91
Management 53
Organic Certification 18

Attorney-Client Communication ENTRIX, Inc. • H-39 Confidential, Privileged Information
Gross Returns Quantity Unit Price per Unit
Total Value
Packing Facility 40
Fencing 8
TOTAL FIXED 361
Opportunity Cost 0.80
Total Costs 3,139
Net Revenues 498
Primary Source: Aguiar, Jose and Etaferahu Takele, and Paul Zellman, University of California Davis, Production Practices and Sample Costs to Produce Chiles, 1995 / 1996, Coachella Valley, Riverside County.

Attorney-Client Communication ENTRIX, Inc. • H-40 Confidential, Privileged Information
Table H-23 Onion Costs and Returns
Quantity Unit Price per Unit
Value per Acre
Fresh Market Gross Returns 425 CWT 12.56 5,337 Variable Costs Rip 1 acre 10 Disk 1 acre 9 List Beds 1 acre 1 Manure Compost 1 acre 245 Shape Beds, Lay Tape 1 acre 123 Transplant 1 acre 49 Hand Weed 1 acre 194 Hand Labor 23 hrs 585 Machine Labor 7 hrs 132 List Furrows 1,063 sack 10 Undercut Plants 1,063 sack 8 Sack / Bag 1,063 sack 1,063 Grade & Pack 1,063 sack 1,206 Load & Haul 1,063 sack 74 Harvest Hand Labor 28 hours 244 Harvest Machine Labor 10 hours 97 Land Prep & Harvest Costs 4,320 interest on operating capital 137 TOTAL VARIABLE COSTS 4,457 Fixed Costs Office Expense 38 Liability Insurance 9 Property Insurance 5 Investment Repairs 3 Management 53 Packinghouse 40 Organic Certification 27 Fencing 8 TOTAL FIXED COSTS 183
Opportunity Cost 0.80
TOTAL COSTS 4,641
NET RETURNS ABOVE TOTAL COSTS 696

Attorney-Client Communication ENTRIX, Inc. • H-41 Confidential, Privileged Information
Primary Source: Molinar, Richard, and Michael Yang, Karen Klonsky, and Richard L. DeMoura, Sample Costs to Produce Onions, San Joaquin Valley South, 2006, University of California Cooperative Extension.
Table H-24 Costs and Returns to Produce Cantaloupe
Quantity Unit Price per Unit Total Value Gross Returns CANTALOUPE 200 cwt 19.06 3,812 Operating Costs 6 ton manure (120 pounds of Nitrogen) 6 ton 138 Phosphorus, 60 lbs 60 lbs 60 Cantaloupe Cartons 500 cartons 400 Organic Herbicide 10 pt 61 Planting Costs 1 acre 63 Cantaloupe Seed 1.5 lb 16 Sulfur spray 20 pt 19 Organic Insecticide 10 oz 44 Organic Insecticide 2 pt 9 Irrigators Labor 7 hours 58 Other Labor 0.4 hours 3 Machine Labor 4 hours 43 Fuel, Lube, and Repair 1 acre 340 Black Plastic 1 acre 103 Harvest Labor and Materials 1 acre 1,437 Bee Hives 1 42 Interest on Operating Capital 40TOTAL OPERATING COSTS 2,876 Fixed Costs Housing, Insurance for Farm Machinery 5 General and Office Overhead 144 General Farm Maintenance 86 Management 53 Organic Certification 19 Fencing 8 Packing House 40TOTAL FIXED COSTS 356 Opportunity Cost 0.80TOTAL COSTS 3,232NET RETURNS TO WATER, MGMT., AND FACILITIES 580

Attorney-Client Communication ENTRIX, Inc. • H-42 Confidential, Privileged Information
Primary Source: University of AZ, Department of Ag and Resource Economics, AZ Cooperative Extension, Fall Cantaloupe, 2001

Attorney-Client Communication ENTRIX, Inc. • H-43 Confidential, Privileged Information
Table H-25 Costs and Returns to Produce Edible Dry Beans
Quantity Unit Price per Unit
Total Value
Gross Returns
PINTO BEANS 1,900 lbs 25 468
Operating Costs
Composted Manure 1 ton 25 25
Soft Rock Phosphate 25 P205 1 25
Pinto Bean Seed 50 lbs 1 34
Sulfate of Potash 25 lbs K 0 3
Machine Labor 3.08 hours 10 31
Non-Machine Labor 1.3 hours 9 11
Harvest Costs 1 ac 125 147
Diesel Fuel 24.7 gal 2 60
Unleaded Gas 4.2 gal 2 9
Interest on operating capital 11
TOTAL OPERATING COSTS 356
Fixed Costs
Land
Irrigation System
Housing, Insurance, Farm Machinery 10
General and Office OH 18
Management 22
Organic Certification 2
Fencing 8
TOTAL FIXED COSTS 60
Opportunity Cost 0.80
TOTAL COSTS 416
NET RETURNS 52
Primary source: University of AZ, Department of Ag and Resource Economics, AZ Cooperative Extension, Edible Dry Beans, 1998
Attorney-Client Communication ENTRIX, Inc. • H-44 Confidential, Privileged Information
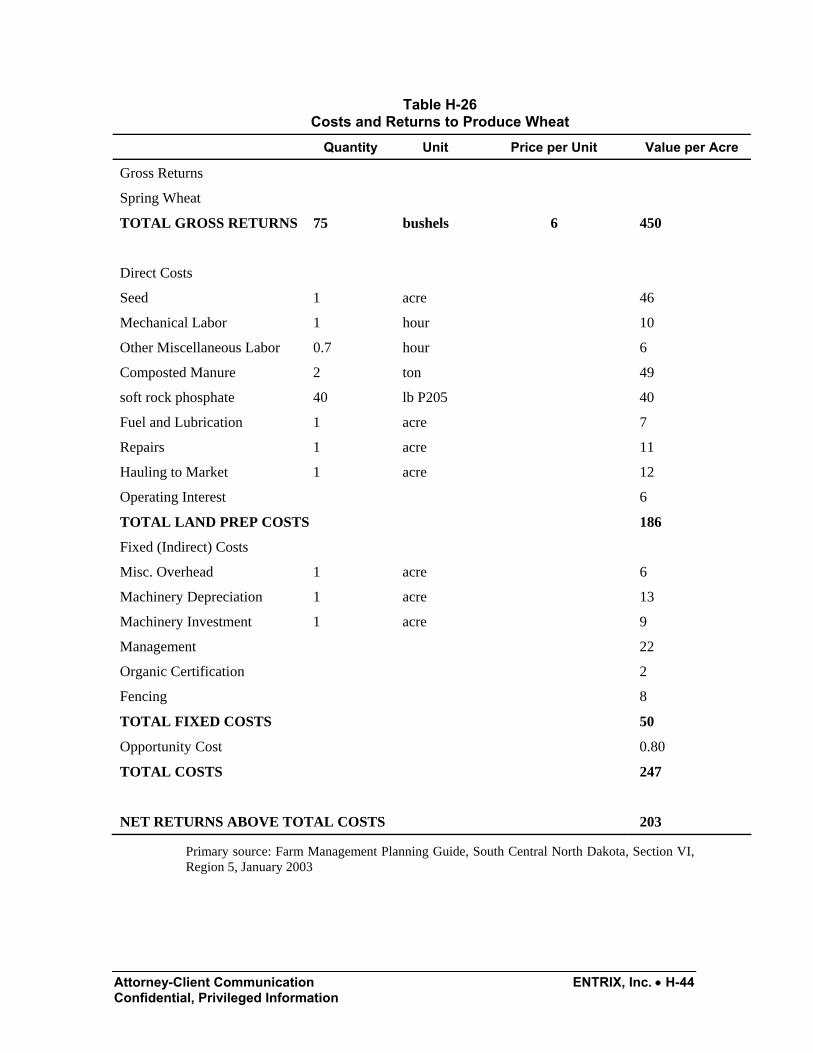
Table H-26 Costs and Returns to Produce Wheat
Quantity Unit Price per Unit Value per Acre
Gross Returns
Spring Wheat
TOTAL GROSS RETURNS 75 bushels 6 450
Direct Costs
Seed 1 acre 46
Mechanical Labor 1 hour 10
Other Miscellaneous Labor 0.7 hour 6
Composted Manure 2 ton 49
soft rock phosphate 40 lb P205 40
Fuel and Lubrication 1 acre 7
Repairs 1 acre 11
Hauling to Market 1 acre 12
Operating Interest 6
TOTAL LAND PREP COSTS 186
Fixed (Indirect) Costs
Misc. Overhead 1 acre 6
Machinery Depreciation 1 acre 13
Machinery Investment 1 acre 9
Management 22
Organic Certification 2
Fencing 8
TOTAL FIXED COSTS 50
Opportunity Cost 0.80
TOTAL COSTS 247
NET RETURNS ABOVE TOTAL COSTS 203
Primary source: Farm Management Planning Guide, South Central North Dakota, Section VI, Region 5, January 2003

Attorney-Client Communication ENTRIX, Inc. • H-45 Confidential, Privileged Information
Table H-27 Costs and Returns to Produce Soybeans
Quantity Unit Price per Unit Value per Acre
Gross Returns
Soybean
TOTAL GROSS RETURNS 50 bushels 12 600
Direct Costs
Seed 1 acre 30
Mechanical Labor 1 hour 10
Other Miscellaneous Labor 0.7 hour 6
Fuel and Lubrication 1 acre 11
Composted Manure 1 ton 25
soft rock phosphate 25 lb P205 25
Repairs 1 acre 17
Hauling to Market 1 acre 12
Harvest Machinery Costs 1 bu 17
Harvest Labor 1 hour 10
Misc. 1 acre 5
Operating Interest 5
TOTAL LAND PREP COSTS 173
Fixed (Indirect) Costs
Misc. Overhead (Office and Farm) 8
Machinery and Equipment 35
Management 22
Organic Certification 3
Fencing 8
TOTAL GROWING PERIOD COSTS 75
Opportunity Cost 0.80
TOTAL COSTS 248
NET RETURNS ABOVE TOTAL COSTS 352
Primary source: Farm Management Planning Guide, South Central North Dakota, Section VI, Region 5, January 2003

Attorney-Client Communication ENTRIX, Inc. • H-46 Confidential, Privileged Information
Table H-28 Costs and Returns to Produce Blue Corn
Quantity Unit Price per Unit Value per Acre
TOTAL GROSS RETURNS 115 bushels 7.40 851
Direct Costs
Seed 1 acre 27
Mechanical Labor 1.6 hours 16
Other Misc Labor 1 hours 9
Fuel and Lubrication 1 acre 11
Repairs 1 acre 17
Drying 1 acre 9
Hauling to Market 1 acre 65
Composted Manure 1 bu 98
Green Manure 1 acre 49
Harvest Expenses 1 acre 126
Operating Interest 14
TOTAL LAND PREP COSTS 441
Fixed (Indirect) Costs
Misc. Overhead 1 acre 9
Machinery Depreciation 1 acre 24
Machinery Investment 1 acre 16
Management 22
Organic Certification 4
Fencing 8
TOTAL FIXED COSTS 83
Opportunity Costs 0.80
TOTAL COSTS 524
NET RETURNS ABOVE TOTAL COSTS 327
Primary source: Farm Management Planning Guide, South Central North Dakota, Section VI, Region 5, January 2003.
Attorney-Client Communication ENTRIX, Inc. • H-47 Confidential, Privileged Information
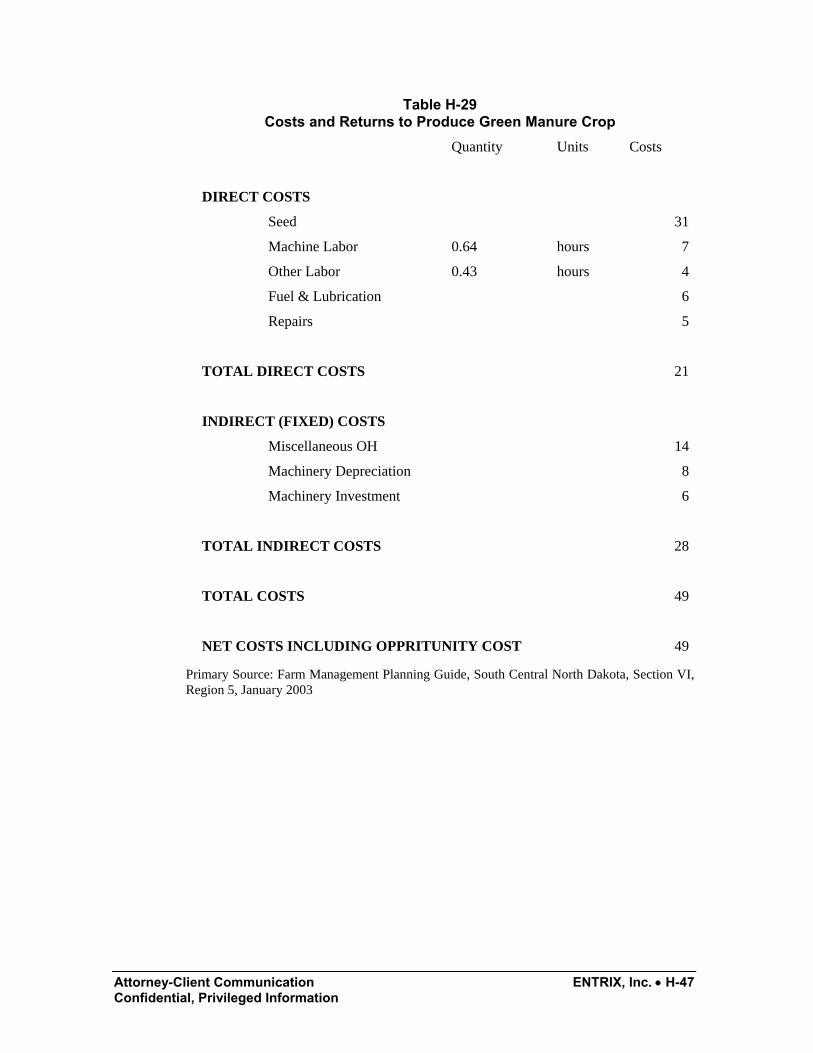
Table H-29 Costs and Returns to Produce Green Manure Crop
Quantity Units Costs
DIRECT COSTS
Seed 31
Machine Labor 0.64 hours 7
Other Labor 0.43 hours 4
Fuel & Lubrication 6
Repairs 5
TOTAL DIRECT COSTS 21
INDIRECT (FIXED) COSTS
Miscellaneous OH 14
Machinery Depreciation 8
Machinery Investment 6
TOTAL INDIRECT COSTS 28
TOTAL COSTS 49
NET COSTS INCLUDING OPPRITUNITY COST 49
Primary Source: Farm Management Planning Guide, South Central North Dakota, Section VI, Region 5, January 2003

Attorney-Client Communication ENTRIX, Inc. • H-48 Confidential, Privileged Information
Table H-30 Costs and Returns to Establish and Produce Alfalfa
Description Year 0 Year 1 - 3 NPV Annual
Yield 0 4.75 4
Price 214.45 214.45 214.45
Gross Revenue 0 1,019 2,797 753
Seed 61 0 59 16
Composted Manure 25 0 24 6
Soft Rock Phospate 120 0 116 31
Sulfate of Potash 8 0 8 2
Insect Control 155 155 576 155
Lime 18 18 67 18
Establishment Labor 41 0 40 11
Machine Labor 0 57 157 42
Fuel 3 3 10 3
Oil and Filter 0 0 1 0.4
Repairs & Maintenance 22 22 81 22
Other 24 24 89 24
Interest on Operating Capital 30 30 112 30
Variable Costs 506 309 1,341 361
Cash Overhead 11 11 41 11
Machinery Depreciation 21 21 78 21
Organic Certification 0 0 0 0
Fencing 8 8 21 6
Mgmt 0 22 60 16
Fixed Costs 32 62 200 54
Opportunity Cost 0 0.80 2.2 0.6
Total Costs 538 371 1,541 415
Net Returns -538 648 1,257 338
Primary Source: Guerena, Martin and Preston Sullivan, Organic Alfalfa Production, Agronomic Production Guide, NCAT Agriculture Specialists, July 2003.

Attorney-Client Communication ENTRIX, Inc. • H-49 Confidential, Privileged Information
Table H-31 Costs and Returns to Produce Grain Corn
Quantity Units Price per Unit
Value or Cost
GRAIN CORN 137.5 bushel 5.75 791
Variable Costs
Seed 1 acre 27
Mechanical Labor 2 hours 16
Other Miscellaneous Labor 1 hours 9
Fuel and Lubrication 1 acre 11
Repairs 1 acre 17
Drying 1 acre 9
Harvest Expense 1 acre 126
Soft Rock Phosphate 20 P205 20
Composted Manure 3 Ton 74
Miscellaneous 1 acre 9
Green Manure 49
Operating Interest 12
TOTAL LAND PREP COSTS 378
Fixed (Indirect) Costs
Misc. Overhead 1 acre 9
Machinery Depreciation 1 acre 24
Machinery Investment 1 acre 16
Management 22
Organic Certification 0
Fencing 8
TOTAL FIXED COSTS 79
Opportunity Cost 0.80
TOTAL COSTS 457
NET RETURNS 334
Primary Source: Farm Management Planning Guide, South Central North Dakota, Section VI, Region 5, January 2003

Attorney-Client Communication ENTRIX, Inc. • H-50 Confidential, Privileged Information
Table H-32 Costs and Returns to Produce Organic Oats
Quantity Units Price per Unit
Value or Cost
ORGANIC OATS 100 bushel 6.53 653
Variable Costs
Seed 1 acre 14
Mechanical Labor 1 hour 11
Other Miscellaneous Labor 0.7 hour 6
Crop Insurance 1 acre 4
Fuel and Lubrication 1 acre 7
Repairs 1 acre 11
Drying 1 acre 9
Harvest Expenses 1 acre 67
Composted Manure 3 ton 74
Green Manure 1 acre 49
Operating Interest 8
TOTAL LAND PREP COSTS 259
Fixed (Indirect) Costs
Misc. Overhead 1 acre 6
Machinery Depreciation 1 acre 14
Machinery Investment 1 acre 9
Management 22
Organic Certification 0
Fencing 8
TOTAL GROWING PERIOD COSTS 59
Opportunity Cost .80
TOTAL COSTS 319
NET RETURNS 334
Primary Source: Farm Management Planning Guide, South Central North Dakota, Section VI, Region 5, January 2003
Attorney-Client Communication ENTRIX, Inc. • H-51 Confidential, Privileged Information
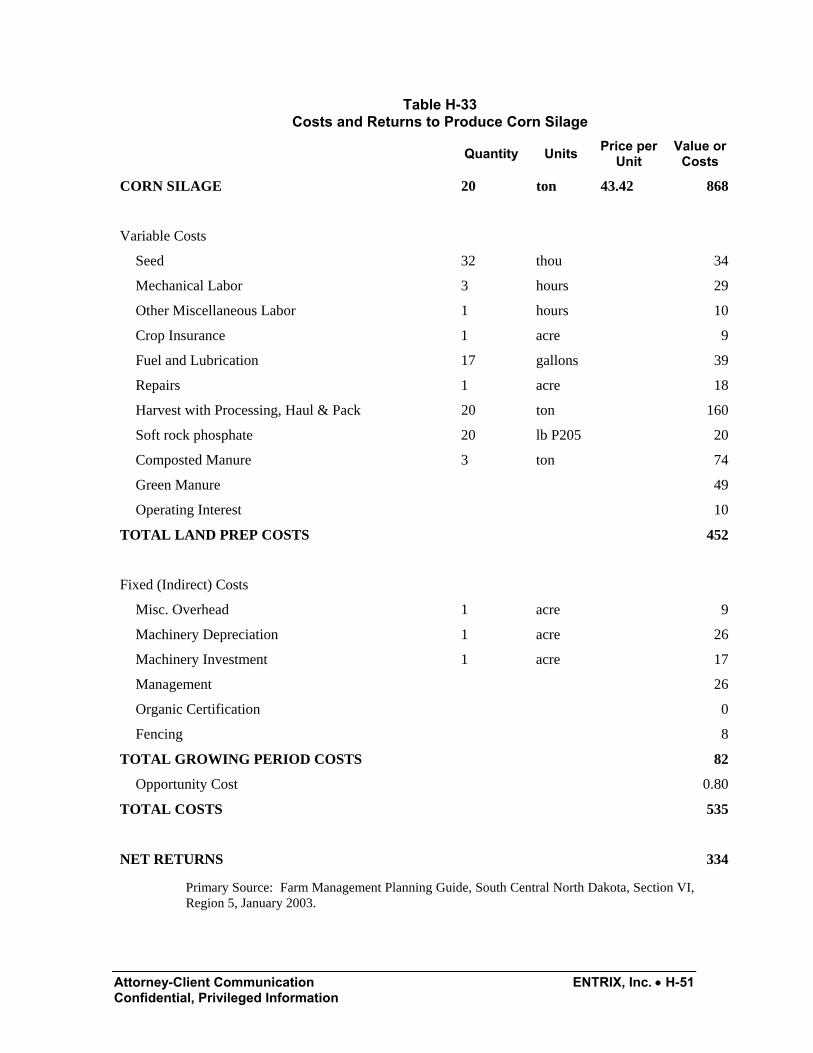
Table H-33 Costs and Returns to Produce Corn Silage
Quantity Units Price per Unit
Value or Costs
CORN SILAGE 20 ton 43.42 868
Variable Costs
Seed 32 thou 34
Mechanical Labor 3 hours 29
Other Miscellaneous Labor 1 hours 10
Crop Insurance 1 acre 9
Fuel and Lubrication 17 gallons 39
Repairs 1 acre 18
Harvest with Processing, Haul & Pack 20 ton 160
Soft rock phosphate 20 lb P205 20
Composted Manure 3 ton 74
Green Manure 49
Operating Interest 10
TOTAL LAND PREP COSTS 452
Fixed (Indirect) Costs
Misc. Overhead 1 acre 9
Machinery Depreciation 1 acre 26
Machinery Investment 1 acre 17
Management 26
Organic Certification 0
Fencing 8
TOTAL GROWING PERIOD COSTS 82
Opportunity Cost 0.80
TOTAL COSTS 535
NET RETURNS 334
Primary Source: Farm Management Planning Guide, South Central North Dakota, Section VI, Region 5, January 2003.

Attorney-Client Communication ENTRIX, Inc. • 52 Confidential, Privileged Information
Table H-34 Costs and Returns for U-Cut Christmas Trees (two pages)
Yr 1 Yr 2 Yr 3 Yr 4 Yr 5 Yr 6 Yr 7 NPV Annual
Trees Cut 0 0 0 0 0 387 775 149 Price per Tree 37.83 37.83 37.83 37.83 37.83 37.83 37.83 37.83 TOTAL GROSS RETURN 0 0 0 0 0 14,640 29,319 36,100 5,794
Tree Stock 762 - - - - - - 740 119 Tree Protectors 38 - - - - - - 36 6 Cover Grass Seed 15 - - - - - - 15 2 Herbicide 49 74 64 64 64 41 18 338 54 Insecticide - 20 20 20 20 20 20 105 17 Fungicide - - - - - - 19 16 3 Amonium Sulfate - 21 32 42 42 84 49 233 37 Miscellaneous Tools 20 8 8 8 8 10 11 67 11
SUBTOTAL 883 123 125 135 135 156 117 1,550 249 Office Expense 120 120 120 120 120 120 120 748 120 Chisel 18 - - - - - - 17 3 Disk 17 - - - - - - 16 3 PTO Sprayer 5 10 - 11 11 11 10 50 8 Rotary Prunners - - - 16 16 39 31 85 14 Harrow 9 - - - - - - 9 1 Seed 9 - - - - - - 9 1 Trailer 1 - - - - - - 1 0 Mower 11 11 - 6 6 6 6 41 7 Fert. Injector - - - 2 2 2 4 8 1 Total Labor 466 200 306 376 385 1,071 1,424 3,642 585 SUBTOTAL 656 341 426 530 539 1,249 1,594 4,627 743 Misc. Harvest Supplies - - - - - 20 20 33 5
Tree Net - - - - - 774 1,550 1,909 306 Balers and Tables - - - - - 20 20 33 5 Advertising Expense - - - - - 30 30 50 8
Liability Insurance - Cust. - - - - - 63 63 104 17

Attorney-Client Communication ENTRIX, Inc. • 53 Confidential, Privileged Information
Yr 1 Yr 2 Yr 3 Yr 4 Yr 5 Yr 6 Yr 7 NPV Annual
Sanitation Fee - - - - - 27 27 45 7 U-Cut assistance - - - - - 1,688 3,380 4,162 668 SUBTOTAL - - - - - 2,622 5,090 6,335 1,017 Employee Benefits 84 36 55 68 69 193 256 656 105
Insurance 9 9 9 9 9 9 9 59 9 Building 55 55 55 55 55 55 55 343 55 Farm Facilities 4 4 4 4 4 4 4 27 4 General and Administration 56 56 56 56 56 56 56 346 56
Management 50 50 50 50 50 50 50 312 50 Fencing 8 8 8 8 8 8 8 47 8 Other 33 33 33 33 33 33 33 208 33 SUBTOTAL 299 251 270 283 285 408 472 1,997 321 Interest on Operating Cap. 106 147 194 249 304 559 418 1,710 274
General Farm Maintenance 55 21 25 28 29 133 218 435 70
Opportunity Cost 0.80 0.80 0.80 0.80 0.80 0.80 0.80 5 0.80 TOTAL COSTS 2,001 885 1,041 1,226 1,292 5,127 7,909 16,658 2,674 NET RETURNS -2,001 -885 -1,041 -1,226 -1,292 9,513 21,409 19,442 3,121
Primary Source: Gorman, William, Robert Grassberger, James Fisher, John Mexal, Gail Welsh, Tom Clevenger and Robert Lansford, Economic Assessment of Growing 6-7 Year Scots Pine and White Fir plantation Christmas Trees in New Mexico, Ag Experiment Station, Bulletin 745, New Mexico State University, September 1989.

Attorney-Client Communication ENTRIX, Inc. • 54 Confidential, Privileged Information
Table H-35 Costs and Returns for Wholesale Christmas Trees (two pages)
Yr 1 Yr 2 Yr 3 Yr 4 Yr 5 Yr 6 Yr 7 NPV Annual Trees Cut 0 0 0 0 0 387 775 149 Price per Tree 16 16 16 16 16 16 16 16 TOTAL GROSS RETURN 0 0 0 0 0 6,192 12,400 15,268 2,451
Tree Stock 762 - - - - - - 740 119 Tree Protectors 38 - - - - - - 36 6 Cover Grass Seed 15 - - - - - - 15 2 Herbicide 49 74 64 64 64 41 18 338 54 Insecticide - 20 20 20 20 20 20 105 17 Fungicide - - - - - - 19 16 3 Amonium Sulfate - 21 32 42 42 84 49 245 39 Miscellaneous Tools 20 8 8 8 8 10 11 68 11
SUBTOTAL 883 123 125 135 135 166 122 1,563 251 Chisel 18 - - - - - - 17 3 Disk 17 - - - - - - 16 3 PTO Sprayer 5 10 - 11 11 11 10 57 9 Rotary Prunners - - - 16 16 39 31 94 15 Harrow 9 - - - - - - 9 1 Seed 9 - - - - - - 9 1 Trailer 1 - - - - - - 1 0 Mower 11 11 - 6 6 6 6 51 8 Fert. Injector - - - 2 2 2 4 8 1 Labor 466 200 306 376 385 1,071 1,424 3,746 601 SUBTOTAL 536 221 334 410 419 1,167 1,562 4,008 643 Chainsaw - - - - - 11 22 27 4 Tree Baler - - - - - 16 31 39 6 Trailer - - - - - 15 30 37 6 Tree Baler (labor) - - - - - 20 40 49 8 Trailer (labor) - - - - - 26 52 64 10 Other Harv. Labor - - - - - 144 349 404 65 SUBTOTAL - - - - - 232 524 620 100 Employee Benefits 84 36 55 68 69 193 256 674 108 Insurance 9 9 9 9 9 9 9 59 9 Farm Facilities 4 4 4 4 4 4 4 27 4

Attorney-Client Communication ENTRIX, Inc. • 55 Confidential, Privileged Information
Yr 1 Yr 2 Yr 3 Yr 4 Yr 5 Yr 6 Yr 7 NPV Annual General and Administration 56 56 56 56 56 56 56 346 56
Management 50 50 50 50 50 50 50 312 50 Fencing 8 8 8 8 8 8 8 47 8 Other 33 33 33 33 33 33 33 208 33 SUBTOTAL 244 196 215 228 230 360 432 1,673 269 Interest on Operating Cap. 96 127 166 210 255 366 152 1,200 193
General Farm Maintenance 50 16 20 23 24 58 79 236 38
Opportunity Cost 0.80 0.80 0.80 0.80 0.80 0.80 0.80 5 0.80 TOTAL COSTS 1,810 685 860 1,007 1,063 2,349 2,873 9,305 1,493 NET RETURNS -1,810 -685 -860 -1,007 -1,063 3,843 9,527 5,963 957
Primary Source: Gorman, William, Robert Grassberger, James Fisher, John Mexal, Gail Welsh, Tom Clevenger and Robert Lansford, Economic Assessment of Growing 6-7 Year Scots Pine and White Fir plantation Christmas Trees in New Mexico, Ag Experiment Station, Bulletin 745, New Mexico State University, September 1989.

Attorney-Client Communication ENTRIX, Inc. • 56 Confidential, Privileged Information
Indices
Table H-36 Producer Price Index
Year Index Inflator
1989 110.90 1.07
1990 112.20 1.06
1991 105.70 1.12
1992 103.60 1.14
1993 107.10 1.11
1994 106.30 1.11
1995 107.40 1.10
1996 122.40 0.97
1997 112.90 1.05
1998 104.60 1.13
1999 98.40 1.20
2000 99.50 1.19
2001 103.80 1.14
2002 99.00 1.20
2003 111.50 1.06
2004 123.30 0.96
2005 118.50 1.00
Source: Bureau of Labor Statistics, Farm Products, Series WPU01.

Attorney-Client Communication ENTRIX, Inc. • 57 Confidential, Privileged Information
Table H-37 Consumer Price Index
Year Index Inflator
1989 124.0 1.58
1990 130.7 1.49
1991 136.2 1.43
1992 140.3 1.39
1993 144.5 1.35
1994 148.2 1.32
1995 152.4 1.28
1996 156.9 1.24
1997 160.5 1.22
1998 163.0 1.20
1999 166.6 1.17
2000 172.2 1.13
2001 177.1 1.10
2002 179.9 1.09
2003 184.0 1.06
2004 188.9 1.03
2005 195.3 1.00
Source: Bureau of Labor Statistics, US City Average, All Items, Series ID: CUUROOOOSAO

Attorney-Client Communication ENTRIX, Inc. • 58 Confidential, Privileged Information
References
“Appendix G – Organic Beef Production for the White Mountain Apache Tribe on the Fort Apache Indian Reservation,” ENTRIX, Inc., 2006.
Boswell, Cory, and Jeff Nuss and Brian Stanton, “Appendix J - Establishing an Irrigated Hybrid Poplar Tree Farm to Supply Hardwood Fiber to Multiple markets for the White Mountain Apache Tribe,” GreenWood Resources, Inc., October 2006.
Clarkson, Lynn, “Appendix F - Investigative Organic Cropping Potential,” June 2006.
Consumer Price Index, Bureau of Labor Statistics, US City Average, All Items, Series ID: CUUROOOOSAO.
Dimitri, Carolyn and Catherine Greene, “Recent Growth Patterns in the US Organic Foods Market,” Agriculture Information Bulletin No. AIB777, Economic Research Service, United States Department of Agriculture, September 2002.
Fisher, James, “Appendix C – Suitability of Christmas Trees, White Mountain Apache Christmas Tree Enterprise,” 2006.
Glover, Charles and Ron Walser, “Appendix B - Agronomic Crop Recommendations,” 2006.
Glover, Jerry, and Herbert Hinman, John Reganold, Preston Andrews, “A Cost of Production Analysis of Conventional vs. Integrated vs. Organic Apple Production Systems,” Agricultural Research Center Publication, XB1041, Washington State University, 2002.

Attorney-Client Communication ENTRIX, Inc. • 59 Confidential, Privileged Information
Gorman, William, Robert Grassberger, James Fisher, John Mexal, Gail Welsh, Tom Clevenger and Robert Lansford, Economic Assessment of Growing 6-7 Year Scots Pine and White Fir plantation Christmas Trees in New Mexico, Ag Experiment Station, Bulletin 745, New Mexico State University, September 1989.
Granatstein, David, “Tree Fruit Production with Organic Farming Methods,” Center for Sustaining Agriculture and Natural Resources, Washington State University.
Greene, Catherine and Amy Kremen, “US Organic Farming in 2000 – 2001: Adoption of Certified Systems,” Agriculture Information Bulletin No. AIB780, Economic Research Service, United States Department of Agriculture, April 2003.
Guerena, Martin and Preston Sullivan, “Organic Alfalfa Production – Agronomic Production Guide,” Appropriate Technology Transfer for Rural Areas (ATTRA), July 2003.
Mater, Catherine, “Appendix K – Markets Evaluation for Production and Sales of Hybrid Poplar (HP) Lumber by the Fort Apache Timber Company (FATCO),” Mater Engineering, Ltd, October 2006.
Mexal, John, “Appendix D – Hybrid Poplar Suitability for Bonito Priarie,” 2006.
National Agriculture Statistics Service (NASS), Arizona Annual Statistical Bulletin, accessed online at http://www.nass.usda.gov/Statistics_by_State/Arizona/index.asp
National Agriculture Statistics Service (NASS), Colorado Annual Publication, accessed online at http://www.nass.usda.gov/Statistics_by_State/Colorado/Publications/Annual_Statistical_Bulletin/index.asp
National Agriculture Statistics Service (NASS), New Mexico Annual Publication, accessed online at http://www.nass.usda.gov/nm/nmbulletin/57_04.pdf
Oberholtzer, Lydia and Carolyn Dimitri and Catherine Greene, “Price Premiums Hold on as US Organic Produce Market Expands,” Outlook Report No. VGS30801, Economic Research Service, United States Department of Agriculture, May 2005.
Organic Business News Price lists, June 2006 – September 2006.

Attorney-Client Communication ENTRIX, Inc. • 60 Confidential, Privileged Information
Personal Communication with Brian Quigley, Cascadian Farms, July 17, 2006.
Personal Communication with Lynn Clarkson, Clarkson Grain Company, December 12, 2005.
Personal Communication with Scott Raita, Tim Mitchell’s Christmas Trees, January 3, 2006.
Pollack, Susan and Agnes Perez, “Economic Research Service, Fruit and Tree Nut Yearbook,” Market and Trade Economics Division, Economic Research Service, US Department of Agriculture, October 2005, FTS-2005.
Producer Price Index, Bureau of Labor Statistics, Farm Products, Series WPU01.
Swenson, Andrew, Brad Brummond and Ron Haugen, Farm Management Planning Guide, Organic Crop Budgets for South Central North Dakota, Section VI, Region 5, January 2003.
University of Arizona Extension, Arizona Field Crop Budgets, accessed online at http://ag.arizona.edu/AREC/ext/budgets/counties.html.
University of California, Davis, Department of Agriculture and Resource Economics, Cost and Return Studies, accessed online at http://www.agecon.ucdavis.edu.
Walser, Ron, “Appendix A - Suitability Report for Tree Fruits, Berries, and Other Fruits and Vegetables,” 2006.
Yates, Scott, “Wheat Growers find Organic is Worth the Hassle”, Capital Press, February 10, 2004.

APPENDIX I
Organic Dairy Production for the White Mountain Apache Tribe on the Fort Apache Indian Reservation
ENTRIX
FEBRUARY 2007

Appendix I - Organic Dairy Production for the White Mountain Apache Tribe on the Fort Apache Indian
Reservation
Prepared for White Mountain Apache Tribe
White River, AZ
By ENTRIX, Inc.
12009 N.E. 99th Street, Suite 1410 Vancouver, WA 98682-2497
January 2007

Attorney-Client Communication ENTRIX, Inc.● I-i Privileged, Confidential Information
Table of Contents
Introduction I-1
Background ..........................................................................................................................................I-1 Current Cattle Production.....................................................................................................................I-1 New Opportunities ...............................................................................................................................I-2 Overview of Organic Dairy Start-Up ...................................................................................................I-2
Assumptions I-4
Production Process I-5
Organic Production Requirements .......................................................................................................I-5 Replacement Heifer Operation .............................................................................................................I-6 Milking Cow Operation........................................................................................................................I-6 Vertically Integrated Processing Operation..........................................................................................I-6 Relationship with Crop Production ......................................................................................................I-7
Marketing I-9
The Tribe as Member of a Cooperative................................................................................................I-9 Direct Marketing Channels.................................................................................................................I-10
Returns I-11
Costs of Production ............................................................................................................................I-11 Feed..............................................................................................................................................I-11 Labor............................................................................................................................................I-11 Herd Health..................................................................................................................................I-12
Returns to the Operation I-13
Dairy Operation Challenges I-14
Conclusion I-16
References I-17

Attorney-Client Communication ENTRIX, Inc.● I-1 Privileged, Confidential Information
Introduction
Background
The White Mountain Apache Tribe is exploring agricultural enterprises that are suitable for the climate of the Fort Apache Indian Reservation (Reservation) and that meet the goals and objectives of the White Mountain Apache Tribe (Tribe). The Tribe seeks to improve the economic conditions of the Reservation through sustainable agriculture and growth of new markets.
The Reservation, home to the White Mountain Apache Tribe, is located 194 miles northeast of Phoenix in east-central Arizona. The Reservation lands comprise approximately 1.6 million acres in Navajo, Apache and Gila counties. Terrain and climate vary widely. This diversity is largely due to differences in elevations on the Reservation. These climate disparities range from mountainous, forested land at 11,000 feet to desert foothills at 3,000 feet in the Salt River Canyon area. Much of the Reservation land is currently used as rangeland; however, some of the rangeland would need to be converted to pasture lands with irrigation to support a dairy herd.
Current Cattle Production
The Tribe grazes beef cattle on their Reservation rangeland. The current beef production process includes cow/calf through finishing operations. Beef cattle production on the Reservation is described in a companion report from ENTRIX, Inc. titled, "Organic Beef Production for the White Mountain Apache Tribe on the Fort Apache Indian Reservation (see Appendix G).

Attorney-Client Communication ENTRIX, Inc.● I-2 Privileged, Confidential Information
The Tribe does not currently have any dairy cattle. The infrastructure for a dairy operation is not currently in place.
New Opportunities
Currently, the Tribe is considering the option of cultivating organic feed crops on Reservation lands; this business opportunity would, in turn, stimulate new growth opportunities for cattle production. The Reservation is an optimal location to produce organic crops, including feed crops which can provide sustenance for raising organic dairy cattle. Reservation lands have the potential to support organic production of these feed crops: alfalfa hay, grain corn, and oats (and possibly soybeans to be used as a protein supplement). The production of these organic feed crops would enable the Tribe to feed a dairy herd an organic diet that is produced almost entirely on the Reservation. This proposed organic crop production would result in a reduction of transportation costs and other marketing expenses that would otherwise be included in the price of organic feed purchased from an outside supplier.
While this new opportunity has market potential for the Tribe, there is an important consideration to address: distance to fluid milk processors. Due to the distance between the Reservation and any fluid milk processing plants, the Tribe would need to have an on site, integrated production system in place to post-process the fluid milk from their dairy cattle operation. This integrated system could consist of the Tribe producing ice cream, yogurt, butter, and/or cheese in order to make a dairy operation not only possible, but also profitable.
Overview of Organic Dairy Start-Up
There are several key factors that need to be considered during the start-up of an organic dairy. A dairy is a capital-intensive business. Many investments are necessary to initiate and sustain this type of operation. Examples of these capital investments include: fencing for pastures; hay barns; grain silos; a feed mill structure; loafing barns; a milking parlor; an isolated barn area for calves; a holding pond system; an irrigation system for the pastures; several different types of vehicles for transporting cattle, milk products, and equipment; and fuel tanks. This is not an exhaustive list. It is assumed and recommended that the Tribe's proposed organic dairy be developed in stages. Each stage would be initiated and completed in accordance with a schedule and timeline. It is expected that the Tribe's organic dairy would involve four essential tasks in the start-up stage:
1. Develop pastures on the Reservation. Approximately 640 acres of pasture would be required for a herd of 200 cows. To irrigate this amount of acreage, the Tribe will need a center-pivot irrigation system.
Attorney-Client Communication ENTRIX, Inc.● I-3 Privileged, Confidential Information
2. Install fencing around the perimeter of the pasture, dairy facility, and elsewhere as needed. This will include cross-fencing for pasture rotations.
3. Construct the dairy barns and other related structures. The dairy cows will need shelter and protection due to the Reservation's climate and elevation. Site locations should be on high ground, where the drainage is good.
4. Design and construct a holding pond system (Jimenez 2006a).

Attorney-Client Communication ENTRIX, Inc.● I-4 Privileged, Confidential Information
Assumptions
At the time the organic dairy operations are initiated, the Tribe's herd of dairy cattle would consist of 200 head of bred heifers—certified organic if available. The cattle breeds considered most suitable for the Reservation's dairy operation would be smaller breeds with higher butter fat content, such as Jersey, Guernsey, or Ayrshire cattle. To reduce the costs involved with maintaining bulls for breeding, artificial insemination would be the breeding method utilized in the dairy operations on the Reservation.
It is assumed that the dairy operation on the Reservation would be vertically integrated. This vertical integration would include replacement heifers, milking cows and dry cows, and a value-added dairy product processing plant.

Attorney-Client Communication ENTRIX, Inc.● I-5 Privileged, Confidential Information
Production Process
Organic Production Requirements
According to information from the Sustainable Agricultural Research and Education Institute (SARE), there are explicit, national organic standards that must be met in order for a livestock herd to be certified organic. These standards apply to animals raised for milk, meat, eggs, and other animal products. In general, the standards emphasize that only all-natural substances are allowed in organic production. The standards for livestock certified as organic include the following stipulations:
1. Animals raised for slaughter must be managed under organic practices from the last third of gestation;
2. Feed products for the livestock must be 100 percent organic, but certain vitamin and mineral supplements are allowed;
3. No hormones for growth promotion or antibiotics for any reason are to be given to any organic animal, but preventative management (including vaccines) will be used to keep animals healthy;
4. Treatment of sick or injured animals cannot be withheld, but animals treated with medication cannot be sold as organic; and
5. All organic livestock must have regular access to pasture throughout the production process.1
1 SARE 2003.
Attorney-Client Communication ENTRIX, Inc.● I-6 Privileged, Confidential Information
Replacement Heifer Operation
As the market for organic replacement heifers is very limited, most organic dairy operations raise replacement heifers for their own use. It is recommended that the Tribe follow this industry practice and include plans for raising replacement heifers in their proposed organic dairy operation. Typically, the heifer replacement factor is about 20 percent per year. Assuming that the Tribe has a herd of 200 head2, 40 heifers would be retained each year as replacements; the remaining heifers and bull calves would be sold as organic, if the market exists, or in the conventional market.
The initial herd of bred heifers ("springers") would need to be purchased from Northern Colorado, Northern California, or Utah, as the adaptation of the animals to cooler climates and higher elevations is critical to the success of the Tribe's preliminary herd. In accordance with SARE, the original herd of bred heifers on the Reservation must be fed and raised organically during the last 90 days of their gestation period in order to be certified organic. For their subsequent gestation period, these springers will be fed and raised organically throughout their entire gestation periods, rather than the 90-day timeframe initially imposed for the first gestation.
Milking Cow Operation
An optimal organic dairy herd size is considered to be 200 to 250 milking cows3. Therefore, the proposed dairy herd on the Reservation would consist of approximately 170 milking cows and 30 dry cows at any given time during the year. Milking of the dairy cows would occur twice daily, on a year round basis.
Vertically Integrated Processing Operation
With the location of any existing, fluid milk processing centers at least 250 to 300 miles away from the Reservation, the Tribe would need to consider a value-added processing operation on the Reservation. The Tribe's dairy products processing center could include product lines for ice cream, butter, yogurt, and/or cheese. The primary markets for these value-added products would be the metropolitan areas of Phoenix and Tucson in the state of Arizona, as
2 Jimenez 2006a.
3 Jimenez 2006a.

Attorney-Client Communication ENTRIX, Inc.● I-7 Privileged, Confidential Information
well as the Albuquerque metropolitan area in New Mexico. Owning and operating a vertically integrated operation for the processing of dairy products from the Tribe's dairy operation is the most feasible option for realizing profits in the organic dairy business4.
Relationship with Crop Production
The organic dairy operation will be most successful if the Tribe’s organic crop production is also successful. The relatively low cost of organic feed inputs to the dairy operation, when the organic feed crops are produced on the Reservation, enables the Tribe to “purchase” the feed at cost. This action results in lower total costs and higher associated returns for both the dairy production and the Tribal operations as a whole. As stated previously, the organic crops proposed for feeding and sustaining the dairy cattle operation are as follows: alfalfa hay, grain corn (and corn silage), oats, and potentially soybeans as a protein supplement. The proposed organic dairy operation would require the feed crops in the amounts and associated acreage shown in Table I-1.
Table I-1 Organic Feed Crop Requirements
Proposed Crop
Unit of Measurement
Feed Requirement
Acreage Requirement
Pasture Land Acres 6405
Organic Alfalfa Hay Tons 370 130
Organic Grain Corn Thousand Bushels 6 43
Organic Corn, Silage Tons 123 6
Organic Oats Thousand Bushels 5 64
Organic Soybeans Thousand Bushels TBD* TBD*
Total Acreage 883 Table Source: Personal communication with Del Jimenez,August 3, 2006. *To be determined, pending protein supplementation needs of cattle.
The feed requirement for organic soybeans is unclear at this time, pending the determination of the amount of protein supplementation (if any) required in the grain mixture for the dairy cattle operation. If the Tribe begins producing a soybean crop for this purpose, however, the organic soybean harvest could be used as an input at cost.
4 Jimenez 2006a. 5 Personal communication with Del Jimenez, August 3, 2006.

Attorney-Client Communication ENTRIX, Inc.● I-8 Privileged, Confidential Information
By "purchasing" organic soybean feed at cost, the Tribe would no longer be required to purchase this protein supplement from an outside organic producer or supplier. Therefore, operating costs for dairy cattle production on the Reservation could potentially decline from estimates developed in the current analysis. In turn, this action will generate associated higher returns for the Tribe's organic dairy operation.

Attorney-Client Communication ENTRIX, Inc.● I-9 Privileged, Confidential Information
Marketing
There are several marketing methods available for marketing organic dairy products to customers. Dairy products are a value-added activity from dairy cattle production on the Reservation. The two most commonly used marketing methods—organic dairy cooperatives and direct marketing—are addressed in this section.
It is not clear at this time if there is a dairy cooperative through which the Tribe could market the dairy products it would choose to produce (such as cheese, ice cream, butter, and yogurt). If the Tribe decides to pursue the development of a dairy products processing operation, an appropriate marketing method for promoting the Tribe's dairy products would be analyzed and selected at that time.
The Tribe as Member of a Cooperative
Agricultural cooperatives are formed by farmers or ranchers to achieve some or all of the advantages of large-scale marketing. Marketing costs are minimized if the Tribe becomes a member of an organic dairy cooperative, which is one of the most common methods of marketing organic foods. Under this method, marketing costs would primarily consist of transportation costs related to hauling organic milk from dairy cows to a fluid milk processing facility (if outside of the Reservation) and/or transporting organic dairy products (cheese, ice cream, butter, and yogurt) from the Reservation to market. If the Tribe does not become a member of an organic dairy cooperative, additional direct marketing costs (see below) would need to be incorporated into the enterprise budget as it is developed.

Attorney-Client Communication ENTRIX, Inc.● I-10 Privileged, Confidential Information
Direct Marketing Channels
Direct marketing is an alternate marketing method for organic producers who do not join cooperatives. The Tribe could select from one of the following direct marketing channels (or even a combination thereof) to market its organic milk and/or organic dairy products:
1. Promote and sell milk and/or milk products directly to wholesalers at the farm gate (in this case, the Reservation);
2. Set up a web site on the Internet for online product promotion and sales; and/or
3. Promote and sell milk and/or milk products directly to local retailers at the farm gate (in this case, the Reservation).
The first direct marketing option involves the Tribe selling organic milk and/or organic dairy products to general line grocery wholesalers, general line foodservice wholesalers, or both. General line grocery wholesalers buy products from the producer, and take title to the product (which they handle). General line foodservice wholesalers serve restaurants, hospitals, schools, and hotels; these types of wholesalers handle products specifically for foodservice use.
The second direct marketing option (Internet sales) would require a significant investment in technology and fulfillment resources before any online sales could occur. Presently, the Tribe does not have this type of business venture in place.
The third direct marketing option can be advantageous as many retailers are now stocking organic foods in their grocery stores due to increased consumer demand. Potential retail customers for the Tribe could include national and regional retailers of organic dairy (cheese, ice cream, butter, and yogurt), such as Safeway® Inc., Costco Wholesale Corp., Whole Foods Market®, Wild Oats Natural Marketplace, and Fred Meyer (a division of Kroger Co.), as well as many local retail markets.

Attorney-Client Communication ENTRIX, Inc.● I-11 Privileged, Confidential Information
Returns
Costs of Production
This section addresses the costs of organic milk production for the proposed dairy operation on the Reservation. While some of the Tribe's costs of producing organic milk and associated dairy products are expected to be higher than those associated with conventional milk production, other costs are reduced.
Feed
Organic feed costs are generally higher due to the higher costs associated with producing organic feed crops in accordance with organic certification standards. As the Tribe is proposing to cultivate the majority of the organic feed crops on Reservation lands, however, this cost differential may decrease. Even so, mineral and vitamin supplements would need to be purchased, and this cost would need to be factored in as well.
Labor
Organic milk production is also more labor intensive than conventional dairy operations. For example, there are higher costs associated with such labor intensive tasks as manure removal, bedding replacement and herd health monitoring. Therefore, it is likely that the Tribe's proposed organic dairy operation would incur an increased cost in the expense of hired labor. This cost increase could be as much as an additional 25 percent to 30 percent above conventional hired labor costs.

Attorney-Client Communication ENTRIX, Inc.● I-12 Privileged, Confidential Information
Herd Health
The Tribe's adherence to organic certification standards for its cattle means that medical treatment options are limited for any ailing dairy cows on the Reservation; therefore, taking preventative measures to reduce or eliminate the occurrence of mastitis and bovine diseases is crucial to overall health of the herd.6 Veterinary costs could increase in some areas (such as disease prevention), yet decrease in other areas. For example, organic farming does not allow any growth hormones, pesticides, or herbicides to be used, so these particular costs would be eliminated.
In summary, the variances in the costs of feed crops, labor, and herd health (as described above) and the conceptual nature of the dairy operation, make it difficult to assess the true cost comparisons between organic and conventional dairy production at present. If the Tribe decides to actively pursue an organic dairy operation, however, a comprehensive assessment of the costs to be included in an enterprise budget would be completed at that time.
6 BCMAFF 2002.
Attorney-Client Communication ENTRIX, Inc.● I-13 Privileged, Confidential Information
Returns to the Operation
While the cost of inputs to produce organic dairy products is higher than that of conventional dairy production, so are the returns. Irrelevant of the type of marketing deemed appropriate by the Tribe, the returns to the producer of organic diary products (in this case, the Tribe) can be expected to be significantly higher than the returns to conventional dairy producers. For example, current prices indicate that retailers charge a price premium of between $1.00 and $1.50 to consumers purchasing organic butter and organic cheese products, above the price of non-organic butter and cheese products.7 As with the costs of production, a return to the operation will be calculated, and a comprehensive enterprise budget will be completed, if the Tribe decides to pursue an organic dairy operation in the future.
7 Safeway 2006.

Attorney-Client Communication ENTRIX, Inc.● I-14 Privileged, Confidential Information
Dairy Operation Challenges
Presently, the Tribe's proposal to establish an organic dairy herd and develop an organic dairy operation on the Reservation is in the conceptual stage. At this time, it is appropriate and essential to review any constraints and concerns that could impact the success of such an endeavor. This analysis has identified six primary challenges facing the Tribe in regard to the proposed dairy cattle production and dairy facilities on the Fort Apache Indian Reservation. They are as follows:
1. Lack of Dairy Infrastructure;
2. Environment for Raising Dairy Cattle;
3. Distance to Milk Processing and Customer Markets;
4. Higher Capital Investment at Inception;
5. Organic Certification Requirements; and
6. Longer Start-Up Phase Prior to Returns.
First, there is currently no dairy operation or similar infrastructure in place on the Reservation; therefore, the Tribe would need to make a significant and high-cost, capital investment prior to the establishment of a dairy cattle operation. Second, areas with harsh winters, such as the climate of the Reservation, can make it difficult for dairy cattle to thrive.
Third, the transportation costs from the Reservation to fluid milk processors would most likely be prohibitive, as the distance would be 250 to 300 miles away to the nearest commercial facility. Therefore, as mentioned previously, the Tribe would need to add a value-added dairy product processing operation on site, to vertically integrate the dairy. As stated earlier, the vertical integration would include the production of milk products such as butter, yogurt, ice cream, and/or cheese. Fourth, adding a dairy product processing facility would, in turn, require additional capital investment, as well as an increase in operating costs and marketing abilities and expenses.
Fifth, the likelihood of snow on the pasture lands for several months of the year may (or may not) create a problem meeting the cattle grazing requirements that are a prerequisite to the
Attorney-Client Communication ENTRIX, Inc.● I-15 Privileged, Confidential Information
dairy operation receiving organic certification. Finally, an organic dairy would usually require two years in production to become established, and then it would take an additional three years to obtain a return on the initial investment.
The constraints and concerns addressed in this section do not prevent the Tribe from moving forward with plans to establish an organic dairy herd and organic dairy operation; however, they provide reference points for the Tribe to use in weighing the advantages and disadvantages of this business opportunity. This section is included to provide the Tribe an opportunity to address problematic issues before they arise and provide a basis for decision making as to: 1) whether or not to pursue an organic dairy operation on the Reservation; and 2) when to begin the start-up operation if a "yes" decision is made.
Attorney-Client Communication ENTRIX, Inc.● I-16 Privileged, Confidential Information
Conclusion
An organic dairy operation on the Reservation could provide an economic development opportunity for the Tribe. However at this point it is only conceptual in nature due to several limiting factors that would need to be addressed prior to initiating such a business venture. This report provides an informational basis for potential future discussions.

Attorney-Client Communication ENTRIX, Inc.● I-17 Privileged, Confidential Information
References
British Columbia Ministry of Agriculture, Food, and Fisheries (BCMAFF). 2002. Planning for Profit: Transition to Certified Organic Dairy (Fluid) Production – 75 Milking Cow Herd on 50 Acres. Fall.
Jimenez, Del. 2006a. Personal communication, telephone call August 3.
Jimenez, Del. 2006b. Personal communication, email dated August 1.
Jimenez, Del. 2006c. Personal communication, email dated August 23.
Jimenez, Del. 2006d. Personal communication, email dated August 29.
Safeway, Incorporated. 2006. Online shopping, Butter Sticks, Organic Cheddar Cheese, Brick and Loaf Cheddar Cheese. Available at: http://shop.safeway.com/superstore/ accessed September 5, 2006.
Sustainable Agriculture Research and Education (SARE). 2003. Transitioning to Organic Production. Available at: www.sare.org/bulletin/organic.
University of Idaho College of Agriculture Cooperative Extension System. 2002. 2002 Idaho Livestock Costs and Returns Estimate, Jersey Dairy Enterprise Annual Cow Budget, Revised December.
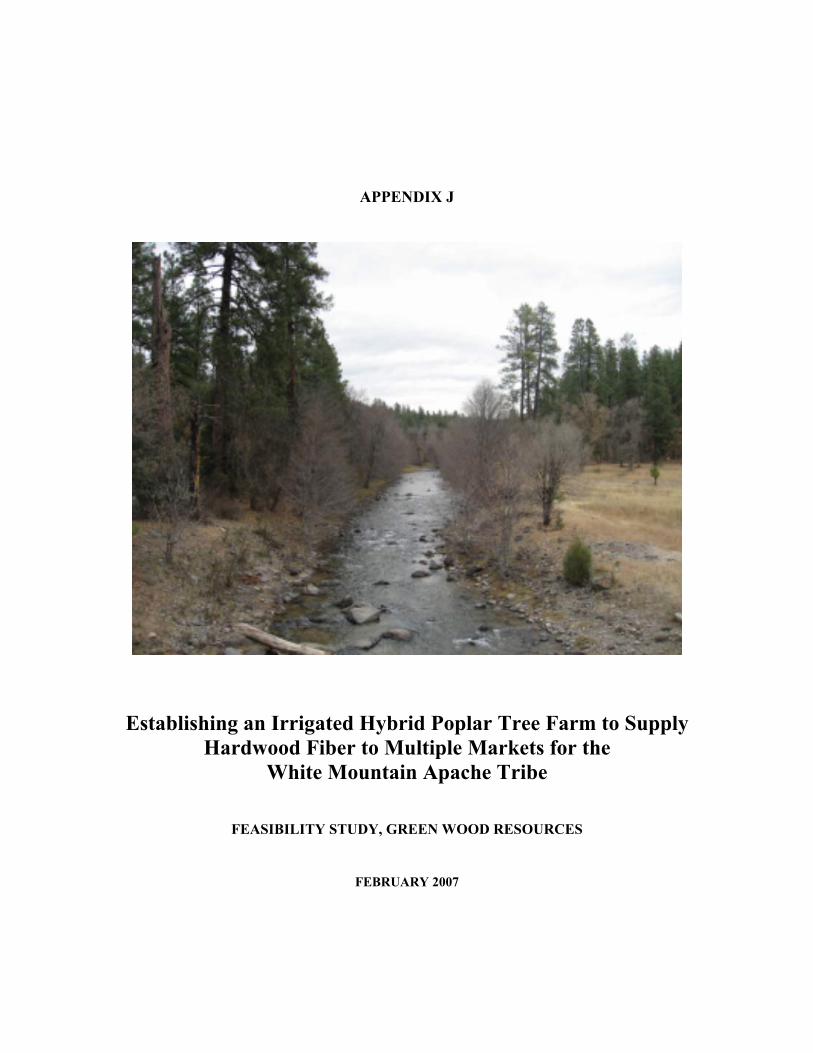
APPENDIX J
Establishing an Irrigated Hybrid Poplar Tree Farm to Supply
Hardwood Fiber to Multiple Markets for the White Mountain Apache Tribe
FEASIBILITY STUDY, GREEN WOOD RESOURCES
FEBRUARY 2007
Appendix J: Establishing an Irrigated Hybrid Poplar Tree Farm to Supply Hardwood Fiber to Multiple
Markets for the White Mountain Apache Tribe Feasibility Study
Prepared for ENTRIX, Inc.
12009 N.E. 99th Street, Suite 1410 Vancouver, WA 98682-2497
By GreenWood Resources, Inc.
Jeff Nuss, President Brian Stanton, Managing Director
Cory Boswell, Financial Analyst 121 SW Salmon Street, Suite 1020
Portland, Oregon 97228
January 2007

Attorney-Client Communication ENTRIX, Inc. ● J-i Privileged, Confidential Information
Table of Contents
Introduction J-1
Review of Land Evaluation and Soil Survey J-3
Background ......................................................................................................................................... J-3 Bonito Prairie ...................................................................................................................................... J-4 Soils Survey......................................................................................................................................... J-4
Plant Material Evaluation and Strategy J-7
Background ......................................................................................................................................... J-7 Short term selection strategy ............................................................................................................... J-8 Mass Multiplication and Propagation................................................................................................ J-10 Long Term Selection Strategy........................................................................................................... J-11 Growth and Yield .............................................................................................................................. J-12
Operational Cost Analysis J-14
Site Preparation ................................................................................................................................. J-14 Establishment .................................................................................................................................... J-15 Crop Care .......................................................................................................................................... J-15 Pruning .............................................................................................................................................. J-18
Tree Utilization at Harvest J-19
Harvesting, Processing & Transportation Cost Analysis .................................................................. J-20
Market Analysis J-22
Four Corners Region Forest Products Industry ................................................................................. J-22 Markets for Hybrid Poplar ................................................................................................................ J-23 Carbon Credits................................................................................................................................... J-25
Financial & Cash Flow Analysis J-27
Conclusions J-29
Appendix A: Rates Activities A-1
Rates & Activities...............................................................................................................................A-1
Appendix B: Site Preparation, Planting and Crop Care Prescriptions B-1

Attorney-Client Communication ENTRIX, Inc. ● J-ii Privileged, Confidential Information
Appendix C: Four Corners Timber Wood Products Industry C-1
Timber received by Four Corners primary forest products industry by ownership class and product, 2002. ................................................................................................................................................... C-1 Destination and sales value of Four Corners primary wood products and mill residues, 2002.......... C-2
Appendix D: Farm major assumptions and financial summary D-1
Appendix E: Unadjusted Net Cash Flow E-1

Attorney-Client Communication ENTRIX, Inc. ● J-1 Privileged, Confidential Information
Introduction
GreenWood Resources (GWR) has been directed by ENTRIX, Inc., under a subcontract from the White Mountain Apache Tribe (Tribe), to report on the feasibility of establishing an irrigated hybrid poplar tree farm (Farm) on the Fort Apache Indian Reservation (Reservation). This Farm would be part of a larger irrigated agriculture project (Project) that would encompass all the “Practicably Irrigable Acres” (PIA) on the Reservation. While a number of crops are being considered for acreage in the Project, hybrid poplar has been identified as possible crop due to a number of potential benefits, some which include:
• Hybrid poplar has wide range of site suitability and can be grown on land that would be considered marginal for row or forage crops.
• Most of the site preparation and crop care activities associated with hybrid poplar production are similar to traditional farming techniques so that expertise and equipment could be leveraged with the agricultural industry in the area.
• Logs from a hybrid poplar tree farm could supply existing sawmills operated by the Tribe’s forest industry, Fort Apache Timber Company (FATCO).
• Residual harvest biomass could be used to supply biomass energy projects proposed in the area.
• Hybrid poplar tree farm can be managed to take advantage of the emerging market for carbon credits.
The success of a hybrid poplar tree farm relies upon a number of aspects which are addressed in this study including:
• Site and soil suitability of Bonito Prairie.
• Selection and supply of appropriate plant material.
• Development of reasonable growth and yield estimates.

Attorney-Client Communication ENTRIX, Inc. ● J-2 Privileged, Confidential Information
• Analysis of operational costs.
• Analysis of harvesting, processing and transportation costs.
• Analysis of market opportunities.
• Analysis of manufacturing costs.
• Financial and net cash flow analysis.
From the outset, it is important to recognize that the establishment of a hybrid poplar tree farm on the Reservation would require a specialized management team. The tree improvement, stand establishment, crop care, irrigation and harvesting of short rotation hardwoods involves some aspects of agriculture and forestry, but is a discipline unique unto itself. Heavy reliance on either traditional agriculture or forestry would not lead to a successful project. A management team including people with specific experience and expertise in hybrid poplar production would be necessary. GreenWood Resources would be prepared to provide the oversight, training and development of a specialized tribal tree farm management group through a long-term partnership or joint venture. This process would provide professional development opportunities for tribe members with interests in agriculture, forestry and natural resources.

Attorney-Client Communication ENTRIX, Inc. ● J-3 Privileged, Confidential Information
Review of Land Evaluation and Soil Survey
Background
The success of a hybrid poplar plantation operation at Bonito Prairie is primarily dependent upon the edaphic and climatic characteristics of the site. Moreover, the probability of achieving success can be maximized by correctly matching plant material – both hybrid type and individual varieties to site conditions. Varieties are developed in consideration of site factors so as to optimize growth and yield while minimizing the risk associated with plantation operations. Similarly, cultivation and farming prescriptions will be developed in consideration of the same site effects to allow for ease of plantation management and maintenance and vigorous growth and development. Universally, successful poplar operations are dependent upon intensive site preparation, clean cultivation throughout the establishment phase of stand development, control of insects, pathogens, and mammals, and the application of optimum levels of plant nutrients and soil moisture.
The development of hybrid poplar operations have reached their zenith in North America in Oregon and Washington along the lower Columbia River floodplain west of the Cascade Mountains and, east of the Cascades, in the arid mid-Columbia River basin.1 Annual precipitation west of the Cascades varies from 40 to 80 in. The average minimum January and maximum July temperatures are 0 and 75 F, respectively. Extremes in winter low and summer high temperatures are 10 and 100 F, respectively. The length of the frost-free period can last 165 to 220 days. The climate is moderately humid with cloudless dry summers and wet, cool winters. Soil texture varies between silty- and loamy clays. Drainage is often moderate to poor. Available water capacity is 10 to 14 inches in most cases. Depth to water table varies 12 to 60 inches. Soil reaction ranges from pH 4.0 to 5.7.
1 Stanton, B. J., J. A. Eaton, J. D. Johnson, D. E. Rice, W. R. Schuette, B. W. Moser, 2002. Hybrid Poplar in the Pacific Northwest: The Effects of Market-Driven Management. Journal of Forestry. 100: 28-33.

Attorney-Client Communication ENTRIX, Inc. ● J-4 Privileged, Confidential Information
East of the Cascades, meager precipitation (9 to 12 inches annually) makes irrigation an absolute necessity.2 The frost-free period lasts 160 to 200 days and late-sprint and early-fall frosts are common. The average minimum January and maximum July temperatures are 25 and 90 F, respectively. The extreme summer high temperature is 109 and the extreme winter low temperature is 0 F. The growing season is typically hot, dry, and windy with gusts commonly occurring at 40 miles per hour. Soils are deep, coarse sandy loams with a neutral soil reaction.
Bonito Prairie
Annual precipitation at the project site is assumed to be in the neighborhood of 14 – 19 inches per year with most falling in the latter part of the growing season. The length of the frost-free period is assumed to vary 120 to 160 days. Spring frost can occur as late as the last week of May. Early fall frosts can occur during the end of September. The average minimum January temperature approximates – 23 F. The average maximum July temperature is about 90 F.
Soils Survey
The soils of Bonito Prairie have been reported in a recent survey of the site.3 Two major types predominate: Lithic Argiustoll and Typic Argiustoll. The former soil type accounts for approximately one third of the project site at Bonito Prairie while the latter accounts for about 60%. The remaining four percent is occupied by a third soil type, Typic Chromustert. The topography of the land where the two main soil types occur is nearly level but with sloping areas up to inclines of 50%. Project success will be contingent upon full utilization of the areas level terrain for the efficiency of mechanized site preparation, irrigation maintenance, cultivation, and harvest operations. GreenWood has successfully managed all of these phases of plantation management on slopes up to 12% at its poplar farm at Paterson, Washington. It would be necessary to map the steeper side slopes along with the rock outcrops at the beginning of project execution.
2 Stanton, B. J. 1987. Establishing and maintaining short-rotation, intensively culture plantations of hybrid cottonwood in the Pacific Northwest. Report submitted to the Department of Energy. 29 pp.
3 Buchanan, B. 2006. Soil Survey of the Bonita Prairie White Mountain Indian Reservation. Report Prepared for White Mountain Apache Indian Reservation, DRAFT Copy. 11 p.

Attorney-Client Communication ENTRIX, Inc. ● J-5 Privileged, Confidential Information
The texture of the soils at Bonito Prairie varies from clay to clay loams. Clay contents in the upper layers have been reported as 25 to 60%. Areas where GreenWood has managed or tested hybrid poplar are characterized by soils for which the particle size analysis have shown clay components of 6% (mid Columbia River basin – sand texture), 8% (Nisqually basin – loam)16% (Caldwell, Idaho – sandy loam), 20% (Willamette Valley foothills of the Coast Range – silt loam texture), 24% (lower Columbia River floodplain – loam texture), 24% (Farmington, New Mexico – sandy clay loam), and 24% (eastern Washington Palouse – silt loam),. It would be necessary to account for the higher clay content of the project site with appropriate varietal selections that would provide for good root penetration and wind firmness in soils of finer texture. Furthermore, during irrigation design, infiltration rates - especially on the steeper side slopes – would need to be given due consideration. Site preparation techniques would also need to be developed in consideration of maintaining the existing drainage capacity of the clay based soils; for instance deep ripping may be counterproductive. Similarly, cultivation and tending practices would be adjusted to account for the shrinking/swelling characteristics of vertisol soils as well as the avoidance of compaction.
The deeper soils of the Typic Argiustoll should be targeted in plantation development.4 Edaphic characteristics can be compared to those where GreenWood grows poplar with good results:
• The reported effective rooting depth of the Typic Argiustoll soil is 40 to 48 inches. The water supplying capacity is 12 to 16 inches. The effective rooting depth along the lower Columbia River floodplain where poplar is successfully grown is 60 inches. It is deeper still in the area of the mid-Columbia River basin where poplar is grown for high yields under irrigation.5
• The water supply capacity of the Typic Argiustoll soil is 12 inches on the lower Columbia floodplain and 4 inches in the arid mid-Columbia River basin.
• No data have yet to be reviewed on native soil fertility levels. These will need to be assessed to develop fertilizer prescriptions. However, organic matter contents (1-2%) are lower than what is typical of soils where poplar is grown without any nutrient applications at all (1 – 15%).
Climatic factors that are of potential concern include the frequency of late spring frosts and early autumnal frosts that may occur with some regularity at this elevation. This would need to be taken into account with appropriate varietal selection. The frequency of cyclonic storms
4 Buchanan, B. 2006. Soil Survey of the Bonita Prairie White Mountain Indian Reservation. Report Prepared for White Mountain Apache Indian Reservation, DRAFT Copy. 11 p.
5 Donna Townsend, Resource Manager, Sandpiper Tree Farm, GreenWood Resources, personal communication, July, 2006.
Attorney-Client Communication ENTRIX, Inc. ● J-6 Privileged, Confidential Information
should be studied in view of the potential for plantation wind throw; wind firmness in high clay content soils should also be considered during site preparation, cultivation, and irrigation design and, especially during varietal selection. Related too would be an evaluation of the historic record of hail storms occurring during the growing season.
No unusual biotic concerns – insect and diseases – are expected since native populations of related species - Fremont poplar or willows - have been observed in the vicinity of Bonito Prairie. Melampsora leaf rust could be a problem given the prevalence of alternate coniferous hosts (juniper and pine) in the surrounding area.

Attorney-Client Communication ENTRIX, Inc. ● J-7 Privileged, Confidential Information
Plant Material Evaluation and Strategy
Background
The success of the Arizona project will be primarily dependent upon the choice of superior plant material. Breeding and selection of Populus has a lengthy and distinguished history that began with a large-scale commercial hybridization programs in eastern United States and Canada in the period 1920 to 1930. Successful breeding programs have since been initiated in Europe, Asia and North America in many cases relying upon non-recurrent, first-generation (F1) interspecific hybridization.6 Hybridization brings the variation encompassed by distinct species into a single generation that often exhibits hybrid vigor for yield. Although controlled reproduction may be difficult when some species are hybridized, the ease with which superior individual selections can be vegetatively propagated as clonal varieties promotes F1hybridization as the breeding method most in vogue. Advanced generation breeding into the second generation (F2) is sometimes accompanied by diminished vigor most likely due to a reduction in heterozygous loci or the disruption of co-adapted linkage groups that occurs during F1 gametogenesis, although transgressive segregants are occasionally found. Backcross breeding is used to introduce a single, highly heritable trait from a donor species to improve an otherwise suitable recurrent parent. For example, in the North Central region of the United States, P. deltoides x P. suaveolens F1 hybrids are crossed (back) to unrelated P. deltoides selections in an attempt to introduce the strong adventitious rooting ability of P. suaveolens into the recurrent P.deltoides parent that shows superior resistance to Septoria canker. (F1 P. deltoides x P. suaveolens hybrids are themselves highly canker susceptible.)
Given that the entire range of genetic variation can be exploited by clonal selection, a very significant advantage compared to other species that rely upon seedling-based family
6 Stanton, B. J. 2004. Poplars. The Encyclopedia of Forest Sciences. Elsevier, Ltd. 1441-1449.

Attorney-Client Communication ENTRIX, Inc. ● J-8 Privileged, Confidential Information
selection programs, Populus programs have frequently focused solely on the selection of superior individuals as opposed to efforts to improve the average performance of whole populations. The traits targeted for Populus improvement are usually the agronomic ones of yield, stem form, pest resistance, tolerance of cold and drought, wind firmness and adventitious rooting. All have exhibited pronounced rates of genetic variation and have responded well to clonal selection programs. Field evaluations typically involve a multi-stage process to sequentially refine large populations until a group of elite selections has been identified. Other selection criteria may include wood and fiber properties for the veneer and sawn wood industries and the calorific quality of biomass for the heat- and power-conversion industries.
An imperative for production programs that incorporate clonal stands is a diverse pool of operational selections to help minimize the risk of plantation failures due to unforeseen climatic and biotic events. Most plantation programs are therefore allied with an ongoing hybridization program that continuously feeds new selections into production use. Continuous turnover of the commercial pool of clones is a safeguard against catastrophic failures due to co-evolution of associated pests. Poplar clonal propagation in the southwestern United States does not have a lengthy history of testing and deploying superior materials. The poplar native to Arizona’s arid environments is Fremont poplar (Populus fremontii).
The plant material development strategy should encompass both short and long term components. The purpose of the short-term strategy is to identify superior varieties from elite populations of varieties that have been developed for other regions. These selections will be used to initiate and sustain the project until newer material is developed under the long-term strategy. This latter strategy involves the development of hybrid varieties that will be bred using parental species possessing preferential adaptation to the climatic and soil conditions of the project site. The final component of the plant material strategy is the nursery propagation process that will supply planting stock of highest quality in quantities sufficient to sustain operational plantation development.
Short term selection strategy
Testing and Selection - The short-term strategy will rely upon GreenWood Resources’ network of varietal site trials throughout the western United States. These trials involve a collection of 97 elite hybrid poplar clones that were assembled from GreenWood’s proprietary breeding program as well as other leading North American poplar breeding centers. The clones in the collection represent eight hybrid species combinations and one intraspecific combination.

Attorney-Client Communication ENTRIX, Inc. ● J-9 Privileged, Confidential Information
Table J-1: Varieties at site trials
Hybrid Taxa Number of Varieties
Populus deltoides x Populus balsamifera 1
Populus deltoides x Populus deltoides 7
Populus deltoides x Populus maximowiczii 13
Populus deltoides x Populus nigra 17
Populus deltoides x Populus trichocarpa 20
Populus nigra x Populus maximowiczii 2
Populus trichocarpa x Populus deltoides 31
Populus trichocarpa x Populus maximowiczii 1
Populus trichocarpa x Populus nigra 5
TOTAL 97
Sixty-six of the 97 clones have been established in replicated field trials at the following locations that are similar to the project site to the extent that they are xeric sites that require irrigation for poplar cultivation.
Table J-2: Replicated field trials sites similar to the project.
Trial Location Latitude Elevation
(meters)
Annual Precip. (inches)
Avg. Max.
Temp. (°F)1
Avg. Min.
Temp. (°F2)
Heating Degree Days (°C3)
Soil pH Soil Texture
Boardman, OR
45.83° 92 8.5 62.6 38.7 3,095 7.6 Sand
Caldwell, ID
43.66° 722 10.4 93.2 21.6 3,072 6.5 Sandy Loam
Klamath Fall, OR
42.20° 1,249 13.5 84.5 20.3 3,667 6.7 Loam
Farmington, NM
36.73° 1,568 8.0 68.4 35.6 3,034 8.1 Sandy Clay
Canyon Day, AZ
33.83° 1,560 19.3 70.7 39.7 2,377 7.7 Loam
Table Source: Latitude, elevation, rainfall, temperature, and heating degree day data collected from http://www.worldclimate.com 1/ Mean of the monthly maximum daily temperature 2/ Mean of the monthly minimum daily temperature 3/ Cumulative number of degrees in a year by which the mean temperature exceeded 18.30C Soil pH and texture data derived from lab analysis from composite soil samples at each site.

Attorney-Client Communication ENTRIX, Inc. ● J-10 Privileged, Confidential Information
The environmental data for each of the varietal-site trials is shown along with conditions at Canyon Day, Arizona where, a new field evaluation trial will be established in 2007. Field performance data from all of these locations - but especially the Canyon Day site - will be used in selecting superior poplar varieties with which to initiate planting of the project at Bonito Prairie. The four established trials are scheduled for completion and varietal selection in 2009 -2010. The Canyon Day trial would be completed in 2011 if established in 2007.
Selection of approximately the eight top selections will be identified for establishment of yield verification trials at Bonito Prairie. These trials will be used to confirm yield projections as well as the superiority of the selected varieties. It is necessary to re-test the selections at Bonito Prairie where elevation and soil characteristics are substantially different than the tests sites including Canyon Day. The re-testing will be done in conjunction with yield verification. Yield verification trials will be established with 64-tree square plots, replicated six times at operational spacing, either 10 feet x 10 feet or 12 feet x 12 feet and conducted for a full rotation.
Mass Multiplication and Propagation
Foundation stock with which a multiplication project can be initiated, is available from GreenWood’s clone bank and nursery operation at Westport, Oregon. Multiplication will be started at the conclusion of the yield verification trials. The goal of the multiplication phase will be to scale up propagation capacity to the point where the project can annually produce 48,000 cuttings from each of the top eight-yielding varieties selected from the yield verification trial.
This would yield a grand total of 192,000 cuttings that is needed to establish 640 acres yearly at a rate of 300 trees per acre under the assumption of a 15-year rotation. (The operational planting stock is an unrooted, dormant hardwood cutting, 12 inches in length composed of one-year-old wood.)
The following table details the scale up propagation schedule for one superior variety selected from the trials. The simulation assumes that the propagation process begin with material from a 100-stool clone bank bed located at GreenWood’s Westport nursery. Each varieties clone back would be capable of producing 200 cuttings for the first year of the following schedule.

Attorney-Client Communication ENTRIX, Inc. ● J-11 Privileged, Confidential Information
Table J-3 Scale up propagation schedule
Year Number of Stools Newly Planted
Total Number of Stools
Number of Harvested Cuttings1
First 200 200 800
Second 800 1,000 4,400
Third 4,400 5,400 24,000
Assumptions in the above schedule are:
1. Multiplication rates:
• 4 cuttings per stool during the first year
• 6 cuttings per stool during the first coppice
• 8 cuttings per stool during the second coppice
2. Cutting allocation
• 800 cuttings in first year used to plant 800 stools in year two
• 4,400 cuttings in second year used to plant 4,400 stools in the nursery in the third year
• 24,000 cuttings in third year used to establish 80 acres of operational plantations in the fourth year
Long Term Selection Strategy
The basis of the long-term clone development strategy will be to develop a controlled hybridization plan for the project so as to sustain genetic advancement beyond the gains achieved under the short-term selection strategy. This is necessary not only for continuing the process of genetic improvement, also for the purpose of varietal diversification; diversification of both hybrid taxa and the range of unrelated families from which the varieties composing each taxon are recruited is necessary to minimize the risk of plantation failures associated with unforeseen pest or climatic events, the injurious effect of which would be accentuated with the continual propagation of the same too few varieties of restricted genetic diversity.
Initially, varietal test population that are being developed under controlled hybridization for ongoing genetic improvement of GreenWood’s irrigated hybrid poplar farms in the arid mid Columbia River Basin will be relied upon to produce new test populations for varietal

Attorney-Client Communication ENTRIX, Inc. ● J-12 Privileged, Confidential Information
evaluation, selection, and commercial deployment. This breeding program is targeting the Populus deltoides x P. nigra hybrid taxon that, worldwide, is among the most commonly pursued species combination. This taxon accounts for18% of the materials currently under test in GreenWood’s varietal site trials. The hybridization of 48 families is being pursued this year and will provide test material for the project beginning in 2008. This effort should be repeated for two additional years (2007-2008). In 2009, hybridization work at GreenWood’s Westport Research Station will incorporate the native Arizona species P. fremontii in controlled crosses with both P, deltoides and P. nigra and, dependent upon the results from the varietal site trials, potentially P. maximowicizii. Plant material from these crosses would be initiated in to testing in 2011.
Growth and Yield
The best current information with which to begin a projection of yield at Bonito Prairie comes from field performance data of hybrid poplar being tested at New Mexico State University experimental station at Farmington, New Mexico. This site is approximately 4 degrees of latitude north of the project site. It receives about one-half the precipitation (8 vs. 16 inches per year). Temperature regimes are similar. The elevation of the project site is appreciably greater and the clay-derived soils at Bonito are not as coarse as those at Farmington. These differences are considered in projecting yearly growth increments average over the life of a 15year rotation. (This is the mean annual increment or MAI.)
The experiment at Farmington entails three replications of 16-tree plots of variety OP-367. Spacing is 10 feet by 10 feet. OP-367 is one of the most widely used and adaptable hybrid poplar varieties planted throughout the western United States. At age four it averages 39 feet in height and 6.2 inches in breast height stem diameter. These measurements are comparable with data of the same age from irrigated poplar plantations in the mid-Columbia River basin. There, growth rates of clone OP-367 approximate 21 green tons of total biomass per acre per year when grown of rotations 12 years. Operationally, yields of 250 green tons of total biomass have been recovered. This level of production represents an upper bound for the Bonito Prairie project. However, it is projected that rotations of 15 years are necessary to achieve comparable yields and, consequently, an MAI of 17 green tons biomass. (One study of superior varieties of the Populus deltoides x P. nigra taxon in north central Arizona – 340 N latitude; 5,600 feet elevation, reported growth rates of 15 green tons per acre per year after three years when grown at very densities and irrigated with industrial effluent. )
Growth projections are developed for plantations established at a spacing of 12 feet by 12 feet and approximately 300 trees to an acre and managed on rotations of 15 years. Plantations are managed primarily for logs for the production of veneers and sawn wood products with the residuum used for the production of energy feedstock. Mean annual biomass increments for listed for upper and lower range estimates, with the lower bound

Attorney-Client Communication ENTRIX, Inc. ● J-13 Privileged, Confidential Information
taking into account the effects of a clay soil and 6,000 foot elevation. Mean annual biomass increments (green dry tons of biomass per acre) for hybrid poplar stands established at 300 per acre and managed for fifteen years are projected in the following table between a range of upper and lower limits.
Table J-4 Growth and yield estimates
Age Lower Bound Upper Bound 1 0.0 0.0 2 1.0 1.6 3 3.5 5.2 4 6.5 9.8 5 9.8 14.6 6 11.2 16.7 7 12.5 18.7 8 12.5 18.6 9 12.2 18.3
10 11.8 17.7 11 11.6 17.3 12 11.4 17.1 13 11.3 16.9 14 11.3 16.9 15 11.4 17.0
The growth projections were derived from analyses of growth and yield models developed by GreenWood Resources. At these growth rates, the yield of merchantable wood following a 15year rotation would approximate 170 to 255 total green tons biomass per acre.
Validation of these growth figures will begin in 2007. Replicated yield plots of the top clones in the Farmington study will be established using 64-square tree plots. Replicates will be confounded with variety. Trials will also include spacing as a treatment factor. Evaluations would be conducted yearly for basal area increment and at rotation for yield of total biomass and merchantable log volume following the development of varietal-specific yield equations.

Attorney-Client Communication ENTRIX, Inc. ● J-14 Privileged, Confidential Information
Operational Cost Analysis
In order to estimate operational costs a prescription of site preparation, establishment, crop care and stand improvement activities has been developed. This prescription includes all activities managers would expect to take place during a typical year. The actual activities would likely change from year to year based upon a number of factors including weather and insect and weed pressure. The majority of the activities take place during site preparation, establishment and first three years of the rotation, with little activity once the trees are established and the canopy closes. It is not likely that a Farm of this size would warrant a dedicated farming labor force and set of equipment. For this reason, costs assumed are on a custom basis with the work done by an independent contractor including materials. The custom rates are based upon those observed on other farms under GWR management. They are generally consistent with custom farming rates for similar activities for irrigated agriculture in other parts of Arizona.7 This would allow for farm labor and equipment to be leveraged over the more intensive agriculture practiced on the balance of the Project. Each of the activities is described in the following sections.
See Appendix A: List of activities and custom farming rates See Appendix B: Crop care prescription
Site Preparation
Beginning in the fall before planting, the site is mechanically prepared with a combination of a forestry mulcher, merricrusher and/or Brown mower, depending upon the amount of woody debris. After the mowing is completed, row centers are marked with a V-shank ripper to a
7 Teegerstrom, Trent; Umeda, Kai, “2001–2002 Arizona Vegetable Crop Budgets Central Arizona Maricopa County,” Department of Agricultural and Resource Economics, College of Agriculture and Life Sciences, The University of Arizona, Publication AZ1261, 2001.

Attorney-Client Communication ENTRIX, Inc. ● J-15 Privileged, Confidential Information
depth of ten to twelve inches in late fall and early winter. The planting bed is finished with a rotovator pass that also incorporates a broad-spectrum herbicide in December through February. Depending upon winter growth of competing vegetation, a pre-plant application of herbicide may be made in April if necessary.
Establishment
As soon as all tractor work in a planting block is complete, the activities associated with planting can begin. The first step is to deploy the lateral drip tubes and emitters and flush the irrigation system. In addition to rolling out the drip tubes, this activity includes hooking up valves, pressurizing the lines and repairing any defective lines and emitters.
Planting will take place as early as weather and field conditions allow, typically in April or May. Trees are hand planted on a grid spacing to arrive at the desired density. Un-rooted cuttings approximately nine inches in length are planted with one active bud in the top inch exposed. Where necessary, a dibble will be used to assist in the planting.
Crop Care
A number of activities will be performed on an annual basis as part of maintaining the care of the crop for optimum growth, yield and value.
Integrated Pest Management
Management of pests that impact the Farm, including weeds, diseases, insects and other animals should be consistent with the principles of integrated pest management (IPM). The main aspects of IPM as they relate to the tree farm are:
• Become familiar with the target organism’s biology and population dynamics,
• Monitor the target organism’s population levels,
• Determine acceptable threshold levels of the disease, insect, animal, or weed,
• Employ an acceptable population control method for the organism. These control methods may be biological, mechanical or, as a last resort, chemical.

Attorney-Client Communication ENTRIX, Inc. ● J-16 Privileged, Confidential Information
Insects –
A number of insect pests can be expected to exist on the farm. Their populations will ebb and flow and at times, they will cause damage that warrants control methods. The most effective defense against insect damage appears to be prevention, because insect damage is highly influenced by the genetic makeup of the plant material. Some economically significant pests common to hybrid poplar are:
• Poplar and Willow Borer (Cryptorhynchus lapathi)
• Western Poplar Clearwing Moth (Paranthrene robiniae)
• Cottonwood leaf beetle (Chrysomela scripta)
• Speckled Green Fruitworm (Orthosia hibisci)
• Other insects – Occasional outbreaks of aphids, webworms, grasshoppers, leafminers, leafrollers and army ants do occur. These are far less economically significant, but do occasionally require control measures.
If control measures are required, they may include sex pheromones that limit mating behavior, or aerial, broadcast or irrigation system application of targeted pesticides.
Weeds –
Clean cultivation of the tree stands will be maintained through the third year of the rotation. After this time, the tree canopy should close so that shading will prevent excessive competition. During the first two years, weeds will be managed using IPM. If control is necessary, mowing will be the preferred method. If a chemical application is warranted, it may include broadcast, directed or hooded sprays of herbicides. Weeds along the row-ends and field perimeters and around the irrigation infrastructure will also be controlled to maintain ease of access.
Animal Damage –
Girdling by voles can cause tree damage in the early years of a rotation. Voles can be controlled by aerial application of zinc phosphate pellets during the fall and winter on one, two and sometimes three-year-old stands. The other sources of animal damage are expected to be coyotes and gophers chewing on the drip tubes. Beyond timely equipment repairs, this problem is not expected to require active management. Measures to protect trees from deer browse may be necessary if damage is too extensive.

Attorney-Client Communication ENTRIX, Inc. ● J-17 Privileged, Confidential Information
Fertilization
Initially, fertilization rates will be based upon the results of trials that utilized soil and tissue testing and the condition of the stand. At this point, amendments of nitrogen, phosphorus and zinc chelate are recommended. Nitrogen will go from 30 lbs/acre in year one, to 50 lbs/acre in year two, to 80 lbs/acre in years three through harvest. Ten lbs/acre of phosphorus will be applied in year one and a second time in year five. Zinc chelate applications will be at 1 lb/acre in year one and on an as needed basis thereafter. Due to the escalating cost of fossil fuels, which are the main ingredient in nitrogen fertilizer, the per-acre cost has increased dramatically over the past few years. Lower rates may be applied in order to capture some savings depending upon crop conditions.
Irrigation
Although the irrigation system is beyond the scope of this study, irrigation is of particular importance to the long-term management and operations of the tree farm. The system will likely include filter stations, sub-mains, risers, drip tubes, emitters and all the associated valves and attachments. Timing, duration and amount of irrigation water applied need to be closely monitored by the Farm manager. During the irrigation season these decisions are based upon information gathered from a number of different sources, including soil moisture monitors, weather stations, visual inspections of the trees and pressure from weed outbreaks. In addition to scheduling water application, management of the irrigation system will include the following activities:
• Operation and routine maintenance of filter stations, valves, mainlines, sub-main, laterals and emitters.
• Repair of leaks and breaks of underground system components.
• Flushing of sub-mains every six weeks.
• Daily monitoring of trees to identify irrigation related problems.
• Weed and vegetation control in areas surrounding irrigation equipment.
Other activities require larger, temporary crews. Hooking up and rolling out drip lines, fixing any dry lines and flushing the system is done prior to planting. After one or two years of the rotation enough litter accumulates on top of the drip tubes and begins to decay that feeder roots from the trees begin to plug drip lines. Lifting hoses out of the litter and setting them back down on the surface prevents further hose damage and gives an opportunity to repair previously damaged lines.
Attorney-Client Communication ENTRIX, Inc. ● J-18 Privileged, Confidential Information
Pruning
Pruning is used to improve the quality of saw logs by removing branches to produce wood with a clear grain. Depending upon stand condition, pruning will be done in three steps; one lift of six feet after the third growing season, a second lift of an additional eight feet after the fourth growing season, and a third and final lift of eight feet after the fifth growing season.

Attorney-Client Communication ENTRIX, Inc. ● J-19 Privileged, Confidential Information
Tree Utilization at Harvest
Hybrid poplar trees in North America have been primarily grown on a six to eight year rotation for production of clean chips for the pulp and paper industry. Under this scenario, the tree was harvested, de-limbed, de-barked and chipped. However, in recent years, a multiple market strategy has been developed to maximize the value of the fiber coming from each part of the tree. Under this multiple market strategy the entire tree would be harvested and processed into three segments:
• Sawlogs. The main stem would yield sawlogs. Depending upon the specifications of the market, the small end diameter (SED) of the sawlog would typically range from 6” to 10”. For the purposes of this study, a 6” SED will be assumed. This segment accounts for 70% of total biomass.
• Small logs. The main stem from 6” to 4” SED would produce small diameter logs for excelsior (see market analysis section). This segment accounts for 15% of total biomass.
• Residual. The main stem beyond the 4” SED, limbs, leaves and bark would produce a low grade or residual chip. This segment accounts for 15% of total biomass.
Figure J-5 Whole tree biomass utilization to multiple markets.
Residual 15%

Attorney-Client Communication ENTRIX, Inc. ● J-20 Privileged, Confidential Information
Harvesting, Processing & Transportation Cost Analysis
Harvesting, processing and transportation are the highest costs associated with the Farm each year. Using the most appropriate expertise, process and equipment is a key to controlling these costs. Although a number of factors could well change by the time the first trees are harvested at the Farm that could impact efficiency and cost, conservative assumptions about the harvesting systems and costs can be made based upon the current practices in use to harvest hybrid poplar.
About 55% of the world's wood harvest is harvested manually, e.g. with a chainsaw. The remaining 45% is harvested mechanically, using either the cut-to-length (CTL) or tree-length method (TL). Of the mechanically harvested portion, about 65% is harvested using the tree-length method and the remaining 35% using the cut-to-length method.8 At present, most hybrid poplar in North America is harvested using tree-length systems. The most likely process for such a system at the Farm would be the following:
• A feller-buncher with a hot saw severs the tree at ground level
• Rubber tired skidders yard the trees to a landing
• A processor de-limbs and merchandizes logs to a 4” SED. The 4” minus logs would be chipped. The limbs, tops, leaves, and bark are chipped as well.
• Sawlogs are hauled on standard log trucks to the mill. Chips are hauled in standard chip vans.
The CTL system is more commonly used in smaller diameter stands in Scandinavian countries. That system would likely follow this process:
• A harvester removes the branches and top at the stump, and cuts the tree to log lengths that may be selected by the operator.
• A forwarder picks up sawlogs and chip logs, transports them to a landing, and loads them on trucks for transportation.
• Residues are left distributed within the stand, which recycles nutrients and eliminates disposal costs if no market exists for the residual.9
8 “Cut-to-Length logging,” Ponsse Oyj, accessed online at http://www.ponsse.fi/english/group/CTL/index.php#loppu on July 13, 2006.
9 Hartsough, Bruce R.; Cooper, David J., “Cut-to-length harvesting of short-rotation eucalyptus,” Forest Products Journal, VOL. 49, No. 10, 1999.

Attorney-Client Communication ENTRIX, Inc. ● J-21 Privileged, Confidential Information
If there is a market for the residual, it is harvested with an energy wood harvester. This machine collects, compacts and bundles residual for easier handling and transportation. Although not yet common in the US, a number of these machines are in use in Europe.10
Both systems likely have merit for harvesting hybrid poplar. Since it is currently in use on GWR managed farms, costs estimates for the tree-length system are more reliable. It also uses equipment currently in use on FATCO logging operations.11 The CTL system is more specialized, more complex, and uses newer technology. It would require a substantial initial investment that may not be supported by harvest at the Farm alone. However, over time the CTL system may prove to be more efficient and cost effective. This report will assume that the tree-length system is used. Cost estimates are based upon similar operations at GWR managed farms and are comparable to rates for harvesting and transportation provided by FATCO.12
Figure J-6 Harvesting, processing and transportation cost estimates.
Activity $/Green Ton
Fell & Skid $5.00
De-Limb, cut to length 13.00
Process Small Logs 2.00
Process Residual 3.00
Transport Sawlogs 5.00
Transport Small Logs 27.00
Transport Residual 10.00
10 Kryzanowski, Tony, “Using Slash for Power,” Logging and Sawmilling Journal, January 2004.
11 Email communication with Travis Greenwalt, Economist, Entrix and Charles Peone, Jr., FATCO.
12 Email communication with Catherine Mater, President, Mater Engineering, Ltd.

Attorney-Client Communication ENTRIX, Inc. ● J-22 Privileged, Confidential Information
Market Analysis
Four Corners Region Forest Products Industry
The Reservation is located within the Four Corners regional forest products industry encompassing Arizona, New Mexico, Utah and Colorado. This regional industry was the subject of a fairly detailed study by the Rocky Mountain Research Station of the United States Department of Agriculture Forest Service (USFS) entitled “The Four Corners Timber Harvest and Forest Products Industry, 200213.” This section relies heavily upon that report.
See Appendix C: Overview of the Four Corners Regional industry.
After World Was II, with strong housing markets and public policy encouraging timber harvest off the National Forests in the region, harvests increased from 700 million board feet Scribner scale (MMBF) during the 1950s to a peak of approximately 1,000 MMBF in the late 1960s. Harvests declined slightly through the 1970s and 1980s to around 805 MMBF. As was the case in much of the West, timber harvests declined due to regulation and litigation related to threatened and endangered species. This was particularly true in Arizona and New Mexico, when the Mexican spotted owl was listed as threatened by the US Fish and Wildlife Service in 1993. Harvest levels from the National Forest have increased somewhat from their low in the mid 1990s, to 84.5 MMBF in 2002. This represents less than 0.3% of the approximately 124.8 billion board feet of saw timber on non-reserved timberlands in the four states.
13 Morgan, Todd A.; Dillon, Thale; Keegan, Charles E., III; Chase, Alfred L.; Thompson, Mike T., “The Four Corners timber harvest and forest products industry, 2002,” United States Department of Agriculture, Forest Service, Rocky Mountain Research Station, Resource. Bull. RMRS-RB-7, Fort Collins, CO., May, 2006.

Attorney-Client Communication ENTRIX, Inc. ● J-23 Privileged, Confidential Information
Fire has also had a dramatic impact on the forest products industry in the region. Before the 19th century, lower intensity, more frequent fires removed much of the fuel loads and lowered the density of native stands, leaving fewer, larger trees. The exclusion of fire, forest harvest and other land use practices has reduced the frequency of fires over the past century, leaving stands with higher density, smaller trees and larger surface fuel loads. When fires occur in these stands now, there is a higher likelihood of larger, more intense crown fires that destroy large volumes of timber and damage the forest soils. There is a broad movement toward treatment, thinning and fuels reduction that would reduce the hazard of crown fires, while maintaining sustainable forest ecosystems that provide a range of resources and values14.
This decrease in harvest and increased emphasis on thinning has changed the landscape of the processing capacity in the region. Production has shifted away from larger mills processing larger diameter logs to smaller mills processing smaller logs and other products such as house logs, vigas, latillas, log furniture, posts and poles. A 2002 census found 241 primary processing facilities active in the region.
Markets for Hybrid Poplar
Hardwood Sawlogs and Lumber
The market for hybrid poplar sawlogs and lumber is the subject of a more in-depth report completed by Mater Engineering. It is assumed that the entire sawlog volume from the Farm would be sold to FATCO and delivered to their processing facility in Canyon Day at a price of $450/mbf. This is their current average delivered log price15.
Pulp and Paper
Clean chips for pulp and paper production have been the primary market for hybrid poplar in North America. Depending upon the equipment and product mix of a given pulp mill, these chips can be an important source of the raw material. However, there are no pulp mills in the Southwest using hardwood chips. The closest markets would be the lower Mississippi River valley and the Pacific Northwest. Given the transportation cost and scarcity of available rail
14 Peterson, David L.; Johnson, Morris C.; Agee, James K.; Jain, Theresa B.; McKenzie, Donald; Reinhardt, Elizabeth D., “Forest structure and fire hazard in dry forests of the Western United States,” U.S. Department of Agriculture, Forest Service, Pacific Northwest Research Station, Portland, OR, Gen. Tech. Rep. PNW-GTR-628, 2005.
15 Email communication with Catherine Mater, President, Mater Engineering, Ltd.

Attorney-Client Communication ENTRIX, Inc. ● J-24 Privileged, Confidential Information
cars it is not likely that chips from the Farm could be delivered to these markets at current prices.
Excelsior
The most likely market for the small logs is excelsior. Western Excelsior Corp. in Mancos, Colorado is a producer of evaporative cooler pads and soil conservation blankets. Their raw material is native aspen harvested from the National Forests in the Four Corners Region. However, the volume available from the National Forests is on the decline and they have identified hybrid poplar as an acceptable substitute. The Navajo Agricultural Products Industry (NAPI) based in Farmington, New Mexico recently announced that they have begun to establish a hybrid poplar tree farm on their irrigation project. Western Excelsior is cooperating in the venture and expects to purchase poplar logs from the farm16. The going rate for aspen logs with a 4” SED delivered to Mancos is $41.00/GT17. Poplar would be discounted compared to aspen because its lower would density. The discount is assumed to be 10%, or $37.00/GT.
Biomass energy
Power Generation
The White Mountain region is at the forefront of using wood biomass as a source of energy. Although the primary source of this biomass is forest thinnings, hybrid poplar residuals could be used as a source as well. Any one or a combination of the following facilities would be possible customers:
• A co-generation plant operated by Snowflake White Mountain Power, LLC is slated to open by approximately 80 miles from Bonito Prairie in 2008. The Tribe has an existing agreement so supply the plant with wood residue from fire damage18.
• A wood pellet plant operated by Forest Energy, Inc. in Show Low, approximately 40 miles from Canyon Day19.
16 Domrzalski, Dennis, “In Navajo Nation’s new business plan, trees are poplar,” New Mexico Business Weekly, May 3, 2004.
17 Personal communication with Norm Birtcher, Forester, Western Excelsior, Inc. October 20, 2006.
18 Email communication with Travis Greenwalt, Economist, ENTRIX.
19 Slothower, Chuck; “Alternative energy proponents push piñon pellets,” Durango Herald, October 14, 2006.

Attorney-Client Communication ENTRIX, Inc. ● J-25 Privileged, Confidential Information
• A biomass energy plant operated by Western Renewable Energy in Eagar, approximately 60 miles from Canyon Day20.
• The Tribe also commissioned a Technical Report on the feasibility of a biomass power generation plant on the Reservation in 200321.
The range of delivered prices for this material is $18.0022 to $25.00/GT23. Due to its high ash and moisture content relative to forest thinnings, poplar would be on the low end of this range.
Biofuels
The longer-term market for both clean chips and residual is likely in biofuels. The national goal for biofuels production dictates the production of 30% of the nation’s gasoline demand with biofuels, primarily ethanol, by 2030. Projected production cost targets are $1.07 per gallon. Annual U.S. ethanol production is currently about 4 billion gallons primarily made from corn grain ethanol. To meet the national goal, production will be increase 15 fold to about 60 billion gallons per year from a variety of plant materials, primarily lignocellulosic biomass.24 Wood chips from poplar consist of about 75% carbohydrates and qualify for ethanol production. Approximately 70 gallons of ethanol can be produced from a dry ton of poplar chips produced from the material left after trees have been processed into solid wood products. GreenWood is in discussions with partner industries to develop a 2.5 million gallon per year poplar ethanol plant. The plant would be a demonstration/pilot scale operation that could be scaled to the production of any poplar plantation.
Carbon Credits
Terrestrial carbon sequestration is the process by which atmospheric carbon dioxide (CO2) is captured by trees, plants and crops through photosynthesis, and stored as carbon in biomass
20 McDaniel, Josh; “Bioenergy Fuels Community-Based Forestry in Arizona,” accessed online at www.sustainablebusiness.com, August 14, 2006.
21 Gold, Leonard; Retzlaff, Greg, “White Mountain Apache Cogeneration Feasibility Assessment,” November 2003.
22 Personal communication with Norm Birtcher, Forester, Western Excelsior, Inc. October 20, 2006.
23 Email communication with Travis Greenwalt, Economist, ENTRIX, June 16, 2006.
24 “Breaking the Barriers to Cellulosic Ethanol: A Joint Research Agenda,” US Department of Energy Office of Science and Office of Energy Efficiency and Renewable Energy, DOE/SC-0095, June 2006.

Attorney-Client Communication ENTRIX, Inc. ● J-26 Privileged, Confidential Information
and soils. Forestry activities can also release CO2 to the atmosphere. A carbon sink occurs when carbon sequestered is greater than carbon released over time. Forests and soils have a large influence on atmospheric levels of CO2. Tropical deforestation is responsible for about 20% of the world's annual CO2 emissions. On a global scale, however, these emissions are more than offset by the uptake of atmospheric CO2 by forests and agriculture.25 Afforestation, planting of trees on land previously not in forestry, of marginal agricultural lands with hybrid poplar has been shown to be a cost-effective manner of carbon sequestration given acceptable growth rates and carbon prices.26
The United States currently lacks a large-scale market for carbon credits; however such a market is being developed. Certified Emission Reduction credits (CER) are available through the Clean Development Mechanism (CDM) of the Kyoto Protocol. Afforestation projects, tree planting on lands previously not in forestry, are eligible for CERs.27 For instance, the Pew Center on Global Climate Change is currently working on carbon dioxide mitigation with 38 large companies that anticipate eventual restrictions or are already dealing with emissions control programs in Europe.
25 “Carbon Sequestration in Agriculture and Forestry,” US. Environmental Protection Agency, accessed online at http://www.epa.gov/sequestration/faq.html, July 14, 2006.
26 McKenneya, Daniel W.; Yemshanova, Denys; Fox, Glenn; Ramlal, Elizabeth; “Cost estimates for carbon sequestration from fast growing poplar plantations in Canada,” Forest Policy and Economics, 6 (2004) 345– 358.
27 Boyd, Emily; Corbera, Esteve; Gutiérrez, María; Estrada, Manuel; “The politics of afforestation and reforestation activities at COP-9 and SB-20,” Tyndall Centre for Climate Change Research, UK, Tyndall Briefing Note No. 12 2004.

Attorney-Client Communication ENTRIX, Inc. ● J-27 Privileged, Confidential Information
Financial & Cash Flow Analysis
A financial and cash flow analysis of the Farm has been performed. The Soil Survey28 identified 12,139 acres with slight or moderate limitations to poplar suitability. However, the irrigation system capacity limits the land available for poplar development to 8,560 acres or 71% of the total. This acreage is large enough to support the required management, farming and harvesting infrastructure and would be a viable economic unit. Development will be done in stages so that the fully developed farm has an even age class distribution and a sustained harvest volume. Because no trees are harvested during the development period, there are several years of negative net cash flows followed relatively large positive net cash flows to perpetuity. Costs are divided among capital costs and expenses. Expenses include harvesting, transportation and crop care. Capital costs are site preparation, stand establishment, planting road construction, perimeter elk fencing and pruning. This analysis does not include irrigation costs in order to be consistent with the other crops in the PIA study. Management costs are scaled up during to the development period to $50/acre. The Internal Rate of Return (IRR) has been calculated for the long-term stream of expected net cash flows to perpetuity calculated at a discount rate of 15%.
See Appendix D: Farm major assumptions and financial summary. See Appendix E: Unadjusted net cash flow.
Only one primary management scenario has been considered. That scenario is calls for a stand density of 300 trees per acre (TPA) on a 12-year rotation with pruning to produce products for multiple markets. Other possible scenarios include:
• Established density of 600 TPA with a mid-rotation thinning to 300 TPA on a 12-year rotation to produce sawlogs, small logs and residual.
• Stand density of 600 TPA on a shorter rotation primarily producing clean chips.
28 Buchanan Consultants, Ltd., “Soil Survey of the Bonito Prairie White Mountain Indian Reservation,” August 2006.

Attorney-Client Communication ENTRIX, Inc. ● J-28 Privileged, Confidential Information
• These same scenarios without pruning to produce knotty sawlogs for lower-grade lumber markets.
These scenarios were not considered because of the importance of producing sawlog volume for the FATCO mills and comparatively low returns for low-grade sawlogs, clean chip and residual. Should new technologies evolve to improve the markets for these products, these scenarios would warrant further study.
A sensitivity analysis has been performed on a range of growth rates and delivered sawlog prices.
Figure J-7 Farm IRR and annualized net return per acre for a
range of MAIs and sawlog prices. MAI
(GT/Acre/Yr) Sawlogs ($/GT) Sawlogs ($/MBF) IRR Annualized Net Return per Acre
11.4 $ 80.00 $400.00 6.38% $ 76.14
11.4 90.00 450.00 9.08% 133.73
11.4 100.00 500.00 11.21% 191.33
14.2 80.00 400.00 9.72% 149.80
14.2 90.00 450.00 12.17% 221.54
14.2 100.00 500.00 14.16% 293.28
17.0 80.00 400.00 12.23% 223.46
17.0 90.00 450.00 14.56% 309.34
17.0 100.00 500.00 16.50% 395.23

Attorney-Client Communication ENTRIX, Inc. ● J-29 Privileged, Confidential Information
Conclusions
Given a reliable and affordable source of irrigation water, a hybrid poplar farm on the Bonito Prairie is feasible. The soil survey indicates that 12,139 acres have slight to moderate limitations to poplar suitability. Hybrid poplar plantations have successfully been established on sites with comparable soils and climatic conditions. Plant material is available for testing and development and a tree improvement program could be designed to develop varieties adapted to the site. Growth and yield estimates indicate that a 12-year rotation would produce merchantable volumes of sawlogs and residuals. Operational costs and net returns are reasonable given a market for sawlogs and residuals. Although not yet quantifiable, new developments in the markets for carbon sequestration and biomass energy have the potential to improve net returns. During development, a management team with specific experience in hybrid poplar would be necessary. GreenWood Resources would be prepared to provide the oversight, training and development of a specialized tribal tree farm management group through a long-term partnership or joint venture. This process would provide professional development opportunities for tribe members with interests in agriculture, forestry and natural resources.

Attorney-Client Communication ENTRIX, Inc. ● A-1 Privileged, Confidential Information
Appendix A: Rates Activities
Rates & Activities
Activity Cost Description
Debris cleanup 100.00 Debris mulching with forestry mulcher, merricrusher and/or mower
Directed spray 35.00 Directed herbicide application
Dormant herbicide 37.00 Broadcast dormant herbicide application
Fertilization - N 30# 16.00 Fertilization with 100# N per acre
Fertilization - N 50# 26.00 Fertilization with 100# N per acre
Fertilization - N 80# 45.00 Fertilization with 100# N per acre
Fertilization - P 10# 5.00 Fertilization with 25# P per acre
Fertilization - Zn 1# 5.00 Fertilization with 100# N per acre
Insecticide 25.00 Insecticide for control of cottonwood leaf beetle and other insects
Marking/subsoiling 20.00 Marking or subsoiling to 18" depth
Miscellaneous $10 10.00 Miscellaneous crop care costs at $10/acre
Miscellaneous $15 15.00 Miscellaneous crop care costs at $15/acre
Miscellaneous $20 20.00 Miscellaneous crop care costs at $20/acre
Miscellaneous $5 5.00 Miscellaneous crop care costs at $5/acre
Mowing 35.00 Mowing vegetation between tree rows
Perimeter Mowing 35.00 Mowing field perimeters
Planting 97.50 Planting with materials at $.25 and labor at $.075 per acre
Prune 1st Lift 115.00 1st lift pruning
Prune 2nd Lift 115.00 2nd lift pruning
Prune 3rd Lift 115.00 3rd lift pruning
Rock Picking 100.00 Mechanical rock picker
Rotovating 40.00 Site prep tillage
Site prep banded herbicide 35.00 Banded herbicide application
Site prep broadcast herbicide 37.00 Broadcast herbicide application of Round-up or equivalent
% of Activity Total Activity planting Year Accounting Code Cost/Acre $/Acre
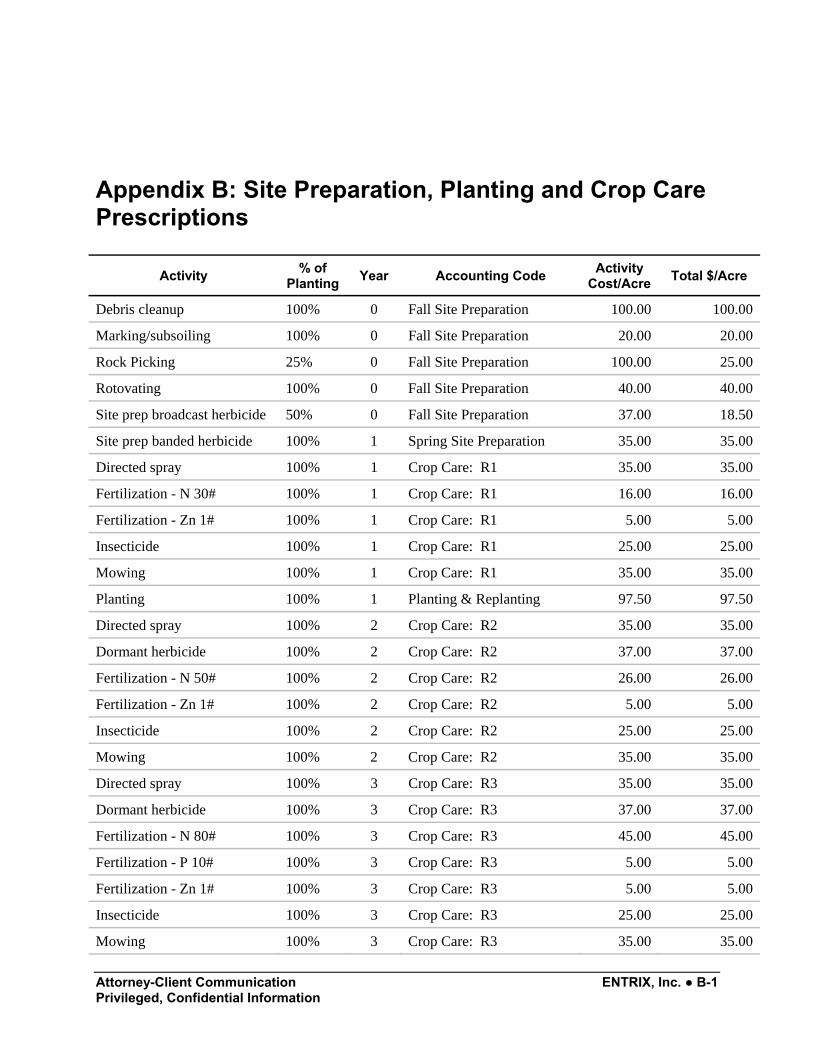
Attorney-Client Communication ENTRIX, Inc. ● B-1 Privileged, Confidential Information
Appendix B: Site Preparation, Planting and Crop Care Prescriptions
Activity % of Planting Year Accounting Code Activity
Cost/Acre Total $/Acre
Debris cleanup 100% 0 Fall Site Preparation 100.00 100.00
Marking/subsoiling 100% 0 Fall Site Preparation 20.00 20.00
Rock Picking 25% 0 Fall Site Preparation 100.00 25.00
Rotovating 100% 0 Fall Site Preparation 40.00 40.00
Site prep broadcast herbicide 50% 0 Fall Site Preparation 37.00 18.50
Site prep banded herbicide 100% 1 Spring Site Preparation 35.00 35.00
Directed spray 100% 1 Crop Care: R1 35.00 35.00
Fertilization - N 30# 100% 1 Crop Care: R1 16.00 16.00
Fertilization - Zn 1# 100% 1 Crop Care: R1 5.00 5.00
Insecticide 100% 1 Crop Care: R1 25.00 25.00
Mowing 100% 1 Crop Care: R1 35.00 35.00
Planting 100% 1 Planting & Replanting 97.50 97.50
Directed spray 100% 2 Crop Care: R2 35.00 35.00
Dormant herbicide 100% 2 Crop Care: R2 37.00 37.00
Fertilization - N 50# 100% 2 Crop Care: R2 26.00 26.00
Fertilization - Zn 1# 100% 2 Crop Care: R2 5.00 5.00
Insecticide 100% 2 Crop Care: R2 25.00 25.00
Mowing 100% 2 Crop Care: R2 35.00 35.00
Directed spray 100% 3 Crop Care: R3 35.00 35.00
Dormant herbicide 100% 3 Crop Care: R3 37.00 37.00
Fertilization - N 80# 100% 3 Crop Care: R3 45.00 45.00
Fertilization - P 10# 100% 3 Crop Care: R3 5.00 5.00
Fertilization - Zn 1# 100% 3 Crop Care: R3 5.00 5.00
Insecticide 100% 3 Crop Care: R3 25.00 25.00
Mowing 100% 3 Crop Care: R3 35.00 35.00
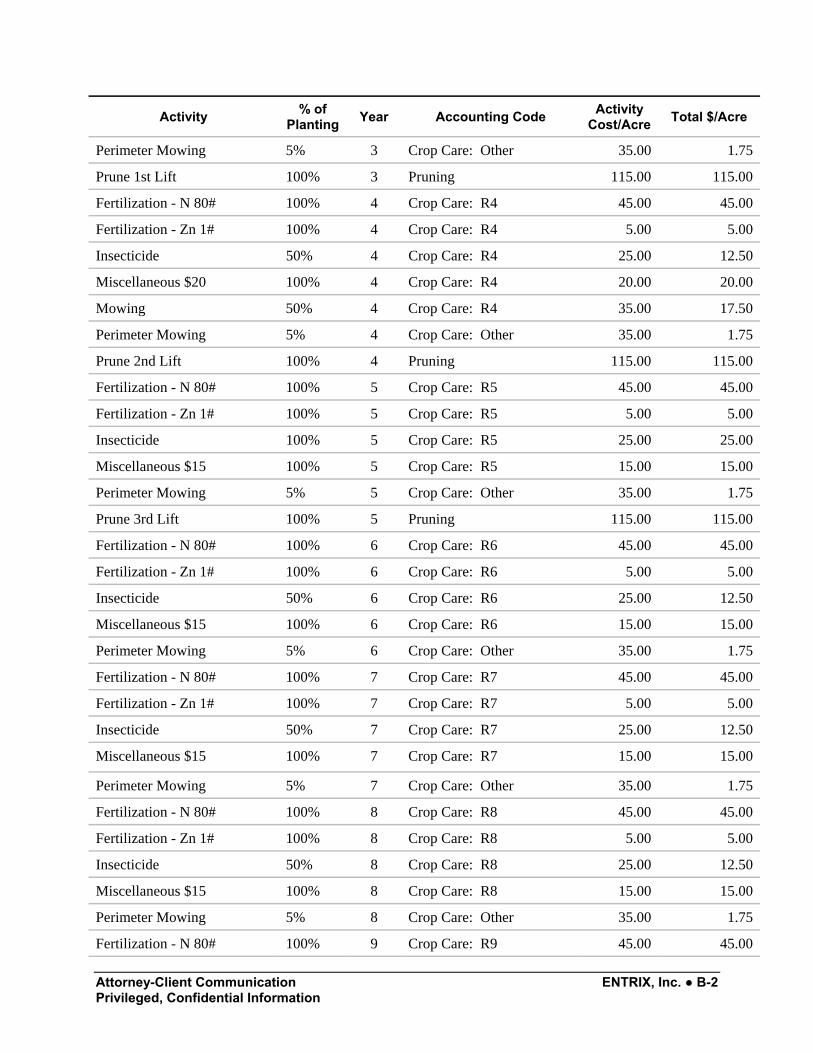
Attorney-Client Communication ENTRIX, Inc. ● B-2 Privileged, Confidential Information
Activity % of Planting Year Accounting Code Activity
Cost/Acre Total $/Acre
Perimeter Mowing 5% 3 Crop Care: Other 35.00 1.75
Prune 1st Lift 100% 3 Pruning 115.00 115.00
Fertilization - N 80# 100% 4 Crop Care: R4 45.00 45.00
Fertilization - Zn 1# 100% 4 Crop Care: R4 5.00 5.00
Insecticide 50% 4 Crop Care: R4 25.00 12.50
Miscellaneous $20 100% 4 Crop Care: R4 20.00 20.00
Mowing 50% 4 Crop Care: R4 35.00 17.50
Perimeter Mowing 5% 4 Crop Care: Other 35.00 1.75
Prune 2nd Lift 100% 4 Pruning 115.00 115.00
Fertilization - N 80# 100% 5 Crop Care: R5 45.00 45.00
Fertilization - Zn 1# 100% 5 Crop Care: R5 5.00 5.00
Insecticide 100% 5 Crop Care: R5 25.00 25.00
Miscellaneous $15 100% 5 Crop Care: R5 15.00 15.00
Perimeter Mowing 5% 5 Crop Care: Other 35.00 1.75
Prune 3rd Lift 100% 5 Pruning 115.00 115.00
Fertilization - N 80# 100% 6 Crop Care: R6 45.00 45.00
Fertilization - Zn 1# 100% 6 Crop Care: R6 5.00 5.00
Insecticide 50% 6 Crop Care: R6 25.00 12.50
Miscellaneous $15 100% 6 Crop Care: R6 15.00 15.00
Perimeter Mowing 5% 6 Crop Care: Other 35.00 1.75
Fertilization - N 80# 100% 7 Crop Care: R7 45.00 45.00
Fertilization - Zn 1# 100% 7 Crop Care: R7 5.00 5.00
Insecticide 50% 7 Crop Care: R7 25.00 12.50
Miscellaneous $15 100% 7 Crop Care: R7 15.00 15.00
Perimeter Mowing 5% 7 Crop Care: Other 35.00 1.75
Fertilization - N 80# 100% 8 Crop Care: R8 45.00 45.00
Fertilization - Zn 1# 100% 8 Crop Care: R8 5.00 5.00
Insecticide 50% 8 Crop Care: R8 25.00 12.50
Miscellaneous $15 100% 8 Crop Care: R8 15.00 15.00
Perimeter Mowing 5% 8 Crop Care: Other 35.00 1.75
Fertilization - N 80# 100% 9 Crop Care: R9 45.00 45.00

Attorney-Client Communication ENTRIX, Inc. ● B-3 Privileged, Confidential Information
Activity % of Planting Year Accounting Code Activity
Cost/Acre Total $/Acre
Fertilization - Zn 1# 100% 9 Crop Care: R9 5.00 5.00
Insecticide 50% 9 Crop Care: R9 25.00 12.50
Miscellaneous $15 100% 9 Crop Care: R9 15.00 15.00
Perimeter Mowing 5% 9 Crop Care: Other 35.00 1.75
Fertilization - N 80# 100% 10 Crop Care: R10 45.00 45.00
Fertilization - Zn 1# 100% 10 Crop Care: R10 5.00 5.00
Insecticide 50% 10 Crop Care: R10 25.00 12.50
Miscellaneous $15 100% 10 Crop Care: R10 15.00 15.00
Perimeter Mowing 5% 10 Crop Care: Other 35.00 1.75
Fertilization - N 80# 100% 11 Crop Care: R11 45.00 45.00
Fertilization - Zn 1# 100% 11 Crop Care: R11 5.00 5.00
Insecticide 50% 11 Crop Care: R11 25.00 12.50
Miscellaneous $15 100% 11 Crop Care: R11 15.00 15.00
Perimeter Mowing 5% 11 Crop Care: Other 35.00 1.75
Fertilization - N 80# 100% 12 Crop Care: R12 45.00 45.00
Fertilization - Zn 1# 100% 12 Crop Care: R12 5.00 5.00
Insecticide 50% 12 Crop Care: R12 25.00 12.50
Miscellaneous $15 100% 12 Crop Care: R12 15.00 15.00
Perimeter Mowing 5% 12 Crop Care: Other 35.00 1.75
Fertilization - N 80# 100% 13 Crop Care: R13 45.00 45.00
Fertilization - Zn 1# 100% 13 Crop Care: R13 5.00 5.00
Insecticide 50% 13 Crop Care: R13 25.00 12.50
Miscellaneous $15 100% 13 Crop Care: R13 15.00 15.00
Perimeter Mowing 5% 13 Crop Care: Other 35.00 1.75
Fertilization - N 80# 100% 14 Crop Care: R14 45.00 45.00
Fertilization - Zn 1# 100% 14 Crop Care: R14 5.00 5.00
Insecticide 50% 14 Crop Care: R14 25.00 12.50
Miscellaneous $15 100% 14 Crop Care: R14 15.00 15.00
Perimeter Mowing 5% 14 Crop Care: Other 35.00 1.75
Fertilization - N 80# 100% 15 Crop Care: R15 45.00 45.00
Fertilization - Zn 1# 100% 15 Crop Care: R15 5.00 5.00

Attorney-Client Communication ENTRIX, Inc. ● B-4 Privileged, Confidential Information
Activity % of Planting Year Accounting Code Activity
Cost/Acre Total $/Acre
Insecticide 50% 15 Crop Care: R15 25.00 12.50
Miscellaneous $15 100% 15 Crop Care: R15 15.00 15.00
Perimeter Mowing 5% 15 Crop Care: Other 35.00 1.75

Attorney-Client Communication ENTRIX, Inc. ● C-1 Privileged, Confidential Information
Appendix C: Four Corners Timber Wood Products Industry
Timber received by Four Corners primary forest products industry by ownership class and product, 2002.
Thousand board feet, Scribner
Ownership Class Sawlogs Fuelwood/Bioenergy
House Logs Post/Pole
Other Products
a
All Product
s
Private 75,693 600 3,457 1,168 12,514 93,432
Tribal 79,430 4,350 458 625 - 84,863
Private & Tribal 155,123 4,950 3,915 1,793 12,514 178,295
National Forest 58,462 200 15,278 2,005 1,811 77,756
Other ownersb 1,942 - 1,558 306 99 3,905
Total National Forest & Others 60,404 200 16,836 2,311 1,910 81,661
All owners 215,527 5,150 20,751 4,104 14,424 259,956
Percentage of product by ownership-
Private 35.1% 11.7% 16.7% 28.5% 86.8% 35.9%
Tribal 36.9% 84.5% 2.2% 15.2% 0.0% 32.6%
Private & Tribal 72.0% 96.1% 18.9% 43.7% 86.8% 68.6%
National Forest 27.1% 3.9% 73.6% 48.9% 12.6% 29.9%
Other ownersb 0.9% 0.0% 7.5% 7.5% 0.7% 1.5%
Total National Forest & Others 28.0% 3.9% 81.1% 56.3% 13.2% 31.4%
All owners 82.9% 2.0% 8.0% 1.6% 5.5% 100.0% a
Other products include logs for log furniture, vigas, latillas, and fiber logs. b Other owners includes other public ownerships and Canadian imports.

Attorney-Client Communication ENTRIX, Inc. ● C-2 Privileged, Confidential Information
Destination and sales value of Four Corners primary wood products and mill residues, 2002
Thousand 2002 Dollars
Product Within 4-Corners States
Other Rocky Mtn.
States
Far Westa Northeastb Southc North
Centrald
Mexico, Canada or
Othere Total
Lumber, mine timbers & other sawn products
70,389 10,453 10,156 119 16,560 5,310 1,229 114,216
House logs & log homes 38,261 1,317 136 489 8,122 1,339 49,664
Posts, poles, vigas, latillas, & log furniture
17,272 576 708 664 710 1,714 170 21,814
Other productsf 15,884 24 6,678 3,528 2,333 5,315 2,181 35,943
All products 141,806 12,370 17,678 4,800 27,725 13,678 3,580 221,637
Percentage of regional sales by product
Product Within 4-Corners States
Other Rocky Mtn.
States
Far Westa Northeastb Southc North
Centrald
Mexico, Canada or
Othere Total
Lumber, mine timbers & other sawn products
49.6% 84.5% 57.4% 2.5% 59.7% 38.8% 34.3% 51.5%
House logs & log homes 27.0% 10.6% 0.8% 10.2% 29.3% 9.8% 0.0% 22.4%
Posts, poles, vigas, latillas, & log furniture
12.2% 4.7% 4.0% 13.8% 2.6% 12.5% 4.7% 9.8%
Other productsf 11.2% 0.2% 37.8% 73.5% 8.4% 38.9% 60.9% 16.2%
All products 64.0% 5.6% 8.0% 2.2% 12.5% 6.2% 1.6% 100.0% a Far West includes Alaska, California, Hawaii, and Washington. b Northeast includes Connecticut, Maine, Massachusetts, New Hampshire, New Jersey, New York, c South includes Alabama, Arkansas, Delaware, Florida, Georgia, Kentucky, Louisiana, Maryland, d North Central includes Illinois,Indiana, Iowa, Kansas, Michigan, Minnesota, Missouri, Nebraska, North e Other includes European countries. f Other products include excelsior, mill residues, mulch, and fuel pellets; they do not include paper

Attorney-Client Communication ENTRIX, Inc. ● D-1 Privileged, Confidential Information
Appendix D: Farm major assumptions and financial summary
Full Development Typical Year Cash Flow Summary Total Acres 8,560 Poplar Rotatation 12 Poplar MAI (GT/Acre/Year) 14.2 Sawlog Volume at Harvest (MBF) 15,708 Sawlog MBF/Acre 23.9 Trees Per Acre 300 Sawlog Percentage 70% Small Log Percentage 15% Residual Percentage 15% 15%
Gross Revenue Total Per Acre Per Green Ton
Sawlogs $7,068,716 $10,735.20 $90.00 Small Logs 622,720 945.72 37.00 Residual 302,945 460.08 18.00 Carbon Credits 0.00
Total Gross Revenue $7,994,382 $12,141.00 $71.25
Cost of Goods Sold
Fell & Skid $561,009 $852.00 $5.00 Transport Whole Trees - - - Delimb, Debark, Cut to Length 1,458,624 2,215.20 13.00 Process Small Logs 33,661 51.12 2.00 Process Residual 50,491 76.68 3.00 Transport Sawlogs 392,706 596.40 5.00 Transport Small Logs 454,417 690.12 27.00 Transport Residual 168,303 255.60 10.00
Total COGS 3,119,211 4,737.12 27.80 Gross Profit 4,875,170 7,403.88 43.45

Attorney-Client Communication ENTRIX, Inc. ● D-2 Privileged, Confidential Information
Expenses $ $
Crop Care Expenses 800,689 1,216.00
Other Expenses 85,600 130.00
Management Fee 428,000 650.00
Total Expenses $1,314,289 $1,996
Net Income 3,560,881 5,408
Capital Costs $ $
Fall Site Preparation 133,997 203.50
Spring Site Preparation 23,046 35.00
Planting & Replanting 64,200 97.50
Pruning 227,169 345.00
Road Construction 17,120 26.00
Other Capital Costs 58,122 88.27
Total Capital Costs $523,655 $795.27
Net Cash Flow $3,037,226 $4,612.61
Sawlog MBF/Acre 23.9
Cumulative negative net cash flow during development
$ (13,967,859)
Internal Rate of Return 12.17%

Attorney-Client Communication ENTRIX, Inc. ● E-1 Privileged, Confidential Information
Appendix E: Unadjusted Net Cash Flow
Unadjusted Net Cash Flow Rotation: 12 0 1 2 3 4 5 6 7 8 9 10 MAI: 14.2 2006 2007 2008 2009 2010 2011 2012 2013 2014 2015 2016
Gross Revenue - - - - - - - - - - Sawlogs $ - $ - $ - $ - $ - $ - $ - $ - $ - $ - $
Small Logs - - - - - - - - - - Residual - - - - - - - - - - Carbon Credits - - - - - - - - - -
Total Gross Revenue - - - - - - - - - -
Cost of Goods Sold - - - - - - - - - - Fell & Skid $ - $ - $ - $ - $ - $ - $ - $ - $ - $ - $ Transport Whole Trees - - - - - - - - - - Delimb, Debark, Cut to Length
- - - - - - - - - -
Process Small Logs - - - - - - - - - - Process Residual - - - - - - - - - - Transport Sawlogs - - - - - - - - - - Transport Small Logs - - - - - - - - - - Transport Residual - - - - - - - - - -
Total COGS $ - $ - $ - $ - $ - $ - $ - $ - $ - $ - $
Gross Profit $ - $
- $ - $ - $
- $ - $ - $ - $ - $ - $ -

Attorney-Client Communication ENTRIX, Inc. ● E-2 Privileged, Confidential Information
Expenses 2006 2007 2008 2009 2010 2011 2012 2013 2014 2015 2016
Crop Care Expenses Crop Care: R1 - 76,382 76,382 76,382 76,382 76,382 76,382 76,382 76,382 76,382 76,382 Crop Care: R2 - - 107,329 107,329 107,329 107,329 107,329 107,329 107,329 107,329 107,329 Crop Care: R3 - - - 123,132 123,132 123,132 123,132 123,132 123,132 123,132 123,132 Crop Care: R4 - - - - 65,846 65,846 65,846 65,846 65,846 65,846 65,846 Crop Care: R5 - - - - - 59,262 59,262 59,262 59,262 59,262 59,262 Crop Care: R6 - - - - - - 51,031 51,031 51,031 51,031 51,031 Crop Care: R7 - - - - - - - 51,031 51,031 51,031 51,031 Crop Care: R8 - - - - - - - - 51,031 51,031 51,031 Crop Care: R9 - - - - - - - - - 51,031 51,031 Crop Care: R10 - - - - - - - - - - 51,031 Crop Care: R11 - - - - - - - - - - - Crop Care: R12 - - - - - - - - - - - Crop Care: R13 - - - - - - - - - - - Crop Care: R14 - - - - - - - - - - - Crop Care: R15 - - - - - - - - - - - Crop Care: Other - - - 1,152 2,305 3,457 4,609 5,762 6,914 8,066 9,218
Total Crop Care -$ $
76,382 $
183,711 $
307,995 $
374,994 $
435,408 $
487,591 $
539,774 $
591,957 $
644,140 $
696,323
Irrigation -$ $ - $
- $ - $
- $ - $
- $ - $
- $ - $
-
Other Expenses 6,585 13,169 19,754 26,338 32,923 39,508 46,092 52,677 59,262 65,846 72,431 Management Expenses
214,000 214,000 214,000 235,400 256,800 278,200 299,600 321,000 342,400 363,800 385,200
Total Expenses 220,585 303,551 417,465 569,734 664,717 753,115 833,283 913,451 993,618 1,073,786 1,153,954
Net Income (220,585) (303,551)
(417,465)
(569,734)
(664,717)
(753,115)
(833,283)
(913,451) (993,618) (1,073,786)
(1,153,954)

Attorney-Client Communication ENTRIX, Inc. ● D-3 Privileged, Confidential Information
Unadjusted Net Cash Flow Rotation: 12 0 1 2 3 4 5 6 7 8 9 10 MAI: 14.2 2006 2007 2008 2009 2010 2011 2012 2013 2014 2015 2016 Capital Costs
Timber & Timberland Pre-commercial Thinning - - - - - - - - - - - Fall Site Preparation 133,997 133,997 133,997 133,997 133,997 133,997 133,997 133,997 133,997 133,997 133,997 Spring Site Preparation - 23,046 23,046 23,046 23,046 23,046 23,046 23,046 23,046 23,046 23,046 Planting & Replanting - 64,200 64,200 64,200 64,200 64,200 64,200 64,200 64,200 64,200 64,200 Pruning - - - 75,723 151,446 227,169 227,169 227,169 227,169 227,169 227,169 Other - - - - - - - - - - -
Road Construction 1,317 2,634 3,951 5,268 6,585 7,902 9,218 10,535 11,852 13,169 14,486 Other Capital Costs 4,471 8,942 13,413 17,884 22,355 26,826 31,297 35,768 40,239 44,710 49,180
Total Capital Costs 139,785 232,819 238,607 320,118 401,629 483,140 488,927 494,715 500,503 506,291 512,079 Net Cash Flow (360,369) (536,370) (656,071) (889,852) (1,066,346) (1,236,255) (1,322,211) (1,408,166) (1,494,122) (1,580,077) (1,666,033)
Cumulative (360,369) (896,739) (1,552,810) (2,442,662) (3,509,007) (4,745,262) (6,067,473) (7,475,639) (8,969,761) (10,549,838) (12,215,871)

Attorney-Client Communication ENTRIX, Inc. ● D-4 Privileged, Confidential Information
Unadjusted Net Cash Flow Rotation: 12 11 12 13 14 15 16 17 18 19 20 MAI: 14.2 2017 2018 2019 2020 2021 2022 2023 2024 2025 2026
Gross Revenue
Sawlogs $ - $ 7,068,716 $
7,068,716 $ 7,068,716 $ 7,068,716 $ 7,068,716 $ 7,068,716 $ 7,068,716 $
7,068,716 $
7,068,716
Small Logs - 622,720 622,720 622,720 622,720 622,720 622,720 622,720 622,720 622,720 Residual - 302,945 302,945 302,945 302,945 302,945 302,945 302,945 302,945 302,945 Carbon Credits - - - - - - - - - -
Total Gross Revenue - 7,994,382 7,994,382 7,994,382 7,994,382 7,994,382 7,994,382 7,994,382 7,994,382 7,994,382
Cost of Goods Sold
Fell & Skid $ - $ 561,009 $
561,009 $ 561,009 $ 561,009 $ 561,009 $ 561,009 $ 561,009 $
561,009 $ 561,009
Transport Whole Trees - - - - - - - - - - Delimb, Debark, Cut to Length - 1,458,624 1,458,624 1,458,624 1,458,624 1,458,624 1,458,624 1,458,624 1,458,624 1,458,62
4 Process Small Logs - 33,661 33,661 33,661 33,661 33,661 33,661 33,661 33,661 33,661 Process Residual - 50,491 50,491 50,491 50,491 50,491 50,491 50,491 50,491 50,491 Transport Sawlogs - 392,706 392,706 392,706 392,706 392,706 392,706 392,706 392,706 392,706 Transport Small Logs - 454,417 454,417 454,417 454,417 454,417 454,417 454,417 454,417 454,417 Transport Residual - 168,303 168,303 168,303 168,303 168,303 168,303 168,303 168,303 168,303
Total COGS $ - $
3,119,211 $
3,119,211 $
3,119,211 $ 3,119,211 $ 3,119,211 $ 3,119,211 $ 3,119,211 $
3,119,211 $
3,119,211
Gross Profit $ - $ 4,875,170 $
4,875,170 $ 4,875,170 $ 4,875,170 $ 4,875,170 $ 4,875,170 $ 4,875,170 $
4,875,170 $
4,875,170

Attorney-Client Communication ENTRIX, Inc. ● D-5 Privileged, Confidential Information
Expenses 2017 2018 2019 2020 2021 2022 2023 2024 2025 2026
Crop Care Expenses Crop Care: R1 76,382 76,382 76,382 76,382 76,382 76,382 76,382 76,382 76,382 76,382 Crop Care: R2 107,329 107,329 107,329 107,329 107,329 107,329 107,329 107,329 107,329 107,329 Crop Care: R3 123,132 123,132 123,132 123,132 123,132 123,132 123,132 123,132 123,132 123,132 Crop Care: R4 65,846 65,846 65,846 65,846 65,846 65,846 65,846 65,846 65,846 65,846 Crop Care: R5 59,262 59,262 59,262 59,262 59,262 59,262 59,262 59,262 59,262 59,262 Crop Care: R6 51,031 51,031 51,031 51,031 51,031 51,031 51,031 51,031 51,031 51,031 Crop Care: R7 51,031 51,031 51,031 51,031 51,031 51,031 51,031 51,031 51,031 51,031 Crop Care: R8 51,031 51,031 51,031 51,031 51,031 51,031 51,031 51,031 51,031 51,031 Crop Care: R9 51,031 51,031 51,031 51,031 51,031 51,031 51,031 51,031 51,031 51,031 Crop Care: R10 51,031 51,031 51,031 51,031 51,031 51,031 51,031 51,031 51,031 51,031 Crop Care: R11 51,031 51,031 51,031 51,031 51,031 51,031 51,031 51,031 51,031 51,031 Crop Care: R12 - 51,031 51,031 51,031 51,031 51,031 51,031 51,031 51,031 51,031 Crop Care: R13 - - - - - - - - - - Crop Care: R14 - - - - - - - - - - Crop Care: R15 - - - - - - - - - - Crop Care: Other 10,371 11,523 11,523 11,523 11,523 11,523 11,523 11,523 11,523 11,523
Total Crop Care $ 748,506 $
800,689 $
800,689 $
800,689 $
800,689 $
800,689 $ 800,689 $ 800,689 $
800,689 $
800,689
Irrigation $ - $ - $
- $ - $
- $ - $ - $ - $
- $ -
Other Expenses 79,015 85,600 85,600 85,600 85,600 85,600 85,600 85,600 85,600 85,600 Management Expenses 406,600 428,000 428,000 428,000 428,000 428,000 428,000 428,000 428,000 428,000
Total Expenses 1,234,122 1,314,289 1,314,289 1,314,289 1,314,289 1,314,289 1,314,289 1,314,289 1,314,289 1,314,289
Net Income (1,234,122)
3,560,881 3,560,881 3,560,881 3,560,881 3,560,881 3,560,881 3,560,881 3,560,881 3,560,881
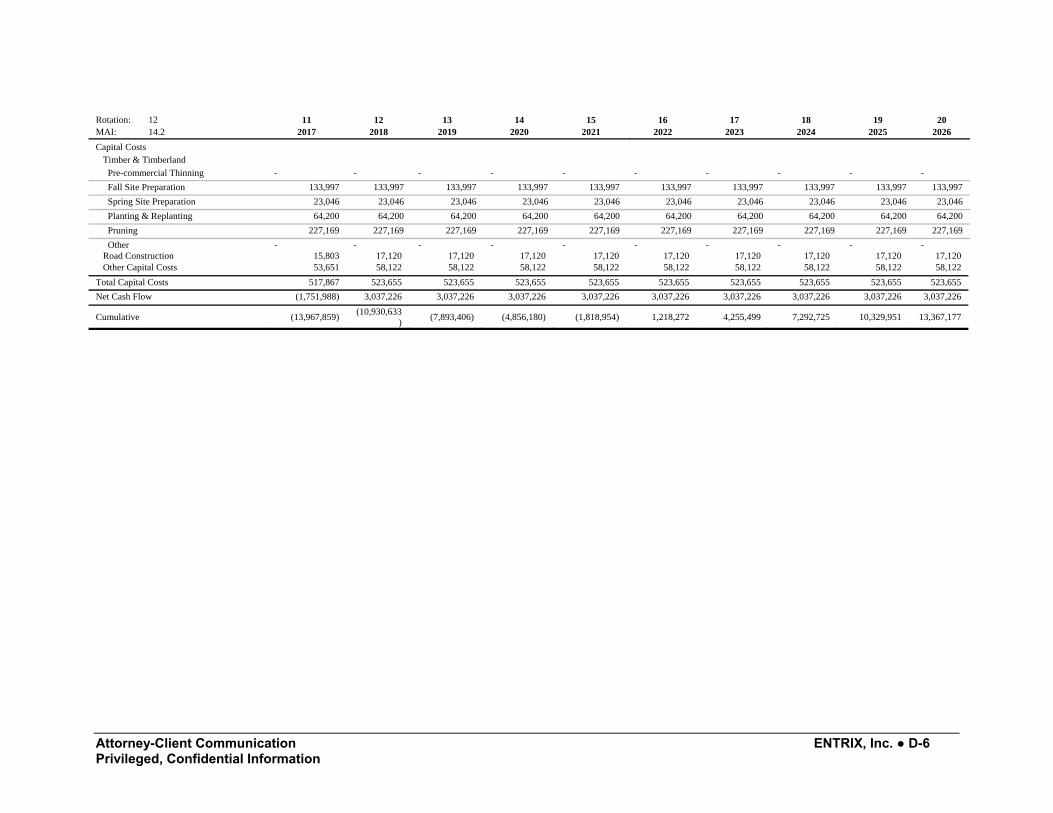
Attorney-Client Communication ENTRIX, Inc. ● D-6 Privileged, Confidential Information
Rotation: 12 11 12 13 14 15 16 17 18 19 20 MAI: 14.2 2017 2018 2019 2020 2021 2022 2023 2024 2025 2026 Capital Costs
Timber & Timberland Pre-commercial Thinning - - - - - - - - - - Fall Site Preparation 133,997 133,997 133,997 133,997 133,997 133,997 133,997 133,997 133,997 133,997 Spring Site Preparation 23,046 23,046 23,046 23,046 23,046 23,046 23,046 23,046 23,046 23,046 Planting & Replanting 64,200 64,200 64,200 64,200 64,200 64,200 64,200 64,200 64,200 64,200 Pruning 227,169 227,169 227,169 227,169 227,169 227,169 227,169 227,169 227,169 227,169 Other - - - - - - - - - -
Road Construction 15,803 17,120 17,120 17,120 17,120 17,120 17,120 17,120 17,120 17,120 Other Capital Costs 53,651 58,122 58,122 58,122 58,122 58,122 58,122 58,122 58,122 58,122
Total Capital Costs 517,867 523,655 523,655 523,655 523,655 523,655 523,655 523,655 523,655 523,655 Net Cash Flow (1,751,988) 3,037,226 3,037,226 3,037,226 3,037,226 3,037,226 3,037,226 3,037,226 3,037,226 3,037,226
Cumulative (13,967,859) (10,930,633) (7,893,406) (4,856,180) (1,818,954) 1,218,272 4,255,499 7,292,725 10,329,951 13,367,177

Attorney-Client Communication ENTRIX, Inc. ● D-7 Privileged, Confidential Information
Unadjusted Net Cash Flow Rotation: 12 21 22 23 24 25 26 27 28 29 30 Perpetuity@
MAI: 14.2 2027 2028 2029 2030 2031 2032 2033 2034 2035 2036 0.15
Gross Revenue $
$ $
$ $
$ $
$ $
$ $
Sawlogs 7,068,716 7,068,716 7,068,71
6 7,068,716 7,068,71
6 7,068,716 7,068,71
6 7,068,716 7,068,71
6 7,068,716 47,124,77
5 Small Logs 622,720 622,720 622,720 622,720 622,720 622,720 622,720 622,720 622,720 622,720 4,151,468 Residual 302,945 302,945 302,945 302,945 302,945 302,945 302,945 302,945 302,945 302,945 2,019,633 Carbon Credits - - - - - - - - - - -
Total Gross Revenue $ 7,994,382 $
7,994,38
2 $
7,994,382
$
7,994,382
$
7,994,382
$
7,994,382
$
7,994,382
$
7,994,382
$
7,994,382
$
7,994,382
$
53,295,877
Cost of Goods Sold
Fell & Skid 561,009 561,009 561,009 561,009 561,009 561,009 561,009 561,009 561,009 561,009 3,740,062
Transport Whole Trees -
Delimb, Debark, Cut to Length
1,458,624
1,458,624
1,458,624
1,458,624
1,458,624
1,458,624
1,458,624
1,458,624
1,458,624
1,458,624
9,724,160
Process Small Logs 33,661 33,661 33,661 33,661 33,661 33,661 33,661 33,661 33,661 33,661 224,404
Process Residual 50,491 50,491 50,491 50,491 50,491 50,491 50,491 50,491 50,491 50,491 336,606
Transport Sawlogs 392,706 392,706 392,706 392,706 392,706 392,706 392,706 392,706 392,706 392,706 2,618,043 Transport Small Logs 454,417 454,417 454,417 454,417 454,417 454,417 454,417 454,417 454,417 454,417 3,029,450 Transport Residual 168,303 168,303 168,303 168,303 168,303 168,303 168,303 168,303 168,303 168,303 1,122,018
Total COGS $
3,119,211 $
3,119,211
$
3,119,211
$
3,119,211
$
3,119,211
$
3,119,211
$
3,119,211
$
3,119,211
$
3,119,211
$
3,119,211
$
9,948,564
Gross Profit $
4,875,170 4,875,170
4,875,170
4,875,170
4,875,170
4,875,170
4,875,170
4,875,170
4,875,170
4,875,170
32,501,135

Attorney-Client Communication ENTRIX, Inc. ● D-8 Privileged, Confidential Information
Expenses 2027 2028 2029 2030 2031 2032 2033 2034 2035 2036 Perpetuity @0.15Crop Care Expenses
Crop Care: R1 76,382 76,382 76,382 76,382 76,382 76,382 76,382 76,382 76,382 76,382 509,210 Crop Care: R2 107,329 107,329 107,329 107,329 107,329 107,329 107,329 107,329 107,329 107,329 715,528 Crop Care: R3 123,132 123,132 123,132 123,132 123,132 123,132 123,132 123,132 123,132 123,132 820,882 Crop Care: R4 65,846 65,846 65,846 65,846 65,846 65,846 65,846 65,846 65,846 65,846 438,974 Crop Care: R5 59,262 59,262 59,262 59,262 59,262 59,262 59,262 59,262 59,262 59,262 395,077 Crop Care: R6 51,031 51,031 51,031 51,031 51,031 51,031 51,031 51,031 51,031 51,031 340,205 Crop Care: R7 51,031 51,031 51,031 51,031 51,031 51,031 51,031 51,031 51,031 51,031 340,205 Crop Care: R8 51,031 51,031 51,031 51,031 51,031 51,031 51,031 51,031 51,031 51,031 340,205 Crop Care: R9 51,031 51,031 51,031 51,031 51,031 51,031 51,031 51,031 51,031 51,031 340,205 Crop Care: R10 51,031 51,031 51,031 51,031 51,031 51,031 51,031 51,031 51,031 51,031 340,205 Crop Care: R11 51,031 51,031 51,031 51,031 51,031 51,031 51,031 51,031 51,031 51,031 340,205 Crop Care: R12 51,031 51,031 51,031 51,031 51,031 51,031 51,031 51,031 51,031 51,031 340,205 Crop Care: R13 Crop Care: R14 Crop Care: R15 Crop Care: Other 11,523 11,523 11,523 11,523 11,523 11,523 11,523 11,523 11,523 11,523 76,821
Total Crop Care 800,689 800,689 800,689 800,689 800,689 800,689 800,689 800,689 800,689 800,689 5,337,928 Irrigation Other Expenses 85,600 85,600 85,600 85,600 85,600 85,600 85,600 85,600 85,600 85,600 570,667 Management Expenses 428,000 428,000 428,000 428,000 428,000 428,000 428,000 428,000 428,000 428,000 2,853,333
Total Expenses 1,314,289 1,314,289 1,314,289 1,314,289
1,314,289
1,314,289
1,314,289
1,314,289
1,314,289
1,314,289
8,761,928
Net Income 3,560,881 3,560,881 3,560,881 3,560,881 3,560,88
1 3,560,881 3,560,88
1 3,560,881 3,560,88
1 3,560,881 23,739,207
Rotation: 12 21 22 23 24 25 26 27 28 29 30 Perpetuity @ 15 MAI: 14.2 2027 2028 2029 2030 2031 2032 2033 2034 2035 2036 Capital Costs Timber & Timberland
Pre-commercial Thinning - - - - - - - - - - - Fall Site Preparation 133,997 133,997 133,997 133,997 133,997 133,997 133,997 133,997 133,997 133,997 893,313 Spring Site Preparation 23,046 23,046 23,046 23,046 23,046 23,046 23,046 23,046 23,046 23,046 153,641 Planting & Replanting 64,200 64,200 64,200 64,200 64,200 64,200 64,200 64,200 64,200 64,200 428,000 Pruning 227,169 227,169 227,169 227,169 227,169 227,169 227,169 227,169 227,169 227,169 1,514,462 Other - - - - - - - - - - -
Road Construction 17,120 17,120 17,120 17,120 17,120 17,120 17,120 17,120 17,120 17,120 114,133 Other Capital Costs 58,122 58,122 58,122 58,122 58,122 58,122 58,122 58,122 58,122 58,122 387,483 Total Capital Costs 523,655 523,655 523,655 523,655 523,655 523,655 523,655 523,655 523,655 523,655 3,491,031 Net Cash Flow 3,037,226 3,037,226 3,037,226 3,037,226 3,037,226 3,037,226 3,037,226 3,037,226 3,037,226 3,037,226 20,248,175 Cumulative 16,404,404 19,441,630 22,478,856 25,516,083 28,553,309 31,590,535 34,627,761 37,664,988 40,702,214 43,739,440 63,987,615

APPENDIX K
Markets Evaluation for Production and Sales of Hybrid Poplar (HP) Lumber by the Fort Apache Timber Company (FATCO)
MATER ENGINEERING
FEBRUARY 2007

Appendix K - Markets evaluation for production and sales of hybrid poplar (HP) lumber by the Fort Apache
Timber Company (FATCO)
Prepared for ENTRIX, Inc.
12009 N.E. 99th Street, Suite 1410 Vancouver, WA 98682-2497
By Mater Engineering, Inc.
12009 N.E. 99th Street, Suite 1410 Vancouver, WA 98682-2497
October 16, 2006

Attorney Client Communication ENTRIX, Inc. i Privileged, Confidential Information
Table of Contents
Executive Summary 1
General Overview 2
Existing Conditions 6
Analysis 9
Potential Opportunities........................................................................................................................... 9 Survey Respondents: ............................................................................................................................ 19 Survey Results:..................................................................................................................................... 19
Species use:.................................................................................................................................... 19 Experience with specie substitution:.............................................................................................. 21 Willingness to pay higher prices:................................................................................................... 23 Perceptions about HP:.................................................................................................................... 23 Interest in testing HP out in product development:........................................................................ 24 Potential Constraints: ..................................................................................................................... 25

Attorney Client Communication ENTRIX, Inc. K-1 Privileged, Confidential Information
Executive Summary
In September of 2006, Mater Engineering was contracted by ENTRIX to evaluate market trends and solid wood production opportunities and constraints that would need to be considered by the White Mountain Apache Tribe and the Fort Apache Timber Company (FATCO) with regard to investment in a hybrid poplar (HP) farm on the reservation and HP lumber production at FATCO. This report details our findings. Information on some of the sawmilling aspects of HP was provided by FATCO. This report covers the following four main analyses areas:
• General overview of mechanical testing of HP with regard to solid wood production;
• A review of existing conditions at FATCO based on an on-site visitation conducted by Mater Engineering in September;
• An analysis of potential opportunities for the processing and marketing of HP into the solid wood products market; and
• An analysis of potential constraints for the processing and marketing of HP into the solid wood products market.

Attorney Client Communication ENTRIX, Inc. K-2 Privileged, Confidential Information
General Overview
• Lead by major research within US and Canadian forest products labs and by Potlatch Corporation, comprehensive testing of hybrid poplar (HP) has already been completed, including testing of multiple clonal varieties where wood characteristic differences for solid wood application are now noted.
• Credible volume HP production runs have been conducted by Potlatch Corporation during the last few years with results that fostered a corporate decision to move forward in converting their 17,000-acre hybrid poplar farm from pulpwood production to sawlog production. This decision required Potlatch to thin and prune their existing tree farm to allow for more spacing and tree growth, and also required a harvest and replant regime that targeted clonal HP varieties best suited for producing sawlog quality. (Note: not all clonal varieties are alike – especially when evaluating mechanical characteristics of wood for solid wood production. See Constraints section of this report.). Pruning and thinning of the 17,000-acre farm started in 2000 and is now completed.
• The pruning and thinning of the farm allowed Potlatch to test many clonal varieties of HP for desired solid wood properties. That testing occurred between 1999 – 2004. At the same time, smaller volumes of HP lumber were being sold into the market for furniture parts, moulding and millwork product, cabinetry, and veneer cores.
• Potlatch is now prepared to enter ~40 mmbf of HP into the market every year for solid wood product manufacturing on a sustainable basis. Targeted areas for market entry will be in both softwood and hardwood applications (non-structural). The Potlatch product brochure (see attached) stresses the following:
• HP is an excellent choice for trim, moulding, and cut stock.

Attorney Client Communication ENTRIX, Inc. K-3 Privileged, Confidential Information
• It serves as an excellent substitute for ponderosa pine, radiata pine, and white fir in softwoods, and alder in hardwoods.
• The wood is easily milled, can take screws and nails well, and can be used for nearly any non-structural application.
• One of the biggest advantages of the operation is that Potlatch is able to tightly control product grade and quality – providing customers with the most consistent, uniform product available on a year-round basis.

Attorney Client Communication ENTRIX, Inc. K-4 Privileged, Confidential Information

Attorney Client Communication ENTRIX, Inc. K-5 Privileged, Confidential Information

Attorney Client Communication ENTRIX, Inc. K-6 Privileged, Confidential Information
Existing Conditions
Existing conditions at FATCO, based on an September 2006 visit by Mater:
• FATCO running both large and small log lines.
• 90% of total annual volume is ponderosa pine; do process some Douglas fir and Engelmann spruce.
• The annual allowable cut is now down to 40 mmbf. This results in 37.5 mmbf of annual volume run for the mill. (Note: the mill used to operate on 100 mmbf/yr.). The inclusion of a HP product line would not affect the stated AAC, but would increase the volume of through-put through the mill.
• ~ 60% of the total annual volume goes through small log line @ an average 1.18% overrun. Taper in the smaller logs is a significant contributor to the very low overrun (~4” in 16’). The remainder volume goes through the large log line @ 1.25% overrun.
• There are three strata of logs for the small log and large log lines each (see below). The small log line cost-effectively processes from 8” +, but a notable % of log volume being processed in the small log line is coming in at 6”-7”.

Attorney Client Communication ENTRIX, Inc. K-7 Privileged, Confidential Information
Figure 1
• Because of the decrease in the AAC, the mill has excess capacity in all production lines (small and large log lines) and in the dry kiln end.
• Dry kilns are currently operating at only 60% capacity. Mill personnel state they could handle 40-50 mmbf more material per year and stay with existing operating infrastructure (would still leave six downed kilns unoperating).
• The planer facility is running at capacity on a single shift basis. New planer equipment purchased and installed can handle up to 1,100 pieces per hour, but chain line can only stack 300 pieces per hour. So currently, there is a mis-match on production capability. Mill personnel suggest more automated stacking systems are needed to match production line.
• The remanufacturing facility at FATCO is currently producing a variety of value-added products: from blanks for turnings; moulding and millwork, decking material, even treated logs for utility buyers. Mill personnel correctly envision a substantial increase in value-added production if a HP plantation becomes a reality for the tribe.
• The tribe has not approved a long-term (10-yr.) management plan for their forests. Currently FATCO operates on a three year ‘guaranteed’ supply.
• The characteristic of the log supply has substantially transitioned more to small logs (12” and under). Mill personnel state that the pressure to harvest more of the small log is very high and unprofitable given the high taper in the small logs – so high grading is occurring in the areas where they are allowed to harvest to compensate for production loss.

Attorney Client Communication ENTRIX, Inc. K-8 Privileged, Confidential Information
• The average log haul range is ~ 45 miles – and that is not projected to change in the future. Delivered log costs run from $156-$158/mbf log scale.
• FATCO has a current customer base of ~45 customers all over the US.
• 60% of product produced by FATCO is dimension; 20% is Shop and Moulding & Better; another 15% is Common; the remainder is Boards and Timber.
• Employment – even with the reduced AAC – is still at ~250 people at the mill. 40 people each for the small and large log mills; the remainder for running the rest of the operation. As employment is key priority for the tribe, this is unlikely to change.

Attorney Client Communication ENTRIX, Inc. K-9 Privileged, Confidential Information
Analysis
Potential Opportunities
Should the tribe elect to invest in a HP plantation on the reservation and FATCO secure the wood resource for processing, the opportunities for the mill could be significant in five key areas:
• No new infrastructure would be required to process the HP logs into lumber.
• Increased softwood sales could be realized, matched with new sales opportunities in hardwood markets.
• With increased control over consistent log quality coming into the mill, FATCO will have potential to increase both internal and external sales.
• FATCO can look to its existing customer base for product interest and product purchase.
Let’s examine each of these potential benefits in more detail:
1. No new infrastructure would be required to process the HP logs into lumber.
FATCO’s current milling operation includes a large log processing facility and a small log processing facility, both operating at below capacity. In early processing of smaller diameter HP logs in the US and Canada, initial concerns for processing tended to focus on the log debarking and on the ‘reported’ fuzzying of the lumber after processing. Additionally, there was little to no information regarding the drying of the wood and lumber and grade recovery. Actual test runs of HP logs conducted in the US and Canada since 1999 provide the following information:

Attorney Client Communication ENTRIX, Inc. K-10 Privileged, Confidential Information
• Debarking:
“The most surprising thing about the test was how well the Nicholson A5A barker removed the bark. We had been told the bark was stringy and difficult to remove. The Nicholson barker had no difficulty whatsoever removing the bark and there was no damage to the logs”
1999 HP test run – Cascade Hardwoods – Washington State
• Sawing: For the many tests that have been conducted on HP logs in the PNW, the sawing of the logs has consistently proven to be no problem. In fact, mill personnel report the logs are easier to work with as they typically are straighter and have much less taper than traditional species. According to FATCO personnel, approximately 60% of the total annual production is processed through their small log mill at an average overrun of ~1.18%. Heavy taper is considered a major factor in the low overrun value (~4” in 16’). This compares unfavorably with HP logs with typical taper of ~1.6” in 20’. Further – if FATCO’s August 2006 small log output data is a typical monthly performance report, we’d assume the following general piece count to board foot of production to be typical throughout the year’s operation (log lengths include 8, 10, 12, 14, and 16 foot lengths; 1.3 mmbf of production for the month):
Figure 2
From the August runs, we can see that 10% of FATCO’s small log mill supply was comprised of logs 6”-7” in diameter. According to FATCO data, this range of log size produces a return-to-log value of ~ $20/mbf log scale. Another 50% of the small log mill’s
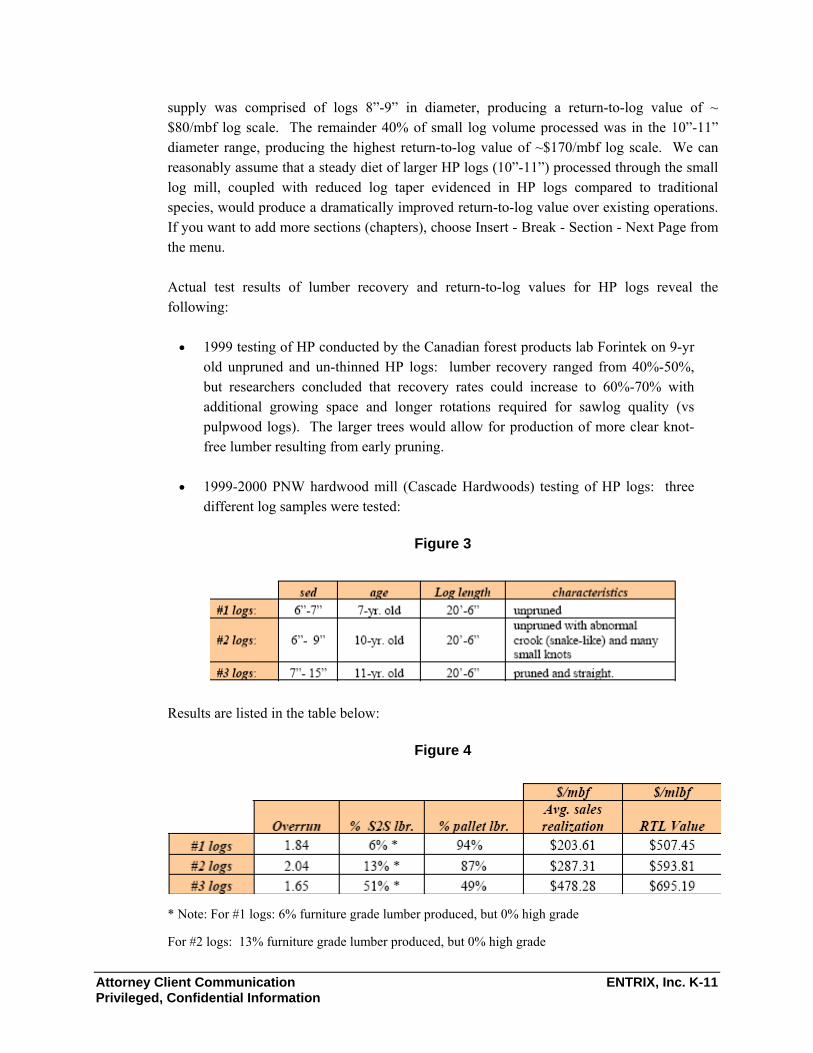
Attorney Client Communication ENTRIX, Inc. K-11 Privileged, Confidential Information
supply was comprised of logs 8”-9” in diameter, producing a return-to-log value of ~ $80/mbf log scale. The remainder 40% of small log volume processed was in the 10”-11” diameter range, producing the highest return-to-log value of ~$170/mbf log scale. We can reasonably assume that a steady diet of larger HP logs (10”-11”) processed through the small log mill, coupled with reduced log taper evidenced in HP logs compared to traditional species, would produce a dramatically improved return-to-log value over existing operations. If you want to add more sections (chapters), choose Insert - Break - Section - Next Page from the menu.
Actual test results of lumber recovery and return-to-log values for HP logs reveal the following:
• 1999 testing of HP conducted by the Canadian forest products lab Forintek on 9-yr old unpruned and un-thinned HP logs: lumber recovery ranged from 40%-50%, but researchers concluded that recovery rates could increase to 60%-70% with additional growing space and longer rotations required for sawlog quality (vs pulpwood logs). The larger trees would allow for production of more clear knot-free lumber resulting from early pruning.
• 1999-2000 PNW hardwood mill (Cascade Hardwoods) testing of HP logs: three different log samples were tested:
Figure 3
Results are listed in the table below:
Figure 4
* Note: For #1 logs: 6% furniture grade lumber produced, but 0% high grade
For #2 logs: 13% furniture grade lumber produced, but 0% high grade
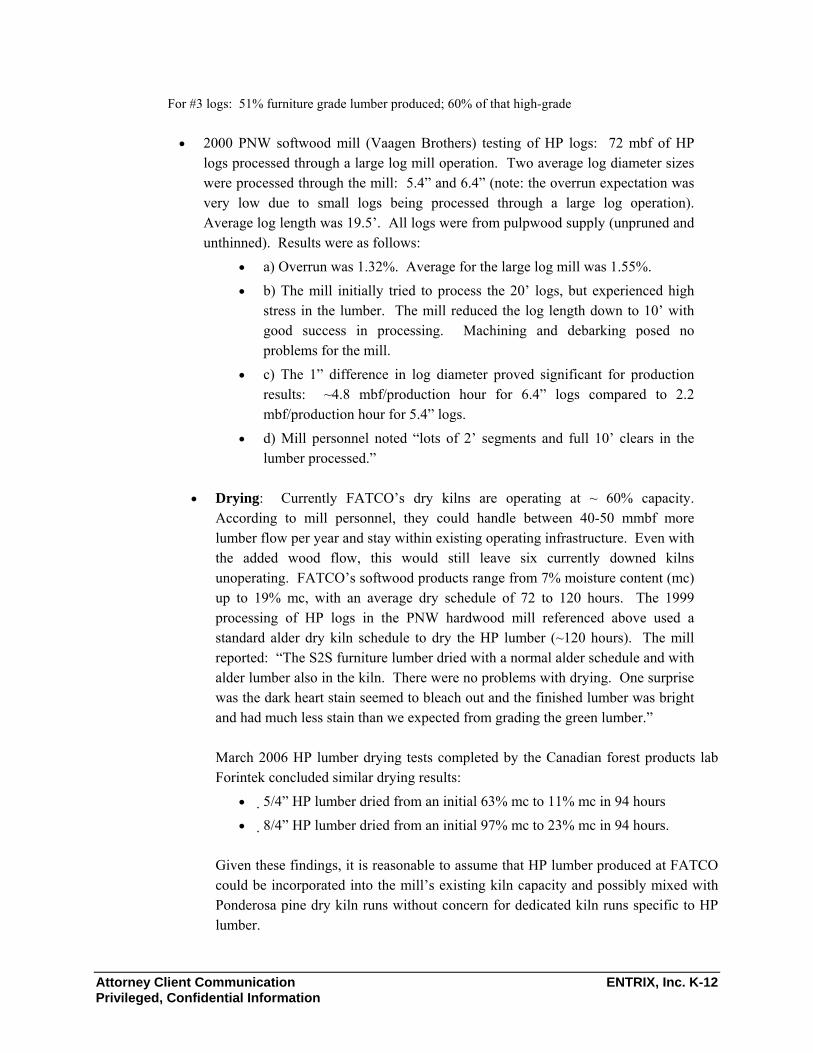
Attorney Client Communication ENTRIX, Inc. K-12 Privileged, Confidential Information
For #3 logs: 51% furniture grade lumber produced; 60% of that high-grade
• 2000 PNW softwood mill (Vaagen Brothers) testing of HP logs: 72 mbf of HP logs processed through a large log mill operation. Two average log diameter sizes were processed through the mill: 5.4” and 6.4” (note: the overrun expectation was very low due to small logs being processed through a large log operation). Average log length was 19.5’. All logs were from pulpwood supply (unpruned and unthinned). Results were as follows:
• a) Overrun was 1.32%. Average for the large log mill was 1.55%. • b) The mill initially tried to process the 20’ logs, but experienced high
stress in the lumber. The mill reduced the log length down to 10’ with good success in processing. Machining and debarking posed no problems for the mill.
• c) The 1” difference in log diameter proved significant for production results: ~4.8 mbf/production hour for 6.4” logs compared to 2.2 mbf/production hour for 5.4” logs.
• d) Mill personnel noted “lots of 2’ segments and full 10’ clears in the lumber processed.”
• Drying: Currently FATCO’s dry kilns are operating at ~ 60% capacity. According to mill personnel, they could handle between 40-50 mmbf more lumber flow per year and stay within existing operating infrastructure. Even with the added wood flow, this would still leave six currently downed kilns unoperating. FATCO’s softwood products range from 7% moisture content (mc) up to 19% mc, with an average dry schedule of 72 to 120 hours. The 1999 processing of HP logs in the PNW hardwood mill referenced above used a standard alder dry kiln schedule to dry the HP lumber (~120 hours). The mill reported: “The S2S furniture lumber dried with a normal alder schedule and with alder lumber also in the kiln. There were no problems with drying. One surprise was the dark heart stain seemed to bleach out and the finished lumber was bright and had much less stain than we expected from grading the green lumber.”
March 2006 HP lumber drying tests completed by the Canadian forest products lab Forintek concluded similar drying results:
• 5/4” HP lumber dried from an initial 63% mc to 11% mc in 94 hours • 8/4” HP lumber dried from an initial 97% mc to 23% mc in 94 hours.
Given these findings, it is reasonable to assume that HP lumber produced at FATCO could be incorporated into the mill’s existing kiln capacity and possibly mixed with Ponderosa pine dry kiln runs without concern for dedicated kiln runs specific to HP lumber.

Attorney Client Communication ENTRIX, Inc. K-13 Privileged, Confidential Information
• Remanufacturing: Planing, Sanding, Shaping, and Boring
1998 Forintek test results on 9-year old HP: “HP can be planed successfully if the tooling is kept sharp and it has a hook angle between 12 degrees and 20 degrees. HP sands very well and is competitive with other traditional species. Using a brad point – HP produced the highest percentage of good-to-excellent samples over all other competitive traditional species. HP is also a good species to shape. However, rough end grain can be evident on cross-grain cuts in the curved portion. Fuzzy grain was also evident in approximately 12% of the samples run in the test. Regardless, HP appears on par with alder and greatly exceeds performance of black cottonwood.”
1999 PNW hardwood mill test results on 7-11 year old HP logs: “The rough dry lumber planed very well. The surface was very smooth and will present a good surface to potential customers. The rough dry lumber laid flatter and thus actually planed better then alder.”
2004 Forintek test results on 15 year old HP logs: “The hybrid poplar machined well. It produced 87% acceptable pieces in the planning process, 98% acceptable pieces in the shaping process, and 100% acceptable pieces in sanding, mortising, and turning.”
2. Increased softwood sales could be realized, matched with new sales opportunities in the hardwood market:
The mill trials conducted by Potlatch in 1999-2000 targeted both hardwood and softwood lumber producers, and brought on board plywood producers for product testing as well. In addition, some of the HP lumber produced during these mill trails was further processed into value-added product: moulding and millwork product and panel product. Some of the technical results for lumber production have been detailed above. Overall results detailed by producers involved in the milling trials lead to the following written statements:
HP in the hardwood market:
• Mill trials: conducted at Cascade Hardwoods located in Washington State in 1999 and 2000.
• Company background: is a 45-year old hardwood lumber producer focusing on alder and maple lumber production for worldwide furniture and cabinetry markets. The company also produces hardwood pallet stock. Annual production is 64 mmbf/yr.

Attorney Client Communication ENTRIX, Inc. K-14 Privileged, Confidential Information
• Written response (June 2000) from the company based on mill trials: “Based on our milling trials and preliminary market interest, we are convinced that Potlatch’s entire HP production can be absorbed into the market.”
• HP log volumes desired by the company as stated in written response: “Cascade Hardwood would consider purchasing 8” and up diameter, 20’ logs to satisfy up to 20% of our total annual production.”
HP in the softwood market:
• Mill trial: conducted at Vaagen Brothers located in Washington State in 2000. 72,000 bf of HP logs processed during mill trial.
• Company background: is a 40+-year old softwood lumber producer focusing on Douglas fir, lodgepole pine, Engelmann spruce, hem-fir, and grand fir lumber production for domestic markets. The company produces ~ 130 mmbf/yr.
• Written response (June 2000) from the company based on mill trial: “We understand that Potlatch is to make a decision regarding whether it will move forward with transitioning its HP fiber into solid wood product markets. From what we have seen during our trial runs, Vaagun Bros. believes there may be significant opportunity in this effort. Access to a consistent wood supply continues to be a significant and growing challenge for us. In addition, we are forced to advance-purchase log inventory sufficient to carry us through the early spring months as weather severely restricts access to traditional log supplies. Under both scenarios, we can see strong benefits to considering Potlatch log purchasing.”
• HP log volumes desired by the company as stated in written response: “While we are most interested in a consistent supply of 7”-8” and up diameter logs, our HewSaw operation also allows us to consider smaller diameter (5”-6”) purchases. We think HP might be suitable for furniture and other markets and could envision a requirement for 300 mbf to 500 mbf per month.”
HP in the plywood market:
• Mill trial: conducted at McKenzie Forest Products located in Oregon in 2000.
• Company background: is a 30-year old plywood producer focusing on fir and hemlock for plywood production. The company produces 250 msf per 8-hr. shift.
• Written response (June 2000) from the company based on mill trial: “Log supply continues to be a significant issue for our operation in the long term. The volume of resource Potlatch looks to bring into the market, coupled with fresh log delivery

Attorney Client Communication ENTRIX, Inc. K-15 Privileged, Confidential Information
is of interest to McKenzie Forest Products. McKenzie currently utilizes 1.6 mmbf log scale per month of material for our panel product. Based on the trial results, we would anticipate your poplar to be an effective substitute for hemlock in most applications.”
• HP log volumes desired by the company as stated in written response: “We would consider hybrid poplar for approximately 10%-15% of our annual volume, especially with 7”and up 17’ logs. When diameter sizes reach 10” and up, it is reasonable to expect an additional $50/mbf log scale based on improved production and wide recovery.”
HP in the millwork market:
• Mill trial: conducted at Woodgrain Millwork Inc. located in Oregon in 2000.
• Company background: is a 50-year old moulding and millwork producer focusing on primarily pine product for worldwide markets. The company employs over 1,000 associates and has operations in Idaho, Oregon, California, North Carolina, Georgia, Chile, and Brazil.
• Written response (June 2000) from the company based on mill trial: “Woodgrain ran ~ 2,000 bf of Potlatch hybrid poplar through our operation. The material ran quite smoothly through both our fingerjoint system and moulder, matching process ease with other traditional species we work with, including radiata pine. Assuming the price for lumber was competitive with other traditional species we work with, we believe hybrid poplar could be sold into the moulding and millwork market.”
HP in the panel market:
• Mill trial: conducted at Pacific Pine Products located in Oregon and 2000.
• Company background: is a softwood panel manufacturer servicing US value-added wood product producers.
• Written response (June 2000) from the company based on mill trial: “Pacific Pine ran hybrid poplar lumber through our panel operation. We produced ten 5/4 x 23” x 80” end and edge-glued panels. The hybrid poplar processed with ease through our operation, similar to other traditional species we employ in our product development. We felt the panels produced could be effectively sold as door core material or even shelving stock in the do-it-yourself market. Based on the trial run, we also thought that your hybrid poplar could be sold as turning squares for a variety of different uses.”

Attorney Client Communication ENTRIX, Inc. K-16 Privileged, Confidential Information
3. With increased control over consistent log quality coming into the mill, FATCO would have potential to increase both internal and external sales.
For ponderosa pine – which comprises over 90% of total volume sold by FATCO - an expected overall sales target range of $400/mbf had been set for FY 2005-2006. This assumes that 60% of the total volume sold by the mill will be dimension lumber with an expected price range $290-$310/mbf. Shop & Mldg & better comprises 20% of total volume sales with an expected price range of $357-$1,410/mbf. Commons round out another 15% of total sales at $285 - $306/mbf. Not withstanding any new and potentially more lucrative entry into a hardwood market as discussed above, infusion of a HP product offering in the softwood market should be able to substantially increase production of shop & mldg & better grades within the total product offering of the mill. And existing customers would be the likely purchasers of the HP product (see customer survey results below). In addition, FATCO would have a unique opportunity to increase its internal sales to its reman plant, with reciprocal sales increases to reman customers. Consider:
• FATCO provided three random months of purchase and sales data for the reman plant: February 2006, March 2006, and July 2006. For all three months, 6/4 FJ moulding and moulding blanks proved the top selling products for the reman plant @ $1100/mbf compared to all other products sold. These products typically represented ~25% of the total bf volume sold, but averaged ~44% of the total sales value for each month.
• Given the mill trial results above, and the quality control on grade of log delivered to the mill from a HP farm, a resulting consistent higher grade of lumber could be produced from the HP. It may be reasonable, for example, to implement a marketing strategy that focuses production for both the mill and the reman plant on higher grade product for moulding. If we assume a substantial increase in 6/4 1 9/16 mldg & btr grade lumber supply to the reman plant, we might see the following increased performance for both the mill and the reman plant (we’ll use the February sales as an example):
• What we know: • Total volume for all 6/4 material sold by FATCO to the reman plant in
February was 90,088 bf (~ 30% of total volume sold). • Mldg & btr grade lumber was only .3% of the total 6/4 volume but commanded
the highest price ($400/mbf vs $300/mbf for the rest of 6/4 on average sold in February). All other product sold by FATCO to the reman plant was priced at $250/mbf.
• HP sales strategy:

Attorney Client Communication ENTRIX, Inc. K-17 Privileged, Confidential Information
• Increase the amount of mdlg. & btr grade lumber sold to the reman plant to equal 70% of the total 6/4 volume sold. So, 70% of 6/4 volume would sell to the reman plant @400/mbf, the remainder 30% of 6/4 volume would sell at $300/mbf. All other product volume and sales prices would remain the same.
• Increase the amount 6/4 FJ mldg and FJ mldg blank product sold by the reman plant to equal 70% (instead of the current 38%) of all 6/4 product sold on the market @ $1,100/mbf. The remainder 30% 6/4 volume would sell at $413/mbf (the average sale price for all 6/4 product save for FJ mldg and FJ mldg blanks sold in February). All other product volume and sales prices would remain the same.
• End result:
• A 10% increase in internal sales to FATCO from the reman plant (from $77,653 to $85,756 for the month); and
• A 14% increase in external sales for the reman plant (from $141,276 to $160,672 for the month).
4. FATCO can look to its existing customer base for product interest and product purchase:
As a means of quantifying market interest level in purchasing HP from FATCO if the specie were made available, FATCO supplied Mater Engineering a complete listing of their current customer base (~ 45 vendors). Working with Hayden Andersen – marketing manager for the mill – a shortlist of 27 of the top FATCO vendors (over 50% of all FATCO vendors) was identified for interview. A survey instrument was developed to obtain answers to questions in six key categories:
• Species use: What lumber species do vendors currently purchase expressed as a percentage of their total annual purchases. (We also tracked published data on specie use for each of the companies to determine prior purchase practices.) If HP lumber is to be introduced into the market, it likely will serve as a specie substitute for some softwoods (white pine, ponderosa pine, lodgepole pine, sugar pine, white fir, spruce) and some hardwoods (alder, aspen, basswood). It is important to know whether existing FATCO vendors purchase species that could be targeted for HP substitution.
• Purchase practices: Have vendor lumber purchase practices changed over the last five years and, if, so, what species were affected and what was the change.
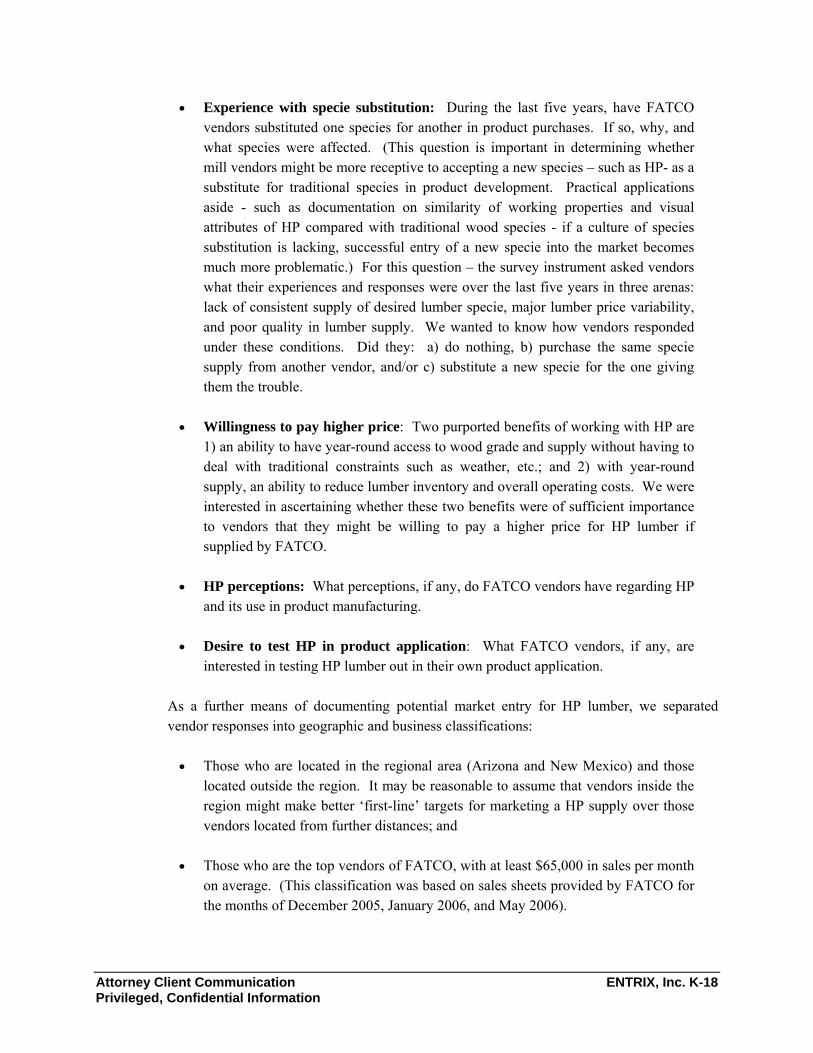
Attorney Client Communication ENTRIX, Inc. K-18 Privileged, Confidential Information
• Experience with specie substitution: During the last five years, have FATCO vendors substituted one species for another in product purchases. If so, why, and what species were affected. (This question is important in determining whether mill vendors might be more receptive to accepting a new species – such as HP- as a substitute for traditional species in product development. Practical applications aside - such as documentation on similarity of working properties and visual attributes of HP compared with traditional wood species - if a culture of species substitution is lacking, successful entry of a new specie into the market becomes much more problematic.) For this question – the survey instrument asked vendors what their experiences and responses were over the last five years in three arenas: lack of consistent supply of desired lumber specie, major lumber price variability, and poor quality in lumber supply. We wanted to know how vendors responded under these conditions. Did they: a) do nothing, b) purchase the same specie supply from another vendor, and/or c) substitute a new specie for the one giving them the trouble.
• Willingness to pay higher price: Two purported benefits of working with HP are 1) an ability to have year-round access to wood grade and supply without having to deal with traditional constraints such as weather, etc.; and 2) with year-round supply, an ability to reduce lumber inventory and overall operating costs. We were interested in ascertaining whether these two benefits were of sufficient importance to vendors that they might be willing to pay a higher price for HP lumber if supplied by FATCO.
• HP perceptions: What perceptions, if any, do FATCO vendors have regarding HP and its use in product manufacturing.
• Desire to test HP in product application: What FATCO vendors, if any, are interested in testing HP lumber out in their own product application.
As a further means of documenting potential market entry for HP lumber, we separated vendor responses into geographic and business classifications:
• Those who are located in the regional area (Arizona and New Mexico) and those located outside the region. It may be reasonable to assume that vendors inside the region might make better ‘first-line’ targets for marketing a HP supply over those vendors located from further distances; and
• Those who are the top vendors of FATCO, with at least $65,000 in sales per month on average. (This classification was based on sales sheets provided by FATCO for the months of December 2005, January 2006, and May 2006).

Attorney Client Communication ENTRIX, Inc. K-19 Privileged, Confidential Information
Survey Respondents:
Twenty-seven (27) vendors were shortlisted for interview. Introductory letters were first sent to all vendors detailing FATCO’s interest in determining whether market interest for HP lumber exists to consider development of a HP plantation on reservation land. Vendors were then faxed a survey asking them to fill out the survey and fax their responses back to Mater Engineering. Follow-up calls were made in an attempt to ensure timely response to the survey, with some responses given verbally over the phone. Of the 27 vendors initially contacted, 21 vendors provided responses, 3 declined to participate in the interview process, and 3 did not respond to the interview request (even with repeated phone calls). Reasons given for declining to participate: Sagebrush Sales Co. (strictly a softwood dimension plant and didn’t think HP would work for them); K&D Forest Products (produces log siding – didn’t think HP would work for them); and Nina Construction (makes construction stakes and didn’t think HP would work for them).
The 21 responding vendors (per classification area) are detailed in Table 1. As can be seen, 57% of the vendors were located in the region (Arizona and New Mexico), 43% were located outside the region, and 24% were top FATCO vendors.
Survey Results:
Species use:
• 20 of the 21 vendors (95%) work with one or more softwood species that could be substituted with HP were it offered by FATCO as a product line (Table 2). These species include ponderosa pine, lodgepole pine, spruce, and white pine. Ponderosa pine purchases ranged from as low as 7% of total annual purchases to as high as 100%. Lodgepole pine purchases ranged from as low as 5% of total annual purchases to as high as 10%. Spruce purchases ranged from as low as

Attorney Client Communication ENTRIX, Inc. K-20 Privileged, Confidential Information
5% of total annual purchases to as high as 10%. And white pine purchases ranged on average as 5% of total annual purchases. In some cases, vendors have already substituted other species, such as radiata pine, for ponderosa pine due to lack of a domestic supply.
• 12 of the 21 vendors (57%) work with hardwoods as well as softwoods in their product mix. Alder purchases ranged from as low as 2% of total annual purchases to as

Attorney Client Communication ENTRIX, Inc. K-21 Privileged, Confidential Information
high as 10%. Aspen purchases ranged from as low as 1% of total annual purchases to as high as 60%. Half of the 12 vendors also have current published
This information is very useful as a potential new market could emerge for FATCO should they offer HP product. As noted earlier, HP is thought to be an effective substitute for alder and aspen in non-structural product manufacturing (furniture, moulding, millwork, cabinetry, etc.) FATCO currently only offers softwood as a product for sale. The inclusion of a HP line of product could open up a new hardwood market arena with existing customers, especially those who are already top FATCO vendors for their softwood lumber supply – all of whom are regional buyers!
Experience with specie substitution:
• When asked in general whether their purchase practices had changed over the last 5 years, over 60% (13 out of 21) of FATCO’s venders selected for interview stated they had. Price and availability of supply were the predominant reasons for the change in purchase practices. Important to the HP discussion: three of the 13 vendors specifically stated they substituted other pine species for ponderosa pine as a result of lack of supply (Pozzi, Baskins, and Ochoco). Much of the pine replacement came from offshore suppliers (radiata pine, taeda pine, and paulownia). Two other vendors specifically referenced alder in their purchase practices changes. Crane Forest Products dropped alder from their product offering due to lack of supply, and Mt. Taylor Millworks added more alder to their product offering as a result of customer demand. The response from Mt. Taylor Millwork is particularly noteworthy as they are a top FATCO vendor as well as regionally located.
• When asked specifically what vendors do when they experience lack of consistent supply, major price increases for the supply, and/or delivery of poor lumber quality, the responses clearly demonstrate a culture of species substitution as a response mechanism. This was particularly true for vendors who purchase hardwood species along with softwood species, and for top FATCO vendors. Table 4 summarizes the response results for this segment of the survey. To a lessor extent, regional vendors appeared to either do nothing or purchase the same species from another vendor as a response to the three barriers listed. Even so, almost a third of those vendors resorted to species substitution as well when the three barriers presented themselves. Across the board however, vendors in all categories appeared less focused on specie substitution as a course of action when poor lumber quality was the issue. In general, they felt they could talk with the supplier to get performance back on course. This however, was not the case for major price fluctuations or lack of consistent supply, where species substitution appeared a more often employed course of action (Table 4). For all three supply

Attorney Client Communication ENTRIX, Inc. K-22 Privileged, Confidential Information
issues, it’s important to note the FATCO vendors referenced ponderosa pine as the most often affected species.
A listing of FATCO vendors that employ species substitution in their purchase practices is provided in (Table 5).

Attorney Client Communication ENTRIX, Inc. K-23 Privileged, Confidential Information
Willingness to pay higher prices:
• As noted earlier, purchasers of HP may well experience true cost savings in their own operations as a result of consistent delivery of required lumber grade and potential for just-in-time delivery of logs that could reduce overall log inventory costs. Given some of these potential cost-offsets, we were interested in knowing which, if any, FATCO vendors might find these attributes to be attractive enough to indicate a willingness to pay more for the HP supply. As noted in (Table 6), about 33% of FATCO vendors indicated they would be willing to pay more for HP product. Surprisingly, vendors located within the FATCO region appeared most responsive to a price premium for HP product, but only one of five top FATCO vendors indicated a willingness to pay more. Further, more vendors attached higher value to a year-around grade delivery scenario than they did to a reduced lumber inventory scenario (Table 7).
Perceptions about HP:
• Over 50% of FATCO vendors have not only heard about HP, but seem rather well versed regarding specie capabilities and properties (Table 8). This was true for vendors that work with both softwoods and hardwoods, and top FATCO vendors
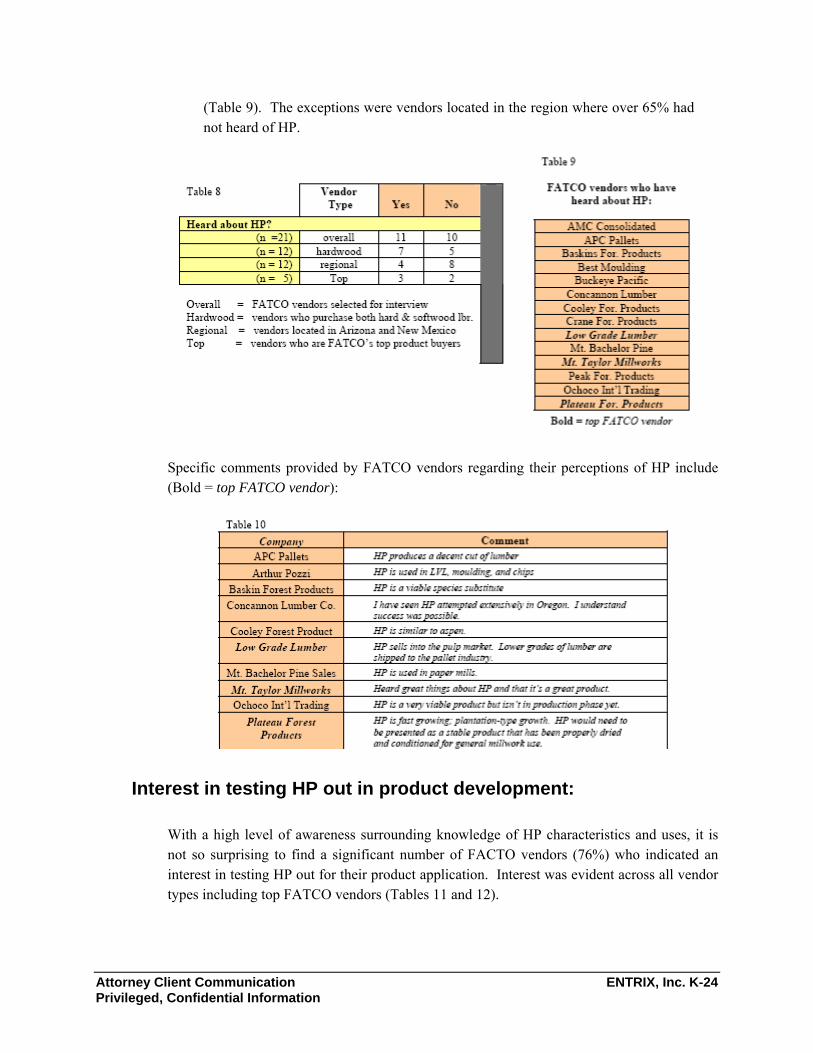
Attorney Client Communication ENTRIX, Inc. K-24 Privileged, Confidential Information
(Table 9). The exceptions were vendors located in the region where over 65% had not heard of HP.
Specific comments provided by FATCO vendors regarding their perceptions of HP include (Bold = top FATCO vendor):
Interest in testing HP out in product development:
With a high level of awareness surrounding knowledge of HP characteristics and uses, it is not so surprising to find a significant number of FACTO vendors (76%) who indicated an interest in testing HP out for their product application. Interest was evident across all vendor types including top FATCO vendors (Tables 11 and 12).

Attorney Client Communication ENTRIX, Inc. K-25 Privileged, Confidential Information
Potential Constraints:
We’ve examined the potential opportunities that exist for FATCO to consider offering a HP product on the market. There are, however, three areas of attention that should be closely considered:
• All clonal varieties of HP are not the same when it comes to solid wood processing. Selecting the right clones for high grade lumber performance is very important.
• Management of a HP farm requires unique knowledge and skills which are atypical to traditional sawmilling operations, and FATCO is no exception.
• Other tribes in the region have already made the decision to invest in HP plantations, but may be headed down a clonal selection path that could harm development of a HP market.
Let’s examine these potential constraints in more detail:
1) HP clonal varieties have very different working wood properties that can dramatically affect use in product manufacturing. If a HP farm is to be established on reservation land, the farm will most likely incorporate multiple clonal varieties of HP trees to protect against potential monoculture catastrophic events such as disease, infestation, etc. Finding different clonal varieties that offer variable protections against catastrophic events while maintaining desirable solid wood product attributes should be carefully considered. 2001 wood property test results conducted by Washington State University on four clonal

Attorney Client Communication ENTRIX, Inc. K-26 Privileged, Confidential Information
varieties of HP supplied by Potlatch Corporation illustrate this point. The test encompassed mechanical testing of four HP clones: Clone 1: TxD clone 50-197 seven yrs. old; Clone 2: TxD clone PC-2 eight yrs. old; Clone 3: DxN clone PC-1 eight yrs. old; and Clone 4: DxN clone OP-367 nine yrs. old. Testing was conducted to determine performance of each clone in the following areas:
• Modulus of elasticity (MOE): a means to determine the stiffness of the wood by determining how much the wood deflects when a load is added to it.
• Modulus of rupture (MOR): a means to determine the amount of load required to break the wood.
• Shear parallel to grain: a means to determine the strength of the wood by applying a load to a piece of wood notched on the end. The load is applied in line with the grain so that the step formed by the notch is sheared from the rest of the piece.
• Specific gravity: a means to determine how dense the wood is in comparison to other species.
• Nail and screw withdrawal: self-explanatory.
The test results show a notable range of results from the four HP clonal varieties when matched against potential hardwood and softwood species where HP might serve as a substitute in product manufacturing (Table 13).
2) FATCO is not set up to manage a HP farm.
This may be obvious but it’s important to underscore that setting up and managing a HP farm is outside the norm of traditional knowledge and skill sets required to operate a sawmill. Should the WMAT elect to invest in HP plantations, it is strongly advised to establish a separate plantation operation staffed by individuals with specific experience in growing HP

Attorney Client Communication ENTRIX, Inc. K-27 Privileged, Confidential Information
trees in a plantation setting. Even the harvesting of the trees will require a different protocol than what is typically experienced in less intensively-managed forest settings.
3) Other tribes in the region have already made a commitment to grow HP plantations for product application, but wrong clonal choices for the solid wood products industry may prove detrimental to the market.
The Navajo Agricultural Products Industry (NAPI) announced in February 2006 plans to invest $2.3 million during the next decade to plant some 1.5 million HPs as a profitable cash crop. NAPI already planted 100 acres of HPs with 50,000 trees in 2004, after New Mexico State University (NMSU) researchers demonstrated that some HPs thrive in the semiarid Four Corners. Since 2002, NMSU researchers have tested 20 poplar clones, planting about 1,300 trees. While some of the clones did poorly, a few did “extremely well”. In particular, OP-367 grew to 15 feet in the first 16 months. This year NAPI will plant 75,000 HPs on an additional 150 acres. Within 10 years, it is projected that up to 3,000 acres of Navajo land may be covered with HP trees.
Before launching the project, NAPI leaders met with executives of Colorado-based Western Excelsior Corporation to assure a market for their poplar. The company operates one of the largest excelsior plants in the nation with aspen trees harvested from the San Juan National Forest. Western Excelsior told NAPI they would “buy all the HP NAPI could produce. We need new sources of raw materials to avoid dependence on aspen, and HP would make a great substitute.”
Apart from selling excelsior, NAPI also plans to market OP-367 into the furniture and light construction market. The potential problem, as noted above, is the wood performance of OP-367 compared to other HP clones that appear to be better suited for solid wood production. Entering a new species into the market is never easy, but market confusion over different clonal performances can greatly enhance obstacles to market success.
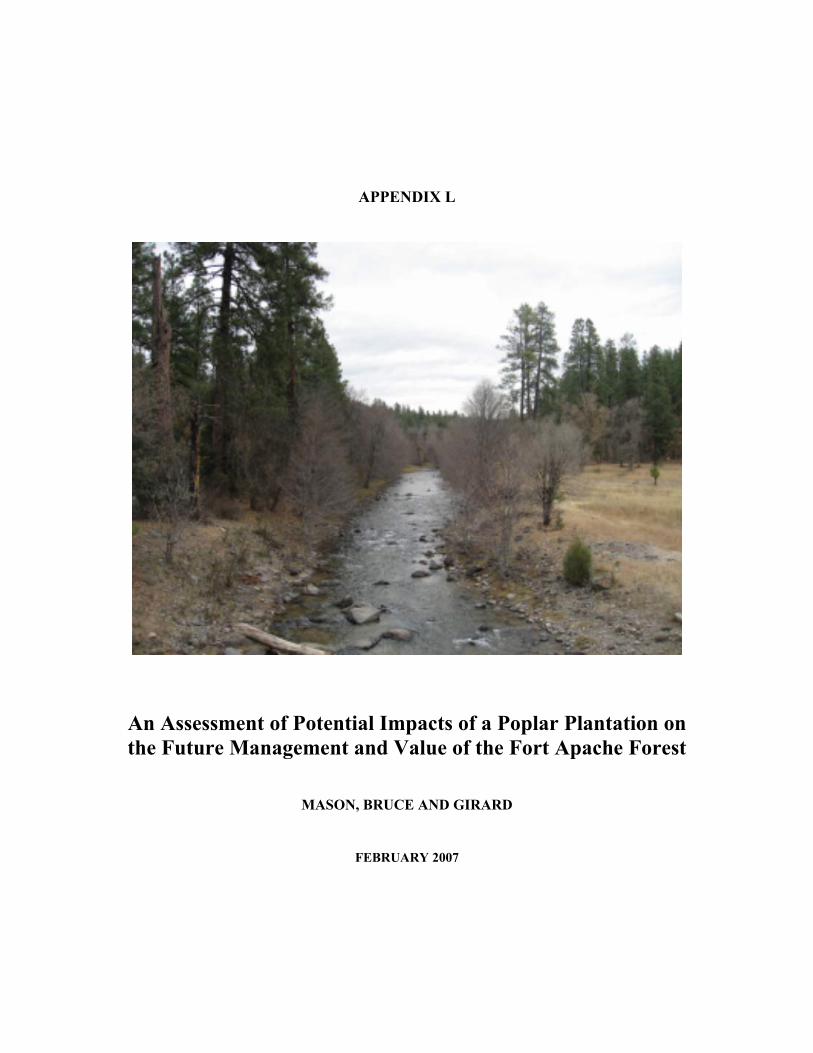
APPENDIX L
An Assessment of Potential Impacts of a Poplar Plantation on the Future Management and Value of the Fort Apache Forest
MASON, BRUCE AND GIRARD
FEBRUARY 2007

Appendix L - An Assessment of Potential Impacts of a Poplar Plantation on the Future Management and
Value of the Fort Apache Forest
Prepared for ENTRIX, Inc.
12009 N.E. 99th Street, Suite 1410 Vancouver, WA 98682-2497
By Mason, Bruce & Girard
October 16, 2006

Attorney-Client Communication ENTRIX, Inc. ●L-i Privileged, Confidential Information
Table of Contents
1.0 Executive Summary L-1
2.0 Introduction L-3
2.1 Purpose and Need......................................................................................................................... L-3 2.2 General Approach......................................................................................................................... L-4 2.3 Methods ........................................................................................................................................ L-5
3.0 Results L-18
3.1 Description of the Forest as of January 1, 2006 ......................................................................... L-18 3.2 Comparison of Base Case and Alternative Case Results............................................................ L-22
4.0 Conclusions L-33
4.1 Net Present Value of Cases ........................................................................................................ L-33 4.2 Discussion .................................................................................................................................. L-35
5.0 Literature Cited L-37
6.0 Appendix L-38
Tree Merchandizing Specifications .................................................................................................. L-38 Benchmarking and Updating Initial Inventory................................................................................. L-39 CFI Plot Stratification ...................................................................................................................... L-41 Forest Vegetation Simulator............................................................................................................. L-47 Silvicultural Regimes ....................................................................................................................... L-48

Attorney-Client Communication ENTRIX, Inc. ●L-1 Privileged, Confidential Information
1.0 Executive Summary
A forest planning model was developed to evaluate the potential beneficial impacts of a proposed hybrid poplar plantation on the future management of 495,000 forested acres of the Fort Apache Reservation in eastern Arizona. The forest is managed by the Bureau of Indian Affairs, Fort Apache Agency on behalf of the White Mountain Apache Tribe.
Three potential benefits were identified for analysis:
• First, development of the hybrid poplar plantation would produce sawlogs that could be used in the tribal sawmill to replace some of the log supply from the natural forest. This may allow the harvest of the natural forest to be increased in the short‐term in anticipation that hybrid poplar volume will become available to replace a reduced future harvest.
• Secondly, the poplar plantation enterprise would generate a net revenue which could be used to increase the budget for silvicultural treatments which would improve the future growth and value of the natural forest and help maintain stocking densities within the desired range.
• Thirdly, accelerated thinning of the forest could produce a measurable benefit in terms of wildfire risk reduction. Currently, 75 percent of the forest is classified as over‐stocked and susceptible to catastrophic, stand‐replacing wildfire.
The results of the forest model indicate the potential impact of the proposed hybrid poplar farm on the value of the Reservation forest is a $30.8 million net benefit:

Attorney-Client Communication ENTRIX, Inc. ●L-2 Privileged, Confidential Information
Table 1 Value of the Fort Apache Natural Forest With and Without Impacts of Poplar
Plantation
Description Without Poplar Plantation With Poplar Plantation Net Benefit
Million Dollars
Net Timber Production Value 409.2 441.4 32.2
Ending Value, Year 50 110.0 103.7 (6.3)
Fire Risk Reduction Value 96.4 101.4 4.9
Total $615.6 $646.5 $30.8
There is a $32.2 million benefit due to the increased timber harvest from the Reservation forest over the first 11 years. This amount also includes any improvement in future timber quality and growth due to increased precommercial thinning activities funded by poplar plantation revenue. Offsetting these benefits is a $6.3 million decrease in the present net value of the ending timber inventory under the Alternative Case. This is the result of a different harvesting pattern between Cases. The ending inventory value can be thought of as a terminal value, or a present value of the forest any given point in time, and is the value of the forest from year 50 through perpetuity. Therefore, the net benefit to the forest represents more than fifty years.
Another significant benefit is an estimated forest fire risk reduction value of $4.9 million. This value represents the present value of future avoided costs of fire suppression, emergency rehabilitation, and lost timber production due to wildfires. These costs are avoided through earlier thinning of overstocked stands, bringing them to a well‐stocked condition with lower long‐term risk of catastrophic wildfire. Also incorporated into this value is the fire risk reduction value of the increased precommercial thinning activities.
Attorney-Client Communication ENTRIX, Inc. ●L-3 Privileged, Confidential Information
2.0 Introduction
2.1 Purpose and Need
Mason, Bruce & Girard was retained by Entrix Environmental Consultants, Inc. to develop a forest planning model for the Fort Apache Indian Reservation in eastern Arizona. The purpose of the model is to evaluate the potential impacts of a proposed hybrid poplar plantation on the future management of the managed, natural forest of the Reservation.
Three potential benefits were identified for analysis:
• Development of the hybrid poplar plantation would produce sawlogs that could be used in the tribal sawmill to replace some of the log supply from the natural forest. This may allow the harvest of the natural forest to be increased in the short‐term in anticipation that hybrid poplar volume will become available to supplement a reduced future harvest. The combination of log sources would ensure a stable total log supply to the Fort Apache Timber Company (FATCO) sawmill over time.
• The poplar plantation enterprise would generate a net revenue which could be used to increase the budget for silvicultural treatments to improve the future growth and value of the natural forest and help maintain stocking densities within the desired range.
• Accelerated thinning of the mostly overstocked forest could also produce a measurable benefit in terms of wildfire risk reduction. Currently, 75 percent of the forest is classified as over‐stocked and susceptible to stand‐replacing wildfires such as the Rodeo‐Chedeski fire which burned over 280,000 acres on the western portion of the Reservation in 2002.
Integrating the timber production of the hybrid poplar plantation with the natural forest could help ensure a higher level, sustainable supply of timber to the tribal sawmill enterprise, Fort

Attorney-Client Communication ENTRIX, Inc. ●L-4 Privileged, Confidential Information
Apache Timber Company. This in turn would secure steady employment both at the mill and in the woods. At the same time, it may provide the opportunity to improve the health and fire resilience of the natural forest.
The forest model described in this report was designed for the relatively limited purpose of this analysis. It is intended for use as a tool to evaluate the relative impact of a hybrid poplar plantation on the potential future management and value of the Reservation forest. It was not intended and should not be interpreted as a recommended forest plan.
2.2 General Approach
A computer model of the forest has been constructed as a tool for evaluating this question. The model includes forest land in the East Management Unit of the Reservation totaling approximately 495,000 acres. The West Unit was excluded from analysis because it has been withdrawn from regulated timber production for the foreseeable future as a result of the Rodeo‐Chedeski fire.
The general approach was to construct a model that adhered to the management guidelines and strategies outlined in the 2005 Forest Management Plan (Fort Apache Agency, 2005). For example, the management regimes used in the model were developed from the silvicultural decision tree and prescription guidelines found in Section IV of the Forest Plan. Management objectives by the established Management Emphasis Areas are also represented in the model. In addition to the 2005 Plan, the 1995 Forest Inventory Analysis report was also an important source of guidance during model development (Fort Apache Agency, 2004).
In the analysis of economic benefits, we include an estimate of value of fire risk reduction through thinning in addition to more traditional focus on timber value. It is widely recognized that forests across the western United States have become overstocked as a result of fire suppression over the past century. Large destructive wildfires, with intensities outside the natural range of occurrence, have drawn attention to this issue. There is growing recognition of the need to reduce hazardous fuels on a landscape level.
Fire risk is a significant issue on the Reservation forest. Approximately 75 percent of the forest is currently overstocked. For this reason, we believe that one of the major benefits of increased thinning on the Reservation forest is fire risk reduction. We attempt to assess the value of this benefit using relevant research literature.
Attorney-Client Communication ENTRIX, Inc. ●L-5 Privileged, Confidential Information
2.3 Methods
2.3.1 Data Sources
Sources of data on the Fort Apache forest included the 1995 Continuous Forest Inventory (CFI) data and geographic information system (GIS) spatial data.
The CFI data was obtained from the Fort Apache Reservation for the 1995 measurement cycle. There were 1,977 sample plots with measurement data in this cycle. GIS layers were provided by the Fort Apache Reservation personnel. GIS data included CFI plot locations, vegetation types, operability, Management Emphasis Areas, East/West Management Zones, fire occurrence, and harvest unit boundaries.
In addition to these data sources, Ken Vroman and Roger Lord from MB&G made a site visit to the Reservation in August, 2006. They spent approximately 1.5 days in the woods, accompanied by the tribal forest manager, Paul DeClay, and Travis Greenwalt from Entrix. During this time, they visited several recent harvesting units, managed and unmanaged stands, and other locations, and reviewed current management practices and issues. Additional time was spent during the visit gathering information from BIA and Tribal forestry staff.
2.3.2 Forest Model Development
A forest planning model is a computer model that combines information describing current forest conditions, alternative future management strategies (regimes), and ownership objectives and constraints to produce a projection of future growth, harvest, and forest conditions. This projection can be used as the basis for a strategic plan, or as in this case, as an analysis tool to evaluate the relative effects of a proposed alternative against a ‘no action’ alternative.
Computer models are necessarily a simplification of the real world. They cannot possibly take into account all of the diversity and complexity of the natural forest, nor do they account for all human‐related aspects of forest management. A number of assumptions must be developed and incorporated into the model. Nevertheless, although simplified, they do provide policymakers with a tool to help gain insight into the dynamics of the natural forest.

Attorney-Client Communication ENTRIX, Inc. ●L-6 Privileged, Confidential Information
For this project, MB&G used a forest modeling system called “Woodstock.”1 This software is used across North America and around the world for forest modeling by government, industry and the private sector. The software uses a mathematical technique, linear programming, to find an optimal, or best, solution to a given problem.
The major components of the planning model are:
• Time horizon • Initial land & timber inventory • Silvicultural regimes • Growth & yield projections • Economic assumptions • Management objective and constraints
The following sections describe how each component of the forest model was developed including major assumptions adopted.
2.3.2.1 Time Horizon
The forest model projects future growth and management for 50 years beginning in 2006. This time horizon is divided into ten 5‐year periods. The first period represents 2006 − 2010. The model extends to 2055.
2.3.2.2 Initial Land & Timber Inventory
The initial conditions include a description of the land base and the timber inventory at the beginning of the model. The forested land base is classified by key characteristics, such as forest type, and an initial average per acre inventory is calculated for each land class. The initial inventory is in the form of a table which lists the average number of trees, by species, diameter, and height, found on the average acre within the given land class. This table is called a “tree list.”
The first step in the development of the initial inventory of land and timber was to update the forest inventory plots from their measurement date (1995) to year‐end 2005. The plot and tree data from the CFI plots was imported into the MBGTools inventory analysis system. To verify that the data was converted properly, a summary from MBGTools of the trees per acre
1 Woodstock is a product of Remsoft Incorporated, New Brunswick, Canada.

Attorney-Client Communication ENTRIX, Inc. ●L-7 Privileged, Confidential Information
and basal area by plot was obtained and compared to the plot summary information in the original database from Fort Apache.
The data was then further processed to obtain estimates of board foot volume. Volumes estimated by MBGTools were compared, by strata, with the volumes reported in the 1995 Forest Inventory Analysis (FIA) document. In total, the MBGTools board foot volume estimate was within 1% of the estimate from the 1995 FIA report. Details of this process are found in the Appendix.
The next step was to “grow” the CFI plots from measurement date through 2005 while at the same time subtracting for annual harvests. The plots were grown forward on an annual basis to year end 2005 using the Forest Vegetation Simulator (FVS) forest growth and yield model.2 After each growth year, volumes equivalent to that year’s harvest were removed from plots which had been designated as harvested in that year based on GIS data provided by the Reservation. The removals by species from the plots were in proportion to the actual harvest by species as provided by the Fort Apache Agency. The final product of this process was an inventory updated to December 31, 2005.
Once the inventory was updated to 2005, the next step was to classify each CFI plot based on tree and stand characteristics including the following:
• 7 vegetation types • 4 size classes • 4 stocking classes • 3 site classes • 2 operability classes • 2 mistletoe classes • 4 Management Emphasis Areas
The purpose of this classification is to group plots with similar biological conditions (e.g. vegetation type, size class, and stocking level) and management regimes (e.g. management goals and constraints), so that their future growth and management can be accurately projected.
Plot classifications for vegetation type, operability, and Management Emphasis Area were determined by overlaying corresponding GIS layers on CFI plot locations. Plot classifications for size, stocking, and site class were determined by tree and plot data. This process is described in the Appendix.
2 The use of FVS is detailed in the Appendix.

Attorney-Client Communication ENTRIX, Inc. ●L-8 Privileged, Confidential Information
Also at this point, plots in the West Management Zone were excluded from further analysis. Only plots in the East Management Zone were categorized into the new strata and used in the forest model. This was because the West Management Zone was removed from the regulated timber production following the 2002 Rodeo‐Chedeski fire.
The classification of plots resulted in 204 biological strata – based on seven vegetation types, four size classes, four stocking classes and three site classes, as derived from the plot data. Average tree lists for each of these biostrata were produced from the updated plots in each biostrata. The tree lists describe the average per acre distribution of trees by species, diameter, and height, and are used to represent initial inventory conditions for growth and yield projections.
The plots were further classified into two operability classes, two mistletoe classes and four management emphasis types. Acres were calculated for each strata based on the GIS overlays and the proportion of plots in each subtype. This resulted in 554 unique strata and a total of 495,032 acres. These strata and their associated tree lists serve as the starting point for the forest model.
The final stratification scheme was as follows:
• Vegetation Type • Pine/Pinyon/Juniper/Live oak • Pine Chaparral • Pine/Grass/Gambel Oak • Pine‐Mixed Conifer • Mixed Conifer • Aspen • Spruce‐Fir
• Size Class (class with maximum Basal Area) • Sapling • Poletimber • Small Sawlog • Large Sawlog
• Stocking Class (class definitions vary by vegetation type) • Under-Stocked • Well-Stocked • Over-Stocked • Excessively-Stocked
• Site Class • High
Attorney-Client Communication ENTRIX, Inc. ●L-9 Privileged, Confidential Information
• Medium • Low
• Operability • Tractor (slopes <= 40%) • Cable/Inaccessible (slopes > 40%)
• Mistletoe Hazard • Absent/Low Hazard • High Hazard
• Management Emphasis Area • Sensitive Areas (Scenic, Wildlife, Fish, Water) • Unregulated • Fuels Management • Forest Products
The resulting classification of the landbase by these characteristics resulted in creation of 554 unique forest development types representing an average of 894 acres each. The total land base represented in the model is 495,032 acres. A series of tables summarizing acreage by various classes are provided in Table 6 through Table 11 of the Appendix.
2.3.2.3 Silvicultural Regimes
Silvicultural regimes describe the various way the forest can be managed in the future. The 2005 Forest Plan outlines the general regimes that are planned by Management Emphasis Area and vegetation type. To the extent possible, we have modeled these regimes in our forest model so that our model reflects these planned future forest management intentions.
The majority of the Reservation forest is being managed using an uneven‐aged management approach in which any given area of forest has a mix of tree sizes and ages. Vegetation types managed as uneven‐aged forests include all except the Spruce‐fir and Aspen types.
In uneven‐aged management, thinnings are undertaken at intervals to remove excess trees from each diameter class. The goal of these periodic harvests is to maintain tree density at a level that promotes healthy, vigorously growing trees, and that reduces losses from mortality, insects, disease, and fire. Opening up the stand by periodic thinning also encourages natural regeneration in the understory. Seedlings fill in the openings created by the thinning, insuring a steady supply of small trees to grow into the stand over time.
Each vegetation type has a target tree distribution which has been determined by the Agency based on the type’s ecology as well as the management goals for the Management Emphasis

Attorney-Client Communication ENTRIX, Inc. ●L-10 Privileged, Confidential Information
Area. The target tree distribution is defined by three parameters: 1) the maximum tree diameter that will be retained in the stand, 2) the q‐factor, or ratio between number of trees in a 2‐inch diameter class and the number of trees in the next largest 2‐inch class, and 3) the target basal area3 per acre. Managing in this manner over time will result in a distribution of trees by diameter class with relatively larger numbers of small trees and fewer large trees. As a result, the forest can be sustained because smaller trees are always present to take the place of larger trees that are removed by harvest or lost to mortality.
There are five general uneven‐aged management regimes defined by the Forest Plan and implemented in the forest model:
• Forest Products – this regime can be applied to operable areas in the Forest Products MEA and includes an optional precommercial/timber stand improvement thinning. This regime is oriented towards production of commercial timber.
• Fuel Management – this regime is applied by the model to all operable acres in the Fuel Management MEA. The primary objective of this regime is fire risk reduction in the MEA area which surrounds communities. This regime includes a precommercial thinning.
• Large Tree – this regime is available to operable areas in both the Forest Products and Sensitive Areas MEA. Its goal is retain a higher proportion of large trees. It includes a precommercial thinning.
• Sensitive Area – this regime is applied to all operable areas in the Sensitive Wildlife, Sensitive Fish, Water, and Scenic Byways MEAs. It includes a precommercial thinning.
• Grown Only – this regime is applied to all inoperable areas in all MEAs. No harvests of any kind are included in this regime.
The specific details of each regime (cutting cycle, maximum diameter, q‐factor, and target basal area) vary by vegetation type. These details are presented in Table 12 of the Appendix.
If a precommercial thinning is included in the regime, it reduces the trees below 8‐inches DBH to the target tree per acre distribution specified by the regime. If no precommercial thinning is included, the trees smaller than 8‐inches are not thinned.
3 Basal area is a measure of tree density. It is determined by estimating the cross‐sectional area of all trees at 4.5 feet above the ground. Basal area is expressed as square feet per acre.

Attorney-Client Communication ENTRIX, Inc. ●L-11 Privileged, Confidential Information
The cutting cycle, or the time interval between thinnings, is 20 years for the mixed conifer, pine/mixed conifer, and pine/grass/Gambel oak types and 40 years for the slower growing pine/chaparral and pine – pinyon/juniper – live oak types. In our forest model, the thinning program could be initiated in small and large sawtimber stands any time within the first 30 years (six periods) of the projection. Thinning in poletimber and saplings stands could be initiated any time beginning in period 6 through 11. Once thinning begins, repeat thinnings occur every 20 or 40 years (depending on vegetation type).
A minimum harvest of 750 board feet per acre was required, following the assumptions used in the 1995 inventory analysis. If a scheduled thin would remove less than this minimum volume, the thin is cancelled. A species preference was used to selectively thin trees based on species. This preference list was taken from the 1995 FIA report and is detailed in the Appendix.
The spruce‐fir and aspen forest types are managed as even‐aged forests. In modeling these types, we followed the general regimes described for these types in the 1995 inventory report and 2005 Forest Management Plan. A minimum rotation age defines the age at which the stand can be considered for a regeneration harvest.
Aspen is assumed to have a minimum rotation age of 110 years, per the 2005 Forest Management Plan. Poletimber aspen stands can receive an optional commercial thinning at ages 70 – 95. This thinning is designed to remove conifer species first, leaving aspen when possible. Once aspen stands reach rotation age, they become available for a regeneration harvest. Natural regeneration following regeneration harvesting is assumed.
Spruce stands are also modeled with a minimum rotation age of 110 years (based on the 2005 Plan). Sapling and poletimber stands can receive an optional commercial thinning between the ages of 85 and 100. In addition, sapling stands can be precommercially thinned between the ages of 30 and 40. Once stands reach 110 years, they are eligible to receive a final harvest. Natural regeneration of the stand is assumed. Regenerated stands can also be precommercially thinned and/or commercially thinned. Details of the even‐aged regimes are presented in Table 13 of the Appendix.
2.3.2.4 Growth & Yield Projections
Growth and yield projections were produced for the 204 biostrata for each silvicultural regime and harvest timing option using the FVS growth model. Details of the FVS model usage are included in the Appendix.
Growth simulations tracked the following values for each period in the projections:
• Pine inventory (primarily ponderosa and southwest white pine)
Attorney-Client Communication ENTRIX, Inc. ●L-12 Privileged, Confidential Information
• Other conifer inventory (all other commercial conifer species) • Hardwood inventory (aspen) • Pine thinning volume • Other conifer thinning volume • Hardwood thinning volume • Basal area before and after thinning • Stocking class before and after thinning • Change in stocking class after thinning • Inventory value • Thinning volume value
Trees of noncommercial species, including primarily cottonwood, juniper, oak, pinyon pine, and chihuahua pine were included in the growth projections but not in inventory or harvest volumes.
Inventory and thinning volume values are based on the return‐to‐log values described in Section 2.3.2.5.
2.3.2.5 Economic Assumptions
Stumpage Value
The value of timber harvested in the forest model is based on Return‐to‐Log (RTL) values for the Fort Apache Timber Company (FATCO) sawmill. RTL values are calculated by taking the selling price of the finished lumber products (and marketable byproducts such as chips) and subtracting out all costs of production – logging, hauling, and milling costs – except the cost of the standing trees themselves. The result is a residual value that represents the value of the standing tree to the mill. RTL varies by log size; larger logs have more value per unit of volume because they can be processed more efficiently and produce higher value final products.
Mater Engineering, Inc. obtained RTL values by log diameter class for the FATCO small and large log sawmills. These values, which we used in our model, are summarized in Table 1.
Attorney-Client Communication ENTRIX, Inc. ●L-13 Privileged, Confidential Information
Table 1 Return-to-log Values for Conifer Harvest
Small End Diameter RTL ($/mbf log scale)
20+” $450
16 – 19” $390
12 – 15” $200
6 - 11” $100
The RTL values were assigned to conifer sawlogs only. Aspen harvest volume is tracked but no value is placed on its volume as it is not used in the mill and has limited outside markets.
Fire Risk Reduction Value
One benefit of active management to reduce acres in overstocked, crowded conditions is a reduction in risk of catastrophic fire.
A report by Snider et. al. (2003) estimated the value of forest‐restoration based hazardous fuel reduction treatments in overstocked forests of Arizona and New Mexico. The analysis indicates that it is cost‐effective to spend up to $505/acre to restore forests to prevent catastrophic fire and avoid associated fire suppression costs. This value, according to the report, is a conservative estimate of the benefit of fire risk reduction based on a comparison of the cost of restoration versus the cost of suppression, emergency rehabilitation, and lost timber production. This partial measure of value does not include the costs of damage to water supplies, lost recreation revenues, lost wages, destroyed property, loss of scenic value and wildlife habitat that would result from catastrophic fire.
The $505/acre benefit of fire risk reduction applies to overstocked forests classified as Fire Condition Class 3 lands. These forests are generally severely overstocked. Presumably, the benefit would be less for less overstocked stands, since the cost of suppression and extent of damage from a less severe wildfire would presumably be lower.
To estimate a fire risk reduction value in our forest model, we have estimated a fire risk reduction benefit whenever stands are moved, via a partial thinning, from either the excessively‐stocked or the over‐stocked class to a lower stocking class. We did not have Fire Condition Class data and assumed that Excessively‐stocked stands on the reservation would be Condition Class 3. We assumed a lesser benefit for thinning in the over‐stocked class. The values assumed in the model are as follows:

Attorney-Client Communication ENTRIX, Inc. ●L-14 Privileged, Confidential Information
Table 2 Fire Risk Reduction Value by Stocking Class Change
Stocking Class Before Thinning
Stocking Class After Thinning
Fire Risk Reduction Benefit ($/acre)
Excessively-stocked Over-stocked $300
Excessively-stocked Well-stocked $500
Excessively-stocked Under-stocked $500
Over-stocked Well-stocked $300
Over-stocked Under-stocked $300
This is a one‐time benefit that occurs in the period of thinning. Snider et. al. (2003) assumed a 3 percent discount rate and a 20‐year effectiveness period – assumptions that are consistent with our discount rate and cutting cycle.
PCT / TSI Cost
The cost for precommercial thinning / timber stand improvement treatments is assumed to be $150 per acre. This figure was confirmed with tribal forestry staff.
Other management costs, such as timber sale preparation and administration, road costs, and personnel have been ignored in this analysis for simplicity. We have assumed this will not materially affect the relative results between the two Cases.
Discount Rate
The discount rate used to calculate Present Net Values was 3%. This real rate is consistent with the rate for long term investments used in other parts of this study.
Inflation
This model assumes 0% inflation and no cost or price changes from period to period.
2.3.2.6 Management Objective & Constraints
Management Objective
The 2005 Forest Management Plan outlines a number of management objectives for the Fort Apache forest. These include goals for many resource values – timber production, wildlife
Attorney-Client Communication ENTRIX, Inc. ●L-15 Privileged, Confidential Information
habitat, forest health, cultural resources, protection from loss from catastrophic fire, etc. For the purposes of the forest model, however, it is necessary to state a single quantitative objective that can be maximized or minimized, subject to other quantitative constraints or limitations. For example, a financial measure such as net present value could be used if the objective of management was financial in nature. Alternatively, maximization or minimization of some forest condition could be used as an objective to reflect resource condition goals.
Our review of the 2005 Forest Plan, as well as discussion with Agency and tribal forestry staff during our on‐site visit, led us to conclude that the overall management objective for the forest could be stated as development and maintenance of a “Desired Future Condition”, or DFC. The DFC describes the intended or desired condition of the forest at some future point in time. In general terms, the DFC of the Ft. Apache forest is to bring the forest into a state where the majority of acres represent uneven‐aged forests with a variety of tree sizes present, and where the stocking level is within the range of a defined Lower and Upper Management Zone.
This control of stocking levels is the general goal of the uneven‐aged silvicultural regimes in the 2005 Plan. Tree growth and vigor are highly density dependent, so maintaining proper tree density encourages vigorous, healthy trees and tends to minimize losses from insects and disease. Reducing stand density to more natural, historic levels also serves to reduce risk of catastrophic fire. Wildlife are also likely to benefit from management that returns the forest to more natural stocking levels and maintains those conditions over time.
In terms of our model, this goal has been interpreted as maximization of the area of forest in the Well‐Stocked density class. Since the Well‐Stocked class is equivalent to the Lower/Upper Management Zone defined in the Forest Plan, maximizing acreage in this class will drive the forest model to maintain as many acres as possible within the Management Zone density range.
Management Constraints
Maximization of the acreage of well‐stocked stands is a primary objective of management but not the only objective. Other goals as well as limitations are represented in the forest model as constraints:
• All operable acres are managed – The model assumes that all operable acres are assigned to a regime that produces a timber harvest. No operable acres are assigned to the “grow only” regime.

Attorney-Client Communication ENTRIX, Inc. ●L-16 Privileged, Confidential Information
• Precommercial thinning budget – The number of acres that can receive precommercial thinning / timber stand improvement treatment is limited by a PCT budget. This budget varies by scenario as described in Section 2.3.3.
• Dwarf Mistletoe treatment – all acres identified as high�hazard for mistletoe must be thinned within the first 30 years. We assume these thinnings will clean up the infestation.
• Regeneration harvests – regeneration harvests are only allowed on the operable acres within the aspen and spruce�fir vegetation types. In addition, the number of regeneration acres in any period must be within ±10% of the acres of all other periods. This constraint has the effect of spreading out these harvests over time while still allowing some flexibility from period to period.
• Aspen harvest – The volume of aspen harvested in any period was allowed to vary no more than ±10% of the harvest in all other periods. This was done to maintain a relatively steady harvest of aspen which has limited markets and is not used in the FATCO sawmill.
• Mill Supply – we assume that it is necessary for the FATCO sawmill to have a steady, sustainable supply of timber. Therefore, total supply including harvest from the Ft. Apache forest and hybrid poplar plantation (in the Alternative Case) cannot decline from period to period.
In addition to these explicit constraints, other limitations and policies are modeled by limiting the regime choices. As noted previously, no harvest is allowed from the unregulated portion of the forest. This includes areas with slopes greater than 40%, inaccessible areas, and all forest within the Wilderness, Sensitive Plant, Recreation, Sensitive Sites, Community and Limited Management MEAs. These areas are all assigned to the “grow only” regime. Also, only the Fuel Management regime could be applied within the Fuel Management MEA and only the Special or Large Tree regime could be used within the Sensitive Fish, Water, and Scenic Byways MEA.
2.3.3 Alternatives Considered
2.3.3.1 Base Case
The status quo Base Case assumes continued management of the natural forest with no hybrid poplar plantation. The PCT budget is limited to $300,000 per year, resulting in a limit of 2,000 acres of precommercial thinning / timber stand improvement activities annually. This level of activity is based on actual accomplishments in recent years.
Attorney-Client Communication ENTRIX, Inc. ●L-17 Privileged, Confidential Information
2.3.3.2 Alternative Case
The Alternative Case examines the effects of a hybrid poplar plantation on the future management of the natural forest. The following specific assumptions were made about the poplar plantation enterprise:
• A hybrid poplar plantation is established yielding a sawlog harvest of 23.9 mbf/acre at age 12.
• Harvest of 659 acres annually, beginning in year 12, for an annual harvest of 15,700 mbf of poplar sawlogs.
• A portion of the annual returns from the hybrid poplar plantation are allocated to pre‐commercial thinning of the natural forest beginning in year 12. This eliminates the PCT budget constraint and allows as much PCT as needed in the forest.
Section 3.0 describes the estimated forest conditions as of the beginning of 2006, and examines the results of the two model scenarios.

Attorney-Client Communication ENTRIX, Inc. ●L-18 Privileged, Confidential Information
3.0 Results
3.1 Description of the Forest as of January 1, 2006
3.1.1 Acreage Distribution
The inventory update process described in Section 2.3.2.2 results in an estimate of forest conditions on the East Management Unit of the Reservation as of the beginning of 2006. Figure 1 illustrates the breakdown of acreage by vegetation type. The four pine types make up 72 percent of the forest. The mixed‐conifer type is the next largest component of the forest. Nine percent of the forest is comprised of the even‐aged aspen and spruce‐fir types.

Attorney-Client Communication ENTRIX, Inc. ●L-19 Privileged, Confidential Information
Figure 1 Estimated acres of forest land by vegetation type, 2006
Estimated acreage by stand size class is shown in Figure 2. More than 60 percent of the forest is classified as sawtimber stands. The majority of the stocking in these stands is made up of trees larger than 11‐inches DBH. Thirty‐six percent of the forest is classified as large sawtimber where the dominant tree size is greater than 17‐inches.
Figure 2 Estimated acres of forest land by stand size class, 2006.
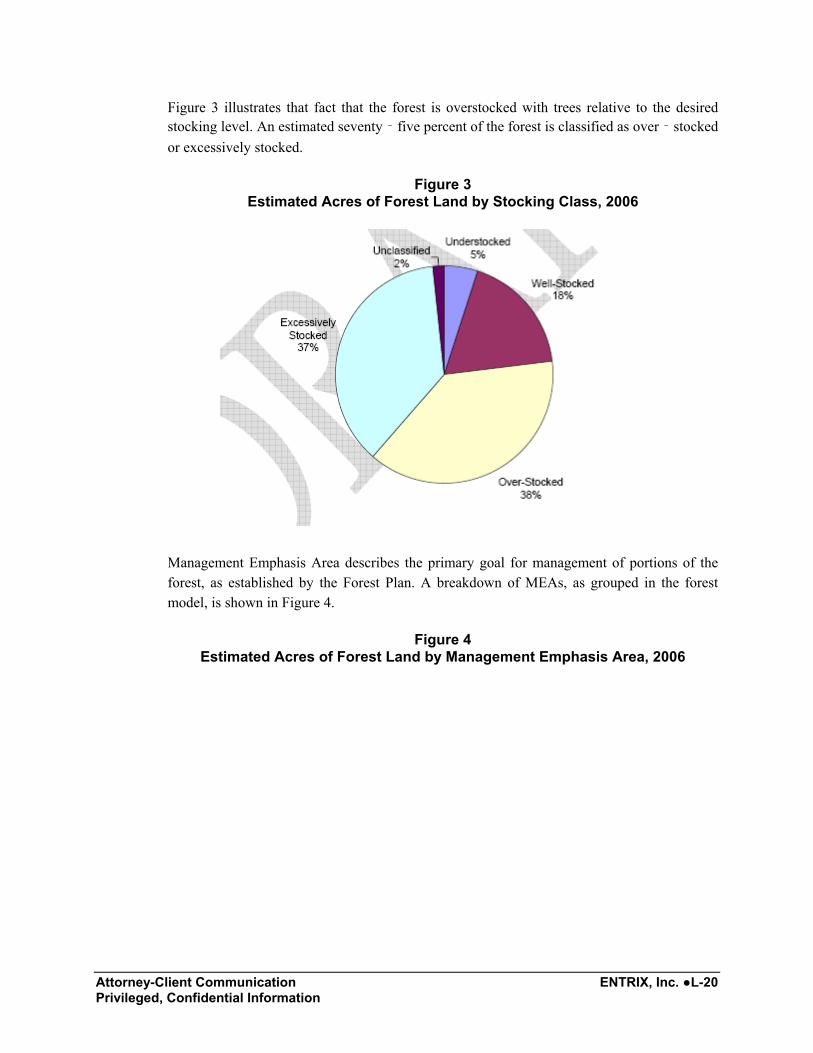
Attorney-Client Communication ENTRIX, Inc. ●L-20 Privileged, Confidential Information
Figure 3 illustrates that fact that the forest is overstocked with trees relative to the desired stocking level. An estimated seventy‐five percent of the forest is classified as over‐stocked or excessively stocked.
Figure 3 Estimated Acres of Forest Land by Stocking Class, 2006
Management Emphasis Area describes the primary goal for management of portions of the forest, as established by the Forest Plan. A breakdown of MEAs, as grouped in the forest model, is shown in Figure 4.
Figure 4 Estimated Acres of Forest Land by Management Emphasis Area, 2006

Attorney-Client Communication ENTRIX, Inc. ●L-21 Privileged, Confidential Information
Two‐thirds of the forest is managed in the Forest Products MEA with a primary goal of timber production. The next largest group of MEAs is labeled as “Unregulated Areas” in the Figure. This group includes the Wilderness, Sensitive Plant, Recreation, Sensitive Cultural Sites, Community, and Limited Management Emphasis Areas from which timber harvest generally does not occur. These areas are referred to as unregulated because they do not contribute timber to the regulated annual allowable cut. The Fuels Management MEA, representing ten percent of the forest, is made up of Wildland Urban Interface and Hazard Fuel Reduction treatment areas within and adjacent to communities and scattered throughout the Reservation. The primary objective of this MEA is to provide defensible space in and around communities and reduce hazardous fuel loads. Sensitive Areas that do receive timber harvesting include Water, Sensitive Wildlife, and Scenic Byways MEAs. These make up seven percent of the forestland.
More detailed acreage data for the forest is available in the Appendix in Table 6 through Table 11.
3.1.2 Timber Inventory
MB&G’s projected timber inventory as of year‐end 2005 for the East Management Unit forest is 6,280 million board feet (gross). We have assumed a 5% loss for hidden defect and breakage, so the initial inventory is reduced to a net inventory 5,944 MMBF (Table 3).

Attorney-Client Communication ENTRIX, Inc. ●L-22 Privileged, Confidential Information
Table 3 Initial (2006) Inventory by Vegetation Type and Species
Group, Million Board Feet Vegetation Type Aspe
n Other
Conifer Pine Total
Aspen 297 137 33 467
Mixed Conifer 378 1,033 429 1,841
Pine/Grass/Gambel Oak 59 110 1,775 1,945
Pine/Pinyon/Juniper/Live Oak
46 380 426
Pine-Chaparral 4 16 20
Pine-Mixed Conifer 114 193 322 629
Spruce-fir 22 584 10 617
Total 871 2,108 2,965 5,944
3.2 Comparison of Base Case and Alternative Case Results
The Base Case assumes management of the natural forest with no hybrid poplar plantation. The objective is to maximize the area of forest in a well‐stocked condition over time, while providing a stable supply of pine and other conifer timber volume to the FATCO mill. Precommercial thinning treatments are limited to 2,000 acres due to budget constraints. Additionally, areas identified as having high levels of infestation with dwarf mistletoe must be thinned within the first 30 years.
In the Alternative Case, development of a hybrid poplar plantation produces sawlog volume that can be used in the FATCO sawmill, beginning in year 12, to replace some harvest volume from the natural forest. This allows harvest of the natural forest to be increased in the early years in anticipation that hybrid poplar volume will become available in year 12. A benefit of this accelerated harvest is higher revenues in the early years and an opportunity to more quickly reduce stocking densities to the desired range. In addition, the poplar plantation enterprise generates a net revenue which will be used to increase the budget for PCT/TSI of the natural forest. These treatments improve future growth and value of the forest and help to more quickly reduce stocking densities to the desired range.
The following sections compare results of the Base and Alternative Cases. A detailed tabular summary of each case is found in the Appendix.

Attorney-Client Communication ENTRIX, Inc. ●L-23 Privileged, Confidential Information
3.2.1 Harvest Volume and Log Supply to Mill
The annual conifer harvest projected under the Base Case is 71.2 million board feet (MMBF‐Scribner log scale) as shown in Figure 5 (left graph). The aspen harvest volume is in addition to this volume, and varies between 2.8 and 3.1 MMBF per year.
Figure 5 Annual Harvest Volume and Log Supply to Mill, Base Case
Figure 5 (right graph) shows the annual logs supplied to the FATCO mill under the assumption that all conifer logs are delivered to the mill. The annual mill supply under this Base Case scenario consists only of the 71.2 MMBF conifer harvest since no hybrid poplar volume is available.
In the Alternative Case, conifer harvest is 85.8 MMBF for the first 10 years, drops to 76.4 MMBF in the third period, then settles at a sustained 70.1 MMBF for the remainder of the projection. Aspen harvest averages 3.0 MMBF annually throughout the projection (Figure 6).
In total, the conifer harvest under the Alternative Case is 4 percent higher than the Base Case. An increase in conifer harvest in the first three periods is partially offset by a slight reduction in harvest volume beginning in Period 4, as shown in Figure 7.
The reduction in conifer harvest beginning in Period 3 is replaced at the sawmill with poplar harvest from the hybrid poplar farm. In all years, total log supply to the mill is level at 85.8 MMBF. This represents a 21 percent increase in log supply to the mill compared to the Base Case (Figure 8).

Attorney-Client Communication ENTRIX, Inc. ●L-24 Privileged, Confidential Information
Figure 6 Annual Harvest Volume and Log Supply to Mill,
Alternative Case
Figure 7 Comparison of Annual Conifer Harvest by Case

Attorney-Client Communication ENTRIX, Inc. ●L-25 Privileged, Confidential Information
Figure 8 Comparison of Annual Log Supply by Case
3.2.2 Timber Inventory
Total inventory increases gradually under the Base Case from 6.1 to 6.7 billion board feet (Bbf) as shown in Figure 9. The increase in inventory occurs exclusively on the inoperable area where harvest does not occur. Inventory on the operable portion of the forest declines 17 percent, from 4.0 Bbf in 2006 to 3.2 Bbf by 2055. This decline is a result of the intentional reduction of area in an overstocked condition.
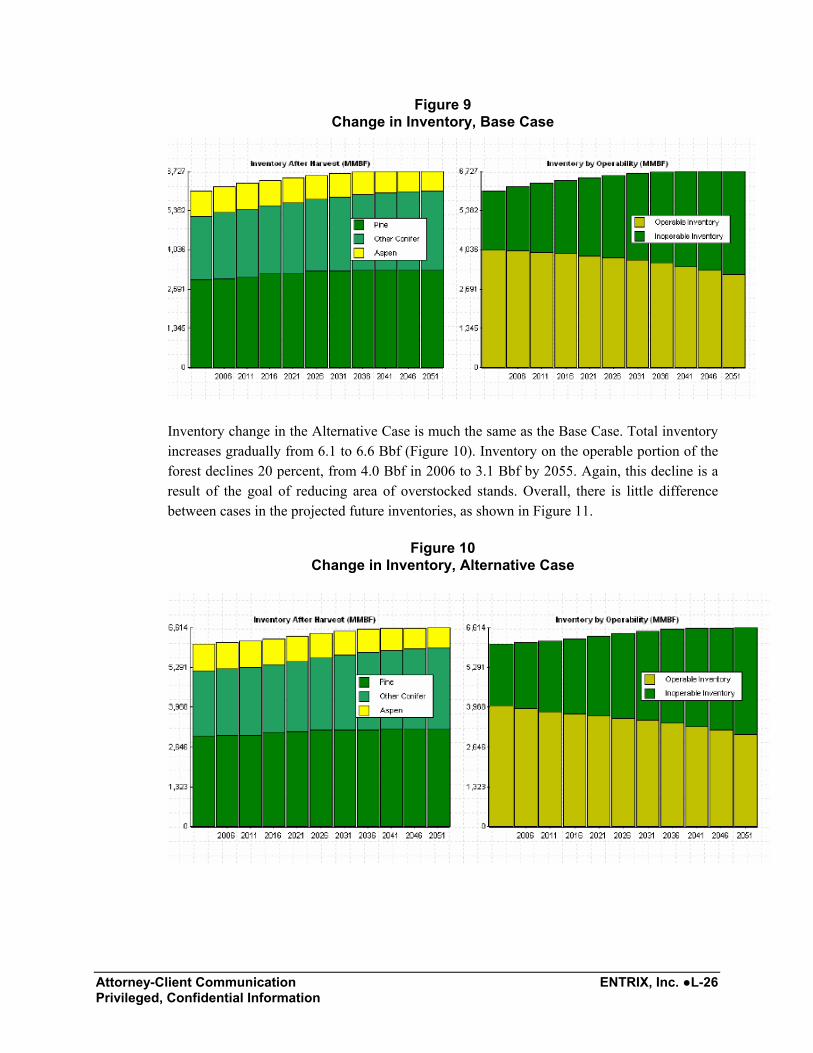
Attorney-Client Communication ENTRIX, Inc. ●L-26 Privileged, Confidential Information
Figure 9 Change in Inventory, Base Case
Inventory change in the Alternative Case is much the same as the Base Case. Total inventory increases gradually from 6.1 to 6.6 Bbf (Figure 10). Inventory on the operable portion of the forest declines 20 percent, from 4.0 Bbf in 2006 to 3.1 Bbf by 2055. Again, this decline is a result of the goal of reducing area of overstocked stands. Overall, there is little difference between cases in the projected future inventories, as shown in Figure 11.
Figure 10 Change in Inventory, Alternative Case

Attorney-Client Communication ENTRIX, Inc. ●L-27 Privileged, Confidential Information
Figure 11 Comparison of Inventory Trends by Case
3.2.3 Stocking Conditions
The number of acres in a well‐stocked condition improves markedly under both scenarios. Across the entire forest (left graph in Figure 12), acres of well‐stocked stands increase from 87,500 acres initially, to 315,000 acres by the end of 50 years in the Base Case. The proportion of the forest that is over‐stocked or excessively‐stocked drops from 78 percent initially to 34 percent of the forest by 2051.
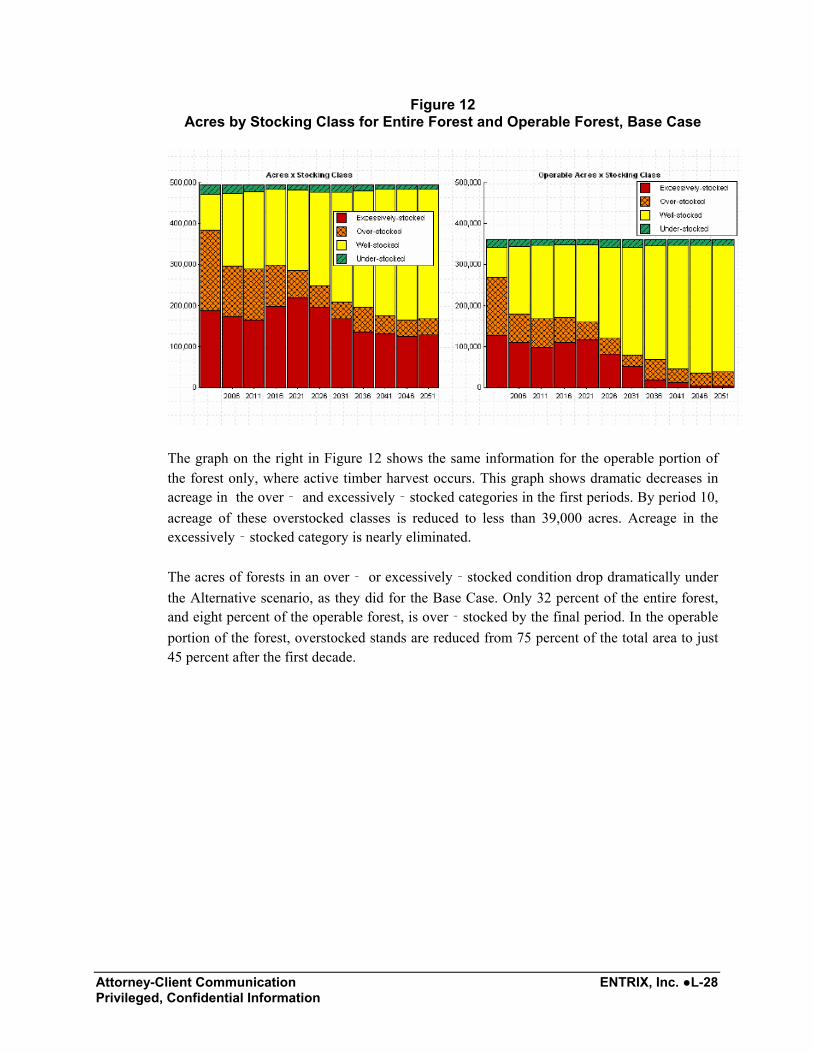
Attorney-Client Communication ENTRIX, Inc. ●L-28 Privileged, Confidential Information
Figure 12 Acres by Stocking Class for Entire Forest and Operable Forest, Base Case
The graph on the right in Figure 12 shows the same information for the operable portion of the forest only, where active timber harvest occurs. This graph shows dramatic decreases in acreage in the over‐ and excessively‐stocked categories in the first periods. By period 10, acreage of these overstocked classes is reduced to less than 39,000 acres. Acreage in the excessively‐stocked category is nearly eliminated.
The acres of forests in an over‐ or excessively‐stocked condition drop dramatically under the Alternative scenario, as they did for the Base Case. Only 32 percent of the entire forest, and eight percent of the operable forest, is over‐stocked by the final period. In the operable portion of the forest, overstocked stands are reduced from 75 percent of the total area to just 45 percent after the first decade.
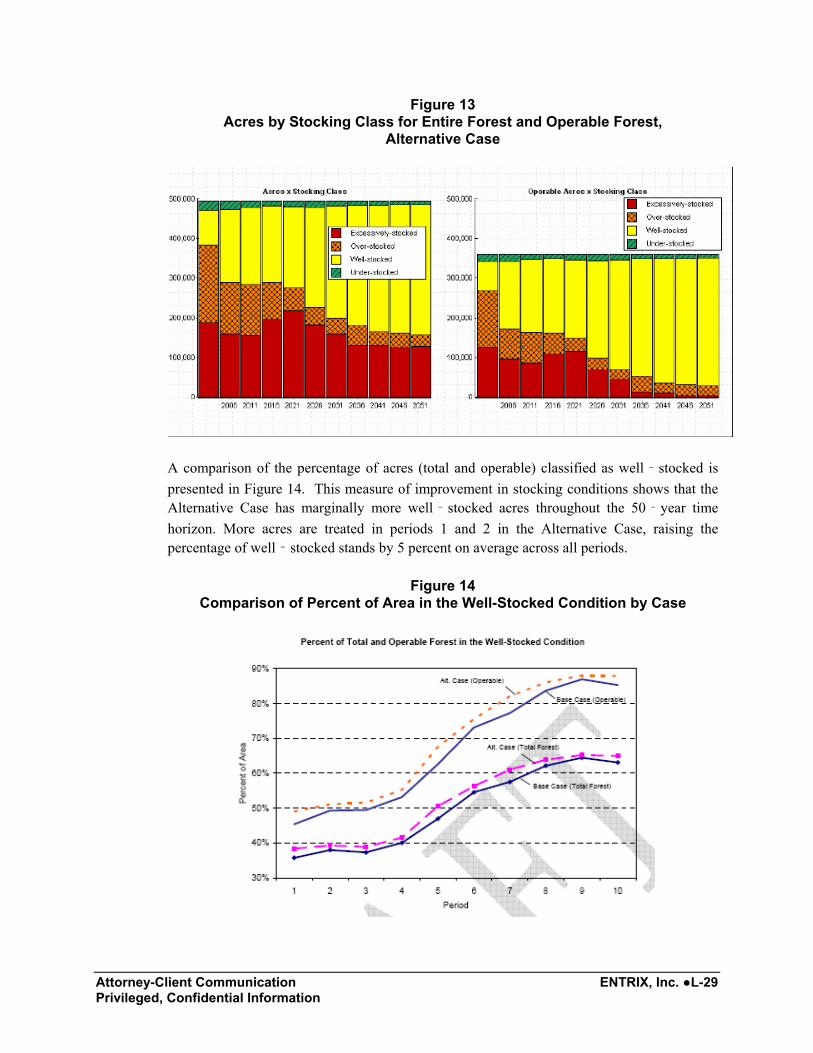
Attorney-Client Communication ENTRIX, Inc. ●L-29 Privileged, Confidential Information
Figure 13 Acres by Stocking Class for Entire Forest and Operable Forest,
Alternative Case
A comparison of the percentage of acres (total and operable) classified as well‐stocked is presented in Figure 14. This measure of improvement in stocking conditions shows that the Alternative Case has marginally more well‐stocked acres throughout the 50‐year time horizon. More acres are treated in periods 1 and 2 in the Alternative Case, raising the percentage of well‐stocked stands by 5 percent on average across all periods.
Figure 14 Comparison of Percent of Area in the Well-Stocked Condition by Case

Attorney-Client Communication ENTRIX, Inc. ●L-30 Privileged, Confidential Information
3.2.4 Harvest Value
The value of the harvest, as measured by Return‐to‐Log value at the FATCO sawmill, averages $16.7 million annually over 50 years for the Base Case. Value varies from year to year as the mix of log sizes changes. By comparison, the value of the harvest under the Alternative Case averages $17.6 million annually, an average improvement of nearly $1.0 million annually over the Base Case. The Alternative Case has a 32 percent higher harvest value in the first decade due to the higher harvest level. Figure 15 illustrates annual harvest value by case.
Figure 15 Comparison of Annual Harvest Value by Case
3.2.5 Fire Risk Reduction Acres and Value
Fire risk is reduced by thinning overstocked forests. The assumed value of this risk reduction, in terms of avoided fire suppression and emergency rehabilitation costs and lost timber productivity is illustrated in Figure 16 for the Base Case. The top chart shows the annual acres moved from a higher stocking class to a lower class as a result of thinning treatments. Acreage treated varies from period to period but averages 10,743 acres annually.

Attorney-Client Communication ENTRIX, Inc. ●L-31 Privileged, Confidential Information
Figure 16 Fire Risk Reduction Acres and Value, Base Case
The lower chart in Figure 16 shows that value of fire risk reduction under the assumptions described in Section 2.3.2.5. The value of fire risk reduction through thinning averages $4.0 million per year.
Figure 17 summarizes acres of fire risk reduction through thinning and the estimated value of the fire risk reduction for the Alternative Case. Acreage treated varies from period to period but averages 11,184 acres annually. The value of fire risk reduction through thinning averages $4.1 million per year, an increase of 3 percent over the Base Case.
Although this may not appear to be a significant difference, the fire risk reduction occurs sooner under the Alternative Case. The value of fire risk reduction is 13 percent higher in the first decade under the Alternative Case and 6 percent more acres are treated. Figure 18 compares the fire risk reduction value between Cases.

Attorney-Client Communication ENTRIX, Inc. ●L-32 Privileged, Confidential Information
Figure 17 Fire Risk Reduction Acres and Value, Alternative Case
Figure 18 Comparison of Annual Fire Risk Reduction Value by Case
Attorney-Client Communication ENTRIX, Inc. ●L-33 Privileged, Confidential Information
4.0 Conclusions
4.1 Net Present Value of Cases
The Net Present Value (NPV) of the Base and Alternative Cases can be calculated from three components:
• The net timber production value
• The value of the ending timber inventory in year 50
• The fire risk reduction value
The harvest value less precommercial thinning expense approximates a net value of timber production on the Reservation forest. Other management costs, such as timber sale preparation and administration, road costs, and personnel have been ignored in this analysis for simplicity. We have assumed this will not materially affect the relative results between the two Cases.
An ending inventory value is used to adjust for any differences between the Base and Alternative Cases in the forest value at the end of the 50‐year model time period. To approximate an ending inventory value, the model tracks the value of the standing inventory based on the RTL values per unit of volume and the inventory volume by log size class. This provides an estimate of the value of the ending inventory for any given time period. Using this total value, however, would overestimate the ending value of the forest. Large tracts of timberland generally sell at a discount to their full stumpage value in recognition of the fact that the entire inventory would be cut over a long period of time. When estimating ending inventory value, MB&G applies a “valuation factor” which varies with the size of the inventory; the larger the inventory, the more the value is discounted. MB&G maintains a database of timberland transactions and has developed a relationship between timberland sale prices and the size of the sale. This is used to estimate a valuation factor. For a forest of this

Attorney-Client Communication ENTRIX, Inc. ●L-34 Privileged, Confidential Information
size, we estimate a valuation factor of 43 percent. To estimate the ending inventory value, we multiplied the full value of the ending inventory value by this valuation factor.
The final component of NPV is the fire risk reduction value, which has been discussed previously.
The NPV of each Case is summarized in Table 4. The Alternative Case has an NPV that is $30.8 million higher than the Base Case. This includes a $32.2 million increase for timber production value, a $6.3 million decrease for ending inventory value and a $4.9 million increase in fire risk reduction value. This incremental value represents the potential impact of the proposed hybrid poplar farm on the value of the Reservation forest.
Table 4 Net Present Value of Alternative Cases at a 3 percent Discount Rate
Description Base Case Alternative Case Difference
Million Dollars
Net Timber Production 409.2 441.4 32.2
Ending Inventory Value, Yr 50
110.0 103.7 (6.3)
Fire Risk Reduction Value 96.4 101.4 4.9
Total $615.6 646.5 $30.8
The increase in net timber production value is largely due to higher initial harvest volume in periods 1 – 3 in the Alternative Case. This increased harvest is facilitated by the hybrid poplar plantation which begins providing harvest volume in Period 3 (year 12) to offset a decline in harvest from the natural forest.
Also contributing to the higher net timber production value is the effect of increased precommercial thinning activity, which increases the future volume and value of harvest by controlling stocking and increasing growth of the remaining trees. On average, PCT acreage increased by 187 percent in the Alternative Case compared to the Base Case. An average of 5,577 acres are treated annually beginning in period 3, when revenue from the hybrid poplar plantation is used to increase the PCT budget. By comparison, the Base Case treats an average of 1,695 acres annually throughout the 50‐year period.
The ending inventory value of the Alternative Case is slightly reduced due to the slightly lower standing inventory in year 50.
The Alternative Case shows a $4.9 million dollar higher value for fire risk reduction. This is due to more acres being thinned from over‐stocked conditions to well‐stocked conditions,

Attorney-Client Communication ENTRIX, Inc. ●L-35 Privileged, Confidential Information
particularly in the early periods. The additional precommercial thinning activity of the Alternative Case is partially responsible for this increased fire risk reduction value.
4.2 Discussion
The results of the forest model indicate the potential impact of the proposed hybrid poplar farm on the value of the Reservation forest is a $30.8 million benefit. The majority of this benefit is due to the increased timber harvest from the Reservation forest over the first 11 years. This increase in harvest is only possible because of the supply of hybrid poplar that becomes available from the proposed plantation beginning in year 12.
Results are predicated on several key assumptions that should be highlighted. First, we assumed that a stable supply of timber (conifer from the natural forest and poplar from the plantation) is necessary for the FATCO mill over the 50‐year time horizon. This seems to be a reasonable assumption given the desire of the Tribe to have a steady source of employment and income from the tribal‐owned sawmill company.
Second, we have assumed that the management direction of the natural forest will be influenced by the development of the proposed poplar farm. It is assumed that the Tribal decision makers and BIA would be willing to increase harvesting from the Reservation forest in the short‐term in anticipation of future harvest volume from the poplar plantation. The increased value of the Alternative Case is highly dependent on this assumption.
It could be argued that the Tribal decision makers and BIA could increase timber harvests in the short‐term to the level of the Alternative Case even without the investment in the proposed hybrid poplar plantation. This is true, if the Tribe was willing to accept an inevitable future decline in harvest levels at some point. However, the fact that they so far have not chosen to do so, even though the FATCO mill is operating at a reduced rate, is evidence of the Tribe’s over‐riding concern for maintaining a harvest level that is sustainable long into the future.
We have assumed the FATCO mill can use the species and log size mix projected in the future harvest and that the Return‐to‐Log values we used are accurate representations of value to the mill. We have also assumed that the FATCO sawmill will use the poplar volume when it becomes available. This issue is being assessed in a companion study.
A second significant contributor to the NPV of each case was the estimated fire risk reduction value of $4.9 million. Our assumption here is that the fire risk reduction value of up to $505/acre reported by Snider et. al. (2003), as applied by the model, is an accurate representation of this value. We feel confident in this assumption. First, the value is inherently conservative in that it only includes avoided costs for fire suppression and
Attorney-Client Communication ENTRIX, Inc. ●L-36 Privileged, Confidential Information
post‐fire emergency rehabilitation and some estimate of lost timber productivity. It does not include other direct costs of wildfires including the potential for loss of life, buildings and other infrastructure, nor does it include an estimate of non‐financial resource losses from fire such as wildlife habitat, water quality degradation, soil loss, and air pollution. Others have placed the value of fuel reduction at more than $1,400 per acre for high risk forests in other parts of the western U.S. (Mason et. al., 2006).
The forest model described in this report was designed for the relatively limited purpose of this analysis. It is intended for use as a tool to evaluate the relative impact of a hybrid poplar plantation on the potential future management and value of the Reservation forest. It was not intended and should not be interpreted as a recommended forest plan.

Attorney-Client Communication ENTRIX, Inc. ●L-37 Privileged, Confidential Information
5.0 Literature Cited
Fort Apache Agency. 2004. 1995 Forest Inventory Analysis: Fort Apache Indian Reservation. White River, Arizona. October 12, 2004.
Fort Apache Agency. 2005. Forest Management Plan 2005‐2014: Fort Apache Indian Reservation.
Mason, L.C., B.R. Lippke, K.W. Zobrist, T.D. Bloxton, K.R. Cedar, J.M. Comnick, J.B. McCarter, and H.K. Rogers. 2006. Investments in fuel removals to avoid forest fires result in substantial benefits. J. For. 104(1):27‐31.
Snider, G.B., D.B. Wood, and P.J. Daugherty. 2003. Analysis of costs and benefits of restoration‐based hazardous fuel reduction: Treatment vs. no treatment. Progress Report No. 1. Ecological Resource Institute, Northern Arizona University. June 13, 2003. Available at: http://hdl.handle.net/2019/324

Attorney-Client Communication ENTRIX, Inc. ●L-38 Privileged, Confidential Information
6.0 Appendix
Tree Merchandizing Specifications
Trees were merchandized using a western tree taper function which was calibrated to local volumes. Initial inventory merchandizing specifications were set to match those documented in the 1995 Forest Inventory Analysis document and included:
• Minimum DBH: 11” DBH • Min Top DOB: 8” DIB • Log Lengths: 16’ preferred, 12’ minimum • Minimum of one 16’ log per tree • Stump Height: assuming 1’ • Defect: No defect deductions applied.
Different merchantability specifications were used once the initial inventory was benchmarked to the 1995 inventory report. These updated merchantability specifications were based on recent mill specifications. During the inventory update process, trees were re‐merchandized using the following parameters:
• Minimum DBH: 8” DBH • Min Top DOB: 6” DIB • Log Lengths: 16’ preferred, 12’ minimum • Minimum of one 16’ log per tree • Stump Height: assuming 1’ • Defect: No defect deductions applied.

Attorney-Client Communication ENTRIX, Inc. ●L-39 Privileged, Confidential Information
In the growth and yield projections for the forest model, a 5 percent defect was assumed. This includes 3% hidden defect and 2% breakage and is consistent with the assumptions of the 1995 inventory report.
Benchmarking and Updating Initial Inventory
Plots were stratified by their Forest Management Zone, and board foot volumes by strata were benchmarked against the volumes reported in the 1995 Forest Inventory Analysis document (Tables 13 – 16). The taper function was calibrated during this benchmark process to more closely approximate the local volume equations. The table below shows the final benchmark volume comparisons, by strata, between the FIA document and MB&G’s estimated volume.

Attorney-Client Communication ENTRIX, Inc. ●L-40 Privileged, Confidential Information
Table 4
The following graph shows the annual projection of inventory from 1995 through 2005. The left‐most ’benchmark’ bar in the benchmark volume which matches the 1995 FIA report within 1% of total volume. The ‘Remerch’ next to it is the same trees re‐merchandized using a smaller minimum DBH and top diameter. Bars to the right of this show the annual growth and depletions (harvest volume removed) through the time period shown. Average projected growth was 111.8 MMBF per year, or 1.8% of inventory.

Attorney-Client Communication ENTRIX, Inc. ●L-41 Privileged, Confidential Information
Figure 19 Projection of Inventory Volumes from 1995 to 2005, showing depletions and
growth in each period
CFI Plot Stratification
This section describes the land classification system used to develop the forest model. Tables showing acreage by class follow the description of the stratification scheme.
Biological Strata
Vegetation Type
The forest has been classified by the Fort Apache Agency into 7 forest vegetation classes, or forest types. These are as follows:
• Pine – Pinyon/Juniper – Live oak • Pine Chaparral • Pine/Grass/Gambel Oak • Pine�Mixed Conifer • Mixed Conifer

Attorney-Client Communication ENTRIX, Inc. ●L-42 Privileged, Confidential Information
• Aspen • Spruce�Fir
Each CFI plot was assigned a vegetation type based on an overlay of the GIS vegetation type layer on plot locations.
Size Class
Stand size class was determined based on the predominant tree size in the stand as determined by basal area. Each tree in the plot was classified into one of four size classes as follows:
• Sapling: < 5” DBH • Poletimber: 5.0 to 10.9” DBH • Small Sawtimber:11.0” to 16.9” DBH • Large Sawtimber: 17.0 inch DBH and greater
Stand Size Classes were then determined based on which tree size class had the most basal area. For example, if the total basal area of small sawtimber trees exceeded that of the sapling, poletimber, and large sawtimber trees, the stand was classified as small sawtimber.
Stocking Class
Plots were classified into one of four stocking classes based on total stand basal area. The basal area of a single tree is the top surface area of the stump if the tree was to be cut off 4.5 feet above the ground. A stand’s basal area is the sum of all the tree basal areas on an acre and is measured in square feet.
For the Fort Apache forest, we defined 4 stocking classes with basal area ranges that vary by vegetation type. The categories are generally described as follows:
• The Well‐Stocked category matches the range of the Upper and Lower Management Zone as defined in the Fort Apache Forest Management Plan 2005‐2014.
• Under‐stocked stands have basal area less than the minimum basal area of the well‐stocked category.
• Overstocked stands have basal areas up to 50% higher than the high‐end of the well‐stocked range.

Attorney-Client Communication ENTRIX, Inc. ●L-43 Privileged, Confidential Information
• Excessively‐stocked stands have basal areas in excess of 50% of the high‐end of the well‐stocked range.
Ideally, stands would be managed within the well‐stocked range of density to promote forest health and minimize mortality and losses from insects, disease, overcrowding and fire. In fact, this is the range of stand densities in which the Fort Apache Agency intends to manage the operable portion of the forest in which timber harvesting is allowed.
Since the Upper/Lower Management Zone basal area ranges in the Forest Management Plan vary somewhat depending on the Management Emphasis Area, we generalized the basal area ranges as follows:
Table 5 Stocking Classes by Vegetation Type
Under-Stocked Well-Stocked Over-Stocked Excessively-Stocked
Description
Min BA
Max BA
Min BA
Max BA Min BA
Max BA
Min BA
Max BA
Pine/Pinyon/Juniper/Live oak
0 44 45 91 92 136 137 242
Pine Chaparral 0 36 37 78 79 117 118 160
Mixed Conifer 0 60 61 122 123 183 184 346
Aspen 0 150 151 215 216 280 281 421
Pine/Grass/Gamble oak 0 47 48 96 97 144 145 349
Pine/Mixed Conifer 0 58 59 112 113 167 168 283
Spruce/Fir 0 100 101 140 141 210 211 283
Site Class
Site Index is a measure of site productivity based on the height of dominant trees at age 100. Fort Apache CFI plot data includes an estimate of Site Index for each plot. This data was used to classify each plot into Low, Medium, or High Site Class. Site Classes were defined as follows:
• Low – Site Index < 75 • Medium – Site Index 75 – 90 • High – Site Index > 90

Attorney-Client Communication ENTRIX, Inc. ●L-44 Privileged, Confidential Information
Management Strata
Mistletoe Class
Mistletoes are the most wide spread tree disease in the southwest and have negative impacts on forest growth and health. Mistletoes are a parasitic plant that injure and eventually kill their tree host. Both dwarf mistletoes and true mistletoes occur on the Fort Apache Reservation and are problems receiving significant management attention by Reservation forest managers.
CFI tree data include mistletoe hazard rating for each tree. The 6‐class dwarf mistletoe rating (DMR) system is useful for quantifying intensity of infection in trees and stands. For this system, the live crown of the tree is visually divided into thirds and each third rated as: 0 = no visible infection, 1 = light infection (less than half of the branches in the crown third have dwarf mistletoe infections), or 2 = heavy infection (more than half of the branches in the crown third have infections). The three ratings are then added to obtain a tree rating ranging from 0 (healthy trees) to 6 (severely infected trees). The tree ratings of all live trees in a stand or plot (including uninfected ones) are then summed and the resulting total is divided by the number of live trees to obtain an average rating for the stand. Stands with a hazard rating of 0.4 and higher are considered high‐risk stands.
We classed stands into 2 Mistletoe Classes as follows:
• Absent/Low Hazard – Stand DMR rating < 0.4 • High Hazard – Stand DMR ≥ 0.4
The age of the CFI data makes this classification somewhat uncertain; we expect that we have underestimated acreage as high hazard for mistletoe. In the years since the CFI measurement, mistletoe infestations may have expanded. On the other hand, treatments of some of the high hazard stands would have reduced acreage. However, no more current assessment of mistletoe hazard was available.
Operability Class
Each plot was classified into one of two operability classes based on a GIS overlay of operability information. Cable ground (slopes greater than 40%) and inaccessible areas were classed as Inoperable because the current forest plan excludes these areas from the regulated timber harvest base. Operable areas included slopes less than 40% where ground‐based harvesting systems are applicable.

Attorney-Client Communication ENTRIX, Inc. ●L-45 Privileged, Confidential Information
Management Emphasis Areas
The current Forest Management Plan designated twelve Management Emphasis Areas (MEAs) that cover the Fort Apache Reservation. Six of these are not included in the regulated timberland base and are therefore not included in the forest model. The remaining six MEAs were grouped as follows for the purposes of this analysis:
• Forest Products – includes the Forest Products MEA.
• Fuels Management – Includes Fuels Management MEA.
• Sensitive Areas – includes Scenic, Wildlife, Fish and Water MEAs.
• Unregulated – includes Wilderness, Sensitive Plants, Sensitive Sites, Recreation, Community, and Limited Management MEAs
The total land base represented in the model is 495,032 acres. Less than 2 percent of the landbase (7,990 acres) could not be classified as to size class, stocking, site and mistletoe hazard because the strata lacked representative CFI plots. For this area, average conditions by vegetation type were assumed.
Acreage Tables
The following tables summarize model acreage by various strata. Table totals may not be consistent due to rounding.
Table 6 Acres by Size Class and Vegetation Type, 12/31/05

Attorney-Client Communication ENTRIX, Inc. ●L-46 Privileged, Confidential Information
Table 7 Acres by Stocking Class and Vegetation Type, 12/31/05
Table 8 Acres by Site Class and Vegetation Type, 12/31/05
Table 9 Acres by Operability Class and Vegetation Type, 12/31/05
Table 10 Acres by Mistletoe Hazard Class and Vegetation Type, 12/31/05

Attorney-Client Communication ENTRIX, Inc. ●L-47 Privileged, Confidential Information
Table 11 Acres by Emphasis Area and Vegetation Type, 12/31/05
Forest Vegetation Simulator
This analysis used the Central Rockies Variant of the Forest Vegetation Simulator (FVS), a growth and yield model developed by the USDA Forest Service for the central Rockies region including eastern Arizona. Where possible, procedures found in the 1995 Fort Apache inventory report relative to the use of FVS for calculation of the Annual Allowable Cut were followed.
Key FVS model parameters included:
• FVS Version: 6.31 RV:07.05.06 • SW Ponderosa Pine sub‐model • Forest location code (nearest national forest): Apache‐Sitgreaves
During the inventory update process, the following parameters were used:
• SDIMax for all types: 450
For yield table projections, the following parameters were used:
• SDIMax for pine types: 450 • SDIMax for aspen and spruce‐fir types: 600
• Mortality adjustments: • FIXMORT = 0.15 for aspen • FIXMORT = 0.06 for juniper, cottonwood, oak, misc. softwoods • FIXMORT = 0.20 for misc. hardwoods
MB&G uses a proprietary growth modeling environment to automate the production of yield tables. The system, called YTGTools, links the FVS growth model to a database containing tree lists for each biostrata (vegetation type, size class, site class, stocking class combination),

Attorney-Client Communication ENTRIX, Inc. ●L-48 Privileged, Confidential Information
instructions for each silvicultural regime, and output tables to store and summarize results. YTGTools produces the yield tables which are needed as input into the Woodstock forest model.
Regeneration of new seedlings normally occurs when uneven‐aged stands are disturbed by thinning. This natural regeneration process assures that new trees are added to take the place of trees that were removed, over time creating a multi‐aged forest structure. It is important in projecting growth and yield over long time periods to represent this natural regeneration process. However, FVS is not capable of accurately predicting natural regeneration. In order to model regeneration, we add new “reprod trees” to the existing tree list during the projection.
To develop realistic reprod tree lists, we examined CFI data on plots which had received a partial harvest 6‐10 years previous to measurement, and which had not been precommercially thinned in the meantime. From these plots, we developed representative reproduction tree lists by vegetation type. These describe the typical per acre reproduction you would expect to see, depending on the vegetation type, about 10 years after thinning. These reproduction tree lists were added to the projected tree lists 2 periods (10 years) following each partial thinning.
Silvicultural Regimes
Silvicultural regimes used in the model are summarized in Table 12 for uneven‐aged regimes and Table 13 for even‐aged regimes.

Attorney-Client Communication ENTRIX, Inc. ●L-49 Privileged, Confidential Information
Table 12 Parameters for Uneven-aged Silvicultural Regimes
Basal Area Target (sq.ft.)
Veg Type Emphasis Harvest Entry Cycle
Q-Factor
Max DBH
Lower Upper
Fuels Mgt 20 1.2 22 55 92
Forest Products 20 1.4 22 68 102
Large Tree 20 1.2 30 80 120
Mixed Conifer
Sensitive F/W, Water, Scenic
20 1.3 24 72 108
Fuels Mgt 40 1.1 16 42 60
Forest Products 40 1.3 16 41 65
Large Tree 40 1.2 24 47 66
Ponderosa Pine / Chaparral
Sensitive F/W, Water, Scenic
40 1.2 18 43 61
Fuels Mgt 20 1.1 22 43 72
Forest Products 20 1.3 22 53 80
Large Tree 20 1.2 30 60 90
Ponderosa Pine / Grass / Gambel Oak
Sensitive F/W, Water, Scenic
20 1.2 24 57 85
Fuels Mgt 40 1.1 18 40 67
Forest Products 40 1.3 18 50 76
Large Tree 40 1.2 26 58 87
Ponderosa Pine / Pinyon-Juniper / Live Oak
Sensitive F/W, Water, Scenic
40 1.2 20 54 81
Fuels Mgt 20 1.1 22 57 86
Forest Products 20 1.3 22 66 93
Large Tree 20 1.2 30 60 106
Ponderosa Pine / Mixed Conifer
Sensitive F/W, Water, Scenic
20 1.2 24 57 99
Species Preference
The following list of species lists the order in which trees were selected for thinning within a given diameter class, for uneven‐aged thinnings. This list is based on species preferences in the 1995 FIA document, page 43.

Attorney-Client Communication ENTRIX, Inc. ●L-50 Privileged, Confidential Information
• SPECIES PREFERENCES FOR RETENTION • Juniper (most likely to be retained after harvest) • Oaks • Other hardwoods • Pinyon pine • Aspen • Ponderosa pine • Douglas‐fir • White pine • Engelmann spruce • Blue spruce • White fir • Corkbark fir (least likely to be retained after harvest)
Table 13 Even-aged Silvicultural Regimes
Vegetation Type
Stand Size Class Precommercial Thin Commercial Thin Minimum
Rotation Age
Poletimber None
Optional thin at age 70 – 95 to 30% maximum SDI, removing conifer spp. first
110 years
Small Sawtimber
None None 110 years
Large Sawtimber
None None 110 years
Aspen
Regeneration Thin @ age 20 to 700 TPA
None 110 years
Sapling Thin @ age 30 to 40 to 850 TPA
Optional thin at age 85 – 100 to 180 sq.ft. basal area
110 years
Poletimber None
Optional thin at age 85 – 100 to 180 sq.ft. basal area
110 years
Small Sawtimber
None None 110 years
Large Sawtimber
None None 110 years
Spruce-fir
Regeneration Thin @ age 25 to 850 TPA
Optional thin to 180 sq.ft. basal area at age 70 – 80 if precommercially thinned, or 80 – 90 if not.
110 years

ENTRIX, Inc. 51
Base Case Summary
Description: Base Case Years per Period: 5 Discount Rate: 3.0%

ENTRIX, Inc. 52
Alternative Case Summary
Description: Alternative Case Years per Period: 5 Discount Rate: 3.0%