crop rotation biomass and effects on sugarcane yield in brazil
TRANSCRIPT

Chapter 1
© 2013 Ambrosano et al., licensee InTech. This is an open access chapter distributed under the terms of the Creative Commons Attribution License (http://creativecommons.org/licenses/by/3.0), which permits unrestricted use, distribution, and reproduction in any medium, provided the original work is properly cited.
Crop Rotation Biomass and Effects on Sugarcane Yield in Brazil
Edmilson José Ambrosano, Heitor Cantarella, Gláucia Maria Bovi Ambrosano, Eliana Aparecida Schammas, Fábio Luis Ferreira Dias, Fabrício Rossi, Paulo Cesar Ocheuze Trivelin, Takashi Muraoka, Raquel Castellucci Caruso Sachs, Rozario Azcón and Juliana Rolim Salomé Teramoto
Additional information is available at the end of the chapter
http://dx.doi.org/10.5772/53825
1. Introduction
Healthy soils are vital to a sustainable environment. They store carbon, produce food and timber, filter water and support wildlife and the urban and rural landscapes. They also preserve records of ecological and cultural past. However, there are increasing signs that the condition of soils has been neglected and that soil loss and damage may not be recoverable [1]. Soil is a vital and largely non-renewable resource increasingly under pressure. The importance of soil protection is recognized internationally.
In order to perform its many functions, it is necessary to maintain soil condition. However, there is evidence that soil may be increasingly threatened by a range of human activities, which may degrade it. The final phase of the degradation process is land desertification when soil loses its capacity to carry out its functions. Among the threats to soil are erosion, a decline in organic matter, local and diffuse contamination, sealing, compaction, a decline in bio-diversity and salinisation.
The authors in [2] made the interesting observation when study of nine great groups of New Zealand soils, that although many soil quality indicators will be different between soil types differing in clay and organic mater contents, land use had an overriding effect on soil quality: agricultural systems could be clearly differentiated from managed and natural forests, and grass land and arable land were also clearly separated.
Regular additions of organic matter improve soil structure, enhance water and nutrient holding capacity, protect soil from erosion and compaction, and support a healthy community of soil organisms. Practices that increase organic matter include: leaving crop

Biomass Now – Cultivation and Utilization 4
residues in the field, choosing crop rotations that include high residue plants, using optimal nutrient and water management practices to grow healthy plants with large amounts of roots and residue, applying manure or compost, using low or no tillage systems, using sod-based rotations, growing perennial forage crops, mulching, and growing cover crops as green manure [3].
Addition to being a frequent addition of organic matter should be diversified. Diversity cropping systems are beneficial for several reasons. Each plant contributes a unique root structure and type of residue to the soil. A diversity of soil organisms can help control pest populations, and a diversity of cultural practices can reduce weed and disease pressures. Diversity across the landscape can be increased by using buffer strips, small fields, or contour strip cropping. Diversity over time can be increased by using long crop rotations. Changing vegetation across the landscape or over time not only increases plant diversity, but also the types of insects, microorganisms, and wildlife that live on your farm [3]. In addition a dedicated management approach is needed to maintain or increase the soil organic matter content.
The incorporation of plant materials to soils, with the objective of maintaining or improving fertility for the subsequent crop is known as green manuring. The inclusion of a legume fallow within a sugarcane cropping cycle is practiced to reduce populations of detrimental soil organisms [5, 6], provide nitrogen (N) through biological fixation [7,8] and for weed suppression [9, 10].
Interest in the use of green manure’s biomass has revived because of their role in improving soil quality and their beneficial N and non-N rotation effects [11]. Because of its nitrogen fixation potential, legumes represent an alternative for supplying nutrients, substituting or complementing mineral fertilization in cropping systems involving green manuring. This practice causes changes in soil physical, chemical and biological characteristics, bringing benefits to the subsequent crop both in small-scale cropping systems and in larger commercial areas such as those grown with sugarcane [12].
The area cropped with sugarcane (Saccharum spp.) in Brazil shows rapid expansion, with most of the increase for ethanol production. The area cultivated with sugarcane is now 9.6 Mha, with an increase of 5 Mha from 2000 and over 8.6 Mha of fresh sugarcane harvested per year [13]. Sugarcane crops in Brazil are replanted every five to ten years. In southeastern Brazil, the interval between the last sugarcane harvest and the new plantings occurs during the spring-summer season, under high temperature and heavy rainfall (almost 1,000 mm in six months) [14].
Green manure fertilization of the soil with legumes has been recommended before a sugarcane field is replanted. This practice does not imply on losing the cropping season, does not interfere with sugarcane germination, and provides increases in sugarcane and sugar yield, at least during two consecutive cuts [12]. Additionally, it protects the soil against erosion, prevents weed spreading and reduces nematode populations [15, 16]. Legumes usually accumulate large quantities of N and K, the nutrients which are taken up in the highest amounts by the sugarcane plants.

Crop Rotation Biomass and Effects on Sugarcane Yield in Brazil 5
Residue incorporation studies of legumes using 15N label indicate that 10 to 34% of the legume N can be recovered in the subsequent rye or wheat crop, 42% in rice, 24% recovery from Velvet bean by corn crop, around 15% of N recovery from sunn hemp by corn plants in no-till system, 30% by maize [51],and 5% of N recovery from sunn hemp by sugarcane [12], and ranged from 19 to 21% when the recovery was observed from sunn hemp by two sugarcane harvest [17].
The authors suggested that legume residue decomposition provided long-term supply of N for the subsequent crops, by not supplying the nutrient as an immediate source.
There are many benefits to the sugarcane crop of leguminous plants rown in rotation in sugarcane renovation areas; these include the recycling of nutrients taken up from deep soil layers by the rotational crop, which may prevent or decrease leaching losses, and the addition of N from biological fixation. Leguminous plants can accumulate over 5 t ha–1 of dry mass during a short period of time during the summer and take up large amounts of N and K. Most of this N comes from the association of legumes with rhizobia. In this way crop rotation with legumes can replace partially or totally N mineral fertilization of sugarcane, at least for the first ratoon [18, 12].
Another important microbial association is that of mycorrhizal fungi and plant roots. These fungi are present in over 80% of plant species [19]. In contrast with the large diversity of plants, which includes sugarcane, that have their roots colonized by mycorrhizas, only 150 fungi species are responsible for that colonization [19]. A crop whose roots are colonized by mycorrhizal fungi can raise the soil mycorrhizal potential which can benefit plants which are responsive to this fungi association and that are cultivated in sequence. This could be particularly useful for the nutritional management of crops in low nutrient, low input–output systems of production [20].
This study evaluated biomass production, N content, characterizing the biomass and the natural colonization of arbuscular mycorrhizal fungi (AMF) of leguminous green manure and sunflower (Helianthus annuus L.) in rotation with sugarcane and their effect in the soil. Their effect on stalk and sugar yield and nematode that occur on sugarcane cv. IAC 87-3396 grown subsequently was also studied. The economic balance considered the costs of production and revenues of the rotational crops as well as three or five harvests of sugarcane was too evaluated.
2. Development
Three long term assays were developed during December 4, 1999 to October 10, 2005 to complete this study as following:
The experiments were carried out in Piracicaba, state of São Paulo, Brazil (22o42’ S, 47o38’ W, and 560 m a.s.l). The soil, classified as an Arenic Hapludult, and a Typic Paleudult, was chemically characterized at different depths after cutting the green manure crop, before the sugarcane first planting. The soil was acidic and had low amounts of nutrients (Table 1), typical of many sugarcane growing areas.

Biomass Now – Cultivation and Utilization 6
Total monthly rainfall and local temperature were measured at the meteorological station near the experimental site (Figure 1).
Soil characteristics* Arenic Hapludult Typic Paleudult
0.0-0.2 0.2-0.4 0.0-0.2 0.2-0.4 Soil depth, m pH (0.01mol l-1) 4.1 4.0 5.5 5.5 O.M. (g dm–3) 26 22 20 19 P (mg dm-3) 3 14 13 10 K (mmolc dm-3) 0.7 0.5 0.6 0.4 Ca (mmolc dm-3) 7 6 33 29 Mg (mmolc dm-3) 6 5 21 19 H + Al (mmolc dm-3) 50 68 23 25 CEC (mmolc dm-3) 64 80 79 74 V % 22 14 68 64
*Adapted from [12 and 16]
Table 1. Soil chemical characteristics before sugarcane planting, in plots without green manure, at depths of 0.0-0.2 and 0.2-0.4 m.
Figure 1. Climatological data of maximum and minimum annual average temperature, and annual average rainfall from December 1999 to December 2004 (experiment 1) adapted from [14].
2.1. Effect of seven rotational crops in sugarcane yield
The experiment 1 consisted to evaluate seven rotational crops plus control (fallow) grown before sugarcane was planted.
The soil is as a Typic Paleudult and was chemically characterized at different depths with samples taken after the green manures were cut but before sugarcane was planted (Table 1).

Crop Rotation Biomass and Effects on Sugarcane Yield in Brazil 7
The experimental design was a randomized block with eight treatments and five replications.
The rotational crops were peanut (Arachis hypogaea L.) cv. IAC-Tatu, peanut cv. IAC-Caiapo, sunn hemp cv. IAC-1 (Crotalaria juncea L.), velvet bean (Mucuna aterrima Piper and Tracy), soybean (Glycine max L. Merrill) cv. IAC-17, sunflower (Helianthus annuus L.) cv. IAC-Uruguai, and mung bean (Vigna radiata L. Wilczek).
The green manures were sowed always in December on 7 m × 10 m size plots, with rows 0.50 m apart. The experimental area was weeded 30 d after sowing, and the weed residues were left on the soil surface.
During seed filling, the plants used as green manure were manually cut and spread on the soil covering the entire plot surface in pieces less than 0.25 m and left there for six months. Peanut, soybean, sunflower and mung bean were harvested after physiological maturation for the grain yield, and the remaining plant parts were cut and spread on the soil. Biomass production of the rotational crops was evaluated in 1 m2 of the plot area.
At the harvest stage, the roots of each rotational crop were sampled in order to evaluate the natural colonization level of arbuscular mycorrhizal fungi (AMF). The colonization percentage was estimated using the root coloration technique according to [21]. The percentage of colonization by AMF was estimated by counting the roots’ stained portions using a reticular plate under a microscope following the procedures described by [22].
To evaluate sugarcane stalk yield 2-m sections of each of the three central rows were cut and weighed.
Ten successive stems were separated from each plot for the technological evaluation of the Brix, pol, and total recovered sugar [23]. Sugar yield, expressed in terms of tons of pol per hectare (TPH), was estimated with the stem yield and technological analysis data.
The economic balance considered the costs of production and revenues of the rotational crops as well as three harvests of sugarcane. The basic costs of production of sugarcane (including land preparation, seed stalk, fertilizer, herbicides feedstock and application, and harvesting) were the average of the 2004, 2005, and 2006 prices, based on an average stalk yield of 70 t ha–1. For the control treatment, which did not include the crop rotations, the cost of production of sugarcane was estimated as U$ 3,111 ha–1. The costs of production of the green manures crotalaria and velvet beans, U$ 100 ha–1, include seeds, planting, and cutting. For the grain crops, the costs of grain harvesting and of chemicals needed for phytosanitary control were added: sunflower (U$ 422 ha–1), peanut cv. IAC-Tatu (U$ 1,289 ha–1), Peanut cv. IAC-Caiapó (U$ 1,480 ha–1), mung bean (U$ 2,007 ha–1) and soybean (U$ 513 ha–1). The sales prices of grain and cane stalks for the period between 2004 and 2006 (according to a database of the Institute of Agricultural Economics of the São Paulo State Secretary of Agriculture) were: sugarcane stalks, U$ 17.56 t–1; sunflower, U$ 178 t–1; peanut cv. IAC-Tatu, U$ 260 t–1; peanut cv. IAC-Caiapó, U$ 260 t–1; soybean, U$ 197 t–1; and mung bean, U$ 2,222 t–1. Mung bean is not sold as a commodity but as a specialty crop; its prices are highly variable, and the market for it is relatively small; therefore, the data on the economical return for mung bean must be taken with care.

Biomass Now – Cultivation and Utilization 8
2.2. Recovery of nitrogen in sugarcane fertilized with sunn hemp and ammonium sulfate
The utilization of nitrogen by sugarcane (Saccharum spp.) fertilized with sunn hemp (SH)(Crotalaria juncea L.) and ammonium sulfate (AS) was evaluated using the 15N tracer technique in the experiment 2, that consisted of four treatments with four replications in a randomized block design as fallow: a) control with no N fertilizer or green manure; b) ammonium sulfate (AS) at a rate of 70 kg ha–1 N; c) sunn hemp (SH) green manure; d) and sunn hemp plus ammonium sulfate (SH + AS). Microplots consisting of three rows of sugarcane 2-m long were set up in plots c and d with the 15N-labeled sunn hemp.
N was added at the rate of 196 and 70 kg ha–1 as 15N labeled sunn hemp green manure (SH) and as ammonium sulfate (AS), respectively. Treatments were: (i) Control; (ii) AS15N; (iii) SH15N + AS; (iv) SH15N; and (v) AS15N + SH. Sugarcane was cultivated for five years and was harvested three times. 15N recovery was evaluated in the two first harvests.
Sunn hemp (Crotalaria juncea L, cv IAC-1) was sown at the rate of 25 seeds per meter on the 4 Dec 2000 and emerged in nine days. Microplots, consisting of 6 rows, 2- m long and spaced by 0.5 m within the sunn hemp plots were used for 15N enrichment as described by Ambrosano [24]. After 79 days the sunn hemp was cut, and the fresh material was laid down on the soil surface. Total dry mass of sunn hemp was equivalent to 9.15 Mg ha–1, containing 21.4 g kg–1 N, corresponding to 195.8 kg ha–1 N with an 15N enrichment of 2.412 atoms % excess.
Microplots with AS-labeled fertilizer (3.01 ± 0.01 atoms % 15N), with two contiguous rows 1-m long, were set up in plots b and also in plots d; therefore, these plots had microplots for both sunn hemp and AS-labeled materials.
Ammonium sulfate was sidedressed to sugarcane 90 days after planting in both main plots and microplots. N rate (70 kg ha–1) is within the range (30 to 90 kg ha–1 N) recommended for the plant cane cycle in Brazil [25]. A basal fertilization containing 100 kg ha–1 P2O5 as triple superphosphate and 100 kg ha–1 K2O as potassium chloride was applied to all treatments to ensure a full sugarcane development. Cane yield was determined outside the microplots by weighing the stalks of three rows of sugarcane, 2-m long.
Stalks yields were measured after 18 months (plant-cane cycle, on 24 Aug 2002), 31 months (1st ratoon crop, on 8 Oct 2003), and 43 months after planting (2nd ratoon crop, on 20 Sep 2004). Samples consisting of ten stalks were used for the determination of apparent sucrose content (Pol) in the cane juice, according to [23]. The expressed cane juice was analyzed for Pol (apparent sucrose) by a saccharimeter. Just before harvesting of the plant cane (24 Aug 2002) and of the first ratoon (8 Oct 2003) whole plants were collected from 1-m row of plants in the center of the microplots. Leaves and stalks were analyzed separately for determination of 15N abundance and N content in a mass spectrometer coupled to an N analyzer, following the methods described in [26].
The fraction and amount of nitrogen in the plant derived from the labeled source (Ndff) and the fraction of N recovery of the labeled source (R%) were calculated based on the isotopic results (atoms %), according to Trivelin [26], Equations 1 to 3:

Crop Rotation Biomass and Effects on Sugarcane Yield in Brazil 9
Ndff a / b 100 (1)
QNdff Ndff / 100 TN (2)
R% Ndff / NF 100 (3)
where: Ndff (%) is the fraction of nitrogen in the plant derived from the labeled source, a and b are 15N abundance values (atoms % excess) in the plant and in the labeled source (AS or SH), respectively; QNdff (kg ha-1) is the amount of nitrogen in the plant derived from the labeled source, TN (kg ha–1) is total cumulative nitrogen in the sugarcane plant (kg ha–1 ); R% is the fraction of N recovery of the labeled Sugarcane cultivar IAC- 87-3396 was planted on Mar or April on plots with ten sugarcane rows, 10-m long and spaced at 1.4 m.
The biological nitrogen fixation (BNF) by leguminous plants was determined by natural abundance of 15N technique (δ15N) [27], and sunflower was the non-N fixing specie. The chemical analysis of plants to determine macro and micronutrient contents were performed according to the methods proposed by [28].
2.3. Effect of four rotational crops in sugarcane yield
The experiment 3 consisted to evaluate and characterize the biomass of leguminous residues, the natural arbuscular mycorrhizal (AM) fungus occurrence and the effect of leguminous on the nematodes (Pratylenchus spp.) in sugarcane crop. The experiment was carried out in Piracicaba, São Paulo State, Brazil. The soil was classified as Typic Paleudult and the sugarcane (Saccharum spp.) cultivar was IAC87-3396. The effects of previous cultivation of legumes were evaluated for five consecutive harvests. The treatments consisted of previous cultivation of legumes: peanut (Arachis hypogaea L.) cultivars IAC-Tatu and IAC-Caiapó, sunn hemp IAC 1 (Crotalaria juncea L.) and velvet-bean [Mucuna aterrima (Piper & Tracy) Holland], and a control treatment. We adopted the randomized block design with five replications.
The chronology of the events on the experimental field in experiment 3 is the same that experiment 1.
3. To evaluate seven rotational crops The changes in soil properties were relatively small as should be expected with only one rotation. The rotational crops can contribute with organic residues, but, in general, the amounts of organic C added to the soil are usually not enough to cause significant changes in soil organic matter in the short term (Table 2).The letters in the tables represent statistical comparisons. Means followed by at least one equal letter do not differ statistically. Means followed by all the different letters differ significantly. The rotational crops also affected some soil attributes (Table 2). The organic matter content increased in the soil upper layer (0-0.2 m) with the cultivation of peanut cv. IAC-Tatu and velvet bean, and in the 0.2-0.4 m layer, with mung bean, sunflower IAC-Uruguai, and peanut cv. IAC-Tatu. The increase of

Biomass Now – Cultivation and Utilization 10
soil exchangeable magnesium was also observed for peanut cv. IAC-Tatu and velvet bean, although the original Mg content was already high.
Rotational crops Organic matter Mg
0-0.2 m 0.2-0.4 m Average 0-0.2 m 0.2-0.4 m Average ----------- g kg–1 ----------- -------- mmolc dm-3 ------ Control 20 Ab 19 Ab 19 21 19 20 b Mung bean cv. M146 19 Ab 20 Aa 20 19 18 19 b Peanut cv. IAC-Caiapó 21 Ab 19 Bb 20 24 15 20 b Peanut cv. IAC-Tatu 23 Aa 21 Aa 22 29 23 26 a Soybean cv. IAC-17 19 Ab 17 Bb 18 20 17 18 b Sunflower cv. IAC-Uruguai
20 Ab 20 Aa 20 20 19 19 b
Sunn hemp IAC 1 19 Ab 18 Ab 18 19 17 18 b Velvet bean 23 Aa 18 Bb 21 28 18 23 a Average 21 A 19 B 20 22 A 18 B 20 1C.V.(%) 8.1 8.1 18.4 22.6
Means followed by the same lower-case letter in the columns and capital letter in the rows are not different (Comparisons among means were made according to Tukey-Kramer test, p > 0.1). 1Coefficient of variation. Adapted from [14].
Table 2. Organic matter and exchangeable magnesium in soil sampled after rotational crops.
Sunflower accumulated more above-ground dry matter of total biomass and soybean more grain yield than the other crops (Table 3). Soybean, sunn hemp, velvet bean, and sunflower extracted the greatest amounts of N and P (Table 4). Sunflower also recycled more of K, Ca, Mg, and Zn than the other rotational crops, probably as a consequence of the higher biomass yield (Tables 3 and 4).
Soybean presented the highest N content, and sunflower the lowest. No differences were observed between peanuts and velvet bean and between sunn hemp and mung bean (Table 5). Among the macronutrients, N had the highest and P the lowest accumulation in the rotational crops. On the average Fe was recycled in the highest amounts in the above-ground parts of the rotational crops and Zn in the lowest (Table 4). The same results were observed by [29]) who evaluated pigeon pea (Cajanus cajan) and stylo plants (Stylosanthes guianensis var. vulgaris cv. Mineirão).
The high AMF infection rate, which helps the uptake of micronutrients (Table 3), may explain the high amounts of Zn returned to the soil when sunflower was grown before sugarcane. There is an increasing utilization of sunflower as a crop rotation with sugarcane in Brazil, due to its use for silage, seed oil production, and to its potential as a feedstock for biodiesel [30].
The amounts of N in the above-ground parts of sunn hemp (Table 4) were relatively low compared to those of [31], who reported the extraction of up to 230 kg ha–1 of N, and to those of [12], who found 196 kg ha–1 of N. However, the amounts of N returned to the soil

Crop Rotation Biomass and Effects on Sugarcane Yield in Brazil 11
are directly related to the nutrient concentration in the plant, which varies with the local potential for biological nitrogen fixation (BNF) and with the growth stage of the crop at the time of cutting, and with the biomass yield, which is affected by the weather, soil, and crop growing conditions.
Rotational crop Above ground dry matter2
Grain yield2 Natural infection of AMF
-------------kg ha–1----------- %
Control - - -
Mung bean cv. M146 2,225 d 798 d 51 b
Peanut cv. IAC-Caiapó 1,905 d 1,096 c 74 a
Peanut cv. IAC-Tatu 1,783 d 1,349 c 57 b
Soybean cv. IAC-17 3,669 c 2,970 a 56 b
Sunflower cv. IAC-Uruguai 15,229 a 1,805 b 73 a
Sunn hemp IAC 2 6,230 b - 49 c
Velvet bean 5,049 b - 65 a
1C.V. % 5.1 22.1 15.9
Means followed by the same letter in each column are not different (Comparisons among means were made according to Scott-Knott test, p = 0.05). 1Coefficient of variation. 2 Analysis of variance were made after data transformation to log (×).Adapted from [14].
Table 3. Dry mass and grain yields of the rotational crops and percentage of infection of natural arbuscular mycorrhizal fungus (AMF) in roots of rotational crops.
Rotational crops N P K2 Ca2 Mg2 Fe2 Mn2 Zn2 ------------------------ kg ha–1 ----------------- ---------------- g ha–1 ----------- Control - - - - - - - - Mung bean cv. M146 27 b 2.4 b 17 d 17 d 12 d 2,073 a 258 a 43 c Peanut cv. IAC-Caiapo 39 b 2.7 b 35 c 19 d 13 c 3,279 a 222 a 47 c Peanut cv. IAC-Tatu 34 b 3.8 b 27 c 18 d 11 c 1,679 a 81 b 37 c Soybean cv. IAC-17 122 a 8.7 a 14 d 46 c 28 b 1,424 a 186 a 56 c Sunflower IAC-Uruguai
71 a 7.7 a 120 a 171 a 98 a 2,736 a 324 a 259 a
Sunn hemp IAC 2 97 a 5.8 a 33 c 34 c 21 b 1,313 b 178 a 84 b Velvet bean 109 a 8.9 a 50 b 61 b 17 b 792 a 159 a 90 b 1C.V. % 10.9 42.5 13.3 9.7 13.0 9.5 10.1 9.9
Means followed by the same letter in each column are not different (Comparisons among means were made according to Scott-Knott test, p = 0.05). 1Coefficient of variation. 2 Analysis of variance were made after data transformation to log (×).Adapted from [14].
Table 4. Nutrient content of above ground biomass of the rotational crops, excluding the grains.

Biomass Now – Cultivation and Utilization 12
Perin [32] found substantial amounts of N derived from BNF present in the above ground parts of sunn hemp (57.0%) grown isolated and 61.1% when intercropped with millet (50% seeded with each crop). The sunn hemp+ millet treatment grown before a maize crop resulted in higher grain yield than when sunn hemp alone was the preceding rotation. This effect was not observed when N-fertilizer (90 kg N ha–1) was added. Intercropping legume and cereals is a promising biological strategy to increase and keep N into the production system under tropical conditions [32]. A large proportion of the N present in soybeans usually comes from BNF. Guimarães [33] found that 96% of the N present in above ground parts of soybeans were derived from BNF, values which are in agreement with those obtained by [32] for sunn hemp. However, in the present study, only about 27% of the N present in the soybean residues were from BNF (Table 5), probably because of poor specific population of fixing bacteria for soybeans in the experimental site, which have been grown with sugarcane for long time. No inoculation of soybean with Bradyrhizobium was done. The contribution of BNF for the peanut varieties was significantly different: it reached 70% of the N in the cv. IAC-Caiapó but only 37.7% in the cv. IAC-Tatu (Table 5). Usually the natural population of rhyzobia is high enough to guarantee root colonization for peanuts but probably the bacteria population in the soil of the experimental site was not efficient for peanuts cv. IAC-Tatu.
Rotational crop C content N content C : N N-BNF
-------------- g kg–1 ------------ %
Mung bean cv. M146 426 a 12.5 c 34.1 b 89 a Peanut cv. IAC-Caiapó 424 a 20.9 b 20.3 b 70 b
Peanut cv. IAC-Tatu 440 a 19.2 b 23.0 b 38 c Soybean cv. IAC-17 426 a 31.9 a 13.3 b 27 c
Sunflower IAC-Uruguai 429 a 4.6 d 92.4 a - Sunn hemp IAC 2 449 a 17.2 c 26.1 b 69 b
Velvet bean 446 a 21.6 b 20.7 b 62 b 1C. V. % 2.8 19.1 19.6 13.7
Means followed by the same letter in each column are not different (Comparisons among means were made according to Scott-Knott test, p = 0.05). 1Coefficient of variation. Adapted from [14].
Table 5. Carbon and nitrogen concentration, carbon to nitrogen ratio, and N derived from biological N2 fixation (BNF) in the aboveground parts of the rotational crops at harvesting.
The rate of natural colonization with AMF was relatively high in all crops (Table 3). Peanut cv. IAC-Caiapo and sunflower cv. IAC-Uruguai, followed by velvet bean, had at least 64% of root infection with AMF. At the same time, sunflower produced the greatest amount of above-ground biomass, followed by C. juncea and velvet bean. Soybean had the highest grain yield (Table 3) and also presented a considerable percentage of root infection with AMF: 56% (Table 3). Besides the symbiotic association with rhizobia, roots of the legumes can be colonized by fungi of the family Endogonaceae that form vesicular-arbuscular (VA) endomycorrhizas, which help enhance the uptake of phosphorus and other nutrients [34].

Crop Rotation Biomass and Effects on Sugarcane Yield in Brazil 13
Results of a nursery study on the effect of a short season pre-cropping with different mycotrophic herbaceous crops on growth of arbuscular mycorrhiza-dependent mandarin orange plants at an early stage after transplantation were presented by [20]. Mandarin orange seedling plants 180 days after transplantation showed variation in shoot growth in response to single season pre-cropping with seven different crops—maize, Paspalum millet, soybean, onion, tomato, mustard, and ginger, and two non-cropped fallow treatments—non-weeded and weeded fallows. Net growth benefit to the orange plants due to the different pre-crops and the non-weeded fallow treatment over the weeded fallow treatment plants showed a highly positive correlation with mycorrhizal root mass of the orange plants as it varied with the pre-crop treatments. Increase in citrus growth varied between 0 and 50% depending upon the mycorrhizal root mass of the pre-crops and weeds, AMF spore number, and infective inoculum density of the pre-cropped soils. These pre-crop variables individually and cumulatively contributed to the highly significant positive correlation between the AMF potential of the pre-cropped soils and growth of mandarin orange plants through their effect on mycorrhizal root mass development (i.e. extent of mycorrhization) of the mandarin orange plants. The choice of a pre-crop from the available options, grown even for a short season, can substantially alter the inherent AMF potential of soils to a significant influence on the performance of the mycorrhiza-dependent orange plant. The relationship between soil mycorrhizal potential left by a pre-crop and mycorrhizal benefit drawn by the succeeding AMF responsive plant can be of advantage for the exploitation of native AMF potential of soils for growth and nutrition management of crops in low nutrient, low input–output systems of production [20].
Sugarcane yield increased more than 30%, in average, due to the rotational crops as compared with the control treatment; those benefits lasted up to the third harvest (Table 6). In the first cutting, sunflower was the rotational crop that induced the greater yield increase, followed by peanut cv. IAC-Caiapó, and soybean cv. IAC 17. [35] observed that sunn hemp residues increased the sugarcane yield; in the first harvest after the green manure, the effect of the legume crop was better than that of chemical fertilization with nitrogen. Similar results were reported later by [36], with a yield rise of 15.4 tons ha–1 of sugarcane stalks, which represented about 24% increase in relation to the control. Positive effects on stalk yields were also found by [31] when sugarcane was grown after Crotalaria spectabilis, and by [36], who cultivated sugarcane after sunn hemp and velvet bean.
Sunflower was the best rotational treatment, causing an yield increased of around 46% in the first harvest after the rotational crops (Table 6). Meanwhile, in the average of three cuttings, peanut showed an yield increase of around 22% whereas sunflower presented a 10% yield increase; these results are in agreement with those of [31, 36].
The sugar content of sugarcane stalks is important because the raw material remuneration takes into account this parameter. Some crops that preceded sugarcane had a high effect on sugar yield (Table 7); this was observed mainly in the first harvest in areas where sunflower, peanuts and C. juncea were previously cultivated (Table 2). The 3-year average data showed a sugar yield increase, in the best treatment, of 3 t ha–1 in relation to the control. These results were already observed by [35, 31] who found an average increase of 2.98 ton–1 ha due to green manure crops grown before sugarcane.

Biomass Now – Cultivation and Utilization 14
Rotational crops Stem yield First cut Second cut Third cut Average
------------------------------- ton ha–1 ---------------------------------- Control 47.6 Bc 111.2 Aa 50.7 Ba 69.8 Mung bean cv. M146 61.6 Bb 131.9 Aa 54.7 Ba 82.7 Peanut cv. IAC-Caiapó 67.6 Ba 130.6 Aa 58.0 Ba 85.4 Peanut cv. IAC-Tatu 60.6 Bb 114.9 Aa 66.8 Ba 80.8 Soybean cv. IAC-17 67.5 Ba 124.9 Aa 56.7 Ca 83.1 Sunflower cv. IAC-Uruguai 69.5 Ba 105.2 Aa 55.3 Ca 76.7 Sunn hemp IAC 1 65.9 Bab 125.8 Aa 51.1 Ca 80.9 Velvet bean 61.3 Bb 116.3 Aa 61.2 Ba 79.6 Average 62.7 120.1 56.8 SEM1 0.85 3.80 1.65
Means followed by the same lower-case letter in the columns and capital letter in the rows are not different (Comparisons among means were made according to Tukey-Kramer test, p > 0.1). 1Standard error of the mean. SEM for comparison of rotational crops is 4.22. Adapted from [14].
Table 6. Yield of millable stems of sugarcane grown after rotational crops planted before the first sugarcane cycle.
Rotational crop Sugar yield1 First cut Second cut Third cut Average SEM2
-------------------------------------- ton ha–1 ----------------------------------
Control 6.9 Bb 18.1 Aa 7.5 Ba 10.3 1.4 Mung bean cv. M146 9.3 Ba 19.6 Aa 8.3 Ba 12.4 1.7 Peanut cv. IAC-Caiapó 9.9 Ba 21.2 Aa 8.9 Ba 13.3 1.6 Peanut cv. IAC-Tatu 8.8 Cab 18.5 Aa 10.5 Ba 12.6 1.3 Soybean cv. IAC-17 10.0 Ba 17.7 Aa 8.8 Ba 12.2 1.3 Sunflower cv. IAC-Uruguai 10.3 Ba 15.5 Aa 8.1 Ca 11.3 1.0 Sunn hemp IAC 2 9.3 Ba 19.2 Aa 7.5 Ca 12.0 1.5 Velvet bean 9.2 Ba 18.5 Aa 9.5 Ba 12.4 1.3 Average 9.2 18.6 8.6 SEM2 0.2 0.6 0.3
Means followed by the same lower-case letter in the columns and capital letter in the rows are not different (Comparisons among means were made according to Tukey-Kramer test, p > 0.1). 1 Apparent sucrose content in the cane juice. 2Standard error of the mean. Adapted from [14].
Table 7. Sugar yields of three consecutive cuttings of sugarcane grown after rotational crops.
Studying crop rotation with legume plants in comparison with a control with and without a mineral N addition, [35] observed that, after a crop rotation, the sugarcane yield was higher after C. juncea and velvet bean, with 3.0 and 3.2 stalk tons ha–1 increase, respectively. The treatments with an addition of N fertilizer but no-rotation with green manure resulted in only 1.1 tons ha–1 of a sugar yield increase, in the average of three years, suggesting that the

Crop Rotation Biomass and Effects on Sugarcane Yield in Brazil 15
beneficial influence of leguminous plants is not restricted to the N left by the leguminous plants after harvest.
Farmers must combine the resources of land, labor, management, and capital in order to derive the most profit. Since resources are usually scarce, maximizing returns on each one is important. Crop rotations provide income diversification. If profitability of one crop is reduced because of price variation or some unpredicted reason, income is not as likely to be adversely affected as if the whole farm was planted to this crop, provided that a profit potential exists for each crop in a rotation. This is especially important to the farmer with limited capital.
Some of the general purposes of rotations are to improve or maintain soil fertility, reduce the erosion, reduce the build-up of pests and diseases, best distribute the work load, reduce the risk of weather damage, reduce the reliance on agricultural chemicals, and increase the net profits. Crop rotations have fallen somewhat into disfavor because they require additional planning and management skills, increasing the complexity of farming operations.
Crop rotation can positively affect yield and increase profit (Table 8). Except for peanuts, all other rotational crops contributed to raise the net income. This was true both for the green manures (crotalaria juncea and velvet bean), as for the grain crops (soybean, sunflower and mung bean). Peanuts caused an increase in the sugarcane stalk yields relative to the control, especially in the first harvest (Table 8), but the high cost of production of this grain somewhat cancelled out the benefit of this rotation. However, in many sugarcane regions in São Paulo State peanuts are extensively grown in rotation with sugarcane, probably because in those sites yields are higher and the cost of production, lower. Mung beans are a niche crop. Although it provided a relatively high net return in the present study (Table 8), the risks may be high due to the market restrictions and price fluctuations.
Rotational crop Gross revenue Cost of production Net income ---------------------- U$ ha–1 ----------------------- Control 3,710 3,111 599 b Mung bean cv. M146 6,131 5,118 1,012 a Peanut cv. IAC-Caiapó 4,784 4,591 193 b Peanut cv. IAC-Tatu 4,606 4,401 205 b Soybean cv. IAC-17 4,961 3,624 1,337 a Sunflower cv. IAC-Uruguai 4,431 3,584 847 a Sunn hemp IAC 2 4,263 3,195 1,068 a Velvet bean 4,193 3,212 981 a C.V.(%) - - 24.1
Means followed by the same letter in the column are not different (Comparisons among means were made according to Scott-Knott test, p > 0.05). 1Gross revenue includes sales of the three harvests of sugarcane plus grains of rotational crops. Cost of production includes land and crop management, chemicals, feedstock, and harvesting costs of all sugarcane and rotational crops, but excludes land rental. Adapted from [14].
Table 8. Economic balance1 of sugarcane production including revenues and costs of crop rotation.

Biomass Now – Cultivation and Utilization 16
4. To evaluated the recovery of nitrogen by sugarcane when applied green manure crop and mineral N
To evaluate the utilization of nitrogen by sugarcane (Saccharum spp.) fertilized with sunn hemp (SH) (Crotalaria juncea L.) and ammonium sulfate (AS):
The presence of a green manure crop and mineral N applied together caused some soil alterations that could be detected in samples collected in the sugarcane planting and harvesting seasons (Table 9). There was an increase in calcium and magnesium availability, and consequently in base saturation and pH, in relation to the AS-15N treatment, at planting. Similar results were obtained by [38], who worked with four velvet bean cultivars, velvet bean, Georgia velvet bean, cow itch, and cratylia. The presence of green manure caused a significant sum of bases increase, due to increases in calcium and magnesium; consequently, treatments involving velvet bean showed higher CEC values. The presence of organic acids in the plant mass could be the reason for this change.
During sugarcane harvest, increases in Mg concentration, pH, and base saturation (V%) were observed in the treatments containing SH-15N+ AS in relation to the treatment containing AS-15N alone. Also, a significant reduction in potential acidity was observed in treatments containing SH-15N+ AS in relation to the treatment containing AS-15N alone (Table 9).
Soil sampling at sugarcane planting Treatment pH (CaCl2) Ca Mg H+Al SB V 0.01mol l-1 ------------------mmolc dm-3------------------- ----- % ----- Control 5.1 ab 20.5 ab 14.5 ab 37.8 a 35.4 ab 48.2 a AS-15N2 4.7 b 15.8 b 9.8 b 47.0 a 25.9 b 36.0 a SH + AS -15N 5.3 a 24.8 a 17.8 a 32.0 a 42.8 a 55.8 a SH-15N 5.0 ab 18.0 ab 13.0 ab 39.0 a 31.4 ab 44.5 a Mean 5.0 19.8 13.8 39.0 33.9 46.1 C.V.% 5.12 7.55 10.76 20.77 6.81 22.52 Soil sampling at sugarcane harvest Control 5.0 ab 17.8 a 14.0 ab 39.8 ab 32.2 a 44.5 ab AS-15N 4.7 b 15.3 a 9.8 b 46.5 a 25.4 a 35.8 b SH + AS -15N 5.6 a 24.7 a 26.8 a 25.5 b 44.4 a 67.5 a SH-15N 5.0 ab 19.0 a 15.3 ab 36.3 ab 34.5 a 48.5 ab Mean 5.0 18.0 16.4 37.0 33.5 49.1 C.V.% 8.00 30.88 15.18 25.87 32.45 29.57
Means followed by different letters in columns in each sampling season are different (Comparisons among means were made according to Tukey test P < 0.05). 2 Treatments were: Control (no N fertilizer applied), AS-15N (15N-labeled ammonium sulfate), SH + AS -15N (Sunn hemp + 15N-labeled ammonium sulfate), SH-15N (15N-labeled Sunn hemp). Adapted from [12].
Table 9. Chemical characterization of the soil (0.0-0.2 m depth) in the sugarcane planting and harvesting seasons.
Crop Rotation Biomass and Effects on Sugarcane Yield in Brazil 17
The presence of organic acids in decomposing plant residues can help Mg movement in the soil [39]. Crops with high C:N ratio may release N more slowly and cause an increase in N uptake by succeeding crop In addition, rotational plants that were grown before sugarcane could recycle nutrients that would otherwise be leached contribute with N derived from BNF and keep some elements in plant available forms, which could be transformed into more recalcitrant forms if the soil lie fallow for some time.
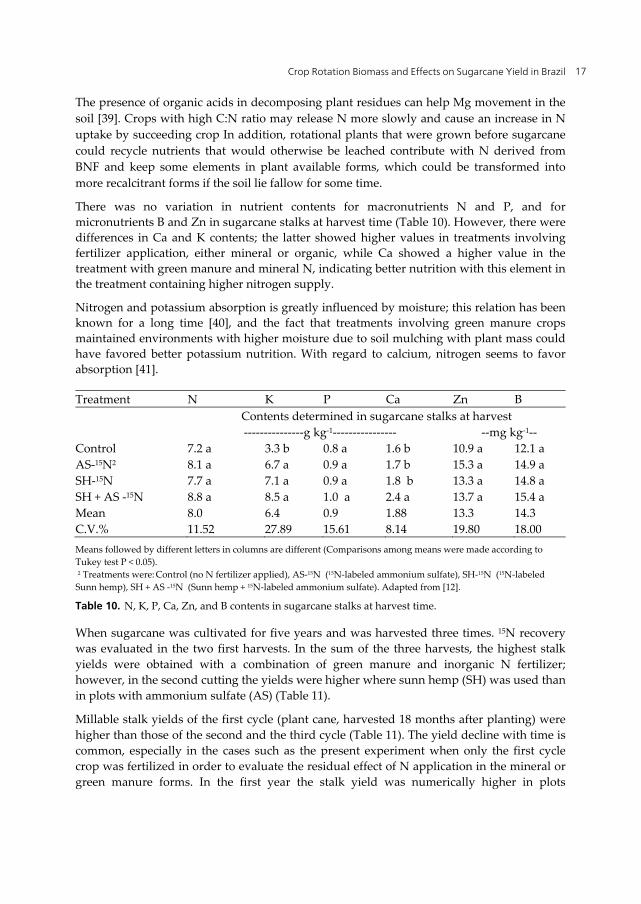
There was no variation in nutrient contents for macronutrients N and P, and for micronutrients B and Zn in sugarcane stalks at harvest time (Table 10). However, there were differences in Ca and K contents; the latter showed higher values in treatments involving fertilizer application, either mineral or organic, while Ca showed a higher value in the treatment with green manure and mineral N, indicating better nutrition with this element in the treatment containing higher nitrogen supply.
Nitrogen and potassium absorption is greatly influenced by moisture; this relation has been known for a long time [40], and the fact that treatments involving green manure crops maintained environments with higher moisture due to soil mulching with plant mass could have favored better potassium nutrition. With regard to calcium, nitrogen seems to favor absorption [41].
Treatment N K P Ca Zn B Contents determined in sugarcane stalks at harvest ---------------g kg-1---------------- --mg kg-1-- Control 7.2 a 3.3 b 0.8 a 1.6 b 10.9 a 12.1 a AS-15N2 8.1 a 6.7 a 0.9 a 1.7 b 15.3 a 14.9 a SH-15N 7.7 a 7.1 a 0.9 a 1.8 b 13.3 a 14.8 a SH + AS -15N 8.8 a 8.5 a 1.0 a 2.4 a 13.7 a 15.4 a Mean 8.0 6.4 0.9 1.88 13.3 14.3 C.V.% 11.52 27.89 15.61 8.14 19.80 18.00 Means followed by different letters in columns are different (Comparisons among means were made according to Tukey test P < 0.05). 2 Treatments were: Control (no N fertilizer applied), AS-15N (15N-labeled ammonium sulfate), SH-15N (15N-labeled Sunn hemp), SH + AS -15N (Sunn hemp + 15N-labeled ammonium sulfate). Adapted from [12].
Table 10. N, K, P, Ca, Zn, and B contents in sugarcane stalks at harvest time.
When sugarcane was cultivated for five years and was harvested three times. 15N recovery was evaluated in the two first harvests. In the sum of the three harvests, the highest stalk yields were obtained with a combination of green manure and inorganic N fertilizer; however, in the second cutting the yields were higher where sunn hemp (SH) was used than in plots with ammonium sulfate (AS) (Table 11).
Millable stalk yields of the first cycle (plant cane, harvested 18 months after planting) were higher than those of the second and the third cycle (Table 11). The yield decline with time is common, especially in the cases such as the present experiment when only the first cycle crop was fertilized in order to evaluate the residual effect of N application in the mineral or green manure forms. In the first year the stalk yield was numerically higher in plots

Biomass Now – Cultivation and Utilization 18
fertilized with a combination of green manure and AS; however, in the second year the plots that received SH produced more cane than those fertilized only with AS or the control treatment, indicating that the green manure applied before planting still affected plant growth and yield after 34 months. In the third cycle, there were no differences among the treatments, showing that the residual effect of both N sources had disappeared (Table 11). In the sum of three cuttings, the combination of AS and green manure resulted in highest yields.
Treatments2 Harvests Total of three cuttings
Mean ± SEM3 24 Aug
2002 08 Oct 2003 20 Sep 2004
--------------------------- Stalk yield, Mg ha-1 --------------------------- Control 86.0 Ba 61.1 Bab 47.1 Ab b194.2 64.7 ± 4.6 AS15N 106.2 ABa 64.7 Bb 42.3 Ab ab213.2 71.1 ± 4.6 SH + AS15N 128.7 Aa 84.5Ab 45.0 Ac a258.2 86.1 ± 4.6 SH15N 92.4 ABa 83.8 Aa 41.2 Ab ab217.3 72.4 ± 4.6 Mean ± SEM 103.3 ± 3.8 a 73.5 ± 3.8 b 43.9 ± 3.8 c 215.4 ± 18.9 -------------------------POL, Mg ha-1 ------------------------------ Control 11.9 10.4 17.9 b40.2 13.5 ± 0.7 B AS15N 14.9 11.1 17.5 ab43.5 14.5 ± 0.6 AB SH + AS15N 17.0 14.1 18.4 a49.5 16.5 ± 0.6 A SH15N 12.9 14.2 18.1 ab45.2 15.1 ± 0.6 AB Mean ± SEM 14.2 ± 0.9 b 12.4 ± 0.9 b 18.0 ± 0.9 a 43.8 ± 2.4 Means followed by a different letter lower-case letter, in the rows, and upper-case letter, in the columns, are different (Comparisons among means were made according to Tukey-Kramer p ≤ 0.1). Means followed by superscript letters differ vertically (Comparisons among means were made according to Tukey-Kramer p ≤ 0.1). 1 Cane was planted on 01 Mar 2001. POL =apparent sucrose content in the cane juice. 2 Treatments were: Control (no N fertilizer applied), AS15N (15N-labeled ammonium sulfate); SH + AS15N (Sunn hemp + 15N-labeled ammonium sulfate); SH15N (15N-labeled Sunn hemp). 3 Standard error of the mean. Adapted from [17].
Table 11. Millable stalk yield and POL1 of sugarcane plants in three consecutive harvests as a function of N applied at planting as ammonium sulfate (AS) or Sunn hemp (SH) green manure1
[36] showed evidence of the positive effect of green manure fertilization with sunn hemp in sugarcane, with greater sugarcane yield increase than with the application of 40 kg ha-1 mineral N to the soil. [43], studying lupine in maize, and [44], studying velvet bean and sunn hemp in rice, could not find response to mineral N applied after green manure, and no N fertilizer was needed when vetch (Vicia spp.) was grown after wheat, and when cotton followed faba beans [42].
The effect of fertilizer source on sugar concentration was less evident. In the average of three cuttings, the value of pol in plots, treated with both AS + SH was higher than in that observed in plots that received no N (Table 11). Pol in cane juice was higher in the third cutting than in the two previous ones. Variations in pol measurements among cropping seasons are usually more affected by environmental conditions (temperature and drought)

Crop Rotation Biomass and Effects on Sugarcane Yield in Brazil 19
that determine cane maturation than by nutrition. However, high N tends to decrease sugar content and delay maturation [45]; therefore, after two years with no N fertilization, sugar content in cane plants was more likely to be high.
The recovery of N by the first two consecutive harvests accounted for 19 to 21% of the N applied as leguminous green manure and 46 to 49% of the N applied as AS.
Nitrogen derived from AS and SH in the leaves and top parts of the sugarcane plant, excluding the stalks, varied from 6.9 to 12.3 % of the total N at the end of the first cycle (plant cane) and was not affected by N source (Table 12). But the amounts of N from both sources accumulated in the leaves and tops were in the range of only 4.5 to 6.0 kg ha-1, which represent a recovery of 6.4 to 8.1% of the N applied as AS and 2.7 and 3.1% of the N from the green manure (Table 12). The recovery of 15N in the second cycle decreased when the N source was the inorganic fertilizer. In the second year the percentage of N derived from sunn hemp was greater than that from the AS, indicating a slightly higher residual effect of the green manure (Table 12).
Sampling
dates Treatments2 Mean ± SEM3
AS15N SH-15N + AS SH15N AS15N+ SH ----------------------------- Ndff ,% -------------------------
24 Aug 2002 12.3 Aa 11.1 Aa 10.9 Aa 6.9 Aa 10.3 ± 1.1 08 Oct 2003 1.7 Bb 5.5 Aa 4.1 Aab 1.7 Bb 3.2 ± 1.1 Mean ± SEM 7.0 ± 1.6 8.3 ± 1.6 7.5 ± 1.6 4.3 ± 1.6 ---------------------------- QNdff, kg ha-1 -----------------------
24 Aug 2002 5.7 6.0 5.2 4.5 5.4 ± 0.6 A 08 Oct 2003 1.8 6.8 4.6 2.9 4.0 ± 0.6 A Mean ± SEM 3.7 ± 1.0 a 6.4 ± 1.0 a 4.9 ± 1.0 a 3.7 ± 1.0 a --------------------------------- R, % -------------------------------
24 Aug 2002 8.1 Aa 3.1 Aa 2.7 Aa 6.4 Aa 5.1 ± 0.6 08 Oct 2003 2.6 Ba 3.5 Aa 2.3 Aa 4.1 Aa 3.1 ± 0.6 Mean ± SEM 5.3 ± 0.9 3.3 ± 0.9 2.5 ± 0.9 5.3 ± 0.9
Means followed by a different letter lower-case letter, in the rows, and capital letter, in the columns, are different [Comparisons among means were made according to Tukey-Kramer and F´ tests (p ≤ 0.1), respectively]. 1 Cane was planted on 01 Mar 2001. 2 Treatments were: Control (no N fertilizer applied), AS15N (15N-labeled ammonium sulfate); SH + AS15N (Sunn hemp 15N-labeled ammonium sulfate); SH15N (15N-labeled Sunn hemp). 3 Standard error of the mean. Adapted from [12].
Table 12. Percentage (Ndff) and quantity (QNdff) of nitrogen in leaves derived from the labeled fertilizer source and nitrogen recovery (R) in samples taken in the first and second harvests1.
Biomass Now – Cultivation and Utilization 20
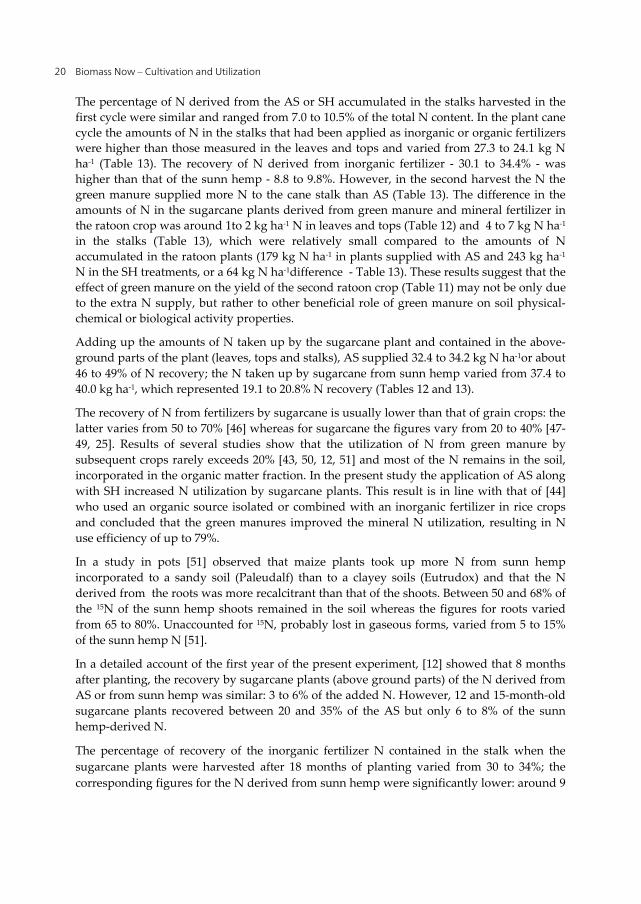
The percentage of N derived from the AS or SH accumulated in the stalks harvested in the first cycle were similar and ranged from 7.0 to 10.5% of the total N content. In the plant cane cycle the amounts of N in the stalks that had been applied as inorganic or organic fertilizers were higher than those measured in the leaves and tops and varied from 27.3 to 24.1 kg N ha-1 (Table 13). The recovery of N derived from inorganic fertilizer - 30.1 to 34.4% - was higher than that of the sunn hemp - 8.8 to 9.8%. However, in the second harvest the N the green manure supplied more N to the cane stalk than AS (Table 13). The difference in the amounts of N in the sugarcane plants derived from green manure and mineral fertilizer in the ratoon crop was around 1to 2 kg ha-1 N in leaves and tops (Table 12) and 4 to 7 kg N ha-1
in the stalks (Table 13), which were relatively small compared to the amounts of N accumulated in the ratoon plants (179 kg N ha-1 in plants supplied with AS and 243 kg ha-1 N in the SH treatments, or a 64 kg N ha-1difference - Table 13). These results suggest that the effect of green manure on the yield of the second ratoon crop (Table 11) may not be only due to the extra N supply, but rather to other beneficial role of green manure on soil physical-chemical or biological activity properties.
Adding up the amounts of N taken up by the sugarcane plant and contained in the above-ground parts of the plant (leaves, tops and stalks), AS supplied 32.4 to 34.2 kg N ha-1or about 46 to 49% of N recovery; the N taken up by sugarcane from sunn hemp varied from 37.4 to 40.0 kg ha-1, which represented 19.1 to 20.8% N recovery (Tables 12 and 13).
The recovery of N from fertilizers by sugarcane is usually lower than that of grain crops: the latter varies from 50 to 70% [46] whereas for sugarcane the figures vary from 20 to 40% [47- 49, 25]. Results of several studies show that the utilization of N from green manure by subsequent crops rarely exceeds 20% [43, 50, 12, 51] and most of the N remains in the soil, incorporated in the organic matter fraction. In the present study the application of AS along with SH increased N utilization by sugarcane plants. This result is in line with that of [44] who used an organic source isolated or combined with an inorganic fertilizer in rice crops and concluded that the green manures improved the mineral N utilization, resulting in N use efficiency of up to 79%.
In a study in pots [51] observed that maize plants took up more N from sunn hemp incorporated to a sandy soil (Paleudalf) than to a clayey soils (Eutrudox) and that the N derived from the roots was more recalcitrant than that of the shoots. Between 50 and 68% of the 15N of the sunn hemp shoots remained in the soil whereas the figures for roots varied from 65 to 80%. Unaccounted for 15N, probably lost in gaseous forms, varied from 5 to 15% of the sunn hemp N [51].
In a detailed account of the first year of the present experiment, [12] showed that 8 months after planting, the recovery by sugarcane plants (above ground parts) of the N derived from AS or from sunn hemp was similar: 3 to 6% of the added N. However, 12 and 15-month-old sugarcane plants recovered between 20 and 35% of the AS but only 6 to 8% of the sunn hemp-derived N.
The percentage of recovery of the inorganic fertilizer N contained in the stalk when the sugarcane plants were harvested after 18 months of planting varied from 30 to 34%; the corresponding figures for the N derived from sunn hemp were significantly lower: around 9

Crop Rotation Biomass and Effects on Sugarcane Yield in Brazil 21
to 10% (Table 13). The residual effect of the N from both sources in the second harvest of the sugarcane plant was similar: between 4 and 6% of the N supplied at planting as AS or SH was recovered in the stalks of the sugarcane plant 31 months after planting (Table 12).
Sampling dates Treatments2
Mean ± SEM3 AS15N SH 15N + AS SH15N AS15N + SH
------------------------------ Ndff, % ------------------------- 24 Aug 2002 10.5 Aa 7.0 Aa 8.2 Aa 10.3 Aa 9.0 ± 1.2 08 Oct 2003 1.4 Bb 3.8 Aa 3.7 Aa 1.7 Bb 2.6 ± 0.1 Mean ± SEM 6.0 ± 1.2 5.4 ± 1.2 5.9 ± 1.2 6.0 ± 1.2 ---------------------------- QNdff, kg ha-1 ----------------------- 24 Aug 2002 24.1 Aa 19.3 Aa 17.3 Aa 21.1 Aa 20.4 ± 2.78 08 Oct 2003 2.7 Bb 8.6 Aa 10.3 Aa 3.9 Bb 6.4 ± 0.8 Média ± SEM 13.4 ± 2.6 14.0 ± 2.6 13.8 ± 2.6 12.5 ± 2.6 ---------------------------------- R, % ------------------------------- 24 Aug 2002 34.4 Aa 9.9 Abc 8.8 Ac 30.1 Aab 20.8 ± 1.9 08 Oct 2003 3.9 Ba 4.4 Aa 5.3 Aa 5.6 Ba 4.8 ± 1.9 Mean ± SEM 19.1 ± 3.2 7.1 ± 3.2 7.0 ± 3.2 17.8 ± 3.2 -------------------- Cumulative N kg ha-1------------------------ 24 Aug 2002 177.4 235.6 257.0 220.4 222.6 ± 9.2 A 08 Oct 2003 181.0 190.8 228.0 270.8 217.6 ± 9.2 A Mean ± SEM 179.2 ± 12.0 a 213.2 ± 12.0 a 139.9 ± 12.0 a 245.6 ± 12.0 a Means followed by a different letter lower-case letter, in the rows, and capital letter, in the columns, are different [Comparisons among means were made according to Tukey-Kramer and F´ tests (p ≤ 0.1), respectively]. 1 Cane was planted on 01 Mar 2001 2 Treatments were: Control (no N fertilizer applied), AS15N (15N-labeled ammonium sulfate); SH + AS15N (Sunn hemp + 15N-labeled ammonium sulfate); SH15N (15N-labeled Sunn hemp). 3 Standard error of the mean. Adapted from [12].
Table 13. Percentage (Ndff) and quantity (QNdff) of nitrogen derived from the labeled fertilizer source, nitrogen recovery (R) in sugarcane stalks and nitrogen accumulated in samplings carried out in the first and second harvestings1.
In the present study, about 69% of the N present in the sunn hemp residues were from BNF. The data obtained in the present study are also in agreement with those obtained by [18] for green manure produced in the field, in the inter-rows of the ratoon crop.
Perin [32] found substantial amounts of N derived from BNF present in the above ground parts of sunn hemp (57.0%) grown isolated and 61.1% when intercropped with millet (Pennisetum glaucum, (L.) R. Brown) (50% seeded with each crop). The sunn hemp+millet treatment grown before a maize crop resulted in higher grain yield than when sunn hemp alone was the preceding rotation. This effect was not observed when N-fertilizer (90 kg N ha–1) was added; Perin [32] concluded that intercropping legume and cereals is a promising biological strategy to increase and keep N into production system under tropical conditions.
No difference was observed in relation to the cumulative N listed in Table 10. The cumulative N results are similar to those found by [47], who obtained, during plant cane harvesting, mean values of 252.3 kg ha-1 cumulative nitrogen, with high nitrogen and plant material

Biomass Now – Cultivation and Utilization 22
accumulation during the last three months, as also observed by [49]. The nitrogen contents found in the above-ground part of sugarcane, Table 10, are in agreement with results of [47].
As the amounts of N applied as AS or SH to sugarcane in the first cycle were different (70 kg N ha-1as AS and 196 kg N ha-1 as SH), the quantities of N derived from the green manure in the second harvest were larger than those from the inorganic fertilizer, although the percentage of N recovery was similar (Table 12).
Because less N derived from the green manure was recovered by the sugarcane plant in the first cycle it would be expected that a higher proportion of that N would be taken up in the second cycle (first ratoon), but this did not happen. It seems that the residual N that is incorporated to the soil organic matter has a somewhat long turnover. Other authors have reported low recovery (about 3.5% of the N) by the second crop after sunn hemp cover crop [52] or hairy vetch (Vicia villosa Roth) plowed into the soil [53]. Low recovery of residual N has also been observed for inorganic fertilizer sources: less than 3% of the N derived from fertilizers was taken up by soybeans (Glicine max (L) Merril) [54], maize (Zea Mays L.) [52], [53] or sugarcane (Saccharum spp) [55], results similar to those obtained in the present study (Table 12 and 13).
The amounts of inorganic N, derived from both N sources, present in the 0-0.4 m layer of soil in the first season after N application and were below 1 kg ha–1.
The average concentration of inorganic nitrogen in the 0-40 cm layer of soil was relatively low in most samples taken after 8, 12, 15, and 18 months of planting (Table 14). Samples taken in February, in the middle of the rainy and hot season, presented somewhat higher values of (NH4+ + NO3-)-N probably reflecting higher mineralization of soil organic N (Figure 2). Later in the growing season (samples of May and Aug 2002) soil inorganic N content decreased again. This coincides with beginning of the dry season with mild temperatures, when the sugarcane plant reached maturity and probably had already depleted the soil for most of the available N.
Treatments1 Sampling dates 29 Oct 2001 20 Feb 2002 28 May 2002 24 Aug 2002 Mean ± SEM2
-----------------------------------------mg kg-1--------------------------------------- Control 2.7 Ab 7.3 ABa 2.3 Ab 2.8 Ab 3.8 ± 0.22 AS15N 2.6 Ab 9.1 Aa 2.2 Ab 3.2 Ab 4.3 ± 0.22 SH15N + AS 2.9 Ab 7.0 ABa 2.7 Ab 3.1 Ab 3.9 ± 0.22 SH15N 2.8 Ab 5.8 Ba 1.5 Bc 2.8 Ab 3.2 ± 0.22 SH + AS15N 2.7 Ab 7.2 ABa 3.1 Ab 2.6 Ab 3.9 ± 0.22 Mean ± SEM 2.7 ± 0.19 7.3 ± 0.19 2.4 ± 0.19 2.9 ± 0.19 Means followed by a different letter lower-case letter, in the rows, and capital letter, in the columns, are different (Comparisons among means were made according to Tukey-Kramer test p ≤ 0.1). 1 Treatments were: Control (no N fertilizer applied); AS15N (15N-labeled ammonium sulfate); SH + AS15N (Sunn hemp + 15N-labeled ammonium sulfate); SH15N (15N-labeled Sunn hemp). 2 Standard error of the mean. Adapted from [12].
Table 14. Soil mineral N (NH4+ + NO3-) determined in four sampling dates during the plant cane cycle. Data are average of samplings of the 0-0.2 and 0.2-0.4 m soil layers.

Crop Rotation Biomass and Effects on Sugarcane Yield in Brazil 23
The percentage of the inorganic N derived from AS or SH present in the soil from the 8th to the 18th month after sugarcane planting represented only 1 to 9% of total inorganic N (Table 15). The proportion of N that was originated from AS decreased with time whereas that from the green manure increased, indicating that the mineralization of this organic source could supply more N at the end of the season (Table 15). Indeed, [12] showed that sugarcane stalks sampled in 15-month old plants had significantly higher percentage of N derived from AS than from SH; in the 18th month that difference had disappeared. Nonetheless, throughout the season, the amounts of inorganic N in the soil derived from either AS or SH were of very little significance for the nutrition of the sugarcane plant – less than 1 kg ha-1 of inorganic N in a 40 cm soil layer (Table 15), indicating that little residual N is expected in soils grown with this crop. Although the rate of N applied as SH was almost 200 kg N ha-1, little nitrate leaching losses are expected under the conditions of this experiment.
Treatments1 Sampling dates
29 Oct 2001 20 Feb 2002 28 May 2002 24 Aug 2002 Mean ± SEM2
------------------------------ Ndff, % ----------------------------------- AS15N 5.9 Aa 0.7 Aa 3.2 Aa 1.0 Ba 2.7 ± 0.57 SH15N + AS 2.6 Ab 3.2 Aab 9.0 Aa 5.7 ABab 5.1 ± 0.62 SH15N 2.9 Aa 4.3 Aa 7.0 Aa 5.9 Aa 5.0 ± 0.58 SH + AS15N 2.9 Aa 0.3 Aa 4.0 Aa 1.3 ABa 2.1 ± 0.62
Mean ± SEM 3.6 ± 0.58 2.1 ± 0.56 5.8 ± 056 3.5 ± 0.55
--------------QNdff, kg ha-1 --------------------------
AS15N 0.3 Aa
0.3 Aa
0.4 Aa
0.5 Aa
0.40 ± 0.16
SH15N + AS 0.1 Aa 0.2 Aa 0.2 Aa 0.2 Aa 0.18 ± 0.18 SH15N 0.1 Aa 0.2 Aa 0.1 Aa 0.2 Aa 0.15 ± 0.16 SH + AS15N 0.1 Aa 0.1 Aa 0.1 Aa 0.0 Aa 0.07 ± 0.16
Mean ± SEM 0.15 ± 0.09 0.21 ± 0.09 0.24 ± 0.09 0.22 ± 0.09
For Ndff: means followed by a different letter lower-case letter, in the rows, and capital letter, in the columns, are different (Comparisons among means were made according to Tukey-Kramer and F tests p ≤ 0.1), respectively. For Qndff: means followed by a different letter lower-case letter, in the rows, and capital letter, in the columns, are different (Comparisons among means were made according to Tukey-Kramer test p ≤ 0.1). 1 Treatments were: Control (no N fertilizer applied); AS15N (15N-labeled ammonium sulfate); SH + AS15N (Sunn hemp + 15N-labeled ammonium sulfate); SH15N (15N-labeled Sunn hemp). 2 Standard error of the mean. Adapted from [12].
Table 15. Percent (Ndff) and amount (QNdff) of soil mineral N (NH4+ + NO3-) derived from the labeled fertilizer source (Ndff). Data are average of samplings of the 0-0.2 and 0.2-0.4 m soil layers.
Soil N is often the most limiting element for plant growth and quality. Therefore, green manure may be useful for increasing soil fertility and crop production. With regard to

Biomass Now – Cultivation and Utilization 24
fertilization, organic matter such as a green manure can be potentially important sources of N for crop production [56].
Sugarcane is a fast growing plant that produces high amounts of dry matter. Therefore, it tends to rapidly deplete the soil of inorganic N, especially in soils fertilized with small rates of soluble N as in the case of this study. Cantarella [25] reviewed several Brazilian studies showing little nitrate leaching losses in sugarcane. More recently, [57] showed that only 0.2 kg ha-1 NO3--N derived from 120 kg ha-1 of N as urea enriched to 5.04 15N At% applied to the planting furrow leached below 0.9 m in a sugarcane field, although the total N loss reached 18 kg ha-1 N, mostly derived from soil organic matter mineralization or residual N already present in the soil. As in the present study, the data of [57] refer to N applied at the end of the rainy season when excess water percolating through the soil profile is limited (Figure 2).
Figure 2. Climatic data for maximum and minimum temperature and rainfall during the first sugarcane growing season (plant cane cycle experiment 2), adapted from [12].

Crop Rotation Biomass and Effects on Sugarcane Yield in Brazil 25
5. To evaluate the effect of biomass on the occurrence of nematodes (Pratylenchus spp.) and sugarcane yield after five cuts
The legume most productive was sunn hemp crotalaria juncea IAC-1 with 10,264 kg ha-1, followed by velvet-bean with 4,391 kg ha-1 and peanuts IAC-Caiapó and IAC-Tatu with 3,177 kg ha-1 and 1,965 kg ha-1, respectively.
There was an increase of Stalk yield of sugarcane in the average of the five cuts, compared to control treatment (Table 16). It can be seen that the effect of planting green manure in the fields of sugarcane promoted reform of benefits in terms of increased productivity of sugarcane, and this is lasting reaching in this case until the fifth cut, and the only treatment that stood out was the rotation of the witness with sunn hemp. Notably, the sunn hemp had higher dry matter production, and this may be a positive influence on growth of sugarcane. After five harvests, sunn hemp crotalaria was the leguminous crop that induced the greatest sugarcane yield, with 30% increase in cane yield and 35% in sugar yield.
Rotational crop Harvests 25 Oct 2001 9 Sep 2002 1Aug 2003 7Nov 2004 6 Oct 2005 Mean
--------------------------- Stalk yield, Mg ha-1 ---------------------------- Sunn hemp IAC 1 145.36 122.30 79.70 51.86 39.30 87.70 A Velvet bean 141.2 121.88 75.72 51.78 28.12 85.56 AB Peanut cv. IAC-Tatu 149.92 108.79 74.58 52.16 29.64 83.02 AB Peanut cv. IAC-Caiapó 122.74 122.30 67.42 49.44 36.78 79.74 AB Control 129.90 85.31 55.38 46.40 36.15 67.51 B Mean 138.39 a 113.23 b 71.00 c 50.43 d 34.16 e
C.V.% (plot) = 7.57, CV% (subplots) = 4.20. Means followed by same lower-case letter in rows and capital letters in columns do not differ (Comparisons among means were made according to Tukey test p> 0.05). For statistical analysis the data were transformed into log (x). Adapted from [16].
Table 16. Millable stalk yield of sugarcane plants in five consecutive harvests as a function of treatments.
Crop rotation with non-host species of nematodes, when well planned, can be an efficient method for integrated control of nematodes. It is common in some areas, the practice of cultivation of Fabaceae in the period between the destruction of ratoon sugarcane field and planting the new. There are several plants used in systems of crop rotation with sugarcane, the most common are crotalarias, velvet beans, soybeans and peanuts. However, depending on nematode species occurring in the area, some of these cultures may significantly increase the population of these parasites. Thus, the sugarcane crop, can be greatly impaired by increasing the inoculum potential of the nematodes [58, 59].
The peanut IAC-Caiapó and velvet bean were the leguminous crops that resulted in the greater percentage of AM fungus. The lowest population of Pratylenchus spp. was found in the treatments with peanut IAC-Tatu and IAC-Caiapó (Figure 3).

Biomass Now – Cultivation and Utilization 26
Thet peanut IAC-Caiapó showed a minimum of 10 nematodes per 10 g of roots and a maximum of 470, while on the control this variation was from 80 to 2,510, indicating the smaller presence of the nematode in treatments with peanut IAC-Caiapó (Figure 3).
Figure 3. Number of nematodes of the genus Pratylenchus spp. by 10 grams of roots of sugar sugarcane cultivation influenced by the previous legume species. Adapted from [16].
6. Conclusions
Crop rotation can positively affect yield and increase profit, contributed to raise the net income. This was true both for the green manures (sunn hemp and velvet bean), as for the grain crops (soybean, sunflower and mung bean). Peanuts caused an increase in the sugarcane stalk yields relative to the control, especially in the first harvest, but the high cost of production of this grain somewhat cancelled out the benefit of this rotation.
However, in many sugarcane regions in São Paulo State (Brazil) peanuts are extensively grown in rotation with sugarcane, probably because in those sites yields are higher and the cost of production, lower. Mung beans are a niche crop. Although it provided a relatively high net return in the present study, the risks may be high due to the market restrictions and price fluctuations.
The biomass of green manure induced a complete N substitution in sugarcane and can cause positively affect yield and increase Ca and Mg contents, sum of bases, pH, and base saturation, and decreasing potential acidity and increase profit.
The combination of inorganic fertilizer and green manure resulted in higher sugarcane yields than either N source separately. The recovery of N from ammonium sulfate was higher in the first year whereas in the green manure presented a longer residual effect and
Crop Rotation Biomass and Effects on Sugarcane Yield in Brazil 27
resulted in higher yields of cane in the second cycle. The recovery of 15N- labeled fertilizers by two successive sugarcane crops summed up 19 to 21% of the N applied as sunn hemp and 46 to 49% of the N applied as ammonium sulfate. Very little inorganic N was present in the 0-40 cm soil layer with both N sources.
The sugar content of sugarcane stalks is important because the raw material remuneration takes into account this parameter in Brazil. Some crops that preceded sugarcane had a high effect on sugar yield; this was observed mainly in the first harvest in areas where sunflower, peanuts, velvet beans and sunn hemp were previously cultivated. The 3-year average data showed a sugar yield increase, in the best treatment, of 3 t ha–1 in relation to the control.
The peanut IAC-Caiapó, sunflower and velvet bean were the leguminous crops that resulted in the greater percentage of AM fungus. The lowest population of Pratylenchus spp. was found in the treatments with peanut IAC-Tatu and IAC-Caiapó.
After five harvests, sunn hemp crotalaria was the leguminous crop that induced the greatest sugarcane yield, with 30% increase in cane yield and 35% in sugar yield.
Author details
Edmilson José Ambrosano*, Raquel Castellucci Caruso Sachs and Juliana Rolim Salomé Teramoto APTA, Pólo Regional Centro Sul, Piracicaba (SP), Brazil
Fábio Luis Ferreira Dias APTA, Pólo Regional Centro Sul, Piracicaba (SP), Brazil Instituto Agronômico (IAC), Campinas (SP), Brazil
Heitor Cantarella Instituto Agronômico (IAC), Campinas (SP), Brazil
Gláucia Maria Bovi Ambrosano Universidade Estadual de Campinas, Departamento de Odontologia SocialPiracicaba (SP) Brazil
Eliana Aparecida Schammas Instituto de Zootecnia, Nova Odessa (SP), Brazil
Fabrício Rossi Faculdade de Zootecnia e Engenharia de Alimentos (FZEA/USP), Pirassununga, (SP), Brazil
Paulo Cesar Ocheuze Trivelin and Takashi Muraoka Centro de Energia Nuclear na Agricultura (CENA/USP), Piracicaba (SP), Brazil
Rozario Azcón Estação Experimental de Zaidin, Granada, Espain
* Corresponding Author

Biomass Now – Cultivation and Utilization 28
Acknowledgement
To the technical research support of Gilberto Farias, Benedito Mota, and Maria Aparecida C. de Godoy. To FAPESP and CNPq for the grants. Piraí seeds for green manure and cover crops for the support.
7. References
[1] Environment Agency, soil: a precious resource, Available: http://publications.environment-agency.gov.uk/PDF/GEHO1007BNDB-E-E.pdf , Accessed 2012 Apr 23, Rio House Waterside Drive, Aztec West Almondsbury, Bristol, 2007.
[2] Schipper, L.A. and Sparling, G.P. (2000) Performance of soil condition indicators across taxonomic groups and land uses. Soil Sci. Soc. Am. J., 64, 300-311.
[3] Soil quality for environmental health in http://soilquality.org/home.html Accessed 2012 Mar 23.
[4] Pankhurst, C.E., Magarey, R.C., Stirling, G.R., Blair, B.L., Bell, M.J., Garside, A.L., 2003. Managementpractices to improve soil health and reduce the effects of detrimental soil biota associated with yield decline of sugarcane in Queensland, Australia. Soil Tillage Research 72, 125–137.
[5] Pankhurst, C.E., Stirling, G.R., Magarey, R.C., Blair, B.C., Holt, J.A., Bell, M.J., Garside, A.L., 2005. Quantification of the effects of rotation breaks on soil biological properties and their impact on yield decline in sugarcane. Soil Biology and Biochemistry 37, 1121–1130.
[6] Shoko, M.D., Zhou, M., 2009. Nematode diversity in a soybean–sugarcane production system in a semi-arid region of Zimbabwe. Journal of Entomology and Nematology 1, 25–28.
[7] Garside, A.L., Berthelsen, J.E., Richards, C.L., Toovey, L.M., 1996. Fallow legumes on the wet tropical coast: some species and management options. In: Proceedings of the Australian Society of Sugar Cane Technologists, vol. 18, pp. 202–208.
[8] Shoko, M.D., Tawira, F., 2007. Benefits of soyabeans as a breakcrop in sugarcane production systems in the South Eastern Lowveld of Zimbabwe. Sugar Journal 70, 18–22.
[9] McMahon, G.G., Williams, R.C., McGuire, P.J., 1989. The effects of weed competition on ratoon sugar cane yield. In: Proceedings of the Australian Society of Sugar Cane Technologists, vol. 10, pp. 88–92.
[10] Cheruiyot, E.K., Mumera, L.M., Nakhone, L.N., Mwonga, S.M., 2003. Effect of legumemanaged fallow on weeds and soil nitrogen in following maize (Zea mays L.) and wheat (Triticum aestivum L.) crops in the Rift Valley highlands of Kenya. Australian Journal of Experimental Agriculture 43, 597–604.
[11] Jannink, J.L.; Liebman, M.; Merrick, L.C. Biomass Production and Nitrogen Accumulation in Pea, Oat, and Vetch Green Manure Mixtures. Agronomy Journal 1996. 88 (2). 231-240.

Crop Rotation Biomass and Effects on Sugarcane Yield in Brazil 29
[12] Ambrosano, E.J.; Trivelin, P.C.O.; Cantarella, H.; Ambrosano, G.M.B.; Schammass, E.A; Guirado, N.; Rossi, F.; Mendes, P.C.D.; Muraoka, T. 2005. Utilization of nitrogen from green manure and mineral fertilizer by sugarcane. Scientia Agricola 62: 534-542.
[13] IBGE. (2010). Systematic Survey of Agricultural Production. Available at: http://www.sidra.ibge.gov.br/bda/default.asp? t=5&z=t&o= 1 & u 1 = 1 & u 2 = 1 & u 3 = 1 & u 4 = 1 & u 5 = 1 & u 6 = 1 & u 7 = 1&u8=1&u9=3&u10=1&u11 =26674&u12= 1&u13=1&u14=1 [Accessed Aug. 16, 2011] (in Portuguese).
[14] Ambrosano, E.J.; Azcón R.; Ambrosano, G.M.B.; Cantarella, H.; Guirado, N.; Muraoka, T.; Rossi, F.; Schammass, E.A.; Trivelin, P.C.O.; Ungaro, M.R.; Teramoto S.J.R. 2010. Crop rotation biomass and arbuscular mycorrhizal fungi effects on sugarcane yield. Scientia Agricola 67: 692-701.
[15] Dinardo-Miranda, L.L.; Fracasso, J.V. 2009. Spatial distribution of plantparasitic nematodes in sugarcane fields. Scientia Agricola 66: 188-194
[16] Ambrosano, E.J.; Ambrosano, G. M. B.; Azcón, R.; Cantarella, H.; Dias F.L.F.; Muraoka, T.; Trivelin, P.C.O.; Rossi, F.; Schammass, E.A.; Sachs R.C.C. Productivity of sugarcane after previous legumes crop. Bragantia v. 70, n. 4, p. 1-9, 2011. (in Portuguese, with abstract in English).
[17] Ambrosano, E.J; Trivelin, P.C.O.; Cantarella, H.; Ambrosano, G.M. B.; Schammass, E.A.; Muraoka,T.; Rossi, F.; 15N-labeled nitrogen from green manure and ammonium sulfate utilization by the sugarcane ratoon. Scientia Agricola, v.68, p.361-368, 2011.
[18] Albuquerque, G.A.C.; Araújo Filho, J.T.; Marinho, M.L. 1980. Green manure and its economic importance. Boletim IAA/PLANALSUCAR 1: 1-10. (in Portuguese).
[19] Azcón, R.; Rubro, R.; Barea, J.M. 1991. Selective interactions between different species of mycorrhizal fungi and Rhizobium meliloti strains and theirs effects on growth, N2 fixation (15N) and nutrition of Medicago sativa L. New Phytologist 117: 399- 404.
[20] Panja, B.N.; Chaudhuri S. 2004. Exploitation of soil arbuscular mycorrhizal potential for AM-dependent mandarin orange plants by pre-cropping with mycotrophic crops. Applied Soil Ecology 26: 249-255.
[21] Philips, J.M.; Hayman, D.S. 1970. Improved procedures for cleaning roots and staining parasitic and vesicular arbuscular mycorrhizal fungi for rapid assessment of infection. Transactions of the British Mycological Society 55: 158-162.
[22] Giovanetti, M.; Mosse, B. 1980. An evaluction of techniques for measuring vesicular arbuscular mycorrhizal spores. New Phytologist 84: 489-500.
[23] Tanimoto, T. 1964. The press method of cane analysis. Hawaiian Planter’s Record 57: 133-150.
[24] Ambrosano, E.J.; Trivelin, P.C.O.; Cantarella, H.; Rossetto, R.; Muraoka, T.; Bendassolli, J.A.; Ambrosano, G.M.B.; Tamiso, L.G.; Vieira, F.C.; Prada Neto, I. 2003. Nitrogen-15 labeling of Crotalaria juncea Green Manure. Scientia Agricola 60: 181-184. 67: 692-701.
[25] Cantarella, H.; Trivelin, P.C.O.; Vitti, A.C. 2007. Nitrogen and sulfur in the sugar cane. p. 355-412. In: Yamada, T.; Abdalla, S.R.S.; Vitti, G.C. (ed.) Nitrogen and sulfur in the Brazilian agriculture. Piracicaba: Internacional Plant Nutrition Institute. 722p.
Biomass Now – Cultivation and Utilization 30
[26] Trivelin, P.C.O.; Lara Cabezas, W.A.R.; Victoria, R.L.; Reichardt, K. 1994. Evaluation of a 15N plot design for estimating plant recovery of fertilizer nitrogen applied to sugar cane. Scientia Agricola.51: 226-234.
[27] Shearer, W.B.; Kohl, D.H. 1986. N2-fixation in field settings: estimations based on natural 15N abundance. Australian Journal of Plant Physiology 13: 699-756.
[28] Bataglia, O.C.; Furlani, A.M.C.; Teixeira; J.P.F.; Furlani, P.R.; Gallo, J.R. 1983. Methods for Chemical Analysis of Plants. Instituto Agronômico, Campinas, SP, Brazil. (in Portuguese).
[29] Silveira, P.M.; Braz, A.J.B.P.; Kliemann, H.J.; Zimmermann, F.J.P. 2005. Accumulation of nutrients in the leaves of Guandu and Estilosantes. Pesquisa Agropecuária Tropical 35: 133-138. (in Portuguese, with abstract in English).
[30] Porto, W.S.; Carvalho, C.G.P.; Pinto, R.J.B.; Oliveira, M.F.; Oliveira, A.C.B. 2008. Evaluation of sunflower cultivars for central Brazil. Scientia Agricola 65: 139-144.
[31] Caceres, N.T.; Alcarde, J.C. 1995. Green manuring with leguminous in rotation with sugar cane (Saccharum ssp). STAB 13: 16-20. (in Portuguese).
[32] Perin, A.; Santos, R.H.S.; Urquiaga, S.; Guerra, J.G.M.; Cecon, P.R. 2006. Sunnhemp and millet as green manure for tropical maize production. Scientia Agricola 63: 453-459.
[33] Guimarães, A.P.; Morais, R.F.; Urquiaga, S.; Boddey, R.M.; Alves, B.J.R. 2008. Bradyrhizobium strain and the 15N natural abundance quantification of biological N2 fixation in soybean. Scientia Agricola 65: 516-524.
[34] Azcón-G. de Aguilar, C.; Azcón, R.; Barea, J.M. 1979. Endomycorrhizal fungi and Rhizobium as biological fertilisers for Medicago sativa in normal cultivation. Nature 279: 325–327.
[35] Wutke, A.C.P.; Alvarez, R. 1968. Restoration of soil for the cultivation of sugar cane.Bragantia 27: 201-217. (in Portuguese, with abstract in English).
[36] Mascarenhas, H.A.A.; Tanaka, R.T.; Costa, A.A.; Rosa, F.V.; Costa, V.F. 1994. Residual Effects of Legumes on the Physical and Economic Yield of Sugarcane, Instituto Agronômico, Campinas, SP, Brazil. (in Portuguese).
[37] Mascarenhas, H.A.A.; Nogueira, S.S.S.; Tanaka, R.T.; Martins, Q.A.C.; Carmello, Q.A.C. 1998. Effect of productivity of crop rotation and summer and sunn henp in the winter. Scientia Agricola 55: 534-537 (in Portuguese, with abstract in English).
[38] Sakai, R.H.; Ambrosano, E.J.; Guirado, N.; Rossi, F.; Mendes, P.C.D.; Cantarella, H.; Arevalo, R.A.; Ambrosano, G.M.B. 2007. Agronomic evaluation of four species of mucuna used as green manure in agroecological systems. Revista Brasileira de Agroecologia 2: 910-913. (in Portuguese, with abstract in English).
[39] Franchini, J. C.; Meda, A. R.; Cassiolato, M. E.; Miyazawa, M.; Pavan, M.A. 2001. Plant residue extracts potential for lime mobility in the soil using a biological method. Scientia Agricola 58: 357-360.
[40] Humbert, R.P.. In: The Growing of sugar cane. Amsterdan: Elsevier, 1968. p.133-309. Nutrition of sugar cane.
[41] Silva, L.C.F.; Casagrande, J.C. Nutrição mineral da cana-de-açúcar (macronutrientes) In: Orlando FilhO, J. Nutrição e adubação da cana-de-açúcar no Brasil. Piracicaba: IAA Planalsucar, 1983. p.77-99. (in Portuguese).
Crop Rotation Biomass and Effects on Sugarcane Yield in Brazil 31
[42] Rochester I. and Peoples M. 2005. Growing Vetches (Vicia Villosa Roth) In Irrigated Cotton Systems: Inputs Of Fixed N, N Fertilizer Savings And Cotton Productivity. Plant Soil. 271: 251-264.
[43] KanthacK, R.A.D.; Mascarenhas, H.A.A.; Castro, O.M.; Tanaka, R.T. Nitrogênio aplicado em cobertura no milho após tremoço. Pesquisa Agropecuária Brasileira, v.26, p.99-104, 1991. (in Portuguese, with abstract in English).
[44] Muraoka, T.; Ambrosano, E.J.; Zapata, F.; Bortoletto, N.; Martins, A.L.M.; Trivelin, P.C.O.; Boaretto, A.E.; Scivittaro, W.B. Eficiência de abonos verdes (crotalária y mucuna) y urea, aplicados solo o juntamente, como fuentes de N para el cultivo de arroz, Terra, v.20, p.17-23, 2002. (in Portuguese, with abstract in English).
[45] Silveira, J.A.G.; Crocomo, O.J. 1990. Nitrogen Assimilation in Sugarcane Plants as Affected by High Levels of N and Vinasse in the Soil. Brazilian Journal of Plant Physiology, 2: 7-15.
[46] Freney, J.R.; Denmead, O.T.; wood., a.w.; saffigna, p.g.; chapman, l.s.; ham, g.j.; hurney, a.p.; stewart, r.l. Factors controlling ammonia loss from trash covered sugarcane fields fertilized with urea. Fertilizer Resarch, 31:341-349, 1992.
[47] Gava, G.J.C.; Trivelin, P.C.O.; Vitti, A.C.; Oliveira, M.W. 2003. Recovery of nitrogen (15N) from urea and cane trash by sugar cane ratoon (Saccharum spp.). Pesquisa Agropecuária Brasileira, 27: 621-630. (in Portuguese, with abstract in English).
[48] Trivelin, P.C.O.; Victoria, R.L.; Rodrigues, J.C.S. Aproveitamento por soqueira de cana-de-açúcar de final de safra do nitrogênio da aquamônia-15N e Uréia – 15N aplicado ao solo em complemento à vinhaça. Pesquisa Agropecuária Brasileira, v.30, p.1375-1385, 1995. (in Portuguese, with abstract in English).
[49] Trivelin, P.C.O.; Rodrigues, J.C.S.; Victoria, R.L. Utilização por soqueira de cana-de-açúcar de inicio de safra do nitrogênio da aquamônia-15N e Uréia – 15N aplicado ao solo em complemento à vinhaça. Pesquisa Agropecuária Brasileira, v. 31, p.89-99, 1996. (in Portuguese, with abstract in English).
[50] Silva, E.C.; Muraoka, T.; Buzetti, S.; Guimarães, G.L.; Trivelin, P.C.O.; Veloso, M.E.C. Utilização do nitrogênio (15N) residual de coberturas de solo e da uréia pela cultura do milho. Revista Brasileira de Ciência do Solo, 30:965-974, 2006. (in Portuguese, with abstract in English).
[51] Ambrosano, E.J.; Trivelin, P.C.O.; Cantarella, H.; Ambrosano, G.M.B.; Schammass, E.A.; Muraoka, T.; Guirado, N.; Rossi, F. 2009. Nitrogen supply to maize from sunn hemp and velvet bean green manures. Scientia Agricola 66: 386-394.
[52] Silva, E.C.; Muraoka, Buzetti, S.; Veloso, M.E.C.; Trivelin, P.C.O. Aproveitamento do nitrogênio (15N) da crotalária e do milheto pelo milho sob plantio direto em Latossolo Vermelho de Cerrado. Ciência Rural, 36:739-746, 2006. (in Portuguese, with abstract in English).
[53] Seo, J. Meisinger, J.J.; Lee, H. Recovery of nitrogen-15-labeled hairy veth and fertilizer applied to corn. Agronomy Journal, 98:245-254, 2006.
[54] Boaretto, A.E.; Spolidoria, E.S.; Freitas, J.G.; Trivelin, P.C.O.; Muraoka, T.; Cantarella, H. Fate of 15N-urea applied to wheat-soybean succession crop. Bragantia, 63:265-274, 2004. (in Portuguese, with abstract in English).

Biomass Now – Cultivation and Utilization 32
[55] Basanta, M.V.; Dourado Neto, D.; Reichardt, K.; Bacchi, O.O.S.; Oliveira, J.C.M. Trivelin, P.C.O. Timm, L.C.; Tominaga, T.T.; Correchel, V.; Cassaro, F.A.M.; Pires, L.F.; Macedo, J.R. Management effects on nitrogen recovery in a sugarcane crop grown in Brazil. Geoderma, 116:235-248, 2003.
[56] Asagi, N.; Ueno H. 2009. Nitrogen dynamics in paddy soil applied with various 15N-labelled green manures Plant Soil. 322:251–262.
[57] Ghiberto, P.J.L. Libardi, P.L.; Brito, A.S.; Trivelin, P.C.O. Leaching of nutrients from a sugarcane crop growing on an Ultisol in Brazil. Agricultural Water Management, 96:1443-1448, 2009
[58] Novaretti, W.R.T. Nematóides em cana-de-açúcar e seu controle. Informe Agropecuário, v.16, p.37-42. 1992. (in Portuguese, with abstract in English).