cross-border bank flows and monetary policy · our paper is related to three branches of the...
TRANSCRIPT

Cross-Border Bank Flows and Monetary Policy*
Ricardo Correa Federal Reserve Board [email protected]
Teodora Paligorova Bank of Canada
Horacio Sapriza Federal Reserve Board
Andrei Zlate Federal Reserve Bank of Boston
December 31, 2015
Abstract
Using a novel BIS dataset on bilateral cross-border claims, we study the determinants of cross-border bank flows within a matrix of source and recipient country pairs over the past two decades. The richness of the panel dataset and the econometric specification with country-time fixed effects allow us to distinguish between the supply and demand-side determinants of cross-border bank flows. Controlling for demand conditions in recipient countries, we find that the supply of cross-border bank flows increases when monetary policy in source countries is tightened. Importantly, a tightening of monetary policy in source countries coincides with a slowdown in domestic credit and an acceleration in bank flows toward foreign non-bank borrowers from advanced economies. The result provides empirical support for the existence of an international portfolio rebalancing channel, whereby tighter monetary policy in source countries leads to a decrease in the net worth and collateral values of domestic borrowers, which prompts banks to substitute away from domestic credit and toward foreign credit to safer locations and borrower types. Our findings shed new light on the differentiated impact of monetary policy in source countries on the cross-border banking flows and financial stability in recipient countries.
JEL classification: F34, F36, G01
Key words: cross-border bank flows, monetary policy, country-specific vs. global determinants,
portfolio rebalancing.
* The authors are grateful for the helpful comments from Mark Carey, Stijn Claessens, Sally Davies, Seung Lee, Viktors Stebunovs, Julieta Yung, participants at the Annual Meetings of the Southern Economic Association, and workshop participants at the Bank of Canada and the Federal Reserve Board. We also like to thank Kelly Posenau for outstanding research assistance. The views stated herein are those of the authors and are not necessarily the views of the Bank of Canada, the Federal Reserve Bank of Boston, the Federal Reserve Board, or the Federal Reserve System.

1. Introduction
The rapid growth in cross-border bank linkages over the past three decades has led to a more
interconnected global financial system with both positive and negative consequences. As a result
of the recent Global Financial Crisis, understanding the factors that trigger sharp fluctuations in
cross-border bank flows around the world has become a priority. In particular, academic and
policymakers need a better understanding of the role played by monetary policy in the allocation
of bank credit between domestic and foreign markets, as well as across the foreign destinations
themselves. Assessing the reaction of internationally-active banks to monetary policy shocks
should shed more light on the international financial spillovers that unfold through the banking
sector, with implications for both monetary policy and financial stability in recipient countries.
In this context, we examine the effect of domestic monetary policy on cross-border banking
flows, with particular focus on several questions: (1) What is the effect of domestic monetary
policy on the supply of cross-border banking flows to foreign economies? (2) How does this
effect differ across different types of foreign borrowers, i.e. banks vs. non-banks, and foreign
country characteristics? (3) Aside global factors, is there a role for country-specific factors
(including monetary policy in source countries) as determinants of cross-border banking flows?
To rationalize the domestic and international transmission of monetary policy shocks, the
theoretical literature has long established the existence of a bank lending channel, whereby
monetary tightening leads to a decline in the supply of bank loans, which in turn increases
borrowers’ cost of capital and dampens real economic activity (Bernanke and Gertler, 1995). On
the empirical side, some studies have found that monetary tightenings decrease the aggregate
supply of bank loans (Kashyap et al, 1993), but the effect of tightenings on the supply of loans
varies across banks depending on their size (Kashyap and Stein, 2000). Moreover, the effect of
monetary tightenings varies across loan types, as banks appear to respond by rebalancing their
portfolios away from loans deemed riskier in the context of higher interest rates, such as
consumer and residential real estate loans, and more toward loans deemed to be safer, such as
commercial and industrial loans or commercial real estate mortgages. Depending on the strength
of this substitution, this “portfolio rebalancing” effect may offset the bank lending channel,
whereby monetary tightening actually leads to an increase in the supply of loans for certain
sectors (Den Haan et al., 2007; Den Haan et al., 2009).
1

There is a similar lack of consensus regarding the international transmission of monetary policy
shocks. Global banks are known to facilitate the propagation of monetary policy changes across
borders through their internal liquidity management operations; for instance, domestic monetary
tightening may prompt the domestic offices of global banks to increase their reliance on foreign
liquidity, which in turn decreases the supply of bank loans abroad (Cetorelli and Goldberg,
2012a, 2012b). However, the international transmission of domestic monetary policy shocks
varies with the global banks’ funding and investment priorities across countries (Cetorelli and
Goldberg, 2012b). In fact, the international transmission of monetary policy shocks through
cross-border banking flows may go beyond the realm of global banks, and thus may depend on
other factors such as the type of foreign borrowers (i.e., banks vs. non-banks) or on country-
specific characteristics. Nonetheless, there is only limited evidence on the importance of country-
specific supply factors, in addition to the global factors, as determinants of cross-border banking
flows (Bruno and Shin, 2015a).
As shown by these studies, identifying the impact of changes in domestic monetary policy on the
supply of cross-border banking flows is a challenge. Monetary policy cycles may overlap across
countries, and results that appear as supply-driven increases in cross-border credit due to domestic
monetary policy may be explained by changes in credit demand in the host country. To isolate the
pure supply effect of domestic monetary policy on cross-border flows one needs to fully control
for credit conditions in recipient countries. We are able to solve this identification issue by using
information on bilateral cross-border bank claims from the locational banking statistics by
residence compiled by the Bank for International Settlements (BIS). These statistics are published
at an aggregate level by the BIS, but the bilateral claims dataset, which contains information on
bilateral cross-border bank flows by reporting (source) and counterparty (recipient) country at a
quarterly frequency is available to reporting central banks. We use a sample covering the period
between 1995Q1 and 2014Q1, which allows us to cover several monetary cycles for the 29
reporting countries in our sample.1
The dyadic structure of this dataset allows us to identify the supply of cross-border bank flows by
using different sets of fixed effects. For example, in our more restrictive specification, we
1 In this paper we use ‘reporting’ and ‘source’ country interchangeably. The same applies to ‘counterparty’ and ‘recipient’ country.
2

introduce counterparty-time fixed effects, which allow us to control for unobserved (time-variant)
counterparty-country fundamentals that may shift the demand for cross-border flows. In this case,
the identification of the effect of monetary policy stances on the supply of cross-border flows arises
from the comparison of these flows from different reporting countries to one counterparty country
at a given point in time. This test, which is similar in nature to that applied to firms by Khwaja and
Mian (2008), allows us to isolate factors that affect the supply of cross-border flows from those
that affect the demand of these flows.2
A concern in any study dealing with monetary policy is how to measure the stance of policy set
by the central bank. We follow Herrmann and Mihaljek (2010) and use the nominal policy rate as
the main measure to capture the monetary policy stance in our set of reporting countries. A
potential problem with our strategy is that policy rates in the domestic economy may be
endogenously determined by the cross-border flows supplied by its banks. However, we believe
that this concern is not material. Central banks typically adjust their monetary policy stances to
achieve their mandates of price stability and, for some, employment in their domestic economies
(Bernanke, 2013). Cross-border bank flows only enter a central bank’s policy reaction function if
they either affect domestic financial stability or if these flows have a significant effect on world
output that, in turn, affect the domestic economy. We consider these channels second order effects,
as central bank may use other policies to mitigate financial instability (prudential policies) and the
feedback effect from global growth may not be substantial enough to alter the monetary policy
stance. Thus, the impact of domestic monetary policy on cross-border flows may be considered as
a spillover, which allows us to treat the policy rate as exogenous in our tests.
With this estimating framework in mind, our main results are as follows: (1) While controlling
for foreign demand, we find that tighter monetary policy domestically has a positive and
significant effect on the growth of cross-border claims to non-bank residents in foreign
economies. Similarly, this positive relation between monetary policy rates and the growth in
cross-border claims to foreign residents is also present for total claims and claims on foreign
2 A concern may be that different reporting banking countries face different borrowers in the same country, which would prevent us from controlling for the demand for cross-border flows using only fixed effects. However, as shown by Cerutti, Hale, and Minoiu (2015), a large fraction of cross-border claims on non-banks are intermediated through the global syndicated loan market. Borrowers on this market are likely to be more homogenous, as they have to satisfy a minimum credit quality to be able to seek funds from the global banks that participate on it.
3

banks, even though its robustness varies across specifications. Thus, our results relying on
bilateral cross-border banking flows do not provide evidence for an international bank lending
channel, whereby tighter monetary policy at home would decrease the supply of cross-border
bank flows. (2) Instead, comparing domestic credit growth to cross-border flows, we find that
tighter monetary policy domestically is associated with slower credit growth at home and faster
bank lending to foreign non-bank counterparties, providing support to a “portfolio rebalancing
channel”; the portfolio rebalancing also works toward foreign advanced economies and against
emerging market economies. (3) Lastly, while controlling for global factors, we find that
country-specific characteristics are important determinants of cross-border bank flows. Thus,
faster GDP and faster credit growth in the destination economy are associated with higher bank
inflows; on the contrary, higher aggregate leverage in the destination economy leads to lower
bank inflows.
Our paper is related to three branches of the empirical literature. First, it is related to empirical
work on the transmission of monetary policy through the bank lending channel both domestically
and internationally (Kashyap et al., 1993; Kashyap and Stein, 2000; Cetorelli and Goldberg,
2012a, 2012b). It also adds to recent evidence that monetary tightening leads to a portfolio
rebalancing effect that actually increases the supply of certain loans (commercial and industrial
loans) domestically, which can offsets the bank lending channel (Den Haan et al., 2007). Our
evidence for a portfolio rebalancing effect is consistent with Ippolito et al. (2015), which shows
that firms that that are unhedged and borrow from banks at floating rates may become riskier
during periods of monetary tightening and thus are more likely to lose access to bank credit.
Second, our paper adds to the sparse literature on the determinants of cross-border banking
flows, such as Cerutti et al. (2014), which emphasizes the role of global factors such as
uncertainty, U.S. monetary policy, and U.K. and Euro Area bank conditions; it is also related to
Cerutti and Claessens (2014), which focuses on role of bank-specific vulnerabilities in the
reduction of cross-border and local affiliate lending during the Global Financial Crisis in 2008,
and finds a role for country-specific characteristics like the U.S. policy rate. Finally, our paper is
related to a growing literature on the determinants of international capital flows, but which
focuses on total or portfolio flows rather than on cross-border banking flows (Forbes and
Warnock, 2012; Ahmed and Zlate, 2014, Ghosh et al., 2014).
4

The rest of the paper is structured as follows. Section 2 presents the data and section 3 the
methodology. Sections 4 and 5 describe the main results on the role of monetary policy, portfolio
rebalancing, and the role of other country-specific factors as drivers of cross-border bank flows.
Section 6 presents the robustness results. Section 7 concludes.
2. Data
2.1 Cross-Border Bank Flows
The Locational Banking Statistics (LBS) by residence, compiled by the Bank for International
Settlements (BIS), is the main data source for the empirical tests conducted in the paper. The
dataset is confidential and is made available by the BIS to the central banks of reporting
countries. The LBS provide quarterly data on the aggregate cross-border claims and liabilities of
banks residing in 45 reporting countries (Bank for International Settlements, 2013).3 The first-
difference of cross-border bank claims, which are already adjusted for exchange rate fluctuations
across quarters by the BIS, gives the corresponding bank flows. An advantage of these data,
compared to the banking flows collected from balance of payments statistics, is the detailed
breakdowns of the reported series by destination. In fact, reporting countries produce information
on their bank claims (and liabilities) on roughly 200 counterparty countries, with a breakdown by
currency, instrument (loan and debt securities), and type of counterparty (bank or non-bank).
The LBS dataset includes information dating back to 1977. However, some countries, especially
emerging market economies, started reporting these data only later. This factor, plus the
availability of other data used in the empirical tests, limits our sample to the period between
1995:Q1 and 2014:Q1, for 29 reporting countries and 77 counterparty countries. We also exclude
from our sample the offshore centers that report to the LBS.4 Table 1 presents the list of
countries included in the sample and the number of observations per country. As shown in the
table, France, Germany, Switzerland, and the United Kingdom have the largest number of
3 The BIS LBS started collecting information on domestic claims and liabilities as of 2012:Q2. 4 We exclude financial centers from our sample for two reasons. First, these locations are typically used by corporations or banks to arrange financial transactions whose funds are redirected elsewhere for their final use (Avdjiev, et al., 2014). Second, this pass-through nature of offshore centers makes their monetary policy irrelevant to the banking flow originated in these locations.
5

observations as reporting countries, while the United Kingdom and the United States appear with
the highest frequency as counterparty countries. These cursory statistics outline the importance
of these European countries as hosts for large global banks and the United States as a large
financial center in the global banking network.
The dyadic structure of the LBS data (i.e., multiple reporting countries to multiple
counterparties) allows for the use of different types of fixed effects in the econometric panel
specifications, which are crucial to control for unobservable variation in country-specific drivers
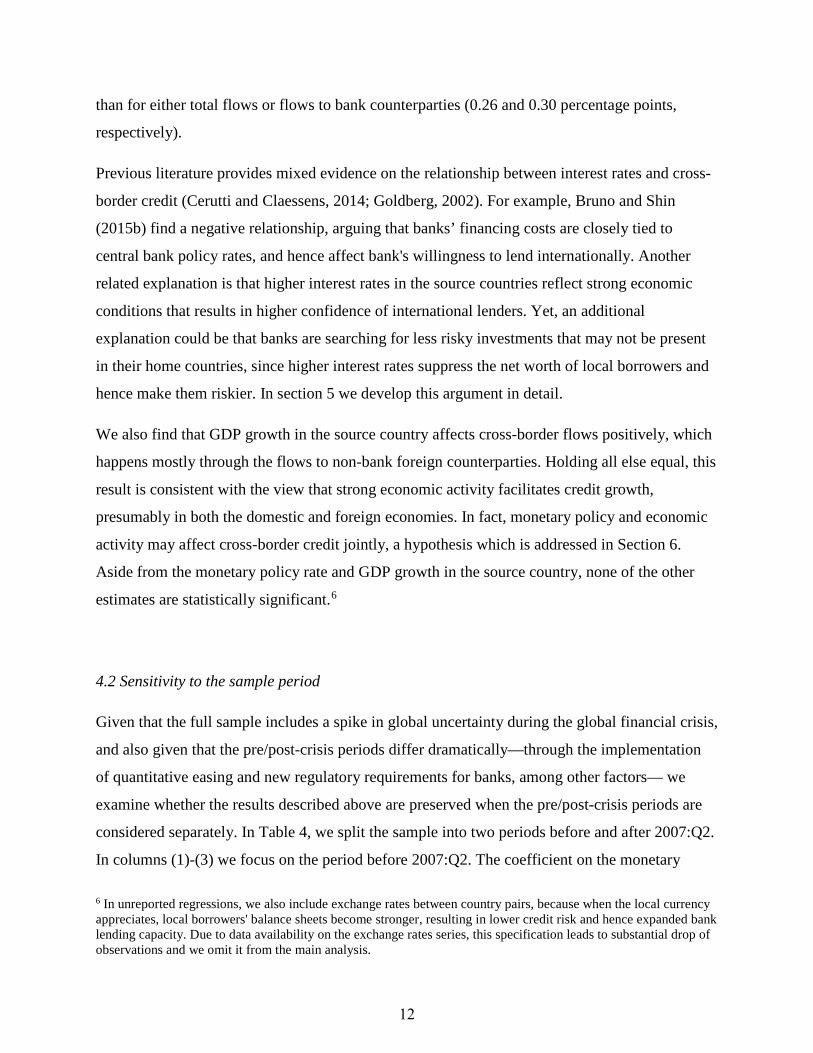
of cross-border bank flows. Figure 1 provides a schematic representation of the dyadic data. In
this hypothetical example, banks from three reporting countries have cross-border exposures to
borrowers from five counterparty countries. This structure allows to disentangle changes in
cross-border bank flows that are driven by supply factors specific to the source country from
those arising from changes in the demand for credit in the destination. An additional advantage
of the LBS dataset arises from the way that cross-border claims are reported. Countries are
required to report to the BIS the amount outstanding of cross-border claims of banks residing in
their jurisdiction, converted to U.S. dollars using the end-of-quarter exchange rate. Note that the
currency composition of these claims are also reported, which allows the BIS to calculate the
exchange rate-adjusted changes in cross-border claims for each country. This is akin to a real
measure of bank flows stripping out any currency variation.
Using these data, we construct the dependent variable used in our estimation, the quarterly
growth of cross-border bank claims, which is equivalent to the cross-border bank flows
normalized by the outstanding bank claims lagged one period. Specifically, we construct this
variable by dividing the exchange rate-adjusted change in outstanding claims from quarter t-1 to
quarter t by the outstanding claims at t-1. Before computing this growth rate, we drop reporting-
counterparty pairs where the minimum outstanding claims in a given quarter are worth less than
$5 million or the total outstanding claims are negative. This final growth rate is expressed in
percent and winsorized at the 2.5 percentile.
Table 2 presents a set of summary statistics for the cross-border bank flows (CBF) computed as
the growth in cross-border claims for our sample of countries. As shown in the table, the
quarterly total CBFs (to bank and non-bank counterparties) average around 4 percent of the
lagged outstanding claims during our sample period. By type of counterparties, the CBFs to
6

banks average around 9 percent, while the CBFs to non-banks average almost 5 percent. The
volatility of flows to banks is also larger than that of flows to non-bank counterparties, as shown
by their standard deviations.
A drawback of the LBS is that it does not contain the historical claims of domestic banks on
borrowers residing in their home country. Some of our tests require the complete portfolio of
claims of reporting banks to assess whether banks substitute domestic claims for foreign claims.
For this purpose, we construct a new dataset of domestic banks’ claims on the domestic non-
bank sector. These claims include both loans and securities, and thus are consistent with the data
in the LBS. To construct the series of bank claims on the domestic non-bank sector, we use two
sources. First, we use data on total credit to the private non-financial sector, also constructed by
the BIS (Dembiermont et al., 2013). Second, we collect data on domestic bank claims, loans, and
securities holdings vis-a-vis the public sector, from national sources consistent with those used
by the BIS. The resulting series on bank credit to the domestic public sector in local currency is
added to the series on bank credit to the private sector to construct the aggregate bank claims to
the domestic non-bank sector. Using these series, we compute growth rates for the outstanding
claims that are compatible with those described above for cross-border claims.
2.2 Monetary policy rates and other explanatory variables
Our main variable of interest is the monetary policy rate, which is targeted by the 29 BIS
reporting countries in our sample. We collect data on this variable from several sources including
central banks and the International Monetary Fund. Some monetary authorities do not target
specific rates, in which case we use the reference rate most widely used by market participants to
assess the monetary stance of the central bank. For euro area countries, we use the individual
countries' policy rates until the introduction of the euro and then the rate for Main Refinancing
Operations (minimum bid rate) set by the European Central Bank for the rest of the sample
period.
In our main specifications, we use the nominal policy rate as the reference rate. As noted by
Herrmann and Mihaljek (2010), there are two reasons why nominal rates should be preferred to
real rates when estimating the determinants of cross-border bank flows. First, banks typically
calculate their expected profits, when making a loan, using nominal rates rather than real rates.
7

Second, it is difficult to select the correct deflator when dealing with cross-border claims. There
are various reasons to use a deflator for the reporting country as well as the counterparty country,
depending on where the bank profits for the loan would be reinvested. That said, we are aware
that real policy rates differ with price inflation across reporting countries. Therefore, we
explicitly add the inflation rate for the reporting countries in our estimation, as well as other
control variables described below.
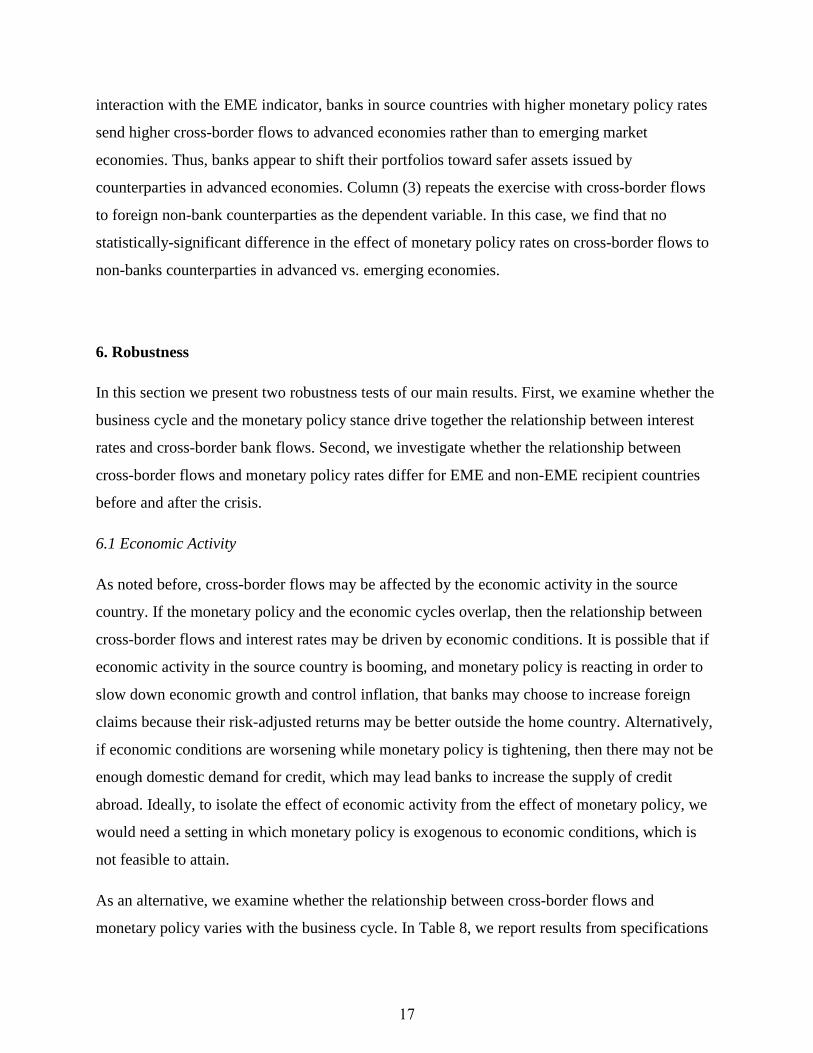
We present a cursory assessment of the relationship between cross-border bank claims and
monetary policy rates in Figure 2. The top left panel shows the mean policy rate for our sample
of 29 reporting countries and the mean growth in cross-border claims for the sample period. As
the pattern of time series shows, the correlation between these two variables appears to be
positive in the sample period. A similar correlation is observed for the cross-border claims
originated in the banking sectors of Great Britain and the United States in the top right and
bottom left panels, respectively. In contrast, the correlation between these two variables appears
to the weaker for the German banking sector, as shown in the bottom right panel. These graphs
provide some basic evidence that higher monetary policy rates are associated with larger cross-
border bank flows. But these cross-border bank flows may also result from other macroeconomic
conditions in both reporting and counterparty countries, which require the use of a series of
controls to capture these factors.
The monetary policy rate is an informative indicator of the monetary policy stance of a country
under normal circumstances. However, in our sample period, three central banks implemented
unconventional monetary policy measures as their reference rate hit the zero lower bound. For
these three countries, Japan, the United Kingdom, and the United States, we construct an
indicator variable equaling one for the duration of the countries’ quantitative easing program and
zero otherwise. For countries not using unconventional tools, the indicator variable equals zero
for the full sample period. More details about these indicator variables and other regressors are in
the Appendix.
In addition to the monetary policy rate, other macroeconomic factors can potentially have a
significant impact on cross-border bank flows. For instance, weak domestic credit demand as a
result of slow economic growth may induce global banks to lend more abroad. Controlling for
these additional factors is crucial to identify the effect of monetary policy rates on cross-border
8

claims. Following the existent literature, we consider the quarterly real GDP growth, the
quarterly inflation rate, and the debt-to-GDP ratio as explanatory variables, as in Bruno and Shin
(2015a), who point out that these factors can potentially affect credit conditions, citing for
instance, that a higher inflation rate could limit the supply of credit. Similarly, in our estimations
we also use bank equity returns at a quarterly frequency, a country-specific variable that
measures the health of the banking system (Bruno and Shin, 2015a; Ghosh et al., 2015). To
capture the reporting countries’ domestic demand for credit, we include the quarter-over-quarter
growth in the domestic credit to the non-financial private sector among the explanatory variables,
constructed using the BIS dataset described before.
Lastly, for the specifications that do not use counterparty-time fixed effects to control for
demand, we collect similar variables for counterparty countries to control for factors that may
affect the demand for cross-border flows.
3. Methodology
We start our analysis estimating variants of the following specification:
CrossBorderFlows i,j,t = αj,t + β MPi,t-1 + X'i,t-1 + εi,j,t
where i and j indicate the reporting (‘source’) country and counterparty (‘recipient’) countries
respectively, and t denotes time at quarterly frequency.5 We use three different cross-border flow
measures: first, the ratio between the (exchange-rate and break adjusted) current minus previous
quarter outstanding claims on all sectors in a counterparty country (numerator) scaled by the
lagged outstanding claims of a reporting country in a given quarter (denominator), which is our
measure of cross-border bank flows; second, the same measure based on claims via-a-vis foreign
bank counterparties; and third, the same measure but for claims on foreign non-bank
counterparties.
We use two different fixed effect estimators. First, αj,t represents a counterparty-time fixed effect,
which accounts for the time variation in country-specific characteristics for the counterparty
5 We use the terms reporting and source country interchangeably; the same applies for counterparty and recipient country.
9

countries. Using this approach ensures that the relationship between monetary policy in the
source country and cross-border flows is not driven by demand for credit in the recipient country,
since the latter is accounted for by the counterparty-time fixed effect. This method therefore
achieves a cleaner identification of the impact of factors specific to the source country on the
supply of cross-border credit. Therefore, the coefficient β should be interpreted as the impact of
the monetary policy stance in reporting countries on the supply of cross-border flows to the same
recipient in a given year-quarter. The upper graph of Figure 3 provides graphical representation
of the counterparty-time identification.
Given this estimation method, we expect the coefficient on monetary policy rates β to be
positive, that is, reporting countries with higher monetary policy rates lend more abroad
compared to reporting countries with lower monetary policy rate in a particular quarter. Our
explanation is that, because monetary policy tightening at home decreases borrowers’ net worth
and collateral values through the balance sheet channel, borrowers become more risky (Ippolito
et al., 2015). Therefore, domestic banks invest in less risky loans to safeguard their capital ratios
(e.g., Den Haan et al., 2007). Because borrowers at home become more risky, banks opt for
cross-border claims, presumably in countries where monetary policy rate is relatively lower and
borrowers are less risky. This behavior is also consistent with the risk-taking channel of
monetary policy in which banks tend to lend to risker borrowers when monetary policy is
accommodative (e.g., Jimenez et al., 2014).
In our second specification, we include reporting-counterparty fixed effects αi,j and we separately
account for trend effects at the year-quarter level αt (these fixed effects replace αj,t in the equation
above). This specification allows us to estimate the relationship between the interest rate
differential of reporting and counterparty countries (MPi,t-1 – MPj,t-1) and cross-border flows.
This estimator controls for persistent characteristics of a reporting-counterparty pair and for the
time variation in global factors, which allows to isolate some of the effect of time-varying
characteristics at the reporter and counterparty levels. However, it also makes it harder to
disentangle the effects of supply from those of demand characteristics, to the extent that
explanatory variables do not entirely capture such variation for the source or destination
countries. The lower graph in Figure 3 shows graphically how the identification is achieved.
10

We also include a set of push (X'i,t-1) and pull factors (X'j,t-1) that have been found to explain
cross-border banks flows. For instance, macroeconomic conditions in host and home countries
drive banking flows, though the evidence is mixed. Bruno and Shin (2015b) find a negative
impact of foreign growth on banking inflows. Goldberg (2002) finds mixed results. The general
“pull” evidence seems to suggest that banking flows are directed to countries with strong
economic activity (e.g., Portes and Rey, 2005). We measure economic activity as the GDP
growth in reporting and counterparty countries (GDPgr_rep and GDPgr_cp). We also include
variables that measure credit growth (CRgr_rep, CRgr_cp) and banking sector equity
performance (BankRet_rep, BankRet_cp) for reporting and counterparty countries. In addition, to
understand whether higher external debt reduces bank inflows as in Bruno and Shin (2015a), we
include the ratio of debt to GDP (Debt/GDP_rep, Debt/GDP_cp). All controls are winsorized at
the 2.5% level and the standards errors are clustered at the reporting country level.
4. Monetary policy and cross-border flows
In this section we explore the relationship between monetary policy rates and cross border credit.
We employ different estimation techniques and specifications to ascertain that our main result is
robust and we discuss the potential effect of a global factor.
4.1 Main results on supply-side determinants
Table 3 presents the fixed effects estimates of the effect of reporting-country monetary policy
(Mprate_rep) on cross-border flows. In column (1) the dependent variable is the growth of cross-
border claims on both bank and non-bank sectors of recipient countries' economies. The estimate
on Mprate_rep suggests that one percent increase in the monetary policy rate in the source
country is associated with an additional 0.26 percentage points in cross-border flows relative to
the outstanding claims per destination. Since we rely on counterparty-time fixed effects, this
estimate is relevant for the cross-section of reporting countries that have a common counterparty
in a given year-quarter. In columns (2) and (3) we split the cross-border bank flows into those
with banking and non-banking foreign counterparties and find a similar relation between the
monetary policy rate and cross-border flows. However, it appears that the effect of higher
interest rates is larger for flows to counterparties in the non-bank sector (0.41 percentage points)
11
than for either total flows or flows to bank counterparties (0.26 and 0.30 percentage points,
respectively).
Previous literature provides mixed evidence on the relationship between interest rates and cross-
border credit (Cerutti and Claessens, 2014; Goldberg, 2002). For example, Bruno and Shin
(2015b) find a negative relationship, arguing that banks’ financing costs are closely tied to
central bank policy rates, and hence affect bank's willingness to lend internationally. Another
related explanation is that higher interest rates in the source countries reflect strong economic
conditions that results in higher confidence of international lenders. Yet, an additional
explanation could be that banks are searching for less risky investments that may not be present
in their home countries, since higher interest rates suppress the net worth of local borrowers and
hence make them riskier. In section 5 we develop this argument in detail.
We also find that GDP growth in the source country affects cross-border flows positively, which
happens mostly through the flows to non-bank foreign counterparties. Holding all else equal, this
result is consistent with the view that strong economic activity facilitates credit growth,
presumably in both the domestic and foreign economies. In fact, monetary policy and economic
activity may affect cross-border credit jointly, a hypothesis which is addressed in Section 6.
Aside from the monetary policy rate and GDP growth in the source country, none of the other
estimates are statistically significant.6
4.2 Sensitivity to the sample period
Given that the full sample includes a spike in global uncertainty during the global financial crisis,
and also given that the pre/post-crisis periods differ dramatically—through the implementation
of quantitative easing and new regulatory requirements for banks, among other factors— we
examine whether the results described above are preserved when the pre/post-crisis periods are
considered separately. In Table 4, we split the sample into two periods before and after 2007:Q2.
In columns (1)-(3) we focus on the period before 2007:Q2. The coefficient on the monetary
6 In unreported regressions, we also include exchange rates between country pairs, because when the local currency appreciates, local borrowers' balance sheets become stronger, resulting in lower credit risk and hence expanded bank lending capacity. Due to data availability on the exchange rates series, this specification leads to substantial drop of observations and we omit it from the main analysis.
12

policy rate is positive for all three types of cross-border bank flows, but it is statistically
significant at the 1 percent level only for flows to foreign non-bank counterparties. Beyond the
flows to foreign non-bank counterparties, the significance of the monetary policy rate for either
the total cross-border flows or for those to bank counterparties is weak at best. In columns (4)-
(6), for the period during and after the crisis, the coefficient on the monetary policy rate is
positive and significant for all flow types.
To sum up, the robustness of the effect of monetary policy on cross-border bank flows differs
across flow types and time periods. Thus, the coefficient on the monetary policy rate is positive
and statistically significant mainly for the bank flows to foreign non-bank counterparties, which
suggests a portfolio rebalancing toward foreign non-bank borrowers.
4.3 Reporter and counterparty country characteristics
In Table 5 we report estimates from specifications that simultaneously include reporter-
counterparty fixed effects and time fixed effects, which allow to isolate the effect of time-
varying characteristics of the reporting- and counterparty countries on cross-border bank flows.
In columns (1)-(3) we include separately the interest rates in the source and recipient countries,
while in columns (4)-(6) we include the interest rate differential (MPrate_diff) instead. As in the
previous table, we also account for a set of push and pull factors found to play a role in cross-
border credit (e.g., Ahmed and Zlate, 2014; Ahmed et al., 2015). The only difference with the
previous specification is that now we can account for source and recipient country controls
separately.
In column (1), the sign on the interest rate in reporting countries (Mprate_rep) is positive and
significant, suggesting that higher monetary policy rates in reporting countries are associated
with higher cross-border bank flows to foreign counterparties. Similarly, the negative coefficient
on the interest rates in the counterparty countries (Mprate_cp) suggests that high interest rates do
not necessarily attract bank inflows. Thus, using the within reporting and counterparty estimates,
we find that cross-border credit moves away from countries with tighter monetary policy, where
borrowers have likely become more risky and where central banks are cooling demand, and
moves to countries with lower interest rates, holding all else equal. In column (2), where the
dependent variable is cross-border flows on banks, the monetary policy rates in counterparty
13

countries enter negatively, while in column (3), for cross-border claims on non-banks, the
monetary policy rates in reporting countries matter positively. In columns (4) to (6) we include a
specification with the interest rate differential between reporting and counterparty countries,
MPrate_diff, whose positive coefficients are consistent with the results in columns (1)-(3):
higher interest rates in the reporter vs. counterparty countries are associated with larger bank
flows from reporters to counterparty countries.
Looking at country characteristics other than monetary policy, GDP growth in the recipient
country (GDPgr_cp) has a positive and significant effect on all three types of cross-border bank
flows. This result is in line with previous studies showing that faster growth attracts more bank
inflows (e.g., Portes and Rey, 2005). In addition, we use country-specific variables that measure
the health of banking systems and the strength of macroeconomic fundamentals in both the
reporting and counterparty countries, such as credit growth to the private non-financial sector,
bank returns, inflation, and total gross debt to GDP. Two results stand out. As a measure of
demand, faster credit growth to the non-financial sector in the counterparty country (CRgr_cp) is
positively correlated with cross-border banking flows to both the banking and non-banking
sectors. Although this result may be partially mechanic, as our measure of total domestic credit
growth to the private non-financial sector includes cross-border credit, the use of lagged credit
growth mitigates the concern of reverse causation. In addition, greater indebtedness in recipient
countries deters bank flows to the non-bank counterparties, consistent with the findings in Bruno
and Shin (2015b), but has no effect on cross-border flows to bank counterparties.
To assess the impact of unconventional monetary policy on cross-border bank flows, we use a
dummy variable (QE_rep) that equals one for reporter countries in quarters when quantitative
easing was in place. The coefficient on that indicator variable is positive and significant, but only
for cross-border banking flows to the non-bank sector.
More recently, a series of studies have documented that permissive credit conditions in countries
with accommodative monetary policy—and hence low interest rates—are transmitted across
borders. Miranda-Agrippino and Rey (2015) highlight the highly synchronized nature of
financial conditions across borders and the co-movement in debt flows that accompanies them.
There is also robust evidence that banking flows respond negatively to an increase in global risk
aversion, when central banks usually lower interest rates (Bruno and Shin (2015b)). Hence, it is
14

possible that the positive effect of monetary policy rates on cross border bank flows that we
highlight above is driven by a “global factor” (e.g., risk aversion) that is correlated with interest
rates, rather than by interest rates as country-specific characteristics. However, the estimation
technique used in Table 5 appeases this concern. Since the global factor is likely unobservable,
and to the extent that it operates in the same way across reporting and counterparty countries, the
time fixed effect accounts for it. Accounting for the global factor in this manner, the country-
specific interest rates are still statistically significant determinants of cross-border banking flows.
5. Monetary policy and bank portfolio rebalancing
The results in the previous section showed a positive relation between monetary policy rates in
sources countries and cross-border bank flows, especially to foreign counterparties in the non-
bank sector. As noted earlier, this result is inconsistent with the traditional bank lending channel,
which states that the cross-border flow of new loans should decrease as monetary policy tightens.
However, our findings are consistent with a broader portfolio rebalancing conducted by global
banks, whereby these institutions decrease domestic lending, in line with the bank lending
channel, but at the same time increase their foreign lending, in line with the portfolio rebalancing
channel described in Den Haan et al. (2007).
In the previous sections we only used information on the growth of cross-border claims as our
main dependent variable. To determine whether banks rebalance their portfolios as monetary
policy rates increase, we use a new database that includes not only cross-border claims to the
non-bank sector, but also claims on the domestic non-bank sector. We focus on cross-border
bank flows to non-bank counterparties, for which we found the most robust evidence for a
positive relation between interest rates in source countries and cross-border bank flows.
Table 6 reports the results from a specification similar to that in equation (1), in which the
dependent variable also includes the growth in domestic claims of banks from reporter country i
on non-banks from country i itself; these are stacked with the growth in cross-border claims by
banks from source country i on non-bank counterparties from recipient countries j. The control
variables are the same as before, and we still use counterparty-time fixed effects to control for
demand conditions in the recipient countries. In addition, we introduce a domestic indicator
15

variable (Domestic ind.) that equals one when the claim is on the domestic non-bank sector; this
domestic counterparty indicator is interacted with the monetary policy rate. Thus, in Table 6, the
specification in column (1) simply replicates the estimations from Table 3 (column 3), but with
the growth in domestic claims included in the dependent variable. As is shown by the coefficient
of the monetary policy rate, the results are robust to the inclusion of domestic claims, as this
coefficient remains positive and significant.
Also in Table 6, columns (2) and (3) present results with the monetary policy rate interacted with
the domestic indicator. A negative coefficient on this interaction term would present evidence
that banks adjust their domestic and foreign portfolios differently in response to changes in
monetary policy rates. The negative and statistically significant coefficient on the interacted term
suggests that, when monetary policy in a source country is tighter, banks increase cross-border
flows to foreign non-bank counterparties, while at the same time they decrease or maintain
constant the growth in the claims to domestic non-bank counterparties. As reported in column
(3), this result is robust for the pre-Global Financial Crisis period, with the sample used in that
specification ending in 2007:Q2. These results are consistent with the existence of both an
international portfolio rebalancing channel and a domestic balance sheet channel.
To rationalize the international portfolio rebalancing channel, we reckon that as monetary policy
rates in sources countries increase, domestic borrowers may become riskier (Ippolito et al.,
2013), which may lead banks to invest in safer assets issued by foreign residents. But are banks
rebalancing their portfolios toward safer foreign assets? We test this hypothesis in Table 7, in
which we differentiate banks' reaction to monetary policy rates (and to the other control
variables) depending on whether the counterparty is located in an advanced or an emerging
economy. Although this is a simple definition of risky borrowers, it is consistent with market
perceptions on the riskiness of borrowers across countries. To differentiate between foreign
advanced and emerging market economies, we construct an indicator variable that equals one
when the counterparty country is in the latter group. Then, we interact this indicator variable
(EME) with all our regressors. Once again, the variables of interest are the monetary policy rate
of the reporting country (Mprate_rep) and its interaction with the EME indicator variable.
In columns (1) and (2) of Table 7, the dependent variables are the cross-border bank flows, both
total and to bank counterparties. As shown by the coefficient on the monetary policy rate and its
16
interaction with the EME indicator, banks in source countries with higher monetary policy rates
send higher cross-border flows to advanced economies rather than to emerging market
economies. Thus, banks appear to shift their portfolios toward safer assets issued by
counterparties in advanced economies. Column (3) repeats the exercise with cross-border flows
to foreign non-bank counterparties as the dependent variable. In this case, we find that no
statistically-significant difference in the effect of monetary policy rates on cross-border flows to
non-banks counterparties in advanced vs. emerging economies.
6. Robustness
In this section we present two robustness tests of our main results. First, we examine whether the
business cycle and the monetary policy stance drive together the relationship between interest
rates and cross-border bank flows. Second, we investigate whether the relationship between
cross-border flows and monetary policy rates differ for EME and non-EME recipient countries
before and after the crisis.
6.1 Economic Activity
As noted before, cross-border flows may be affected by the economic activity in the source
country. If the monetary policy and the economic cycles overlap, then the relationship between
cross-border flows and interest rates may be driven by economic conditions. It is possible that if
economic activity in the source country is booming, and monetary policy is reacting in order to
slow down economic growth and control inflation, that banks may choose to increase foreign
claims because their risk-adjusted returns may be better outside the home country. Alternatively,
if economic conditions are worsening while monetary policy is tightening, then there may not be
enough domestic demand for credit, which may lead banks to increase the supply of credit
abroad. Ideally, to isolate the effect of economic activity from the effect of monetary policy, we
would need a setting in which monetary policy is exogenous to economic conditions, which is
not feasible to attain.
As an alternative, we examine whether the relationship between cross-border flows and
monetary policy varies with the business cycle. In Table 8, we report results from specifications
17

similar to the ones used in Table 3, but we add an interaction term between the monetary policy
rate and GDP growth in the reporting countries. Our focus is on the interaction term and also on
the base coefficient on Mprate_rep. Starting with column (1), in which the dependent variable is
the growth in cross-border flows to all sectors, we observe that the base coefficient on
Mprate_rep is positive and significant. The interaction term between the monetary policy rate
and GDP growth is negative and significant, suggesting that as GDPgr_rep increases, the
relationship between monetary policy and cross-border flows weakens. This result is not
surprising, as it is consistent with an increase in domestic credit demand when GDP growth is
elevated and monetary policy is tightening.
In column (2), the dependent variable is cross-border flows on the banking sector. The result is
similar to the one reported in column (1). In column (3), we note that GDPgr_rep does not play a
role in influencing the growth in cross-border flows to non-banks. Overall, we find that GDP and
monetary policy affect cross-border flows independently and our result is likely not being
affected by the confounding effects of economic activity.
6.2 EMEs vs. Non EMEs Before and During the Financial Crisis
In Table 9, we estimate our main specifications separately for EME and non-EME recipient
countries, and also for the period before and after the Global Financial Crisis. In previous
specifications, we tested our main hypothesis separately using these breakdowns, but it is
informative to combine both features to assess if any new relationships can be revealed. In
columns (1)-(12) we look at EME countries before 2007:Q2, followed by non-EME countries
before 2007:Q2, EME countries after 2007:Q2, and non-EME countries after 2007:Q2.
We find that the relationship between cross-border flows and monetary policy for non-EME
countries is very similar before and after 2007:Q2, which is consistent with the portfolio
rebalancing channel. This is potentially explained by banks’ perception that borrowers in non-
EME countries are safer, even after the Global Financial Crisis.
In contrast, we also find that there are differences in the reaction of cross-border flows to EME
borrowers to monetary policy rates before and after 2007:Q2. As shown in column (2), the
coefficient on the monetary policy rate is negative and significant for cross-border flows on
banks after 2007:Q2, but it plays a positive role for flows to the non-bank sector in the same
18

period, as shown in column (3). As for the period before 2007:Q2, we find that cross-border
flows to banks in EME countries are not significantly related to monetary policy rates in the
reporting country. For non-banks, the relationship is positive and significant.
These results show that the relationship between cross-border flows and monetary policy rates is
complex and depends on both the time period and the country of destination. However, these
findings support our main explanation that bank flows go to safer locations as a result of a bank
portfolio rebalancing channel.
7. Conclusions
As cross-border bank flows increased rapidly over the past three decades, it became crucial to
understand the main drivers of these international transactions, as well as the risks that they
generate to both creditors and borrowers. This paper focuses on a specific but important link in
this cross-border transmission mechanism, the relation between monetary policy and cross-
border bank flows. In particular, we ask whether global banks adjust their cross-border flows
according to an international bank lending channel, or if they adjust their flows in a way that
rebalances their portfolios towards riskier or safer securities.
To answer these questions, we use information from the BIS locational banking statistics, as well
as a novel dataset with information on banks’ claims on the domestic non-bank sector. The
dyadic structure of these data allows us to control for factors affecting the demand for cross-
border flows, which helps in the identification of changes in the supply of cross-border flows as
a result of movements in monetary policy rates.
There are three main results that arise from our tests. First, monetary policy tightening episodes
during periods of conventional monetary policy are associated with an increase in cross-border
flows, particularly to non-banks. Second, banks appear to rebalance their portfolios away from
domestic claims to non-banks and into cross-border flows to non-banks. This may be the result
of domestic borrowers becoming riskier relative to foreign borrowers. To test whether those
foreign borrowers are safer, we separate the effect of the monetary policy rate on cross-border
flows to borrowers in emerging and advanced economies. This exercise leads to our third result.
19

Global banks lend more to banks in advanced economies and to non-banks in both emerging and
advanced economies as policy rates increase. The result is consistent with a partial flight to
safety as monetary policy tightens.
20

References:
Ahmed, Shaghil and Andrei Zlate, 2014. “Capital Flows to Emerging Market Economies; A
Brave New World?” Journal of International Money and Finance (2014):1-28.
Ahmed, Shaghil, Stephanie Curcuru, Francis Warnock, and Andrei Zlate, 2015. “The Two
Components of International Capital Flows,” mimeo, Boston Fed.
Avdjiev, Stefan, Michael Chui, and Hyun Song Shin, 2014. “Non-financial corporations from
emerging market economies and capital flows,” BIS Quarterly Review, December.
Bank for International Settlements, 2013. “Guidelines for reporting the BIS international banking
statistics.” http://www.bis.org/statistics/bankstatsguide.pdf
Bernanke, Ben S., 2013. “Monetary Policy and the Global Economy,” Speech at the Department
of Economics and STICERD (Suntory and Toyota International Centres for Economics and
Related Disciplines) Public Discussion in Association with the Bank of England, London School
of Economics, London, United Kingdom.
http://www.federalreserve.gov/newsevents/speech/bernanke20130325a.htm
Bernanke, Ben S., and Mark Gertler, 1995. "Inside the Black Box: The Credit Channel of
Monetary Policy Transmission," Journal of Economic Perspectives 9(4): 27-48.
Bruno, Valentina and Hyun Song Shin, 2015a. “Capital flows and the risk-taking channel of
monetary policy,” Journal of Monetary Economics, 71:119–132.
Bruno, Valentina and Hyun Song Shin, 2015b. “Cross-Border Banking and Global Liquidity,”
Review of Economic Studies 82(2): 535-564.
Cerutti, Eugenio, Stijn Claessens and Lev Ratnovski, 2014. "Global Liquidity and Drivers of
Cross-Border Bank Flows," IMF Working Papers 14/69, International Monetary Fund.
Cerutti, Eugenio and Stijn Claessens, 2014. “The Great Cross-Border Bank Deleveraging:
Supply Constraints and Intra-Group Frictions,” IMF Working Papers 14/1, International
Monetary Fund.
21

Cerutti, Eugenio, Galina Hale, and Camelia Minoiu, 2015. “Financial crises and the composition
of cross-border lending,” Journal of International Money and Finance 52(2015): 60-81.
Cetorelli Nicola and Linda S. Goldberg, 2012a. "Banking Globalization and Monetary
Transmission," Journal of Finance 67(5): 1811-1843.
Cetorelli, Nicola and Linda S. Goldberg, 2012b. "Liquidity management of U.S. global banks:
Internal capital markets in the great recession" Journal of International Economics 88(2): 299-
311.
Dembiermont, Christian, Mathias Drehmann, and Siriporn Muksakunratana, 2013. “How much
does the private sector really borrow a new database for total credit to the private non-financial
sector,” BIS Quarterly Review, March.
Den Haan, Wouter J., Steven W. Sumner, and Guy M. Yamashiro, 2007. "Bank loan portfolios
and the monetary transmission mechanism," Journal of Monetary Economics 54(3): 904-924.
Den Haan, Wouter J., Steven W. Sumner, and Guy M. Yamashiro, 2009. "Bank loan portfolios
and the Canadian monetary transmission mechanism," Canadian Journal of Economics 42(3):
1150-1175.
Forbes, Kristin and Francis Warnock, 2012. “Capital Flow Waves: Surges, Stops, Flight, and
Retrenchment,” Journal of International Economics 88: 235-251.
Ghosh, Atish, Mahvash Qureshi, Jul Kim, and Juan Zeldueno, 2014. “Surges,” Journal of
International Economics 92: 266-285.
Goldberg, Linda S., 2002. “When is U.S. bank lending to emerging markets volatile?” In
Sebastian Edwards and Jeffrey A. Frankel (Eds.), Preventing Currency Crises in Emerging
Markets (pp. 171–196). University of Chicago Press.
Herrmann, Sabine and Dubravko Mihaljek, 2010. “The determinants of cross-border bank flows
to emerging markets: new empirical evidence on the spread of financial crisis,” BIS Working
Papers No. 315, July.
22

Ippolito, Filippo, Ali Ozdagli, and Ander Perez, 2015. “The Transmission of Monetary Policy
through Bank Lending: The Floating Rate Channel,” mimeo, Boston Fed.
Jimenez, Gabriel, Steven Ongena, Jose Luis Peydro, and Jesus Saurina, 2014. “Hazardous times
for monetary policy: What do 23 million loans say about the impact of monetary policy on credit
risk taking?” Econometrica, 82 (2): 463–505.
Kashyap, Anil K., Jeremy C. Stein, and David Wilcox, 1993. “Monetary Policy and Credit
Conditions: Evidence from the Composition of External Finance,” American Economic Review
83(1): 78-98.
Kashyap, Anil K., and Jeremy C. Stein, 2000. "What Do a Million Observations on Banks Say
about the Transmission of Monetary Policy?" American Economic Review 90(3): 407-428.
Khwaja, Asim I. and Atif Mian, 2008. “Tracing the Impact of Bank Liquidity Shocks: Evidence
from and Emerging Market,” American Economic Review 98(4), 1413-1442.
Miranda-Agrippino, Silvia and Helene Rey, 2015. “World asset markets and global liquidity,”
Working Paper.
Portes, Richard and Helene Rey, 2005. “The determinants of cross-border equity flows,” Journal
of International Economics 65:269–296.
23

Figure 1: Data Structure of BIS Locational Banking Statistics
Brazil
USA (Reporting Country)
Indonesia
France (Reporting Country)
Japan
Canada (Reporting Country)
India
China
29
RE
PO
RT
ING
CO
UN
TR
Y (
sen
din
g)
77
Co
un
terp
art
y C
ou
ntr
y (
rece
ivin
g)
24

Figure 2: Cross-Border Flow and Monetary Policy
12
34
56
Mea
n M
onet
ary
Pol
icy
Rat
e (%
)
−10
010
2030
Mea
n C
ross
−bo
rder
Flo
ws
(%)
1995
q1
1997
q1
1999
q1
2001
q1
2003
q1
2005
q1
2007
q1
2009
q1
2011
q1
2013
q1
Mean Cross−border Flows (%) Mean Monetary Policy Rate (%)
All (Reporting) Countries
02
46
8M
onet
ary
polic
y ra
te (
%)
−20
−10
010
2030
Cro
ss−
bord
er fl
ows
(%)
1995
q1
1997
q1
1999
q1
2001
q1
2003
q1
2005
q1
2007
q1
2009
q1
2011
q1
2013
q1
Cross−border flows (%) Monetary policy rate (%)
Great Britain
02
46
8M
onet
ary
polic
y ra
te (
%)
−20
020
40C
ross
−bo
rder
flow
s (%
)
1995
q1
1997
q1
1999
q1
2001
q1
2003
q1
2005
q1
2007
q1
2009
q1
2011
q1
2013
q1
Cross−border flows (%) Monetary policy rate (%)
USA
01
23
45
Mon
etar
y po
licy
rate
(%
)
−10
010
2030
Cro
ss−
bord
er fl
ows
(%)
1995
q1
1997
q1
1999
q1
2001
q1
2003
q1
2005
q1
2007
q1
2009
q1
2011
q1
2013
q1
Cross−border flows (%) Monetary policy rate (%)
Germany
These graphs show quarterly monetary policy rates and cross-border flows to all sectors defined as the ratio ofcurrent cross-border claims over total outstanding lagged claims.
25

Figure 3: Graphical Presentation of Our Identification
X (CBF)
Y (CBF)
X (CBF)
X1 (CBF)
b) Reporting/Counterparty Fixed Effects
a) Counterparty/Year-Quarter Fixed Effects
Co
un
terp
art
y C
ou
ntr
y
USA (Reporting Country, 2003q2): 1.25
CANADA (Reporting Country, 2003q2): 3.25
Identification: Y-X
Co
un
terp
art
y C
ou
ntr
y
USA (Reporting Country, 2003q2): 1.25
USA (Reporting Country, 2007q4): 4.5
Identification: X1-X
26

Table 1: List of reporting and counterparty countriesEME reporting (EME counterparty) takes one if the reporting (counteraprty) country is clas-sified as an emerging economy and zero otherwise.
Reporting Country Observations EME reporting Counterparty Country Observations EME counterpartyAUSTRALIA 1,467 0 ALGERIA 456 1AUSTRIA 3,832 0 ARGENTINA 1,014 1BELGIUM 4,034 0 AUSTRALIA 1,316 0BRAZIL 819 1 AUSTRIA 1,389 0CANADA 2,333 0 BELGIUM 1,498 0DENMARK 2,238 0 BOLIVIA 123 1FINLAND 1,581 0 BRAZIL 1,276 1FRANCE 5,228 0 BULGARIA 672 1GERMANY 5,318 0 CANADA 1,402 0GREECE 845 1 CHILE 1,171 1HONG KONG 2,184 1 CHINA 1,376 1INDIA 1,764 1 COLOMBIA 700 1INDONESIA 274 1 COTE D’IVOIRE 231 1IRELAND 2,265 0 CROATIA 473 1ITALY 3,348 0 CYPRUS 777 1JAPAN 3,410 0 CZECH REPUBLIC 951 1KOREA 2,160 0 DENMARK 1,394 0LUXEMBURG 2,549 0 ESTONIA 122 1MALAYSIA 866 1 FINLAND 1,270 0MEXICO 170 1 FRANCE 1,636 0NETHERLANDS 4,094 0 GERMANY 1,598 0PORTUGAL 1,479 0 GHANA 346 1SOUTH AFRICA 373 0 GREECE 1,143 1SPAIN 3,285 0 GUATEMALA 345 1SWEDEN 2,227 0 HONG KONG 1,362 1SWITZERLAND 5,236 0 HUNGARY 936 1TURKEY 794 1 ICELAND 838 0UNITED KINGDOM 5,236 0 INDIA 1,074 1UNITED STATES 3,889 0 INDONESIA 1,308 1TOTAL 73,298 29 IRELAND 1,505 0
ISRAEL 1,017 1ITALY 1,508 0JAMAICA 231 1JAPAN 1,561 0JORDAN 406 1KOREA 1,134 1KUWAIT 557 1LATVIA 73 1LIBYA 169 1LITHUANIA 270 1LUXEMBOURG 1,487 0MALAYSIA 933 1MAURITIUS 388 1MEXICO 1,219 1MOROCCO 892 1NETHERLANDS 1,612 0NEW ZEALAND 901 0NORWAY 1,391 0OMAN 500 1PAKISTAN 707 1PANAMA 1,097 1PARAGUAY 341 1PERU 918 1PHILIPPINES 1,004 1POLAND 1,128 1PORTUGAL 1,295 0QATAR 564 1ROMANIA 647 1RUSSIA 1,314 1SAUDI ARABIA 1,004 1SENEGAL 172 1SINGAPORE 1,483 1SLOVAK REPUBLIC 555 1SLOVENIA 582 1SOUTH AFRICA 1,195 1SPAIN 1,406 0SRI LANKA 538 1SWEDEN 1,393 0SWITZERLAND 1,595 1TAIWAN 946 1THAILAND 940 1TUNISIA 635 1TURKEY 1,317 1UKRAINE 309 1UNITED KINGDOM 1,652 0UNITED STATES 1,647 0VENEZUELA 963 1TOTAL 73,298 77
27

Table 2: Sample StatisticsThis table reports summary statistics for cross-border flows, reporting and counterparty coun-tries. All variables are defined in the Appendix.
Observations Mean Median StDev Min Max
Cross-Border Flows (CBF)CBF to Banks and Non-Banks (%) 73,298 4.08 0.87 24.29 -44.10 89.25CBF to Banks (%) 70,844 9.01 0.54 46.99 -66.59 195.74CBF to Non-Banks (%) 71,623 4.85 0.57 27.11 -47.58 107.35Reporting CountryMPrate rep 73,298 3.10 2.67 3.24 0.00 61.00CRgr rep 73,298 1.94 1.79 4.97 -18.99 20.97Bankret rep 73,298 2.68 3.02 17.03 -83.43 90.74GDPgr rep 73,298 2.16 2.29 4.10 -27.60 29.33Debt/GDP rep 73,298 67.90 62.58 38.98 3.08 244.25Infl rep 73,298 2.19 1.97 2.72 -13.67 39.18QE rep 73,298 0.05 0.00 0.23 0.00 1.00Counterparty CountryMPrate cp 44,990 5.54 3.83 9.86 0.00 300.00CRgr cp 44,990 2.32 2.20 5.57 -37.97 22.89Bankret cp 44,990 3.50 3.11 19.25 -83.43 232.17GDPgr cp 44,990 2.93 3.02 5.55 -52.53 53.33Debt/GDP cp 44,990 56.20 48.60 35.28 1.85 244.25Infl cp 44,990 4.73 2.69 20.28 -29.50 1551.20
28

Table 3: Main Regression: Cross-Border Flows and Monetary Policy of ReportingCountriesThis table reports within counterparty/year-quarter estimates. All variables are one quarterlagged. Variable definitions are listed in the Appendix. Standard errors are clustered at thereporting country level. *** denotes 1% significant level, ** denotes 5% significant level, and* denotes 10% significant level.
Cross-Border Credit (CBF) to:Banks&Non-Banks Banks Non-Banks
(1) (2) (3)
Mprate rep 0.259*** 0.298** 0.413***[0.090] [0.114] [0.107]
GDPgr rep 0.084** 0.014 0.099*[0.038] [0.067] [0.049]
CRgr rep 0.040 0.122 0.074[0.059] [0.087] [0.072]
Bankret rep -0.003 -0.000 -0.005[0.010] [0.019] [0.014]
Debt/GDP rep -0.006 -0.014 -0.003[0.005] [0.009] [0.006]
Infl rep -0.013 0.082 0.060[0.069] [0.152] [0.082]
QE rep 0.859 -0.663 1.206[0.857] [1.364] [1.420]
Observations 73,298 70,877 71,704R2 0.12 0.12 0.11Fixed Effects Count./Year-Quarter Count./Year-Quarter Count./Year-Quarter
29

Tab
le4:
Cro
ss-B
ord
erCre
dit
and
Moneta
ryPolicyofReportingCountriesBefore
/After2007Q2
Thistablereports
within
counterparty/y
ear-quarterestimates.Thedep
endentvariab
leiscross-border
flow
sdefined
intheAppendix.
Allvariab
lesarelagged
atthepreviousquarter.
Variable
definitionsarelisted
intheAppendix.Standard
errors
are
clustered
at
thereportingcountrylevel.***denotes
1%sign
ificantlevel,**
denotes
5%sign
ificantlevel,and*denotes10%
significantlevel.
BanksandNon-B
anks
Banks
Non-B
anks
BanksandNon-B
anks
Banks
Non-B
anks
Before
2007Q2
After2007Q2
(1)
(2)
(3)
(4)
(5)
(6)
Mprate
rep
0.157*
0.180
0.335***
0.563***
0.767***
0.663***
[0.080]
[0.114]
[0.112]
[0.127]
[0.200]
[0.205]
GDPgrrep
-0.005
-0.003
0.007
0.093*
0.009
0.132**
[0.007]
[0.017]
[0.009]
[0.047]
[0.085]
[0.061]
CRgrrep
-0.002
0.003
0.086
0.074
0.219
0.071
[0.074]
[0.131]
[0.103]
[0.085]
[0.130]
[0.072]
Bankretrep
-0.018
-0.015
-0.004
0.009
0.009
-0.006
[0.019]
[0.038]
[0.018]
[0.012]
[0.028]
[0.019]
Deb
t/GDP
rep
-0.004
-0.005
0.009
-0.005
-0.014**
-0.009
[0.007]
[0.017]
[0.009]
[0.004]
[0.006]
[0.006]
Inflrep
0.136
0.171
0.116
-0.165*
-0.068
-0.021
[0.084]
[0.193]
[0.104]
[0.093]
[0.183]
[0.133]
QE
rep
1.219
-3.314*
1.641
0.998
0.439
0.990
[0.790]
[1.850]
[1.174]
[1.066]
[1.643]
[1.746]
Observations
42,850
41,562
41,894
30,448
29,315
29,810
R2
0.12
0.12
0.12
0.11
0.11
0.10
Counter./Year-Quarter
Fixed
Effects
Yes
Yes
Yes
Yes
Yes
Yes
30

Table 5: Where Do Cross-Border Flows Go?This table reports regressions results of within reporting-counterparty estimator.MPrate diff is the difference between the rates of reporting and counterparty countries.All variables are lagged at the previous quarter. Variable definitions are listed in the Ap-pendix. All specifications include year-quarter fixed effects. Standard errors are clustered atthe reporting country level. *** denotes 1% significant level, ** denotes 5% significant level,and * denotes 10% significant level.
Banks&Non-Banks Banks Non-Banks Banks&Non-Banks Banks Non-Banks
(1) (2) (3) (4) (5) (6)
Mprate rep 0.154* 0.183 0.238***[0.079] [0.122] [0.082]
Mprate cp -0.097** -0.237*** -0.065[0.046] [0.079] [0.056]
MPrate diff 0.119*** 0.216*** 0.118**[0.041] [0.077] [0.055]
GDPgr rep 0.026 -0.019 0.035 0.026 -0.019 0.035[0.052] [0.079] [0.063] [0.052] [0.080] [0.063]
CRgr rep 0.021 0.088 0.019 0.021 0.088 0.019[0.056] [0.077] [0.067] [0.056] [0.077] [0.067]
Bankret rep -0.010 -0.005 -0.008 -0.010 -0.005 -0.008[0.011] [0.021] [0.015] [0.011] [0.021] [0.015]
Debt/GDP rep -0.032* -0.033 -0.038** -0.031* -0.034 -0.035**[0.016] [0.028] [0.015] [0.016] [0.027] [0.015]
Infl rep -0.093 -0.068 0.006 -0.081 -0.079 0.035[0.085] [0.138] [0.095] [0.076] [0.123] [0.091]
QE rep 1.754* 2.498 2.683** 1.697* 2.552 2.497**[0.914] [1.702] [1.021] [0.894] [1.710] [0.993]
GDPgr cp 0.110*** 0.180*** 0.055* 0.200*** 0.345*** 0.090**[0.034] [0.060] [0.032] [0.029] [0.040] [0.040]
CRgr cp 0.199*** 0.346*** 0.089** 0.200*** 0.345*** 0.090**[0.029] [0.041] [0.040] [0.029] [0.040] [0.040]
Bankret cp 0.011 0.027 0.000 0.011 0.026 0.000[0.010] [0.017] [0.009] [0.010] [0.017] [0.009]
Debt/GDP cp -0.022*** 0.014 -0.049*** -0.021*** 0.013 -0.048***[0.008] [0.013] [0.009] [0.007] [0.012] [0.009]
Infl cp 0.068* 0.046 0.064 0.075* 0.039 0.080[0.038] [0.075] [0.062] [0.037] [0.076] [0.059]
Observations 44,990 44,244 43,848 44,990 44,244 43,848R2 0.04 0.04 0.04 0.04 0.04 0.04Fixed Effects Count/Report Count/Report Count/Report Count/Report Count/Report Count/Report
31

Table 6: Is There a Substitution Between Domestic and Cross-border Flows?This table reports regression results from within counterparty/year-quarter estimation. Allvariables are one quarter lagged. Variable definitions are listed in the Appendix. Standarderrors are clustered at the reporting country level. *** denotes 1% significant level, ** denotes5% significant level, and * denotes 10% significant level.
Cross-Border Flows (CBF) to non-banks(1) (2) (3)
Mprate rep 0.379*** 0.432*** 0.348***[0.100] [0.108] [0.110]
Mprate rep Domestic ind. -0.575*** -0.593**[0.159] [0.215]
QE rep 1.092 1.127 1.458[1.421] [1.428] [1.059]
Bankret rep -0.005 -0.005 -0.005[0.012] [0.012] [0.017]
GDPgr rep 0.394** 0.387** 0.166[0.188] [0.186] [0.270]
Debt/GDP rep -0.004 -0.004 0.006[0.006] [0.006] [0.009]
Infl rep 0.082 0.079 0.137[0.069] [0.071] [0.084]
Observations 77,182 77,182 44,463R2 0.10 0.10 0.11Fixed Effects Count./Year-Quarter Count./Year-Quarter Count./Year-Quarter
32

Table 7: How Does Country Destination Affect Cross-border Flows: EME vs non-EMEsThis table reports regression results from within counterparty/year-quarter estimation. Allvariables are one quarter lagged. Variable definitions are listed in the Appendix. Standarderrors are clustered at the reporting country level. *** denotes 1% significant level, ** denotes5% significant level, and * denotes 10% significant level.
Cross-Border Flows (CBF) to:Banks&Non-Banks Banks Non-Banks
(1) (2) (3)
Mprate rep 0.341*** 0.509*** 0.381***[0.096] [0.144] [0.130]
Mprate rep× EME -0.242** -0.748*** 0.106[0.096] [0.172] [0.196]
GDPgr rep 0.039 0.022 0.015[0.060] [0.107] [0.065]
GDPgr rep× EME 0.102 -0.001 0.181*[0.070] [0.135] [0.091]
CRgr rep 0.064 0.123 0.117[0.074] [0.115] [0.090]
CRgr rep× EME -0.045 0.001 -0.081[0.069] [0.126] [0.076]
Bankret rep -0.014 -0.009 0.009[0.018] [0.024] [0.020]
Bankret rep× EME 0.021 0.017 -0.027[0.025] [0.036] [0.020]
Debt/GDP rep -0.007 -0.006 -0.005[0.007] [0.014] [0.009]
Debt/GDP rep× EME 0.001 -0.018 0.006[0.007] [0.016] [0.008]
Infl rep -0.109 -0.072 0.087[0.111] [0.209] [0.116]
Infl rep× EME 0.200* 0.348 -0.064[0.114] [0.256] [0.112]
QE rep -0.228 -2.560* 0.310[0.772] [1.365] [1.189]
QE rep× EME 1.646** 2.746** 1.501[0.710] [1.211] [1.045]
Observations 73,298 70,877 71,704R2 0.12 0.12 0.11Fixed Effects Count./Year-Quarter Count./Year-Quarter Count./Year-Quarter
33

Table 8: Do Economic Activity and Monetary Policy Affect Cross-border FlowsIndependently?This table reports regression results of within counterparty/year-quarter estimation. All vari-ables are lagged one quarter. Variable definitions are listed in the Appendix. Standard errorsare clustered at the reporting country level. *** denotes 1% significant level, ** denotes 5%significant level, and * denotes 10% significant level.
Cross Border Flows to:Banks&Non-Banks Banks Non-Banks
(1) (2) (3)
Mprate rep 0.345*** 0.466*** 0.369***[0.076] [0.112] [0.117]
GDPgr rep 0.140*** 0.125* 0.070[0.035] [0.066] [0.051]
GDPgr rep× MPrate rep -0.015*** -0.029*** 0.009[0.004] [0.007] [0.006]
CRgr rep 0.042 0.126 0.073[0.058] [0.085] [0.073]
Bankret rep -0.002 0.002 -0.005[0.010] [0.018] [0.014]
Debt/GDP rep -0.004 -0.011 -0.003[0.005] [0.009] [0.006]
Infl rep -0.017 0.075 0.062[0.068] [0.150] [0.081]
QE rep 0.902 -0.579 1.185[0.854] [1.360] [1.426]
Observations 73,298 70,877 71,704R2 0.12 0.12 0.11Fixed Effects Count./Year-Quarter Count./Year-Quarter Count./Year-Quarter
34

Tab
le9:
How
DoesCountryDestination
AffectCro
ss-b
ord
erFlows:
EM
Evsnon-E
MEsbefore
2007Q2
Thistablereports
regression
resultsfrom
within
counterparty/year-quarterestimation.Allvariablesare
onequarter
lagged.Variable
defi
nitionsarelisted
intheAppendix.Standarderrors
areclustered
atthereportingcountrylevel.***denotes1%
significantlevel,
**den
otes
5%sign
ificantlevel,an
d*denotes
10%
sign
ificantlevel.
EM
Ebefore
2007Q2
non-E
ME
before
2007Q2
EM
Eafter2007Q2
non-E
ME
after2007Q2
All
Banks
Non-B
anks
All
Banks
Non-B
anks
All
Banks
Non-B
anks
All
Banks
Non-B
anks
(1)
(2)
(3)
(4)
(5)
(6)
(7)
(8)
(9)
(10)
(11)
(12)
Mprate
rep
-0.069
-0.403*
0.412**
0.276***
0.413**
0.331***
0.527***
0.307
0.651**
0.586***
0.993***
0.642**
[0.157]
[0.211]
[0.160]
[0.092]
[0.152]
[0.113]
[0.153]
[0.325]
[0.303]
[0.149]
[0.241]
[0.234]
QE
rep
1.987*
-2.614
2.676*
-0.054
-4.820*
0.290
1.724
1.560
1.581
-0.231
-1.798
0.082
[0.984]
[3.332]
[1.371]
[1.222]
[2.467]
[2.078]
[1.384]
[2.020]
[2.102]
[0.777]
[1.507]
[1.342]
CRgrrep
-0.022
-0.064
0.032
0.022
0.083
0.137
0.057
0.288*
0.047
0.094
0.132
0.096
[0.087]
[0.148]
[0.132]
[0.098]
[0.176]
[0.114]
[0.078]
[0.145]
[0.080]
[0.113]
[0.158]
[0.100]
Bankretrep
0.015
0.030
0.002
-0.056**
-0.067*
-0.011
0.002
-0.009
-0.033
0.015
0.028
0.020
[0.030]
[0.054]
[0.020]
[0.020]
[0.038]
[0.029]
[0.014]
[0.034]
[0.021]
[0.020]
[0.037]
[0.022]
GDPgrrep
0.090
0.051
0.075
0.046
-0.013
0.030
0.169***
-0.019
0.294***
0.031
0.050
-0.005
[0.055]
[0.132]
[0.087]
[0.077]
[0.161]
[0.091]
[0.048]
[0.107]
[0.085]
[0.073]
[0.155]
[0.074]
Deb
t/GDP
rep
-0.006
-0.017
0.008
-0.004
0.009
0.006
-0.005
-0.021**
-0.006
-0.006
-0.007
-0.011
[0.007]
[0.024]
[0.010]
[0.012]
[0.027]
[0.016]
[0.004]
[0.010]
[0.006]
[0.005]
[0.010]
[0.009]
Inflrep
0.321**
0.406*
0.184
0.022
0.083
0.137
-0.112*
0.121
-0.099
-0.227
-0.230
0.053
[0.115]
[0.234]
[0.144]
[0.098]
[0.176]
[0.114]
[0.056]
[0.239]
[0.109]
[0.153]
[0.243]
[0.196]
Observations
24,146
22,921
23,793
18,704
18,641
18,101
16,715
15,764
16,531
13,733
13,551
13,279
R-squared
0.15
0.15
0.16
0.08
0.09
0.08
0.14
0.13
0.12
0.08
0.07
0.06
Count./Year-Quarter
FE
Yes
Yes
Yes
Yes
Yes
Yes
Yes
Yes
Yes
Yes
Yes
Yes
35

Appendix Shortened Name Full Name Description Source Units Cl_allinst_allsecro CBF to banks and
non-banks Cross-border bank claims on banks and nonbanks. Calculated as the flow of claims in the quarter, adjusted for exchange rate changes, over the previous quarter’s outstanding amount in percent, winsorized at the 2.5 percentile.
Bank of International Settlements
Percent
Cl_allinst_banksro CBF to banks Cross-border bank claims on banks. Calculated as the flow of claims in the quarter, adjusted for exchange rate changes, over the previous quarter’s outstanding amount in percent, winsorized at the 2.5 percentile.
Bank of International Settlements
Percent
Cl_allinst_nbanksro CBF to non-banks Cross-border bank claims on non-banks. Calculated as the flow of claims in the quarter, adjusted for exchange rate changes, over the previous quarter’s outstanding amount in percent, winsorized at the 2.5 percentile.
Bank of International Settlements
Percent
MPrate_rep Monetary policy rate for reporting country
Central bank monetary policy rate for reporting countries in percent.
Central banks, International Monetary Fund, CEIC
Percent
CRgr_rep Growth in credit to domestic private non-financial sector for reporting country
Quarter-over-quarter growth rate of outstanding credit from all sectors to the private non-financial sector for reporting countries in percent.
Bank of International Settlements
Percent
36

Bankret_rep Banking sector returns for reporting country
Quarter-over-quarter growth rate of banking sector stock return index for reporting countries in percent.
Datastream Percent
GDPgr_rep Real GDP growth rate for reporting country
Quarter-over-quarter real/chained GDP growth for reporting countries in percent.
Haver Percent
Debt/GDP_rep Gross debt to GDP for reporting country
Gross debt as a percentage of nominal GDP for reporting countries in percent. Quarterly data interpolated from annual data.
International Monetary Fund, World Economic Outlook, Haver
Percent
Infl_rep Inflation rate for reporting country
Quarter-over-quarter inflation for reporting countries in percent, calculated using consumer price indices.
Haver Percent
QE_rep Quantitative easing indicator for reporting country
Dummy variable indicating quantitative easing policies during the quarter for reporters U.S., U.K., and Japan. The U.S. QE period is 12/31/2008 to 12/31/2014. The U.K. QE period is 3/31/2009 to 12/31/2014. The Japan periods are 3/31/2001 to 3/31/2006 and 6/30/2013 to 12/31/2014.
1/0
Exchangegr_rep Real exchange rate growth for reporting country
Quarter over quarter growth rate of the real exchange rate (interpreted as amount of counterparty’s currency per unit of reporter’s currency) for reporting countries in percent.
New York Fed, Bloomberg
Percent
37

MPrate_cp Monetary policy rate for counterparty country
Central bank monetary policy rate for counterparty countries
Central banks, International Monetary Fund, CEIC
Percent
CRgr_cp Credit to domestic private non-financial sector for counterparty country
Quarter-over-quarter growth rate of outstanding credit from all sectors to the private non-financial sector for counterparty countries in percent.
Bank of International Settlements
Percent
Bankret_cp Banking sector returns for counterparty country
Quarter-over-quarter growth rate of banking sector stock return index for reporting countries in percent.
Datastream Percent
GDPgr_cp Real GDP growth rate for counterparty country
Quarter-over-quarter real/chained GDP growth for counterparty countries in percent.
Haver Percent
Debt/GDP_cp Gross debt to GDP for counterparty country
Gross debt as a percentage of nominal GDP for counterparty countries in percent. Quarterly data interpolated from annual data.
International Monetary Fund, World Economic Outlook, Haver
Percent
Infl_cp Inflation rate for counterparty country
Quarter-over-quarter inflation for counterparty countries in percent, calculated using consumer price indices.
Haver Percent
MPrate_diff Monetary policy rate difference
Difference between the monetary policy rates of reporting and counterparty countries in percent.
Central banks, International Monetary Fund, CEIC
Percent
38