cross-cultural teams: modeling and qualitative …
TRANSCRIPT

CROSS-CULTURAL TEAMS: MODELING AND QUALITATIVE ANALYSIS OF
INFLUENCES ON TEAM PERFORMANCE THROUGH
VIRTUAL EXPERIMENTS
A THESIS SUBMITTED
TO THE DEPARTMENT OF CIVIL ENGINEERING AND THE COMMITTEE ON
GRADUATE STUDIES
OF STANFORD UNIVERSITY
IN PARTIAL FULFILLMENT OF THE REQUIREMENTS
FOR THE DEGREE OF ENGINEER
Tamaki Horii
August 2003
1

© Copyright 2003
by
Tamaki Horii
All Rights Reserved
2

Approved for the department:
Adviser: Raymond E. Levitt Professor of Civil & Environmental Engineering
Co-Adviser: Yan Jin Visiting Associate Professor of Civil & Environmental Engineering
Approved for the University Committee
on Graduate Studies:
3

Abstract
The recent business trend of globalization in the construction industry has confronted project
managers with difficulties in managing cross-cultural teams. Managers need guidelines and tools
to understand and predict cultural influences in order to better manage their teams. This thesis
aims to model cultural factors emerging in cross-cultural teams between Japanese and American
firms by using the VDT model (Levitt et al, 1994: Jin and Levitt 1996). Although cultural factors
were not initially considered in the model, the VDT model has the potential to capture cultural
phenomena in projects, using its rich behavior parameters.
In order to model cultural factors, this thesis focuses on characterizing cultural differences
along two aspects: practice and value differences (Hofstede, 1991). Practice differences, which
are related to the organization structure, refer to each nation's preferred management style, such as
its level of centralization of control, its level of formalization for communication, and its structural
configuration. Value differences, which are related to the micro-level behavior of individuals,
refer to workers' decision making and coordination behavior. Thus, each nation will have its own
patterns of organizational structure and behavior. In addition to these two aspects, task
complexity, as suggested by contingency theory (Galbraith, 1974, 1977; Thompson, 1967), is
considered in the model. Four different levels of task complexity are examined: pooled,
sequential, reciprocal, and intensive workflows.
Based on the cultural model described above, an analysis of the cultural impact on
relationships among task complexity, organization structure system, and team cultural behavior
patterns was carried out.
For the task complexity-organization system relationship, the simulated results showed that
4

the American organization structure has less tolerance for low team experience, in comparison to
the Japanese structure. In the case of high team experience, the two structures had no significant
differences in performance.
As for the organization system-cultural behavior relationship, both Japanese and American
teams show better performance when each works with their own preferred organization structure, in
the cases of medium and high task complexities. These tendencies are consistent with the
Hofstede’s proposition of “the preferred coordination mechanism” (Hofstede, 1991), with limited
task complexity.
For the cultural behavior pattern-task complexity relationship, each of the two behavior
patterns shows less hidden work for certain project types. Additionally, changes in cultural behavior
patterns appear to have less impact than changes in the organization structures.
The existing parameters of the VDT model limited what could be modeled. The simulated
results, nonetheless, captured the qualitative tendencies of cultural impacts that are consistent, to a
certain degree, with literature and observations. Further validation is needed to calibrate the model
for quantitative analysis. Additionally, effects of learning between different cultural groups will be
an important question to address in future research.
5

Acknowledgement
As with any project of this magnitude, I owe a debt of gratitude to many people for their help
along the way. In particular, without the friendship and intellectual supports of my advisors,
Professor Raymond E. Levitt and Professor Yan Jin, this thesis may never have reached completion.
Their enthusiasm, patience, and keen insights have made my research an interesting and enjoyable
experience at Stanford.
I would like to express my gratitude to those members of Stanford faculty who have helped me
with my research. Professor Stephen R. Barley, John Kunz, Russell Clough, and Dr. Phil Herbert,
have provided new and useful insights to my thesis.
I also would like to express my appreciation to the interviewees who provided precious data as
well as comments. I am indebted for their numerous contributions.
Many thanks also go to CRGP (Collaboratory for Research on Global Projects) group
members: Ashwin Mahalingam, Ryan Orr, Johanna Nummelin, and Tapio Koivu. Without these
friends, my life here would have been dull indeed.
My appreciation extends to Obayashi Corporation and its staff for providing financial support.
Their giving me the opportunity to attend Stanford as a graduate student is gratefully acknowledged.
Finally, my deepest gratitude and appreciation is extended to my family, Yoshiko and Tatsuki,
for their faith and patience.
6

Contents
A b s t r a c t 4
Acknowledgments 6
1. Introduction 13
2. Points of Departure 16
2.1 What i s Cul ture? 16
2.2 Practice Differences 18
2.3 Value Differences 19
3. Objectives and Approach 23
3.1 Object ives 23
3.2 Approach 23
3.3 Steps 24
4. Observations 26
4.1 Case Study 26
4.2 Interview Method 28
4.3 Observat ion 30
5. Modeling 43
5.1 Framework 45
5.2 Model ing 54
5.3 Scenar ios 55
6. Experiment 59
6.1 Hidden Work Volume 59
7

6.2 Components of Hidden Work 64
6.3 Project Quali ty Risk 69
7. Discussion 72
8. Conclusion 76
Appendix A: JP Behavior Pattern 80
Appendix B: AM Behavior Pattern 82
Appendix C: Workflows in the VDT model 84
References 86
8

List of Tables
Chapter 2 2.1 Raw Score of each Dimension 21
Chapter 4
4.1 Description of Case Studies 27
4.2 Summary of interviews – Case Study 1: SC project 37
4.3 Summary of interviews - Case Study 2: C Bridge project 39
4.4 Summary of interviews - Case Study 3: G Bridge project 41
4.5 Summary of interviews - Case Study 4: SF tunnel project 41
Chapter 5 5.1 Setting of Project Intensity 48
5.2 Team Experience 49
5.3 Leadership Styles as Organization Structure 50
5.4 Sets of Micro-level behavior 51
5.5 Sets of Communication Behavior Parameters 52
5.6 Rework and Communication Ratio 55
5.7 Scenarios for Computational Experiments 56
Chapter 6
9
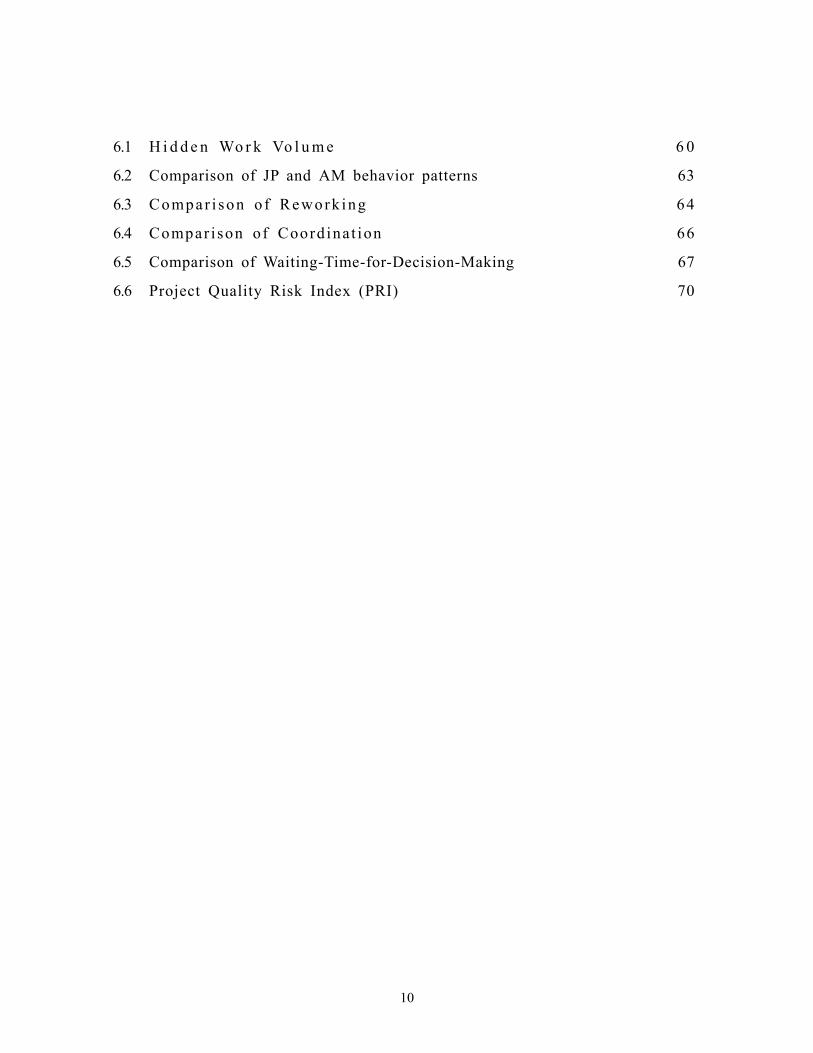
6.1 H i d d e n Wo r k Vo l u m e 6 0
6.2 Comparison of JP and AM behavior patterns 63
6.3 Compar i son o f Rework ing 64
6.4 Compar ison of Coordinat ion 66
6.5 Comparison of Waiting-Time-for-Decision-Making 67
6.6 Project Quality Risk Index (PRI) 70
10

List of Figures
Chapter 2 2.1 Cultural Differences 18
Chapter 4 4.1 A J o i n t Ve n t u r e Te a m 2 6
Chapter 5 5.1 Components of the VDT model and Cultural Factors 44
5.2 Research Framework 45
5.3 A Pooled Workflow Structure 46
5.4 A Sequential Workflow Structure 46
5.5 A Reciprocal Workflow Structure 46
5.6 An Intensive Workflow Structure 47
5.7 Summary of Workflows 47
5.8 Modeling framework 53
5.9 Examples of Modeling 54
5.10 Combinat ions 56
Chapter 6 6.1 Hidden Work Volume in the case of JP structure 61
11

6.2 Hidden Work Volume in the case of AM structure 61
6.3 Comparison of JP and AM structures 62
6.4 Comparison of Behavior Patterns (=JP/AM performance) 63
6.5 Comparison of Behavior Patterns in Reworking 65
6.6 Comparison of Behavior Patterns in Coordination 66
6.7 Comparison of Behavior Patterns in Waiting-Time-for-Decision-Making 68
6.8 Proportion of three components of Work 69
6.9 Comparison of Behavior Patterns in PRI-Japanese Structure 71
6.10 Comparison of Behavior Patterns in PRI-American Structure 71
Chapter 7 7.1 Preferred Coordination Mechanism (Hofstede) 72
7.2 Three columns of the model 74
12

Chapter 1
Introduction The recent business trend toward globalization in the construction industry leads inevitably to
increased cultural diversity within construction companies. Managers in global construction
companies have been confronted with the difficulty of coordinating cross-cultural teams. In
particular, misunderstandings and conflicts arise among team participants due to pre-existing
differences in cultural values and practices. Our research group has observed cases where
misunderstandings within a team end with litigation. From an organizational point of view, the
leadership style, management style, and decision policies of a project team have always been
influenced by cultural values and norms. A manager who fails to organize a cross-cultural team
can potentially have a large negative impact on team performance. How can a manager minimize
cultural conflicts and lead a team to be successful? How should a manager organize and control a
cross-cultural team?
Computational models exist that can answer these questions to some degree. One such
analysis tool for managerial decision making is the Virtual Design Team (VDT) (Jin and Levitt,
1996). The VDT model, which is based on Galbraith’s information processing approach
(Galbraith, 1974, 1977), simulates project organizations performing direct work associated with
assigned tasks, along with supervision to handle exceptions that arise, coordination to resolve
interdependencies between tasks, and waiting time (Levitt et al, 1994; Levitt et al, 1999). VDT
has been used to analyze fast-track projects and to predict team performance. It has also been
used in prospective intervention (Kunz et al, 1998).
Previous VDT research efforts have not considered cultural factors. However, the rich
behavior parameters in the VDT model enable a user to capture cultural phenomena in projects.
This research attempts to provide a framework to predict, through simulation experiments, the
13

impact on organizational performance of assembling cross-cultural teams. This work has been
undertaken as part of the Collaboratory for Research on Global Projects (CRGP)1, which has been
formed to understand the institutional costs and benefits that can arise in global projects.
This research focuses on cultural differences emerging at the project and team level, as a first
step in modeling cultural factors. This thesis deals with joint venture cases between Japanese and
American firms of middle (and large) sized construction projects.
This research begins by defining the characteristics of a bi-cultural team, using first-hand
observations and extant literature. Hofstede (Hofstede, 1991) proposed that cultural factors have
two aspects: practices and values. Practices are composed of symbols, heroes, and rituals. This
thesis extends the meaning of “practices” to include preferences among differing cultures for
different project management styles and organization structures. Similarly, this thesis extends
“value differences” to refer to those values which guide how people make decisions and coordinate.
Practice differences at the project team level are composed of three elements: centralization,
formalization, and organizational structure. Differences in each element vary among differing
countries. For instance, Japanese project teams tend to have multiple levels of hierarchy and to be
highly centralized, while American firms prefer using flatter organization structures and medium
centralization levels. Thus, Japanese and American firms have different organization structures
and decision making policies.
Value differences are related to national culture, as described by Hofstede (Hofstede, 1991)2
and others (Trompenaar, 2004) 3. Their work provides a useful set of dimensions against which
value differences can be measured. On the project level, when participants make decisions or
coordinate with each other, they behave based on their values, called “micro-level behavior” (Jin
and Levitt, 1996). Key elements of micro-level behavior include the decision-making and 1 CRGP is a research group headed by Professor Raymond E. Levitt (Stanford University) and supported by the National Science Foundation and industrial affiliates. For more information about the group, please see http://crgp.stanford.edu 2 Hofstede (Hofstede, 1991) proposed four dimensions to describe cultural differences among 53 countries including Japan and the United States: 1. Power distance, 2. Individualism vs. Collectivism, 3. Masculinity vs. Femininity, and 4. Uncertainty avoidance. 3 Trompenaar has proposed three other dimensions: 1. Universalism vs. Particularism; 2. Specific vs. Diffuse; and 3. Neutral vs. Affective.
14

coordination policies, which can be interpreted along existing cultural dimensions. Both
Japanese and American have their own, differing, patterns of micro-level behavior.
In building a model that predicts project performance, I also consider one aspect of
contingency theory (Galbraith, 1977; Thompson, 1967): task complexity.. This thesis examined
four different levels of task interdependencies: pooled, sequential, reciprocal, and intensive
workflows. I represent these dependencies as a range of task complexity, from low to high,
respectively.
Having built a model, the second step is to conduct a qualitative analysis of the impact of
cultural differences on project performance. Simulated results are measured against Hofstede’s
proposition of “the preferred coordination mechanism.” His proposition implies that members
of a given cultural group will show better performance when working within their preferred
organization structure.
The remainder of this document develops the framework and explores a model of a
cross-cultural team, in order to explicate the impact of cross-cultural teams on project performance.
First, I characterize some cultural differences in construction projects through interviews and
literature review. I do so using Hofstede’s perspective, examining practice and value
differences. Second, I develop a model to capture the cultural impact of cross-cultural projects.
In the model, I consider three main elements: (1) the task complexity (based on contingency
theory); (2) the organization structure (its practices); and (3) the micro-level behavior (its values).
Third, I manipulate certain parameters of the model to represent both Japanese and American
patterns of micro-level behavior and organization structure. I am thus able to conduct virtual
experiments of different scenarios. Fourth, I conduct a qualitative analysis of the simulated
results, examining three relationships among task complexity, organization structure, and
micro-level behavior. I use Hofstede’s proposition relating to “preferred coordination mechanisms
for different cultures” to validate the simulated results. Finally, I discuss the results of the various
simulation experiments, and review the general implications of our study.
15
Chapter 2
Points of Departure The first step of this research into cultural differences is to define “culture” with the goal of
capturing phenomena based on cultural differences that emerge in global projects.
What is Culture? Hofstede asserts that “culture” has been developed from a set of shared experiences (Hofstede,
1991). Most nations have their own unique culture as a result of sharing a common history and a
series of common struggles and successes. Within nations, different economic classes and
different generations have unique shared experiences that lead to the formation of a common
sub-culture. As a result, “shared experiences” are the basic building blocks of “culture.” These
shared experiences lead to the development of a shared set of values and practices. Additionally,
different shared sets of values and practices exist, depending on the subject focused upon, since
each group has their own unique set of shared experiences. There is a large literature that
describes different cultural subjects: national culture, founder culture, professional culture, and
organizational (institutional) culture.
National culture describes a set of values and practices that are deeply embedded in a person’s
mind. Hofstede’s research on national cultures, which proposed a classification along four
dimensions, best describes this component (Hofstede 1991). Since national culture influences each
individual member of a group or organization, observation at the national level provides a convenient
starting point. Most project teams from a given country are composed of people from all over the
country, rather than one city or region.
16

Founders’ culture refers to the values that the founders of an organization set while starting an
organization, or to the values that team leaders bring to project teams (Hofstede 1991). These play a
big role in defining the culture of an organization. Founders define initial rules and goals for the
organization, and establish guidelines for behavior. These guidelines tend to be similar to the
founders’ ideals and past experiences. Founders also tend to hire people who appropriately fit the
organizational culture, thus helping propagate their own values. However, research by Schein and
others (Schein 1992)) suggest that these values get diffused over time and become blended into the
experiences and values of employees hired at a later stage. Note that part of the values of the
founders comes from the societal cultures that they grew up in, so founder culture may be correlated
with national culture.
Professional culture refers to the idea that different professional fields, such as engineering,
sales, marketing, and manufacturing, have their own unique cultures (Hofstede, 1991). For instance,
most engineers are analytical and focused on quality of the product, while sales people tend to be less
analytical, focusing more on cost and time to market (Hofstede, 1991). The organization’s culture
and work behavior varies depending on the organization’s product or service, and the professional
background of the employee base. Professional culture is commonly learned at educational
institutions and through working experience.
Organizational culture can be defined as a set of norms, beliefs and values that are, 1, shared
by members of the organization, and 2, lead to observable behavioral differences in the workplace
(Hofstede, 1991). Organizational culture is distinguished from national culture in that the latter
distinguish similar people, institutions and organizations among different countries, while the former
distinguish different organizations within the same country or countries.
Which cultural delineation(s) do we need to consider in terms of capturing the cultural
differences on the construction projects? It is fair to say that every cultural delineation is involved
and affects a group in different way, such as through the management system or through individual
preferences. To determine which cultural delineations causes each difference, however, is
relatively difficult.
Hofstede describes cultural influences using an “Onion Diagram” of symbols, heroes, rituals,
17

and values (Hofstede, 1991). Hofstede’s research suggests two different key roles are played at
different cultural levels of the diagram. He shows that organizational cultures differ mainly at the
levels of symbols, heroes and rituals, together labeled as “practices”. National cultures differ mostly
at the deeper level, the level of “values”. He also suggests that at the individual level, cultural
differences reside mostly in values, less in practices. At the organization level, cultural differences
reside mostly in practices and less in values. At the project level, the primary subject of this thesis,
cultural differences reside in some middle ground between the two levels (figure 2.1). Therefore,
two elements—practices and value differences—are involved equally at the project level. This
thesis, therefore, views cultural differences from these two points of view.
Organizational Culture Practice
Differences
Project Level Professional Culture
Organizational Level (Molecules)
Individual Level (Atom)
Figure 2.1: Cultural diffe
2.2 Practice Diff Aoki (Aoki, 1992
toward one end of a prot
individual organizational
cluster near the other end
that practice differences c
experiences, values, and
Founder’s Culture
Di
National CultureThe cultubalance (
rences
erences ) suggests that typical Japanese bu
otypical spectrum of values and pra
environment. Their typical Ame
of this spectrum, also independently
an be defined as a way to organize a
beliefs. In other words, these nor
18
Value fferencess
ral differences in the values-practicesHofstede 1991, p.182)
siness organizations tend to cluster
ctices, relatively independent of the
rican business counterparts tend to
of their environment. This implies
nd manage a group based on shared
ms, beliefs, and values lead to the

development of “acceptable practices” within a culture and an organization.
What kinds of practices do we need to consider for a project organization? In construction
projects, a project manager (PM) is assigned as a leader to organize and manage the project. When
a team is assembled, a PM can decide on the centralization level, the configuration of the team
structure, and the formalization level.
The centralization level describes about how much power the PM delegates to subordinates.
The less a PM delegates the power to subordinates, the more centralized the team will be.
Centralization reflects whether decisions are made by a senior project manager or decentralized to
team members or a sub team leader. High project centralization means that almost all decisions are
made by a project manager. With low centralization, a sub team leader or team members tend to
make their own decisions.
Mintzberg proposed that there are five typical configurations of team structure: the simple
structure, the machine bureaucracy, the professional bureaucracy, the divisionalized form, and the
adhocracy (Mintzberg, 1980). Hofstede links Mintzberg’s typology of organizations to cultural
factors along two dimensions: power distance and uncertainty avoidance. These dimensions are
further explained in a later chapter..
Formalization is a measure of how formal communications are in an organization. High
formalization refers to a tendency for communication to occur using formal meetings. With low
formalization, it is more common for communication to occur informally between team members.
2.3 Value Differences Hofstede’s (Hofstede, 1991) research indicates that values, norms and beliefs, collectively
labeled “values”, can be represented by following four dimensions: power distance, individualism,
masculinity, and uncertainty avoidance. Understanding the nature of these dimensions can help us
to predict how individual team members tend to behave and make decisions.
4 These dimensions are explained in the following chapter.
19

(1) Power distance (PDI): Power distance is the extent to which the less powerful
members of organizations and institutions accept and expect that power is distributed unequally.
This inequality defined from lower in the power hierarchy (those with less power). It suggests that a
society’s level of inequality is endorsed by the followers as much as by the leaders. Power and
inequality, of course, are fundamental aspects of any society, and anyone with international
experience is aware that “all societies are unequal, but some are more unequal than others.”
(Hofstede, 1991)
(2) Individualism vs. Collectivism (IDV): Individualism refers to the degree to which
individuals are integrated into groups. On the individualist side, Hofstede found societies in which
the ties between individuals are loose: everyone is expected to look after him or herself and his or her
immediate family. On the collectivist side, he found societies in which people from birth onwards
are integrated into strong, cohesive in-groups, often extended families which offer protection in
exchange for unquestioning loyalty. The word “collectivism” in this sense has no political
meaning: it refers to the group, not to the state. Again, the issue addressed by this dimension is a
fundamental one, expressed in all the societies of the world.
(3) Masculinity vs. Femininity (MAS): Masculinity versus its opposite, femininity, refers
to the distribution of roles between the genders. The IBM studies conducted by Hofstede (1991)
revealed that a. women’s values differ less among societies than men’s values, andb. men’s values
amongst different countries vary along a dimension, from assertive, competitive, and maximally
different from women’s values on one extreme, to modest, caring, and similar to women’s values on
the other. The assertive pole has been called ‘masculine’ and the modest, caring pole ‘feminine’.
The women in feminine countries have the same modest, caring values as the men; in the masculine
countries they are somewhat assertive and competitive, but not as much as the men, so that
masculine countries show a large gap between men’s values and women’s values.
(4) Uncertainty Avoidance (UAI): Uncertainty avoidance deals with a society’s tolerance
for uncertainty and ambiguity; it ultimately refers to man’s search for Truth. It indicates to what
extent a culture programs its members to feel either uncomfortable or comfortable in unstructured
situations. Unstructured situations are novel, unknown, surprising, and different from the usual.
20
Uncertainty-avoiding cultures try to minimize the possibility of such situations by using strict laws
and rules, safety and security measures. On the philosophical and religious level they believe in
absolute Truth: “There can only be one Truth and we have it.” (Hofstede, 1991) People in
uncertainty avoiding countries are also more emotional, and motivated by inner nervous energy.
The opposite type, uncertainty-accepting cultures, is more tolerant of different opinions. They try to
have as few rules as possible, and on the philosophical and religious level they are relativist. People
within these cultures are more phlegmatic and contemplative, and not expected by their environment
to express emotions.
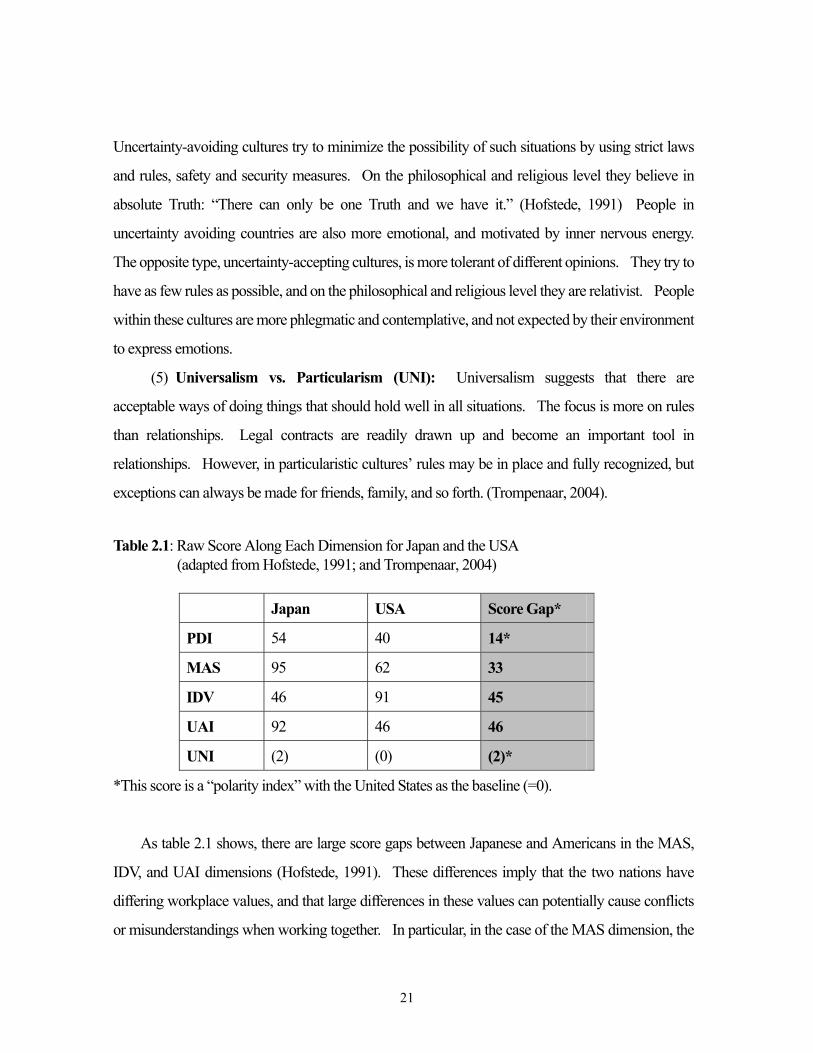
(5) Universalism vs. Particularism (UNI): Universalism suggests that there are
acceptable ways of doing things that should hold well in all situations. The focus is more on rules
than relationships. Legal contracts are readily drawn up and become an important tool in
relationships. However, in particularistic cultures’ rules may be in place and fully recognized, but
exceptions can always be made for friends, family, and so forth. (Trompenaar, 2004).
Table 2.1: Raw Score Along Each Dimension for Japan and the USA (adapted from Hofstede, 1991; and Trompenaar, 2004)
Japan USA Score Gap*
PDI 54 40 14*
MAS 95 62 33
IDV 46 91 45
UAI 92 46 46
UNI (2) (0) (2)*
*This score is a “polarity index” with the United States as the baseline (=0).
As table 2.1 shows, there are large score gaps between Japanese and Americans in the MAS,
IDV, and UAI dimensions (Hofstede, 1991). These differences imply that the two nations have
differing workplace values, and that large differences in these values can potentially cause conflicts
or misunderstandings when working together. In particular, in the case of the MAS dimension, the
21

two countries tend to handle conflicts in different ways (Hofstede, 1991, p92). For instance, in high
masculinity countries, organizations are most likely to solve problems using a “let the best man win”
approach, rather than through compromise and negotiation. These different ways of handling
conflict may cause misunderstandings or errors in judgment that stem from differences in cultural
values. Thus, the larger the gap between the two countries, the more easily misunderstandings
occur.
However, since Hofstede and Trompenaars’ studies are based mainly on IBM case studies,
whether their dimensions apply to the construction industry is unproven. A few recent publications
(Abeysekera, 2002; Lee and Wang, 1994; Pheng and Leong, 2000) highlighted conflicts,
confrontations, misunderstandings, and doing wrong when working with other cultures in the
construction industry. Abeysekera (2002) provided a framework for detecting potential problems
by managing cultural diversity, which consisted of two key concepts: categories and components.
However, the impact of culture on international construction projects has not been considered in
current research efforts. Therefore, the following research questions related to culture are
considered in this thesis:
- Problem observation: What kinds of conflicts are most likely to happen because of cultural
differences in practices and values?
- Output observation: How much impact do cultural differences have on performance metrics
such as cost, schedule, and quality?
- Link to established theory: How can the Hofstede / Trompenaars’ dimensions explain the
observed problems?
22

Chapter 3
Objectives and Approach The objectives of this thesis are to model cultural factors emerging from joint ventures
between Japanese and American firms, and to conduct a quantitative analysis of the impact of
culture on team performance.
3.1 Objectives The following sub-objectives guide this research toward its overall goal:
- Define cultural differences based on case studies and survey of the literature
- Develop a model to capture cultural differences observed in the case studies
- Compare simulated results to existing theory or propositions for validation purposes
- Discuss the implications of simulated results
3.2 Approach Two areas of research provide the basis for this dissertation: culture and organization
science.
Research on culture provides the motivation and is the point of departure for this thesis.
Case study observations show that cultural differences caused many misunderstandings and
conflicts, even though the differences were subtle and often involved insignificant matters. What
is culture? What are cultural differences? Defining “culture” is the first step of this research.
Several disciplines describe ‘culture’ from different points of view: anthropology,
23

ethnography, and sociology. Additionally, political science, economics, law, and organization
science provide their own views of “culture.” For an engineering thesis considering the project
level, it is appropriate to focus on national culture and organization science.
Organization science can predict team performance. Cultural factors of project teams are
captured based on organization theory. For predicting team performance at the project level, a
computational model such as the VDT (Levitt et al, 1999) model provides a useful laboratory for
experimentation. The VDT model is based on organization theories such as the information
processing view of contingency theory (Galbraith 1974, 1977). This thesis is an extension of
contingency theory: a micro-contingency theory of culture.
3.3 Steps This research uses the following four steps to develop a framework and explore a model of a
cross-cultural team.
(1) The first step is to characterize cultural differences emerging in cross-cultural teams
between Japanese and American firms through case studies and a literature survey. Two points of
view proposed by Hofstede (Hofstede 1991, p.182), practice and value differences, provide the
appropriate framework to capture cultural differences which the two different cultural groups bring
to a project.
(2) I then develop a framework to capture the impact of cross-cultural projects by
considering three elements: (1) task complexity, (2) organization structure (practice differences),
and (3) micro-level behavior (value differences). Four different workflows are considered for
representing different task complexities: pooled, sequential, reciprocal, and intensive workflows.
I identify two configurations of the project organization structure that are linked to the practice
differences, and represent each culture. I also identify two patterns of micro-level behavior that
are linked to the value differences and represent each culture.
(3) I manipulate parameters in the VDT model to represent both Japanese and American
24

patterns of micro-level behavior and organization structure, and then conduct simulation
experiments on these different scenarios.
(4) I qualitatively analyze the simulated results using the predictions of Hofstede’s
proposition, “the preferred coordination mechanism”, as validation.
Finally, I discuss the results of the varied simulation experiments, review the general
implications of our study, and discuss further research issues.
25

Chapter 4
Observation This research focuses on two cultures, Japanese and American, because there are relatively
large differences and gaps between the two based on Hofstede’s research (Hofstede, 1991).
These two cultures are also feasible as primary research subjects because of the availability of data
and observations.
4.1 Case Study A joint venture (JV) team is the appropriate unit size to observe cultural differences between
Japanese (JP) and American (AM) organizations. The two subteams are most likely to possess their
own practices and values which have accumulated through shared experiences in an institution.
The larger the cultural gaps between the two parties, the more conflict and misunderstanding will
occur in the joint venture.
JP Culture AM Culture
Organization B Team 2 Organization A Team 1
Joint Venture Team
Figure 4.1: A Joint Venture Team
26

As figure 4.1 shows, this thesis assumes that subteams possess the same cultural practices and
values as their institutional parents. Furthermore, it assumes that these cultural values represent
their respective national cultures. Hofstede (Hofstede, 1991, p.182) mentioned that there are few
differences in values between the national and organizational levels.
As table 4.1 shows, this thesis conducted six interviews on four different construction
projects using the ethnographic interview approach5.
Table 4.1: Description of Case Studies
Case study 1 Semiconductor facility project (SC)
Interviewees - M. M, Project Engineer, Japanese (JP) firm
- D. B, Senior Vice President, American (AM) firm
Project summary Fast-track project (19.5 months)
Design / Build contract
Relationship - Phase 1&2: Conducted by ABC partnership: AAA.
American firm (Architect), BBB. American General
Contractor (Construction), and CCC. Japanese General
Contractor (Structure / MEP Design).
- Phase 3: Conducted by CCC. Japanese General Contractor
with Design/Build contract.
Case Study 2 C Bridge Project (C)
Interviewees - M. Y, Manager, Japanese (JP) firm
- C. W, Project Manager, American (AM) firm
Project summary Three span suspension bridge,
3,456 feet long, 400 feet high
Budget $189 Million
5 Please see section 4.2. Interview method
27

Relationship - JP fabricator provides the steel deck without erection
- Total about $20 million
- Box type steel deck
- First project in USA
Case Study 3 G Bridge Project (G)
Interviewees - I, Project Manager, Japanese (JP) firm
Project summary Seismic renovation project
Budget $122 Million
Relationship - Joint venture project between JP and AM firms
- 60% share for the AM firm and 40% for the JP firm
Case Study 4 SF Tunnel Project (SF)
Interviewees - C, Project Engineer, American (AM) firm
Project summary Total 4 km tunnel
Budget About $100 Million
Relationship - Partnership between JP and AM firms
- JP firm is prime entity contracting with the customer
4.2 Interview Method This thesis uses the “ethnographic interview approach” proposed by Spradley (1979) for
data collection. The ethnographic approach is designed for understanding human culture. The
ethnographic interview uses a method of active listening, rather than providing a testable hypothesis.
The advantage is that interviewees are not influenced, through the interview questions, by the
researcher’s hypotheses or propositions. Taking a passive rather than assertive role allows the
interviewer to observe the unfamiliar cultural scenes and subtle signals expressed by the
interviewee. Thus, the ethnographic interview approach can be much more effective than the
28

questionnaire approach in terms of observing subtle information from interviewees.
Appropriate interviews were conducted under the following conditions:
(1) Interviewees (Informants): Team members who are currently involved in the cultural
scene would be the most appropriate informants, because it is easy for them to recall their
experiences. In terms of availability, team members who were recently involved are acceptable.
Only one person is interviewed at a time to avoid contamination by other’s opinions. Two
interviewees are selected from each project for comparative purposes. For instance, I conducted
separate interviews with one Japanese and one American on the same project, and then compared
their two different opinions about the same problem.
(2) Duration: I conducted two or three one-hour interviews with each interviewee. This
duration provided the necessary time to listen to detailed stories, and was the maximum duration
feasible for busy business interviewees.
(3) Location: Most interviews were conducted in the interviewee’s private office. Thus,
no one else could listen in. This environment enabled interviewees to feel comfortable and
relaxed while speaking. (Some interviewees do not care at all, but some do. This is a part of their
cultural differences.) Noisy places were avoided.
(4) Interviewers (Ethnographer): Two interviewers were used to facilitate peer review,
sharing of memories, and clarification of language issues. Since the ethnographic interview
approach is very sensitive to the language and nonverbal signals used by interviewees, interviewers
needed to pick up these up precisely and appropriately. By using two interviewers, one could
speak Japanese as their native language, while the other spoke English as their first language,
enabling the interview team to understand conversation, and also to grasp subtle nonverbal signals
which are deeply related to the culture.
(5) Interview structure: Spradley (1979, p.59) suggested three key elements for the
ethnographic interview: the explicit purpose, ethnographic explanations, and ethnographic
questions. The explicit purpose leads to the discovery of the cultural knowledge of the informants
(interviewees). The interviewers (ethnographers) offered explanations repeatedly to the
informants in terms of learning and understanding the informant’s culture. Ethnographic questions
29
consisted of three types; descriptive, structural, and contrast questions. By combining the three
types of questions, the interviewers were able to elicit variable and useful information from the
informants. The typical sequence of interviews began with descriptive questions, and then moved
on to structural questions, and finally to contrast questions.
(6) Privacy: The collected data is confidential and interviewee names are not disclosed.
4.3 Observation The ethnographic interview approach requires the collection and recording of the
conversation during the interviews. These records included rich cultural information, where it
was difficult to discern causes among different factors. The approach employed here is to explain
phenomena by using existing dimensions and theories such as those of Hofstede and Trompenaar.
The departure point for this research, described in the previous chapter, is that cross-cultural
teams bring two types of differences into a project: (1) practices and (2) values differences.
Observed interview data were broken into the two categories and the cultural elements that are key
to team performance in construction projects were determined. Cultural dimensions were used to
explain cultural phenomena, as subcategories of value differences.
4.3.1 Practices: (1) Centralization level: There was no direct expression in the interviews regarding the
degree of centralization each nation was most likely to have. However, several key signals were
detected from interviews. For instance, JP engineers make sure of the boss’s opinion before judging
decisions (SF tunnel project, Table 4.5-4). Also, JP engineers complained that the AM project
manager did not appropriately give orders to subordinates. In other words, JP engineers expected
orders, or to be centralized (Semiconductor project, Table 4.3:12). On the other hand, the AM
engineer felt that “Japanese engineers are not brave enough to judge by themselves” (SF tunnel
project, Table 4.5:4,6). Based on the Hofstede dimension power distance index (PDI), larger power
distance countries are most likely to have centralized organization, while small power distance
30

countries have decentralized systems (Hofstede,1991, p.37). Thus, Japanese firms prefer to have a
centralized structure, while American firms prefer a decentralized structure.
(2) Configurations: The Semiconductor and SF tunnel projects, for which the dominant
firm was Japanese, set a pyramid type organizational configuration. On the other hand, GC and C
Bridge projects, for which the dominant firm was American, set up a flat and ad hoc configuration.
Hofstede states that “people from a particular national background will prefer a particular
configuration, because it fits their implicit model, and that otherwise similar organizations in
different countries will resemble different Mintzberg configuration types, because of different
cultural preferences.” (Hofstede, 1991, p.151) Thus, according to the Hofstede classification,
Japanese organizations are categorized as the full bureaucracy type with a pyramid model, while
American organizations prefer to have the divisionalized form. At the project level, since team
members are few in number and limited, in comparison with the firm level, the divisionalized form
is much close to the flat configuration6. Thus, Japanese firms are most likely to set the pyramid
type as the organizational configuration, while American firms are more likely to have the flat
organizational configuration.
(3) Formalization: When two different cultures are involved, meetings tend to be
formalized in order to avoid misunderstandings (C Bridge, Table 4.4:7). For instance, when both
parties realized that they had different approaches to managing the team, meetings, and negotiations,
they tended to set up rules to which both parties agreed. Since the construction project was a
discrete event and team members are assembled on a project basis, these phenomena emphasize the
formalization factor. However, when a project team accumulates experience working together, the
formalization level is eased (G Bridge project). Thus, the formalization level is related to team
experience
Hofstede’s work (Hofstede,1991, p.152) can be used to predict the degree of formalization that
would exist between Japanese and American firms. Based on the PDI – UAI dimensions, high PDI
6 Hofstede (1991) and Minzberg (1980) focus on the firm and institutional level in which larger numbers of people are involved in comparison with project size.
31

and high UAI countries (full bureaucracy types), tend to standardize the work process rather than
using mutual adjustment. This means that high PDI and high UAI countries are most likely to have
a highly formalized coordination system, while low PDI and low UAI countries prefer to standardize
outputs. Thus, each nation has a preference for the formalization level based on their PDI and UAI
dimensions.
4.3.2 Values: (1) Power Distance Index (PDI): The JP firm took the project manager’s (PM) “off hand”
comments more seriously than the PM intended (C Bridge project, Table 4.3:9). Japanese members
believed that comments or orders given by people high in the hierarchy obliged them to act, even
though the American PM thought that it was just informal conversation. This anecdote can be
explained by the power distance dimension, which describes the relationship between boss and
subordinates. Hofstede states that “less powerful people should be dependent on the more powerful
people in the large power distance countries, while the small power distance countries prefer to have
interdependent relations between less and more powerful people” (Hofstede,1991, p.37). Thus, the
beliefs of the Japanese subordinates are similar to people from high power distance countries.
In the SF tunnel project, a Japanese engineer would make sure of the boss’s opinion before
making his or her decision (SF Tunnel Project, Table 4.5:6). Hofstede also categorized decision
making policy using the power distance index. “[S]ubordinates in the large power distance
countries expect to be told what to do,” and “the ideal boss is a benevolent autocrat or good father in
the large power distance countries.” On the other hand, in the case of small power distance countries,
“subordinates expect be consulted,” and “the ideal boss is a resourceful democrat.” (Hofstede,1991,
p.37)
(2) Masculinity Index (MAS): Differences in the MAS in the construction industry were
not observed through the interviews. There are two possible explanations. First, the typical
professional culture in the construction industry has been high in masculinity. Second, MAS is not a
significant factor on construction projects. Which answer is more appropriate cannot be identified
32

in this research. However, it is possible to say that the cultural differences along the MAS
dimension are not a significant factor in construction projects.
(3) Individualism Index (IDV): In all the case studies, the interviewees mentioned that
Japanese people tend to seek consensus among participants or within groups. This tendency is one
source of conflict between Japanese and American groups. Specifically, decision-making took
much longer, since Japanese people tended to canvas the opinions of all team members. The
American engineers felt that the Japanese decision making strategy wasted time in getting to a final
decision. The individualism index proposed by Hofstede (Hofstede,1991, p.49-78) can explain
why Japanese people tend to seek consensus among team members. In collectivist countries, which
embody the opposite concept to individualism, “harmony should always be maintained and direct
confrontations avoided.” Based on these observations, “harmony” is one of the key points in
describing Japanese workplace culture, and can be seen at many different stages, including meetings
and contracts.
In meetings, Japanese people tend to avoid direct confrontation, especially with the boss or the
owner (C bridge project, Table 4.3:8). In the case of the C Bridge project, since the American
consultant represented the owner, the Japanese steel fabricator avoided arguing during the meeting.
Since American meetings tend to be discussions, silence is taken as agreement. The comments of
the American project manager, who attended every meeting, support this tendency. The Japanese
kept silent and never directly confronted the consultant, while the American consultant kept
expressing his opinions and requirements during meetings. Subsequently, the Japanese brought
back the agenda and showed the proposal or revised version at the next meeting, but it was not
approved by the consultant. They followed this same cycle many times, and it ended up taking one
year to get approval for the process of steel fabrication (C Bridge project). Thus, the Japanese
tendency to avoid direct confrontation in meetings caused misunderstanding for the Americans.
The American project manager also mentioned that if the Japanese had said that they disagreed with
the American consultant’s points, things could have been changed (C Bridge project).
In contracts, Japanese firms are relatively careless about signing contracts, especially if they
have a good relationship with the owner (Semiconductor project). The Japanese project manager
33

believed that because of the good relationship, there was nothing in the contract that would hurt them,
and so signed the contract without checking too carefully (SC project, JP project manager). This
contract included some disadvantageous terms for the Japanese contractor, and was one of reasons
the project resulted in a negative profit. The Japanese manager probably through that the good
relationship extended to the business practice. Sociologists call this way of thinking particularism:
treating one’s friends better than others is natural, ethical, and sound business practice. Hofstede
mentioned that particularism and collectivism are correlated with each other (Hofstede, 1991,
p.66-67).
Japanese and American firms take different approaches when the conditions of the contract
have been changed and extra cost has been incurred. The Japanese approach is to finish the work
first, then discuss cost issues later, while the American approach is to contract first and then start
work. In the C bridge project, the Japanese manager said that they could not stop working, even
though the conditions of the initial contract had obviously changed, and extra cost was involved,
because they did not want to bother the other workers by canceling their jobs. On the other hand,
American firms tend to stop working if they cannot get agreement about changed conditions or extra
cost.
(4) Uncertainty Avoidance Index (UAI): Based on the observations, the UAI is related to
the type of decision and duration of decision making.
One important criterion of Japanese firms is high quality work. In the SF tunnel and SC
projects, the American firm was surprised at what the Japanese team required in terms of precision
and high quality work. The American team sometimes felt that “they (the Japanese team members)
are strict inspectors, rather than engineers.” (SC project, Table 4.2:9; SF tunnel project, Table 4.5:7)
Hofstede mentions precision and quality issues in the UAI index: “In the high UAI and relatively
small PDI countries, precision and punctuality are the most important.” (Hofstede, 1991, p.109-138)
Thus, engineers or project managers of high UAI countries tend to require preciseness and high
quality work.
In addition to this, Hofstede proposed that, “in the high UAI countries, it is important for a
manager to have at hand precise answers to most of the questions that his/her subordinates may raise
34

about their work.” (Hofstede, 1991, p.122) This implies that project managers of high UAI
countries tend to correct the problems asked or reported by subordinates; at the very least, they would
not ignore them.
Another tendency is related to the duration of decision-making. For example, in the SC project,
the American manager mentioned that JP firm’s decision making approach is to make a list of all
possibilities and then choose one by eliminating the others, while the American approach picks one
from a small number of choices, and then discusses it (SC project). Making a list of all possibilities
obviously requires a longer duration than the American method.
(5) Universalism vs. Paticularism Index (UNI): As noted previously, Japanese firms
tend to make contracts based on the relationship, rather than the written words. Thus, JP firms may
sign a contract with an owner, even though the contract includes generic or ambiguous words. JP
firms tend to think that ambiguous conditions in a contract can be fixed during the project, for
example, at meetings. In contrast, AM firms tend to think that when a contract has been signed,
every condition has been fixed. Therefore, it is reasonable that a contractual document written by
an AM firm is long and comprehensive. This difference in business practice relating to contracts
has large potential project risk, because of litigation or mitigation actions. In order to avoid
misunderstanding about changed conditions on a contract, one joint venture team wrote detailed
meeting minutes for each meeting and sent them around to seek consensus (C bridge project, Table
4.3:8)
4.3.3 Others: (1) Degree of delegation of power or responsibility: When the American inspector
visited the Japanese steel fabricator to inspect the products, the Japanese engineer asked the inspector
technical questions. However, since the scope of the American inspector’s work was only to inspect
the products, he was not able to answer any questions. The inspector brought these questions to the
United States and asked the owner, who then asked the consultant. Finally, answers were sent to the
Japanese steel fabricators a few weeks later. This anecdote implies that the American delegation’s
35
power is limited because tasks are allocated to many professions. Aoki’s work (Aoki, 1992)
explains this tendency using the duality principle. He proposed the duality characteristic of an
organization by comparing organizations in two nations, Japan and America. Japanese firms tend
to have a decentralized structure in their information flow and a centralized structure in their
personnel administration system. In the United States, many tasks and risks are allocated among
many groups, such as consultants, inspectors, sub-contractors, etc. Thus, in order to conduct an
investigation, the American owner may need to aggregate the information and then re-distribute it
again. This process takes time if a decision needs to cross multiple professions. In contrast, since
Japanese engineers tend to be assigned to multiple tasks, the process is relatively short.
(2) Availability of human resources: It is relatively difficult for foreign companies to
maintain skillful foremen and superintendents and to have skillful employees who are well versed in
the American business, since procurement of projects is uncertain (SC project, Table 4.2:7,8). In the
case of the C bridge project (C bridge project, Table 4.3:1), the project manager pointed out problems
resulting from the lack of a feedback system in the Japanese firm.
(3) Team Experience: Cultural conflicts and misunderstandings are sensitive to the team
experience. In the G bridge project, the Japanese firm had had experience working with the same
American firm. There is apparently no significant problem with their performance. Additionally,
the Japanese project manager had had experience in the United States, including his education at an
American university. He mentioned that he had tried to omit any Japanese business styles in the
project, which was one of the key factors that led to project success (G Bridge project, Table 4.4:1,2).
To summarize, cultural factors have brought about the two types of differences, (1) practices
and (2) values differences. Although the management strategy with respect to practices was
controllable, Japanese and American firms tend to set their own centralization and formalization
levels. Many value differences between Japanese and American individuals can be explained by
using Hofstede’s and Trompenaar’ dimensions. However, several differences were not categorized
using practices or values differences. These related mostly to circumstances surrounding the project
team, such as the availability of human resources.
36

Table 4.2: Summary of interviews - Case Study 1: Semiconductor project Differences Japanese (JP) Firm American (AM) Firm 1 Different
approaches to decision making
Consensus among participants was the first priority, after which the JP team could make a decision.
AM team members tended to make decisions by themselves. AM team members preferred “cowboy style” rather than “group” decision-making.
2 Different approaches to making offers when the conditions of the contract have been changed and extra cost have been incurred.
The JP firm tried to finish the job first, and then filed the claim, because the JP firm worried about affecting interdependent work through stoppage. Thus, from the point of view of the AM firm, claims made by JP firms tended to be late.
The AM firm easily stopped working if there was a conflict, unless the contract was modified based on changing conditions.
3 Different expectations about compensation
The JP firm expected that “Seii” (faithful or sincere) work would be evaluated (and compensated) by the owner. JP first demonstrated their sincere effort, and then asked for changes in the conditions.
To the AM firm, the contract was final. The AM firm believed that an offer to change conditions should be made before work begins or the next task is begun. No compensation should be given unless there is description in the contract.
4 The meaning of meetings
To the JP firm, a meeting was a place to make decisions or reach consensus among participants, rather than a discussion forum.
To the AM firm, a meeting was a place for discussion, rather than for reaching consensus.
5 Language barriers
JP teams could not communicate well because of the language barrier. (Even a fluent speaker spoke less frequently than an AM meeting participant.)
To AM, the silence of JP participants was a signal of agreement.
37

6 Different roles in the organizational structure
The project manager and project engineers were responsible both for paperwork and for managing the field work. Many JP engineers helped to manage in the field, if the superintendents were not skillful.
The project managers and project engineers tended to focus on paperwork, especially contract issues. The superintendent took care of the construction site. Overlapping of work responsibilities was less likely.
7 Difficulty of hiring and retaining skillful people
Since it is relatively difficult to constantly acquire new projects in the United States, it was hard to keep skillful American superintendents and Japanese engineers who have had experience in the United States
The AM firm took advantage of local firms. The AM firm could easily hire skillful superintendents who have had vast experience in the local area.
8 Feedback problems caused by inconsistent project acquisition
The JP firm failed to get feedback from past projects, due to inconsistent project acquisition in the United States
Feedback system was working well.
9 Quality level required
To JP firms, high quality work and products were given first priority, even if the quality level exceeded that specified in the contract.
To AM firms, quality was defined by the contract. The goal of the AM firm was to satisfy the quality level defined in the contract.
10 Relationship between the general contractor (GC) and sub-contractors (Sub)
The GC had more power than the Sub. The relationship between the two was similar to a boss-employees or father-sons relationship. Thus, it is rare that a Sub sues the GC.
Subs were treated as equal to the GC. Subs commonly sue the GC, and vice versa.
11 Relationship between GC and owner
The owner was treated like a king. Their orders were taken absolutely, even if they were unreasonable and out of the scope of the contract
The relationship was relatively equal.
12 Management style
JP firms used a relatively centralized and formalized system, since team members made sure of the boss’ opinions each time. However, one problem arose
AM engineer worked independently. The AM engineer subordinate to the JP project manager preferred to work freely. The preference was for a relatively decentralized system.
38

because the project manager lacked experience in the United States
13 Decision making process
The decision making process sought to eliminate less feasible options, and to decide upon the single best option.
The AM team came up with three or four ideas and quickly decided upon one option. Then they discussed and modified that option.
Table 4.3: Summary of interviews - Case Study 2: C Bridge project Problem Japanese (JP) Firm American (AM) Firm 1 Feedback
problems caused by inconsistent project acquisition
Although the JP firm had had over 10 projects in the United States, there was no feedback and training program from the past projects.
This was the first project to contract with the JP firm as a subcontractor. There was no data about cultural issues.
2 Technology level
The JP firm possessed the ability to produce high quality products. This project was the first bridge project to use the box type steel deck in the United States.
The technical expertise of the JP firm was the main reason to contract with the JP fabricator instead of another firm
3 Longer approval time from the AM consultant (1 yr)
To the JP firm, technical issues and the production process was the responsibility of the fabricator. The fabricator proposed a higher quality and cheaper method to the JP firm. However, the AM consultant did not understand, simply because of documentation problems and unfamiliarity with the techniques. This was a linguistic problem rather than a technical or quality issue.
All concerns raised by the consultant were related to process documentation rather than the products. For instance, the consultant pointed out grammatical errors, rather than the content. In addition, the consultant did not know the new technology and method, and required multiple explanations
4 Language barriers
The JP team kept silent in the meetings. The JP team agreed, more or less, with the grammatical errors pointed out by the AM consultant.
To the AM consultant, silence was a signal of agreement. The AM consultant spent much time correcting the written English in the documents.
39

5 Role of inspectors
Generally, since the inspector was the same person as the project engineer (project manager), he had the power to decide technical issues at the factory.
Inspectors coming to Japan did not have any authority to make decisions at the factory when the JP firm asked questions regarding technical issues. The purpose of the inspectors was simply to inspect products. Thus, the delegated power to the inspector was very narrow and limited.
5 Different approaches to change order requests
When conditions changed, the JP firm tried first to finish the job, then asked for extra compensation for the changing conditions.. Thus, the JP firm’s approach was to complete the work first, then think about cost.
The AM firm tended to stop work relatively easily if there was a conflict about the changing condition of the contract. Thus, the AM approach was to reach contract agreement first and to finish work afterwards.
6 Beliefs and values
“Seii” (a faithful or sincere work attitude) was quite important to achieve a good relationship among the parties. Sometimes faithful work was sufficient reason for compensation from the owner.
Faithful work could achieve a good relationship, but was not going to be a basis for compensation. To the AM firm, the contract conditions stood.
7 Formalization level of meetings
Since the JP firm wanted to avoid misunderstanding, they made meeting minutes and distributed copies to the participants to make sure of the meeting contents.
The AM firm also tried to avoid misunderstanding and made an AM version of the meeting minutes.
8 Meaning of meetings
Meetings were a place for reaching consensus or making decisions. The JP firm tried to avoid direct confrontation
Meetings were an opportunity for discussion rather than for reaching consensus about changing orders or the conditions of the contract.
9 Power distance The JP firm took a comment from the AM project manager to call tag boats as a serious order.
The AM project manager believed it to be a casual conversation, not a genuine order.
10 Differences in meeting styles and contract definitions
Meetings were the place to make the ambiguous contract clear. To the JP firm, contracts use many general terms. Traditionally, Japanese contracts run only a few pages long.
When both parties agreed with the contract, every condition stays fixed even if there are generic or ambiguous words. Thus, if one firm signed the contract with an ambiguous condition, it is that firm’s responsibility.
40

11 Meeting minutes
For the reason listed above, meeting minutes were important in Japan. The minutes specified who said what and the final agreements on issues.
Meeting minutes were important. However, they were not enforceable without agreement or signature, because the purpose of meetings is the discussion of issues.
Table 4.4: Summary of interviews - Case Study 3: G Bridge project Problem /
Tendencies Japanese (JP) Firm American (AM) Firm
1 Successful factors
The JP manager tried to use the AM management method, such as the “cowboy style”.
The AM firm had a flat organization, less formal meetings, and a good relationship between the JP and AM firms.
2 Experience The JP manager had extensive experience and an educational background in the United States.
Both firms have had experience working together
3 Team size The JP team consisted of two individuals, and thus the magnitude of the cultural impact may have been lessened.
The AM team consisted of eight individuals.
4 Uncertainty avoidance
The JP manager tended to be concerned about information disclosure.
The AM manager tended to share information openly.
Table 4.5: Summary of interviews - Case Study 4: SF tunnel project Problem /
Tendencies Japanese (JP) Firm American (AM) Firm
1 Problems regarding the contract
Based on the JP business custom regarding joint ventures, the dominant firm had a “sponsor merit” in the profit.
The AM firm believed that both firms had reached agreement on profit sharing.
2 Litigation problem
The JP firm did not expect that the AM firm would sue to the JP firm, a partner company.
The AM firm believed that litigation was only one way to solve this problem and misunderstanding, because it was a breach of contract.
41

3 Differences in the relationship between the general contractor (GC) and subcontractors (Subs)
In the construction business in Japan, the relationship between a GC and Subs was similar to the relationship between father and sons or daughters.
In the construction business in the United States, the relationship between a GC and Subs is equal.
4 Time for decision making
The JP engineers asked their boss’ judgment before asking their subordinates to carry out any orders.
The AM engineers felt that the JP engineers could not make certain decisions. The AM engineers felt that the JP process required unnecessary decision making time and was inappropriate for the construction industry.
5 Response to the owner’s order
The JP firm demonstrated an effort to satisfy the owner’s orders as much as possible.
The AM engineer rejected the owner’s order because it looked like it was causing low productivity and schedule overruns.
6 Delegation of power
The JP group tended to use consensus among team members, rather than delegate power.
The AM engineers felt that the JP engineers were not empowered to make decisions.
7 Preciseness and quality issues
The JP firm wanted to provide high quality work to the owner. Issues pointed out by the JP engineers were mostly related to the quality.
The AM engineers felt that the JP engineers resembled “inspectors” more than “engineers.”
8 Different methods of job allocation
The JP firm tended to allocate every task to subcontractors.
The AM firm tended to work using their own staff, rather than subcontracting, particularly in the tunnel projects.
42

Chapter 5
Modeling Since Weber’s fundamental work in the early 1900s (Weber, 1924), many organization
theorists have adopted an information processing view of organizations (March and Simon, 1958;
Galbraith, 1977). In this view, an organization is an information-processing and communication
system, structured to achieve a specific set of tasks, and comprised of limited capacity, “boundedly
rational” information processors (individuals or sub-teams). The VDT model (Yan and
Levitt ,1996) succeeded in extending the information processing view by measuring the fit between
the information processing capacity and the information processing demand at the level of an
individual actor. This micro view of the information processing approach to organizational
design is called “neo-information processing” (Burton and Obel, 1998).
The VDT model consists of three elements: project descriptions, micro-behavior of actors,
and organization structure.
Project descriptions are characterized by the type of projects such as Design-Bid-Build or
Design and Build. Projects are described by including the project intensity and identifying task
dependencies, product work volume, and coordination work volume in the model.
The micro-level behavior of actors refers to the actor’s decisions about how to process
information. In the VDT model, actor behavior depends on the actor’s role, one of project
manager (PM), subteam leader (SL), or subteam member (ST). Actors have two basic behaviors
that define their actions and interactions: attention allocation and information processing behavior.
The existing organization theories support the view that organization structure affects an
organization’s performance. An organization’s structure represents the pattern of
43

decision-making and communication among actors (Baligh and Damon, 1980; Baligh and Burton,
1981; Malone, 1987). It affects organizational performance by enforcing constraints on actor’s
decision-making actions through the control structure and centralization policy, and affects
communication actions through a communication structure and formalization policy (Yan and
Levitt, 1996).
One of the initial questions of this research was which organizational component affects
cultural factors the most. Hofstede (Hofstede, 1991) gave a useful insight on this question when
he described culture as being composed of two elements, (1) practices and (2) values. The
balance of the two changes based on the size of the group. Since practices in an organization are
the ways of organizing which enables the organization to conduct a project, practices are linked to
an organization’s structure. Since values form the basis of how people behave and how they
make decisions, cultural values are linked to micro-level behavior in the VDT model (Figure 5.1).
Culture
Current VDT model
Outputs
Practices
Values
Organization Structure
Project Description Micro-level Behavior
Figure 5.1: Components of the VDT model and cultural factors
44

5.1 Framework Figure 5.2 shows the input and output flows, as a framework that can capture the impact of
culture on a construction project. Two different types of information are involved: the project
description and the cultural factors. The project description can be broken down into three
elements: (1) task dependencies, (2) project intensity, and (3) team situations. Cultural factors
have two aspects that affect an organization’s information processing: (4) organization structure and
(5) micro-behaviors.
Inputs
Outputs
Project Description
Cultural Factors 1: Practices
Cultural Factors 2: Values
Task Dependencies
Project Intensity
Organization Structure
Micro Behavior
Situation (Team)
Model
Outputs
Figure 5.2: Research Framework
(1) Task dependencies: To emphasize the impact of culture on team performance,
prototypes of task dependencies are tested in this thesis. Task dependencies can be classified into
four arrangements (Bells and Kozlowski, 2002): a pooled workflow, a sequential workflow, a
reciprocal workflow, and an intensive workflow. These different workflows represent basic units
of work processes in real construction projects.
A pooled workflow is a structure in which tasks and activities are performed separately by all
team members and then combined into a finished product. This is similar to the concept of “fit”
as one of the basic types of dependencies (Malone et al, 1999; Zlotkin, 1995).
45

Task
Task
Task
Task
Figure 5.3: A Pooled Workflow Structure
A sequential structure is a workflow in which tasks and activities flow sequentially from one
to the next. This structure represents the design-bid-build project in this thesis. The
design-bid-build procedure is still predominant in the construction industry. Traditionally, field
construction is not begun until the architect-engineer has completed and finalized the design
(Clough et al, 2000).
Task Task Task Task
Figure 5.4: A Sequential Workflow Structure
A reciprocal structure is the minimum unit of interdependent workflow which is lies between
sequential and intensive workflows.
Task
Task
Task
Task
Figure 5.5: A Reciprocal Workflow Structure
46

An intensive structure is the most interdependent workflow. It represents the fast-track
project. The fast-track procedure refers to the overlapping of project design and construction.
As the design of progressive phases of the work is finalized, these designs are put under contract, a
process commonly referred to as “phased construction.” Construction of the early phases of the
project is begun while later stages are still on the drawing boards. This procedure of overlapping
the design and construction phases can appreciably reduce the total time required to achieve project
completion (Clough et al, 2000).
Task Task
Task Task
Figure 5.6: An Intensive Workflow Structure
Task Workflow
Interdependencies Pooled Type Sequential Type Reciprocal Type Intensive Type
Complexity Low High
Figure 5.7: Summary of Workflows
(2) Project intensity: In the VDT model, there are three settings that determine the
project intensity: the information exchange ratio, the project error probability, and the functional
error probability. The project intensity obviously depends on the project type. In this thesis, the
project intensity is determined in conjunction with four prototypical projects: pooled, sequential,
reciprocal, and intensive.
47

Table 5.1: Setting of Project Intensity
Pooled Type Sequential Type Reciprocal Type Intensive Type
Information Exchange Ratio (IE) Low Med Med High
Project Error Probability (P) Med Med Med High
Functional Error Probability (F) Med Med Med Med
Information exchange probability measures the amount of communication in the project
between positions that are responsible for tasks linked by communications links. The information
exchange probability is set for the project as a whole (SimVision 3.1.1 Help Files). In the case of the
pooled workflow, since tasks and activities are conducted separately by the actors, the information
exchange ratio can be set to a low value. On the other hand, in the case of the intensive workflow,
since task dependencies are complicated, actors need to acquire relevant task information as much as
they can. Thus, the information exchange ratio tends to be high (Table 5.1).
Project-error probability is typically set in the range between 0.05 (low) and 0.10 (significant
but common). The project error probability can be set with a low value if the project involves
relatively standard tasks and routine work processes. It can be set with a high value for nonstandard
tasks and innovative work processes (SimVision 3.1.1 Help Files). Since construction tasks are
relatively non-routine work processes, it is fair to set a common value (0.10) in the cases of pooled,
sequential and reciprocal workflows. The intensive project type generally is of short duration with
high work volume, and thus its project error probability is potentially high (Table 5.1).
Functional-error probability is typically set in the range from 0.05 to 0.10. The
functional-error probability can be set with a low value if the project involves relatively
well-understood technology and standard work processes. This probability can be set with a high
48

value if the project involves unproven technology or innovative work processes (SimVision 3.1.1
Help Files). Since the technological level is out of the scope of this thesis, all three prototypes are
assumed to have a medium error probability (Table 5.1)
(3) Team Situation: Team situation is defined as the context or circumstances
surrounding a team. Based on our observations, the team experience can be considered the
situation.
Since a construction project is a discrete event, in the construction industry team members
tend to be assembled on a project basis, and dissolved when the job is done. This inconsistency
implies that team experience is most likely to be low. However, there are a few cases where team
cohesion was achieved by overcoming economic instability. In this case, cultural conflicts and
misunderstandings were mitigated and vanished. Thus, in this research, team experience was
varied from low to high as an independent variable. The literature on cultural diversity suggests
that managing cultural diversity has benefits, such as cost effectiveness, creativity, and
problem-solving quality (Taylor & Stacy, 1991). This implies that a cross-cultural team with
“high” team experience can potentially have a positive impact on team performance. However,
in this thesis, there is not enough evidence to model positive reactions correlated to team
experience.
Table 5.2: Team Experience
Training Team Experience Low Med High
(4) Organization structure: Each national culture has its preferred coordination
mechanism (Hofstede, 1991). This implies that Japanese and American firms have their own
preferred organization structure, independent of the task complexity and team circumstances. Thus,
there are two types of organization structure: Japanese and American styles. Each style is
49

composed of four elements: centralization, formalization, matrix type, and organizational
configuration.
Table 5.3: Leadership Styles as Organization Structure
Leadership Style JP (Tight System) AM ( Loose System) Centralization High Med Formalization High Med Matrix Type Med Med Organizational Configuration Pyramid Flat
Based on observation and literature review, the Japanese style can be categorized into the
tight system, because they generally have high centralization, high formalization and a pyramid
organization configuration (See section 4.1.1). The American style is a relatively loose system,
identified by medium centralization, formalization, and matrix level, and is a flat configuration (See
section 4.1.1).
(5) Micro-behavior of actors: Based on observation and literature review, two types of
actor behavior, decision-making behavior and coordination behavior, are considered as cultural
factors. Japanese and American firms have their own set of behavior parameters.
Decision making behavior: Three behavior parameters are examined: decision maker policy,
wait time for decision making, and decision type.
- Decision maker policy is used by the VDT model to determine who should make the
decision for an exception, based on the project’s centralization level. This is related to
the PDI index: the subordinates expect to be told what to do in large PDI countries.
The ideal boss is a benevolent autocrat or good father (Hofstede, 1991). Thus,
50

Japanese behavior is more centralized than that of Americans (Figure 5.9).
- Wait time for decision making defines how long a participant should wait for a
decision before it assumes delegation by default. Participants of different managerial
roles have different time-out durations. This is related to the IDV and UAI index,
because high collectivist – high uncertainty avoidance countries need more time to make
decisions because of consensus- seeking activities, and because of the process in which
all possibilities are listed before a decision is chosen.
- Decision type determines how an exception should be dealt with, based on the project’s
centralization policy. The assumption is that higher level participants (e.g., project
managers) tend to make more “rework” decisions. In high UAI countries, it is
important for a manager to have at hand precise answers to most of the questions that
his/her subordinates may raise about their work (Hofstede, p122). This implies that
higher level participants such as project managers tend to make more “correct” decisions.
In addition, the large UAI countries prefer “preciseness” and “punctuality” as good
evaluation criteria (Hofstede, 1991). This implies that “ignore” decisions are relatively
infrequent in comparison with low UAI countries such as the United States.
Table 5.4: Sets of Micro-level behavior
Decision Policy JP type AM type Decision Maker Policy Centralized Average Wait Time for Decision Making Long Average
Decision Type Different proportions Average
Communication behavior: Three communication behavior parameters are related to cultural
factors: information-exchange type, information-exchange priority, and message volume.
- The information-exchange type (coordination distribution policy) helps to determine
the probability of each kind of information exchange – (information exchange, meetings,
51

or noise) taking place, depending on the project formalization. The UAI index
describes formal and informal rules: In large uncertainty-avoiding societies there are
many formal laws and informal rules controlling the rights and duties of employers and
employees (Hofstede, 1991, p.120). Thus, Japanese firms typically formalize team
interactions by setting informal or formal rules.
- The information-exchange priority (coordination priority policy) defines the
probability a participant attends to a given type of communication given the strength of
the organization matrix. In the low IDV (high collectivist) cultures, harmony should
always be maintained. An attendance failure is likely to cause disharmony. Thus, I
assumed that the probability of attendance tends to remain high even if the matrix
strength is low.
- The message volume defines the duration for each type of message. The length of
time needed for processing a message depends on the type of the message (e.g., a
decision or an information exchange), and the role of the actor processing the message
(e.g., PM or ST). High context communication in collectivist countries (Hofstede,
1991, p.67) affects the quantity of information passed.
Table 5.5: Sets of Communication Behavior Parameters
Communication Policy JP style AM style
Information exchange type Different proportions Average
Information exchange priority
Different proportions Average
Message volume Large Average
Figure 5.8 summarizes the modeling framework used to capture cultural phenomena.
52

Figure 5.8: Modeling framework
53

5.2 Modeling For the simulation experiments, the detailed settings of the VDT model are as follows.
The JP organization structure + Pooled workflow The AM organization structure + Pooled workflow
Figure 5.9: Examples of Modeling
(1) Simulation Engine: SimVision-R7 – Educational Version 3.11.1
(2) Actors: There are seven actors in the idealized organization. The seven actors can
be divided into two groups: Japanese and American. Each group has three actors. The head of
the project team is a project manager, who can take on either Japanese or American
micro-behaviors, depending on which firm is the dominant party.
(3) Tasks: There also are seven tasks. Each task has a responsible actor. Each task is
identical and has 240 days working volume. The total work volume is 1680 days, which
represents the medium size of construction projects.
(4) Rework and Communication links: Rework and communication links are ascribed
according to the task intensity. Experiments to find an organizational equivalent of the Reynolds
Number in Fluid Mechanics (Levitt et al, 2002) refers to a “turbulent point” at which hidden
7 SimVision-R was developed by Vité Corporation and is licensed from ePM, LLC, Austin Texas.
54

work volume increases dramatically, as a function of rework links. Thus, the amount of rework
and communication versus the total number of tasks were examined as part of task complexity.
Table 5.6: Rework and Communication Ratio*
Pooled Sequential Reciprocal Intensive
Rework ratio 0 0.4 1 1.3
Communication ratio 0.9 0.9 0.9 1.7
*Ratio = number of rework or communication items / total number of tasks
(5) Parameters (Appendix A and Appendix B): Each nation has its own set of micro-level
behaviors. Behavior parameters are set based on observations and existing theories. Each set of
behavior patterns is shown in Appendix A and Appendix B.
5.3 Scenarios The purpose of this research is to examine Hofstede’s theory of “the preferred coordination
mechanism” using the VDT model. Hofstede proposed that each nation has its preferred
coordination system. If Hofstede’s theory is correct, performance will improve when Japanese
micro-behavior is paired with the Japanese preferred organizing system.
The VDT model can be used as a “theorem prover,” as proposed by Feldman and Arnold
(1983), to test whether a model matches to the examined theory. Burton and Obel (1995) stated
that an experiment needs to include three steps to validate a computational model: reality, content,
and construct validity.
I simulated 4 combinations arising from two micro-level behavior patterns and two organizing
structures with various task complexities (Figure 6.1). Combinations 1 and 3 show cases where
firms work in their own organizing style. Combinations 2 and 4 show cases where firms work in
another organizing style.
55

Figure 5.10: Combinations
The following 48 scenarios are simulated as possible patterns. One of the aims of these
simulations is to see the results of actors with differing micro-behaviors working under the same
managing system and the same task complexity.
Table 5.7: Scenarios for Computational Experiments
Case 1 (Prototype Project 1 – Pooled) 1.1 1.2 1.3 2.1 2.2 2.3 3.1 3.2 3.3 4.1 4.2 4.3 Information Exchange L L L L Project Error L L L L Functional Error M M M M Training: Team Experience Team Experience L M H L M H L M H L M H Number of Meetings + + + + Leadership Style JP (Tight System) AM (Loose System) Centralization H H M M Formalization H H M M Matrix Type M M M M Organizational Configuration Pyramid Pyramid Flat Flat Decision Policy JP-Behavior AM-Behavior Decision Maker Policy Centralized Average Centralized Average Wait Time for Decision Making Increased Average Increased Average
Decision Type Different proportions Average
Different proportions Average
Communication Policy
Intensive
Reciprocal
Sequential
Pooled
Organizing Structure 1
42
3JP Organizing Style
AM Organizing Style AM pattern
JP pattern
Micro-Behavior Task Complexity
56

Information Exchang Type Different proportions Average Different
proportions Average
Information Exchange Priority Different proportions Average
Different proportions Average
Message Volume Increased Average Increased Average Case 2 (Prototype Project 2 - Sequential) 1.1 1.2 1.3 2.1 2.2 2.3 3.1 3.2 3.3 4.1 4.2 4.3 Information Exchange M M M M Project Error M M M M Functional Error M M M M Training: Team Experience Team Experience L M H L M H L M H L M H Number of Meetings + + + + Leadership Style JP (Tight System) AM (Loose System) Centralization H H M M Formalization H H M M Matrix Type M M M M Organizational Configuration Pyramid Pyramid Flat Flat Decision Policy JP-Behavior AM-Behavior Decision Maker Policy Centralized Average Centralized Average Wait Time for Decision Making Increased Average Increased Average
Decision Type Different proportions Average
Different proportions Average
Communication Policy
Information Exchange Type Different proportions Average Different
proportions Average
Information Exchange Priority Different proportions Average
Different proportions Average
Message Volume Increased Average Increased Average Case 3 (Prototype Project 3-Reciprocal) 1.1 1.2 1.3 2.1 2.2 2.3 3.1 3.2 3.3 4.1 4.2 4.3 Information Exchange M M M M Project Error M M M M Functional Error M M M M Training: Team Experience Team Experience L M H L M H L M H L M H Number of Meetings + + + + Leadership Style JP (Tighten System) AM (Relatively Loose System) Centralization H H M M Formalization H H M M
57

Matrix Type M M M M Organizational Configuration Pyramid Pyramid Flat Flat Decision Policy JP-Behavior AM-Behavior Decision Maker Policy Centralized Average Centralized Average Wait Time for Decision Making Increased Average Increased Average
Decision Type Different proportions Average
Different proportions Average
Communication Policy
Information Exchange Type Different proportions Average Different
proportions Average
Information Exchange Priority Different proportions Average
Different proportions Average
Message Volume Increased Average Increased Average Case 4 (Prototype Project 4-Intense) 1.1 1.2 1.3 2.1 2.2 2.3 3.1 3.2 3.3 4.1 4.2 4.3 Information Exchange H H H H Project Error H H H H Functional Error M M M M Training: Team Experience Team Experience L M H L M H L M H L M H Number of Meetings + + + + Leadership Style JP (Tighten System) AM (Relatively Loose System) Centralization H H M M Formalization H H M M Matrix Type M M M M Organizational Configuration Pyramid Pyramid Flat Flat Decision Policy JP-Behavior AM-Behavior Decision Maker Policy Centralized Average Centralized Average Wait Time for Decision Making Increased Average Increased Average
Decision Type Different proportions Average Different
proportions Average
Communication Policy
Information Exchange Type Different proportions Average Different
proportions Average
Information Exchange Priority Different proportions Average Different
proportions Average
Message Volume Increased Average Increased Average
58

Chapter 6
Experimentation I simulated 48 scenarios, in order to focus on the four combinations of the two different patterns
of the micro-level behavior and the two different organizing systems. The VDT model is designed
to predict duration, cost, and quality risks as measure of team performance. For comparison
purposes, each actor and task is identical, and, except for the micro-behavior the actor possesses, cost
differences are mainly caused by differences in simulated duration. Thus, two results, (1) duration
and (2) quality risks, are compared.
6.1 Hidden Work Volume The VDT model displayed the simulated and the critical path method (CPM) duration. The
simulated duration is calculated by considering the simulated work volume and workflow. The
CPM duration is calculated by considering the designed work volume and workflow. The gap
between the simulated and the designed work volume is called “hidden work” (Levitt & Kunz,
2002), and is caused by rework, coordination efforts, and wait time for decisions. Thus, this hidden
work represents the efficiency of team performance.
Table 6.1 and Figures 6.1 and 6.2 show the hidden work volume for all cases. As figure 6.2:3
shows, the hidden work volume increases with task complexity, from case 1 (low) to case 4 (high).
Case 4 continues to have a large amount of hidden work volume, as compared with the other cases.
When comparing the results of the two structural types, the JP and AM organizing structures, a large
difference is observed in the case of low team experience and high task complexity (Table 1 and
Figures 6.1 and 6.2). The AM organizing system lacks tolerance if the team experience is low and
59

the project has a high complexity requirement. However, in the case of medium and high team
experience, there is no significant difference between the JP and AM organizing structures.
The differences between the JP and AM micro-level behavior patterns are very subtle in
comparison with the impact of the organizing system (Figures 6.1-6.3). This is true because the
VDT model is initially designed for predicting the effects of changing organization structure on
organization’s performance (Jin & Levitt, 1996).
Table 6.1: Hidden Work Volume (person-days)
JP Structure L M H AM Structure L M H
JP/JP-1 799 766 740 AM/JP-1 854 787 728 JP/AM-1 783 744 726 AM/AM-1 828 748 715 JP/JP-2 1407 1342 1340 AM/JP-2 1415 1291 1258 JP/AM-2 1434 1371 1368 AM/AM-2 1387 1282 1262 JP/JP-3 1825 1794 1781 AM/JP-3 1830 1727 1705 JP/AM-3 1873 1859 1810 AM/AM-3 1794 1724 1700 JP/JP-4 1924 1787 1713 AM/JP-4 3317 2082 1791 JP/AM-4 1962 1855 1738 AM/AM-4 3174 2072 1833
*Hidden work volume is calculated as Hidden Work Volume = Simulated Work Volume – Designed Work Volume
**JP/JP-1 signifies “Structure Style” / “Pattern of Behavior” – “Project Case”
60

Hidden Work Volume (Days)
0.00
500.00
1000.00
1500.00
2000.00
2500.00
3000.00
3500.00
L M H
Team Experience
Hidden Work Volum
e(Days)
JP/JP-1
JP/AM-1
JP/JP-2
JP/AM-2
JP/JP-3
JP/AM-3
JP/JP-4
JP/AM-4
Case 2
Case 3 &4
Case 1
Figure 6.1: Hidden Work Volume in the case of JP structure
Hidden Work Volume (AM Structure)
0.00
500.00
1000.00
1500.00
2000.00
2500.00
3000.00
3500.00
L M H
Team Experience
Hidden Work Volum
e (Days)
AM/JP-1
AM/AM-1
AM/JP-2
AM/AM-2
AM/JP-3
AM/AM-3
AM/JP-4
AM/AM-4
Case 4
Case 3
Case 2
Case 1
Figure 6.2: Hidden Work Volume in the case of AM structure
61

Hidden Work Volume
500
1000
1500
2000
2500
3000
3500
P S R I
Task Workflow
Hidden Work Volume
(days)
JP/JP
JP/AM
AM/JP
AM/AM
P=Pooled Workflow S=Sequential Workflow R=Reciprocal Workflow I=Intensive Workflow Figure 6.3: Comparison of JP and AM structures
In order to capture the subtle effects of the different micro-level behavior patterns, this thesis
uses the following simple formula:
JP/AM effective index = JP performance / AM performance
When the JP/AM effective index is below 1.0, JP performance is better than AM, and vice versa.
Table 6.2 compares the JP and AM behavior patterns. Interestingly, in the case of the JP
organization structure, the index falls below 1.0, which implies that JP actors will work well with the
JP organization structure, except in the case of pooled workflow (low task complexity). On the
other hand, in the case of the AM organization structure, the index is above 1.0. This implies that
AM actors show better performance under the AM organization structure. Thus, each nation’s
behavior pattern is positively correlated to their own preferred organization structure, under medium
to high task complexities.
62

Table 6.2: Comparison of JP and AM behavior patterns
Structure-Case L M H
JP-1 1.02 1.03 1.02
JP-2 0.98 0.98 0.98
JP-3 0.97 0.97 0.98
JP-4 0.98 0.96 0.99
AM-1 1.03 1.05 1.02
AM-2 1.02 1.01 1.00
AM-3 1.02 1.00 1.00
AM-4 1.05 1.01 0.98
Effects of Behavior Patterns (=JP/AM performance)
0.90
0.95
1.00
1.05
1.10
L M H
Team Experience
JP-1
JP-2
JP-3
JP-4
AM-1
AM-2
AM-3
AM-4
The AM organization structure
The JP organization structure
Figure 6.4: Comparison of Behavior Patterns (JP/AM performance)
63

6.2 Components of Hidden Work Hidden work volume is composed of three elements: rework, coordination efforts, and wait
time for decisions. Qualitative tendencies in each case, for each component of hidden work, can be
captured using the same formula as the JP/AM effective index.
Rework is defined as the work that has to be redone on a task due to exceptions that occur in
another task linked to it by a rework link. Rework occurs in the dependent task, or the task at the
arrow end of the rework link (SimVision 3.1.1 Help Files). As Table 6.3 shows, the index is below
1.0 in almost all cases. This means that JP actors do less rework than AM actors in all cases of task
complexity and organization structure. Thus, the JP micro-level behavior pattern consistently
shows less rework than the AM micro-level behavior pattern.
Proposition: the JP behavior pattern results in less rework than the AM behavior pattern
Table 6.3: Comparison of Reworking Volume
Structure-Case L M H
JP-1 0.99 1.00 1.00
JP-2 0.94 0.94 0.95
JP-3 0.94 0.93 0.95
JP-4 0.94 0.93 0.95
AM-1 0.99 1.02 0.99
AM-2 0.98 0.97 0.96
AM-3 0.98 0.96 0.97
AM-4 1.00 0.97 0.94
64

Rework (=JP/AM Performances)
0.90
0.92
0.94
0.96
0.98
1.00
1.02
1.04
Team Experience
JP-1
JP-2
JP-3
JP-4
AM-1
AM-2
AM-3
AM-4
Figure 6.5: Comparison of Behavior Patterns in Reworking
Coordination models the information flow among positions. Coordination volume is measured as
the sum of two different types of communication: one-to-one information exchange between
positions or persons, and group meetings (SimVision 3.1.1 Help Files). The simulated results for
coordination efforts show that all cases are above 1.0. This means that AM people coordinate
efficiently in all cases. Thus, the AM micro-level behavior pattern consistently shows efficient
coordination in comparison with the JP micro-level behavior pattern.
Proposition: the AM behavior pattern results in less coordination work than the JP behavior
pattern
65

Table 6.4: Comparison in Coordination
Structure-Case L M H
JP-1 1.13 1.15 1.14
JP-2 1.08 1.10 1.10
JP-3 1.08 1.10 1.11
JP-4 1.11 1.12 1.13
AM-1 1.15 1.16 1.14
AM-2 1.11 1.13 1.12
AM-3 1.12 1.14 1.14
AM-4 1.21 1.17 1.14
Comparison in Coordination (=JP/AM performance)
0.95
1.00
1.05
1.10
1.15
1.20
1.25
Tem Experience
JP-1
JP-2
JP-3
JP-4
AM-1
AM-2
AM-3
AM-4
Figure 6.6: Comparison of Behavior Patterns in Coordination
Wait time for decisions arises when positions report exceptions to supervisors and supervisors
make decisions about how to deal with the exceptions. The components include the time a position
waits for a response from the supervisor about how to handle an exception, plus any time the position
66

waits for exception resolution before making the decision (SimVision 3.1.1 Help Files). The index
for wait time is above 1.0 in all cases. This means that JP actors are most likely to wait longer for
decision making than AM actors. Thus, the AM micro-level behavior pattern consistently shows
efficient decision making in comparison with the JP micro-level behavior pattern.
Proposition: the AM behavior pattern has less wait time for decisions than the JP behavior
pattern
Table 6.5: Comparison in Wait-Time-for-Decisions
Structure-Case L M H
JP-1 1.01 1.09 1.02
JP-2 1.07 1.07 1.10
JP-3 1.06 1.05 1.09
JP-4 1.06 1.04 1.09
AM-1 1.02 1.12 1.05
AM-2 1.01 1.04 1.03
AM-3 1.05 1.03 1.04
AM-4 1.06 1.02 1.02
67

Comparison in Decision-Wait-Time (=JP/AM performance)
0.95
1.00
1.05
1.10
1.15
1.20
1.25
Team Experience
JP-1
JP-2
JP-3
JP-4
AM-1
AM-2
AM-3
AM-4
Figure 6.7: Comparison of Behavior Patterns in Wait-Time-for-Decisions
To summarize the components of hidden work, JP actors are effective in reducing rework volume,
and AM actors are effective in reducing coordination and wait-time volume. When considering the
proportion of the three components of hidden work, rework occupied the largest portion, about 75%
of the total hidden work volume. Thus, the greater the improvement in rework volume, the more
effective the team performance is. In the JP case, there is a tradeoff between rework volume and
coordination and wait time.
68

73.5%
20.4%
6.2%
Wait Time for Decision Making
Coordination Effort
Reworking
Figure 6.8: Proportion of three components
6.3 Project Quality Risk Table 6.6 shows the differences in the project-quality-risk index. In the VDT model, the
project-quality-risk index shows the likelihood that the components produced by this project will not
be integrated at the end of the project, or that the integration will have defects based on rework and
exception handling. PRI is thus a measurement of the success of system integration. Any quality
risk below 0.2 is probably acceptable. If the risk is greater than 0.5, it indicates high product quality
risk (SimVision 3.1.1 Help Files).
When comparing the JP and AM organization structures, the JP organization structure
displayed lower risk than the AM organization structure. Specifically, when comparing the cases of
JP-JP-2 and AM-JP-2, the JP organization structure case showed 0.291 risk, while the AM
organization structure showed about 3.16 risk. Since the only difference between the two cases is
the organization structure, it is fair to say that the risk gap was caused by the structural differences.
Thus, the JP organization structure improves quality, as compared to the AM organization structure.
Next, the effects of the different patterns of micro-level behavior are compared. For instance,
69

when comparing the cases of JP-JP-2 and JP-AM-2, the project-quality-risk of the AM behavior
pattern (around 0.27) is lower than the JP behavior pattern (0.291). Thus, AM micro-level behavior
has lower risk than the JP behavior, averaged across both kinds of structure.
This thesis found dual tendencies in the project quality risk. From the point of view of
organization structure, JP structure incurs less risk than AM structure. On the other hand, in the case
of the behavior patterns, the JP behavior pattern incurs more risk than the AM pattern.
However, these simulated results differ from the observations, because Japanese firms tend to
respect high job quality and preciseness. This implies that the JP behavior could show less risk than
the AM behavior. The reason for this discrepancy lies in the definition of “correcting” work.
“Correct” work is designed as half of rework: one-half of the total exception work must be redone by
the actor.. Correcting work causes a reduction in rework volume. The current VDT model does
not represent the other half of total rework. Thus, from the PRI point of view, half of the total
exception is treated as “ignored” rather than “reworked”. The quality index of the VDT model does
not distinguish between the two concepts of “ignored” work and “corrected” work. Future VDT
models that consider culture will need to be more consistent with the theory, with respect to quality
and work volume.
Table 6.6: Project Quality Risk Index (PRI) PRI L M H PRI L M H JP-JP-1 N/A N/A N/A AM-JP-1 N/A N/A N/A JP-AM-1 N/A N/A N/A AM-AM-1 N/A N/A N/A JP-JP-2 0.291 0.289 0.291 AM-JP-2 0.316 0.318 0.316 JP-AM-2 0.254 0.245 0.247 AM-AM-2 0.260 0.258 0.254 JP-JP-3 0.301 0.295 0.294 AM-JP-3 0.335 0.330 0.329 JP-AM-3 0.267 0.263 0.262 AM-AM-3 0.276 0.273 0.273 JP-JP-4 0.303 0.304 0.301 AM-JP-4 0.339 0.329 0.334 JP-AM-4 0.271 0.267 0.263 AM-AM-4 0.289 0.276 0.275
70

PRI (JP Structure)
0.2000.2200.2400.2600.2800.3000.3200.3400.3600.3800.400
L M H
Team Experience
Risk Index
JP-JP-1
JP-AM-1
JP-JP-2
JP-AM-2
JP-JP-3
JP-AM-3
JP-JP-4
JP-AM-4
Figure 6.9: Comparison of Behavior Patterns in Project Quality Risk Index (PRI)-JP structure
PRI (AM Structure)
0.200
0.220
0.240
0.260
0.280
0.300
0.320
0.340
0.360
L M H
Team Experience
AM-JP-1
AM-AM-1
AM-JP-2
AM-AM-2
AM-JP-3
AM-AM-3
AM-JP-4
AM-AM-4
Figure 6.10: Comparison of Behavior Patterns in Project Quality Risk Index (PRI)-AM structure
71

Chapter 7
Discussion The simulated results are compared with the Hofstede’s proposition of “the preferred
coordination mechanism” (Hofstede, 1991, p.152).
7.1 Implications Hofstede introduced Mintzberg’s five coordination mechanisms and projected them onto a
power distance-uncertainty avoidance plane, giving examples of typical countries. Hofstede’s
work implies that each nation shows better performance if they use their own preferred coordination
mechanism. Each nation preferred style is also predicted from a power-distance-uncertainty
avoidance matrix.
Great Britain China
Germany
France
USA
AM
JP
High UAI
Low PDI
High PDI
Low UAI
Figure 7.1: Preferred Coordination Mechanism (Hofstede, 1991)
72

The simulated results shown in figure 6.4 indicate that the JP micro-level behavior pattern is effective
in reducing the total hidden work volume, when using the JP organization structure, except for the
case of pooled workflow. Similarly, the AM behavior pattern is positively correlated to the AM
organization structure in cases of medium to high complexity. Thus, the results show a correlation
between the micro-level behavior pattern and the preferred organization structure, which matches
Hofstede’s theory, but in the limited condition of medium to high task complexity.
When considering the components of hidden work volume in the pooled workflow, there is
less rework volume than for other workflow types. This implies that the choice of which
micro-level behavior pattern leads to better performance depends on characteristics of workflow.
Specifically, if a workflow requires coordination efforts, the AM behavior pattern is more
appropriate than the JP pattern. On the other hand, if the workflow requires much rework, the JP
pattern is more suitable.
Another implication of Hofstede’s theory is that the preferred coordination mechanism can be
predicted from a power distance-uncertainty avoidance matrix. Based on case studies, the JP and
AM organization structures are close to the preferred mechanism plotted by Hofstede. Specifically,
the JP organization structure has relatively high centralization, high formalization, and a pyramid
type configuration. Hofstede also suggests that Japan is categorized with France as a type with a
full bureaucracy (pyramid model). It was appropriate to set every parameters of the AM
organization at the medium level, because America is located into the center of the diagram (Figure
7.1). This is why the divisionalized form, which has been developed in America, enjoys great
popularity (Hofstede, 1991).
Figure 7.2 shows the main framework of this model, which is comprised of three elements:
task complexity, organization structure, and micro-level behavior. There are three relationships for
predicting project performance: (1) organization structure-task complexity, (2) organization
structure-micro behavior, and (3) micro-level behavior-task complexity.
(1) Organization structure-Task complexity relationship: The simulated results
73

suggest that the AM organization structure has less tolerance for low team experience than the JP
organization structure. Additionally, the JP organization structure is robust for high task complexity.
(2) Organization structure-Micro level behavior relationship: The results show a
tendency for one’s micro-level behavior pattern to be positively correlated to one’s organization
structure, for medium-high task complexity. This tendency is confirmed by Hofstede’s proposition,
“the preferred coordination mechanism.” In the case of pooled workflow, the AM behavior pattern
showed less hidden work volume under both organization structures. Since there was very little
coordination required, the trade-off between coordination vs. rework did not exist.
(3) Micro-level behavior-Task complexity relationship: The JP behavior pattern
showed less rework than the AM pattern. The JP pattern is good at projects that are expected to
have a large volume of rework. On the other hand, the AM pattern shows less coordination
volume and wait time, and so is good for projects that are expected to need quick decision making.
(4) Balance of three elements: Changes in behavior patterns had less impact on team
performance than changes in organization structure. At this stage, the relative contributions of the
organization system or behavior pattern are unknown and cannot be analyzed quantitatively.
Using the existing VDT model limits this work, because the VDT model is not primarily
designed for assessing the impact of culture. Specifically, the simulated results show that changes in
behavior parameters do not have significant an impact on team performance. Intuitively, however,
the impact of behavior patterns may be larger than the simulated results indicate. In addition, other
parameters, such as aspiration levels, may be important factors in team performance, and should be
added.
Validation issues also remain, because of a lack of quantitative outcome data for analysis.
Although the VDT model can satisfy the three steps of a “theorem prover,” the current VDT model
has not been proven as a computational model for predicting the impact of culture using case studies.
In particular, understanding quantitative impacts will require further research.
From a technical point of view, the VDT model cannot use two coexisting behavior files in
one project, so the way that changes in the JP/AM ratio, or how a JP or AM structure affects team
74

performance, remains unknown. This thesis only focused on the qualitative impact of the different
patterns of micro-level behaviors for the two different organization structures.
Organization Structure
Culture
Practices
(2) (1) Values Project
Project Description
Micro-level Behavior
(3)
Circumstance (Team Experience)
Figure 7.2: Three columns of the model
75

Chapter 8
Conclusions Project managers in the construction industry, faced with the trend of increasing globalization,
are being confronted with many difficulties in managing culturally diverse teams. Project managers
especially need to understand and predict the impact of cultural differences on project performance.
A computational model such as the VDT model provides a useful laboratory for simulating project
performance. The current VDT model does not capture cultural factors, but the rich micro-level
behavior parameters in the VDT model provide some potential to model cultural phenomena.
Thus, one of the key goals of this work is to provide a framework to model cultural differences
emerging in global construction projects. Specifically, this thesis focuses on two cultures, Japanese
and American, and views cultural differences from two aspects, practice and value differences.
Many existing studies mention both aspects and sometimes mix them. Hofstede proposed that
the proportion of practices and values changes in conjunction with the size of the group. At the firm
and institution level, the practice aspect has a larger impact than the values, because people tend to set
informal and formal rules for managing the entire firm. Thus, practices are captured in the
organization structure at the project level. With respect to practices, the organization structure is
categorized by centralization, formalization, and configuration. Typical JP and AM firms are most
likely to use their own organization structures, based on observations and literature review. The
structure system is under managerial control, because it is relatively easy to change and modify.
With respect to value differences, Hofstede and Trompenaar provided dimensions that describe
cultural norms, beliefs, and values. These dimensions are useful for measuring the distance
between values among two nations, called the “software of the mind” (Hofstede, 1991). However,
76
the Masculinity dimension was not a significant factor in describing differences between JP and AM
firms in the construction industry. Thus, there is a possibility that this dimension may not have been
appropriately measured, depending on the professional cultures involved in a project, and the type of
industry.
This thesis considered that practice differences, which are related to the organization structure,
refer to each nation’s preference for a method of managing projects, such as the centralization,
formalization, and configuration. Value differences, which are related to the micro-level behavior,
refer to actor preferences in decision-making and coordination behavior.
The second goal of this thesis is to analyze qualitatively the impact of having a cross-cultural
team, and to confirm Hofstede’s theory of “the preferred coordination mechanism.” This theory
implies that if a nation uses its own organization structure, it will show better performance than if it
uses other types of organization structure.
The following four findings were obtained through a set of virtual experiments conducted for
this research:
(1) In the organization structure-task complexity relationship, the hidden work volume
increases according to the level of task complexity. The AM organization structure has less
tolerance for low team experience than the JP organization structure. In addition, the JP
organization structure shows high tolerance for high task complexity.
(2) The organization structure-micro level behavior relationship confirms Hofstede’s
proposition about “the preferred coordination mechanism.” Specifically, organizational
performance using the culture’s preferred patterns for micro-level behavior is positively correlated to
the preferred organization structure, in the cases of medium to high task complexity. In the case of
pooled workflow, the AM behavior pattern showed less hidden work volume for both organization
structures. This implies that the relationship between the two is affected by the task complexity.
(3) The micro-level behavior-task complexity relationship: Consider that the JP
behavior pattern showed less rework than the AM pattern. The JP pattern is preferred for a project
that is expected to have a large volume of rework. On the other hand, the AM pattern is preferred
for a project that is expected to need quick decisions, since the AM pattern shows less coordination
77

volume and wait time. Thus, the effectiveness of a behavior pattern depends on the task
characteristics.
(4) The balance of the three elements also needs to be considered. Changes in behavior
patterns have less impact on team performance than changes in organization structure. Variance
caused by the organization system or the behavior pattern is unknown at the stage and not analyzed
quantitatively.
Burton and Obel (1995) suggested that a computational model needs to satisfy three validation
steps for the model to qualify as a “theorem prover”: reality, content, and structure. The reality
validation for VDT has been proven through previous research (Levitt et al, 1994; Levitt et al, 1999).
Since the VDT model already closely represents real projects; we assert that it can be used to confirm
or reject theoretical predictions by modeling and simulating sets of idealized organizations. For
construct validity, existing parameters and variables must adequately represent theory. Since this
thesis links cultural factors and VDT parameters, based on observations and literature review, this
step is satisfied if this framework is used for qualitative analysis. The final step, criterion-related
validity, demonstrates whether the VDT model matches the purposes of the theory. Since
Hofstede’s theory of “the preferred coordination mechanism” straddles two fields, organization
theory (Mintzberg, 1980) and sociology (Hofstede, 1991), the VDT model provides a useful
laboratory to observe the qualitative predictions of the theories.
Further research will be needed to quantitatively analyze project performance. In this thesis,
the qualitative impact of cultural differences were observed and analyzed through intellective
experiments. Nonetheless, quantitative analysis remains as the next item on the agenda.
Since the current VDT model cannot use two coexisting behavior files in a project, how changes
in the JP/AM ratio (using the JP or AM structure) affect team performance is unknown. This thesis
only focused on impact of different patterns of micro-level behaviors and organization structures.
Future research will simulate joint venture organizations in which multiple behavior files (that
characterize the decision-making behaviors of participating teams from multiple countries) can be
represented and reasoned about in the same organizational model.
Extrapolating from these findings of correlation between organization structure and micro-level
78

behavior, each nation’s organization structure has been built to match its own national culture.
However, since performance depends on the characteristics and requirements of a given project,
there are cases where better performance can be attained using another culture’s preferred
organization structure. Thus, a manager needs to consider three relationships for designing project
organizations: (1) task complexity and organization structure, (2) organization structure and
micro-level behavior, and (3) micro-level behavior and task complexity.
In summary, when organizations assemble joint venture teams composed of members from
different cultures, a project manager should pay attention to the relationships among three elements:
task complexity, organization structure, and micro-level behavior. Since the task complexity is
given when a project starts and the micro-level behavior is fixed based on national culture, the
organization structure is the only variable a project manager can control. Managers can find the best
match for organization structure by virtual experimentation..
Currently, there are also intriguing and unexplored research opportunities on the impact of the
learning curve on cross-cultural teams, the optimal ratio of team members from different cultural
backgrounds, or the development of appropriate training programs. Understanding how efficient
and effective cross-cultural teams are created will, no doubt, remain an important research inquiry.
This thesis represents an initial step in that direction.
79

Appendix A: JP Behavior Pattern
Situation Training: Team
Experience JP
Team Experience L M H Individual Skill L M H Organizing Structure
Leadership Style JP
Centralization Centralized Formalization High Matrix Medium Organizational
Configuration Pyramid type
Number of Meetings
Low team Ex. = Increased
Micro Behavior
Decision Policy JP
Decision Maker Policy
Centralized
High Medium Low PM 0.75 0.3 0.2 SL 0.20 0.4 0.4 ST 0.05 0.2 0.4 DH 0.8 0.5 0.2 DM 0.2 0.5 0.8
Time to Wait for Decision
Increased
PM 576 20% SL 1152 20%
80

ST 1152 20% DH 576 40% DM 1152 40% Decision Type Different Proportion Rework Correct Ignore PM 0.50 0.45 0.05 SL 0.40 0.45 0.15 ST 0.25 0.35 0.40 DH 0.65 0.3 0.05 DM 0.05 0.35 0.6
Communication Policy
JP
Information Exchange Type
Formalization H M L
Comm 0.6 0.9 1.9 Meet 0.8 0.9 0.9 Noise 1 1 1
Information Exchange Priority
Matrix H M L
Comm 1 0.8 0.7 Meet 0.7 0.8 1 Noise 1 1 1 Increased in volume Decision Exception InfoEx Meeting Noise PM 15 35 35 0 10 SL 15 65 35 0 10 ST 15 65 35 0 10 DH 15 35 35 0 10 DM 15 65 35 0 10
Message Volume
81

Appendix B:
AM Behavior Pattern
Situation Training: Team Experience
AM
Team Experience L M H Individual Skill M Organizing Structure
Leadership Style AM
Centralization Medium Formalization Medium Matrix Medium Organizational
Configuration Flat type
Number of Meetings Low team Ex. = Increased Micro Behavior
Decision Policy AM
Decision Maker Policy
Average
High Medium Low PM 0.6 0.2 0.1 SL 0.3 0.6 0.3 ST 0.1 0.2 0.6 DH 0.8 0.5 0.2 DM 0.2 0.5 0.8
Time to Wait for Decision
Average
PM 480 SL 960 ST 960 DH 480
82

DM 960 Decision Type Average Rework Correct Ignore PM 0.65 0.3 0.05 SL 0.4 0.4 0.2 ST 0.05 0.35 0.6 DH 0.65 0.3 0.05 DM 0.05 0.35 0.6
Communication Policy
AM
Information Exchange Type
H M L
0.5 1 2 0.7 1 1 1 1 1
Information Exchange Priority
H M L
0.9 0.7 0.6 0.6 0.7 0.9 1 1 1 Message Volume Average Decision Exception InfoEx Meeting Noise PM 10 30 30 0 10 SL 10 60 30 0 10 ST 10 60 30 0 10 DH 10 30 30 0 10 DM 10 60 30 0 10
83

Appendix C:
1.1 Pooled Workflow
JP Org. Structure AM Org. Structure
1.2 Sequential Workflow
JP Org. Structure AM Org. Structure
84

1.3 Reciprocal Workflow
JP Org. Structure AM Org. Structure
1.4 Intensive Workflow
JP Org. Structure AM Org. Structure
85

References Baligh, H., and R. Burton (1981), “Describing and Designing Organizational Structure and Process”,
International Journal of Policy Analysis Information Systems 5, 251-266.
Baligh, H., and W. Damon, (1980), "Foundation for a Systematic Process of Organization Structure Design",
Journal of Information and Optimization Sciences, 1 (2) , May 1980, pp. 133-165.
Bells and Kozlowski (2002) missing ref from p 80. ***
Burton, R. M., J. Lauridsen, and B. Obel (2002), “Return on Assets Loss from Situational and Contingency
Misfits,” Management Science, 48-11. 1461-1485.
Burton, R. M and B. Obel (1995), “The Validity of Computational Models in Organization Science: From
model realism to purpose of the model,” Computational and Mathematical Organization Theory, 1.
57-71.
Clough, R. C., G. Sears and S. Sears, (2000), Construction Project Management, 4th ed.,, John Wiley & Sons
Inc., New York, NY.
Feldman, D.C. and H. J. Arnold (1983), “Managing Individual and Group Behavior in Organizations,” New
York, NY: McGraw-Hill.
Galbraith, J. (1974), “Organization design: An information processing view”, INTERFACES 4
Galbraith, J. (1977), “Organization design”, Addison-Wesley, New York, NY
Graham, J. L., and Sano, Y. (1984), “Smart Bargaining: Doing Business with the Japanese”, Ballinger Publish
Inc., Cambridge, MA.
Hofstede, G. (1991), “Cultures and Organizations: Software of the Mind, Intercultural Cooperation and its
Importance for Survival,” New York, NY: McGraw-Hill.
86

Jin, Y. and R.E. Levitt (1996), “The Virtual Design Team: A computational model of project organizations,”
Computational and Mathematical Organization Theory, 2(3), 171-196.
Kunz, J. C., Christiansen, T. R., Cohen, G. P., Jin, Y., and Levitt, R. E. (1998), “The virtual design team: A
computational simulation model of project organizations”, Communications of the Association for
Computing Machinery (CACM), 41(11)
Levitt, R. E., G. P. Cohen, J. C. Kunz, C. I. Nass, T. Christiansen, and Y. Jin (1994), “The Virtual Design Team:
Simulating How Organization Structure and Information Processing Tools affect Team Performance”,
in Carley, K. M. and M. J. Prietula, editors, Computational Organization Theory, Lawrence Erlbaum,
Associates, Publishers, Hillsdale, NJ.
Levitt, R. E., J. Thomsen, T. R. Christiansen, J C. Kunz, Y. Jin, and C. Nass, (1999), “Simulating Project Work
Processes and Organizations: Toward a Micro-Contingency Theory of Organizational Design,”
Management Science 45 (11), November, 1999, pp1479-1495.
Levitt, R. E., M. Fyall, P. Bjornsson, W. Hewlett, III, T. Casebolt, “When Information Flow in Project
Organizations Becomes Turbulent: Toward an Organizational Reynolds Number,” Proceedings of the
Conference on Agent-Based-Modeling in the Social Sciences, UCLA Lake Arrowhead Conference
Center, May 2002, p3
Malone, T. (1987), “Modeling Coordination in Organizations and Markets”, in Management Science, 33,
1317-1332.
Masahiko Aoki, “Decentralization-Centralization in Japanese Organization: A Duality Principle”, the Political
Economy of Japan, Stanford University Press, 1992,.
Mintzberg, H. (1980), “Structure in 5’s: A Synthesis of the Research on Organization Design,” Management
Science, 26-3, 322-341.
Nasrallah, W. F., and Levitt, R. E. (2001), “An Interaction Value Perspective on Firms of Differing Size”,
Computational and Mathematical Organiation Theory, 7(2): 113-144
Nasrallah, W. F., Levitt, R. E., and Glynn, P. (1998), “Diversity and Popularity in Organizations and
87

Communities”, Computational and Mathematical Organization Theory, 4(4): 347-372.
Schein, E., (1992), Organizational Culture and Leadership,2nd ed, Jossey Bass, San Francisco.
Spradley, P. J. (1979), “The ethnographic interview”, Holt, Rinehart and Winston Inc., New York, NY.
Taylor C. and Stacy B., “Managing cultural diversity”, Academy of Management Executive, Vol 5, 1991,
45-55
Thompson, J. D. (1967), “Organization in action: Social Science Bases in Administrative Theory”,
McGraw-Hill, New York, NY.
Trompenaar, Alfons, (2004), Managing People Across Cultures, Capstone, Ltd., paperback.
Wong, S.S and Burton, R. M. (2000), “Virtual Teams: What are their characteristics, and impact on team
performance?” Computational and Mathematical Organization Theory, 6, 339-360
Yanagida, Y., Foote, H. D., Edward S. J, Jr., Ramseyer, J. M., and Hugh T. S., Jr. (1994), “Law and Investment
in Japan”, Harvard University Press, Cambridge, MA.
Vasantha Abeysekera (2001), “Understanding ‘Culture’ in an international construction context,” Perspective
on Culture in Construction, CIB publication No. 275, 39-51
88