cross-national research and data analysis
TRANSCRIPT

Cross-National
Research and Data
Analysis
Session 7

International Marketing - 2010
Session 7 – page 2
Primary Data
Agenda
Problem
Definition
Research
Design
Measurement
Scaling
Questionnaire
Construction
Sampling Fieldwork Data
Analysis
Secondary Data
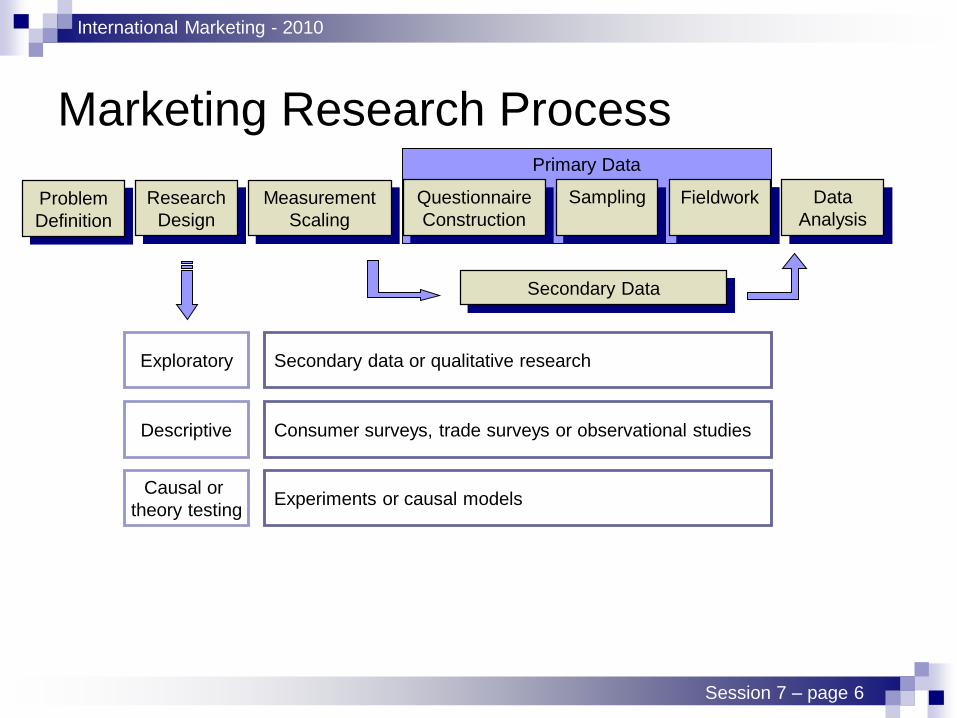
Marketing Research Process:

International Marketing - 2010
Session 7 – page 3
Fraction of Customers Having Churned over the
Last 6 Months (2007)
BMC CHURN INDEX SURVEY 2007

International Marketing - 2010
Session 7 – page 4BMC CHURN INDEX SURVEY 2007
Fraction of Customers Having Churned by
Industry (Europe - 2007)

International Marketing - 2010
Session 7 – page 5
Primary Data
Marketing Research Process
Problem
Definition
Research
Design
Measurement
Scaling
Questionnaire
Construction
Sampling Fieldwork Data
Analysis
Decision
Problem
Research
Problem
Example: Decide on action w.r.t. customer attrition in Europe
Example: What are the drivers of (causes for) customer attrition?
Management level: Corporate
Regional
Local
Decision type Strategic: market entry, segmentation, positioning
Tactical: marketing mix decisions based on the strategic options
Secondary Data
Unit of
analysisWorld, regions, trade blocs, countries, cities, … within-country homogeneity ?
International Marketing - 2010
Session 7 – page 6
Marketing Research Process
Problem
Definition
Research
Design
Measurement
Scaling
Questionnaire
Construction
Sampling Fieldwork Data
Analysis
Exploratory
Causal or
theory testing
Descriptive
Secondary data or qualitative research
Consumer surveys, trade surveys or observational studies
Experiments or causal models
Primary Data
Questionnaire
Construction
Sampling Fieldwork
Secondary Data

International Marketing - 2010
Session 7 – page 7
Marketing Research Process
Problem
Definition
Research
Design
Measurement
Scaling
Questionnaire
Construction
Sampling Fieldwork Data
Analysis
Qualitative research
Focus groups
8 to 10 consumers and a moderator
Video, one-way mirror
Mainly for product policy decisions (ideas for new products)
PROS: Inexpensive, quick
CONS: Unrepresentative sample
Exploratory
Primary Data
Questionnaire
Construction
Sampling Fieldwork
Secondary Data

International Marketing - 2010
Session 7 – page 8
An Example: Coke Light – Coke Zero
Who still remembers the Coca-Cola-commercial on the
11.30 am arrival in the office of the coke light delivery
guy?
Aim: Coke Light is trendy, sexy and refreshing
Focus Group
Coke is associated with sexiness but as side effect of the
commercial, also with a feminine consumption of the brand (few
male consumers)
Solution found: Coke Zero

International Marketing - 2010
Session 7 – page 9
Marketing Research Process
Problem
Definition
Research
Design
Measurement
Scaling
Questionnaire
Construction
Sampling Fieldwork Data
Analysis
Consumer surveys
Larger groups (> 500)
Random samples
Via mail, phone, e-mail, internet, in person
Mainly for ads (pretest, post test, recall scores, media habits), promotion (responses to promotion), segmentation and positioning (consumer habits, product benefits), satisfaction measurement, competition evaluation
Exploratory
Descriptive
Primary Data
Questionnaire
Construction
Sampling Fieldwork
Secondary Data
International Marketing - 2010
Session 7 – page 10
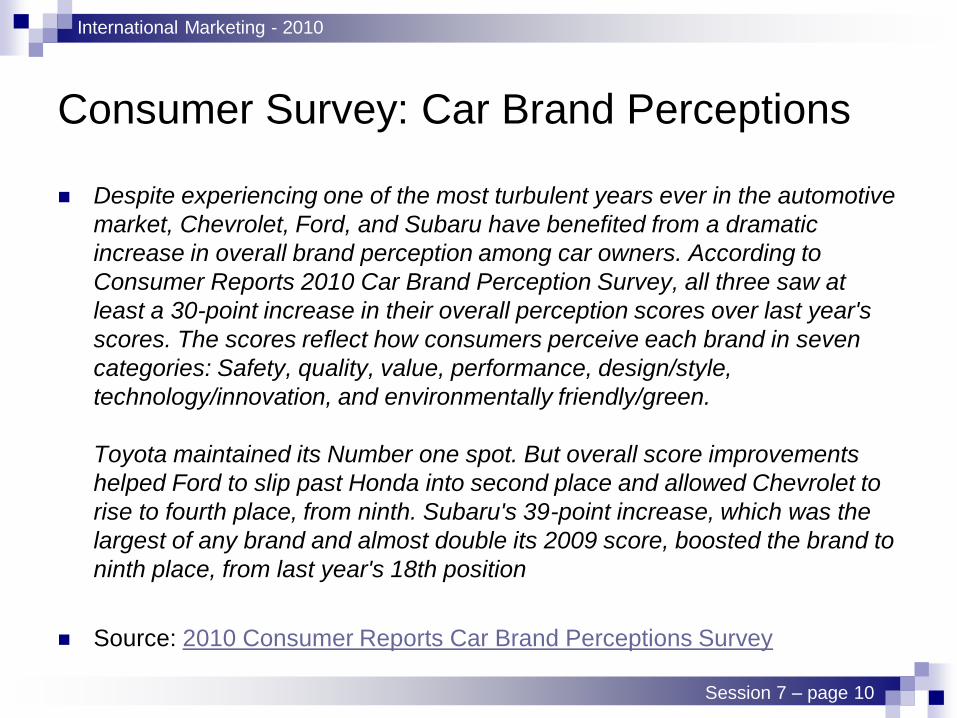
Consumer Survey: Car Brand Perceptions
Despite experiencing one of the most turbulent years ever in the automotive
market, Chevrolet, Ford, and Subaru have benefited from a dramatic
increase in overall brand perception among car owners. According to
Consumer Reports 2010 Car Brand Perception Survey, all three saw at
least a 30-point increase in their overall perception scores over last year's
scores. The scores reflect how consumers perceive each brand in seven
categories: Safety, quality, value, performance, design/style,
technology/innovation, and environmentally friendly/green.
Toyota maintained its Number one spot. But overall score improvements
helped Ford to slip past Honda into second place and allowed Chevrolet to
rise to fourth place, from ninth. Subaru's 39-point increase, which was the
largest of any brand and almost double its 2009 score, boosted the brand to
ninth place, from last year's 18th position
Source: 2010 Consumer Reports Car Brand Perceptions Survey

International Marketing - 2010
Session 7 – page 11
Marketing Research Process
Problem
Definition
Research
Design
Measurement
Scaling
Questionnaire
Construction
Sampling Fieldwork Data
Analysis
Trade surveys
Individuals in the distribution channels and trade associations
Personal experience – speculation : first-step
PROS: quick, first overview to guide future research
CONS: highly subjective
Exploratory
Descriptive
Primary Data
Questionnaire
Construction
Sampling Fieldwork
Secondary Data

International Marketing - 2010
Session 7 – page 12
Marketing Research Process
Problem
Definition
Research
Design
Measurement
Scaling
Questionnaire
Construction
Sampling Fieldwork Data
Analysis
Observational studies
Direct observation of customers, their choices and behavior
PROS: actual behavior, not reported
CONS: collect data, research skills
Exploratory
Descriptive
Primary Data
Questionnaire
Construction
Sampling Fieldwork
Secondary Data
International Marketing - 2010
Session 7 – page 13
Marketing Research Process
Problem
Definition
Research
Design
Measurement
Scaling
Questionnaire
Construction
Sampling Fieldwork Data
Analysis
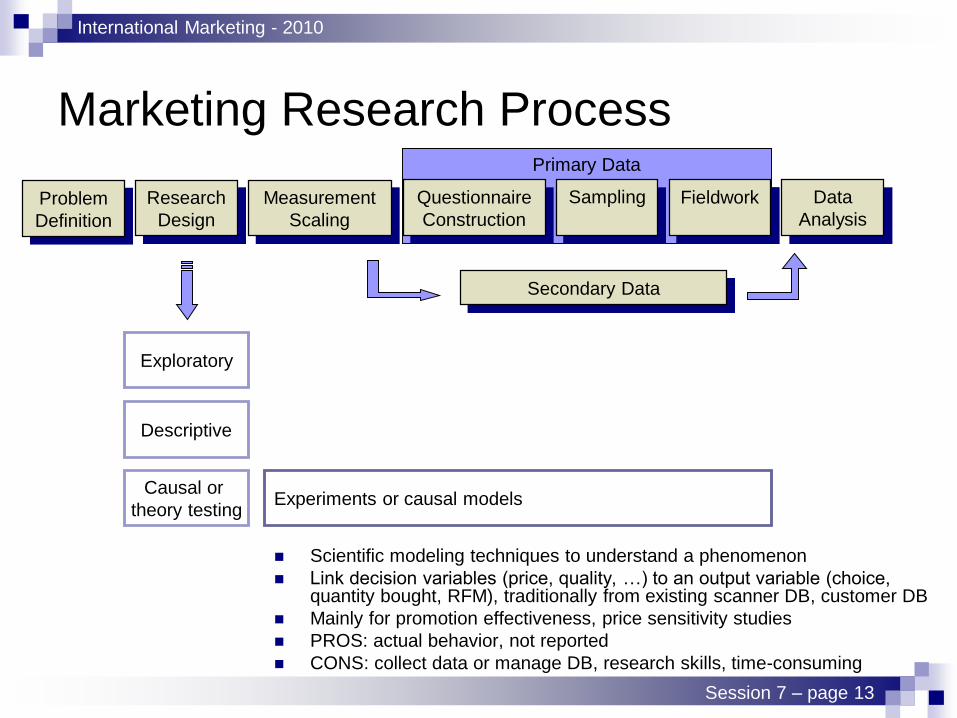
Experiments or causal models
Scientific modeling techniques to understand a phenomenon
Link decision variables (price, quality, …) to an output variable (choice, quantity bought, RFM), traditionally from existing scanner DB, customer DB
Mainly for promotion effectiveness, price sensitivity studies
PROS: actual behavior, not reported
CONS: collect data or manage DB, research skills, time-consuming
Exploratory
Causal or
theory testing
Descriptive
Primary Data
Questionnaire
Construction
Sampling Fieldwork
Secondary Data

International Marketing - 2010
Session 7 – page 14
Scanner Data in Practice
Practitioners reported that scanner data analysis has […] been most widely
adopted for decision making in consumer promotions (i.e.,coupons), trade
promotions, and pricing. For example, logit and regression models applied
to scanner data have revealed very low average consumer response to
coupons which has directly led to reduced couponing activity.
In the case of new product decisions, scanner data use has been slow to
develop due to the inherent limitations of historical data for these decisions.
In advertising, scanner data is widely analyzed with models, but confusion
among practitioners is very high due to controversies about methods and
conflicting results.
Bucklin and Gupta (1999), Marketing Science

International Marketing - 2010
Session 7 – page 15
Use of Data Mining / Artificial
Intelligence Techiques in Marketing
Lemmens & Croux 2006
International Marketing - 2010
Session 7 – page 16
Marketing Research Process
Problem
Definition
Research
Design
Measurement
Scaling
Questionnaire
Construction
Sampling Fieldwork Data
Analysis
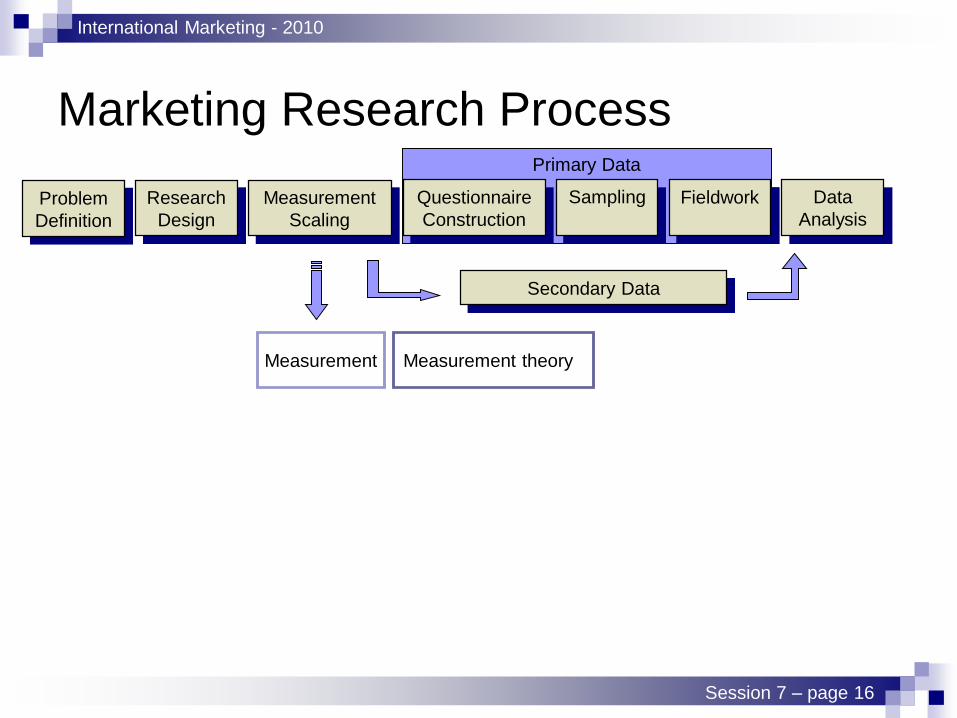
Measurement Measurement theory
Primary Data
Questionnaire
Construction
Sampling Fieldwork
Secondary Data

International Marketing - 2010
Session 7 – page 17
Measurement Theory
Concept Service quality
Construct
Discrepancy between a customer's
expectations for a service offering
and the customer's perceptions of the
service received
•Service tangibles
•Service reliability
•Service responsiveness
•Service assurance
•Service empathy
Concept = An abstraction formed by generalization about particulars,
e.g. mass, strength, love, advertising effectiveness, customer attitude.
Construct = An observable,
measurable concept
(conscious inventions of
researchers)
International Marketing - 2010
Session 7 – page 18
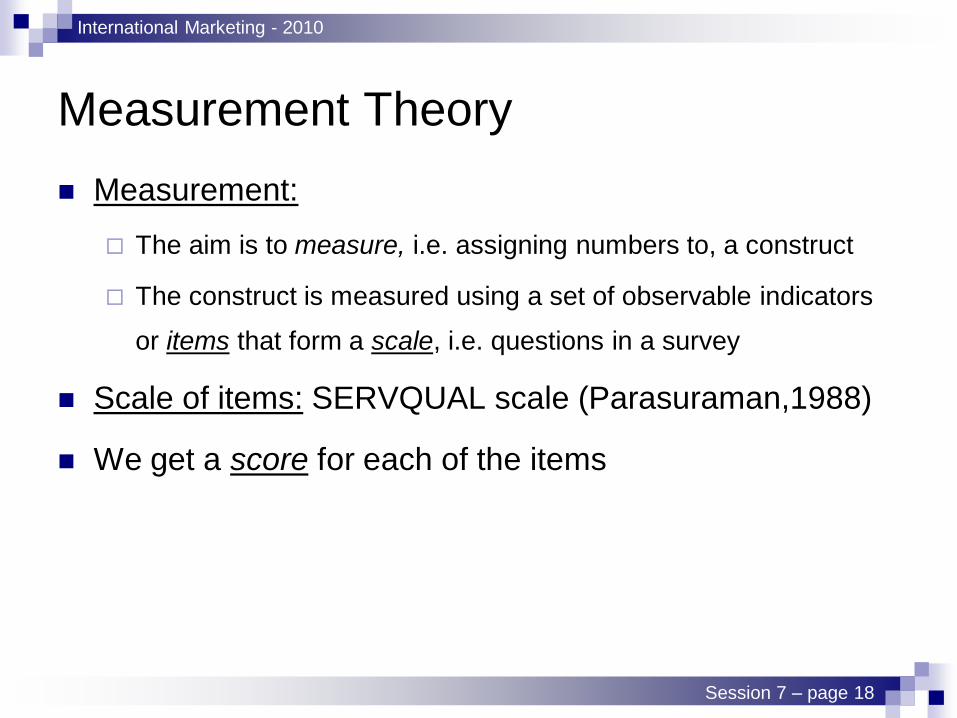
Measurement Theory
Measurement:
The aim is to measure, i.e. assigning numbers to, a construct
The construct is measured using a set of observable indicators
or items that form a scale, i.e. questions in a survey
Scale of items: SERVQUAL scale (Parasuraman,1988)
We get a score for each of the items
International Marketing - 2010
Session 7 – page 19
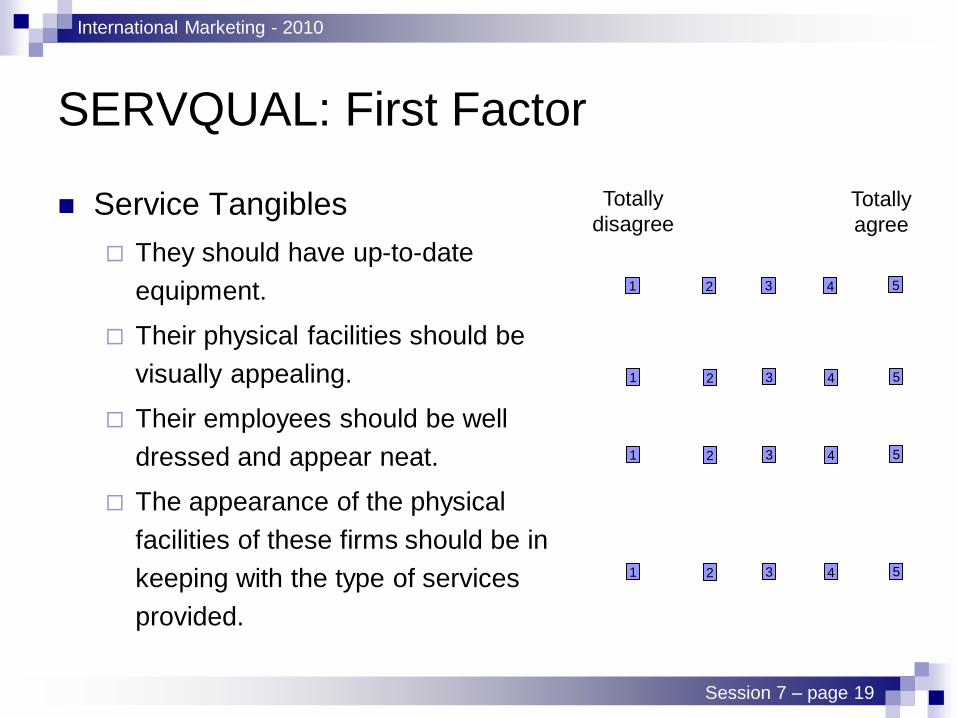
SERVQUAL: First Factor
Service Tangibles
They should have up-to-date
equipment.
Their physical facilities should be
visually appealing.
Their employees should be well
dressed and appear neat.
The appearance of the physical
facilities of these firms should be in
keeping with the type of services
provided.
1 2 3 4 5
1 2 3 4 5
1 2 3 4 5
1 2 3 4 5
Totally
disagreeTotally
agree

International Marketing - 2010
Session 7 – page 20
SERVQUAL: Second Factor
Service Reliability
When these firms promise to do
something by a certain time,
they should do so.
When customers have
problems, these firms should be
sympathetic and reassuring.
These firms should be
dependable.
They should provide their
services at the time they
promise to do so.
They should keep their records
accurately.
1 2 3 4 5
1 2 3 4 5
1 2 3 4 5
1 2 3 4 5
Totally
disagreeTotally
agree
1 2 3 4 5

International Marketing - 2010
Session 7 – page 21
Measurement Theory
Reliability = Constance/consistency of the answers over
time and across individuals
Validity = Does the answers reflect the actual state / true
answer
= observed answer
= true/actual answer
= systematic error
= random error RST
ST
T
XXXX
XXX
XX
0
0
0
R
S
T
X
X
X
X 0
Systematic variance Error variance
Perfect validity:
Not valid but
Perfect reliability:
Not valid and not
reliable:
RST XVarXVarXVarXVar 0
International Marketing - 2010
Session 7 – page 22
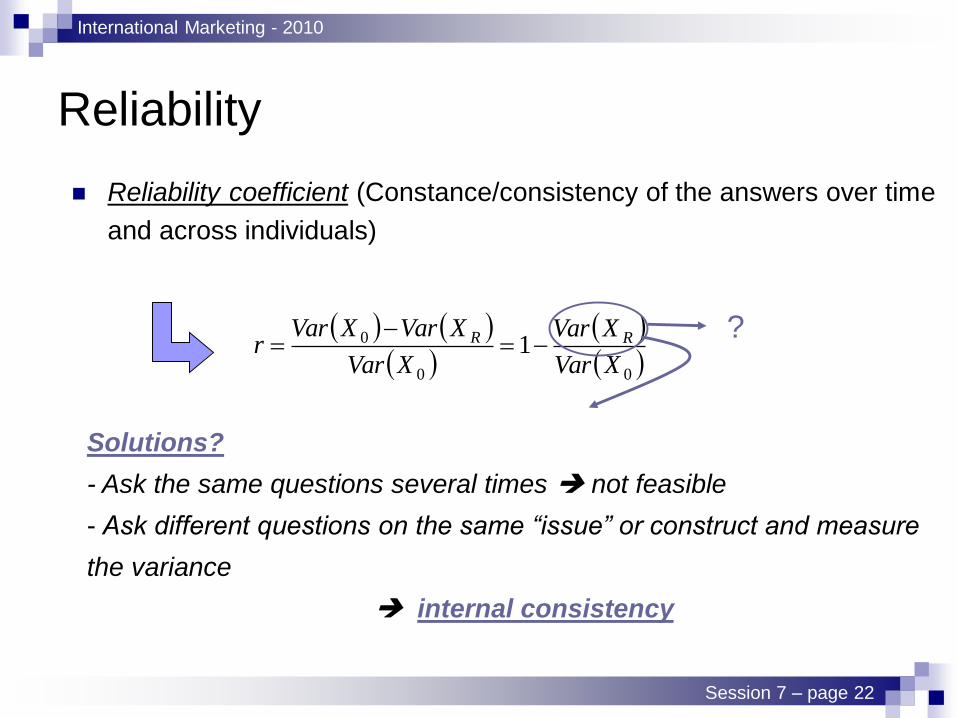
Reliability
Reliability coefficient (Constance/consistency of the answers over time
and across individuals)
00
0 1XVar
XVar
XVar
XVarXVarr RR
?
Solutions?
- Ask the same questions several times not feasible
- Ask different questions on the same “issue” or construct and measure
the variance
internal consistency

International Marketing - 2010
Session 7 – page 23
Reliability (II)
Internal consistency of the construct = Cronbach α
Construct
Question / Item 1
Question / Item 2
Question / Item 3
Question / Item 4…
11
k
k
ncorrelatio item-inter average
itemsquestions/number
k
! Cronbach α is ideally higher than 0.7

International Marketing - 2010
Session 7 – page 24
Service Quality SERVQUAL

International Marketing - 2010
Session 7 – page 25
Cross-National Equivalence
Is a construct’s scale equivalent across countries? The concepts, behaviors or objects should be interpreted equivalently:
(conceptual equivalence)
E.g. concepts of “well-dressed”, “timely”, …
Measures should be calibrated equivalently: (calibration equivalence)
Equivalence in monetary units, distance, volume, color, shape…
E.g. US $ vs. ₤
Questions should be translated such that they remain equivalent:
(translation equivalence)
Forward translation & back translation
Score should have the same interpretation: (score equivalence)
Equivalence of the observed scores on the measures
See Response biases on the next slide!

International Marketing - 2010
Session 7 – page 26
Response Biases
Respondents are influenced by content-irrelevant factors
Response styles/biases:
Social acquiescence or Yes-saying: tendency to agree with items regardless of content
Social disacquiescence: tendency to disagree with items regardless of content
Net acquiescience or directional bias: tendency to agree more than disagree regardless of content
Extreme responding: tendency to endorse the most extreme response categories regardless of content
Response range: tendency to use a narrow or wide range of response categories around the mean
Midpoint responding: tendency to use the middle scale category regardless of content
Noncontingent responding: tendency to respond to items carelessly, randomly or non purposefully
Social desirability: tendency to give the socially desirable response rather than describe what they actually think, believe or do.
Question order: tendency to favor response categories because of their position in a list
International Marketing - 2010
Session 7 – page 27
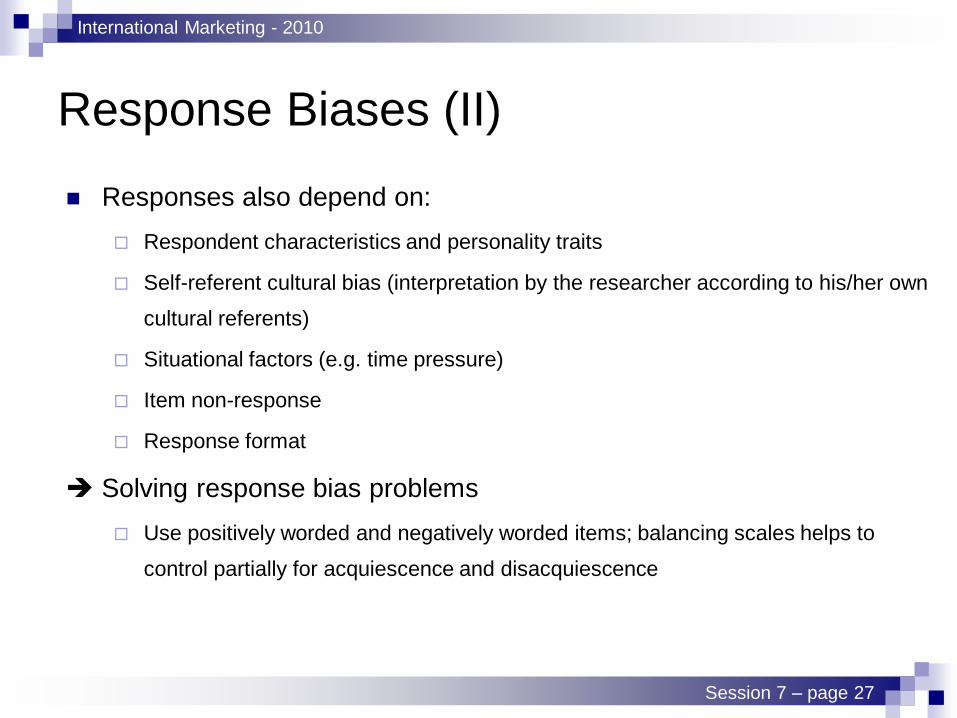
Responses also depend on:
Respondent characteristics and personality traits
Self-referent cultural bias (interpretation by the researcher according to his/her own
cultural referents)
Situational factors (e.g. time pressure)
Item non-response
Response format
Solving response bias problems
Use positively worded and negatively worded items; balancing scales helps to
control partially for acquiescence and disacquiescence
Response Biases (II)

International Marketing - 2010
Session 7 – page 28
Marketing Research Process
Problem
Definition
Research
Design
Measurement
Scaling
Questionnaire
Construction
Sampling Fieldwork Data
Analysis
Measurement
Scaling
Measurement errors
Types of scales
Primary Data
Questionnaire
Construction
Sampling Fieldwork
Secondary Data
Basic scales of measurement
Nominal: e.g. gender? Male or female
Ordinal: e.g. rank brand according to an attribute
Interval: e.g. visits frequency to that store
One of the most well-known types of scale: Likert scales:
Strongly agree Agree Neither agree or disagree Disagree Strongly disagree

International Marketing - 2010
Session 7 – page 29
Example
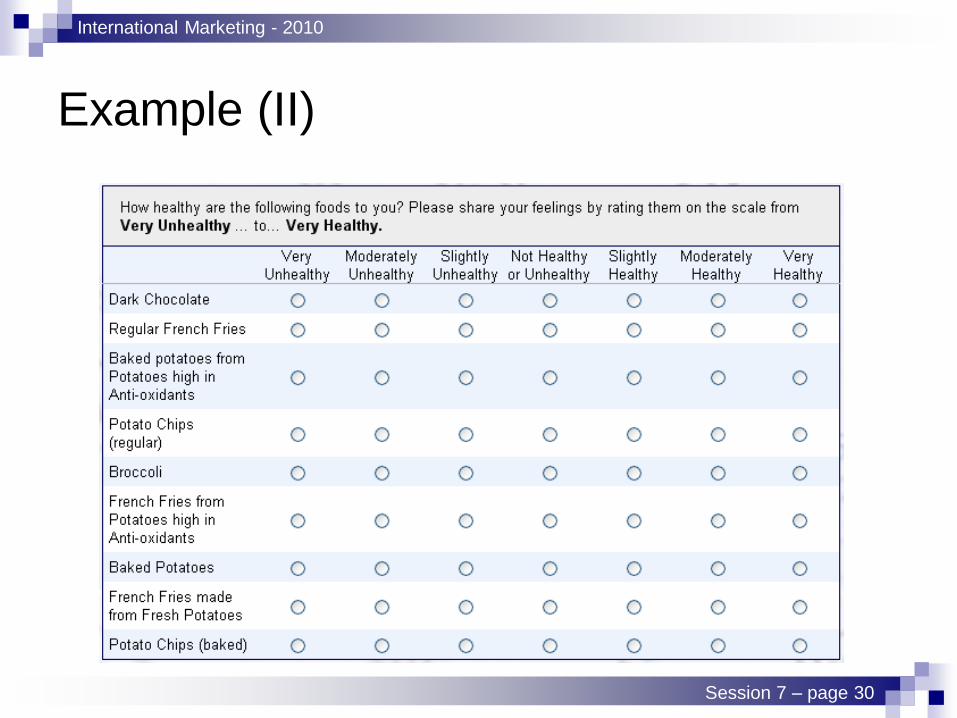
International Marketing - 2010
Session 7 – page 30
Example (II)
International Marketing - 2010
Session 7 – page 31
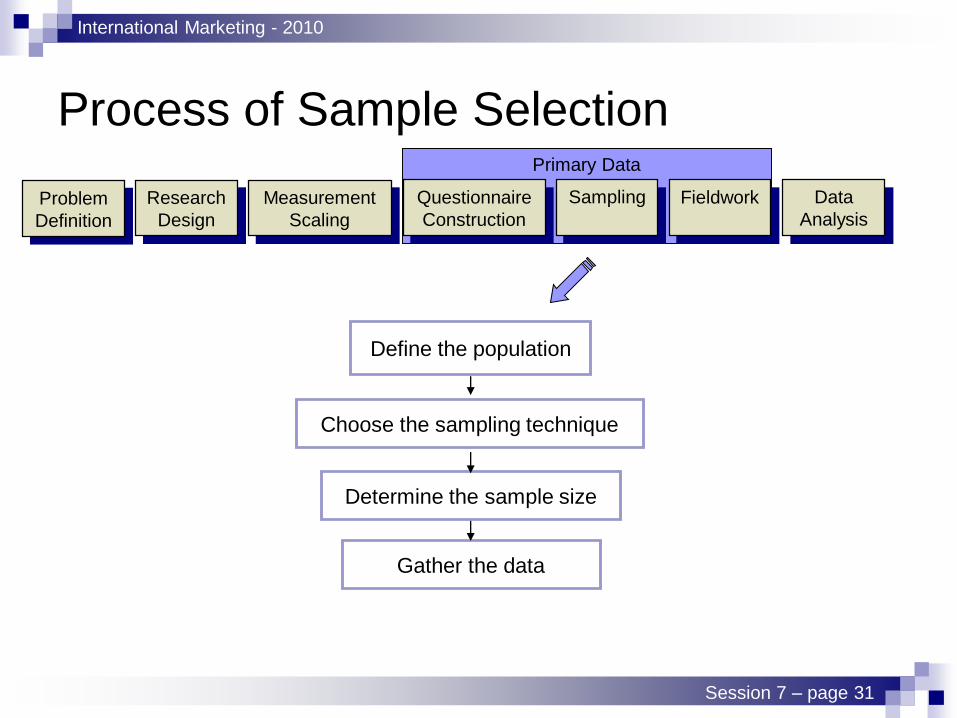
Process of Sample Selection
Define the population
Choose the sampling technique
Determine the sample size
Gather the data
Primary Data
Problem
Definition
Research
Design
Measurement
Scaling
Questionnaire
Construction
Sampling Fieldwork Data
Analysis
International Marketing - 2010
Session 7 – page 32
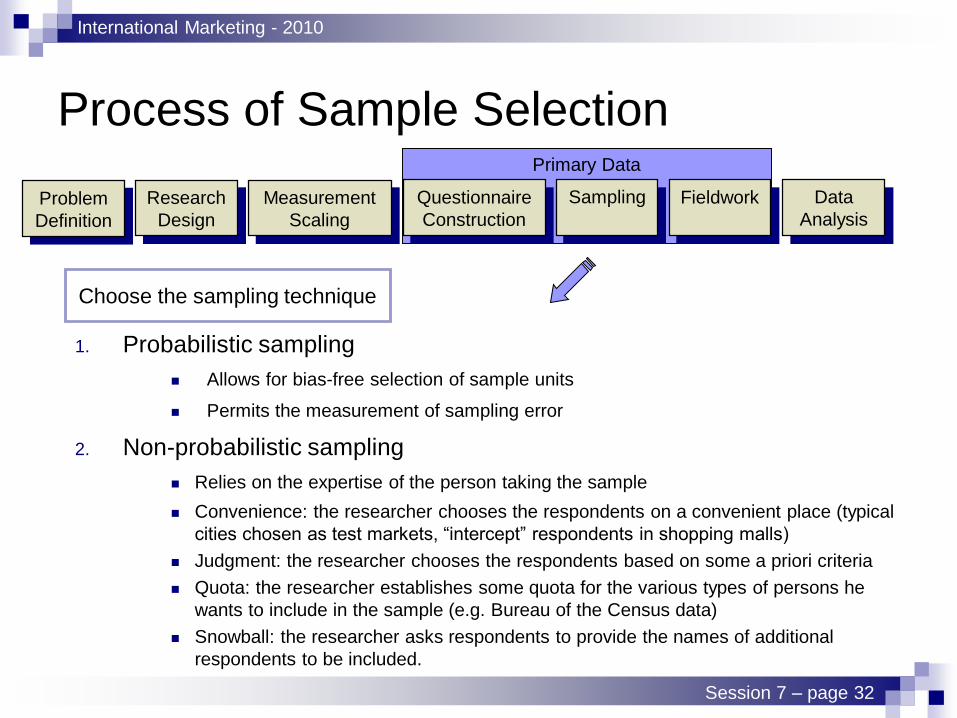
Process of Sample Selection
1. Probabilistic sampling
Allows for bias-free selection of sample units
Permits the measurement of sampling error
2. Non-probabilistic sampling
Relies on the expertise of the person taking the sample
Convenience: the researcher chooses the respondents on a convenient place (typical
cities chosen as test markets, “intercept” respondents in shopping malls)
Judgment: the researcher chooses the respondents based on some a priori criteria
Quota: the researcher establishes some quota for the various types of persons he
wants to include in the sample (e.g. Bureau of the Census data)
Snowball: the researcher asks respondents to provide the names of additional
respondents to be included.
Primary Data
Problem
Definition
Research
Design
Measurement
Scaling
Questionnaire
Construction
Sampling Fieldwork Data
Analysis
Choose the sampling technique

International Marketing - 2010
Session 7 – page 33
Primary Data
Fieldwork
Problem
Definition
Research
Design
Measurement
Scaling
Questionnaire
Construction
Sampling Fieldwork Data
Analysis
Market Research
Company
Top Global Research Companies
1. VNU – AC Nielsen (NL) www.vnu.com
2. Taylor Nelson Sofres (UK) www.tns-global.com
3. IMS Health (US) www.imshealth.com
4. Kantar Group (US) www.kantargroup.com
5. Gfk Group (GE) www.gfk.com
6. Ipsos Group (FR) www.ipsos.com
…

International Marketing - 2010
Session 7 – page 34
Secondary Data
Problem
Definition
Research
Design
Measurement
Scaling
Questionnaire
Construction
Sampling Fieldwork Data
Analysis
Primary Data
Questionnaire
Construction
Sampling Fieldwork
Secondary Data
Ready availability
Low cost compared to primary data
As a first step (overview) to be
completed by detailed primary data
Data accuracy and equivalence issues
Main Secondary Data Sources
See www.internetworldstats.com/sources.htm
US Department of Commerce
www.stat-usa.gov
GlobalEDGE – Michigan State University
www.ciber.msu.edu
United Nations www.un.org
World Bank www.worldbank.org
OECD www.oecd.org
EU Commission www.europa.eu.int
CIA World Factbook
IMF International Financial Stats
Euromonitor www.euromonitor.com

International Marketing - 2010
Session 7 – page 35
Data Analysis
Cross-tabulation
T-tests
Analysis of variance
Analysis of covariance
Multivariate analysis of covariance
Multiple regression
Hierarchical linear models
Multiple discriminant analysis
Correlation analysis
Cluster analysis
Multidimensional scaling
Factor analysis
Confirmatory factor analysis
…
Problem
Definition
Research
Design
Measurement
Scaling
Questionnaire
Construction
Sampling Fieldwork Data
Analysis
Primary Data
Questionnaire
Construction
Sampling Fieldwork
See “Market Research and Analysis” (Dr. Vijay)
All methods are available in SPSS