cross-scale feedbacks and scale mismatches as influences on
TRANSCRIPT

INVITED FEATURE: PROTECTED AREAS AS SOCIOECOLOGICAL SYSTEMS
Ecological Applications, 25(1), 2015, pp. 11–23� 2015 by the Ecological Society of America
Cross-scale feedbacks and scale mismatches as influenceson cultural services and the resilience of protected areas
KRISTINE MACIEJEWSKI,1,3 ALTA DE VOS,1 GRAEME S. CUMMING,1 CHRISTINE MOORE,1 AND DUAN BIGGS2
1Percy FitzPatrick Institute, DST/NRF Centre of Excellence, University of Cape Town, Rondebosch, Cape Town 7701 South Africa2Australian Research Council Centre of Excellence for Environmental Decisions, Centre for Biodiversity and Conservation Science,
University of Queensland, Brisbane, Queensland 4072 Australia
Abstract. Protected areas are a central strategy for achieving global conservation goals, buttheir continued existence depends heavily on maintaining sufficient social and political support tooutweigh economic interests or othermotives for land conversion. Thus, the resilience of protectedareas can be considered a function of their perceived benefits to society. Nature-based tourism(NBT), a cultural ecosystem service, provides a key source of income to protected areas,facilitating a sustainable solution to conservation. The ability of tourism to generate incomedepends, however, on both the scales at which this cultural service is provided and the scales atwhich tourists respond to services on offer. This observation raises a set of location-, context-, andscale-related questions that need to be confronted before we can understand and value culturalservice provision appropriately.We combine elements of resilience analysis with a systems ecologyframework and apply this to NBT in protected areas to investigate cross-scale interactions andscale mismatches. We postulate that cross-scale effects can either have a positive effect onprotected area resilience or lead to scale mismatches, depending on their interactions with cross-scale feedbacks. To demonstrate this, we compare spatial scales and nested levels of institutions todevelop a typology of scale mismatches for common scenarios in NBT. In our new typology, theseverity of a scalemismatch is expressed as the ratio of spatial scale to institutional level, producing25 possible outcomes with differing consequences for system resilience. We predict that greaterdifferences between interacting scales and levels, and greater magnitudes of cross-scaleinteractions, will lead to greater magnitudes of scale mismatch. Achieving a better understandingof feedbacks and mismatches, and finding ways of aligning spatial and institutional scales, will becritical for strengthening the resilience of protected areas that depend on NBT.
Key words: cultural ecosystem services; ecological scale; institutional level; nature-based tourism; park;protected areas as socioecological systems; reserve; scale mismatch; socioecological system; spatial resilience.
INTRODUCTION
Protected areas are central to conservation, with many
conservation strategies relying on maintaining and
expanding protected areas and networks of protected
areas to counter increasing pressure on biodiversity.
Although the importance of protected areas is widely
acknowledged by conservation biologists (Margules and
Pressey 2000, Chape et al. 2005), setting aside or
maintaining areas for conservation may be controversial.
Certain cases of protected area establishment have
occurred without due process or sufficient consideration
of the rights and existing claims of local communities
(Orlove and Brush 1996, Agrawal and Gibson 1999,
Berkes 2004). Additionally, maintaining protected areas
that include land containing desirable natural resources or
that are located in desirable areas for urban development
is increasingly difficult (Cohn 2011). The creation and
maintenance of protected areas in the postcolonial era
thus depends heavily on negotiation and compromise.
Furthermore, once areas have been formally listed as
protected, they must be managed and maintained.
Enforcing regulations andmaintaining access to protected
areas requires not only political will and active engage-
ment by stakeholders, but also income, making them a
potential burden on society. Protected area management
and enforcement is thus subject to the demands and
requirements of the stakeholder community.
Manuscript received 7 December 2013; revised 20 June 2014;accepted 27 June 2014. Corresponding Editor: E. Nelson.
Editors’ Note: Papers in this Invited Feature will bepublished individually, as soon as each paper is ready. Oncethe final paper is complete, a virtual table of contents withlinks to all the papers in the feature will be available at: www.esajournals.org/loi/ecap
3E-mail: [email protected]
11

When most people think about protected areas they
envisage long-standing, iconic places, such as Yellow-
stone National Park in the USA. These parks appear in
the public imagination as fixed, immovable, and
constant. Not all protected areas, however, enjoy the
same prestige or institutional protection. Many pro-
tected areas are considerably more vulnerable to the
winds of political, social, and economic change (Biggs
2011, Mascia and Pailler 2011, Biggs et al. 2014;
Cumming et al., in press). Therefore, a resilience-based
approach to understanding and managing protected
areas is useful as it draws attention to the ability of the
system to maintain its identity in the face of disturbances
and unpredictable change (Adger 2000, Gunderson and
Holling 2002).
If we accept that the resilience of protected areas is
dependent in part on their perceived benefits to society,
understanding and quantifying those benefits becomes
important. The existence of some protected areas can be
fully justified in economic terms, as demonstrated
through cost–benefit analyses of direct returns (Naidoo
and Rickets 2006, O’Farrell et al. 2011). Further, recent
focus has been primarily on regulating and provisioning
services, i.e., carbon storage, pollinator populations, or
the contributions made by headwater parks to down-
stream water quality and quantity (Turner et al. 2012).
By quantifying the services that protected areas provide,
benefits to society can be justified in economic terms
(Hughes et al. 2005). However these regulating and
provisioning services may not be enough to justify land
conversion, and thus, many protected areas depend
heavily on maintaining social and political support to
outweigh economic or other motives for land conver-
sion. For example, protected areas that sit on precious
mineral resources or fertile farmland may be forced to
periodically justify their existence and continued oppor-
tunity costs.
While it is acknowledged that protected areas provide
cultural services, such as aesthetic and recreational
value, and spiritual experiences (Millennium Ecosystem
Assessment 2005), these cultural benefits are not often
formally included in cost-benefit analyses (De Groot et
al. 2002). One reason for this is the difficulty of
quantifying attitudes that may vary widely and sub-
jectively across the human population (van Jaarsveld et
al. 2005, Daniel et al. 2012).
Cultural ecosystem services are the nonmaterial
benefits that people obtain from ecosystems. They
include recreational value, spiritual and religious values,
educational values, inspiration, aesthetic values, social
relations, sense of place, cultural heritage values, and
ecotourism (Millennium Ecosystem Assessment 2005).
In protected areas, most of these services are experienced
when people undertake nature-based tourism (hereafter,
NBT). NBT offers an important connection between
protected area management, protected area resilience,
and cultural services because it provides a key source of
revenue (Chase et al. 1998, Dharmaratne et al. 2000,
Daniel 2012) and a strong financial incentive to manage
biodiversity sustainably and make cultural services
accessible (Kruger 2005, Weaver and Lawton 2007).
The income derived from NBT can be used to assess
cultural services and quantify their economic value in
protected areas (Lee 1997, Naidoo et al. 2011, O’Farrell
et al. 2011, Egoh et al. 2012). Each park entry can be
viewed as a willingness to pay for the services that the
park offers (Chase et al. 1998), and thus, management
may be heavily influenced by tourist needs and demands.
As a result, tourism data provide a potentially insightful
means for exploring NBT-related cultural service
provisions, the socioecological interactions that drive
NBT-related cultural services, and the potential role of
NBT-related cultural services in protected area resil-
ience.
There is considerable interest from the conservation
community in the idea that NBT may provide sufficient
income to justify the costs of setting land aside for
protection (Dharmaratne et al. 2000, Kiss 2004). The
assumption that NBT will provide an economic solution
for a particular protected area is, however, heavily
dependent on the level of NBT-related cultural service
that the area provides (Gelcich et al. 2013). In
considering NBT-related cultural service provision, it
is important to recognize that cultural services are
coproduced by the ecosystem and the socioeconomic
system, a service requires demand for it to be considered
a service (Biggs et al. 2014).
The coproduction of cultural services means that
mapping out a service production chain from ecosystem
element to socioeconomic benefit is a problem. The
potential socioeconomic benefits of tourism are only
realized if cultural services are taken advantage of, much
as a shoe shop only makes money by selling shoes,
regardless of the quality of its product. The same
waterfall in two different protected areas, for example,
might generate a lot of income in an area that is situated
near a highway and little income in another area, which
is difficult to access. Similarly, the ability of tourism to
generate income depends on both the scales at which
cultural services are provided and the scales at which
tourists respond to services on offer.
NBT-related cultural service provision by protected
areas therefore raises a set of location-, context-, and
scale-related questions. These questions must be consid-
ered before we can understand and value cultural service
provision appropriately. When assessing the long-term
resilience of protected areas and the contributions that
NBT-related cultural service provision makes to their
sustainability, variations in the relative magnitudes of
supply and demand across different scales are important
considerations. Aligning patterns and processes that
occur at different scales goes beyond the demands of
tourists and the ability of protected area managers to
meet those demands; it also incorporates elements of
pricing structures, broader questions of governance and
KRISTINE MACIEJEWSKI ET AL.12 Ecological ApplicationsVol. 25, No. 1

security, and international relationships and marketing
(Biggs et al. 2014).
Cumming et al. (in press) have proposed that
protected areas can be analyzed as socioecological
systems using Ostrom’s (2009) framework, with some
additions: notably, a greater awareness of scale and
cross-scale interactions and a more explicit definition of
the relationships between the scales of ecosystem
processes and the levels of institutional arrangements.
We apply this framework to NBT-related cultural
service delivery via NBT in protected areas and extend
it to further investigate cross-scale interactions and scale
mismatches. We assert that long-term success in
conservation depends on strengthening the alignment
between elements and processes at the different scales.
This includes enhancing interactions across scales
between protected area managers, local stakeholders,
the tourist community (local, national, regional, and
global), and the local, national, and global media.
SOCIOECOLOGICAL SCALES AND SCALE MISMATCHES IN
NATURE-BASED TOURISM
Ecological scale refers to the spatial and temporal
dimensions of a pattern or process occurring within the
ecological sphere (Cumming et al. 2006). Landscape
ecologists define scale using extent (the magnitude of a
dimension) and resolution, or grain, which refers to the
precision of the measurement (Gibson et al. 2000). The
ecological elements and processes that produce cultural
services utilized by nature-based tourists exist over a
range of different scales. The spatial scales of protected
areas range from patches within an individual protected
area to functional landscapes and networks.
Social scale has been used to refer to the different
dimensions of institutional size, representation, and
power (Gibson et al. 2000). These dimensions range
from individuals to networks of organizations, and
include the rules, laws, policies, and norms that govern
the extent of resource-related rights and management
responsibilities (Cumming et al. 2006). The manage-
ment approaches of protected areas therefore differ
across scales that influence (and are influenced by)
governance, affecting outputs and outcomes of the
socioecological systems (Ostrom 2009). Governance in
formal protected areas, such as national parks, is often
characterized by a top-down, command-and-control
approach to management (Goss and Cumming 2013).
Private protected areas, on the other hand, are usually
owned and managed by the same individual and
therefore are more conducive to a bottom-up manage-
ment approach at a finer scale. In NBT, social-scale
increases from individual tourists at a patch scale, or
sub-tenure unit, to various tourist communities at a
protected-area scale and national governments and
politics on an international scale. The use of spatial
terminology to define social scale can be confusing,
because equivalent institutions may operate at quite
different spatial scales (e.g., the governments of nation
states have effective scales that cover several different
orders of magnitude). We therefore follow Cumming et
al. (in press) in referring to institutional levels when
discussing rules, laws, and governance structures. In
this framework, protected areas exist as both institu-
tions and biophysical entities that consist of different
spatial scales and institutional levels. Institutional
levels may define corresponding spatial, ecological,
and social scales, ranging from patch to global or
international scale (Cumming et al., in press; Fig. 1).
Rules and management practices therefore vary across
scales, ranging from a single management policy at the
patch scale to national or international context at the
global scale. Fig. 1 provides a conceptualized frame-
work which compares the different spatial scales and
institutional levels (from 1 to 5) at which social and
ecological systems are organized. The institutional
levels are dynamic, as informal networks of power of
influence can play an important role in generating or
prohibiting cross-scale feedbacks (Calgaro et al. 2013).
However, the levels depicted in Fig. 1 are a requisite
simplification (sense Stirzaker et al. 2010) of these
dynamic relational interactions; they are simplified in
order to understand the impact of cross-scale mis-
matches and feedbacks. Temporal dynamics also differ
across scales ranging from short term processes and
initiatives to long term processes and long-standing
national assets (Fig. 1).
Ecological and social processes act synergistically to
produce outcomes, and thus, neither can be considered
in isolation (Hughes et al. 2005). In 2000, Poiani et al.
developed a hierarchical classification of habitats (rang-
ing from small patches to entire regions) and associated
species (ranging from small patch species to long
distance migratory species). The utility of the functional
landscape approach (Fig. 1) lies in its representation of
the relationship between the scales and levels at which
different system elements exist and the frequency and/or
magnitude of their interactions. For example, fewer
resources and a finer scale of action are required when
conserving a local-scale species, such as an endemic
butterfly, as opposed to a broader conservation ap-
proach involving international agreements and global
corporations when conserving an intercontinental mi-
gratory species, such as migratory songbirds (Cumming
et al., in press; Fig. 1). Although the strongest
interactions between elements are likely to occur at the
same scales and levels, protected areas are complex
systems (Cumming et al., in press) and interactions often
occur across scales or levels (Peters et al. 2004). For
example, in a given protected area, the ecological
community may be influenced by invasive species that
enter from the surrounding landscape; local manage-
ment actions may be driven by international agreements,
such as the Convention on International Trade in
Endangered Species of Wild Flora and Fauna (CITES)
or the Convention on Biological Diversity; and the
revenue generated by tourism may be affected by global
January 2015 13PROTECTED AREAS AS SOCIOECOLOGICAL SYSTEMS

events such as conflict, terrorism, or fluctuations in the
international stock market (Biggs 2011, Biggs et al.2014).
Scale mismatches occur when the alignment ofdifferent system elements at different scales and/or
levels results in dysfunctionality. More formally, theyimply that one or more functions of the socioecological
system are disrupted, inefficiencies occur, and/orimportant components of the system are lost (Cum-ming et al. 2006). They can be defined as spatial,
temporal, or functional in nature (Cumming et al.2006). Spatial-scale mismatches arise in conservation
when differences appear between the geographic extentof the problem and the solution (Guerrero et al. 2013)
or when jurisdictional boundaries are too small foreffective management (Crowder et al. 2006). Temporal-scale mismatches relate to processes that occur over
different timescales (Cash et al. 2006). For example, theimplementation of a conservation strategy is a lengthy
process, and long-term participation of stakeholders iscritical to reflect changes in ecological and social
system (Pierce et al. 2005, Pressey and Bottrill 2009).
When the same stakeholders are not involved through-
out the entire planning and implementation process, atemporal-scale mismatch may thereby occur. Marine
ecosystems have been destroyed as a consequence oftemporal mismatches occurring between biological
systems and human institutions, where marine systemsoccur at different timescales to the implementation of
policies (Crowder et al. 2006). Functional-scale mis-matches occur when the scope of processes consideredfor solving the conservation problem differs greatly
from the scope of processes actually used (Kates et al.2001, Guerrero et al. 2013). Functional mismatches can
also be driven by a misalignment between supply anddemand.
A NEW TYPOLOGY FOR ASSESSING SCALE MISMATCHES
Cumming et al.’s (in press) framework organizes the
social and ecological elements of protected areas intofive discrete, hierarchical institutional levels (ranging
from 1, meaning a sub-tenure unit, to 5, meaning aninternational context) and spatial scales (ranging from 1,
meaning patch, to 5, meaning international). We
FIG. 1. Summary of socioecological patterns and processes dynamically nested across different scales and adapted for nature-based tourism from Cumming et al.’s (in press) protected area framework. Each unit represents both a spatial scale (akin totraditional ecological scales) and an institutional level across which pattern and process interactions need to be reconciled throughcross-scale feedbacks to avoid scale mismatches. This figure extends the depiction of Poiani et al. (2000) of the ecologicalcomponents of a functional landscape. PA indicates protected area.
KRISTINE MACIEJEWSKI ET AL.14 Ecological ApplicationsVol. 25, No. 1

propose that the severity of a scale mismatch correlates
with its magnitude, so we used these hierarchical scales
to generate a ratio of institutional level to spatial scale,
using the following simple equation
logðinstitution level valueþ 1Þlogðspatial scale valueþ 1Þ
where log brings all scales and levels of investigation
into a comparable form and the addition of 1 prevents
the possibility of logging a value of 0 or ,1. Interactions
that take place within the same institutional and spatial
scale do not result in a scale mismatch. If we consider a
simple scale mismatch value as a log of the institutional
level in question (from 1 to 5) divided by a log of the
spatial scale in question (from 1 to 5), interactions at
equivalent scales and levels will produce a mismatch
value of 1. Conversely, a scale mismatch may result
when an action or event at one institutional level affects
a socioecological element at a different spatial scale
(scale mismatch index ,1) or vice versa (scale mismatch
ratio .1).
If we consider each of the 25 possible combinations of
spatial scale and institutional level, a range of likely
outcomes can be predicted (Table 1). Conceptually, each
outcome is accompanied by the likelihood of a loss in
system resilience, which we predict will relate to the
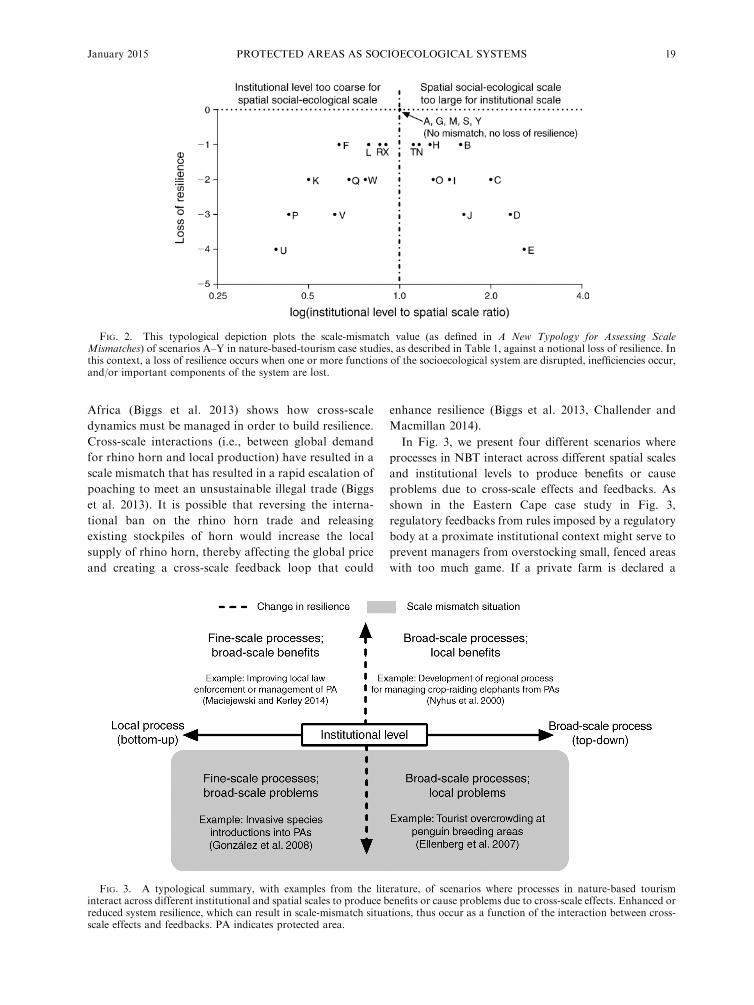
severity of the mismatch (Fig. 2). In this context, we
follow Cumming et al. (2006) in defining a loss of system
resilience as a scenario where the system experiences a
loss of its critical components or a disruption in
socioecological functioning, or when inefficiencies occur.
For our analysis, we scored the magnitude of resilience
reduction as follows: 0, if resilience was unaffected or
positively affected; 1, if mild inefficiencies occurred; 2, if
critical component were lost or functioning of SES were
disrupted; 3, if critical components were lost, function-
ing of SES were disrupted, and efficiencies occurred; 4, if
multiple components were lost, inefficiencies occurred,
and functioning of SES were disrupted; and 5, if system
changes were catastrophic and resulted in a regime shift.
The Appendix offers a more comprehensive treatment of
our method.
Typically, scale mismatch ratios with indices greater
than 1 manifest as social, economic, or ecological
problems that can’t be fixed by local management, while
those with scale mismatch indices smaller than 1 imply a
lack of attention to local detail or a lack of local
management capacity (Table 1). A loss in resilience
occurs when one or more of the functions of the
socioecological system are disrupted, inefficiencies oc-
cur, or an important component of the system is lost.
The greater the institutional level to spatial scale ratio,
the greater the loss in resilience, with 0 being lest severe
and �5 being most severe.
PLATE 1. Global tourist demands influence overstocking of charismatic species such as elephants in small private protectedareas. Photo credit: K. Maciejewski.
January 2015 15PROTECTED AREAS AS SOCIOECOLOGICAL SYSTEMS

To illustrate how the institutional-level to spatial-scale
ratio can be applied, we expand on the examples listed in
Table 1. These examples demonstrate how spatial,
temporal, and functional mismatches negatively affect
system resilience. As illustrated by the crop-raiding
elephants example (scenario F in Table 1), human–
wildlife conflict (Nyhus and Suimianto 2000) may result
from a cross-scale interaction where the spatial scale of
the ecological process exceeds the institutional level; the
outcome is a lack of institutional support and neglect of
local details (e.g., local community needs) in favor of
strategies that might generate more revenue from
tourism. On the other hand, reduced resilience will also
result from a cross-scale interaction where the institu-
tional level exceeds the spatial scale. For example,
decisions made at a national institutional level without
sufficiently accounting for local variability in the
rezoning of the Great Barrier Reef Marine Park
(GBRMP) in 2004 (scenario I in Table 1) substantially
altered the types and distribution of property rights and
TABLE 1. Scale mismatches between institutional level and spatial scale, expressed as a mismatch ratio and related to the loss inresilience in the socioecological system.
ScenarioInstitutional
levelSpatialscale Example outcome Reference
A 1 1 no mismatch N/AB 2 1 too many leaders for a small spatial scale Ankney (1996)
C 3 1 local management inadequate Lindsey et al. (2013)
D 4 1 inadequate attention to detail Maciejewski and Kerley (2014)
E 5 1 inadequate attention to detail TFCAs; Duffy (2006), Anderson et al. (2013)
F 1 2 crop-raiding elephants Nyhus and Suimianto (2000)
G 2 2 no mismatch N/AH 3 2 no real problem, missing infrastructure Wade et al. (2001)
I 4 2 inadequate attention to detail N. Ban, L. Evans, M. Nenadovic, and M.Schoon (unpublished manuscript)
J 5 2 inadequate attention to detail TFCAs; Duffy (2006), Anderson et al. (2013)
K 1 3 introduction of invasive species Gonzalez et al. (2008)L 2 3 inadequate ability to manage ecosystem
processesEllenberg et al. (2007)
M 3 3 no mismatch N/AN 4 3 regional areas overwhelmed by national
management problemsNamibia conservancies
O 5 3 inadequate attention to detail TFCAs; Duffy (2006), Anderson et al. (2013)
P 1 4 regional politics, human conflicts affectsecotourism
Beyers et al. (2011)
Q 2 4 boundary issues, encroachment by peopleinto ecotourism PAs
Weladji and Tchamba (2003)
R 3 4 lack of mandate to take broader action N. Ban, L. Evans, M. Nenadovic, and M.Schoon (unpublished manuscript)
S 4 4 no mismatch N/AT 5 4 international policies might not be
implemented at the national scale ifgovernance is weak
TFCAs; Duffy (2006), Anderson et al. (2013)
U 1 5 global climate change influences can’t bemanaged locally
Halpin (1997)
V 2 5 various problems of poor governance Meduna et al. (2009)
W 3 5 management overwhelmed by regionalproblems
N. Ban, L. Evans, M. Nenadovic, and M.Schoon (unpublished manuscript)
X 4 5 management overwhelmed by regionalproblems
TFCAs; Duffy (2006), Anderson et al. (2013)
Y 5 5 no mismatches N/A
Notes: Key to abbreviations: N/A, not applicable; PA, protected area; GBR, Great Barrier Reef; KAZA, Kavango ZambeziTransfrontier Conservation Area; and TFCA, Transfrontier Conservation Area.
KRISTINE MACIEJEWSKI ET AL.16 Ecological ApplicationsVol. 25, No. 1

associated returns from ecosystem goods and services
(e.g., reduced profits from fishing) to local communities
(N. Ban, L. Evans, M. Nenadovic, and M. Schoon,
unpublished manuscript).
The greater the difference between interacting scales
and levels and the greater the magnitude of the cross-
scale interaction, the greater the degree of mismatch.
For example, global climate change at a broad spatial
scale well exceeds the level of management that occurs in
NBT (scenario U in Table 1) and therefore results in a
high mismatch value. A large scale mismatch value also
results from a top-down management approach where
high institutional levels are used to manage small-scale
NBT (scenarios E and J in Table 1; Fig. 2). These
observations suggest that the institutional level to spatial
ratio is proportional to a loss in resilience. In other
words, the greater the scale mismatch in the cross-scale
interaction, the more vulnerable the protected area
becomes.
Although we have focused here on spatial scale, the
same principles apply to temporal scales and functional
connections. Long-lasting institutions may be inflexible
TABLE 1. Extended.
Case-study exampleInstitutional level
to spatial scale ratioLoss ofresilience
N/A 1 0A conflict in management approaches with waterfowl abundance leads to populationexplosion in Canadian Geese.
1.59 �1
Government priorities favor livestock production and override ecotourism managementdecisions.
2 �2
Global tourist demands influence overstocking of charismatic species, such as elephants,in small private PAs, leading to land degradation in PAs.
2.32 �3
Local communities are unable to forego their immediate natural resource needs and waitout time to see benefits from ecotourism in TFCAs. Local communities are notstratified by age and gender, but one part of the community often favor oneimplementation over another. International borders that open for tourism alsofacilitate the spread of more localized problems, such as poaching. Also, internationalpolicies often can’t address these problems.
2.58 �4
Elephants move out of PA to raid crops in surrounding farms, resulting in park–peopleconflict.
0.63 �1
N/A 1 0Tanzanian tourism fails to realize potential as tourist destination due to lack ofinfrastructure and trained staff.
1.26 �1
Local communities are unable to forego their immediate natural resource needs and waitto see benefits from ecotourism.
1.46 �2
Bad experiences with previous top-down, market-oriented environmental interventions byinternational bureaucracies.
1.63 �3
Loss of critical components, disruption of PA functioning. 0.5 �2High numbers of international tourists at Penguin breeding colony leads to overcrowding,thereby reducing Penguin breeding success.
0.79 �1
N/A 1 0National policy to implement disease fences and prioritize agricultural affects ecotourismopportunities.
1.16 �1
PAs not prepared to manage translocated elephants from KNP; hasty translocation dueto international funding pressure.
1.29 �2
Guerilla warfare in the DRC results in loss of wildlife and disruption in PA functioning. 0.43 �3
Illegal movement of people into PAs due to lack of management. 0.68 �2
Using a single policy instrument to manage a large scale system (GBR) results in manytrade-offs between ecosystem services.
0.86 �1
N/A 1 0Difficult to negotiate international agreements in Angola due to national policies, redtape, and inefficiencies; concern about state of Zimbabwe in the creation of the LTCA.
1.11 �1
Rapidly changing climate conditions occurs on a global scale and causes changes inecotourism PAs that cannot be prevented.
0.39 �4
Poor payment of ecotourism management and staff in PA leads to mismanagement,poaching, and poor maintenance of facilities, thereby reducing cultural service deliveryto tourists.
0.61 �3
In the GBR, flows and land use from surrounding areas affect the integrity of the system,yet management can only affect what is inside.
0.77 �2
Migration of elephants and people in the KAZA and Limpopo TFCA regions impededby fences prior to establishment of TFCAs. Landmines on the Angolan side of theKAZA are a potential problem for opening the area to elephants.
0.90 �1
N/A 1 0
January 2015 17PROTECTED AREAS AS SOCIOECOLOGICAL SYSTEMS

or unable to cope with rapid change, and newer
institutions may lack the history or the credibility to
cope with slow change.
Situations may also arise in which spatial, temporal,
and functional mismatches occur in combination. Forexample, in the Eastern Cape Province of South Africa
(hereafter referred to as the Eastern Cape), management
decisions in private nature reserves are heavily influ-
enced by the annual number of visitors (Maciejewskiand Kerley 2014). At a single-tenure and protected-area
level, managers (social elements at the patch scale)
perceive demand from international tourists (social
elements at the international scale) to stock charismaticspecies, such as elephants (ecological elements at the
patch and protected-area scale; see Plate 1). Managers
may perceive more charismatic animals to produce more
revenue in the short term and may overstock mega-
herbivores or carnivores, leading to serious longer-termecosystem degradation at the patch level (scenario D in
Table 1; see also Kerley and Landman [2006]).
Another, more complex example comes from the
GBRMP in Queensland, Australia, where the state
gross domestic product generated by NBT to theGBRMP exceeds that of all other industries (McCook
et al. 2010). At the patch and protected-area scales, this
marine protected-area network is composed of many
oceanic ecosystem types from coral reefs to deep
oceans. It also encompasses a number of differentzoning types, ranging from general use (where with-
drawal of resources and activities, such as trawling, are
allowed) to preservation where all access and activity is
prohibited (N. Ban, L. Evans, M. Nenadovic, and M.Schoon, unpublished manuscript). This zoning has
changed a great deal in the last 20 years, and while
the current dynamic management approach is com-
mended by world conservation bodies, there remain
scale mismatches that could threaten the region andresources into the future, as indicated in scenario R in
Table 1. N. Ban, L. Evans, M. Nenadovic, and M.
Schoon (unpublished manuscript) outline a number of
scale mismatches under the current governance strat-egy. First, the conservation benefits of the strategy will
take decades to become fully realized, while the impacts
of the fishing restrictions necessary for these benefits
are already being felt at a finer temporal scale by
resources users (Russ and Alcala 2011). Second, thebenefits of this management plan (at the single-tenure
and proximate institutional context) are of global
importance and impact, although the majority of the
cost burden is felt locally.
CROSS-SCALE FEEDBACKS AND RESILIENCE IN NATURE-
BASED TOURISM
As Cumming et al. (in press) highlight, the resilience of
NBT is not only contingent on the interaction between
socioecological elements at different scales. Rather, the
functioning of protected areas and the health of the
tourism sector are influenced by the way in which these,
and other elements of protected area tourism, are
connected by local to global flows of matter, organisms,
information, rules, money and perceptions and the ways
that these flows are mediated and managed (Hall 2010,
Mathevet et al. 2010, Biggs 2011, Thompson et al. 2011,
Calgaro et al. 2013).
In the Eastern Cape example (scenario D in Table 1;
Fig. 2), managers’ decisions are affected by the fact that
they are often made at a single-tenure unit level without
regulating rules flowing from proximate and national
contexts. The degradation of ecosystems may affect their
attractiveness to international tourists, but this feedback
is slow and may take even longer to be recognized by
managers.
Similarly, in the GBRMP example, social and
ecological mismatches are compounded by the fact that
flows into the park from all surrounding catchments that
incorporate such activities as grazing, cropping, and
mining have a large impact on the park’s ecosystem
health and resilience. This, in turn, affects water quality,
as well and the quality of Australia’s tourism products
and their international tourism brand. The magnitude
and nature of these feedbacks are therefore important to
the resilience of NBT. Changes in critical system
interactions can lead to a change in the function and
structure and ultimately push the system past a thresh-
old forcing a regime shift (Walker et al. 2006). It is
therefore important to identify the important feedbacks
in a system and understand which feedbacks cause a loss
of resilience and which can strengthen resilience (Folke
2006). This can be a challenging task, given that these
feedbacks are often the critical regulatory feedbacks in a
system. The fact that their effects are decoupled from the
scale of their production means they may often go
undetected, and their effects are often ascribed to other,
more easily perceived phenomena (Cumming et al.
2006).
The ways in which scale mismatches affect the
resilience of protected areas depends heavily on how
they relate to and affect cross-scale feedbacks. Formally,
a cross-scale feedback occurs when (1) A influences B
and B influences A, and (2) A and B are system elements
(actors or resources, rather than interactions) that exist
at different scales (Cumming et al. 2006; Cumming et al.,
in press). Cross-scale feedbacks can also occur as closed
feedback loops (A influences B influences C influences
A) that can produce surprising dynamics, such as
dampening or exacerbation of local variability (Cum-
ming et al., in press).
Cross-scale feedbacks are not necessarily problem-
atic for protected areas; indeed, they may be of prime
importance for their long-term sustainability. They
may, however, be closely related to scale mismatches,
particularly since many cross-scale influences result in
feedback effects. It also seems likely that many scale
mismatches arise from an inability of governance
systems to cope with biophysical variation at broader
or finer scales. The rhino poaching crisis in South
KRISTINE MACIEJEWSKI ET AL.18 Ecological ApplicationsVol. 25, No. 1
Africa (Biggs et al. 2013) shows how cross-scale
dynamics must be managed in order to build resilience.
Cross-scale interactions (i.e., between global demand
for rhino horn and local production) have resulted in a
scale mismatch that has resulted in a rapid escalation of
poaching to meet an unsustainable illegal trade (Biggs
et al. 2013). It is possible that reversing the interna-
tional ban on the rhino horn trade and releasing
existing stockpiles of horn would increase the local
supply of rhino horn, thereby affecting the global price
and creating a cross-scale feedback loop that could
enhance resilience (Biggs et al. 2013, Challender and
Macmillan 2014).
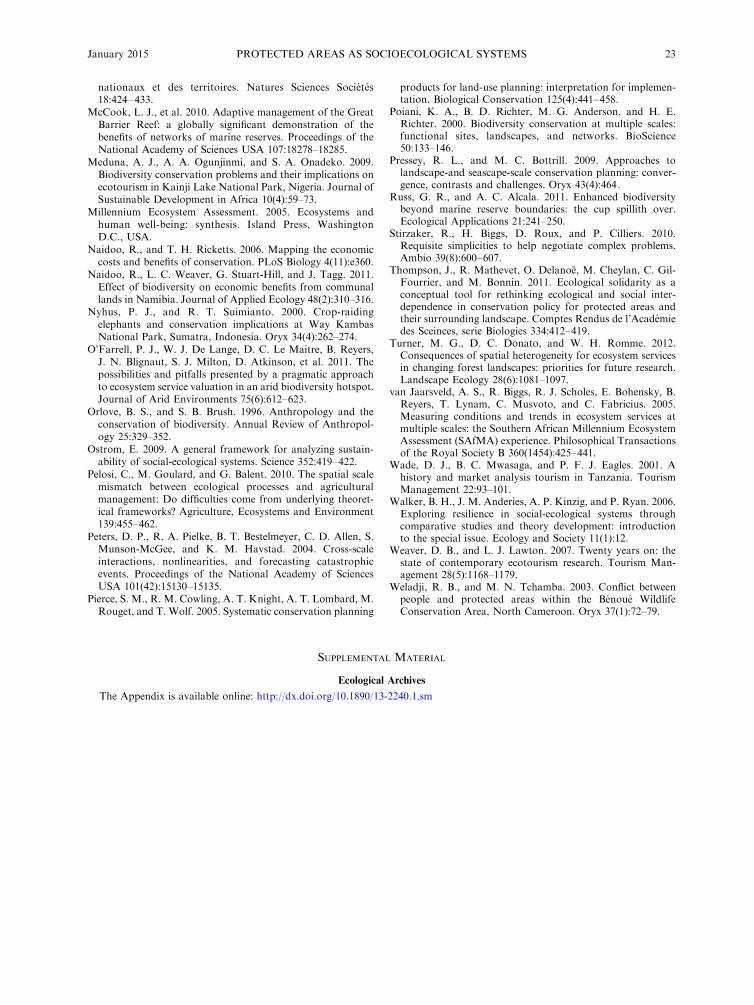
In Fig. 3, we present four different scenarios where
processes in NBT interact across different spatial scales
and institutional levels to produce benefits or cause
problems due to cross-scale effects and feedbacks. As
shown in the Eastern Cape case study in Fig. 3,
regulatory feedbacks from rules imposed by a regulatory
body at a proximate institutional context might serve to
prevent managers from overstocking small, fenced areas
with too much game. If a private farm is declared a
FIG. 3. A typological summary, with examples from the literature, of scenarios where processes in nature-based tourisminteract across different institutional and spatial scales to produce benefits or cause problems due to cross-scale effects. Enhanced orreduced system resilience, which can result in scale-mismatch situations, thus occur as a function of the interaction between cross-scale effects and feedbacks. PA indicates protected area.
FIG. 2. This typological depiction plots the scale-mismatch value (as defined in A New Typology for Assessing ScaleMismatches) of scenarios A–Y in nature-based-tourism case studies, as described in Table 1, against a notional loss of resilience. Inthis context, a loss of resilience occurs when one or more functions of the socioecological system are disrupted, inefficiencies occur,and/or important components of the system are lost.
January 2015 19PROTECTED AREAS AS SOCIOECOLOGICAL SYSTEMS

private nature reserve, it accepts benefits and rules
imposed on it by a governing body that exist at a
proximate institutional level. If it remained a private
farm, land conversion would be relatively simple and at
the owner’s management discretion. However, once
declared a private nature reserve, the owner’s manage-
ment practices may be monitored by a regulating body,
which may prevent overstocking, and ultimately land-
conversion.
This bottom-up management approach of using fine-
scale processes to benefit broad-scale effects may resolve
the scale mismatch between tourist demands and the
supply of NBT-related cultural services and build
resilience in this complex system (Fig. 3; fine-scale
processes, broad-scale benefits). A top-down feedback
may be effective when the institutional levels are
exceeded by the spatial scale as illustrated in the crop-
raiding elephant case study (scenario F in Table 1). In
this example, regional processes, such as erecting electric
fences around the protected area or the use of deterrents
may solve the local park–people conflict (Fig. 3; broad-
scale processes, local benefits). In the GBRMP example
(scenario R in Table 1), cross-scale feedbacks can be
used to highlight the mismatches between social and
ecological components. By considering the cross-scale
flow of goods, inferences can be made about how costs
and benefits are allocated, which can help elucidate the
source and nature of the challenges facing large-scale
systems like the GBRMP.
Cross-scale feedbacks do not always have a positive
effect on NBT and may reduce the resilience of a
system. For example, in the case of invasive species
(scenario K in Table 1), a scale mismatch between
institutional level and spatial scale on the Galapagos
Islands resulted in a cross-scale feedback that dis-
rupted the functioning of the whole socioecological
system. Despite rigorous conservation policies, inva-
sive species proliferated (Gonzalez et al. 2008; Fig. 3;
fine-scale processes, broad-scale problems). Even
though this took place at a fine-scale level, these
invasive species introductions resulted in broad-scale
problems by threatening the ecological integrity of the
archipelago, thereby reducing resilience of the Gala-
pagos system.
Similarly, the improper management of tourists
surrounding the yellow-eyed penguin (Megadyptes anti-
podes) also illustrates how a cross-scale feedback may
reduce the resilience in a socioecological system (scenar-
io L in Table 1; Fig. 3). Tourists are attracted to this
species of penguin, which is one of New Zealand’s
flagship species (Ellenberg et al. 2007). The tourist
numbers at penguin breeding areas are unregulated,
however, which has led to tourist overcrowding. A top-
down effect therefore occurs where high levels of human
disturbance (broad-scale processes) have reduced the
breeding success and lowered fledging weights (fine-scale
problems), placing pressure on the resilience of the
system (Ellenberg et al. 2007; Fig. 3; broad-scale
processes, local problems), while potentially making
the penguin rarer and, hence, even more desirable to see.
DISCUSSION
We have shown that using a socioecological frame-
work to contextualize NBT in protected areas can offer
useful insights into factors that might affect their
sustainability and resilience as a function of NBT-
related cultural service delivery. Cross-scale interactions
are inherent in the system and often lead to scale
mismatches that may affect the functioning of NBT. We
have argued that the degree of scale mismatch relies on
the magnitude of the cross-scale interaction; the greater
the difference between interacting scales and levels, the
greater the mismatch. Managing NBT for resilience
depends in part on identifying these scale mismatches
and either developing appropriate institutions, such as
boundary organizations (Cash and Moser 2000) or
creating cross-scale feedbacks to mitigate the negative
impacts.
Pelosi et al. (2010) reviewed literature on scale
mismatches and found that only 15% of studies adopted
a systematic approach to assessing them. They argued
that the lack of a systematic approach, and the incorrect
or inadequate use of scale mismatch terminology, has
hindered efforts to resolve mismatches. Our new
typology (Table 1; Fig. 2) contributes to addressing this
failing and has considerable potential for expansion to
provide a way of more rigorously (and more quantita-
tively) connecting ideas about scale mismatches to the
analysis of system resilience. In addition to its value for
protected areas, which have been the focus of this
article, our approach is thus relevant for socioecological
management problems more generally, including (for
example) those in urban (Borgstrom et al. 2006), fishery
(Andrew et al. 2007), and agricultural (Pelosi et al. 2010)
contexts.
The proposition that socioecological resilience is most
strongly reduced by the largest scale mismatches (as
measured using the institutional level to spatial scale
ratio; Fig. 2) requires further exploration and testing.
There are clearly many details in this relationship that
will need to be resolved. For example, resilience is not
normative, and it is possible that a scale mismatch may
create a resilient trap that keeps a socioecological system
locked in a collapsed state (e.g., if scales of propagule
dispersal are too small to support vegetation recoloni-
zation in a heavily human-modified landscape). Our
work should thus be read as proposing the general
hypothesis that socioecological resilience relates predict-
ably to the magnitude of a relevant scale mismatch,
leaving the finer details of the relationship for future,
more in-depth empirical analysis.
In the practical realm, there is a clear case for the
incorporation of scale and cross-scale interactions
brought about by NBT-related cultural service delivery
into the analysis of protected area resilience if we are to
KRISTINE MACIEJEWSKI ET AL.20 Ecological ApplicationsVol. 25, No. 1

advance our understanding of the tenability of ecotour-
ism as a strategy to sustain protected areas into the
future. NBT-related cultural service delivery may affect
the resilience of a system that highlights the importance
of time in understanding cross-scale dynamics. In an
ecotourism context, it is very likely that a temporal
mismatch will exist between ecological processes and the
scale at which disturbances and changes to these
processes can be detected and managed. For example,
natural hazards such as the 2004 Indian Ocean tsunami
have the propensity to disrupt future tourist flows
(Calgaro et al. 2013). In many systems, cross-scale
interactions that may not be significant at first may
escalate unpredictably over time. For example, in the
Eastern Cape case study, ecological degradation caused
by overstocking may not result in reduced visitation
rates at first. However, should visitation rates be
sufficiently reduced, a private owner might decide to
convert his land back to a more economically viable use,
such as crop or livestock farming, which would
constitute a regime shift. We anticipate that future
research will identify a strong set of connections between
cross-scale feedbacks, scale mismatches, and regime
shifts (Kinzig et al. 2006). While our analysis shows that
socioecological elements inevitably interact across multi-
ple scales to produce positive and negative outcomes, we
do not investigate the mechanisms that produce cross-
scale feedbacks and scale-mismatch. We postulate that
understanding how the structure of systems at different
scales interacts with agency to produce desired and
undesired effects may prove key to understanding these
connections and conditions that facilitate regime shifts.
The structure and agency may work together to create
favorable and unfavorable outcomes across space and
time, however this falls outside the scope of this study.
We focused explicitly on interactions between socio-
ecological components that exist at different scales and
the scale-crossing mismatches that may result from this.
We did not focus on the mechanisms that produce cross-
scale feedbacks, such as the interplay between structure
and agency.
The ability of NBT-focused protected area systems to
generate income depends on both the scale at which
cultural services are provided and the scale at which
tourists respond to services on offer. Depending on a
protected area’s context, a misalignment in temporal,
spatial, or functional scales could compromise the
current or future identity or functioning of a protected
area, thereby affecting the resilience of the whole
socioecological system. The resilience of ecotourism is
therefore closely linked to the management of cross-
scale feedbacks and scale mismatches.
The location of a protected area, as well as its ecology,
affordability, and infrastructure plays an important role
in attracting tourists and generating income (A. De Vos,
G. Cumming, C. Moore, and K. Maciejewski, unpub-
lished manuscript). At a single-tenure and protected-area
level, it might be difficult to perceive and implement
rules and strategies that factor in these landscape- and
national-level processes. However, feedbacks that occur
as a result of rules made at the national institutional
level might enhance resilience by ensuring that broad-
scale processes are taken into consideration when
developing the business model of a park.
While we have made a strong case for including the
analysis of cross-scale feedbacks and scale mismatches
to better understand and manage protected areas that
rely on NBT, more research is needed to investigate the
connection between cross-scale feedbacks, scale mis-
matches, and regime shifts. There is also scope for future
research to focus on the mechanisms that produce cross-
scale feedbacks, such as the interplay between structure
and agency. Socioecological systems are complex
dynamic systems containing a myriad of factors and
cross-scale processes that may influence the social sphere
within natural resource management. As our analysis
shows, a greater understanding of cross-scale feedbacks
and scale mismatches (and finding ways to strengthen
the alignment of scales) can contribute to enhancing the
resilience of socioecological systems.
ACKNOWLEDGMENTS
We are grateful to colleagues in the Resilience Alliance foruseful discussions on this and related topics and to the twoanonymous referees who provided helpful comments thatimproved the manuscript. This research was supported by theDepartment of Science and Technology/National ResearchFoundation (DST/NRF) Centre of Excellence at the PercyFitzPatrick Institute, a Competitive Programme for RatedResearchers (CPRR) grant to G. S. Cumming from theNational Research Foundation of South Africa, and a JamesS. McDonnell Foundation complexity scholar award to G. S.Cumming.
LITERATURE CITED
Adger, W. N. 2000. Social and ecological resilience: are theyrelated? Progress in Human Geography 24(3):347–364.
Agrawal, A., and C. C. Gibson. 1999. Enchantment anddisenchantment: the role of community in natural resourceconservation. World Development 27:629–649.
Anderson, J. A., M. de Garine-Wichatitsky, D. H. M. Cum-ming, V. Dzingirai, and K. E. Giller. 2013. Transfrontierconservation areas. People living on the edge. Routledge,New York, New York, USA.
Andrew, N. L., C. Bene, S. J. Hall, E. H. Allison, S. Heck, andB. D. Ratner. 2007. Diagnosis and management of small-scale fisheries in developing countries. Fish and Fisheries8:227–240.
Ankney, C. D. 1996. An embarrassment of riches: too manygeese. Journal of Wildlife Management 60(2):217–223.
Ban, N. C., M. Mills, J. Tam, C. C. Hicks, S. Klain, N. Stoeckl,M. C. Bottrill, J. Levine, R. L. Pressey, T. Satterfield, andK. A. Chan. In press. Towards a social-ecological approachfor conservation planning: embedding social considerations.Frontiers in Ecology and the Environment.
Berkes, F. 2004. Rethinking community-based conservation.Conservation Biology 18(3):621–630.
Beyers, R. L., J. A. Hart, A. R. Sinclair, F. Grossmann, B.Klinkenberg, and S. Dino. 2011. Resource wars and conflictivory: the impact of civil conflict on elephants in the
January 2015 21PROTECTED AREAS AS SOCIOECOLOGICAL SYSTEMS

democratic republic of Congo—the case of the Okapi reserve.PLoS ONE 6(11):e27129.
Biggs, D. 2011. Understanding resilience in a vulnerableindustry: the case of reef tourism on Australia’s GreatBarrier Reef. Ecology and Society 16:30.
Biggs, D., F. Courchamp, R. Martin, and H. P. Possingham.2013. Legal trade of Africa’s rhino horns. Science 339:1038–1039.
Biggs, D., L. Swemmer, G. Phillips, J. Stevens, S. Freitag, andR. C. C. Grant. 2014. The development of a tourism researchframework by South African National Parks to informmanagement. Koedoe 56(2):art1164.
Borgstrom, S. T., T. Elmqvist, P. Angelstam, and C. Alfsen-Norodom. 2006. Scale mismatches in management of urbanlandscapes. Ecology and Society 11(2):art16.
Calgaro, E., K. Lloyd, and D. Dominey-Howes. 2014. Fromvulnerability to transformation: a framework for assessingthe vulnerability and resilience of tourism destinations.Journal of Sustainable Tourism 22:342–360.
Cash, D. W., W. N. Adger, F. Berkes, P. Garden, L. Lebel, P.Olsson, L. Pritchard, and O. Young. 2006. Scale and cross-scale dynamics: governance and information in a multilevelworld. Ecology and Society 11:8.
Cash, D. W., and S. C. Moser. 2000. Linking global and localscales: designing dynamic assessment and managementprocesses. Global Environmental Change 10:109–120.
Challender, D. W. S., and D. C. MacMillan. In press. Poachingis more than an enforcement problem. Conservation Letters.
Chape, S., J. Harrison, M. Spalding, and I. Lysenko. 2005.Measuring the extent and effectiveness of protected areas asan indicator for meeting global biodiversity targets. Philo-sophical Transactions of the Royal Society B 360(1454):443–455.
Chase, L. C., D. R. Lee, W. D. Schulze, and D. J. Anderson.1998. Ecotourism demand and differential pricing of Na-tional Park access in Costa Rica. Land Economics74(4):466–482.
Cohn, J. P. 2011. 50th anniversary for ANWR. BioScience61(6):496.
Crowder, L. B., et al. 2006. Resolving mismatches in US oceangovernance. Science 313(5787):617–618.
Cumming, G. S., et al. In press. Understanding protected arearesilience: a multiscale socioecological framework. EcologicalApplications.
Cumming, G. S., D. H. Cumming, and C. L. Redman. 2006.Scale mismatches in social-ecological systems: causes, con-sequences, and solutions. Ecology and Society 11(1):14.
Daniel, T., et al. 2012. Contributions of cultural services to theecosystem services agenda. Proceedings of the NationalAcademy of Sciences USA 109(23):8812–8819.
De Groot, R. S., M. A. Wilson, and R. M. Boumans. 2002. Atypology for the classification, description and valuation ofecosystem functions, goods and services. Ecological Eco-nomics 41(3):393–408.
Dharmaratne, G. S., F. Yee Sang, and L. J. Walling. 2000.Tourism potentials for financing protected areas. Annals ofTourism Research 27:590–610.
Duffy, R. 2006. The potential and pitfalls of global environ-mental governance. The politics of transfrontier conservationin Southern Africa. Political Geography 25:89–112.
Egoh, B., E. G. Drakou, M. B. Dunbar, J. Maes, and L.Willemen. 2012. Indicators for mapping ecosystem services: areview. Report EUR 25456. Publications Office of theEuropean Union, Luxembourg.
Ellenberg, U., A. N. Setiawan, A. Cree, D. M. Houston, andP. J. Seddon. 2007. Elevated hormonal stress response andreduced reproductive output in yellow-eyed penguins ex-posed to unregulated tourism. General and ComparativeEndocrinology 152(1):54–63.
Folke, C. 2006. Resilience: the emergence of a perspective forsocial-ecological systems analyses. Global EnvironmentalChange 16:253–267.
Gelcich, S., F. Amar, A. Valdebenito, J. Carlos Castilla, M.Fernandez, C. Godoy, and D. Biggs. 2013. Financing marineprotected areas through visitor fees: insights from touristswillingness to pay in Chile. Ambio 42(8):975–984.
Gibson, C. C., E. Ostrom, and T. Ahn. 2000. The concept ofscale and the human dimensions of global change: a survey.Ecological Economics 32(2):217–239.
Gonzalez, J. A., C. Montes, J. Rodriguez, and W. Tapial. 2008.Rethinking the Galapagos Islands as a complex social-ecological system: implications for conservation and manage-ment. Ecology and Society 13(2):13.
Goss, J., and G. S. Cumming. 2013. Networks of wildlifetranslocations in developing countries: an emerging con-servation issue? Frontiers in Ecology and Environment11:243–250.
Guerrero, A. M., R. R. McAllister, J. Corcoran, and K. A.Wilson. 2013. Scale mismatches, conservation planning, andthe value of social-network analyses. Conservation Biology27(1):35–44.
Gunderson, L., and C. Holling, editors. 2002. Panarchy:understanding transformations in human and natural sys-tems. Island Press, Washington, D.C., USA.
Hall, C. M. 2010. Crisis events in tourism: subjects of crisis intourism. Current Issues in Tourism 13:401–417.
Halpin, P. N. 1997. Global climate change and natural-areaprotection: management responses and research directions.Ecological Applications 7:828–843.
Hughes, T. P., D. R. Bellwood, C. Folke, R. S. Steneck, and J.Wilson. 2005. New paradigms for supporting the resilience ofmarine ecosystems. Trends in Ecology and Evolution 20:380–386.
Kates, R. W., et al. 2001. Sustainability science. Science292:641–642.
Kerley, G. I. H., and M. Landman. 2006. The impacts ofelephants on biodiversity in the Eastern Cape subtropicalthickets. South African Journal of Science 102:395–402.
Kinzig, A. P., P. A. Ryan, M. Etienne, H. E. Allison, T.Elmqvist, and B. H. Walker. 2006. Resilience and regimeshifts: assessing cascading effects. Ecology and Society11(1):20.
Kiss, A. 2004. Is community-based ecotourism a good use ofbiodiversity conservation funds? Trends in Ecology andEvolution 19:232–237.
Kruger, O. 2005. The role of ecotourism in conservation:panacea or Pandora’s box? Biodiversity and Conservation14(3):579–600.
Lee, C. 1997. Valuation of nature based tourism resources usingdichotomous choice contingent valuation method. TourismManagement 18:587–591.
Lindsey, P. A., C. P. Havemann, R. M. Lines, A. E. Price, T. A.Retief, T. Rhebergen, C. Van der Waal, and S. S. Romanach.2013. Benefits of wildlife-based land uses on private lands inNamibia and limitations affecting their development. Oryx47(1):41–53.
Maciejewski, K., and G. I. H. Kerley. 2014. Elevated elephantdensity does not improve ecotourism opportunities, suggest-ing convergence in social and ecological objectives. Ecolog-ical Applications 24(5):920–926.
Margules, C. R., and R. L. Pressey. 2000. Systematicconservation planning. Nature 405(6783):243–253.
Mascia, M. B., and S. Pailler. 2011. Protected area down-grading, downsizing, and degazettement (PADDD) and itsconservation implications. Conservation Letters 4:9–20.
Mathevet, R., J. D. Thompson, O. Delanoe, M. Cheylan, C.Gil-Fourrier, and M. Bonnin. 2010. La solidarite ecologique:un nouveau concept pour la gestion integree des parcs
KRISTINE MACIEJEWSKI ET AL.22 Ecological ApplicationsVol. 25, No. 1
nationaux et des territoires. Natures Sciences Societes18:424–433.
McCook, L. J., et al. 2010. Adaptive management of the GreatBarrier Reef: a globally significant demonstration of thebenefits of networks of marine reserves. Proceedings of theNational Academy of Sciences USA 107:18278–18285.
Meduna, A. J., A. A. Ogunjinmi, and S. A. Onadeko. 2009.Biodiversity conservation problems and their implications onecotourism in Kainji Lake National Park, Nigeria. Journal ofSustainable Development in Africa 10(4):59–73.
Millennium Ecosystem Assessment. 2005. Ecosystems andhuman well-being: synthesis. Island Press, WashingtonD.C., USA.
Naidoo, R., and T. H. Ricketts. 2006. Mapping the economiccosts and benefits of conservation. PLoS Biology 4(11):e360.
Naidoo, R., L. C. Weaver, G. Stuart-Hill, and J. Tagg. 2011.Effect of biodiversity on economic benefits from communallands in Namibia. Journal of Applied Ecology 48(2):310–316.
Nyhus, P. J., and R. T. Suimianto. 2000. Crop-raidingelephants and conservation implications at Way KambasNational Park, Sumatra, Indonesia. Oryx 34(4):262–274.
O’Farrell, P. J., W. J. De Lange, D. C. Le Maitre, B. Reyers,J. N. Blignaut, S. J. Milton, D. Atkinson, et al. 2011. Thepossibilities and pitfalls presented by a pragmatic approachto ecosystem service valuation in an arid biodiversity hotspot.Journal of Arid Environments 75(6):612–623.
Orlove, B. S., and S. B. Brush. 1996. Anthropology and theconservation of biodiversity. Annual Review of Anthropol-ogy 25:329–352.
Ostrom, E. 2009. A general framework for analyzing sustain-ability of social-ecological systems. Science 352:419–422.
Pelosi, C., M. Goulard, and G. Balent. 2010. The spatial scalemismatch between ecological processes and agriculturalmanagement: Do difficulties come from underlying theoret-ical frameworks? Agriculture, Ecosystems and Environment139:455–462.
Peters, D. P., R. A. Pielke, B. T. Bestelmeyer, C. D. Allen, S.Munson-McGee, and K. M. Havstad. 2004. Cross-scaleinteractions, nonlinearities, and forecasting catastrophicevents. Proceedings of the National Academy of SciencesUSA 101(42):15130–15135.
Pierce, S. M., R. M. Cowling, A. T. Knight, A. T. Lombard, M.Rouget, and T. Wolf. 2005. Systematic conservation planning
products for land-use planning: interpretation for implemen-tation. Biological Conservation 125(4):441–458.
Poiani, K. A., B. D. Richter, M. G. Anderson, and H. E.Richter. 2000. Biodiversity conservation at multiple scales:functional sites, landscapes, and networks. BioScience50:133–146.
Pressey, R. L., and M. C. Bottrill. 2009. Approaches tolandscape-and seascape-scale conservation planning: conver-gence, contrasts and challenges. Oryx 43(4):464.
Russ, G. R., and A. C. Alcala. 2011. Enhanced biodiversitybeyond marine reserve boundaries: the cup spillith over.Ecological Applications 21:241–250.
Stirzaker, R., H. Biggs, D. Roux, and P. Cilliers. 2010.Requisite simplicities to help negotiate complex problems.Ambio 39(8):600–607.
Thompson, J., R. Mathevet, O. Delanoe, M. Cheylan, C. Gil-Fourrier, and M. Bonnin. 2011. Ecological solidarity as aconceptual tool for rethinking ecological and social inter-dependence in conservation policy for protected areas andtheir surrounding landscape. Comptes Rendus de l’Academiedes Sceinces, serie Biologies 334:412–419.
Turner, M. G., D. C. Donato, and W. H. Romme. 2012.Consequences of spatial heterogeneity for ecosystem servicesin changing forest landscapes: priorities for future research.Landscape Ecology 28(6):1081–1097.
van Jaarsveld, A. S., R. Biggs, R. J. Scholes, E. Bohensky, B.Reyers, T. Lynam, C. Musvoto, and C. Fabricius. 2005.Measuring conditions and trends in ecosystem services atmultiple scales: the Southern African Millennium EcosystemAssessment (SAfMA) experience. Philosophical Transactionsof the Royal Society B 360(1454):425–441.
Wade, D. J., B. C. Mwasaga, and P. F. J. Eagles. 2001. Ahistory and market analysis tourism in Tanzania. TourismManagement 22:93–101.
Walker, B. H., J. M. Anderies, A. P. Kinzig, and P. Ryan. 2006.Exploring resilience in social-ecological systems throughcomparative studies and theory development: introductionto the special issue. Ecology and Society 11(1):12.
Weaver, D. B., and L. J. Lawton. 2007. Twenty years on: thestate of contemporary ecotourism research. Tourism Man-agement 28(5):1168–1179.
Weladji, R. B., and M. N. Tchamba. 2003. Conflict betweenpeople and protected areas within the Benoue WildlifeConservation Area, North Cameroon. Oryx 37(1):72–79.
SUPPLEMENTAL MATERIAL
Ecological Archives
The Appendix is available online: http://dx.doi.org/10.1890/13-2240.1.sm
January 2015 23PROTECTED AREAS AS SOCIOECOLOGICAL SYSTEMS