cross-species immune system atlas a dissertation …kx850xf5314/bjornson... · in scope and quality...
TRANSCRIPT

CROSS-SPECIES IMMUNE SYSTEM ATLAS
A DISSERTATION
SUBMITTED TO THE DEPARTMENT OF
MICROBIOLOGY & IMMUNOLOGY
AND THE COMMITTEE ON GRADUATE STUDIES
OF STANFORD UNIVERSITY
IN PARTIAL FULFILLMENT OF THE REQUIREMNTS
FOR THE DEGREE OF
DOCTOR OF PHILOSOPHY
ZACHARY B. BJORNSON-HOOPER
MARCH 2016

http://creativecommons.org/licenses/by-nc/3.0/us/
This dissertation is online at: http://purl.stanford.edu/kx850xf5314
© 2016 by Zachary Bjornson-Hooper. All Rights Reserved.
Re-distributed by Stanford University under license with the author.
This work is licensed under a Creative Commons Attribution-Noncommercial 3.0 United States License.
ii

I certify that I have read this dissertation and that, in my opinion, it is fully adequatein scope and quality as a dissertation for the degree of Doctor of Philosophy.
Garry Nolan, Primary Adviser
I certify that I have read this dissertation and that, in my opinion, it is fully adequatein scope and quality as a dissertation for the degree of Doctor of Philosophy.
Ann Arvin
I certify that I have read this dissertation and that, in my opinion, it is fully adequatein scope and quality as a dissertation for the degree of Doctor of Philosophy.
Edgar Engleman
I certify that I have read this dissertation and that, in my opinion, it is fully adequatein scope and quality as a dissertation for the degree of Doctor of Philosophy.
Harry Greenberg
I certify that I have read this dissertation and that, in my opinion, it is fully adequatein scope and quality as a dissertation for the degree of Doctor of Philosophy.
David Relman
Approved for the Stanford University Committee on Graduate Studies.
Patricia J. Gumport, Vice Provost for Graduate Education
This signature page was generated electronically upon submission of this dissertation in electronic format. An original signed hard copy of the signature page is on file inUniversity Archives.
iii

iv
Abstract
Animal models are an integral part of the drug development and evaluation process.
However, they are unsurprisingly imperfect reflections of humans. With the rise of targeted
and biological therapeutics, it is increasingly important that we understand the molecular
differences in immunological behavior of humans and model organisms. Thus, we profiled a
large number of healthy humans, along with the model organisms most similar to humans:
rhesus and cynomolgus macaques and African green monkeys, and the most widely used
mammalian model: mice. Immune cell signaling responses to a panel of 15 stimuli were
measured using CyTOF mass cytometry to read out universal signaling and phenotyping
panels. We found numerous instances of different immune signaling events occurring between
species with likely effects on evaluation of therapeutics. We frame these differences in the
context of the immune system as a modular network.

v
Table of Contents Abstract ..................................................................................................................................... iv
Introduction ................................................................................................................................ 1
Main Body .................................................................................................................................. 9
Cell type-specific antibody screening in non-human primates ................................ 9
Counterstain panel and staining condition development ..................................... 10
Antibody reactivity screen................................................................................... 11
Design and production of universal phenotyping and signaling assays ................. 22
Cell type frequency, surface marker expression and signaling response reference
ranges across species .............................................................................................. 29
Selected exemplary differences between species ................................................... 59
CD1c+ B cells are more abundant in macaques .................................................. 59
CD8αα+ B cells are present in macaques and have a unique functional profile . 60
CD4+CD8+ double-positive T cells are more abundant in macaques and display
unique responses to different type I interferons .................................................. 62
Macaque granulocytes are rapidly responsive to Bacillus anthracis .................. 66
Correlations between immune signatures and metadata......................................... 67
Monocyte abundance correlates with herpes simian B virus status .................... 67
Detecting “modules” of the immune system via cross-categorical clustering ....... 69
Effect of ketamine on signaling and blood chemistry ............................................ 71
Public Database ...................................................................................................... 74
Conclusion .............................................................................................................. 75
Materials and Methods ........................................................................................... 76
Antibody reactivity screen................................................................................... 76
Stimuli ................................................................................................................. 77
Blood ................................................................................................................... 79
Antibodies ........................................................................................................... 80
Stimulation and Staining ..................................................................................... 82
Acquisition .......................................................................................................... 83
References ................................................................................................................................ 84

1
Introduction
For better or for worse, animal models are an integral part of the drug development
and evaluation process: all candidate therapeutics are evaluated for toxicity,
pharmacokinetics/pharmacodynamics and efficacy using animals. Furthermore, in
circumstances when human clinical trials of efficacy cannot be conducted for ethical reasons
or when an insufficient number of natural cases exists, such as for therapeutics for biothreat
agents, the U.S. Food and Drug Administration allows licensure after efficacy is evaluated
only in animal models under 21 CFR 314 (“The Animal Rule”). This rule has been applied in
a limited number of cases since its issuance in 2002, including Raxibacumab for inhalational
anthrax, B12 for cyanide poisoning, pyridostigmine for nerve gas and levofloxacin and
moxifloxacin for bubonic plague, but therapeutics for an increasing number of conditions are
being evaluated via this mode.
Unsurprisingly, animal models are imperfect reflections of humans1 (among other
reviews). On a high level, most diseases are host-restricted. Modeling these diseases is
inherently challenging, and researchers use a variety of imperfect, compensatory techniques.
For example, naturally occurring ebolaviruses do not infect mice, so researchers use mouse-
adapted viruses, which still do not produce disease similar to that seen in humans2. HIV does
not infect macaques, so researchers use SIV and SHIV as surrogates, or have to use
chimpanzees—one of the most ethically challenging animal models3. The major group human
rhinoviruses do not bind the mouse receptor homologue, so researchers use transgenic animals
and infect with more than 500,000 times the human infectious dose to produce disease4,5.
Cancers are slow to induce and rarely develop naturally over the short lifetime of a mouse, so
tumors are xenografted into immunocompromised mice or an artificially small number of
genes are mutated to induce tumor formation6. We still have no cure for any of these diseases.
Furthermore, while a model may appear reflective of a disease at a high level, e.g. by
physical examination, our metrics for evaluating the quality of models do not always
encompass the elements relevant to the evaluation of the therapeutic in question, such as
cellular receptors or kinases. While broadly characterized animal models may have sufficed
for evaluation of the whole-virus vaccines, antibiotics and other broadly active and agent-
targeting therapeutics that were the focus of medicine for the century since Pasteur’s used
sheep to model anthrax in the 1880s, understanding the single-cell differences in immune
signaling between animal models and humans is of increasing importance as more rationally
designed biotherapeutics that target the host, and especially specific receptors and pathways,

2
are brought to trial. For example, on a molecular level, macaque IgG3 appears to have
different functional abilities due to its shorter hinge region compared with human IgG3: while
human CD16 interacts with IgG1 and IgG3, macaque CD16 instead interacts with IgG1 and
IgG27. Additionally, CD16 is absent on macaque granulocytes7,8. These differences will likely
confound evaluation of therapeutic antibodies that act through this Fcγ receptor9. On a systems
level, there is almost no correlation of transcriptomic responses to burn, trauma and
endotoxemia between humans and mice10, underscoring how these species have evolved
unique mechanisms to heal and combat disease. While there may be a relatively high degree
of conservation of expression patterns between orthologous genes in mice and humans, a large
number of genes have divergent expression patterns and regulatory elements especially have a
lower level of conservation across species11. Similarly, Barreiro et al. found high-level
conservation in responses to LPS across humans, rhesus macaques and chimpanzees, but
closer investigation of lineage-specific responses revealed divergence that likely explain
differing susceptibility to infectious diseases12.
In addition to being imperfect efficacy models, animals are also imperfect safety
models. Notably, Fialuridine killed five people in clinical trials when administered at doses
that were found to be nontoxic in mice, rats, dogs and monkeys—four very different species13.
Likewise, TGN1412 (anti-CD28) caused catastrophic organ failure in humans when
administered at 1/500th of the safe animal dose due to differences in CD28 expression in the
model organisms used14.
The overall low accuracy of animal models begs the question how many drugs would
work in humans but fail in our animal models?
Additionally, when evaluating therapeutics, it is important to consider differences
between human demographic groups—ages, genders, ethnicities, immunological histories,
genetics, etc. These differences are perhaps better recognized, or at least better addressed, than
those between animal models and humans: the US Food and Drug Administration since 1998
has required that new drug applications describe safety and effectiveness by gender, age and
race15, and the labels for some 38% of drugs approved from 2004 to 2007 include PK/PD data
by ethnicity16. Warfarin, rosuvastatin, tacrolimus, carbamazepine and others are all known to
have ethnicity-dependent pharmacokinetics/pharmacodynamics16. A variety of factors,
including hormones, body fat, body mass index and blood flow, contribute to gender
differences in bioavailability, distribution, metabolism and excretion of drugs17. Moreover,
factors such as vaccination history (which differs markedly by country), gut microbiota,

3
smoking and other health-related behaviors, medications and underlying disease status all
have the potential to modulate the effects of drugs and disease.
Likewise, gender bias is an issue in animal models. Male mice are used far more
frequently than females, probably in large part because female animals’ hormonal cycles make
them more variable to work with18. The NIH recently began requiring researchers to study
both genders, or support why only one gender will be studied, in an effort to combat this
discrepancy19.
To address these issues and characterize the immunological variability both within
and between species, we performed phospho-flow immune signaling profiling of whole blood
from approximately 100 healthy humans, 32 rhesus macaques (Macaca mulatta), 32
cynomolgus macaques (Macaca fascicularis), 24 African green monkeys (Chlorocebus
aethiops) and 50 C57BL/6 mice (Mus musculus), measuring 16 signaling proteins and 24
surface markers per cell in approximately 20 immune cell populations after treatment with a
panel of 15 stimuli using CyTOF mass cytometry. The set of phenotyping panels was
designed to demarcate orthologous populations in all species, while the signaling panel and
complementary stimuli were targeted at innate immunity and cytokine responses. We present
several detailed examples of specific findings, in the context of our broad findings reflecting
the immune system structure and its differences between species and individuals.
Single-cell mass cytometry for analysis of immune system functional
states
Part of the following material are excerpts reproduced from Bjornson, Nolan and Fantl
201320 with permission from Elsevier and co-authors. I contributed the following: I
collaboratively wrote the review.
Fluorescence-based flow cytometry has proven an invaluable technology for both
immunologists and clinicians alike21. Importantly, it provides critical biological information at
the single-cell level regarding ploidy, immunophenotype, frequency of cell subsets, expression
levels of proteins, as well as functional characterization22–27. Furthermore, the potential of this
technology can be significantly extended by interrogating single cells not only in their basal
state but also after their exposure to exogenous stimuli. The latter has given rise to
fluorescence-based phospho-flow cytometry, which has enabled determination of the activity
of intracellular pathways28–37. Interrogation revelation of cellular states is key to the
mechanistic understanding of disease and to elucidation of the positive or negative effects on

4
these pathways after cells have been exposed to therapeutic and potential therapeutic agents in
vitro or in vivo34,38–40.
However, as powerful as fluorescence-based flow cytometry can be, it falls somewhat
short in its ability to simultaneously capture the degree of complexity now well-appreciated in
the immune system. The primary drawback of traditional fluorescence-based flow cytometry
is ironically the same tool that has enabled it to be so useful for nearly three decades. The
spectral overlap precludes the simultaneous measurement of beyond 10 to 17 parameters per
single cell,41,42 making it difficult to simultaneously distinguish highly specific immune cell
types at the same time as measuring signaling events across many pathways.
To address this limitation, Scott Tanner and colleagues at the University of Toronto
embarked upon a remarkable adaptation of inductively coupled plasma-mass spectrometry
(ICP-MS). ICP-MS is routinely used in the mining, metallurgy and semi-conductor industries
and is the method of choice for measuring the elemental composition of materials because it can
detect the contamination of, for example, blood with lead and drinking water with arsenic,
beryllium or heavy metals. In ICP-MS, samples are atomized and ionized in plasma at
temperatures approximating that of the surface of the sun (7500K). The mass spectrometer can
then resolve and quantify elemental components, based on mass-to-charge ratio (m/z), with a
level of sensitivity of parts per quadrillion.
Tanner and colleagues realized that incorporating such attributes into flow cytometry
might dramatically increase the number of parameters that could be measured per single cell.
They reasoned that, rather than being conjugated to fluorophores, antibodies could be
conjugated to stable metal isotopes, such as lanthanides, that are absent or at low abundance in
biological systems, and then adapt ICP-MS instrumentation for their detection42–49. This was the
foundational concept upon which the mass cytometer was developed.
By tagging each antibody with a unique lanthanide isotope, the readout from each
isotope can be correlated with a particular antibody, which in turn can be correlated to levels of
antigen associated with an individual cell. Thus, the number of simultaneously measurable
parameters per cell is now only limited by the number of stable isotopes suitable for conjugating
to antibody reagents. For this to be accomplished, two fundamental technical challenges needed
to be overcome. One was to develop reagents to tag antibodies with stable metal isotopes.
Another was to adapt the ICP mass spectrometer to simultaneously detect multiple isotope tags,
in the form of an ion cloud, associated with a single cell event.

5
The former was accomplished by synthesizing polymeric chelators, which can be
conjugated to antibodies in a ratio of four to five polymers per antibody, with each polymer
capable of carrying 30 metal isotopes46,50,51. At present, a total of 42 purified, stable metal
isotopes are available and compatible with the metal chelating polymer chemistry (Figure 1). A
further six isotopes of platinum, in the form of cisplatin, can be used to directly label
antibodies52. In addition to these channels for antibody measurements, 17 channels can be used
for DNA, barcoding53–56, quantum dots41,57, cell cycle58 and viability59.
The latter was accomplished by designing the ion optics to suppress unwanted,
dominant, low-mass ions from the plasma gas (argon and argon-containing polyatomic ions) or
from the sample itself (carbon, hydrogen, oxygen, phosphorus and nitrogen). These pass into a
quadrupole set up as an ion guide with a low mass cutoff set close to m/z = 80. The higher mass
ions (ranging between 100 and 200 Daltons and encompassing the lanthanide isotopes) pass into
the TOF. The next big distinction is a very fast ion detector, which is specific to the mass
cytometer and provides measurement resolution of one nanosecond. Digital and analog readouts
are algorithmically combined to provide the required dynamic range of detection. Finally, a very
fast data download and processing system is then integrated for storage of data in a modestly
sized file. Thus, the mass cytometer data handling is necessarily very different by comparison
with conventional ICP-MS. Figure 2 depicts ICP-MS instrumentation adapted for
multiparametric single-cell analyses.
Figure 1 A large number of metals are available for a variety of measurements. The lanthanides and other metals
provide 42 stable isotopes for measuring antigen-bound antibodies, MHC tetramers and nucleic acid probes. Rhodium
and iridium, as DNA intercalators, register a cell event. Platinum, in the form of cisplatin:sulfur complexes, is used
as a viability marker. Additionally, cisplatin can be used to label antibodies directly, adding up to six antibody
channels. Iodine, as iodo-deoxyuridine, is used for cell cycle measurements. Six palladium isotopes allow for mass
tag “barcoding” and multiplexed measurement of samples. Adapted from20 with permission from Elsevier.

6
In the few years since its inception, CyTOF has been published in studies involving
drug screens60, cancers61–63, B cell development64,65, stem cell differentiation66,67, T cell
signaling68,69 and specificity70, cell cycle58, trauma71,72, infectious disease73,74, vaccinology75
and innate immunity76, among others. A wide suite of complementary bioinformatics
algorithms followed to support these studies61,64,65,77–81, as have new reagents for measuring
specific RNAs82 and MHC-tetramer complexes70,83.
Many new technologies, CyTOF included, have revolutionized how we conduct basic
science. However, it is remarkable that even with the availability of sophisticated tools for high-
throughput screening, such as robots and sensitive detection systems to rapidly identify new
chemical entities (NCEs) from large compound libraries, no significant increases in either the
rate of approval or the number of approved drugs has resulted. Moreover, even with all the
rigorous testing a compound is subjected to as it transits the developmental process, the highest
rate of attrition, more often than not, manifests in the clinic, making the process of such failures
extremely costly84–88. The archetypal drug development program can be divided into: i)
discovery, ii) preclinical studies, iii) clinical trials and iv) approval and marketing. These tend
to proceed along a linear path with the inevitable imposition of a very long interval (years)
between the identification of an NCE to its eventual administration in humans.
One factor contributing to these setbacks is the disparity between the early stages of
NCE development, using reductionist approaches with purified enzymes and cell lines, and the
later stages of testing in animals and eventual clinical trials in humans. Clearly, it would be very
beneficial if, in the early stages of drug development, there was a deeper understanding of how
different cell types (animal models or human primary samples) harboring disease or reacting to
disease processes, respond to an NCE, and how these responses are likely to translate into
responses in humans. Moreover, any chosen molecular target operates not in isolation but within
a complex circuitry of positive and negative feedback loops. The recent development of high-
dimensional CyTOF mass cytometry offers a potential shift away from reductionist approaches
currently in use for drug development towards a more systems-level characterization based on
a cell-by-cell interrogation.

7
Figure 2 Mass cytometry enables high-dimensional analysis of diseases and therapies. Diseases including
cancers and infections perturb cellular signaling. Mass cytometry provides a readout for up to 55 simultaneous
measurements, both of those disease-induced perturbations and importantly of counter-perturbations induced by
candidate therapeutics. Furthermore, the simultaneous inclusion of cell phenotype and cell cycle provide a more
detailed picture than possible before. After cells are stained with antibodies and other metallic assay reagents, they
are introduced into the mass cytometer as a stream of single cells, then atomized and ionized as they pass through
the inductively coupled plasma (ICP) torch. Low-mass elements (including carbon and nitrogen) are filtered out by
a radio frequency quadrupole before entering the time-of-flight (TOF) detector. A high-speed, online analysis
system produces data equivalent to that of traditional fluorescence-based cytometry. Reproduced from20 with
permission from Elsevier.
In animal models where anti-bacterial and anti-viral agents are being sought, one critical
consideration in their development is how these targeted-microorganisms, encoding a relatively
sparse number of genes, co-opt the immune system of the host. A single-cell systems analysis
has the potential to reveal how microorganisms subvert normal immune pathways. Furthermore,
such analysis should provide at least two important pieces of information: insight into the
immune response mounted in the species being utilized and secondly, relevance of the animal

8
model to the human immune system89,90. Furthermore, the same analyses will also provide an
understanding of the context in which safety features of drugs can be determined with greater
accuracy. Perhaps the greatest shortcut to avoiding a late-stage failure could come from
incorporating single-cell pathway analysis of primary samples into the drug development
process as early as possible and continuing such assays throughout. Cells from biopsies,
peripheral blood and bone marrow could now replace cell lines to indicate pathway and cell-
type suitability for a given NCE.
Both fluorescence- and mass-based flow cytometry have proved suitable for this task.
They both can measure multiple pathways simultaneously using antibodies against intracellular
pathways as well as surface markers to delineate specific cell types. In one proof of principle
study, multi-parametric phospho-flow fluorescence cytometry was used to screen a small library
of compounds and identified a target- and pathway-selective inhibitor of Jak/Stat signaling by
measuring inhibition of potentiated responses to physiologically relevant cytokines in spleen
and peripheral blood38. Recently, mass cytometry was used to profile 27 small molecule kinase
inhibitors (investigational and approved compounds) using PBMCs60. Each inhibitor was
assayed against 14 activated intracellular proteins within 14 immune cell subsets under 12
different stimuli conditions for healthy PBMC samples. Using incubation time and
concentration as variables for each inhibitor, individual samples generated nearly 19,000 data
points. Strikingly, this level of detail revealed previously unrecognized variation in levels of
pathway inhibition across cell types as well as off-target effects. This foundational study
provided a level of detail capable of reclassifying inhibitor selectivity profiles. In this way,
single-cell mass cytometric analysis of primary tissues shows great potential to cull all but the
most promising NCEs in their early stages, and monitor their properties along most of the drug
development processes with the eventual goal of increased success in the clinic
By allowing the simultaneous measurement of more parameters per single cell than ever
before, mass cytometry affords the opportunity to generate reference maps for human, non-
human primate, murine and other species’ immune systems across different species used for
drug development. While it is clear that a far greater understanding of animal models than
presently exists is urgently needed, they can never act as perfect surrogates for humans.
Nevertheless, by understanding relationships between animal models and by recognizing their
limitations, critical questions can be answered about diseases and the drugs being developed to
conquer them.

9
Main Body
Cell type-specific antibody screening in non-human primates
Many key immunology assays, such as flow cytometry, Western blots,
immunohistochemistry and immunofluorescence microscopy, make use of antibodies to
demarcate specific cell types and quantify signaling moieties. Very few antibodies are raised
against non-human primate antigens; instead, researchers typically use anti-human antibodies
that are cross-reactive with the non-human primate species that they are studying. To help
researchers find antibodies for NHP research, the National Institutes of Health supports a
highly valuable database of the cross-reactivity of commercially available antibodies with 13
NHP species (http://www.nhpreagents.org). The database is derived from manufacturer and
investigator reports, and typically provides a simple yes/no statement about whether a clone
stains a species, with occasional comments about staining intensity or specificity. While an
invaluable resource, the database is limited in its coverage. For example, prior to this study,
only 28 CD markers had been evaluated in African green monkeys.
Additionally, with few exceptions, the database lacks information about the cell types
bound by cross-reactive antibodies. Thus, researchers must confirm that each clone they use is
staining the cell population of interest through literature review or experimental verification.
For example, granulocyte and monocyte marker expression is known to be substantially
different in humans than in non-human primates. Anti-human CD33 clone AC104.3E3 was
reported in the NIH database and manufacturer’s datasheet as cross-reactive with rhesus and
cynomolgus macaques, but our lab and others determined that in those species, it prominently
stains granulocytes91,92, while in humans it stains monocytes and classical dendritic cells.
(Like in macaques, CD33 primarily stains granulocytes in mice as well93.) Meanwhile, CD16
is found on granulocytes in humans and sooty mangabeys, but not in macaques or baboons7,8,
which will likely confound animal studies evaluating therapeutic antibodies, which may bind,
transduce signals through and mediate internalization via this Fc receptor9. Another example
is CD56, which is primarily expressed on monocytes in macaques94, but is a canonical NK cell
marker in humans.
Several valuable cross-reactivity screens have been previously reported: Yoshino et
al.95 screened 339 antibodies in cynomolgus macaques, but do not systematically report cell
type-specificity; as part of the animal homologue section of HLDA8, a team of institutes
tested 377 antibodies in Aotus nancymaae splenocytes96, cynomolgus macaque blood97,98 and
10
rhesus macaque blood99, including cell type-specificity in rhesus. Nonetheless, we could not
find a sufficient resource for African green monkeys, nor could we find sufficient information
on specificity of staining in macaques for all of the markers that we sought. The two most
comprehensive datasets for African green monkeys together evaluated 58 clones for a total of
different 28 antigens, not all of which are commercially available100,101.
To aid our design of CyTOF panels for non-human primates, we screened 332
monoclonal antibodies in blood from two individuals of each of four NHP species: rhesus
macaque (Macaca mulatta), cynomolgus macaque (Macaca fascicularis), African green
monkey (Chlorcebus aethiops) and olive/yellow baboon (Papio hamadryas anubis x Papio
hamadryas cynocephalus hybrid). Furthermore, we included counter-stain antibodies that
allowed us to determine staining specificity in at least five major immune cell populations.
Data from the NHPs were compared to the same screen ran in our laboratory on human blood.
While this project segment was originally intended as a stepping stone to help design
our CyTOF panels, the screen yielded a number of interesting conclusions on its own.
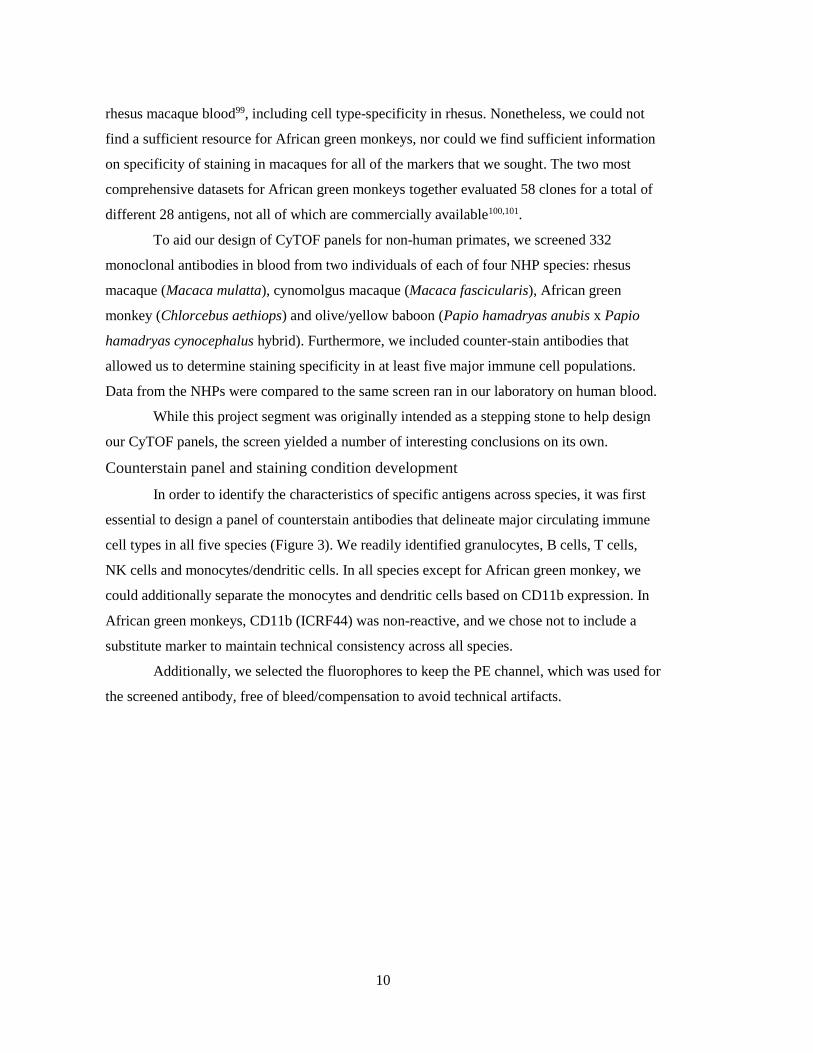
Counterstain panel and staining condition development
In order to identify the characteristics of specific antigens across species, it was first
essential to design a panel of counterstain antibodies that delineate major circulating immune
cell types in all five species (Figure 3). We readily identified granulocytes, B cells, T cells,
NK cells and monocytes/dendritic cells. In all species except for African green monkey, we
could additionally separate the monocytes and dendritic cells based on CD11b expression. In
African green monkeys, CD11b (ICRF44) was non-reactive, and we chose not to include a
substitute marker to maintain technical consistency across all species.
Additionally, we selected the fluorophores to keep the PE channel, which was used for
the screened antibody, free of bleed/compensation to avoid technical artifacts.

11
Figure 3 Five counterstains allow identification of at least five populations. Representative staining from a
baboon shown. After gating by time to exclude artifacts, granulocytes were identified as CD66abce+/SSC-A+.
Non-granulocytes were divided into B cells (CD20+/CD3-), T cells (CD3+/CD20-), NK cells (CD7+/CD3-/CD20-)
and monocytes/dendritic cells (CD7-/CD3-/CD20-). In species other than the African green monkey, dendritic cells
could be separated on the basis of CD11b staining.
Fixation and red blood cell lysis conditions were selected after testing a large number
of protocols on the basis of preserving antigen staining and effectively lysing non-human
primate blood (data not shown). Fixation with approximately 0.3% PFA was low enough to
avoid obvious loss of staining and sufficient to cease morphological changes of cells as
observed as forward and side scatter signals changing over the course of acquisition on the
cytometer. Enzymatic lysis with VersaLyse was highly effective for both human and non-
human primate blood, whereas other methods such as hypotonic lysis were inadequate or
inconsistent for non-human primate blood.
Antibody reactivity screen
We established universal criteria for defining positive expression to determine antigen
expression in an unbiased manner. An antibody clone was classified as reactive with a
population if more than 10 percent of cells had a PE signal intensity greater than the 95th
percentile of the intensity of the corresponding isotype control for the same species and

12
population (Table 1). This threshold was found to accurately reflect the results of manual
classification: we verified 500 of the 14,940 clones x species x populations, taking into
consideration reported staining patterns and the degree of separation from the isotype control,
and calculated a false-positive rate of 7.4% and a false-negative rate of 1.6%, for an initial
accuracy of 91%. Then, we manually verified and corrected as necessary all discordant
replicates and all clones that were classified as reactive in a non-human primate species but
not in a human; thus, our final estimated accuracy exceeds 91%. However, because all data are
publicly available, researchers can independently validate the expression of antigens of
interest by accessing the primary data. In total, we identified 260, 153, 129, 161 and 147
clones that are reactive with one or more populations in human, cynomolgus macaque, rhesus
macaque, African green monkey and baboon, respectively.
Table 1 Summary of cell type-specific cross-reactivity. Clones were considered reactive if at least 10 percent of
cells had a signal greater than the signal of the 95th percentile of corresponding isotype control or were manually
classified as positive. B: B cells, T: T cells, N: CD7+ NK cells, M: CD7- monocytes and dendritic cells, G:
granulocytes, ?: insufficient number of cells for population normally in that position. Two of each non-human
primate species and one human were assayed.
Antibody Clone Human Cyno Rhesus Baboon AGM
CD1a HI149 T G
CD1b SN13 (K5-1B8) T G M T G
CD1c L161 B M B M B M B M B
CD1d 51.1 B M
CD2 RPA-2.10 TN BTN BTN BTNM BTN
CD3 HIT3a T
CD4 RPA-T4 T M T
CD5 UCHT2 BT G
CD6 BL-CD6 BTN G
CD7 CD7-6B7 TN
CD8a HIT8a TN
CD9 HI9a ?T?MG BTNMG BTNMG BTNMG BTNMG
CD10 HI10a BTN G MG G MG G
CD11a HI111 BTNMG M
CD11b CBRM1/5 BT G
CD11b ICRF44 BTNMG B NMG BTNMG B NMG BTNMG
CD11c 3.9 B MG B M B B M
CD13 WM15 T MG T MG
CD14 M5E2 BT MG MG MG G
CD15 W6D3 MG
CD16 3G8 BTNMG TNM TNM TNM N
CD18 TS1/18 BTNMG
CD19 HIB19 B B
CD20 2H7 B B B B N B
CD21 Bu32 BT B B B
CD22 HIB22 B
CD23 EBVCS-5 ?????
CD24 ML5 BTNMG
CD25 BC96 BTN T

13
Antibody Clone Human Cyno Rhesus Baboon AGM
CD26 BA5b TN
CD27 O323 BTN BTN BTN BTNM BTN
CD28 CD28.2 TN T T T T
CD29 TS2/16 BTNMG BTNMG BTNMG BTNMG BTNMG
CD30 BY88
CD31 WM59 BTNMG BTNMG BTNMG BTNMG BTNMG
CD32 FUN-2 BTNMG BT MG BTNMG BTNMG B MG
CD33 WM53 NMG
CD34 581
CD35 E11 ????? BT MG BT MG BT MG B G
CD36 5-271 BTNMG
CD38 HIT2 BTNMG
CD39 A1 BTNMG BTNMG MG BTNMG B MG
CD40 HB14 B M B M B B B M
CD41 HIP8 BTNMG BTNMG BTNMG BTNMG BTNMG
CD42b HIP1 BTNMG
CD43 CD43-10G7 BT?MG T G T T MG
CD44 BJ18 BTNMG BTNMG BTNMG BTNMG BTN G
CD45 HI30 BT?MG
CD45RA HI100 BT?M
CD45RB MEM-55 BTNM BTNMG BTNM BTNM BTN
CD45RO UCHL1 ????? T
CD46 TRA-2-10 BTNMG
CD47 CC2C6 BTNMG BTNMG BTNMG BTNMG BTNMG
CD48 BJ40 BTNMG B M B MG B MG BTNMG
CD49a TS2/7 TNM TN T T G TN
CD49c ASC-1 BTN
CD49d 9F10 BTNMG BTNMG BTNMG BTNMG BTNMG
CD49e NKI-SAM-1 TNMG TNMG TNMG BTNMG BTNMG
CD49f GoH3 BTNMG BTNMG BTNMG BTNMG BTNMG
CD50 CBR-IC3/1 BTNMG TNM TNMG
CD51 NKI-M9
CD51,CD61 23C6 B M T M
CD52 HI186 BTNMG M M
CD53 HI29 BTNMG
CD54 HA58 BTNMG
CD55 JS11 BTNMG G G G
CD56 HCD56 N NM NM NM N
CD57 HCD57 N
CD58 TS2/9 BTNMG BTNMG BTNMG BTNMG BTNMG
CD59 p282 (H19) BTNMG BTNMG BTNMG BTNMG
CD61 VI-PL2 BTNMG BTNMG BTNMG BTNMG BTNMG
CD62E HAE-1f
CD62L DREG-56 BTNMG
CD62P AK4
CD63 H5C6 BTNMG BTNMG BTNMG BTNMG BTNMG
CD64 10.1 MG MG NMG MG MG
CD66a/b/c/e TET2* G G G G G
CD66a/c/e ASL-32 G
CD66b G10F5 G
CD69 FN50 TNM TN TN G B N

14
Antibody Clone Human Cyno Rhesus Baboon AGM
CD70 113-16 T
CD71 CY1G4 BTNM
CD73 AD2 BT G TN TN G
CD74 LN2 BT MG B M B MG B M BT MG
CD79b CB3-1 BTNMG T G G T G T M
CD80 2D10 BTN
CD81 5A6 BTNMG T M BT M BT MG BTNMG
CD82 ASL-24 BTNMG T G T G T G
CD83 HB15e T G T BT M BT
CD84 CD84.1.21 BTNMG BTNMG BTNMG BTNMG BTNMG
CD85 17G10.2
CD85 GHI/75 BTNMG
CD85 MKT5.1 T MG MG MG G G
CD85d 42D1 T MG
CD85h 24 MG G
CD85k ZM4.1 M
CD86 IT2.2 BT MG B M B MG BT MG BT MG
CD87 VIM5 T MG MG BTNMG MG NMG
CD88 S5/1 BTNMG G T
CD89 A59 NMG NMG NMG MG T G
CD90 5E10 BTNMG BTNMG BTNMG BTNMG
CD93 VIMD2 M MG MG TNMG TNMG
CD94 DX22 TN T G T T
CD95 DX2 BTNMG BTNMG BTNMG BTNMG BTNMG
CD96 NK92.39 TN G
CD97 VIM3b BTNMG B
CD99 HCD99 BT?MG TN T T MG
CD100 A8 BTNMG BTNM BTNM BTNMG BTNM
CD101 BB27 BT MG T MG BTNMG T MG MG
CD102 CBR-IC2/2 BTNMG BTNMG BTNM BTNM BTNMG
CD103 Ber-ACT8
CD104 58XB4
CD105 43A3 NM
CD106 STA
CD107a H4A3 BTNMG T G BTN BT MG BTNMG
CD108 MEM-150 B NM B B B B
CD109 W7C5 TNM NM TN
CD111 R1.302 N
CD112 TX31 T MG
CD114 LMM741 NMG G
CD115 9-4D2-1E4 G G TN G M T G
CD116 4H1 T MG T
CD117 104D2 N
CD119 GIR-208 BTNMG BTNMG BTNMG BTNMG BTNMG
CD122 TU27 TN N N N N
CD123 6H6 B NM
CD124 G077F6 B
CD126 UV4 TNMG T M T T T
CD127 A019D5 TN T T TN T
CD129 AH9R7 TN TN T G
CD131 1C1 MG MG MG MG G

15
Antibody Clone Human Cyno Rhesus Baboon AGM
CD132 TUGh4 BTNMG MG G T MG
CD134 Ber-ACT35
(ACT35)
T
CD135 BV10A4H2
CD137 4B4-1
CD138 DL-101 TNMG T G T MG T G
CD140a 16A1
CD140b 18A2 G G T G T G
CD141 M80 MG M MG
CD143 5-369 T G
CD144 BV9
CD146 SHM-57 BTNMG MG BTNMG T MG
CD148 A3 BTNMG
CD150 A12 (7D4) BT BT BT BT BT
CD152 L3D10
CD154 24-31 BTNMG
CD155 SKII.4 NMG
CD156c SHM14 BTNMG BTNMG BTNMG BTNMG BTNMG
CD158a/h HP-MA4 N N N G
CD158b DX27 N
CD158d mAb 33 (33) TN G
CD158e1 DX9 N
CD158f UP-R1 T MG
CD161 HP-3G10 TNMG TN TNM TNMG N
CD162 KPL-1 BTNMG BTNMG BTNMG BTNMG BTNMG
CD163 GHI/61 M MG MG G
CD164 67D2 BTNMG BTNMG BTNMG BTNMG BTNMG
CD165 SN2 (N6-D11) BTNMG BTNMG B BTNMG BTNMG
CD166 3A6 BTNMG BTNMG BT MG BT MG BTNMG
CD167a 51D6
CD169 7-239
CD170 1A5 NMG
CD172a SE5A5 T MG T MG TNMG MG MG
CD172b B4B6 MG
CD172g LSB2.20 T G MG TNMG TNMG MG
CD178 NOK-1 G MG
CD179a HSL96 T
CD179b HSL11 BT M
CD180 MHR73-11 B M B M B M B M B M
CD181 8F1/CXCR1 TNMG
CD182 5E8/CXCR2 NMG
CD183 G025H7 BTNMG BTNMG BTNM BTNMG BTNMG
CD184 12G5 BTNMG BTNMG BTNMG BTNMG BTNMG
CD193 5E8 T M
CD195 T21/8 BTNMG T MG MG T M T MG
CD196 G034E3 BTNM BTN G BTN BTN BTNMG
CD197 G043H7 BT G BT BT BTN BT
CD200 OX-104 BT G BT B
CD200R OX-108 BTNMG BT MG
CD201 RCR-401
CD202b 33.1 (Ab33)

16
Antibody Clone Human Cyno Rhesus Baboon AGM
CD203c NP4D6
CD205 HD30 G BT MG T MG T MG TNMG
CD206 15-2
CD207 10E2
CD209 9E9A8
CD210 3F9 BTNMG BTNM M BTN BTNMG
CD213a2 SHM38 T G T
CD215 JM7A4 T G T G TN G T G T G
CD218a H44 TNMG N TN TN TN G
CD220 B6.220 M MG M M MG
CD221 1H7/CD221 TNMG T MG T BTN G N G
CD226 11A8 BTNMG BTNMG BTNMG BTNMG BTNMG
CD229 HLy-9.1.25 BTN
CD231 SN1a (M3-3D9) T G G T T
CD235ab HIR2 B
CD243 UIC2 BTNMG T T
CD244 C1.7 TNM
CD245 DY12 TNMG M TN M
CD252 11C3.1 G T G
CD253 RIK-2 TN G N
CD254 MIH24 G
CD255 CARL-1 T T
CD257 T7-241 BT MG T G TN G T MG BT MG
CD258 T5-39 TN
CD261 DJR1 G T T
CD262 DJR2-4 (7-8) T MG
CD263 DJR3 G
CD266 ITEM-1 T
CD267 1A1 B B B B B
CD268 11C1 BT BT M B BT MG BT MG
CD271 ME20.4 N TNM TNM BTNM TNM
CD272 MIH26 BT G
CD273 24F.10C12 T G TNM TNM T M M
CD274 29E.2A3 BTNMG T G N G T MG BTNMG
CD275 9F.8A4 B
CD276 MIH42 TN G N N TN
CD277 BT3.1 BTNMG B B BTNM BTN
CD278 C398.4A TN T T T T
CD279 EH12.2H7 T T T T T
CD282 TL2.1 B MG
CD284 HTA125 T M
CD286 TLR6.127 MG
CD290 3C10C5 B B
CD294 BM16 MG
CD298 LNH-94 BTNMG BTNMG BTNMG BTNMG BTNMG
CD300e UP-H2 M
CD300F UP-D2 M
CD301 H037G3 BT MG T MG BT MG BT MG
CD303 201A
CD304 12C2
CD307e 509f6 B

17
Antibody Clone Human Cyno Rhesus Baboon AGM
CD314 1D11 TN G TN TN TN N
CD317 RS38E BTNMG BTNMG BTNM BTNMG BTNMG
CD318 CUB1
CD319 162.1 BTNM G
CD324 67A4
CD325 8C11 G
CD326 9C4
CD328 6-434 NMG
CD334 4FR6D3
CD335 9E2 N
CD336 P44-8
CD337 P30-15 N N N N N
CD338 5D3
CD340 24D2
CD344 CH3A4A7 TNMG TN G
CD351 TX61 N G
CD352 NT-7 BTNMG T MG T G T
CD354 TREM-26 TNMG MG T G MG G
CD355 Cr24.1
CD357 621 TNMG T G TN G T G T MG
CD360 2G1-K12 BTNM BTNM BTNM BTNM B NM
4-1BB Ligand 5F4 TNMG T G TN T G TNMG
C3aR hC3aRZ8 TNMG
C5L2 1D9-M12 TNMG BTNMG BTNMG BTNMG BTNMG
CCR10 6588-5 BTNMG B MG BTNMG BT MG BT MG
CLEC12A 50C1 MG
CLEC9A 8F9
CX3CR1 2A9-1 TNMG MG G M
CXCR7 8F11-M16
Delta Opioid
Receptor
DOR7D2A4
DLL1 MHD1-314
DLL4 MHD4-46
DR3 JD3
EGFR AY13
erbB3 1B4C3
FcRL4 413D12
FcRL6 2H3 N B
FcεRIα AER-37 (CRA-1) M M M M
Galectin-9 9M1-3 T G BT G BT G T
GARP 7B11
HLA-A2 BB7.2
HLA-A,B,C W6/32 BTNMG BTNMG BTNMG BTNMG BTNMG
HLA-DQ HLADQ1 B
HLA-DR L243 BTNM B MG BTNMG BTNMG BTNMG
HLA-E 3D12 BTNMG
HLA-G 87G MG MG M
HVEM 122 BTNMG BTNMG BTNM BTNMG BTNMG
IFN-γ R b chain 2HUB-159 T MG G T T T MG
IgD IA6-2 B
IgG1, κ Isotype Ctrl MOPC-21

18
Antibody Clone Human Cyno Rhesus Baboon AGM
IgG1, κ Isotype Ctrl RTK2071
IgG2a, κ Isotype
Ctrl
MOPC-173
IgG2a, κ Isotype
Ctrl
RTK2758
IgG2b, κ Isotype
Ctrl
MPC-11
IgG2b, κ Isotype
Ctrl
RTK4530
IgG3,k Isotype Ctrl MG3-35
IgG Isotype Ctrl HTK888
Ig light chain κ MHK-49 B MG G
Ig light chain λ MHL-38 B M B MG B MG B MG
IgM MHM-88 B NMG B MG B NMG BTNMG BTNMG
IgM, κ Isotype Ctrl MM-30
IgM, κ Isotype Ctrl RTK2118
IL-28RA MHLICR2a
Integrin α9β1 Y9A2 MG G N N N G
integrin β5 AST-3T G
Integrin β7 FIB504 BTNMG BTNM BTNMG BTNMG BTNMG
Jagged 2 MHJ2-523 N
LAP TW4-6H10 M MG M T M
Lymphotoxin β
Receptor
31G4D8 M M M BT MG
Mac-2 Gal397 T G T G T G T G
MAIR-II TX45 ????? T G T T T G
MICA/MICB 6D4
MSC W7C6 T T T G T M T
MSC,NPC W4A5 BT MG T G BTNMG BT MG BT MG
NKp80 5D12 N TN TNM TNM TN
Notch 1 MHN1-519 N
Notch 2 MHN2-25 M M
Notch3 MHN3-21
Notch 4 MHN4-2
NPC 57D2 ????? T
Podoplanin NC-08
Pre-BCR HSL2 MG M M
PSMA LNI-17
Siglec-10 5G6 B M MG
Siglec-8 7C9 N
Siglec-9 K8 NMG
SSEA-1 MC-480 G
SSEA-3 MC-631 B
SSEA-4 MC-813-70 MG G G
SSEA-5 8E11 T T
SUSD2 W3D5 B TN BT MG
SUSD2 W5C5 N TNM G BTNMG
TCR gamma/delta B1 T G T TN TN T
TCR Vα24-Jα18 6B11
TCR Vα7.2 3C10 T
TCR Vβ13.2 H132 ?????

19
Antibody Clone Human Cyno Rhesus Baboon AGM
TCR Vβ23 αHUT7
TCR Vβ8 JR2 (JR.2)
TCR Vβ9 MKB1
TCR Vδ2 B6
TCR α/β IP26 T
Tim-1 1D12 N G
Tim-3 F38-2E2 N
Tim-4 9F4
TLT-2 MIH61 ?????
TNAP W8B2 G G B MG B G
TRA-1-60-R TRA-1-60-R
TRA-1-81 TRA-1-81 N
TSLPR 1B4 M
Vγ9 B3
β2-microglobulin 2M2 BT?MG B N B B B
We highly encourage researchers who are evaluating antibodies to examine the
primary data by visiting www.immuneatlas.org. This website provides an easy-to-use interface
for downloading the raw FCS files, gating populations and calculating statistics. Researchers
can directly compare the relative staining intensity and distribution of staining between
species. We especially encourage review when evaluating antibodies that stain rare
populations—specifically populations that comprise less than 10 percent of a population that
we report in Table 1 or that are dim and that would thus likely be excluded by our threshold.
Additionally, we encourage due diligence when interpreting markers such as CD41 and
CD51/CD61, which are listed as reactive with all cell types, but in actuality are probably
staining platelet debris stuck to other cells, furthermore keeping in mind that actual antibody-
antigen specificity may vary by species due to differences in gene sequence and protein
structure.
Earlier we discussed that in macaques, CD33 is found on granulocytes, and CD16 is
restricted to monocytes and dendritic cells. In this study, we found that African green
monkeys share this same staining pattern, albeit with weaker CD33 staining. Another notable
difference out of the many that we found is that CD172g (signal regulatory protein (SIRP) γ,
also known as SIRPβ2) is expressed on CD11b+ monocytes and granulocytes, but not on T
cells, in all of the NHP species examined, whereas the marker is expressed on T cells, some B
cells and perhaps granulocytes in humans (Figure 4). Meanwhile, both the ligand, CD47, and
the related protein CD172a (SIRPα), which also binds CD47 but with higher affinity102, have
comparable expression patterns between all species (see www.immuneatlas.org). Because it
lacks a cytoplasmic signaling domain, CD172g is postulated to signal unidirectionally by

20
activating the CD47-expressing cell and inducing T cell migration and proliferation in
humans, mice and rats102–104. Thus, our finding suggests a major difference in regulation of
immune cell migration and adaptive response, which warrants further study.
Another exemplary difference is the finding that CD90 stains essentially all
leukocytes in all examined NHP species, whereas it does not stain circulating human cells—a
finding consistent with a prior study in cynomolgus macaques95.
A final example of the differences we found is the presence of CD2 staining not only
on T cells, but also on B cells in rhesus macaque, cynomolgus macaque, African green
monkey and to a lesser extent baboon (Figure 5). CD2 is involved in adhesion, co-stimulation,
antigen recognition and potentially differentiation105,106. In mice, virtually all circulating and
bone marrow B cells express CD2105. Kingma et al. previously reported that only a small
subset (5.74 +/- 2.46%) of normal human peripheral blood B cells express CD2, although
approximately 25% of surveyed B cell neoplasms expressed CD2107. We observed no CD2+ B
cells in human. B cell CD2 expression thus seems to have been progressively lost
evolutionarily, with the most abundant expression in the oldest species (mouse), moderate
expression in macaques and African greens, less expression in baboons and essentially no
expression in the youngest species (human). Interestingly, the ligand is not conserved between
species: CD2 exclusively binds CD48 in mice and rats, while in humans it strongly binds
CD58 and only weakly binds CD48, which is also co-expressed with CD58106,108.

21
Figure 4 CD172g is expressed on monocytes and all granulocytes, but not on T cells, in examined NHP
species. By comparison, CD172g is expressed on all T cells, a subset of granulocytes and a subset of B cells (data
not shown) in humans. As discussed, CD11b did not uniformly stain AGMs; thus, some of the CD11b-negative
cells are monocytes. Blue: isotype control, orange: CD172g.

22
Figure 5 CD2 is expressed on B cells in NHPs.
This screen is especially valuable for the advancement of African green monkey
immunology because there is a dearth of literature discussing immunophenotyping and only
28 reactive antibodies are listed in the NIH database. Nonetheless, this species is important in
drug development—especially SIV research—and is the subject of an international effort to
make it the most comprehensively characterized NHP by phenotype and genomics109. Its
usage is furthermore accelerating due to a shortage of rhesus macaques for research110.
While we screened 332 different antibody clones, not all of the antigens targeted by
those antibodies are expected to be present in resting, peripheral blood cells. Indeed, only
78.3% (260/332) of the antibodies stained human blood. Thus, our screen did not evaluate
markers that are found only in cells from bone marrow and other tissues, in progenitors or in
activated populations. However, blood is the most easily accessed and likely the most
common biological sample type used in research environments, and we thus expected it to be
of the greatest use to most researchers. Likewise, it was the tissue of choice for our CyTOF
assays. For other applications, researchers may benefit from targeted studies such as Sopper et
al., in which they tested approximately 100 monoclonal antibodies in blood, lymph nodes and
spleen of rhesus macaques111, or Conrad et al., in which they tested only TCR and CD3
antibodies but in 44 species112.
Design and production of universal phenotyping and signaling assays
Using the data generated from the antibody screen, along with numerous targeted
experiments and copious literature review to help shape the gating strategy, we designed
panels for humans, macaques, African green monkeys and mice (Table 2, Table 6, Table 7,

23
Table 8). We aimed to identify the same populations in all species, using the same epitope and
clone whenever possible. We considered a large volume of literature concerning species-
specific cell subsets and previously validated panels, taking into account that orthologous
populations may have different surface marker expression profiles in different species. For
example, our separation of mDCs and pDCs on the basis of CD1c, CD11c and CD123 is
consistent with the comprehensive review of NHP DCs by Jesudason et al.113 and study by
Dutertre et al.114, and our use of CD7 as a pan-NK marker in macaques is consistent with
Webster et al.’s report on macaque NK subsets.115 (Note, however, Dutertre et al. also report
that BDCA3 stains macaque CD1c+ mDC and is thus not specific to XCR1+ mDCs114.) Our
panel includes all but one marker (CD34) of the 12 that were validated by Autissier et al. for
studying lymphocyte, monocyte and dendritic cell subsets in humans116, and all of the markers
that they validated for macaque phenotyping using a very similar panel117; furthermore, our
panel includes an additional 12 phenotyping markers, allowing even deeper analysis.
In most cases we were able to use the same clones for both humans and non-human
primates, and in most cases we were able to use the same epitopes for all species (Table 2). In
the case of erythrocytes, we decided to use the common marker CD235a for humans and
CD233 for NHPs, instead of using the less common CD233 for all species (no anti-CD235
clone reactive with NHPs could be found). In the case of CD11c, clone 3.9 was only used in
non-human primates because Bu15 was non-reactive, but 3.9 is reported to preferentially bind
activated CD11c118 and requires the addition of magnesium as a cofactor during staining118,119.
In the case of naïve and memory T cells, we observed very broad distribution of CD45RA
staining, as previously reported120,121, with two clones (5H9 and HI100), which was difficult to
gate (see www.immuneatlas.org). Staining of this marker was superior with the VersaLyse-
based method than with the Triton-X100-based method (see methods) (data not shown). We
were largely able to use the same clones for African green monkeys as we were for macaques,
with several exceptions. No reactive clones were found for CD11c; instead, we rely on CD16
for gating monocyte subpopulations and CD123, CD1c and BDCA3 for gating dendritic cell
subpopulations.

24
Table 2 Phenotyping panels for humans, mice, macaques and African green monkeys, grouped by canonical target.
Antibodies listed as “epitope (clone)”. See supplementary tables for vendor, metal conjugate and staining
concentration.
Canonical
Target
Human Mouse Macaque African green
Lymph/mono CD45 (HI30) CD45.2 (104) and
pan-CD45 (30-
F11)
CD45 (DO58-
1283)
CD45 (DO58-
1283)
Erythrocytes CD235a (HIR2) Ter119 (TER-119) CD233 (BRIC6)
Platelets CD61 (VI-PL2) CD61 (2C9.G2) CD61 (VI-PL2) CD61 (VI-PL2)
Granulocytes CD66abce
(TET2)
Ly6G (1A8) CD66abce
(TET2)
CD66abce
(TET2)
Granulocytes FcεRIα (MAR-1) CD33
(AC104.3E3)
Basophils CD123 (7G3) FcεRIα (MAR-1) CD123 (7G3)
B cells CD19 (J3-119) CD19 (6D5) CD20 (2H7) CD20 (2H7)
B cells B220 (RA3-6B2)
B cells, class-
switched
IgM (G20-127) IgM (RMM-1) IgM (G20-127) IgM (G20-127)
APCs (B, DC) HLA-DR
(Immu357)
MHC II
(M5/114.15.2)
HLA-DR
(Immu357)
HLA-DR
(Immu357)
DCs, B cells CD1c (AD5-8E7) CD1c (AD5-8E7) CD1c (AD5-8E7)
cDCs BDCA3 (1A4) (CD8) BDCA3 (1A4) BDCA3 (1A4)
pDCs CD123 (7G3) BST-2 (120g8) CD123 (7G3) CD123 (7G3)
T subset CCR7 (150503) CD62L (MEL-14) CCR7 (150503-
FITC)
T cells CD3 (SP34.2) CD3 (17A2) CD3 (SP34.2) CD3 (SP34.2)
CD4+ T cells CD4 (OKT4) CD4 (RM4-5) CD4 (OKT4) CD4 (L200)
CD8+ T cells CD8 (RPA-T8) CD8 (53-6.7) CD8 (RPA-T8) CD8 (RPA-T8)
Naïve T cells CD45RA
(HI100)
CD44 (IM7) CD45RA
(HI100)
Myeloid cells CD11b (ICRF44) CD11b (M1/70) CD11b (ICRF44) CD11b (ICRF44)
Myeloid, T
subset
CD11c (Bu15) CD11c (HL3) CD11c (3.9) CD11c (3.9)
Monocytes CD14 (M5E2) Ly6C (HK1.4) CD14 (M5E2) CD14 (M5E2)
NK, mono, gran CD16 (3G8) CD16/32 (2.4G2) CD16 (3G8) CD16 (3G8)
Myeloid CD33
(AC104.3E3)
CD115 (CSF-1R)
Monocytes CD56
(NCAM16.2)
CD56
(NCAM16.2)
NK cells CD56
(NCAM16.2)
CD49b (HMa2)
NK cells CD7 (M-T701) CD7 (M-T701) CD7 (M-T701)
NK cells CD161 (HP-
G310)
NK1.1/CD161c
(PK126)
CD161 (HP-
G310)
CD161 (HP-
G310)
These panels enabled parallel gating of all five species (Figure 6, Figure 7). Note that
these hierarchies only show the major populations and make use of a subset of our
phenotyping panel. It is possible to further subset most of these populations—for example,
25
NK cells can be further subset based on CD20, CCR7 and CD56—and it is our hope that
interested researchers will explore the raw data on www.immuneatlas.org.
We designed the stimuli panel and complementary signaling antibody panels in
tandem. Signaling epitopes are highly conserved and, with only one exception, the same
clones were usable in all five species (Table 9). The stimuli and readouts were selected for
their clinical relevance and their roles in disease and innate immunity (Table 3, Table 5, Table
9). Many of the stimuli are recombinant cytokines; these recombinant proteins were preferably
species-matched, i.e. recombinant rhesus cytokines were used in rhesus macaque blood.
Where no suitable proteins were found, we used the closest species available (e.g. macaque
cytokines were frequently used in African green monkey blood).
Table 3 Signaling antibodies. See supplementary tables for vendor, metal conjugate and staining concentration.
Protein epitope (clone)
STAT1 pY701 (4a)
STAT3 pY705 (4)
STAT4 pY693 (38)
STAT5 pY694 (46)
STAT6 pY691 (human: 18, mouse: J71-
773.58.11)
Ki67 (SolA15)
Erk1/2 pT202/Y204 (D13.14.4E)
MAPKAPK2 pT334 (27B7)
CREB pS133 (87G3)
IkBa total (L35A5)
TBK1/NAK pS172 (D52C2)
S6 pS235/236 (2F9)
Zap70/Syk pY319/Y352 (17a)
4E-BP1 pT37/46 (236B4)
PLCγ2 pY759 (K86-689.37)
P38 pT180/Y182 (36/p38)

26
Figure 6 Parallel gating hierarchy in all four primate species.

27
Figure 7 Mouse gating hierarchy, paralleling Figure 6.
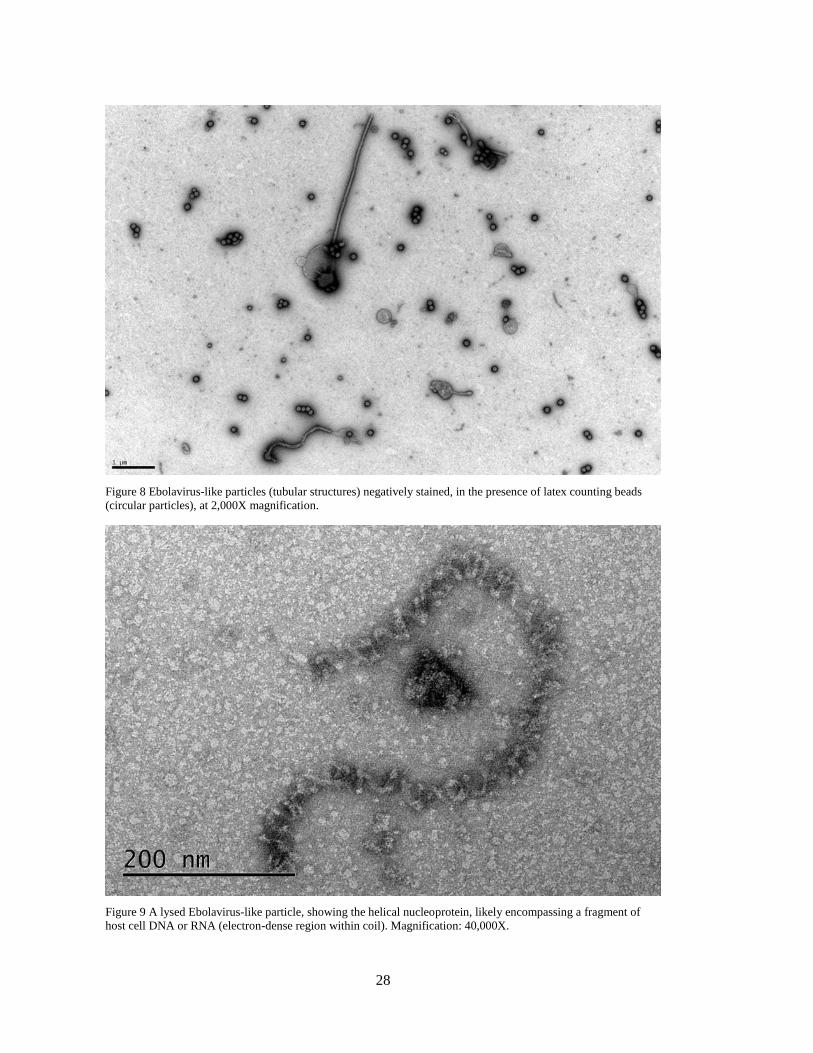
With the help of NIH NIAID Integrated Research Facility (IRF), we produced Zaire
Ebolavirus-like particles (VLPs) comprised of four viral proteins that self-assemble into a
structure resembling the native virion122,123. These particles are inherently replication-defective
and when administered to non-human primates evoke a vaccinating immune response124–126,
furthermore eliciting type I interferon and proinflammatory cytokine expression127. We
initially characterized the particles by western blot to confirm presence of all four constituents
and by electron microscopy (EM) to estimate titer and particle dimensions (Figure 8, Figure
9). Batches were produced each week due to poor stability, and typically could not be
validated prior to use as a stimulation condition. Instead we validated a random subset of the
batches by EM retrospectively. Nonetheless, EM grids were prepared and stored for all VLP
preparations, and time permitting the remaining grids may be imaged.
28
Figure 8 Ebolavirus-like particles (tubular structures) negatively stained, in the presence of latex counting beads
(circular particles), at 2,000X magnification.
Figure 9 A lysed Ebolavirus-like particle, showing the helical nucleoprotein, likely encompassing a fragment of
host cell DNA or RNA (electron-dense region within coil). Magnification: 40,000X.

29
The particular type of LPS (long chain derived from E. coli O111:B4) was selected
because it is from a pathogenic strain more commonly found in clinical cases128.
Midway through the study, we had to cease usage of inactivated Bacillus as a
stimulation condition due to the third-party discovery that the institute that generated the
material could not guarantee complete inactivation. At the same time, generation and usage of
the Ebolavirus-like particles was also suspended to avoid usage of materials that would
potentially be perceived by the public as hazardous.
Numerous steps were taken to reduce error and technical variability. All antibodies
were conjugated on the milligram-scale such that a single lot could be used for all samples.
Antibody cocktails for staining cells were cryo-lyophilized into single-use pellets to stabilize
the conjugates and eliminate pipetting errors from repeatedly assembling cocktails. Likewise,
all stimuli that were stable at -80 degrees C were dispensed once along with diluent into
single-use plates. Whole blood was used instead of PBMCs to avoid perturbations and
inconsistency from density gradient isolations. We employed mass-tag barcoding to combine
all stimulation conditions into a single tube per donor, eliminating variability in staining
volume and processing. The entirety of our assay was automated: after whole blood was
manually transferred from vacutainers to multichannel reservoirs, an automation platform
consisting of liquid handlers, centrifuges, an incubator, aspirators and robotic arms was
employed for stimulation, fixation, lysis, barcoding, two-step staining and washing. This alone
was a significant advancement in automation; others have reported that this would be
impossible129. Quality control tests were run on the CyTOF before every sample, and internal
normalization standards were included with samples to control for variability during runs.
Finally, all custom analysis code has been annotated step-by-step and made publicly available
along with detailed records from antibody conjugations and blood processing.
Cell type frequency, surface marker expression and signaling response
reference ranges across species
Using the hierarchy shown in Figure 6 and Figure 7, we gated blood cells all species
in parallel. The frequencies of these cell types in each species are shown in Figure 10. The
frequencies of many populations were significantly different between species; several major
examples are as follows:
More CD4+/CD8+ double-positive T cells in macaques than in humans, mice or
AGMs (see discussion in section CD4+CD8+ double-positive T cells are more
abundant in macaques and display unique responses to different type I interferons).

30
Approximately 10x fewer neutrophils in mice than all primates.
Approximately 3x more B cells in NHPs than humans, and 10x more in mice than
humans.
Higher ratio of classical to non-classical monocytes in humans than any other species.
Figure 10 Frequencies of gated cell types by species. Center line: median; Box: 25th to 75th quantile; Whiskers: 1.5x
interquartile range.

31
Interestingly, when we clustered the species by their cell type frequencies alone, we
recapitulated the evolutionary tree (Figure 11): rhesus and cynomolgus macaques diverged
most recently, 1.5 to 3.5 Ma; macaques and African green monkeys diverged 11.5 to 14 Ma;
Old World monkeys and humans diverged 20-38 Ma and mice diverged more than 90 Ma130–
132. This result brings up an intriguing possibility for subsequent and more in-depth analysis of
large numbers of species to look for critical junctures in the evolution of the immune system.
Figure 11 Clustering of pairwise correlations of cell type frequencies recapitulates the evolutionary tree. Metric:
𝑃𝑒𝑎𝑟𝑠𝑜𝑛𝐶𝑜𝑟𝑟𝑒𝑙𝑎𝑡𝑖𝑜𝑛[𝑠𝑝𝑒𝑐𝑖𝑒𝑠1, 𝑠𝑝𝑒𝑐𝑖𝑒𝑠2]2; distance function: Euclidean; linkage: average.
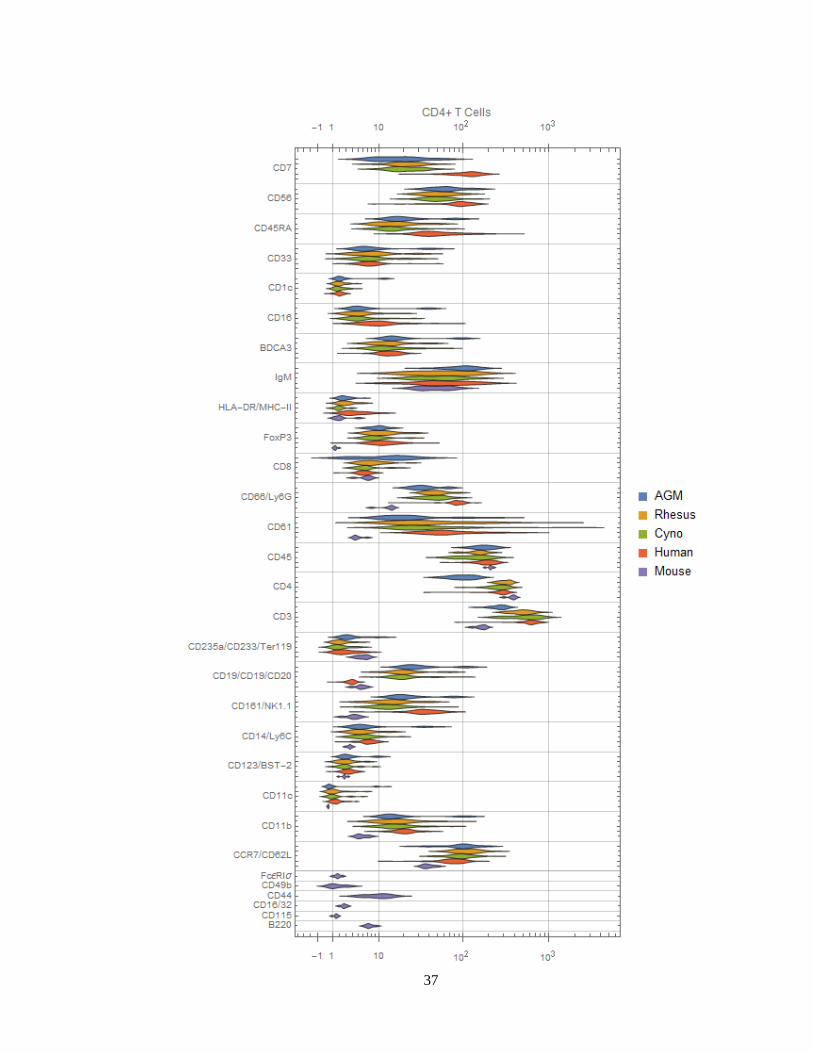
To assess the phenotypes of these populations, we then plotted the distributions of
staining intensities of every surface marker in every species by population (Figure 12). These
plots allow for the observation of differential expression of markers. For example:
Neutrophils in humans express high levels of CD16 (as discussed in section Cell type-
specific antibody screening in non-human primates) and moderate levels of CD11c, in
contrast to all three NHP species. Neutrophils in the three NHP species express higher
levels of CCR7. Neutrophils in mice express moderate levels of CD16/32.
Macaque B cells express higher levels of CD1c than humans or African green
monkeys. See section CD1c+ B cells are more abundant in macaques.

32
Both CD4+ and CD8+ T cells in humans express higher levels of CD161 and CD7
than NHPs. Mice also do not express NK1.1 (CD161) in these populations.
NHP NK cells express higher levels of CD8 than humans. This is consistent with
Autssier et al.,117 although one must not ignore the fact that some human NK cells also
express CD8133.
African green monkey classical monocytes stain brightly for BDCA3—a canonical
dendritic cell subset marker in humans.
Although these differences most certainly reflect biological differences between
species, due to genetic variation of antigens that may affect binding affinity between species,
differences in staining intensities should also be interpreted with caution. One must also
consider the possibility for cross-reactivity with different epitopes and populations in NHPs
than in humans, against which most of these antibodies were raised. For this reason, in the
discussion here we primarily focus on cases where a marker is present in one or more species
and essentially absent in another, and furthermore on cases that we are able to corroborate
through further data mining and literature review. Several examples of caveats to consider
include:
While human NK cells, B cells and nonclassical monocytes appear to express higher
amounts of CD45RA, we previously observed what appears to be a difference in
affinity for this clone between NHPs and humans.
Because humans were stained with anti-CD19 and NHPs with anti-CD20, we cannot
necessarily conclude that the difference in staining of this canonical B cell marker is
significantly different. Furthermore, CD19 appears to have higher background in
many populations.
As discussed earlier, although CD11c is known to exist in AGMs113, no CD11c clone
could be found that is cross reactive with AGMs and sensitive enough for our CyTOF
panel. This marker is thus negative in all populations in AGMs.
The moderate wide-spread staining of CD61, which canonically stains platelets,
monocytes and macrophages, could be due to platelet debris sticking to other cell
types during processing and have no biological meaning. However, this marker has
also been proposed to be acquired by activated T cells from platelet-derived
microvesicles134. In previous studies with cynomolgus macaques, we observed subsets
T cells, B cell subsets and NK cells that stain for CD61 (Figure 13), which could
indicate that this is an activation marker in more than just T cells in macaques.

33
Figure 12 (next 12 pages) Distribution charts of surface markers for each species by population. Different markers
are grouped together if they were on the same channel and stain similar cell types between species (e.g.
CD235a/CD233/Ter119 are all on In113 and stain erythrocytes), and are labeled as “[all species]”,
“[primates]/[mice]” or “[humans]/[non-human primates]/[mice]”.

34

35

36
37

38

39

40

41

42

43

44

45

46
Figure 13 CD61 expression on 37 cell types in cynomolgus macaque PBMCs. Circles are SPADE77 clusters of
similar cells.
Finally, we can visualize signaling behaviors by species (Figure 14). These charts are
meant to provide a compact, semi-quantitative overview of this large dataset. One must take
into consideration necessary technical caveats associated with dosing and activity if

47
attempting to make precise quantitative conclusions: When available, we used cytokines
specific to each species and dosed at the same mass concentration (i.e. mg/mL) as we dosed
for humans as opposed to attempting to coordinate species-specific ECx values. Thus,
quantitative comparisons in response must be verified by closer examination of controls
and/or by performing additional experiments such as dose-response curves. To that end, we
advise examination of other signaling antibodies, stimulation conditions and/or other cell
types, which can usually serve as internal controls.
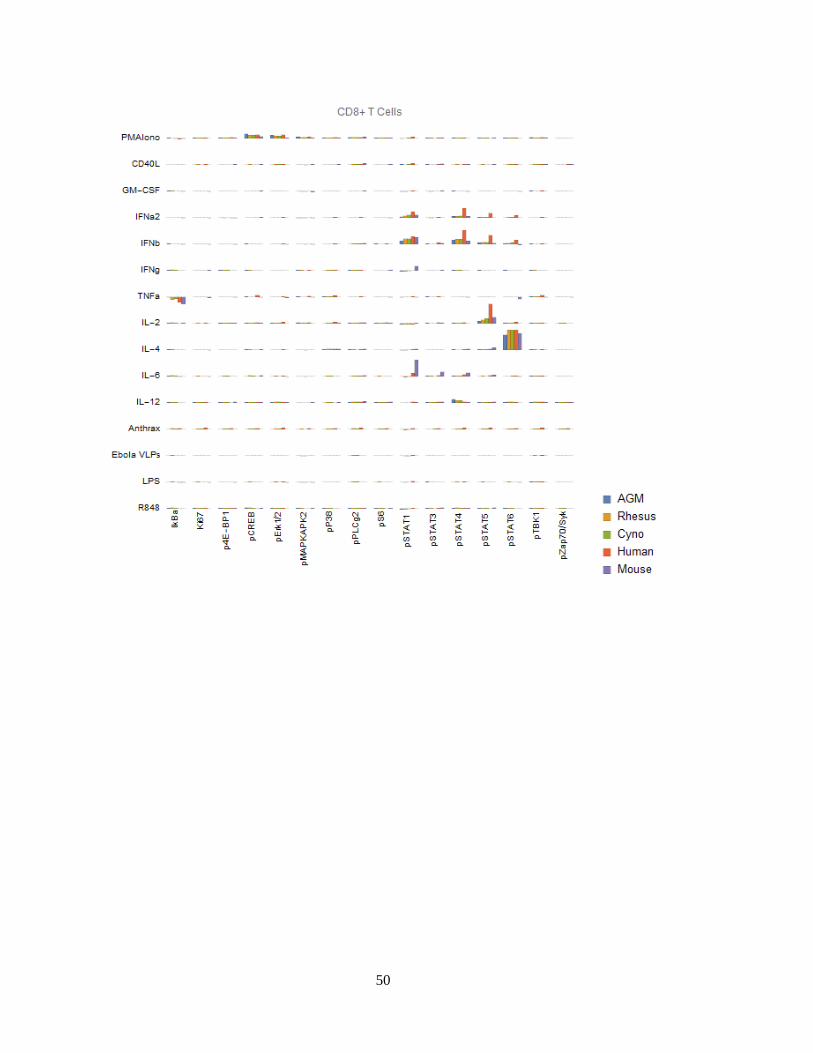
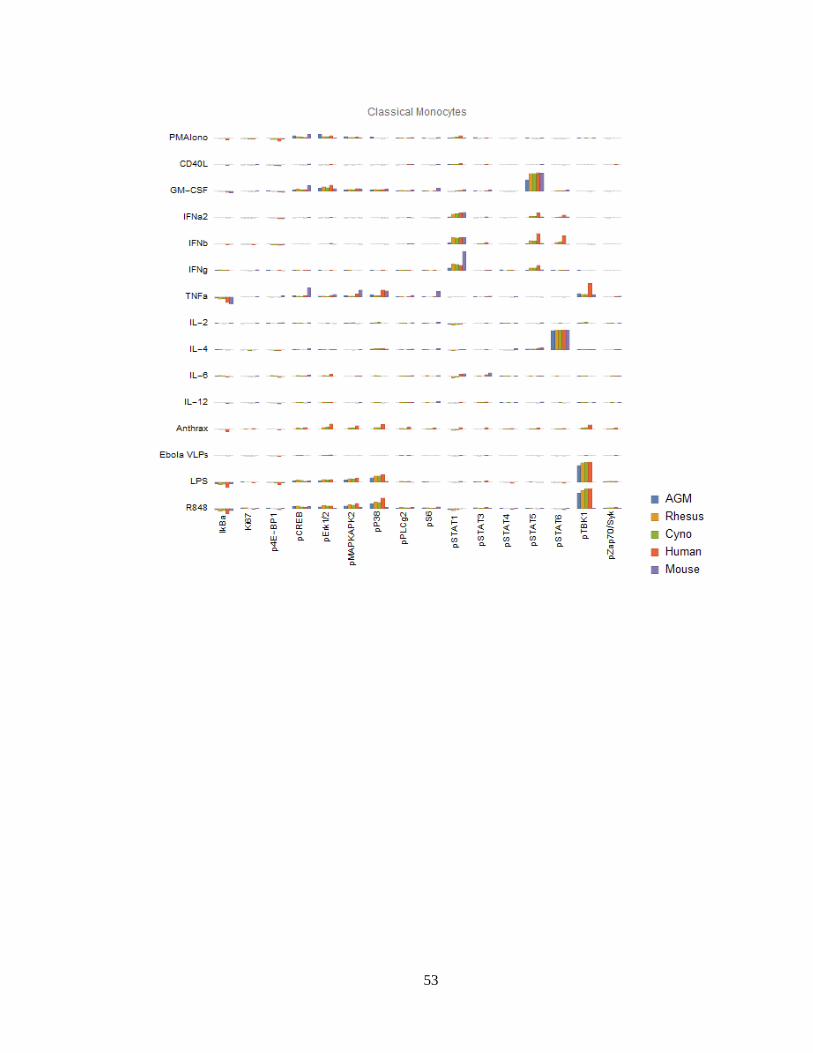
Figure 14 (continued next 11 pages) Signaling responses (difference of ArcSinh-transformed values, or
approximately fold-change) by cell type, stimulus, activation marker and species for 12 major cell types. Note that
Bacillus anthracis (“anthrax”) and Ebola VLPs were not available for use as stimuli in mice or AGMs; thus, values
for these species are always displayed as zero. We could not gate intermediate monocytes or a “CD11b-/CD16-“-
equivalent population in mice; these values are also zero. The Y axis range of all charts is -0.5 to +1.5.

48

49
50

51

52
53

54

55

56

57

58
While we are unable to explore and validate every one of the many differences in
detail, we explore several in depth in the following section, and several briefly here:
Mouse granulocytes (both neutrophils and basophils) have a unique, high pSTAT1
response to IFNγ. Mouse neutrophils (but not basophils) also have a strong
pMAKPAK2 response to GM-CSF.
Mouse classical monocytes have a stronger pSTAT1 response to IFNγ than the other
species.
However, mouse classical monocytes lack TLR4 (LPS) and TLR7/8 (R848)-triggered
pTBK1, pP38 and pMAPKAPK2 responses. Mouse TLR8 is defective135, and TLR7 is
primarily expressed in DCs136 (and we did indeed see a response to R848 in mouse
pDCs); thus, the R848 observation is expected. We could not find any prior literature
regarding LPS response in mouse monocytes, although they are known to express the
LPS receptor CD14137 and TLR4 with high homology both in the exons and
regulatory elements compared to human TLR4138. Considering these findings in

59
addition to the fact that mouse monocytes essentially lack MHC-II and are thus not
major antigen-presenting cells139,140, it is clear that classical monocytes, which are
crucial to innate immune responses in humans, serve a very different role in mice.
All three NHP species have an almost-absent pSTAT6 response to IL-4 in
nonclassical monocytes. This is a major, canonical signaling response. Mice deficient
in STAT6 exhibit defective immune behaviors in response to IL-4 across the
spectrum141,142: B cells do not upregulate MHC-II or CD23 and do not proliferate
when co-stimulated with anti-IgM; T cells show reduced proliferation in response to
PMA; T cell cytokine production and allergic antibody responses are reduced; T cells
also fail to differentiate into Th2 cells. Despite the almost-absent response in
nonclassical monocytes, all three NHP species have varying degrees of IL-4 x STAT6
responses in other cell types, including T cells, classical monocytes, intermediate
monocytes, neutrophils, B cells, DCs and NK cells. These responses serve as a
positive technical controls for STAT6 and IL-4 in NHPs in our assays; but may also
point towards biological compensation for the lack of response in nonclassical
monocytes in NHPs.
African green monkey pDCs have essentially no IkBα response to R848, although
they have a stronger pTBK1 response than any of the other species.
Cynomolgus pDCs have a unique pSTAT5 response to IL-6. Others have reported that
IL-6 causes low-levels of phosphorylation of STAT5 in T cells and NK cells in mice
to detectable levels by 15 minutes143 (the time point we used); we too see a small
response in mice and humans in those cell types, but the magnitude of these responses
are dwarfed by that of cynomolgus pDCs.
Selected exemplary differences between species
CD1c+ B cells are more abundant in macaques
CD1 is a family of lipid and glycolipid-presenting molecules—a counterpart to MHC
class I and II found on a subset of B cells and dendritic cells that plays an important role in
humans in defense against diseases such as tuberculosis. CD1c (BDCA-1) specifically
presents mannosyl mycoketide and phosphomycoketide144. A previous study reported that
21.4% of B cells in rhesus macaques were CD1c+ B cells, in contrast to humans with only
3.3%117. We similarly found significantly more CD1c+ B cells in all three NHP species that
we examined when compared to humans, and significantly higher amounts of CD1c therein
(Figure 15). Interestingly, mice and rats lack group 1 CD1 altogether144. Mouse susceptibility

60
to tuberculosis varies by strain, but at least several, including the common C57BL/6 and
BALB/c strains, are resistant145,146, and thus must have group 1 CD1-independent mechanisms
for controlling infection. Despite the lack of conservation between mice and primates, the
function of group 1 CD molecules in rhesus macaques and humans appears to be largely
similar as evidenced by trans-species activation of human T cells by rhesus CD1b147—another
group 1 CD1 functionally similar to CD1c. With regard to the higher intensity of CD1c
staining, we initially wondered if this could be due to a difference in affinity between species.
However, the levels of CD1c on DCs were more similar, albeit still statistically significantly,
different between macaques and humans (Figure 15). This could indicate (a) that non-human
primates have an increased ability to invoke an adaptive response to Mycobacterium infections
through a larger display of antigens, (b) that their CD1-restricted T cells are fewer or less
responsive and thus the larger display is a compensatory mechanism, and/or (c) that their
upstream lipid processing, such as the deglycosylation of mycobacterial mannosyl
phosphomycoketide, is less effective at yielding useful antigens and the larger display is again
compensatory.
Figure 15 CD1c+ B cells are more abundant in non-human primates than in humans, and CD1c is furthermore
expressed at higher levels in NHP B cells, especially in macaques. Left: medians CD1c staining of all individual
donors by species. Middle and right: One representative individual from each species. Dot plots show 1000
randomly selected B cells (middle) or 250 randomly selected CD11b-/CD16- DCs (right).
CD8αα+ B cells are present in macaques and have a unique functional profile
In humans, CD8α is found almost exclusively on T cell and NK cell subsets;
exceptions are limited to conditions such as HIV-1148, B-cell leukemia149–151 and
lymphomas152, and potentially a very small subset in healthy individuals148. In many rhesus
macaques, however, CD8α is also found on a subset of B cells115. We found 19 out of 25
61
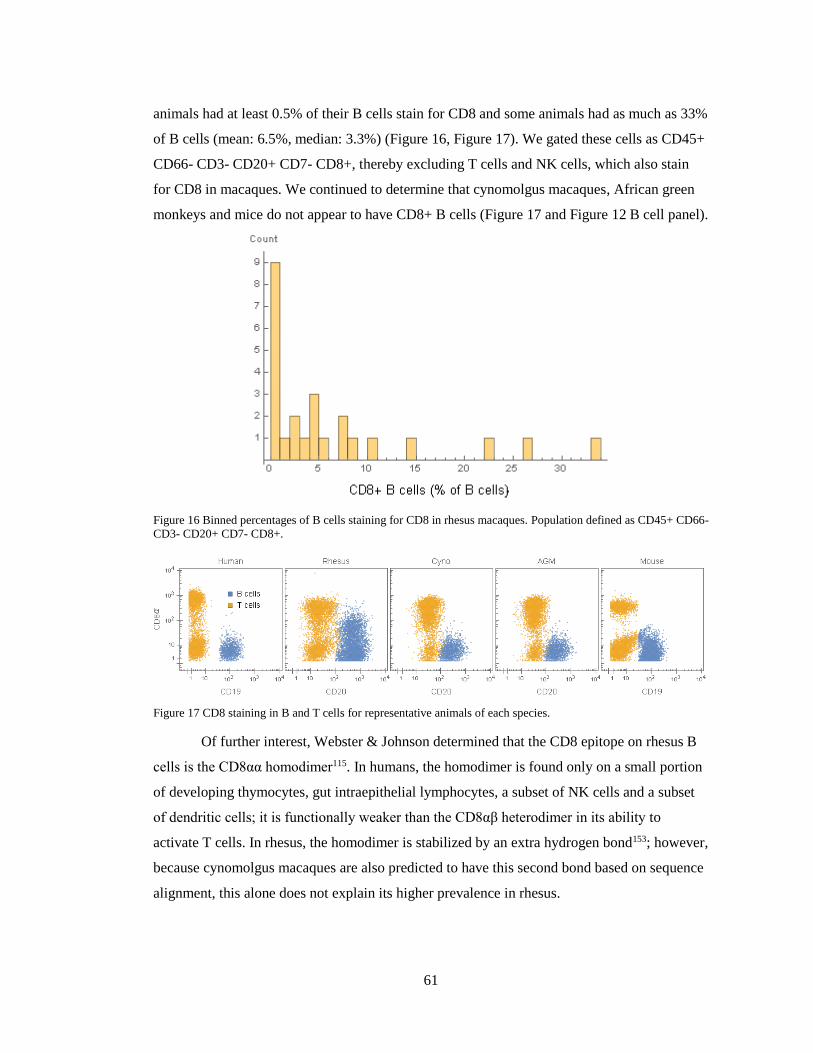
animals had at least 0.5% of their B cells stain for CD8 and some animals had as much as 33%
of B cells (mean: 6.5%, median: 3.3%) (Figure 16, Figure 17). We gated these cells as CD45+
CD66- CD3- CD20+ CD7- CD8+, thereby excluding T cells and NK cells, which also stain
for CD8 in macaques. We continued to determine that cynomolgus macaques, African green
monkeys and mice do not appear to have CD8+ B cells (Figure 17 and Figure 12 B cell panel).
Figure 16 Binned percentages of B cells staining for CD8 in rhesus macaques. Population defined as CD45+ CD66-
CD3- CD20+ CD7- CD8+.
Figure 17 CD8 staining in B and T cells for representative animals of each species.
Of further interest, Webster & Johnson determined that the CD8 epitope on rhesus B
cells is the CD8αα homodimer115. In humans, the homodimer is found only on a small portion
of developing thymocytes, gut intraepithelial lymphocytes, a subset of NK cells and a subset
of dendritic cells; it is functionally weaker than the CD8αβ heterodimer in its ability to
activate T cells. In rhesus, the homodimer is stabilized by an extra hydrogen bond153; however,
because cynomolgus macaques are also predicted to have this second bond based on sequence
alignment, this alone does not explain its higher prevalence in rhesus.

62
Because we simultaneously measured phenotyping and signaling molecules, we were
also able to evaluate the functional behavior of CD8+ B cells (Figure 18). Considering several
higher magnitude responses, we found that these cells (1) still respond to the canonical B cell
stimulus CD40L by phosphorylating CREB and degrading IkBα, albeit to a lesser degree than
CD8- B cells; (2) unlike T and NK cells, do not degrade IkBα in response to TNFα, do not
phosphorylate STAT5 in response to IL-2 and do not phosphorylate STAT4 in response to
IFNβ; and (3) have 47% greater pSTAT1 response to IFNβ than CD8- B cells.
Figure 18 Selected mean signaling responses in rhesus macaques with CD8+ B cells.
CD4+CD8+ double-positive T cells are more abundant in macaques and display
unique responses to different type I interferons
Macaques are known to have higher frequencies of peripheral CD4+CD8+ double-
positive (DP) T cells than humans, the frequency of which furthermore increases with age (see
Table 4). We found a median frequency of 6.3% in rhesus, 2.5% in cyno and less than 0.25%
in AGM, mouse and human (Figure 19).
While in humans these were initially considered immature cells that were prematurely
released from the thymus, in macaques they appear to be a mature, normal population154,155
(reviewed in156). Likewise, more recent work in humans found the population to contain
differentiated, effector-memory lymphocytes157. They are also associated with viral infections
in humans158, mice159 and chimpanzees157, and are found in the intestine in mice160.

63
Table 4 Studies reporting frequencies of DP T cells in macaques. *SIV infected. †All frequencies calculated from
Table 1; we report the mean of the means for each of the DP-high/middle/low-frequency groups to correct for bias
arising from unequal group sizes.
Study Species Origin Age % PBL
This Rhesus China 5-9 years 6.3
This Cyno China 5-9 years 2.5
Akari 1997154 Cyno Indonesia, Philippines,
Malaysia
0-4 years
5-9 years
10-14 years
>15 years
1.2
2.7
9.4
8.7
Lee161 Cyno Not specified 6.5 years
7.3 years
7.7 years
8.8 years
9.4 years
10.0 years
11.0 years
3.1†
5.1
4.5
4.7
7.1
5.0
6.0
Reimann
1994162
Rhesus Not specified Not specified <10
Dean 1996163 Rhesus Not specified Not specified 5.8*
Wang 2008164 Rhesus India 0 to 3 days
12 to 21 days
~2
~4

64
Figure 19 Frequency distribution of CD4+CD8+ double positive T cells for rhesus and cynomolgus macaques.
Table: Median frequencies (percent of singlet cells) by species.
We found an exciting mechanistic difference in responses to IFNα and IFNβ in
macaque DP T cells. Whereas all type 1 interferons signal through the same receptor
complex165 and are thus expected to have largely redundant downstream signaling effects,
there are a number of known differences: for example, IFNβ is more potent than IFNα in
inducing apoptotic166 and anti-proliferative167,168 pathways, and IFNβ alleviates some effects of
multiple sclerosis169 while IFNα does not170. (See171 for a review of differences.) The
mechanisms of many of these differences are unknown. We found that macaque double-
positive T cells have a strong pSTAT5 response to IFNβ but not to IFNα (Figure 20);
meanwhile, the pSTAT1 and pSTAT4 responses to both IFNs followed the same trends across
T cell subsets, albeit with different magnitudes, reflective of expected differences in potencies
and/or dosages.

65
Figure 20 Mean STAT signaling responses of 52 rhesus and cynomolgus macaques to type 1 interferons.
Potential mechanisms of this difference include:
(1) Specific inhibition of STAT5 in these cells. For example, STAT5 could be
sumoylated. Knock-out of a SUMO-specific protease in mice resulted in STAT5
sumoylation and abrogation of phosphorylation172. To explain the activation of
STAT5 by IFNβ, then IFNβ would also have to activate a SUMO protease, or less
likely, IFNα would have to also activate SUMO.
(2) Activation by IFNβ of another receptor and/or kinase upstream of STAT5 (e.g. Jak2,
which is downstream of receptors for type II interferon, IL-5, IL-10, growth factors
and a variety of others, but not known to be downstream of IFNAR173), coupled with
the inability of Tyk2/Jak1 to activate STAT5.
(3) A refractory period during which sensitivity to IFNα but not IFNβ is reduced, as is
found in Mycobacterium-exposed dendritic cells174. In the published case, the
refractory period was initiated by the autocrine production of IFNβ; in our case, some
other factor would have to initiate the refractory period.
(4) An interaction of IFNβ but not IFNα with solely the low-affinity receptor component
IFNAR1, followed by JAK1-independent phosphorylation of STAT5 by TYK2. To
support this, a crystal structure of a complex of IFNAR1 and IFNβ was recently
published, and IFNα does not appear to be able to form such a complex, instead
requiring IFNAR2 as well165,175,176. Furthermore, TYK2 associates with IFNAR1 and

66
activates STAT5 after activation by type I interferons165,177. However, if this
mechanism is true, then one would also expect that neither STAT1 nor STAT4 would
be phosphorylated by IFNα.
(5) Conversely, a lack of or defect in TYK2 in DP T cells would limit signaling to
proteins capable of being activated by JAK1. To support this, others have found that
TYK2-deficient cells (U1A) are responsive to INFβ but not IFNα175,178,179. However,
this again would not explain the lack of activation of only STAT5.
Macaque granulocytes are rapidly responsive to Bacillus anthracis
One of our stimulation conditions was 22M CFU of gamma-irradiated, vegetative
Bacillus anthracis Ames for 15 minutes. Despite the short incubation period, we found a
subtle but significantly greater level of neutrophil activation (Ki67) in macaques than in
humans (Figure 21). This indicates a very rapid response to infection in these animals; humans
could lack this response outright or have a delayed response.
Figure 21 Neutrophil Ki67 induction (log ratio) by species after exposure to 22M CFU of gamma-irradiated
Bacillus anthracis for 15 minutes.
That this activation occurs in neutrophils is especially interesting not only because
neutrophils kill Bacillus anthracis180, but also because macaque and several other NHP

67
species’ neutrophils uniquely contain theta defensins181, which are highly potent antibiotics
against Bacillus anthracis and its lethal factor (LF)182,183.
For reasons beyond our control, we had to discontinue use of Bacillus antigen midway
through the project; thus, none of the mouse or AGM samples were treated with Bacillus
antigen, nor were 18 of the human samples. Accordingly, our analyses considered only the
samples that were treated.
Correlations between immune signatures and metadata
Monocyte abundance correlates with herpes simian B virus status
Many macaques are naturally infected with herpes simian B virus (formerly
Cercopithecine herpes virus 1, or B virus)184. Like herpes simplex viruses in humans, the virus
is community- or sexually acquired, persists for life and is essentially harmless to macaques.
When transmitted to humans the disease is usually lethal. African green monkeys are not
natural carriers of herpes simian B virus, although they are carriers of another herpes virus,
simian agent 8 (SA8, Cercopithecine herpes virus 2)185.
All macaques were tested for B virus—most 12 to 13 months prior to our study, but
some up to six years prior. Thus, some of the animals labeled “negative” are likely now
positive. Nonetheless, we detected a significant association between B virus status and
nonclassical monocyte abundance in all macaques (Figure 22), and a stronger association with
both intermediate and nonclassical monocyte frequency in rhesus macaques (Figure 23).
Future work should further discriminate between latent and active infection.
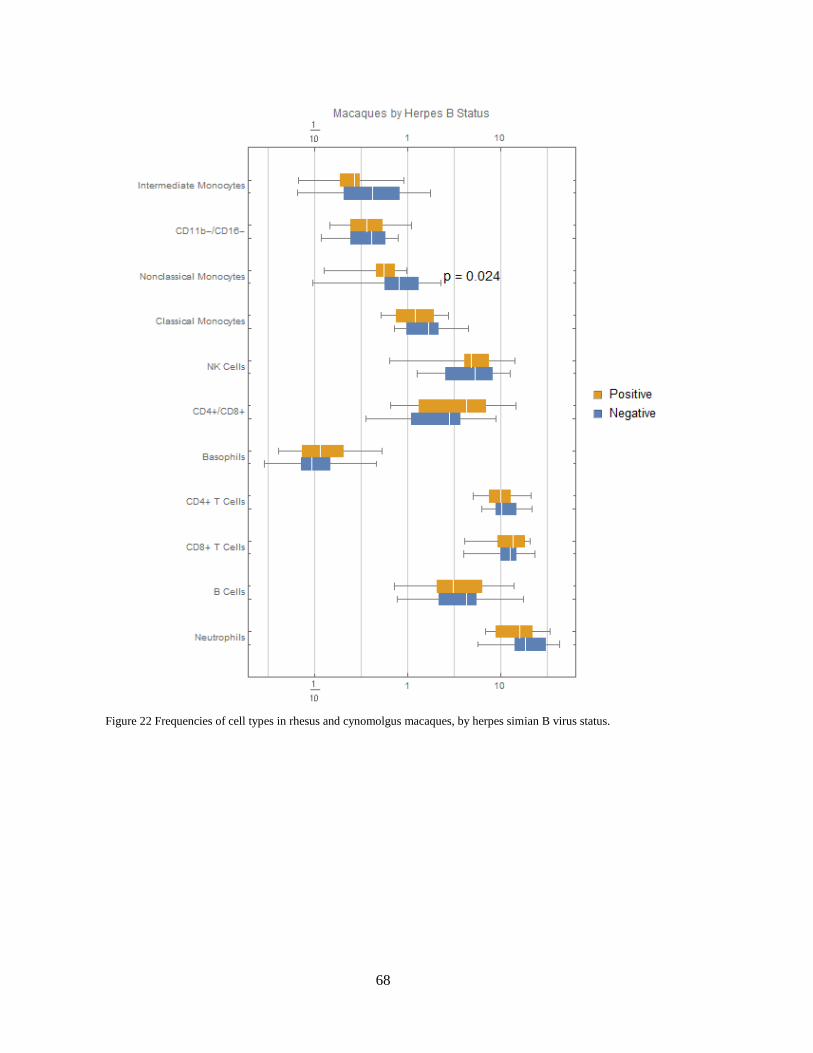
68
Figure 22 Frequencies of cell types in rhesus and cynomolgus macaques, by herpes simian B virus status.

69
Figure 23 Frequencies of cell types in rhesus macaques alone, by herpes simian B virus status.
Detecting “modules” of the immune system via cross-categorical
clustering
With the measurement of many pathways in many cell types comes the ability to
analyze the immune system as, indeed, a system, and furthermore analyze the correlations of
different “modules” (i.e. a set of pathways in a set of cell type that act in coordination).
Hierarchical clustering of Pearson correlation coefficients has been successfully
applied when looking at signaling markers alongside of physical measurements in salmonella-

70
infected mice to realize such modules186. However, this method assumes that a single
clustering can accurately represent the entire dataset; that assumption is challenged by
experiments with large numbers of parameters, as in our case. Additionally, statistical
correlations are properties of the observed data and not necessarily of the underlying
biological process; as such, correlations often yield high number of false-positive
relationships187.
Several important characteristics of our dataset affect what sort of analyses we can
perform: (1) It has more biological replicates than measured parameters, which is important
for making statistical inferences. (2) It is depth-first, and with few exceptions does not
measure multiple proteins per pathway. This makes it impossible to reconstruct individual
pathways as was impressively performed by Sachs et al188. (3) It is based on a single timepoint
measurement of a dynamic system and thus is not well suited to resolving temporal
dynamics189.
Recently, the concept of cross-categorization was presented via the algorithm
CrossCat, which automatically infers a set of nested models, each of which are clustered
independently190–193. Put another way, the algorithm automatically detects partitions, within
which relationships between parameters can be better detected, thus discovering independent
systems embedded in the dataset. Additional strengths of the CrossCat algorithm include high
levels of immunity to noise and confounding signals, and the use of mutual information in
place of the commonly used correlation scores.
We used CrossCat to bi-cluster a table containing every combination of cell type,
stimulus and signaling channel for the human samples (Figure 24). In general, values clustered
by cell type, occasionally splitting further by stimuli and signaling readouts. This method
yields a very clean view of the “modules” of the data. The application of systems immunology
analytical techniques is an active area of research in our lab and will be applied in more depth
to this dataset in the months to come.

71
Figure 24 Cross categorization of cell type x stimulus x signaling readout for all humans, with frequently appearing
terms annotated in the left margin.
Effect of ketamine on signaling and blood chemistry
For safety reasons, non-human primates in biocontainment environments are typically
anesthetized with ketamine prior to collecting blood. This effects circulation, respiration,
hormones and immune signaling directly194–200. One alternative, tethered venous catheters
(CVCs), has be used for conscious sampling in BSL4 facilities201, but substantially increases
the risk of septicemia202, has very unreliable patency202 and causes persistent, low-level
stress203,204 likely due to the weight of the armored tether and jacket. The potentially better
alternative, vascular access ports (VAPs), has not been reported to have been used in
biocontainment environments, but has been successfully employed in large studies in lower
risk environments with lower apparent induced stress205. The effects of the sampling method
must thus be considered by investigators and reviewers.

72
To simplify comprehension of our assay results, all macaque blood was collected from
conscious animals. Humans were likewise sampled while awake, and mice were bled within
seconds after deep sedation and cervical dislocation. While we intended to sample from
conscious African green monkeys, we ultimately could not locate an animal facility willing to
collect from conscious animals.
We conducted a brief study of three male rhesus macaques sampled while conscious,
then sampled again within 15 minutes later after being sedated with 10 mg/kg ketamine IM.
Full blood chemistry was performed (Figure 25) in addition to the phospho-flow assays
applied in our primary project (Figure 26). One of the three animals generally shifted in the
opposite direction as the other animals; thus, we suspect a tube might have been mislabeled,
although we cannot rule out that these are real effects that we cannot easily control, as
discussed below. At the least, these results indicate substantial changes one way or another. In
particular, ketamine seems to induce a low-level activation of many signaling pathways that is
generally additive to the effects of the exogenous stimuli.
Figure 25 Percent change in 22 blood chemistries after sedation with 10 mg/ml IM ketamine. Values are mean and
CV of three male cynomolgus macaques.
-40%
-30%
-20%
-10%
0%
10%
20%
30%
Blood Chemistry, % Change After Sedation

73
pErk pSTAT5 pSTAT6 pMAPKAPK2 pCREB
Figure 26 Ketamine is has sweeping modulatory effects on immune signaling. Blood from three male cynomolgus
macaques was treated with 13 different stimuli before (e.g. “CD40L”) or immediately after 10 mg/ml ketamine

74
general anesthesia (e.g. “CD40L+”). Showing medians of the five indicated channels, relative to pre-ketamine
unstimulated condition.
We initially planned a follow-up experiment with the input from an anesthesiologist,
but the extent of the experiment rapidly exceeded the scope of this project: (1) Animals are
typically dosed in bolus and not regulated at a particular plasma concentration. Absorption
kinetics and distribution are expected to differ between animals, resulting in different plasma
concentrations. While the most relevant scenario for biocontainment studies is dosing by bolus
to emulate sedation prior to phlebotomy, a very large number of animals would be required to
achieve statistical power for these reasons. (2) Animals become stressed by human presence
and by the first conscious sampling. To mitigate this effect, different sets of animals could be
used and animals could be screened off during sampling, but then a larger number of animals
would be required. (3) It is difficult to separate the first-order effects of the ketamine binding
to receptors versus the second-order effects of hormones released by the affected cells. The
kinetics are again affected by absorption and distribution and thus vary by animal.
Public Database
Ultimately we generated approximately 3,000 flow cytometry standard (FCS) files
containing more than one billion events for the primary FDA dataset, and approximately 4,000
FCS files for the antibody screening dataset. Both to meet our own analysis needs and to allow
easy access to the data by other researchers, we created a new, web-based analysis platform
capable of handling this immense volume of data and providing programmatic access to the
data and descriptive statistics extracted from it.
The platform is deployed in a secure cloud environment and transparently makes use
of thousands of CPUs to yield analysis results in seconds instead of hours or days. The
application programming interface (API) allows researchers and bioinformaticians to query
the dataset directly from their programming language of choice, such as R, Mathematica or
Python. This, in turn, allows greater traceability and reproducibility in data analysis by
allowing the commands used to extract data to be stored and rerun, compared to a typical
graphical user interface with which interactions cannot be readily recorded. We have
developed toolkits for R and Mathematica, and provide complete documentation of the API
for usage with any language. Both the antibody screening dataset and the cross-species
signaling dataset are hosted at www.immuneatlas.org.

75
Conclusion
Animal models are commonplace in drug development. Here we clearly show that
model species must be carefully selected and evaluated based on their relevance to the
particular experiment at hand. For example, a therapeutic targeting one pathway in a particular
cell type should be confirmed to trigger relevant, similar signaling in humans as in the model
species. Nonetheless, even with careful selection based on evaluation of one or several
particular pathways, one cannot discount the complex interplay between multiple pathways
and multiple cell types. In some cases, highly targeted immunotherapeutics seem as if they
would be nearly impossible to validate in animal models because of this. One might counter
that for over a century we have used animal models for development of many successful
vaccines and drugs. However, some of the most successful vaccines, such as smallpox, are
broadly immunogenic and activate broad swaths of the immune system, and ultimately yield
the acquisition of protective immunity. The former broad activation is inherently less
susceptible to minute differences in cellular immunology between species through effects of
averaging; the latter is known to occur faithfully in all mammals. We encourage researchers to
consider humans as early as possible in the drug development process. For example, the use of
primary human cells (i.e. blood and tumor samples) for development from day one will
presumably yield dozens of therapeutic candidates that have been missed because they have
been evaluated in animal cells and animal models that do not reflect human immunology.

76
Materials and Methods
Antibody reactivity screen
Blood was collected in sodium heparin and processed within 24 hours of collection.
Eight to 10 ml of blood was gently fixed and lysed by incubating with 792 µl of 16%
paraformaldehyde (Electron Microscopy Sciences, Hatfield, PA) and 29.6 ml of VersaLyse
(Beckman Coulter, Brea, CA) for 10 minutes at room temperature, then washed once with
0.01% BSA in PBS (“staining buffer”). Cells were resuspended in 6.5 ml of staining buffer,
then incubated with 0.5 ml of human TruStain FcX Fc receptor blocking solution (Biolegend,
San Diego, CA) for 10 minutes.
Five counterstain antibodies were then added: 500 µl CD3 (SP34.2)-Brilliant Violet
421 (BD Biosciences, San Jose, CA), 500 µl CD20 (2H7)-Brilliant Violet 605 (Biolegend),
1000 µl CD66 (TET2)-APC-Vio770 (Miltenyi, San Diego, CA), 500 µl CD11b (ICRF44)-
PerCP/Cy5.5 (Biolegend) and 500 µl CD7 (M-T701)-APC (BD Biosciences), for a final
volume of 10 ml.
Subsequent steps were performed on an automation platform including an Agilent
Bravo 96-channel pipetting robot, centrifuges, BioTek ELx405 96-channel aspirator/dispenser
and Thermo Scientific MultiDrop dispenser. Twenty microliters of cells in the antibody
cocktail were dispensed into every well of a 384-well plate using the MultiDrop.
LegendScreen Human PE antibody screen plates (Biolegend) were rehydrated with the
manufacturer-recommended 25 µl of water. The screen consists of four 96-well plates; 5 µl
from each well were transferred to the single 384-well plate quadrant-wise. Staining reactions
were incubated in the dark at room temperature for 30 minutes with 2.0 mm-radius orbital
shaking, then washed three times with staining buffer and acquired on a BD LSR II with 405,
488 and 633 nm lasers using an HTS autosampler.
Files were gated and populations exported using a web-based, high-throughput
cytometry analysis platform developed in our laboratory. Every well was manually gated by
time to exclude anomalies caused by air bubbles or debris: temporal regions where the signal
in the PE channel over time were inconsistent were excluded. Cell populations were then
gated as described in the results section. Population gates were tailored to each species;
tailoring to individual donors within a species was not necessary. The remaining analysis
(statistics calculations, discordant replicate resolution, verification and reporting) was
performed using Mathematica (Wolfram Research, Champaign, IL).

77
Stimuli
Table 5. Stimuli. Stimuli marked with an asterisk (*) were dispensed at time of usage due to production and/or
storage requirements.
Stimulus Host Species Used In Produced In Lot Working
Concentration
GM-CSF Rhesus Rhesus
Cyno
E. coli 3600102 100 ng/ml
GM-CSF Human Human E. coli 3112711 100 ng/ml
GM-CSF Mouse Mouse E. coli 3201617 100 ng/ml
IFNα2 Rhesus/Cyno
(identical)
Rhesus
Cyno
E. coli 5967, 5616
pooled
150 ng/ml
IFNα2 Human Human E. coli 5962 150 ng/ml
IFNα2 Mouse Mouse E. coli E05729-1634 150 ng/ml
LPS N/A Human
Rhesus
Cyno
Mouse
E. coli
O111:B4
LEB-36-01 1 g/ml
IL-6 Rhesus Rhesus
Cyno
E. coli 3600502 500 ng/ml
IL-6 Human Human E. coli 3103810 500 ng/ml
IL-6 Mouse Mouse E. coli 3201609 500 ng/ml
Resiquimod
(R848)
N/A Human
Rhesus
Cyno
Mouse
N/A 848-35-14 10 g/ml
IFNγ Rhesus Rhesus
Cyno
E. coli ETZ0213071 330 ng/ml
IFNγ Human Human E. coli RAX1814011 330 ng/ml
IFNγ Mouse Mouse E. coli 061398 330 ng/ml
TNFα Rhesus Rhesus
Cyno
E. coli DCSD011308
1
100 ng/ml
TNFα Human Human E. coli DDHB011306
2
100 ng/ml
TNFα Mouse Mouse E. coli CS1313081 100 ng/ml
IFNβ* Human Human
Rhesus
Cyno
CHO 5886 5 ng/ml
IFNβ Mouse Mouse Human cell
line
CD40L
soluble
dimer
(“MegaCD4
0L”)
Human Human
Rhesus
Cyno
CHO 05281412,
03041401
pooled
125 ng/ml
CD40L
soluble
dimer
(“MegaCD4
0L”)
Mouse Mouse CHO 01151321 125 ng/ml
PMA and
ionomycin*
N/A Human
Rhesus
Cyno
N/A E13495-116 0.081 M PMA
and 1.34 M
iono

78
Stimulus Host Species Used In Produced In Lot Working
Concentration
Mouse
IL-12 Rhesus Rhesus
Cyno
CHO OQM0210071 400 ng/ml
IL-12 Human Human CHO 0210596,
0707596-2
pooled
400 ng/ml
IL-12 Mouse Mouse CHO 0407S97 400 ng/ml
IL-4 Rhesus Rhesus
Cyno
E. coli IXV0113111 125 ng/ml
IL-4 Human Human E. coli AG1314021 125 ng/ml
IL-4 Mouse Mouse E. coli BC1613061 125 ng/ml
IL-2 Rhesus/Cyno
(identical)
Rhesus
Cyno
E. coli 04/12/2008 2 g/ml
IL-2 Human Human E. coli 101312,
041412 pooled 2 g/ml
IL-2 Mouse Mouse E. coli 0608108 2 g/ml
*Gamma-
inactivated
vegetative
Bacillus
anthracis
Ames
N/A Human
Rhesus
Cyno
AGD0001331 400,000 CFU/ml
*Zaïre
Ebolavirus-
like particles
N/A Human
Rhesus
Cyno
293T cells
Human and non-primate stimuli were tested in human whole blood over a range of
concentrations to select the working concentration. Mouse stimuli were likewise tested in
mouse blood. All stimuli were diluted such that the same volume of each would achieve the
desired stimulation concentration, then aliquoted into single-use stimuli plates and stored at -
80, with the exception of those marked with *, which were dispend at time of use due to
storage requirements or the need to adjust the stimulation concentration. All cytokines were
tested for endotoxin by the LAL method and verified to contain an amount less than that
detectable by our phospho-flow assays (approximately 10 pg/ml).
LPS was commercially prepared by phenol-water extraction and contained small
amounts of other bacterial components that activate TLR2.
Rhesus/cynomolgus IL-2 was obtained from the NIH/NCRR-funded Resource for
Nonhuman Primate Immune Reagents.
Gamma-inactivated vegetative Bacillus anthracis Ames (ANG-BACI008-VE) was
obtained from the Department of Defense Critical Reagents Program through the NIH
Biodefense and Emerging Infections Research Resources Repository, NIAID, NIH.

79
Zaïre Ebolavirus-like particles were used within 48 hours of production, except where
noted, and thus different lots were used throughout the course of the project. Particles were
produced according to122 using calcium phosphate instead of Lipofectamine. Briefly, 1 µg of
pCAGGS-GP, 1 µg of pCAGGS-VP35, 1.5 µg of pCAGGS-NP and 1.5 µg of pCAGGS-VP40
(courtesy of R. Johnson et al., NIH NIAID Integrated Research Facility) were transfected into
293T cells by the calcium phosphate method, harvested after 36 hours, then purified through a
20% sucrose cushion at 115,605 x g for two hours and stored at +4 degrees. Preparations were
initially verified by western blot to contain each of the four proteins and periodically verified
by electron microscopy. For particle quantitation, VLP particle preparations were mixed with
110 nm latex spheres (Structure Probe, Inc., West Chester, PA) at a known concentration,
absorbed onto copper carbon-Formvar-coated 300 mesh electron microscopy grids prepared in
duplicate and stained with uranyl acetate (protocol courtesy of J. Birnbaum, NIH NIAID
Integrated Research Facility). Due to the short shelf-life of the particles, grids were generally
imaged after use as a stimulus and thus the effective stimulation concentration was determined
after the fact.
Blood
Venous human blood was obtained from the Stanford Blood Center, AllCells Inc.
(Alameda, CA) (exempt, non-human subjects research) or from volunteers from the Stanford
community under an IRB-approved protocol.
Baboon (Papio hamadryas anubis x Papio hamadryas cynocephalus) blood was
obtained from the Southwest National Primate Research Center, which is funded by the
National Center for Research Resources (p51 RR013986) and supported by the Office of
Research Infrastructure Programs/OD P51 OD011133. Macaque (Macaca mulatta and M.
fascicularis) blood was obtained from Valley Biosystems from conscious (not sedated),
captive-born, Chinese-origin animals. African green monkey (Cercopithecus aethiops) blood
was obtained from Worldwide Primates and Bioreclamation, LLC. The African green
monkeys were wild-born in St. Kitts; age was estimated by capture date (assuming two years
old at time of capture). Mice were obtained from Charles River Laboratories. Animal work
was done under an approved animal care and usage committee protocol (#26675).
Health reports for the macaques were obtained and are available in the experiment
data repository.
Complete blood counts (CBCs) were performed on a Sysmex XT-2000iv with the
veterinary software module.

80
Antibodies
Purified antibodies were purchased and conjugated in-house using DVS/Fluidigim
MaxPar X8 metal conjugation kits. All antibodies were titrated for optimal signal-to-noise
ratio, then re-confirmed in at least two different individuals per species (three humans, two
cynomolgus macaques, two rhesus macaques, three mice). All conjugations and titrations were
well-documented, and records are available in the experiment data repository. Finally,
antibodies were lyophilized into LyoSpheres by BioLyph LLC (Hopkins, MN) with excipient
B144 as 4x cocktails. CyTOF antibody LyoSpheres were stress-tested for over one year and
found to have no significant change in staining (not shown).
Table 6 Macaque extracellular antibodies
Antigen Clone Label Vendor and Catalog Straining
Concentration
(µg/ml)
CD45 DO58-1283 115 BD 552566 5.37
CD233 BRIC 6 113 IBGRL 9439 4.11
CD61 VI-PL2 140 Biolegend 336402 5.37
CD66 YTH71.3 158 Thermo MA5-17003 2.25
CD20 2H7 173 Biolegend 302302 5.37
IgM G20-127 174 BD 555780 2.68
HLA-DR Immu357 176 Beckman Coulter 0.34
CD1c AD5-8E7 162 Miltenyi 1.34
BDCA3 1A4 164 BD 559780 3.58
CD123 7G3 148 BD 554527 1.34
CCR7 150503 FITC BD 561271 8.94
FITC FIT-22 171 Biolegend 408302 5.39
CD3 SP34.2 157 BD 551916 2.68
CD4* OKT4 156 Biolegend 317404 1.25
CD8 RPA-T8 155 Biolegend 301002 1.41
CD45RA HI100 166 Biolegend 304102 2.68
CD11b ICRF44 153 Biolegend 301312 6.71
CD11c 3.9 143 Biolegend 1.34
CD14 M5E2 151 Biolegend 301810 10.73
CD16 3G8 159 Biolegend 302033 2.68
CD33 AC104.3E3 142 Miltenyi 4.29
CD56 NCAM16.2 175 BD 559403 1.79
CD7 M-T701 141 BD 555359 5.37
CD161 HP-G310 168 Biolegend 339902 3.08

81
Table 7 Human extracellular antibodies. *At time of rehydration, surface cocktail was supplemented with 8.64 µl
of CD4 #201 (OKT4) per 12 LyoSpheres to increase signal.
Antigen Clone Label Vendor and Catalog Staining
Concentration
(µg/ml)
CD45 HI30 115 Biolegend 304002 3.25
CD235a HIR2 113 Biolegend 306602 0.67
CD61 VI-PL2 140 Biolegend 336402 5.37
CD66 YTH71.3 158 Pierce MA1-36189 3.41
CD19 J3-119 173 Beckman Coulter IM1313 1.79
IgM G20-127 174 BD 555780 2.68
HLA-DR Immu357 176 Beckman Coulter Immu357 0.34
CD1c AD5-8E7 162 Miltenyi (Custom) 1.34
BDCA3 1A4 164 BD 559780 4.31
CD123 7G3 148 BD 554527 1.34
CCR7 150503 171 R&D MAB197-100 7.01
CD3 SP34.2 157 BD 551916 2.68
CD4* OKT4 156 Biolegend 317402 1.25
CD8 RPA-T8 155 Biolegend 301002 1.41
CD45RA HI100 166 Biolegend 304102 2.68
CD11b ICRF44 153 Biolegend 301302 7.16
CD11c Bu15 143 Biolegend 337202 1.34
CD14 M5E2 151 Biolegend 301802 10.73
CD16 3G8 159 Biolegend 302033 2.68
CD33 AC104.3E3 142 Miltenyi (Custom) 3.58
CD56 NCAM16.2 175 BD 559043 1.79
CD7 M-T701 141 BD 555359 5.37
CD161 HP-G310 168 Biolegend 339902 5.37
Table 8 Mouse extracellular antibodies.
Antigen Clone Label Vendor and Catalog Straining
Concentration
(µg/ml)
Ter119 TER-119 113 Biolegend 116202 5.37
CD45.2 104 115 Biolegend 109801 5.37
pan-CD45 30-F11 115 Biolegend 103102 5.37
CD61 2C9.G2 140 Biolegend 104302 1.34
Ly6G 1A8 158 Biolegend 127602 0.34
CD19 6D5 173 Biolegend 115502 1.34
B220 RA3-6B2 141 Biolegend 103202 22.68
IgM RMM-1 174 Biolegend 406501 2.68
MHC II M5/114.15.2 176 Biolegend 107602 0.34
BST-2 120g8 148 Dendritics DDX0390P-
100
1.34
CD115 CSF-1R 164 Biolegend 135502 1.34

82
FcεRIa MAR-1 166 Bioelgend 134302 0.34
CD62L MEL-14 FITC Biolegend 104406 3.22
CD3 17A2 157 Biolegend 100202 0.34
CD4 RM4-5 156 Biolegend 100506 0.34
CD8 53-6.7 155 Biolegend 100702 0.34
CD44 IM7 175 Biolegend 103002 0.34
CD11b M1/70 153 Biolegend 101202 1.34
CD11c HL3 143 BD 553799 0.34
Ly6C HK1.4 151 Biolegend 128002 0.34
CD16/32 2.4G2 162 BD 553142 1.34
NK1.1 PK136 168 Biolegend 108702 1.34
CD49b HMa2 142 Biolegend 103501 0.34
Table 9 Signaling and other post-permeabilization antibodies.
Antigen Label Species Clone Straining
Concentration
(µg/ml)
STAT1 pY701 147 primates
mice 4a
3.83
6.97
STAT3 pY705 139 all 4 5.82
STAT4 pY693 170 all 38 5.66
STAT5 pY694 149 all 46 5.37
STAT6 pY691 165 primates
mice
18
J71-773.58.11
5.38
8.33
Ki67 169 all SolA15 3.36
Erk1/2 pT202/Y204 152 all D13.14.4E 16.44
MAPKAPK2 pT334 144 all 27B7 2.29
CREB pS133 145 all 87G3 7.24
IkBa amino-terminal 163 all L35A5 3.79
TBK1/NAK pS172 161 all D52C2 10.78
S6 pS235/236 150 all 2F9 13.15
Zap70/Syk
pY319/Y352
160 all 17a 2.14
4E-BP1 pT37/46 172 all 236B4 3.13
PLCγ2 pY759 146 all K86-689.37 2.18
P38 pT180/Y182 154 all 36/p38 3.56
FITC (for CCR7) 171 NHPs FIT-22 5.33
FITC (for CD62L) 171 mice FIT-22 8.44
FoxP3 167 primates
mice
PCH101
NRRF-30
10.55
7.16
Stimulation and Staining
Stimulation and staining was carried out on a custom automation platform consisting
of an Agilent Bravo pipetting robot, Agilent BenchBot robotic arm, Peak KiNeDx robotic
arm, Thermo Cytomat C2 incubator, BioTek ELx405-UVSD aspirator/dispenser, BioTek

83
MultiFlo FX four-reagent dispenser, Q.Instruments microplate shakers, Velocity11 VSpin
centrifuges and a custom chilling system contained in a negative-pressure biosafety enclosure.
The VWorks robotic programs are freely available at http://github.com/nolanlab/ProtocolFiles.
Logs from all protocols runs are available upon request.
Whole blood was stimulated by mixing with stimuli and incubating in a humidified
37-degree, 5% CO¬2 incubator for 15 minutes. Blood was fixed for 10 minutes at room
temperature with 1.6% paraformaldehyde (PFA, Electron Microscopy Sciences) and lysed
with 0.1% Triton-X100 in PBS for 30 minutes at room temperature per 206. Cells were
washed twice with PBS, then each donor’s 16 conditions were barcoded according to 54.
Briefly, cells were slightly permeabilized with 0.02% saponin, then stained with unique
combinations of functionalized, stable palladium isotopes. The stimulation plate containing 6
donors x 16 conditions was then reduced to 6 wells, each containing the 16 conditions for one
donor. Cells were washed once with staining media (CSM: 0.2% BSA in PBS with 0.02%
sodium azide), blocked with human (humans, NHPs) or mouse (mouse) TruStain FcX block
(Biolegend) for 10 minutes at room temperature with shaking, then stained with rehydrated
extracellular LyoSpheres for 30 minutes at room temperature with shaking in a final volume
of 240 µl. (See Table 6, Table 7, Table 8 for final staining concentrations.) Cells were washed
once, then permeabilized in >90% methanol at 4 degrees C for 20 minutes. Cells were washed
four times, then stained with intracellular lyospheres for 60 minutes at room temperature with
shaking. Cells were washed once, then placed into 1.6% PFA and 0.1 µM natural iridium
intercalator (Fluidigm) in PBS at 4 degrees C until acquisition on a CyTOF. With few
exceptions, cells were acquired within seven days of staining. From prior validation
experiments, this amount of time imparted no significant effect on staining.
Acquisition
Prior to running, cells were washed twice with water. Samples were acquired on a
single DVS/Fluidigm CyTOF 2 fitted with a Super Sampler sample introduction system
(Victorian Airship & Scientific Apparatus LLC). QC reports were run on the CyTOF between
every barcoded sample. Prior to beginning acquisition, the instrument must have demonstrated
Tb159 dual counts > 1,000,000 and oxidation < 3%; if the instrument failed those criteria, it
was cleaned, tuned or repaired as necessary. Approximately 4,800,000 events were acquired
per sample.

84
References
1. Davis, M. M. A prescription for human immunology. Immunity 29, 835–8 (2008).
2. Bente, D., Gren, J., Strong, J. E. & Feldmann, H. Disease modeling for Ebola and Marburg viruses. Dis Model Mech 2, 12–17 (2009).
3. Evans, D. T. & Silvestri, G. Nonhuman primate models in AIDS research. Curr. Opin. HIV AIDS 8, 255–61 (2013).
4. Bartlett, N. W. et al. Mouse models of rhinovirus-induced disease and exacerbation of allergic airway inflammation. Nat. Med. 14, 199–204 (2008).
5. Couch, R. B., Cate, T. R., Douglas, R. G., Gerone, P. J. & Knight, V. Effect of route of inoculation on experimental respiratory viral disease in volunteers and evidence for airborne transmission. Bacteriol. Rev. 30, 517–29 (1966).
6. Richmond, A. & Su, Y. Mouse xenograft models vs GEM models for human cancer therapeutics. Dis. Model. Mech. 1, 78–82
7. Rogers, K. A., Scinicariello, F. & Attanasio, R. IgG Fc receptor III homologues in nonhuman primate species: genetic characterization and ligand interactions. J. Immunol. 177, 3848–56 (2006).
8. Rogers, K. A., Scinicariello, F. & Attanasio, R. Identification and characterization of macaque CD89 (immunoglobulin A Fc receptor). Immunology 113, 178–86 (2004).
9. Nimmerjahn, F. & Ravetch, J. V. Fcgamma receptors as regulators of immune responses. Nat. Rev. Immunol. 8, 34–47 (2008).
10. Seok, J. et al. Genomic responses in mouse models poorly mimic human inflammatory diseases. Proc. Natl. Acad. Sci. U. S. A. 110, 3507–12 (2013).
11. Shay, T. et al. Conservation and divergence in the transcriptional programs of the human and mouse immune systems. Proc. Natl. Acad. Sci. U. S. A. 110, 2946–51 (2013).
12. Barreiro, L. B., Marioni, J. C., Blekhman, R., Stephens, M. & Gilad, Y. Functional comparison of innate immune signaling pathways in primates. PLoS Genet. 6, e1001249 (2010).
13. Trials, I. of M. (US) C. to R. the F. (FIAU/FIAC) C. Review of the Fialuridine (FIAU) Clinical Trials. (National Academies Press (US), 1995). at <http://www.ncbi.nlm.nih.gov/books/NBK232098/>
85
14. Eastwood, D. et al. Monoclonal antibody TGN1412 trial failure explained by species differences in CD28 expression on CD4+ effector memory T-cells. Br. J. Pharmacol. 161, 512–26 (2010).
15. Commissioner, O. of the. Women’s Health Research - 1998 The Investigational New Drug Applications and New Drug Applications Regulation. at <http://www.fda.gov/ScienceResearch/SpecialTopics/WomensHealthResearch/ucm133181.htm>
16. Yasuda, S. U., Zhang, L. & Huang, S.-M. The role of ethnicity in variability in response to drugs: focus on clinical pharmacology studies. Clin. Pharmacol. Ther. 84, 417–23 (2008).
17. Gandhi, M., Aweeka, F., Greenblatt, R. M. & Blaschke, T. F. Sex differences in pharmacokinetics and pharmacodynamics. Annu. Rev. Pharmacol. Toxicol. 44, 499–523 (2004).
18. Zucker, I. & Beery, A. K. Males still dominate animal studies. Nature 465, 690 (2010).
19. Clayton, J. A. & Collins, F. S. Policy: NIH to balance sex in cell and animal studies. Nature 509, 282–283 (2014).
20. Bjornson, Z. B., Nolan, G. P. & Fantl, W. J. Single-cell mass cytometry for analysis of immune system functional states. Curr. Opin. Immunol. 25, 484–94 (2013).
21. Chattopadhyay, P. K. & Roederer, M. Cytometry: today’s technology and tomorrow's horizons. Methods 57, 251–8 (2012).
22. Sigal, A. et al. Generation of a fluorescently labeled endogenous protein library in living human cells. Nat. Protoc. 2, 1515–27 (2007).
23. Darzynkiewicz, Z. Critical aspects in analysis of cellular DNA content. Curr. Protoc. Cytom. Chapter 7, Unit 7.2 (2011).
24. Jacobberger, J. W. et al. A new biomarker for mitotic cells. Cytometry. A 73, 5–15 (2008).
25. Biancotto, A., Dagur, P. K., Fuchs, J. C., Langweiler, M. & McCoy, J. P. OMIP-004: in-depth characterization of human T regulatory cells. Cytometry. A 81, 15–6 (2012).
26. Biancotto, A., Fuchs, J. C., Williams, A., Dagur, P. K. & McCoy, J. P. High dimensional flow cytometry for comprehensive leukocyte immunophenotyping (CLIP) in translational research. J. Immunol. Methods 363, 245–61 (2011).

86
27. Van Lochem, E. G. et al. Immunophenotypic differentiation patterns of normal hematopoiesis in human bone marrow: reference patterns for age-related changes and disease-induced shifts. Cytometry B. Clin. Cytom. 60, 1–13 (2004).
28. Krutzik, P. O., Irish, J. M., Nolan, G. P. & Perez, O. D. Analysis of protein phosphorylation and cellular signaling events by flow cytometry: techniques and clinical applications. Clin. Immunol. 110, 206–21 (2004).
29. Irish, J. M. et al. Single cell profiling of potentiated phospho-protein networks in cancer cells. Cell 118, 217–28 (2004).
30. Irish, J. M., Czerwinski, D. K., Nolan, G. P. & Levy, R. Kinetics of B cell receptor signaling in human B cell subsets mapped by phosphospecific flow cytometry. J. Immunol. 177, 1581–9 (2006).
31. Irish, J. M., Czerwinski, D. K., Nolan, G. P. & Levy, R. Altered B-cell receptor signaling kinetics distinguish human follicular lymphoma B cells from tumor-infiltrating nonmalignant B cells. Blood 108, 3135–42 (2006).
32. Irish, J. M., Kotecha, N. & Nolan, G. P. Mapping normal and cancer cell signalling networks: towards single-cell proteomics. Nat. Rev. Cancer 6, 146–55 (2006).
33. Palazzo, A. L. et al. Association of reactive oxygen species-mediated signal transduction with in vitro apoptosis sensitivity in chronic lymphocytic leukemia B cells. PLoS One 6, e24592 (2011).
34. Rosen, D. B. et al. Distinct patterns of DNA damage response and apoptosis correlate with Jak/Stat and PI3kinase response profiles in human acute myelogenous leukemia. PLoS One 5, e12405 (2010).
35. Hotson, A. N., Hardy, J. W., Hale, M. B., Contag, C. H. & Nolan, G. P. The T cell STAT signaling network is reprogrammed within hours of bacteremia via secondary signals. J Immunol 182, 7558–7568 (2009).
36. O’Gorman, W. E. et al. The initial phase of an immune response functions to activate regulatory T cells. J. Immunol. 183, 332–9 (2009).
37. O’Gorman, W. E. et al. Alternate mechanisms of initial pattern recognition drive differential immune responses to related poxviruses. Cell Host Microbe 8, 174–185 (2010).
38. Krutzik, P. O., Crane, J. M., Clutter, M. R. & Nolan, G. P. High-content single-cell drug screening with phosphospecific flow cytometry. Nat. Chem. Biol. 4, 132–42 (2008).
87
39. Kornblau, S. M. et al. Dynamic single-cell network profiles in acute myelogenous leukemia are associated with patient response to standard induction therapy. Clin. Cancer Res. 16, 3721–33 (2010).
40. Tong, F. K., Chow, S. & Hedley, D. Pharmacodynamic monitoring of BAY 43-9006 (Sorafenib) in phase I clinical trials involving solid tumor and AML/MDS patients, using flow cytometry to monitor activation of the ERK pathway in peripheral blood cells. Cytometry B. Clin. Cytom. 70, 107–14 (2006).
41. Chattopadhyay, P. K. et al. Quantum dot semiconductor nanocrystals for immunophenotyping by polychromatic flow cytometry. Nat. Med. 12, 972–7 (2006).
42. Bandura, D. R. et al. Mass cytometry: technique for real time single cell multitarget immunoassay based on inductively coupled plasma time-of-flight mass spectrometry. Anal. Chem. 81, 6813–22 (2009).
43. Baranov, V. I., Quinn, Z., Bandura, D. R. & Tanner, S. D. A sensitive and quantitative element-tagged immunoassay with ICPMS detection. Anal. Chem. 74, 1629–36 (2002).
44. Bendall, S. C. & Nolan, G. P. From single cells to deep phenotypes in cancer. Nat. Biotechnol. 30, 639–47 (2012).
45. Bendall, S. C., Nolan, G. P., Roederer, M. & Chattopadhyay, P. K. A deep profiler’s guide to cytometry. Trends Immunol. 33, 323–32 (2012).
46. Ornatsky, O. et al. Highly multiparametric analysis by mass cytometry. J. Immunol. Methods 361, 1–20 (2010).
47. Razumienko, E. et al. Element-tagged immunoassay with ICP-MS detection: evaluation and comparison to conventional immunoassays. J. Immunol. Methods 336, 56–63 (2008).
48. Tanner, S. D. et al. Flow cytometer with mass spectrometer detection for massively multiplexed single-cell biomarker assay. Pure Appl. Chem. 80, 2627–2641 (2008).
49. Tanner, S. D., Baranov, V. I., Ornatsky, O. I., Bandura, D. R. & George, T. C. An introduction to mass cytometry: fundamentals and applications. Cancer Immunol. Immunother. 62, 955–65 (2013).
50. Lou, X. et al. Polymer-based elemental tags for sensitive bioassays. Angew. Chem. Int. Ed. Engl. 46, 6111–4 (2007).
51. Abdelrahman, A. I. et al. Metal-Containing Polystyrene Beads as Standards for Mass Cytometry. J. Anal. At. Spectrom. 25, 260–268 (2010).

88
52. Mei, H. E., Leipold, M. D. & Maecker, H. T. Platinum-conjugated antibodies for application in mass cytometry. Cytometry. A (2015). doi:10.1002/cyto.a.22778
53. Zunder, E. R. et al. Palladium-based mass tag cell barcoding with a doublet-filtering scheme and single-cell deconvolution algorithm. Nat. Protoc. 10, 316–33 (2015).
54. Behbehani, G. K. et al. Transient partial permeabilization with saponin enables cellular barcoding prior to surface marker staining. Cytometry. A 85, 1011–9 (2014).
55. Lai, L., Ong, R., Li, J. & Albani, S. A CD45-based barcoding approach to multiplex mass-cytometry (CyTOF). Cytometry. A 87, 369–74 (2015).
56. Mei, H. E., Leipold, M. D., Schulz, A. R., Chester, C. & Maecker, H. T. Barcoding of live human peripheral blood mononuclear cells for multiplexed mass cytometry. J. Immunol. 194, 2022–31 (2015).
57. Bendall, S. C. et al. Single-cell mass cytometry of differential immune and drug responses across a human hematopoietic continuum. Science (80-. ). 332, 687–696 (2011).
58. Behbehani, G. K., Bendall, S. C., Clutter, M. R., Fantl, W. J. & Nolan, G. P. Single-cell mass cytometry adapted to measurements of the cell cycle. Cytometry. A 81, 552–66 (2012).
59. Fienberg, H. G., Simonds, E. F., Fantl, W. J., Nolan, G. P. & Bodenmiller, B. A platinum-based covalent viability reagent for single-cell mass cytometry. Cytometry. A 81, 467–75 (2012).
60. Bodenmiller, B. et al. Multiplexed mass cytometry profiling of cellular states perturbed by small-molecule regulators. Nat. Biotechnol. 30, 858–67 (2012).
61. Levine, J. H. et al. Data-Driven Phenotypic Dissection of AML Reveals Progenitor-like Cells that Correlate with Prognosis. Cell 162, 184–97 (2015).
62. Behbehani, G. K. et al. Mass Cytometric Functional Profiling of Acute Myeloid Leukemia Defines Cell-Cycle and Immunophenotypic Properties That Correlate with Known Responses to Therapy. Cancer Discov. 5, 988–1003 (2015).
63. Han, L. et al. Single-cell mass cytometry reveals intracellular survival/proliferative signaling in FLT3-ITD-mutated AML stem/progenitor cells. Cytometry. A 87, 346–56 (2015).
64. Bendall, S. C. et al. Single-cell trajectory detection uncovers progression and regulatory coordination in human B cell development. Cell 157, 714–25 (2014).

89
65. Amir, E. D. et al. viSNE enables visualization of high dimensional single-cell data and reveals phenotypic heterogeneity of leukemia. Nat. Biotechnol. 31, 545–52 (2013).
66. Zunder, E. R., Lujan, E., Goltsev, Y., Wernig, M. & Nolan, G. P. A Continuous Molecular Roadmap to iPSC Reprogramming through Progression Analysis of Single-Cell Mass Cytometry. Cell Stem Cell 16, 323–337 (2015).
67. Lujan, E. et al. Early reprogramming regulators identified by prospective isolation and mass cytometry. Nature 521, 352–6 (2015).
68. Mingueneau, M. et al. Single-cell mass cytometry of TCR signaling: amplification of small initial differences results in low ERK activation in NOD mice. Proc. Natl. Acad. Sci. U. S. A. 111, 16466–71 (2014).
69. Krishnaswamy, S. et al. Systems biology. Conditional density-based analysis of T cell signaling in single-cell data. Science 346, 1250689 (2014).
70. Newell, E. W., Sigal, N., Bendall, S. C., Nolan, G. P. & Davis, M. M. Cytometry by time-of-flight shows combinatorial cytokine expression and virus-specific cell niches within a continuum of CD8+ T cell phenotypes. Immunity 36, 142–52 (2012).
71. Gaudillière, B. et al. Clinical recovery from surgery correlates with single-cell immune signatures. Sci. Transl. Med. 6, 255ra131 (2014).
72. Fragiadakis, G. K. et al. Patient-specific Immune States before Surgery Are Strong Correlates of Surgical Recovery. Anesthesiology 123, 1241–55 (2015).
73. Miner, J. J. et al. Chikungunya viral arthritis in the United States: a mimic of seronegative rheumatoid arthritis. Arthritis Rheumatol. (Hoboken, N.J.) 67, 1214–1220 (2015).
74. Sen, N. & Arvin, A. M. Dissecting the molecular mechanisms of the tropism of varicella-zoster virus for human T cells. J. Virol. (2016). doi:10.1128/JVI.03375-14
75. O’Gorman, W. E. et al. The Split Virus Influenza Vaccine rapidly activates immune cells through Fcγ receptors. Vaccine 32, 5989–97 (2014).
76. O’Gorman, W. E. et al. Single-cell systems-level analysis of human Toll-like receptor activation defines a chemokine signature in patients with systemic lupus erythematosus. J. Allergy Clin. Immunol. 136, 1326–36 (2015).
77. Qiu, P. et al. Extracting a cellular hierarchy from high-dimensional cytometry data with SPADE. Nat Biotechnol 29, 886–891 (2011).

90
78. Bruggner, R. V, Bodenmiller, B., Dill, D. L., Tibshirani, R. J. & Nolan, G. P. Automated identification of stratifying signatures in cellular subpopulations. Proc. Natl. Acad. Sci. U. S. A. 111, E2770–7 (2014).
79. Van Gassen, S. et al. FlowSOM: Using self-organizing maps for visualization and interpretation of cytometry data. Cytometry. A 87, 636–45 (2015).
80. Sörensen, T., Baumgart, S., Durek, P., Grützkau, A. & Häupl, T. immunoClust--An automated analysis pipeline for the identification of immunophenotypic signatures in high-dimensional cytometric datasets. Cytometry. A 87, 603–15 (2015).
81. Spitzer, M. H. et al. An interactive reference framework for modeling a dynamic immune system. Science (80-. ). 349, 1259425–1259425 (2015).
82. Frei, A. P. et al. Highly multiplexed simultaneous detection of RNAs and proteins in single cells. Nat. Methods (2016). doi:10.1038/nmeth.3742
83. Leong, M. L. & Newell, E. W. Multiplexed Peptide-MHC Tetramer Staining with Mass Cytometry. Methods Mol. Biol. 1346, 115–31 (2015).
84. Nolan, G. P. What’s wrong with drug screening today. Nat. Chem. Biol. 3, 187–91 (2007).
85. Tralau, T. & Luch, A. Drug-mediated toxicity: illuminating the ‘bad’ in the test tube by means of cellular assays? Trends Pharmacol. Sci. 33, 353–64 (2012).
86. Paul, S. M. et al. How to improve R&D productivity: the pharmaceutical industry’s grand challenge. Nat. Rev. Drug Discov. 9, 203–14 (2010).
87. Kola, I. & Landis, J. Can the pharmaceutical industry reduce attrition rates? Nat. Rev. Drug Discov. 3, 711–5 (2004).
88. Baxter, K. et al. An end to the myth: there is no drug development pipeline. Sci. Transl. Med. 5, 171cm1 (2013).
89. Deeks, S., Drosten, C., Picker, L., Subbarao, K. & Suzich, J. Roadblocks to translational challenges on viral pathogenesis. Nat. Med. 19, 30–4 (2013).
90. Ma-Lauer, Y., Lei, J., Hilgenfeld, R. & von Brunn, A. Virus-host interactomes--antiviral drug discovery. Curr. Opin. Virol. 2, 614–21 (2012).
91. Uchida, N. et al. High-efficiency Transduction of Rhesus Hematopoietic Repopulating Cells by a Modified HIV1-based Lentiviral Vector. Mol. Ther. 20, 1882–1892 (2012).

91
92. Brown, K. N. & Barratt-Boyes, S. M. Surface phenotype and rapid quantification of blood dendritic cell subsets in the rhesus macaque. J. Med. Primatol. 38, 272–8 (2009).
93. Brinkman-Van der Linden, E. C. et al. CD33/Siglec-3 binding specificity, expression pattern, and consequences of gene deletion in mice. Mol Cell Biol 23, 4199–4206 (2003).
94. Carter, D. L. et al. CD56 identifies monocytes and not natural killer cells in rhesus macaques. Cytometry 37, 41–50 (1999).
95. Yoshino, N., Ami, Y., Terao, K., Tashiro, F. & Honda, M. Upgrading of Flow Cytometric Analysis for Absolute Counts, Cytokines and Other Antigenic Molecules of Cynomolgus Monkeys(Macaca fascicularis) by Using Anti-Human Cross-Reactive Antibodies. Exp. Anim. 49, 97–110 (2000).
96. Daubenberger, C. A., Spirig, R., Patarroyo, M. E. & Pluschke, G. Flow cytometric analysis on cross-reactivity of human-specific CD monoclonal antibodies with splenocytes of Aotus nancymaae, a non-human primate model for biomedical research. Vet. Immunol. Immunopathol. 119, 14–20 (2007).
97. Saalmüller, A. et al. Summary of the animal homologue section of HLDA8. Cell. Immunol. 236, 51–8 (2005).
98. Saalmüller, A. & Aasted, B. Summary of the animal homologue section of HLDA8. Vet. Immunol. Immunopathol. 119, 2–13 (2007).
99. Sestak, K., Scheiners, C., Wu, X. W. & Hollemweguer, E. Identification of anti-human CD antibodies reactive with rhesus macaque peripheral blood cells. Vet. Immunol. Immunopathol. 119, 21–6 (2007).
100. Olobo, J. O. Reactivity of some monoclonal antibodies specific for human lymphocytes with vervet monkey peripheral blood mononuclear cells. Scand. J. Immunol. Suppl. 11, 199–201 (1992).
101. Mortara, L. et al. Phenotype and function of myeloid dendritic cells derived from African green monkey blood monocytes. J. Immunol. Methods 308, 138–55 (2006).
102. Brooke, G., Holbrook, J. D., Brown, M. H. & Barclay, A. N. Human lymphocytes interact directly with CD47 through a novel member of the signal regulatory protein (SIRP) family. J. Immunol. 173, 2562–70 (2004).
103. Barclay, A. N. & Brown, M. H. The SIRP family of receptors and immune regulation. Nat. Rev. Immunol. 6, 457–64 (2006).
92
104. Piccio, L. et al. Adhesion of human T cells to antigen-presenting cells through SIRPbeta2-CD47 interaction costimulates T-cell proliferation. Blood 105, 2421–7 (2005).
105. Yagita, H. et al. CD2 expression in murine B cell lineage. Int. Immunol. 1, 94–8 (1989).
106. Davis, S. J. & van der Merwe, P. A. The structure and ligand interactions of CD2: implications for T-cell function. Immunol. Today 17, 177–187 (1996).
107. Kingma, D. W. et al. CD2 is expressed by a subpopulation of normal B cells and is frequently present in mature B-cell neoplasms. Cytometry 50, 243–8 (2002).
108. Davis, S. J., Ikemizu, S., Wild, M. K. & Merwe, P. A. CD2 and the nature of protein interactions mediating cell-cell recognition. Immunol. Rev. 163, 217–236 (1998).
109. Jasinska, A. J. et al. Systems biology of the vervet monkey. ILAR J. 54, 122–43 (2013).
110. Cohen, J. AIDS RESEARCH:Vaccine Studies Stymied by Shortage of Animals. Science (80-. ). 287, 959–960 (2000).
111. Sopper, S. et al. Lymphocyte subsets and expression of differentiation markers in blood and lymphoid organs of rhesus monkeys. Cytometry 29, 351–62 (1997).
112. Conrad, M. L., Davis, W. C. & Koop, B. F. TCR and CD3 antibody cross-reactivity in 44 species. Cytometry. A 71, 925–33 (2007).
113. Jesudason, S., Collins, M. G., Rogers, N. M., Kireta, S. & Coates, P. T. H. Non-human primate dendritic cells. J. Leukoc. Biol. 91, 217–228 (2012).
114. Dutertre, C.-A. et al. TLR3-responsive, XCR1+, CD141(BDCA-3)+/CD8α+-equivalent dendritic cells uncovered in healthy and simian immunodeficiency virus-infected rhesus macaques. J. Immunol. 192, 4697–708 (2014).
115. Webster, R. L. & Johnson, R. P. Delineation of multiple subpopulations of natural killer cells in rhesus macaques. Immunology 115, 206–214 (2005).
116. Autissier, P., Soulas, C., Burdo, T. H. & Williams, K. C. Evaluation of a 12-color flow cytometry panel to study lymphocyte, monocyte, and dendritic cell subsets in humans. Cytometry. A 77, 410–9 (2010).
117. Autissier, P., Soulas, C., Burdo, T. H. & Williams, K. C. Immunophenotyping of lymphocyte, monocyte and dendritic cell subsets in normal rhesus macaques by 12-color flow cytometry: clarification on DC heterogeneity. J. Immunol. Methods 360, 119–28 (2010).

93
118. Sadhu, C., Hendrickson, L., Dick, K. O., Potter, T. G. & Staunton, D. E. Novel tools for functional analysis of CD11c: activation-specific, activation-independent, and activating antibodies. J. Immunoassay Immunochem. 29, 42–57 (2008).
119. Ihanus E., Uotila L. M., Toivanen A., Varis M., G. C. G. Red-cell ICAM-4 is a ligand for the monocyte-macrophage integrin CD11c/CD18: characterization of the binding sites on ICAM-4. Blood 802–810 (2007).
120. Valentine, M. et al. Expression of the memory marker CD45RO on helper T cells in macaques. PLoS One 8, e73969 (2013).
121. Pitcher, C. J. et al. Development and Homeostasis of T Cell Memory in Rhesus Macaque. J. Immunol. 168, 29–43 (2002).
122. Johnson, R. F., Bell, P. & Harty, R. N. Effect of Ebola virus proteins GP, NP and VP35 on VP40 VLP morphology. Virol J 3, 31 (2006).
123. Licata, J. M., Johnson, R. F., Han, Z. & Harty, R. N. Contribution of ebola virus glycoprotein, nucleoprotein, and VP24 to budding of VP40 virus-like particles. J Virol 78, 7344–7351 (2004).
124. Warfield, K. L. et al. Filovirus-like particles produced in insect cells: immunogenicity and protection in rodents. J Infect Dis 196 Suppl , S421–9 (2007).
125. Warfield, K. L. et al. Ebola virus-like particle-based vaccine protects nonhuman primates against lethal Ebola virus challenge. J Infect Dis 196 Suppl , S430–7 (2007).
126. Sun, Y. et al. Protection against lethal challenge by Ebola virus-like particles produced in insect cells. Virology 383, 12–21 (2009).
127. Ayithan, N. et al. Ebola virus-like particles stimulate type I interferons and proinflammatory cytokine expression through the toll-like receptor and interferon signaling pathways. J Interf. Cytokine Res 34, 79–89 (2014).
128. Coleman, W. G., Goebel, P. J. & Leive, L. Genetic analysis of Escherichia coli O111:B4, a strain of medical and biochemical interest. J. Bacteriol. 130, 656–60 (1977).
129. Malergue, F., van Agthoven, A., Scifo, C., Egan, D. & Strous, G. J. Automation of a phospho-STAT5 staining procedure for flow cytometry for application in drug discovery. J. Biomol. Screen. 20, 416–21 (2015).
130. Glazko, G. V. Estimation of Divergence Times for Major Lineages of Primate Species. Mol. Biol. Evol. 20, 424–434 (2003).
131. Pozzi, L. et al. Primate phylogenetic relationships and divergence dates inferred from complete mitochondrial genomes. Mol. Phylogenet. Evol. 75, 165–83 (2014).
94
132. Perelman, P. et al. A molecular phylogeny of living primates. PLoS Genet. 7, e1001342 (2011).
133. Campbell, J. P., Guy, K., Cosgrove, C., Florida-James, G. D. & Simpson, R. J. Total lymphocyte CD8 expression is not a reliable marker of cytotoxic T-cell populations in human peripheral blood following an acute bout of high-intensity exercise. Brain. Behav. Immun. 22, 375–80 (2008).
134. Brezinschek, R. I., Oppenheimer-Marks, N. & Lipsky, P. E. Activated T cells acquire endothelial cell surface determinants during transendothelial migration. J. Immunol. 162, 1677–84 (1999).
135. Liu, J. et al. A five-amino-acid motif in the undefined region of the TLR8 ectodomain is required for species-specific ligand recognition. Mol. Immunol. 47, 1083–90 (2010).
136. Guiducci, C. et al. RNA recognition by human TLR8 can lead to autoimmune inflammation. J. Exp. Med. 210, 2903–19 (2013).
137. Breslin, W. L., Strohacker, K., Carpenter, K. C., Haviland, D. L. & McFarlin, B. K. Mouse blood monocytes: standardizing their identification and analysis using CD115. J. Immunol. Methods 390, 1–8 (2013).
138. Rehli, M. Of mice and men: species variations of Toll-like receptor expression. Trends Immunol. 23, 375–8 (2002).
139. Rose, S., Misharin, A. & Perlman, H. A novel Ly6C/Ly6G-based strategy to analyze the mouse splenic myeloid compartment. Cytom. Part A 81A, 343–350 (2012).
140. León, B. et al. Dendritic cell differentiation potential of mouse monocytes: monocytes represent immediate precursors of CD8- and CD8+ splenic dendritic cells. Blood 103, 2668–76 (2004).
141. Takeda, K. et al. Essential role of Stat6 in IL-4 signalling. Nature 380, 627–30 (1996).
142. Kaplan, M. H., Schindler, U., Smiley, S. T. & Grusby, M. J. Stat6 Is Required for Mediating Responses to IL-4 and for the Development of Th2 Cells. Immunity 4, 313–319 (1996).
143. Tormo, A. J. et al. IL-6 activates STAT5 in T cells. Cytokine 60, 575–82 (2012).
144. Van Rhijn, I. & Moody, D. B. CD1 and mycobacterial lipids activate human T cells. Immunol. Rev. 264, 138–53 (2015).
145. Chackerian, A. A. & Behar, S. M. Susceptibility to Mycobacterium tuberculosis: lessons from inbred strains of mice. Tuberculosis 83, 279–285 (2003).

95
146. Orme, I. M. The mouse as a useful model of tuberculosis. Tuberculosis 83, 112–115 (2003).
147. Morita, D. et al. Trans-species activation of human T cells by rhesus macaque CD1b molecules. Biochem. Biophys. Res. Commun. 377, 889–93 (2008).
148. Schlesinger, M., Rabinowitz, R., Levy, P. & Maayan, S. The expression of CD8 on B lymphocytes in HIV-infected individuals. Immunol. Lett. 50, 23–7 (1996).
149. Koelliker, D. D. et al. CD8-positive B-cell chronic lymphocytic leukemia. A report of two cases. Am. J. Clin. Pathol. 102, 212–6 (1994).
150. Mulligan, S. P. et al. B-cell chronic lymphocytic leukaemia with CD8 expression: report of 10 cases and immunochemical analysis of the CD8 antigen. Br. J. Haematol. 103, 157–62 (1998).
151. Islam, A. et al. CD8 expression on B cells in chronic lymphocytic leukemia: a case report and review of the literature. Arch. Pathol. Lab. Med. 124, 1361–3 (2000).
152. Carulli, G. et al. Aberrant expression of CD8 in B-cell non-Hodgkin lymphoma: a multicenter study of 951 bone marrow samples with lymphomatous infiltration. Am. J. Clin. Pathol. 132, 186–90; quiz 306 (2009).
153. Zong, L. et al. Rhesus macaque: a tight homodimeric CD8alphaalpha. Proteins 75, 241–4 (2009).
154. Akari, H., Terao, K., Murayama, Y., Nam, K. H. & Yoshikawa, Y. Peripheral blood CD4+CD8+ lymphocytes in cynomolgus monkeys are of resting memory T lineage. Int. Immunol. 9, 591–7 (1997).
155. Nam, K. et al. Peripheral blood extrathymic CD4(+)CD8(+) T cells with high cytotoxic activity are from the same lineage as CD4(+)CD8(-) T cells in cynomolgus monkeys. Int. Immunol. 12, 1095–103 (2000).
156. Zuckermann, F. A. Extrathymic CD4/CD8 double positive T cells. Vet. Immunol. Immunopathol. 72, 55–66 (1999).
157. Nascimbeni, M., Shin, E., Chiriboga, L., Kleiner, D. E. & Rehermann, B. Peripheral CD4+ CD8+ T cells are differentiated effector memory cells with antiviral functions. Blood 104, 478–486 (2004).
158. Nascimbeni, M., Pol, S. & Saunier, B. Distinct CD4+ CD8+ double-positive T cells in the blood and liver of patients during chronic hepatitis B and C. PLoS One 6, e20145 (2011).

96
159. Periwal, S. B. & Cebra, J. J. Respiratory mucosal immunization with reovirus serotype 1/L stimulates virus-specific humoral and cellular immune responses, including double-positive (CD4(+)/CD8(+)) T cells. J. Virol. 73, 7633–40 (1999).
160. Sasahara, T., Tamauchi, H., Ikewaki, N. & Kubota, K. Unique properties of a cytotoxic CD4+CD8+ intraepithelial T-cell line established from the mouse intestinal epithelium. Microbiol. Immunol. 38, 191–9 (1994).
161. Lee, W.-W., Nam, K.-H., Terao, K., Akari, H. & Yoshikawa, Y. Age-related increase of peripheral CD4+ CD8+ double-positive T lymphocytes in cynomolgus monkeys: longitudinal study in relation to thymic involution. Immunology 109, 217–25 (2003).
162. Reimann, K. a et al. Use of human leukocyte-specific monoclonal antibodies for clinically immunophenotyping lymphocytes of rhesus monkeys. Cytometry 17, 102–108 (1994).
163. Dean, G. A., Reubel, G. H. & Pedersen, N. C. Simian immunodeficiency virus infection of CD8+ lymphocytes in vivo. J. Virol. 70, 5646–50 (1996).
164. Wang, X., Das, A., Lackner, A. A., Veazey, R. S. & Pahar, B. Intestinal double-positive CD4+CD8+ T cells of neonatal rhesus macaques are proliferating, activated memory cells and primary targets for SIVMAC251 infection. Blood 112, 4981–90 (2008).
165. Platanias, L. C. Mechanisms of type-I- and type-II-interferon-mediated signalling. Nat. Rev. Immunol. 5, 375–86 (2005).
166. Chawla-Sarkar, M., Leaman, D. W. & Borden, E. C. Preferential Induction of Apoptosis by Interferon (IFN)-{beta} Compared with IFN-{{alpha}}2: Correlation with TRAIL/Apo2L Induction in Melanoma Cell Lines. Clin. Cancer Res. 7, 1821–1831 (2001).
167. Johns, T. G. et al. Antiproliferative potencies of interferons on melanoma cell lines and xenografts: higher efficacy of interferon beta. J. Natl. Cancer Inst. 84, 1185–90 (1992).
168. Rosenblum, M. G. et al. Growth inhibitory effects of interferon-beta but not interferon-alpha on human glioma cells: correlation of receptor binding, 2’,5'-oligoadenylate synthetase and protein kinase activity. J. Interferon Res. 10, 141–51 (1990).
169. Noronha, A., Toscas, A. & Jensen, M. A. Interferon beta decreases T cell activation and interferon gamma production in multiple sclerosis. J. Neuroimmunol. 46, 145–53 (1993).
170. Camenga, D. L. et al. Systemic recombinant alpha-2 interferon therapy in relapsing multiple sclerosis. Arch. Neurol. 43, 1239–46 (1986).

97
171. Van Boxel-Dezaire, A. H. H., Rani, M. R. S. & Stark, G. R. Complex modulation of cell type-specific signaling in response to type I interferons. Immunity 25, 361–72 (2006).
172. Krämer, O. H. & Moriggl, R. Acetylation and sumoylation control STAT5 activation antagonistically. JAK-STAT 1, 203–7 (2012).
173. Rawlings, J. S., Rosler, K. M. & Harrison, D. A. The JAK/STAT signaling pathway. J. Cell Sci. 117, 1281–3 (2004).
174. Severa, M. et al. Differential responsiveness to IFN-alpha and IFN-beta of human mature DC through modulation of IFNAR expression. J. Leukoc. Biol. 79, 1286–94 (2006).
175. Platis, D. & Foster, G. R. Activity of hybrid type I interferons in cells lacking Tyk2: a common region of IFN-alpha 8 induces a response, but IFN-alpha2/8 hybrids can behave like IFN-beta. J. Interferon Cytokine Res. 23, 655–66 (2003).
176. De Weerd, N. A. et al. Structural basis of a unique interferon-b signaling axis mediated via the receptor IFNAR1. Nat. Immunol. 14, 901–7 (2013).
177. Fish, E. N. et al. Activation of a CrkL-stat5 signaling complex by type I interferons. J. Biol. Chem. 274, 571–3 (1999).
178. Pellegrini, S., John, J., Shearer, M., Kerr, I. M. & Stark, G. R. Use of a selectable marker regulated by alpha interferon to obtain mutations in the signaling pathway. Mol. Cell. Biol. 9, 4605–4612 (1989).
179. Gauzzi, M. C. et al. The amino-terminal region of Tyk2 sustains the level of interferon alpha receptor 1, a component of the interferon alpha/beta receptor. Proc. Natl. Acad. Sci. U. S. A. 94, 11839–44 (1997).
180. Mayer-Scholl, A. et al. Human neutrophils kill Bacillus anthracis. PLoS Pathog. 1, e23 (2005).
181. Tran, D. et al. Microbicidal properties and cytocidal selectivity of rhesus macaque theta defensins. Antimicrob. Agents Chemother. 52, 944–53 (2008).
182. Wang, W. et al. Retrocyclins kill bacilli and germinating spores of Bacillus anthracis and inactivate anthrax lethal toxin. J. Biol. Chem. 281, 32755–64 (2006).
183. Kim, C. et al. Human alpha-defensins neutralize anthrax lethal toxin and protect against its fatal consequences. Proc. Natl. Acad. Sci. U. S. A. 102, 4830–5 (2005).
184. Arvin, A. et al. Monkey B virus. Human Herpesviruses: Biology, Therapy and Immunoprophylaxis (2007). at <http://www.ncbi.nlm.nih.gov/pubmed/21348110>

98
185. Ritchey, J. W., Ealey, K. A., Payton, M. E. & Eberle, R. Comparative pathology of infections with baboon and African green monkey alpha-herpesviruses in mice. J. Comp. Pathol. 127, 150–61
186. Hotson, A. N. et al. Coordinate actions of innate immune responses oppose those of the adaptive immune system during Salmonella infection of mice. Sci. Signal. 9, ra4–ra4 (2016).
187. Ness, R. O., Sachs, K. & Vitek, O. From Correlation to Causality: Statistical Approaches to Learning Regulatory Relationships in Large-Scale Biomolecular Investigations. J. Proteome Res. (2016). doi:10.1021/acs.jproteome.5b00911
188. Sachs, K., Perez, O., Pe’er, D., Lauffenburger, D. A. & Nolan, G. P. Causal protein-signaling networks derived from multiparameter single-cell data. Science 308, 523–9 (2005).
189. Sachs, K. et al. Single timepoint models of dynamic systems. Interface Focus 3, 20130019 (2013).
190. Shafto, P., Kemp, C., Mansinghka, V. & Tenenbaum, J. B. A probabilistic model of cross-categorization. Cognition 120, 1–25 (2011).
191. Mansinghka, V. K. et al. Cross-Categorization : A Method for Discovering Multiple Overlapping Clusterings. Nips 1–3 (2009).
192. Mansinghka, V., Tibbetts, R., Baxter, J., Shafto, P. & Eaves, B. BayesDB: A probabilistic programming system for querying the probable implications of data. 1–45 (2015). at <http://arxiv.org/abs/1512.05006>
193. Mansinghka, V. et al. CrossCat: A Fully Bayesian Nonparametric Method for Analyzing Heterogeneous, High Dimensional Data. Sci. York 1–50
194. Laudanski, K. et al. Ketamine affects in vitro differentiation of monocyte into immature dendritic cells. Anesthesiology 123, 628–41 (2015).
195. Welters, I. D. et al. Ketamine inhibits transcription factors activator protein 1 and nuclear factor-kappaB, interleukin-8 production, as well as CD11b and CD16 expression: studies in human leukocytes and leukocytic cell lines. Anesth. Analg. 110, 934–41 (2010).
196. Wesseling, H., Rahmoune, H., Tricklebank, M., Guest, P. C. & Bahn, S. A Targeted Multiplexed Proteomic Investigation Identifies Ketamine-Induced Changes in Immune Markers in Rat Serum and Expression Changes in Protein Kinases/Phosphatases in Rat Brain. J. Proteome Res. 14, 411–421 (2015).

99
197. Gil, A. G., Silvan, G., Illera, M. & Illera, J. C. The effects of anesthesia on the clinical chemistry of New Zealand White rabbits. Contemp. Top. Lab. Anim. Sci. 43, 25–9 (2004).
198. Soma, L. R. Anesthetic and analgesic considerations in the experimental animal. Ann N Y Acad Sci 406, 32–47 (1983).
199. Tanaka, T. et al. General anesthetics inhibit LPS-induced IL-1β expression in glial cells. PLoS One 8, e82930 (2013).
200. Sleeper, M. M., Gaughan, J. M., Gleason, C. R. & Burkett, D. E. Echocardiographic reference ranges for sedated healthy cynomolgus monkeys (Macaca fascicularis). J Am Assoc Lab Anim Sci 47, 22–25 (2008).
201. Kortepeter, M. G. et al. Real-time monitoring of cardiovascular function in rhesus macaques infected with Zaire ebolavirus. J Infect Dis 204 Suppl , S1000–10 (2011).
202. Taylor, W. M. & Grady, a W. Catheter-tract infections in rhesus macaques (Macaca mulatta) with indwelling intravenous catheters. Lab. Anim. Sci. 48, 448–454 (1998).
203. Crockett Bowers, C.L., Sackett, G.P., Bowden, D.M., C. M., Crockett, C. M., Bowers, C. L., Sackett, G. P. & Bowden, D. M. Urinary cortisol responses of longtailed macaques to five cage sizes, tethering, sedation and room change. Am J Prim 30, 55–74 (1993).
204. Adams, M. R., Kaplan, J. R., Manuck, S. B., Uberseder, B. & Larkin, K. T. Persistent sympathetic nervous system arousal associated with tethering in cynomolgus macaques. Lab Anim Sci 38, 279–281 (1988).
205. Graham, M. L. et al. Refinement of vascular access port placement in nonhuman primates: Complication rates and outcomes. Comp. Med. 60, 479–485 (2010).
206. Chow, S. et al. Whole blood fixation and permeabilization protocol with red blood cell lysis for flow cytometry of intracellular phosphorylated epitopes in leukocyte subpopulations. Cytom. Part A 67, 4–17 (2005).