crossroads resource center · 2016-04-29 · east michigan local farm & food economy by ken...
TRANSCRIPT

East MichiganLocal Farm & Food Economy
by Ken Meter, Crossroads Resource Center (Minneapolis)1
forEast Michigan Council of Governments2
for theRegional Food Systems Assessment and Plan Project funded by USDA
September 12, 2012
Covers Arenac, Bay, Clare, Gladwin, Gratiot, Huron, Iosco, Isabella, Midland,Ogemaw, Roscommon, Saginaw, Sanilac, & Tuscola Counties in Michigan
East Michigan Region (Bureau of Economic Analysis, 2010)780,297 residents receive $24 billion of income annually. Personal income rose 69% from 1969 to2010, after dollars were adjusted for inflation, in part due to an increase in population. The largestsource of personal income is transfer payments (from government programs such as pensions), at$7.3 billion. Capital income (from interest, rent or dividends), ranks second at $3.8 billion [see below].Government jobs rank third, with $2.7 billion. Manufacturing jobs produce $2.4 billion of personalincome, but this has fallen from $3.3 billion in 2001. Retail workers earn $1.1 billion. Note thatincome from public sources makes up 42% of all personal income in the region.
Income received from transfer payments includes $2.6 billion of retirement and disability insurancebenefits; $2.9 billion of medical benefits; $854 million of income maintenance benefits; $439 millionof unemployment insurance; $130 million of veterans’ benefits, and $167 million of education andtraining assistance.
Government income includes $2.4 billion of income earned by state and local government workers,and $267 million earned by federal workers. Military personnel earn $77 million of personal income.
Although population has increased more than 16% since 1969, there has been only limited publicplanning to assure a secure and stable food supply.
Public schools in the East Michigan purchased $21 million of food in 2011. Of this, $2.8 millionwas USDA commodities. See further detail on pages 24-27.
1 Considerable research assistance provided by Nick Wojciak.2 Any use of the data contained in this study for further reporting or calculations should reference theoriginal data source, and cite this report with credit to both Crossroads Resource Center and EMCOG.
Crossroads Resource Center
7415 Humboldt Ave. S. / Minneapolis, Minnesota 55423 / [email protected] www.crcworks.org
Tools for Community Self-determination

Highlights of East Michigan Local Farm & Food Economy — Ken Meter, Crossroads Resource Center, 2012
— 2 —
Issues affecting low-income residents of the East Michigan region:91,191 East Michigan residents live in what the USDA calls “food deserts” A list of these Censustracts may be found on page 28, and the USDA web site shows a map of each location.
262,842 residents (34%) earn less than 185% of federal poverty guidelines. At this level of income,children qualify for free or reduced-price lunch at school. These lower-income residents spend $532million each year buying food, including $110 million of SNAP benefits (formerly known as foodstamps) and additional WIC coupons. The region’s 6,989 farmers receive an annual combined totalof $79 million in subsidies (22-year average, 1989-2010), mostly to raise crops such as corn,soybeans, or wheat that are sold as commodities, not to feed local residents. Data from Federal Censusof 2006-2010, Bureau of Labor Statistics, & Bureau of Economic Analysis.
9% percent of the region’s households (over 74,000 residents) earn less than $10,000 per year.Source: Federal Census of 2006-2010.
17% of all Michigan adults aged 18-64 carried no health insurance in 2010. Source: Centers for DiseaseControl.
Food-related health conditions:23% of Michigan residents reported in 2009 that they eat five or more servings of fruit or vegetableseach day. 77% do not. This level of adequate consumption is about the same as the 1996 rate. Itserves as a key indicator of health, since proper fruit and vegetable consumption has been connectedto better health outcomes. Source: Centers for Disease Control.
52% of Michigan adults report they have at least 30 minutes of moderate physical activity five ormore days per week, or vigorous physical activity for 20 or more minutes three or more days perweek. This is an improvement over 46% in 2001. Source: Centers for Disease Control.
10% of Michigan residents have been diagnosed with diabetes as of 2010, up from 7.7% in 2004.Source: Centers for Disease Control. Medical costs for treating diabetes and related conditions in themetro region are estimated at $451 million per year. Costs for the state of Michigan as a whole total$5.7 billion. Source: American Diabetes Association cost calculator.
67% of Michigan residents are overweight (35%) or obese (32%), up from 55% in 1995. Source:Centers for Disease Control.

Highlights of East Michigan Local Farm & Food Economy — Ken Meter, Crossroads Resource Center, 2012
— 3 —
The region’s farms (Agricultural Census, 2007)Agricultural Census data for 2007 were released February 4, 2009
The Census of Agriculture defines a “farm” as “an operation that produces, or would normallyproduce and sell, $1,000 or more of agricultural products per year.”
Land:• 11,496 farms. This is 21% of Michigan’s farms.• The East Michigan region had 8% more farms in 2007 than in 2002. Some of this may be
due to census takers making better contact with small farms.• 594 (5%) of these are 1,000 acres or more in size.• 4,393 (38%) farms are less than 50 acres.• Average farm size is 229 acres, more than the state average of 179 acres.• The region has 2.6 million acres of land in farms.• This amounts to 26% of the state’s farmland.• The East Michigan region holds 2 million acres of harvested cropland.• At least 28,000 of these acres are irrigated. Note that data for irrigated acreage in Roscommon County
were suppressed by the USDA in an effort to protect confidentiality, so this total is incomplete.• Average value of land and buildings per farm was $672,000. This was more than the 2007
state average of $611,000.
Sales:With the exception of foods sold directly to consumers (see below), farmers typically sell commodities to wholesalers,brokers or manufacturers that require further processing or handling to become consumer items. The word“commodities” is used in this report to mean the crops and livestock sold by farmers through these wholesale channels.The term “products” encompasses commodity sales, direct sales, and any other sales.
• The region’s farmers sold $1.37 billion of crops and livestock in 2007.• $777 million of crops were sold.• $600 million of livestock and products were sold.• 6,451 (56%) of the region’s farms sold less than $10,000 of products in 2007.• Total sales from these small farms were at least $358,000, over 1% of the region’s farm
product sales. Note that data for sales of less than $10,000 in Roscommon County were suppressed by theUSDA in an effort to protect confidentiality, so this total is incomplete.
• 2,160 (19%) of the region’s farms sold more than $100,000 of products.• Total sales from these larger farms were $1.3 billion, 93% of the region’s farm product sales.• 45% of the region’s farms (5,216 of 11,496) reported net losses in 2007. This is less than the
Michigan average of 55%.• 7,067 (30%) of East Michigan farmers collected a combined total of $36 million of federal
subsidies in 2007.

Highlights of East Michigan Local Farm & Food Economy — Ken Meter, Crossroads Resource Center, 2012
— 4 —
Top farm products of East Michigan (2007)Note: ** denotes sales data has been suppressed by USDA in an effort to protect confidentiality.
Product $ millionsMilk** 342Corn 271Cattle and calves** 170Soybeans 151Forage crops (hay, etc.)** 128Wheat** 79
Production Expenses:• Production expenses in 2007 totaled $1.1 billion.• Feed purchases were the largest single expense for East Michigan farmers in 2007, totaling
$154 million (14% of production expenses).• Fertilizer, lime, and soil conditioners ranked second, costing farmers $146 million (13%).• Farmers charged $135 million to depreciation (12%).• Livestock and poultry purchases ranked as the fourth most important expense, at $104
million (10%).• Supplies, repairs, and maintenance cost farmers $90 million (8%).• Land and building rental costs totaled at least $88 million (8%). Note that data for land and
building expenses in Roscommon County were suppressed by the USDA so this total and percentage areincomplete.
• Seeds and plants cost farmers $80 million (7%).• Hired farm labor costs were at least $80 million (7%). Note that data for hired farm labor expenses
in Roscommon County were suppressed by the USDA in an effort to protect confidentiality, so this total andpercentage are incomplete.
Cattle & Dairy:• 3,012 farms hold an inventory of 321,000 cattle.• 217,000 cattle were sold by farmers in 2007 for total sales of at least $170 million. Note that
data for sales of cattle and calves in Midland County were suppressed by the USDA in an effort to protectconfidentiality, so this total is incomplete.
• 1,374 farms raise beef cows.• 667 farms raise milk cows.• 884 farms produced corn for silage.• 3,879 farms produced 689,000 tons of forage crops (hay, etc.) on 218,000 acres.• 2,953 farms sold at least $128 million of forage crops. Note that data for sales of forage crops in
Gratiot and Midland counties were suppressed by the USDA in an effort to protect confidentiality, so thistotal is incomplete.
Highlights of East Michigan Local Farm & Food Economy — Ken Meter, Crossroads Resource Center, 2012
— 5 —
Other Livestock & Animal Products:• 445 farms hold an inventory of 138,000 hogs and pigs.• 431 farms sold at least 351,000 hogs and pigs in 2007, worth at least $8 million. Note that data
for sales of hogs and pigs in Gratiot, Huron, and Roscommon counties were suppressed by the USDA in aneffort to protect confidentiality, so this total is incomplete.
• 294 farms hold an inventory of at least 10,000 sheep and lambs. Note that data for inventory ofsheep and lambs in Roscommon County were suppressed by the USDA in an effort to protect confidentiality,so this total is incomplete.
• 334 farms sold at least $833,000 worth of sheep, goats, and lambs in 2007. Note that data forsales of sheep, goats, and lambs in Sanilac County were suppressed by the UDSA in an effort to protectconfidentiality, so this total is incomplete.
• 803 farms hold an inventory of at least 19,000 laying hens. Note that data for inventory of layinghens in Huron and Tuscola counties were suppressed by the USDA in an effort to protect confidentiality, sothis total is incomplete.
• 106 farms raise broiler chickens.• 9 farms engage in aquaculture.• 413 farms raise horses and ponies.
Grains, Oil Seeds, & Edible Beans:• 4,860 million farms produced at least $580 million of grains, oil seeds, and edible beans. Note
that data for sales of grains, oil seeds, and edible beans in Roscommon County were suppressed by theUDSA in an effort to protect confidentiality, so this total is incomplete.
• 3,878 farms produced 87 million bushels of corn on 654,000 acres, worth $271 million.• This amounts to an average price per bushel of corn of $3.10. Note that this price is an average,
and does not necessarily represent an actual price at which corn was sold.• 3,103 farms produced 19 million bushels of soybeans on 470,000 acres, worth $151 million.• This amounts to an average price per bushel of soybeans of $7.95. Note that this price is an
average, and does not necessarily represent an actual price at which soybeans were sold.• The total value of corn and soybeans amounted to 30% of all farm product sales in 2007.• 2,347 farms produced 17 million bushels of wheat on 232,000 acres, worth at least $79
million. Note that data for sales of wheat in Roscommon County were suppressed by the USDA in aneffort to protect confidentiality, so this total is incomplete.
Vegetables & Melons (some farmers state that Ag Census data does not fully represent vegetable production):• 443 farms worked 29,000 acres to produce vegetables, worth at least $28 million. Note that
data for sales of vegetables in Gratiot and Ogemaw counties were suppressed by the USDA in an effort toprotect confidentiality, so this total is incomplete.
• This represents a 13% increase in the number of farms (from 393) over 2002 levels.• 85 farms raised potatoes.
Fruits (some farmers state that Ag Census data does not fully represent fruit production):• 184 farms in the region hold at least 1,000 acres of orchards. Note that data for acreage of
orchards in Clare County were suppressed by the USDA in an effort to protect confidentiality, so this total isincomplete.

Highlights of East Michigan Local Farm & Food Economy — Ken Meter, Crossroads Resource Center, 2012
— 6 —
• 241 farms sold at least $2.2 million of fruits, nuts, and berries. Note that data for sales of fruits,nuts, and berries, in Bay, Roscommon, and Sanilac counties were suppressed by the USDA in an effort toprotect confidentiality, so this total is incomplete.
Nursery & Greenhouse Plants:• 202 farms sold at least $17 million worth of ornamentals in 2007. Note that data for sales of
ornamentals in Clare and Midland counties were suppressed by the USDA in an effort to protectconfidentiality, so this total is incomplete.
• This represents an increase of 6% in the number of farms (from 190) since 2002.• 93 farms sold Christmas trees.
Direct & Organic Sales:• 942 farms sell $5.7 million of food products directly to consumers. This is a 24% increase of
number of farms (758 in 2002) selling direct, and an 8% increase in direct sales over 2002sales of $5.3 million.
• This amounts to 0.4% of farm product sales, the same as the national average of 0.4%.• Tuscola County leads the region in direct sales, with $1.2 million.• 97 farms in the region sold at least $12 million of organic products, accounting for at least
37% of Michigan’s organic sales. Note that data for sales of organic products in Bay, Gladwin, Iosco,Isabella, Ogemaw, and Roscommon counties were suppressed by the USDA in an effort to protectconfidentiality, so this total is incomplete.
• For comparison, 582 farms in Michigan sold $32 million of organic food products.• 95 farms market through community supported agriculture (CSA).• 396 farms produce and sell value-added products.
Conservation Practices:• 3,529 farms use conservation methods such as no-till, limited tilling, filtering field runoff to
remove chemicals, fencing animals to prevent them from entering streams, etc.• 1,021 farms practice rotational or management intensive grazing.• 85 farms generate energy or electricity on the farm.
Other Crops:• 884 farms produced 1.2 million tons of corn for silage on 75,000 acres.• 482 farms produced 701,000 bushels of oats on 12,000 acres.• 701 farms produced at least 3.4 million tons of sugarbeets (for sugar) on over 142,000 acres.
Note that data for tonnage and acreage of sugarbeets in Isabella and Ogemaw Counties were suppressed bythe USDA in an effort to protect confidentiality, so these totals are incomplete.

Highlights of East Michigan Local Farm & Food Economy — Ken Meter, Crossroads Resource Center, 2012
— 7 —
Limited-resource farms and others in East Michigan(Census of Agriculture, 2007)
Small family farms: Farms Percent Acres PercentLimited-resource 1,657 15% 118,498 5%Retirement 2,508 22% 245,284 9%Residential/lifestyle 3,653 33% 299,874 11%Farming occupation/lower sales 1,361 12% 167,021 6%Farming occupation/higher sales 614 5% 279,044 11%
Large family farms 489 4% 411,097 16%Very large family farms 519 5% 830,493 32%Nonfamily farms 337 3% 120,261 5%
Total 11,138 2,471,572
Definition of terms (Agricultural Census 2007):
Limited-resource farms have market value of agricultural products sold gross sales of less than$100,000, and total principal operator household income of less than $20,000.
Retirement farms have market value of agricultural products sold of less than $250,000, and aprincipal operator who reports being retired.
Residential/lifestyle farms have market value of agricultural products sold of less than $250,000,and a principal operator who reports his/her primary occupation as other than farming.
Farming occupation/lower-sales farms have market value of agricultural products sold of lessthan $100,000, and a principal operator who reports farming as his/her primary occupation.
Farming occupation/higher-sales farms have market value of agricultural products sold ofbetween $100,000 and $249,999, and a principal operator who reports farming as his/her primaryoccupation.
Large family farms have market value of agricultural products sold between $250,000 and$499,999.
Very large family farms have market value of agricultural products sold of $500,000 or more.
Nonfamily farms are farms organized as nonfamily corporations, as well as farms operated byhired manager.

Highlights of East Michigan Local Farm & Food Economy — Ken Meter, Crossroads Resource Center, 2012
— 8 —
County and State Highlights
Arenac County highlights (Agriculture Census 2007):• 488 farms, 28% more than in 2002.• Arenac County has 95,000 acres of land in farms.• Farmers sold $30 million of products in 2007.• $18 million (60%) of these sales were crops.• $12 million (40%) of these sales were livestock.• The most prevalent farm size is 50 to 179 acres, with 179 farms (37%) in this category.• The next most prevalent is 10 to 49 acres, with 171 (35%) farms.• 22 farms (5%) are 1,000 acres or more.• 193 farms (40%) are less than 50 acres.• 351 farms (72%) sold less than $10,000 in farm products.• 63 farms (13%) sold more than $100,000 in farm products.• Arenac County ranks 8th in Michigan for acreage of dry edible beans, with 5,351.• 20 farms sold $75,000 of food directly to consumers. This is a one-farm decrease in the
number of farms selling direct (21 in 2002), and a 121% increase in direct sales over 2002sales of $34,000.
• Direct sales were 0.3% of farm product sales, less than the national average of 0.4%.
Bay County highlights (Agriculture Census 2007):• 851 farms, 8% more than in 2002.• Bay County has 186,000 acres of land in farms.• Farmers sold $77 million of products in 2007.• $69 million (90%) of these sales were crops.• $8 million (10%) of these sales were livestock.• The most prevalent farm size is 10 to 49 acres, with 297 farms (35%) in this category.• The next most prevalent is 50 to 179 acres, with 271 (32%) farms.• 43 farms (5%) are 1,000 acres or more.• 342 farms (40%) are less than 50 acres.• 426 farms (50%) sold less than $10,000 in farm products.• 176 farms (21%) sold more than $100,000 in farm products.• Bay County ranks 2nd in Michigan for inventory of quail, but inventory figures were not released by
the USDA in an effort to protect confidentiality.• The county ranks 3rd in the state for acreage of dry edible beans, with 20,000.• Bay County ranks 5th in the state for sales of forage crops (hay, etc.), with $11 million.• The county ranks fifth in the state for acreage of sugarbeets (for sugar), with 14,000.• Bay County ranks 6th in Michigan for inventory of farm-raised deer, with 772.• The county ranks 10th in the state for inventory of bee colonies, with 2,524.• 93 farms sold $809,000 of food directly to consumers. This is a 33% increase in the number
of farms selling direct (70 in 2002), and a 28% decrease in direct sales since 2002 sales of$1.1 million.
• Direct sales were 1% of farm product sales, more than twice the national average of 0.4%.

Highlights of East Michigan Local Farm & Food Economy — Ken Meter, Crossroads Resource Center, 2012
— 9 —
Clare County highlights (Agriculture Census 2007):• 450 farms, 9% more than in 2002.• Clare County has 68,000 acres of land in farms.• Farmers sold $18.3 million of products in 2007.• $2.7 million (15%) of these sales were crops.• $15.6 million (85%) of these sales were livestock.• The most prevalent farm size is 50 to 179 acres, with 206 farms (46%) in this category.• The next most prevalent is 10 to 49 acres, with 133 (30%) farms.• 7 farms (2%) are 1,000 acres or more.• 157 farms (35%) are less than 50 acres.• 307 farms (68%) sold less than $10,000 in farm products.• 40 farms (9%) sold more than $100,000 in farm products.• Clare County ranks 1st in Michigan for acreage of short-rotation woody crops, with 958.• 36 farms sold $80,000 of food directly to consumers. This is a 10% decrease in the number
of farms selling direct (40 in 2002), and a 36% decrease in direct sales since 2002 sales of$125,000.
• Direct sales were 0.4% of farm product sales, the same as the national average of 0.4%.
Gladwin County highlights (Agriculture Census 2007):• 557 farms, 4% more than in 2002.• Gladwin County has 68,000 acres of land in farms.• Farmers sold $12.1 million of products in 2007.• $6.6 million (55%) of these sales were crops.• $5.5 million (45%) of these sales were livestock.• The most prevalent farm size is 50 to 179 acres, with 270 farms (48%) in this category.• The next most prevalent is 10 to 49 acres, with 175 (31%) farms.• 7 farms (1%) are 1,000 acres or more.• 198 farms (36%) are less than 50 acres.• 389 farms (70%) sold less than $10,000 in farm products.• 18 farms (3%) sold more than $100,000 in farm products.• 59 farms sold $256,000 of food directly to consumers. This is a 20% increase in the number
of farms selling direct (49 in 2002), and an 11% decrease in direct sales since 2002 sales of$289,000.
• Direct sales were 2.1% of farm product sales, more than 5 times the national average of0.4%.
Gratiot County highlights (Agriculture Census 2007):• 1,036 farms, 2% more than in 2002.• Gratiot County has 287,000 acres of land in farms.• Farmers sold $190 million of products in 2007.• $86 million (45%) of these sales were crops.• $104 million (55%) of these sales were livestock.• The most prevalent farm size is 50 to 179 acres, with 354 farms (34%) in this category.• The next most prevalent is 10 to 49 acres, with 333 (32%) farms.• 73 farms (7%) are 1,000 acres or more.• 400 farms (39%) are less than 50 acres.

Highlights of East Michigan Local Farm & Food Economy — Ken Meter, Crossroads Resource Center, 2012
— 10 —
• 522 farms (50%) sold less than $10,000 in farm products.• 218 farms (21%) sold more than $100,000 in farm products.• Gratiot County ranks 3rd in Michigan for sales of cattle and calves, with $21 million.• The county ranks 4th in the state for acreage of soybeans, with 77,000.• Gratiot County ranks 4th in the state for inventory of pullets for laying flock replacement, but
inventory figures were not released by the USDA in order to protect confidentiality.• The county ranks fourth in the state for inventory of hogs and pigs, with 61,000.• Gratiot County ranks 5th in Michigan for livestock sales.• The county ranks 5th the state for inventory of turkeys, but inventory figures were not released by
the USDA in an effort to protect confidentiality.• Gratiot County ranks 6th in the state for sales of forage crops (hay, etc.), but sales figures were
not released by the USDA in an effort to protect confidentiality.• The county ranks sixth in the state for sales of poultry and eggs, but sales figures were not
released by the USDA in an effort to protect confidentiality.• Gratiot County ranks 6th in state for sales of milk, with $61 million.• The county ranks 6th in Michigan for acreage of sugarbeets (for sugar), with 10,000.• Gratiot County ranks 6th in the state for inventory of cattle and calves, with 39,000.• The county ranks seventh in the state for sales of agricultural products.• Gratiot County ranks 7th in the state for sales of grains, oilseeds, dry beans, and dry peas,
with $69 million.• The county ranks 7th in the state for sales of hogs and pigs, but sales figures were not released by
the USDA in an effort to protect confidentiality.• Gratiot County ranks 7th in Michigan for acreage of corn for grain, with 92,000.• The county ranks tenth in the state for acreage of wheat, with 17,000.• 77 farms sold $615,000 of food directly to consumers. This is a 15% increase in the number
of farms selling direct (77 in 2002), and a 124% increase in direct sales over 2002 sales of$274,000.
• Direct sales were 0.3% of farm product sales, less than the national average of 0.4%.
Huron County highlights (Agriculture Census 2007):• 1,394 farms, 17% more than in 2002.• Huron County has 441,000 acres of land in farms.• Farmers sold $375 million of products in 2007.• $167 million (44%) of these sales were crops.• $208 million (56%) of these sales were livestock.• The most prevalent farm size is 10 to 49 acres, with 404 farms (29%) in this category.• The next most prevalent is 50 to 179 acres, with 397 (28%) farms.• 118 farms (8%) are 1,000 acres or more.• 500 farms (36%) are less than 50 acres.• 618 farms (44%) sold less than $10,000 in farm products.• 479 farms (34%) sold more than $100,000 in farm products.• Huron County ranks 1st in Michigan, and 4th in the United States for acreage of dry edible
beans, with 73,000.• The County ranks 1st in the state and 4th in the country for acreage of sugarbeets (for sugar),
with 53,000.• Huron County ranks 1st in the state for sales of grains, oilseeds, dry beans, and dry peas, with
$115 million.

Highlights of East Michigan Local Farm & Food Economy — Ken Meter, Crossroads Resource Center, 2012
— 11 —
• The county ranks first in the state for sales of forage crops (hay, etc.), with $49 million.• Huron County ranks 1st in the state for sales of cattle and calves, with $78 million.• The county ranks 1st in Michigan for sales of milk, with $108 million.• Huron County ranks 1st in the state for acreage of wheat for grain, with 59,000.• The county ranks first in the state for inventory of cattle and calves, with 106,000.• Huron County ranks 2nd in the state for crop sales.• The county ranks 2nd in the state for livestock sales.• Huron County ranks 3rd in Michigan for sales of agricultural products.• The county ranks third in the state for acreage of corn, with 100,000.• Huron County ranks 3rd in the state for inventory of bee colonies, with 4,860.• The county ranks 4th in the state for inventory of laying hens, but inventory figures were not
released by the USDA in an effort to protect confidentiality.• Huron County ranks 5th in the state for sales of poultry and eggs, but sales figures were not
released by the USDA in an effort to protect confidentiality.• The county ranks fifth in Michigan for inventory of pullets for laying flock replacement, but
inventory figures were not released by the USDA in an effort to protect confidentiality.• Huron County ranks 10th in the state for sales of hogs and pigs, but sales figures were not released
by the USDA in an effort to protect confidentiality.• The county ranks 10th in the state for inventory of hogs and pigs, with 37,000.• 52 farms sold $368,000 of food directly to consumers. This is a 33% increase in the number
of farms selling direct (39 in 2002), and a 55% increase in direct sales over 2002 sales of$238,000.
• Direct sales were 0.1% of farm product sales, one quarter the national average of 0.4%.
Iosco County highlights (Agriculture Census 2007):• 316 farms, 11% more than in 2002.• Iosco County has 48,000 acres of land in farms.• Farmers sold $15 million of products in 2007.• $4.7 million (31%) of these sales were crops.• $10.3 million (69%) of these sales were livestock.• The most prevalent farm size is 10 to 49 acres, with 127 farms (40%) in this category.• The next most prevalent is 50 to 179 acres, with 121 (38%) farms.• 6 farms (2%) are 1,000 acres or more.• 136 farms (43%) are less than 50 acres.• 241 farms (76%) sold less than $10,000 in farm products.• 27 farms (9%) sold more than $100,000 in farm products.• 52 farms sold $140,000 of food directly to consumers. This is a 108% increase in the number
of farms selling direct (25 in 2002), and a 79% increase in direct sales over 2002 sales of$78,000.
• Direct sales were 0.9% of farm product sales, more than twice the national average of 0.4%.

Highlights of East Michigan Local Farm & Food Economy — Ken Meter, Crossroads Resource Center, 2012
— 12 —
Isabella County highlights (Agriculture Census 2007):• 1,018 farms, 7% more than in 2002.• Isabella County has 196,000 acres of land in farms.• Farmers sold $71.4 million of products in 2007.• $36 million (50%) of these sales were crops.• $35.4 million (50%) of these sales were livestock.• The most prevalent farm size is 50 to 179 acres, with 397 farms (39%) in this category.• The next most prevalent is 10 to 49 acres, with 317 (31%) farms.• 32 farms (3%) are 1,000 acres or more.• 366 farms (36%) are less than 50 acres.• 621 farms (61%) sold less than $10,000 in farm products.• 139 farms (14%) sold more than $100,000 in farm products.• Isabella County ranks 6th in Michigan for inventory of pheasants, with 12,000.• The county ranks 8th in the state for inventory of cattle and calves, with 29,000.• Isabella County ranks 9th in the state for sales of cattle and calves, with $11 million.• The county ranks ninth in the state for inventory of broiler chickens, with 2,467.• Isabella County ranks 10th in the state for sales of forage crops (hay, etc.), with $3 million.• The county ranks 10th in Michigan for acreage of forage crops (hay, etc.), with 28,000.• 94 farms sold $527,000 of food directly to consumers. This is a 31% increase in the number
of farms selling direct (72 in 2002), and a 48% increase in direct sales over 2002 sales of$355,000.
• Direct sales were 0.7% of farm product sales, nearly double the national average of 0.4%.
Midland County highlights (Agriculture Census 2007):• 571 farms, 12% more than in 2002.• Midland County has 91,000 acres of land in farms.• Farmers sold $48.8 million of products in 2007.• $22.4 million (46%) of these sales were crops.• $26.4 million (54%) of these sales were livestock.• The most prevalent farm size is 10 to 49 acres, with 217 farms (38%) in this category.• The next most prevalent is 50 to 179 acres, with 201 (35%) farms.• 17 farms (3%) are 1,000 acres or more.• 267 farms (47%) are less than 50 acres.• 392 farms (69%) sold less than $10,000 in farm products.• 58 farms (10%) sold more than $100,000 in farm products.• Midland County ranks 8th in the Michigan for sales of forage crops (hay, etc.), but sales figures
were not released by the USDA in an effort to protect confidentiality.• The county ranks 8th in the state for acreage of sugarbeets (for sugar), with 3,427.• 67 farms sold $212,000 of food directly to consumers. This is a 76% increase in the number
of farms selling direct (38 in 2002), and a 168% increase in direct sales over 2002 sales of$79,000.
• Direct sales were 0.4% of farm product sales, the same as the national average of 0.4%.

Highlights of East Michigan Local Farm & Food Economy — Ken Meter, Crossroads Resource Center, 2012
— 13 —
Ogemaw County highlights (Agriculture Census 2007):• 321 farms, 25% more than in 2002.• Ogemaw County has 61,000 acres of land in farms.• Farmers sold $30.5 million of products in 2007.• $4.1 million (13%) of these sales were crops.• $26.4 million (87%) of these sales were livestock.• The most prevalent farm size is 50 to 179 acres, with 122 farms (38%) in this category.• The next most prevalent is 10 to 49 acres, with 96 (30%) farms.• 12 farms (4%) are 1,000 acres or more.• 108 farms (34%) are less than 50 acres.• 213 farms (4%) sold less than $10,000 in farm products.• 44 farms (14%) sold more than $100,000 in farm products.• 25 farms sold $65,000 of food directly to consumers. This is a two-farm decrease in the
number of farms selling direct (27 in 2002), and a 70% decrease in direct sales from 2002sales of $216,000.
• Direct sales were 0.2% of farm product sales, one half the national average of 0.4%.
Roscommon County highlights (Agriculture Census 2007):• 54 farms, 8 farms more than in 2002.• Roscommon County has 4,749 acres of land in farms.• Farmers sold $379,000 of products in 2007.• $170,000 (45%) of these sales were crops.• $209,000 (55%) of these sales were livestock.• The most prevalent farm size is 10 to 49 acres, with 23 farms (43%) in this category.• The next most prevalent is 50 to 179 acres, with 20 (37%) farms.• No farms are 1,000 acres or more.• 25 farms (46%) are less than 50 acres.• 42 farms (78%) sold less than $10,000 in farm products.• No farms sold more than $100,000 in farm products.• Roscommon County ranks 6th in Michigan for acreage of fresh cut herbs, with 4.• 7 farms sold $20,000 of food directly to consumers. There was no change in the number of
farms selling direct since 2002, and a 17% decrease in direct sales since 2002 sales of$24,000.
• Direct sales were 5.3% of farm product sales, more than thirteen times the national averageof 0.4%.
Saginaw County highlights (Agriculture Census 2007):• 1,533 farms, 13% more than in 2002.• Saginaw County has 324,000 acres of land in farms.• Farmers sold $142.5 million of products in 2007.• $126.5 million (89%) of these sales were crops.• $16 million (11%) of these sales were livestock.• The most prevalent farm size is 10 to 49 acres, with 568 farms (37%) in this category.• The next most prevalent is 50 to 179 acres, with 493 (32%) farms.• 63 farms (4%) are 1,000 acres or more.• 666 farms (43%) are less than 50 acres.
Highlights of East Michigan Local Farm & Food Economy — Ken Meter, Crossroads Resource Center, 2012
— 14 —
• 774 farms (50%) sold less than $10,000 in farm products.• 270 farms (18%) sold more than $100,000 in farm products.• Saginaw County ranks 1st in Michigan for acreage of corn, with 113,000.• The county ranks 3rd in the state for acreage of soybeans, with 84,000.• Saginaw County ranks 4th in the state for sales of grains, oilseeds, dry beans, and dry peas,
with $93 million.• The county ranks fourth in the state for sales of forage crops (hay etc.), with $17 million.• Saginaw County ranks 4th in Michigan for acreage of sugarbeets (for sugar), with 18,000.• The county ranks 6th in the state for acreage of wheat, with 27,000.• Saginaw County ranks 6th in the state for acreage of dry edible beans, with 9,461.• The county ranks seventh in the state for crop sales.• 109 farms sold $770,000 of food directly to consumers. This is a 27% increase in the number
of farms selling direct (86 in 2002), and a 13% decrease in direct sales since 2002 sales of$888,000.
• Direct sales were 0.5% of farm product sales, more than the national average of 0.4%.
Sanilac County highlights (Agriculture Census 2007):• 1,535 farms, 4% less than in 2002.• Sanilac County has 417,000 acres of land in farms.• Farmers sold $216.7 million of products in 2007.• $118.2 million (55%) of these sales were crops.• $98.5 million (45%) of these sales were livestock.• The most prevalent farm size is 50 to 179 acres, with 523 farms (34%) in this category.• The next most prevalent is 10 to 49 acres, with 431 (28%) farms.• 100 farms (7%) are 1,000 acres or more.• 504 farms (33%) are less than 50 acres.• 750 farms (49%) sold less than $10,000 in farm products.• 377 farms (25%) sold more than $100,000 in farm products.• Sanilac County ranks 1st in Michigan and 2nd in the United States for inventory of pheasants,
but inventory figures were not released in an effort to protect confidentiality.• The county ranks 1st in the state for acreage of soybeans, with 109,000.• Sanilac County ranks 2nd in the state for sales of cattle and calves, with $26 million.• The county ranks second in the state for acreage of wheat, with 48,000.• Sanilac County ranks 2nd in the state for inventory of cattle and calves with 56,000.• The county ranks 3rd in Michigan for sales of grains, oilseeds, dry beans, and dry peas, with
$94 million.• Sanilac County ranks 3rd in the state for sales of forage crops (hay, etc.), with $20 million.• The county ranks third in the state for sales of milk, with $71 million.• Sanilac County ranks 3rd in the state for acreage of forage crops (hay, etc.), with 35,000.• The county ranks 3rd in the state for acreage of sugarbeets (for sugar), with 19,000.• Sanilac County ranks 4th in Michigan for sales of agricultural products.• The county ranks seventh in the state for sales of livestock.• Sanilac County ranks 7th in the state for inventory of bee colonies, with 3,371.• The county ranks 9th in the state for acreage of corn, with 91,000.• Sanilac County ranks 10th in the state for crop sales.

Highlights of East Michigan Local Farm & Food Economy — Ken Meter, Crossroads Resource Center, 2012
— 15 —
• 106 farms sold $566,000 of food directly to consumers. This is a five-farm increase in thenumber of farms selling direct (101 in 2002), and a 2% decrease in direct sales since 2002sales of $580,000.
• Direct sales were 0.3% of farm product sales, less than the national average of 0.4%.
Tuscola County highlights (Agriculture Census 2007):• 1,372 farms, 6% more than in 2002.• Tuscola County has 343,000 acres of land in farms.• Farmers sold $150 million of products in 2007.• $117 million (78%) of these sales were crops.• $33 million (22%) of these sales were livestock.• The most prevalent farm size is 50 to 179 acres, with 492 farms (36%) in this category.• The next most prevalent is 10 to 49 acres, with 458 (33%) farms.• 94 farms (7%) are 1,000 acres or more.• 531 farms (39%) are less than 50 acres.• 805 farms (59%) sold less than $10,000 in farm products.• 251 farms (18%) sold more than $100,000 in farm products.• Tuscola County ranks 2nd in Michigan and 9th in the United States for acreage of dry edible
beans, with 37,000.• The county ranks 2nd in the state for acreage of sugarbeets (for sugar), with 20,000.• Tuscola County ranks 2nd in the state for sales of forage crops (hay, etc.), with $20 million.• The county ranks third in the state for acreage of wheat, with 32,000.• Tuscola County ranks 4th in the state for acreage of corn, with 96,000.• The county ranks 5th in Michigan for sales of grains, oilseeds, dry beans, and dry peas, with
$91 million.• Tuscola County ranks 5th in the state for inventory of laying hens, but inventory figures were not
released by the USDA in an effort to protect confidentiality.• The county ranks sixth in the state for inventory of pullets for laying flock replacement, but
inventory figures were not released by the USDA in an effort to protect confidentiality.• Tuscola County ranks 7th in the state for sales of poultry and eggs, but inventory figures were not
released by the USDA in an effort to protect confidentiality.• The county ranks 8th in the state for inventory of broiler chickens, with 2,790.• 145 farms sold $1.2 million of food directly to consumers. This is a 25% increase in the
number of farms selling direct (116 in 2002), and a 24% increase in direct sales over 2002sales of $977,000.
• Direct sales were 0.8% of farm product sales, double the national average of 0.4%.
Highlights of East Michigan Local Farm & Food Economy — Ken Meter, Crossroads Resource Center, 2012
— 16 —
State of Michigan highlights (Agriculture Census 2007):• 56,000 farms, 5% more than in 2002.• Michigan has 10 million acres of land in farms.• Farmers sold $5.8 billion of products in 2007.• $3.33 billion (58%) of these sales were crops.• $2.42 billion (42%) of these sales were livestock.• The most prevalent farm size is 10 to 49 acres, with 21,000 farms (37%) in this category.• The next most prevalent is 50 to 179 acres, with 19,000 (34%) farms.• 1,969 farms (4%) are 1,000 acres or more.• 24,945 farms (45%) are less than 50 acres.• 35,000 farms (62%) sold less than $10,000 in farm products.• 7,966 farms (14%) sold more than $100,000 in farm products.• Michigan ranks 3rd in the United States for sales of Christmas trees, with $29 million.• The state ranks 5th in the country for sales of fruit, tree nuts, and berries, with $392 million.• Michigan ranks 6th in the country for sales of ornamentals, with $623 million.• The state ranks seventh in the country for sales of milk with $1.3 billion.• Michigan ranks 7th in the country for acreage of corn for silage, with 297,000.• The state ranks 9th in the country for vegetable sales, with $347 million.• 6,373 farms sold $59 million of food directly to consumers. This is a 29% increase in the
number of farms selling direct (4,925 in 2002), and a 58% increase in direct sales over 2002sales of $37 million.
• Direct sales were 1% of farm product sales, more than twice the national average of 0.4%.• If direct food sales made up a single commodity, the value of these sales would outrank the
state’s 16th-most important product, cherries.• 632 farms farm organically, with a total of 41,000 acres of harvested cropland, and 4,709
acres of pastureland.• 14,000 acres on 477 farms are undergoing organic conversion.• 582 farms in Michigan sold $32 million of organic food products, including $18 million of
crops (this may include ornamental and greenhouse crops), $3.6 million of livestock andpoultry, and $10.5 million of products from livestock and poultry (such as milk or eggs).
• 463 farms market through community supported agriculture (CSA).• 2,194 farms produce value-added products.• 15,220 farms use conservation methods such as no-till, limited tilling, filtering field runoff to
remove chemicals, fencing animals to prevent them from entering streams, etc.• 7,151 farms practice rotational or management intensive grazing.• 417 farms generate energy or electricity on the farms.

Highlights of East Michigan Local Farm & Food Economy — Ken Meter, Crossroads Resource Center, 2012
— 17 —
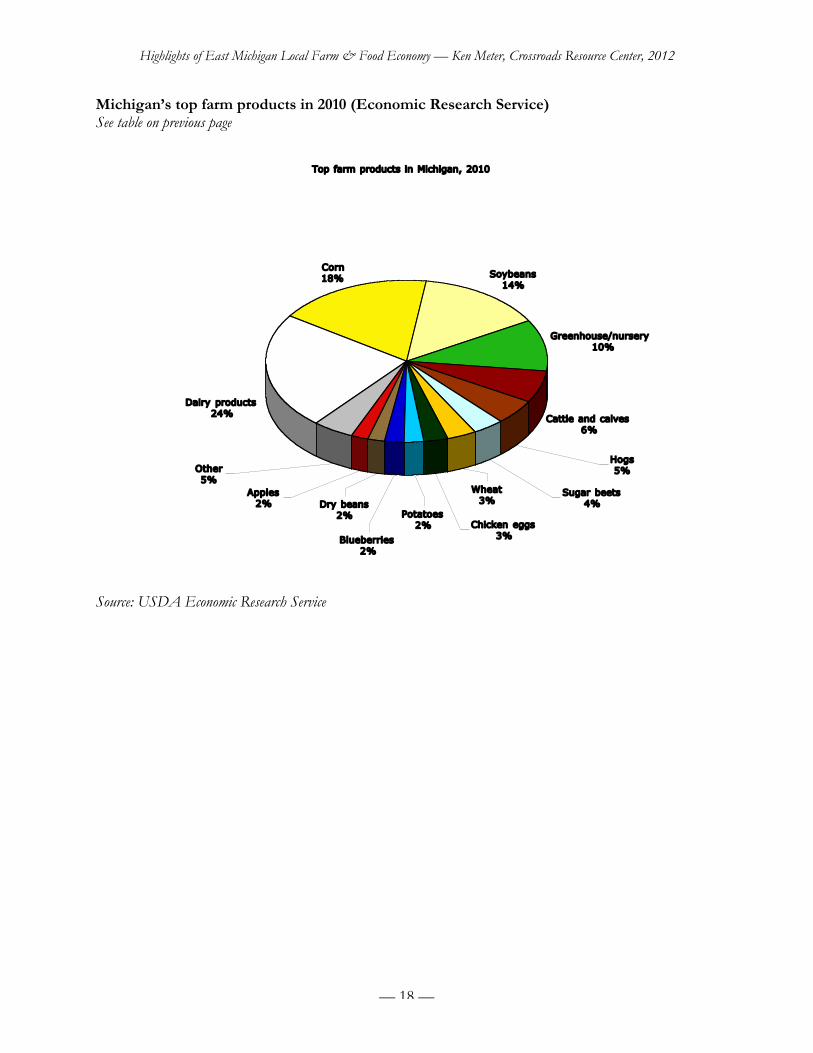
Michigan’s top farm products in 2010 (Economic Research Service)The data in the table below and pie chart on the next page are for Michigan as a whole. See chart on next page.
$ millions1 Dairy products 1,4112 Corn 1,0823 Soybeans 8674 Greenhouse/nursery 6215 Cattle and calves 3816 Hogs 3187 Sugar beets 2138 Wheat 1999 Chicken eggs 163
10 Potatoes 14011 Blueberries 13412 Dry beans 12213 Apples 11614 Hay 7115 Cucumbers 7016 Cherries 3717 Corn, sweet 2318 Beans, snap 2119 Celery 1820 Grapes 1521 Asparagus 1422 Onions 13
Note: turkeys, tomatoes, and carrots were also listed among Michigan’s top 25 products, but sales figures for theseproducts were not released by ERS, in an effort to protect confidentiality.
Note also that at $59 million, direct sales from farmers to consumers amount to more than the valueof the 16th-ranking product, cherries.
Highlights of East Michigan Local Farm & Food Economy — Ken Meter, Crossroads Resource Center, 2012
— 18 —
Michigan’s top farm products in 2010 (Economic Research Service)See table on previous page
Top farm products in Michigan, 2010
Dairy products24%
Corn18% Soybeans
14%
Greenhouse/nursery10%
Cattle and calves6%
Wheat3%
Potatoes2% Chicken eggs
3%
Dry beans2%
Blueberries2%
Apples2%
Other5%
Sugar beets4%
Hogs5%
Source: USDA Economic Research Service

Highlights of East Michigan Local Farm & Food Economy — Ken Meter, Crossroads Resource Center, 2012
— 19 —
Balance of Cash Receipts and Production Costs (BEA):East Michigan farmers sell $1.31 billion of food commodities per year (1989-2010 average),spending $1.26 billion to raise them, for an average gain of $55 million each year. This is an averagenet cash income of $4,770 per farm. Note that these sales figures compiled by the BEA may differ from cashreceipts recorded by the USDA Agriculture Census (above).
Overall, farm producers earned a surplus of $1.3 billion by selling crops and livestock over the years1989 to 2010. Yet farm production costs exceeded cash receipts for seven years of that 22-yearperiod. Moreover, 45% of the region's farms reported that they lost money in 2007 (Ag Census).East Michigan region farmers and ranchers earned $116 million more by selling commodities in2010 than they earned in 1969 (in 2010 dollars), primarily because of strong markets in 2008 and2010 — the only two years since 1980 in which farmers’ net cash income was higher than in 1969.
Farmers and ranchers earn another $47 million per year of farm-related income — primarily customwork, and rental income (22-year average for 1989-2010). Federal farm support payments are amore important source of net income than commodity production, averaging $82 million per yearfor the region for the same years.
The region's consumers:See also information covering low-income food consumption and food-related health conditions, page 1-2 above.East Michigan region consumers spend $2.0 billion buying food each year, including $1.2 billion forhome use. Most of this food is produced outside the region, so East Michigan consumers spendabout $1.8 billion per year buying food sourced far away. Only $5.7 million of food products (0.4%of farm cash receipts and 0.3% of the region’s consumer market) are sold by farmers directly toconsumers.
Estimated change in net assets (that is, assets minus liabilities) for all region households combinedwas a loss of $1.76 billion in 2009 alone (BLS). This places additional pressure on East Michiganconsumers trying to buy food.
Farm and food economy summary:Farmers earn $55 million each year producing food commodities, and spend $660 million buyinginputs sourced outside of the region. Even when farmers make money, these input purchases resultin substantial losses to the region as a whole. Overall, farm production creates a loss of $715 millionto the region.OPPORTUNITY
Meanwhile, consumers spend $1.8 billion buying food from outside. Thus, total loss to the region is$2.5 billion of potential wealth each year. This loss amounts to nearly twice the value of all foodcommodities raised in the region.

Highlights of East Michigan Local Farm & Food Economy — Ken Meter, Crossroads Resource Center, 2012
— 20 —
East Michigan region: markets for food eaten at home (2009):East Michigan region residents purchase $2.0 billion of food each year, including $1.2 billion to eatat home. Home purchases break down in the following way:
millionsMeats, poultry, fish, and eggs $ 248Fruits & vegetables 200Cereals and bakery products 166Dairy products 136“Other,” incl. Sweets, fats, & oils 447
If East Michigan region residents purchased $5.00 of food each week directly from farmers in theregion, this would generate $203 million of new farm income for East Michigan farmers.
Arenac County: markets for food eaten at home (2009):Arenac County residents purchase $40 million of food each year, including $24 million to eat athome. Home purchases break down in the following way:
millionsMeats, poultry, fish, and eggs $ 5.0Fruits & vegetables 4.1Cereals and bakery products 3.4Dairy products 2.8“Other,” incl. Sweets, fats, & oils 9.1
Bay County: markets for food eaten at home (2009):Bay County residents purchase $271 million of food each year, including $165 million to eat athome. Home purchases break down in the following way:
millionsMeats, poultry, fish, and eggs $ 34.2Fruits & vegetables 27.6Cereals and bakery products 22.9Dairy products 18.8“Other,” incl. Sweets, fats, & oils 61.7
Clare County: markets for food eaten at home (2009):Clare County residents purchase $78 million of food each year, including $48 million to eat at home.Home purchases break down in the following way:
millionsMeats, poultry, fish, and eggs $ 9.8Fruits & vegetables 8.0Cereals and bakery products 6.6Dairy products 5.4“Other,” incl. Sweets, fats, & oils 17.8

Highlights of East Michigan Local Farm & Food Economy — Ken Meter, Crossroads Resource Center, 2012
— 21 —
Gladwin County: markets for food eaten at home (2009):Gladwin County residents purchase $65 million of food each year, including $39 million to eat athome. Home purchases break down in the following way:
millionsMeats, poultry, fish, and eggs $ 8.2Fruits & vegetables 6.6Cereals and bakery products 5.5Dairy products 4.5“Other,” incl. Sweets, fats, & oils 14.7
Gratiot County: markets for food eaten at home (2009):Gratiot County residents purchase $107 million of food each year, including $65 million to eat athome. Home purchases break down in the following way:
millionsMeats, poultry, fish, and eggs $13.5Fruits & vegetables 10.9Cereals and bakery products 9.0Dairy products 7.4“Other,” incl. Sweets, fats, & oils 24.3
Huron County: markets for food eaten at home (2009):Huron County residents purchase $83 million of food each year, including $51 million to eat athome. Home purchases break down in the following way:
millionsMeats, poultry, fish, and eggs $ 10.5Fruits & vegetables 8.5Cereals and bakery products 7.0Dairy products 5.8“Other,” incl. Sweets, fats, & oils 18.9
Iosco County: markets for food eaten at home (2009):Iosco County residents purchase $65 million of food each year, including $40 million to eat at home.Home purchases break down in the following way:
millionsMeats, poultry, fish, and eggs $ 8.2Fruits & vegetables 6.6Cereals and bakery products 5.5Dairy products 4.5“Other,” incl. Sweets, fats, & oils 14.8

Highlights of East Michigan Local Farm & Food Economy — Ken Meter, Crossroads Resource Center, 2012
— 22 —
Isabella County: markets for food eaten at home (2009):Isabella County residents purchase $177 million of food each year, including $108 million to eat athome. Home purchases break down in the following way:
millionsMeats, poultry, fish, and eggs $ 22.3Fruits & vegetables 18.0Cereals and bakery products 14.9Dairy products 12.3“Other,” incl. Sweets, fats, & oils 40.3
Midland County: markets for food eaten at home (2009):Midland County residents purchase $210 million of food each year, including $128 million to eat athome. Home purchases break down in the following way:
millionsMeats, poultry, fish, and eggs $ 26.6Fruits & vegetables 21.5Cereals and bakery products 17.8Dairy products 14.6“Other,” incl. Sweets, fats, & oils 47.9
Ogemaw County: markets for food eaten at home (2009):Ogemaw County residents purchase $54 million of food each year, including $33 million to eat athome. Home purchases break down in the following way:
millionsMeats, poultry, fish, and eggs $ 6.9Fruits & vegetables 5.6Cereals and bakery products 4.6Dairy products 3.8“Other,” incl. Sweets, fats, & oils 12.4
Roscommon County: markets for food eaten at home (2009):Roscommon County residents purchase $62 million of food each year, including $38 million to eatat home. Home purchases break down in the following way:
millionsMeats, poultry, fish, and eggs $ 7.8Fruits & vegetables 6.3Cereals and bakery products 5.2Dairy products 4.3“Other,” incl. Sweets, fats, & oils 14.0

Highlights of East Michigan Local Farm & Food Economy — Ken Meter, Crossroads Resource Center, 2012
— 23 —
Saginaw County: markets for food eaten at home (2009):Saginaw County residents purchase $502 million of food each year, including $307 million to eat athome. Home purchases break down in the following way:
millionsMeats, poultry, fish, and eggs $ 63.5Fruits & vegetables 51.3Cereals and bakery products 42.5Dairy products 34.9“Other,” incl. Sweets, fats, & oils 114.6
Sanilac County: markets for food eaten at home (2009):Sanilac County residents purchase $108 million of food each year, including $66 million to eat athome. Home purchases break down in the following way:
millionsMeats, poultry, fish, and eggs $ 13.7Fruits & vegetables 11.0Cereals and bakery products 9.1Dairy products 7.5“Other,” incl. Sweets, fats, & oils 24.7
Tuscola County: markets for food eaten at home (2009):Tuscola County residents purchase $140 million of food each year, including $85 million to eat athome. Home purchases break down in the following way:
millionsMeats, poultry, fish, and eggs $ 17.7Fruits & vegetables 14.3Cereals and bakery products 11.8Dairy products 9.7“Other,” incl. Sweets, fats, & oils 31.9
Michigan: markets for food eaten at home (2009):Michigan residents purchase $24.8 billion of food each year, including $15.1 billion to eat at home.Home purchases break down in the following way:
millionsMeats, poultry, fish, and eggs $ 3,136Fruits & vegetables 2,535Cereals and bakery products 2,099Dairy products 1,724“Other,” incl. Sweets, fats, & oils 5,659

Highlights of East Michigan Local Farm & Food Economy — Ken Meter, Crossroads Resource Center, 2012
— 24 —
Food purchasesISD ISD Dist. by East Michigan Schools, 2011No. Name Code District Name Purchases
09 Bay-Arenac ISD $ 3,100,549.7706010 Arenac Eastern School District 76,520.5706020 Au Gres-Sims School District 100,376.5206050 Standish-Sterling Community Schools 429,458.5309010 Bay City School District 1,401,001.6809030 Bangor Township Schools 500,796.0109050 Essexville-Hampton Public Schools 253,343.3009090 Pinconning Area Schools 226,163.9609902 Bay County PSA 112,889.20
18 Clare-Gladwin Regional Education Service District $ 1,570,571.8818000 Clare-Gladwin Regional Education Svc. Dist. 2,670.5518010 Clare Public Schools 34,808.9318020 Farwell Area Schools 348,568.1718060 Harrison Community Schools 435,328.5826010 Beaverton Rural Schools 328,521.7026040 Gladwin Community Schools 394,427.9526901 Creative Learning Academy 26,246.00
29 Gratiot-Isabella RESD $ 1,216,817.7029010 Alma Public Schools 527,486.3229020 Ashley Community Schools 70,164.2129040 Breckenridge Community Schools 140,554.8529050 Fulton Schools 145,459.9829060 Ithaca Public Schools 302,968.2129100 St. Louis Public Schools 30,184.13

Highlights of East Michigan Local Farm & Food Economy — Ken Meter, Crossroads Resource Center, 2012
— 25 —
Food purchasesISD ISD Dist. by East Michigan Schools, 2011No. Name Code District Name Purchases
32 Huron ISD $ 1,011,984.7632010 Bad Axe Public Schools 233,863.9532030 Caseville Public Schools 52,834.6932050 Elkton-Pigeon-Bay Port Laker Schools 230,983.1532060 Harbor Beach Community Schools 154,862.8932080 North Huron School District 91,982.5932090 Owendale-Gagetown Area School District 60,067.3732130 Port Hope Community Schools 22,988.8932170 Ubly Community Schools 164,401.23
35 Iosco RESA $ 991,888.8735010 Oscoda Area Schools 300,199.2535020 Hale Area Schools 133,890.3335030 Tawas Area Schools 235,626.9535040 Whittemore-Prescott Area Schools 306,214.3435901 Sunrise Education Center 15,958.00
29 Gratiot-Isabella RESD $ 1,204,886.7937010 Mt. Pleasant City School District 582,955.8237040 Beal City Public Schools 142,225.7237060 Shepherd Public Schools 360,044.7937901 Renaissance Public School Academy 87,968.3037902 Morey Public School Academy 31,692.16
56 Midland County Educational Service Agency $ 1,478,246.5956010 Midland Public Schools 832,028.4256020 Bullock Creek School District 379,191.2556030 Coleman Community Schools 21,688.8256050 Meridian Public Schools 201,724.9056901 Windover High School 29,182.0056903 Academic and Career Education Academy 14,431.20
72 C.O.O.R. ISD $ 1,230,628.3165045 West Branch-Rose City Area Schools 541,999.5772010 Roscommon Area Public Schools 356,081.3072020 Houghton Lake Community Schools 332,547.44

Highlights of East Michigan Local Farm & Food Economy — Ken Meter, Crossroads Resource Center, 2012
— 26 —
Food purchasesISD ISD Dist. by East Michigan Schools, 2011No. Name Code District Name Purchases
73 Saginaw ISD $ 5,998,923.0673000 Saginaw ISD 60,869.7373010 Saginaw, School District of the City of 1,718,538.3173030 Carrollton Public Schools 485,926.0473040 Saginaw Township Community Schools 1,210,466.6073080 Buena Vista School District 145,823.2273110 Chesaning Union Schools 271,023.1973170 Birch Run Area Schools 332,545.5873180 Bridgeport-Spaulding Community School Dist. 309,248.4873190 Frankenmuth School District 250,406.4773200 Freeland Community School District 297,514.7373210 Hemlock Public School District 153,315.2873230 Merrill Community Schools 200,883.5973240 St. Charles Community Schools 198,235.8073908 Saginaw Preparatory Academy 95,072.6473909 Francis Reh PSA 122,295.3873910 North Saginaw Charter Academy 32,281.0073912 International Academy of Saginaw 114,477.02
76 Sanilac ISD $ 1,712,876.3476000 Sanilac ISD 11,086.8276060 Brown City Community Schools 280,097.3176070 Carsonville-Port Sanilac School District 146,141.5376080 Croswell-Lexington Community Schools 468,104.3776090 Deckerville Community School District 172,526.5576140 Marlette Community Schools 248,509.6176180 Peck Community School District 104,910.7176210 Sandusky Community School District 281,499.44

Highlights of East Michigan Local Farm & Food Economy — Ken Meter, Crossroads Resource Center, 2012
— 27 —
Food purchasesISD ISD Dist. by East Michigan Schools, 2011No. Name Code District Name Purchases
79 Tuscola ISD $ 1,818,867.8179000 Tuscola ISD 48,917.5179010 Akron-Fairgrove Schools 64,504.2279020 Caro Community Schools 357,050.2179030 Cass City Public Schools 287,267.0979080 Kingston Community School District 145,845.8879090 Mayville Community School District 153,427.8579100 Millington Community Schools 303,582.9779110 Reese Public Schools 24,964.0079145 Unionville-Sebewaing Area S.D. 160,167.0579150 Vassar Public Schools 273,141.03
Total $ 21,336,241.88
Summary of school food purchases by all 85 school districts in East Michigan
Type of purchase Code AmountUncoded 000 $ 1,405,715.70USDA Commodities 781 2,770,599.08USDA Bonus Comm. 782 109,869.87National School Breakfast 850 4,348,891.09National School Lunch (NSL) 851 12,496,912.92NSL Special Milk 852 6,987.46Child Care Food Program 853 18,549.34CNP Fruit/Veg Pilot 856 68,698.82Summer Food Service 858 72,412.85NSL After School Snack 861 35,350.94School Lunch 310 1,505.17School Breakfast 311 748.64
Note: The above data was provided by the Michigan Department of Education, and compiled by Ken Meter ofCrossroads Resource Center for this report.

Highlights of East Michigan Local Farm & Food Economy — Ken Meter, Crossroads Resource Center, 2012
— 28 —
29 Census Tracts Identified as “Food Deserts” by USDA
County Census Tract Type PopulationBay 26017280100 Urban 515Bay 26017280200 Urban 1,172Bay 26017280300 Urban 1,503Bay 26017280400 Urban 3,191Bay 26017280900 Urban 3,202Bay 26017281000 Urban 4,363Bay 26017281100 Urban 1,075Bay 26017281200 Urban 4,339Bay 26017281300 Urban 3,375Gratiot 26057990300 Urban 7,487Gratiot 26057990400 Urban 5,866Huron 26063950100 Rural 1,564Huron 26063950200 Rural 2,453Huron 26063950300 Rural 2,639Huron 26063951200 Rural 4,472Iosco 26069990100 Urban 2,374Iosco 26069990900 Urban 3,411Iosco 26069991100 Rural 2,856Isabella 26073950500 Urban 2,790Midland 26111290100 Urban 3,997Roscommon 26143970200 Urban 1,972Roscommon 26143970900 Urban 2,126Saginaw 26145000200 Urban 1,639Saginaw 26145001100 Urban 3,855Saginaw 26145001300 Urban 3,299Saginaw 26145010800 Urban 2,863Saginaw 26145011000 Urban 7,001Saginaw 26145011500 Urban 3,107Sanilac 26151970200 Rural 2,685
Total 91,191
Note: Some residents of so-called “food deserts” dislike the use of this term.
A map of these “food deserts” can be found at:http://www.ers.usda.gov/data-products/food-desert-locator/go-to-the-locator.aspx

Highlights of East Michigan Local Farm & Food Economy — Ken Meter, Crossroads Resource Center, 2012
— 29 —
Acknowledgement
Thanks to the members of the Advisory Committee who guided the compilation of this report:
• Anamika Laad—East Michigan Council of Governments• Carl Osentoski—Huron-Sanilac County• Hal Hudson—Thumb Area Farmer/Educator• Joseph Sancimino—Arenac County• Julia Darnton, MSU Extension—Saginaw• Lyn Grim—Clare County• Rosalie Myers—Roscommon County• Stephen Erickson—Tuscola County• Zygmunt Dworzecki—Tuscola County
Highlights of East Michigan Local Farm & Food Economy — Ken Meter, Crossroads Resource Center, 2012
— 30 —
Key data sources:
Bureau of Economic Analysis data on farm production balancehttp://www.bea.doc.gov/bea/regional/reis/
Food consumption estimates from Bureau of Labor Statistics Consumer Expenditure Surveyhttp://www.bls.gov/cex/home.htm
U.S. Census of Agriculturehttp://www.nass.usda.gov/census/
USDA/Economic Research Service food consumption data:http://www.ers.usda.gov/data/foodconsumption/
USDA/ Economic Research Service farm income data:http://ers.usda.gov/Data/FarmIncome/finfidmu.htm
For more information:
To see results from Finding Food in Farm Country studies in other regions of the U.S.:http://www.crcworks.org/?submit=fffc
To read the original Finding Food in Farm Country study from Southeast Minnesota (written for theExperiment in Rural Cooperation): http://www.crcworks.org/ff.pdf
To view a PowerPoint presented in March, 2008, by Ken Meter at Rep. Collin Peterson’s (D-MN)Minnesota agricultural forum, called the “Home Grown Economy”:http://www.crcworks.org/crcppts/petersonkm08.pdf
For further information: http://www.crcworks.org/
Contact Ken Meter at Crossroads Resource Center<[email protected]>
(612) 869-8664