crossvit: enhancing canopy monitoring management practices
TRANSCRIPT
Sensors 2013, 13, 7652-7667; doi:10.3390/s130607652
sensors ISSN 1424-8220
www.mdpi.com/journal/sensors
Article
CrossVit: Enhancing Canopy Monitoring Management
Practices in Viticulture
Alessandro Matese 1,2,
*, Francesco Primo Vaccari 1, Diego Tomasi
3,
Salvatore Filippo Di Gennaro 1, Jacopo Primicerio
1,2, Francesco Sabatini
1 and Silvia Guidoni
2
1 Istituto di Biometeorologia (CNR-IBIMET), Consiglio Nazionale delle Ricerche, Via G. Caproni 8,
Firenze 50145, Italy; E-Mails: [email protected] (F.P.V.);
[email protected] (S.F.D.G.); [email protected] (J.P.);
[email protected] (F.S.) 2
Dipartimento Scienze Agrarie, Forestali e Alimentari, Università di Torino, Via Leonardo da Vinci 44,
Grugliasco (TO) 10095, Italy; E-Mail: [email protected] 3
Centro di Ricerca per la Viticoltura, Consiglio per la Ricerca e la Sperimentazione in Agricoltura,
Conegliano (TV) 31015, Italy; E-Mail: [email protected]
* Author to whom correspondence should be addressed; E-Mail: [email protected];
Tel.: +390-553-033-711; Fax: +390-553-089-10.
Received: 3 May 2013; in revised form: 5 June 2013 / Accepted: 6 June 2013 /
Published: 13 June 2013
Abstract: A new wireless sensor network (WSN), called CrossVit, and based on MEMSIC
products, has been tested for two growing seasons in two vineyards in Italy. The aims are
to evaluate the monitoring performances of the new WSN directly in the vineyard and
collect air temperature, air humidity and solar radiation data to support vineyard
management practices. The WSN consists of various levels: the Master/Gateway level
coordinates the WSN and performs data aggregation; the Farm/Server level takes care of
storing data on a server, data processing and graphic rendering; Nodes level is based on a
network of peripheral nodes consisting of a MDA300 sensor board and Iris module and
equipped with thermistors for air temperature, photodiodes for global and diffuse solar
radiation, and an HTM2500LF sensor for relative humidity. The communication levels are:
WSN links between gateways and sensor nodes by ZigBee, and long-range GSM/GPRS
links between gateways and the server farm level. The system was able to monitor the
agrometeorological parameters in the vineyard: solar radiation, air temperature and air
humidity, detecting the differences between the canopy treatments applied. The
performance of CrossVit, in terms of monitoring and reliability of the system, have been
OPEN ACCESS
brought to you by COREView metadata, citation and similar papers at core.ac.uk
provided by Institutional Research Information System University of Turin

Sensors 2013, 13 7653
evaluated considering: its handiness, cost-effective, non-invasive dimensions and low
power consumption.
Keywords: wireless sensor network; canopy microclimate; ZigBee; viticulture
1. Introduction
Modern viticulture is one of the most promising agricultural sectors where new technologies might
be implemented (i.e., disease control, canopy management) to ensure high quality wine production,
low management costs and good yield, to cope with the recent crisis in the sector. The International
Organisation of Vine and Wine has recently published its report of the global economic situation of the
viticulture and wine market in 2011, stating that the world vineyard area has decreased by 7.8 Mha
(thousands of hectares). In the European Union the reduction in vineyard area could be between 50 and
55 Mha, with the largest reductions in Greece, Italy and Portugal. Quality is a critical factor for the
success of wine and therefore strict control of the wine production process is of utmost importance [1].
Precision viticulture aims to maximize the oenological potential of vineyards. This is especially true
in regions where the high quality standards of the wine production justify the adoption of site-specific
management practices to simultaneously increase both quality and yield [2]. Furthermore, the
site-specific management practices, which are becoming increasingly common, are also oriented
towards a sustainable viticulture in which the growers and winemakers have begun to evaluate the
impact of their management practices on the environment both for its preservation (i.e., save water)
and to characterize their product on the wine market [3].
Besides the prestige wines from historically suited environments, quality products can be obtained
in Italy in sites appropriate for a modern and economically sustainable viticulture, such as the Veneto
Piave CDO area. In these situations, mechanized vine management systems can support the
competitiveness of wines able to satisfy a broad-based demand.
New Wireless Sensor Network (WSN) technologies can be useful and efficient to provide remote
and real-time monitoring of variables involved in the grape and wine production system. In a broad
sense a WSN is composed of various sensor modules connected to a node with radio modules that
transmit the data from nodes to a base station where the data are stored.
A WSN integrates sensors, wireless communications, embedded computing, micro-electromechanical
systems, microelectronics and other technologies; it can monitor parameters in real-time, sense and
gather information from environments or objects, process the data and transmit the required
information to the users.
The agricultural sector does not make sufficient use of technology and informatics to support
production practices. Although progress has being made with regard to the deployment of sensors,
WSN, actuators and other electromechanical devices in agricultural settings, there are still important
areas of development that have not been sufficiently explored.
Embedded systems and wireless technologies can, in the long run, reduce costs and increase profits
in countries with favorable year-round climates that permit multiple harvests but which lack other
essentials required to maximize their potential [4].
Sensors 2013, 13 7654
The application of a WSN in viticulture might respond to the actual needs, although a complete cost
and performance analysis of these networks is fundamental to fully understand their application
potential. Indeed, the dimensions of a single sensor node may vary from the size of a shoebox to a
microscopically small particle, while the cost of a single device may vary from hundreds of euros
(for networks of very few but powerful nodes) to a few cents (for large-scale networks made up of
very simple nodes) [5].
In the last years many system deployments and WSN architectures have been proposed and
published in the scientific literature with different potential characteristics, especially with regard to
precision farming applications, where energy efficiency, transmission performance as well as the
effectiveness of the application have shown that these tools could make a contribution not only to
research but also for the food industry. A comprehensive review on the state of the art of WSNs in
agriculture and the food industry was written by Ruiz-Garcia et al. [6]. With regard to applications in
viticulture, Burrell et al. [7] described WSN applications and configurations that can address different
priorities in the vineyard, and Beckwith et al. [8] implemented a WSN consisting of 65 motes that
collected temperature measurements in a vineyard over one month. Some of these applications focused
on integration of WSN for video-surveillance. Lloret et al. [9] showed that, in the agriculture context,
wireless technologies such as Wi-Fi and Bluetooth penalize energy consumption, becoming a major
drawback when transmitting the images or video sequences required by an identification system. A
video-surveillance platform called Integrated WSN Solution for Precision Agriculture was described
and proposed by Garcia-Sanchez et al. [10] to detect and identify intruders as well as to oversee the
production process. Very interesting studies have been conducted by the Portuguese CITAB and
UTAD institutes. Researchers have shown the feasibility of a ZigBee-based WSN powered by batteries
that can be recharged with green energy from three sources (solar power, wind power and hydro
power) [11]. In addition, Peres et al. [12] developed the Intelligent Precision Agriculture Gateway
(iPAGAT), designed to provide the necessary middleware between locally deployed sensor networks
and a remote location within the whole-farm concept. This solar-powered infrastructure runs an
aggregation engine that supplies a local database with environmental data gathered by a locally
deployed ZigBee wireless sensor network. Finally, Nadimi et al. [13] have developed a WSN system
with the same hardware described in our paper, although with totally different objectives.
This paper introduces a new WSN, called CrossVit, based on MEMSIC products and tested for two
years in a vineyard in Northern Italy. The aims are to: (i) evaluate the monitoring performances of the
new WSN directly in the vineyard; (ii) collect air temperature, air humidity and solar radiation data to
support vineyard management, disease control and water management practices; (iii) compare vine
canopy microclimate related to different training and trellis systems (i.e., upwards or downwards shoot
position) or canopy management practices (i.e., leaf removal, shoot pruning, etc.).
2. Experimental Section
2.1. System Deployment and Architecture
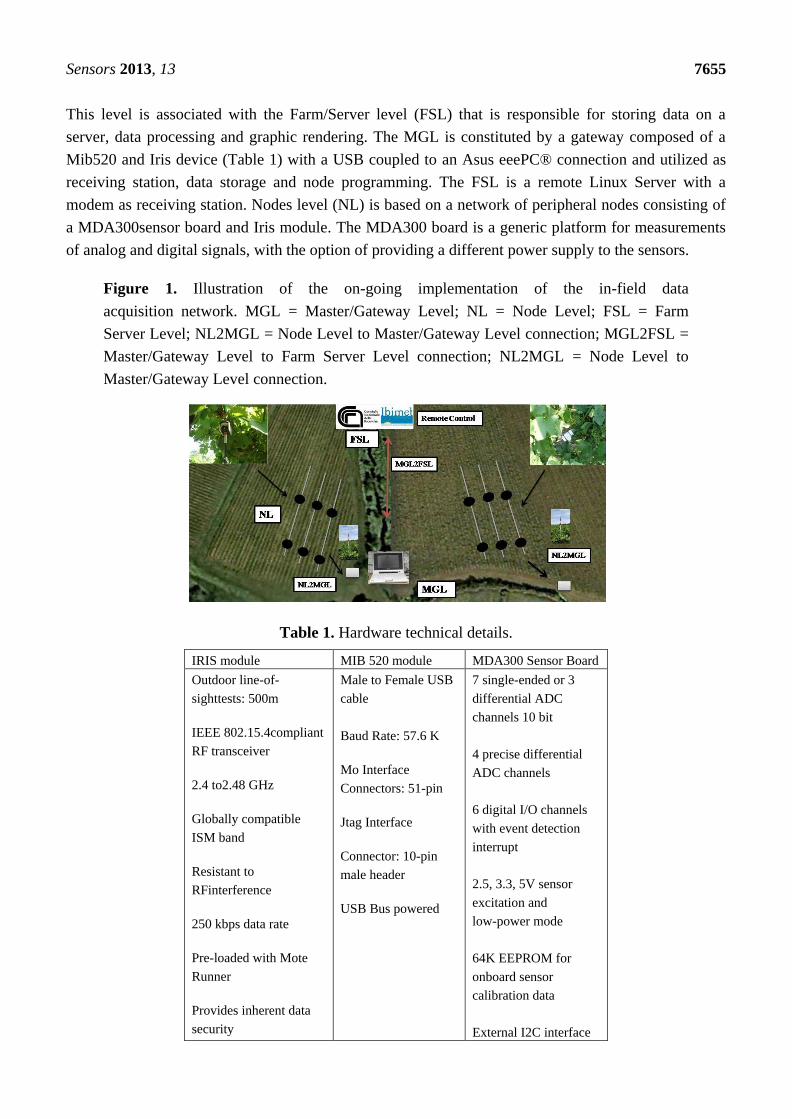
The WSN system proposed is based on MEMSIC Technology devices and consists of three levels
(Figure 1). The Master/Gateway level (MGL) coordinates the WSN and performs data aggregation.
Sensors 2013, 13 7655
This level is associated with the Farm/Server level (FSL) that is responsible for storing data on a
server, data processing and graphic rendering. The MGL is constituted by a gateway composed of a
Mib520 and Iris device (Table 1) with a USB coupled to an Asus eeePC® connection and utilized as
receiving station, data storage and node programming. The FSL is a remote Linux Server with a
modem as receiving station. Nodes level (NL) is based on a network of peripheral nodes consisting of
a MDA300sensor board and Iris module. The MDA300 board is a generic platform for measurements
of analog and digital signals, with the option of providing a different power supply to the sensors.
Figure 1. Illustration of the on-going implementation of the in-field data
acquisition network. MGL = Master/Gateway Level; NL = Node Level; FSL = Farm
Server Level; NL2MGL = Node Level to Master/Gateway Level connection; MGL2FSL =
Master/Gateway Level to Farm Server Level connection; NL2MGL = Node Level to
Master/Gateway Level connection.
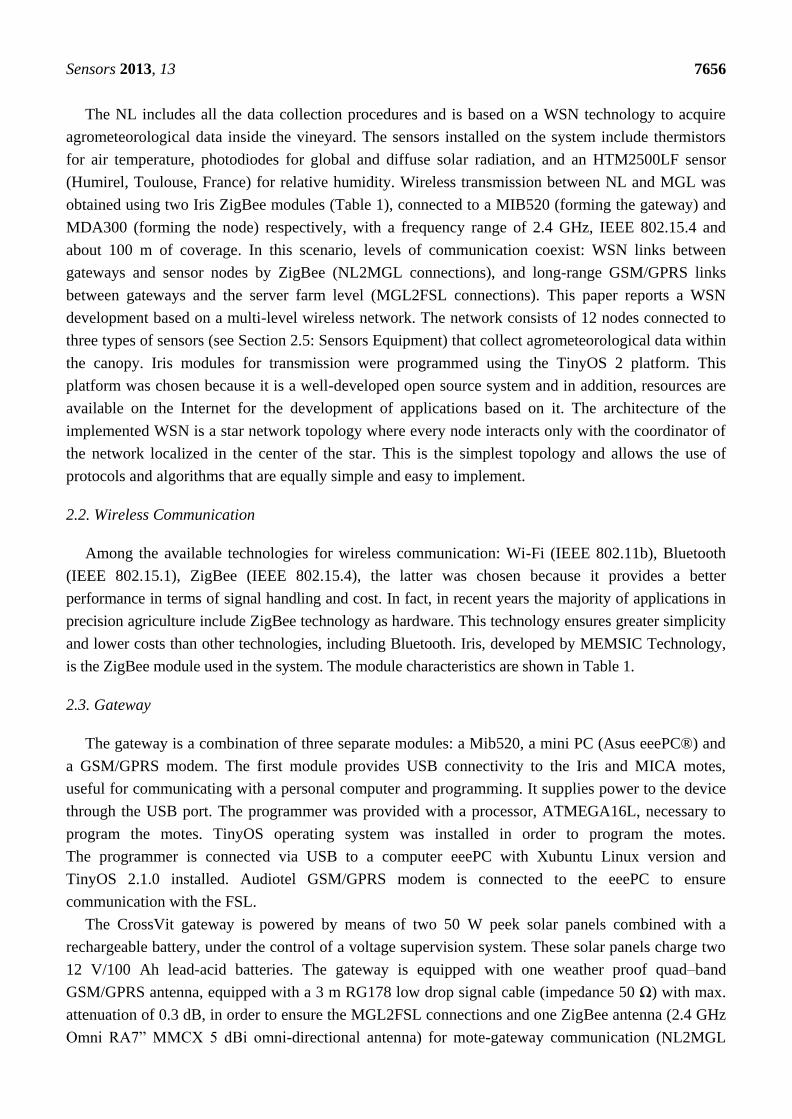
Table 1. Hardware technical details.
IRIS module MIB 520 module MDA300 Sensor Board
Outdoor line-of-
sighttests: 500m
IEEE 802.15.4compliant
RF transceiver
2.4 to2.48 GHz
Globally compatible
ISM band
Resistant to
RFinterference
250 kbps data rate
Pre-loaded with Mote
Runner
Provides inherent data
security
Male to Female USB
cable
Baud Rate: 57.6 K
Mo Interface
Connectors: 51-pin
Jtag Interface
Connector: 10-pin
male header
USB Bus powered
7 single-ended or 3
differential ADC
channels 10 bit
4 precise differential
ADC channels
6 digital I/O channels
with event detection
interrupt
2.5, 3.3, 5V sensor
excitation and
low-power mode
64K EEPROM for
onboard sensor
calibration data
External I2C interface
Sensors 2013, 13 7656
The NL includes all the data collection procedures and is based on a WSN technology to acquire
agrometeorological data inside the vineyard. The sensors installed on the system include thermistors
for air temperature, photodiodes for global and diffuse solar radiation, and an HTM2500LF sensor
(Humirel, Toulouse, France) for relative humidity. Wireless transmission between NL and MGL was
obtained using two Iris ZigBee modules (Table 1), connected to a MIB520 (forming the gateway) and
MDA300 (forming the node) respectively, with a frequency range of 2.4 GHz, IEEE 802.15.4 and
about 100 m of coverage. In this scenario, levels of communication coexist: WSN links between
gateways and sensor nodes by ZigBee (NL2MGL connections), and long-range GSM/GPRS links
between gateways and the server farm level (MGL2FSL connections). This paper reports a WSN
development based on a multi-level wireless network. The network consists of 12 nodes connected to
three types of sensors (see Section 2.5: Sensors Equipment) that collect agrometeorological data within
the canopy. Iris modules for transmission were programmed using the TinyOS 2 platform. This
platform was chosen because it is a well-developed open source system and in addition, resources are
available on the Internet for the development of applications based on it. The architecture of the
implemented WSN is a star network topology where every node interacts only with the coordinator of
the network localized in the center of the star. This is the simplest topology and allows the use of
protocols and algorithms that are equally simple and easy to implement.
2.2. Wireless Communication
Among the available technologies for wireless communication: Wi-Fi (IEEE 802.11b), Bluetooth
(IEEE 802.15.1), ZigBee (IEEE 802.15.4), the latter was chosen because it provides a better
performance in terms of signal handling and cost. In fact, in recent years the majority of applications in
precision agriculture include ZigBee technology as hardware. This technology ensures greater simplicity
and lower costs than other technologies, including Bluetooth. Iris, developed by MEMSIC Technology,
is the ZigBee module used in the system. The module characteristics are shown in Table 1.
2.3. Gateway
The gateway is a combination of three separate modules: a Mib520, a mini PC (Asus eeePC®) and
a GSM/GPRS modem. The first module provides USB connectivity to the Iris and MICA motes,
useful for communicating with a personal computer and programming. It supplies power to the device
through the USB port. The programmer was provided with a processor, ATMEGA16L, necessary to
program the motes. TinyOS operating system was installed in order to program the motes.
The programmer is connected via USB to a computer eeePC with Xubuntu Linux version and
TinyOS 2.1.0 installed. Audiotel GSM/GPRS modem is connected to the eeePC to ensure
communication with the FSL.
The CrossVit gateway is powered by means of two 50 W peek solar panels combined with a
rechargeable battery, under the control of a voltage supervision system. These solar panels charge two
12 V/100 Ah lead-acid batteries. The gateway is equipped with one weather proof quad–band
GSM/GPRS antenna, equipped with a 3 m RG178 low drop signal cable (impedance 50 Ω) with max.
attenuation of 0.3 dB, in order to ensure the MGL2FSL connections and one ZigBee antenna (2.4 GHz
Omni RA7” MMCX 5 dBi omni-directional antenna) for mote-gateway communication (NL2MGL
Sensors 2013, 13 7657
connections) placed on a 3 m high post. The RJ-178B cable has a SMA male connector (antenna) and a
male MMCX connector (mote).
2.4. Node
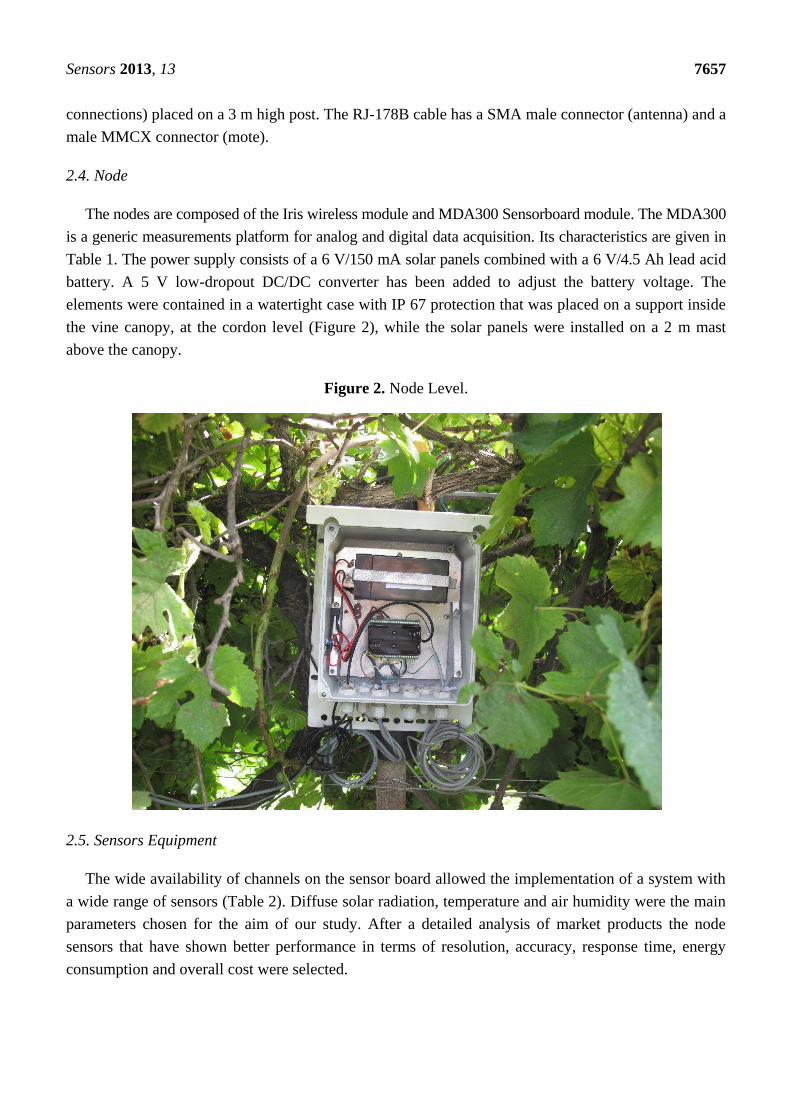
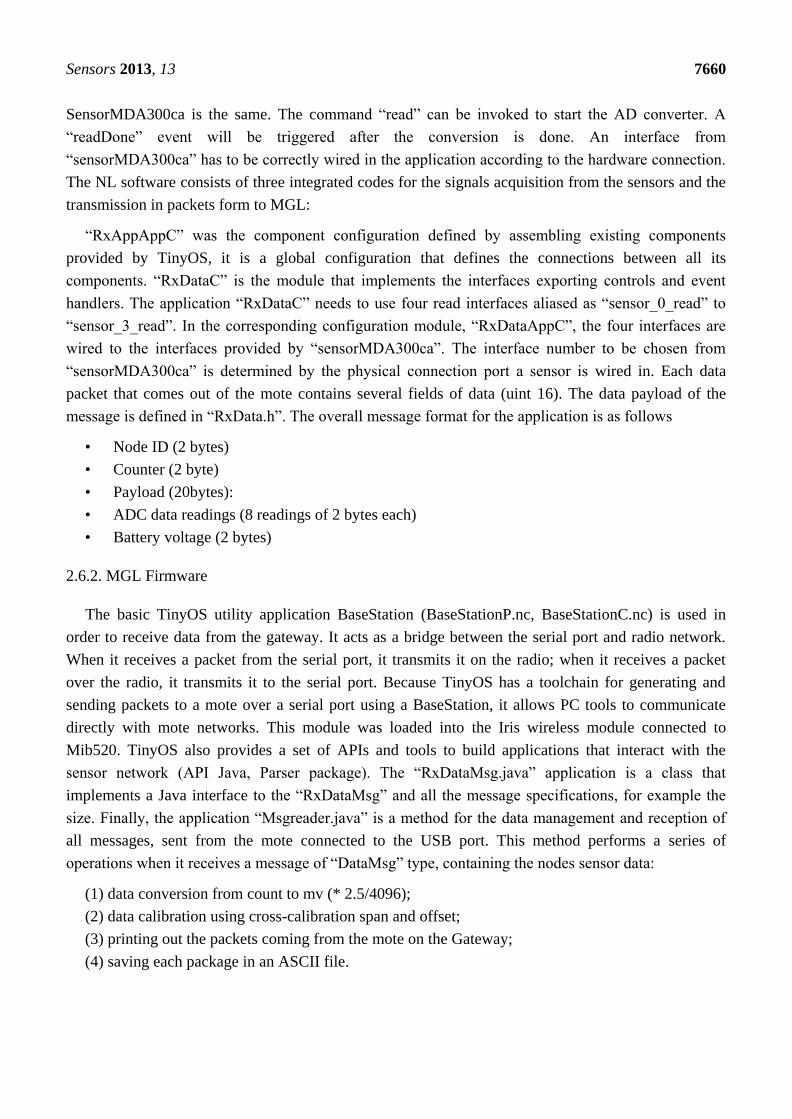
The nodes are composed of the Iris wireless module and MDA300 Sensorboard module. The MDA300
is a generic measurements platform for analog and digital data acquisition. Its characteristics are given in
Table 1. The power supply consists of a 6 V/150 mA solar panels combined with a 6 V/4.5 Ah lead acid
battery. A 5 V low-dropout DC/DC converter has been added to adjust the battery voltage. The
elements were contained in a watertight case with IP 67 protection that was placed on a support inside
the vine canopy, at the cordon level (Figure 2), while the solar panels were installed on a 2 m mast
above the canopy.
Figure 2. Node Level.
2.5. Sensors Equipment
The wide availability of channels on the sensor board allowed the implementation of a system with
a wide range of sensors (Table 2). Diffuse solar radiation, temperature and air humidity were the main
parameters chosen for the aim of our study. After a detailed analysis of market products the node
sensors that have shown better performance in terms of resolution, accuracy, response time, energy
consumption and overall cost were selected.
Sensors 2013, 13 7658
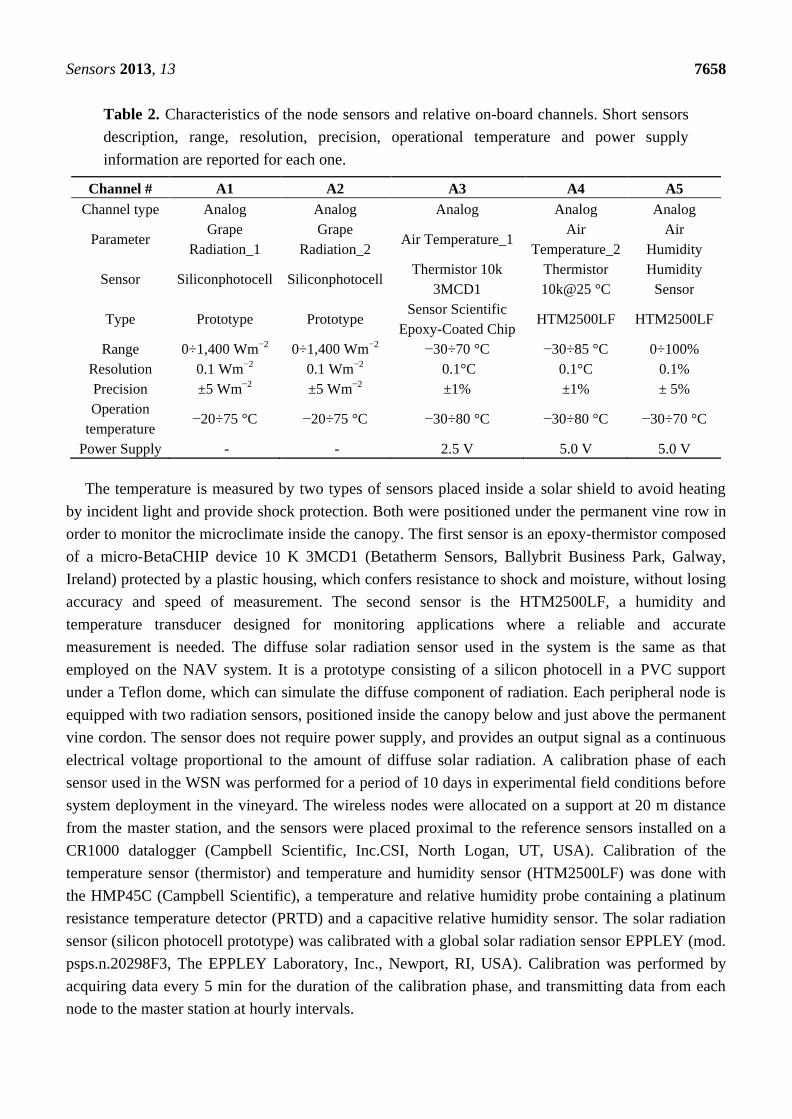
Table 2. Characteristics of the node sensors and relative on-board channels. Short sensors
description, range, resolution, precision, operational temperature and power supply
information are reported for each one.
Channel # A1 A2 A3 A4 A5
Channel type Analog Analog Analog Analog Analog
Parameter Grape
Radiation_1
Grape
Radiation_2 Air Temperature_1
Air
Temperature_2
Air
Humidity
Sensor Siliconphotocell Siliconphotocell Thermistor 10k
3MCD1
Thermistor
10k@25 °C
Humidity
Sensor
Type Prototype Prototype Sensor Scientific
Epoxy-Coated Chip HTM2500LF HTM2500LF
Range 0÷1,400 Wm−2 0÷1,400 Wm−2 −30÷70 °C −30÷85 °C 0÷100%
Resolution 0.1 Wm−2 0.1 Wm−2 0.1°C 0.1°C 0.1%
Precision ±5 Wm−2 ±5 Wm−2 ±1% ±1% ± 5%
Operation
temperature −20÷75 °C −20÷75 °C −30÷80 °C −30÷80 °C −30÷70 °C
Power Supply - - 2.5 V 5.0 V 5.0 V
The temperature is measured by two types of sensors placed inside a solar shield to avoid heating
by incident light and provide shock protection. Both were positioned under the permanent vine row in
order to monitor the microclimate inside the canopy. The first sensor is an epoxy-thermistor composed
of a micro-BetaCHIP device 10 K 3MCD1 (Betatherm Sensors, Ballybrit Business Park, Galway,
Ireland) protected by a plastic housing, which confers resistance to shock and moisture, without losing
accuracy and speed of measurement. The second sensor is the HTM2500LF, a humidity and
temperature transducer designed for monitoring applications where a reliable and accurate
measurement is needed. The diffuse solar radiation sensor used in the system is the same as that
employed on the NAV system. It is a prototype consisting of a silicon photocell in a PVC support
under a Teflon dome, which can simulate the diffuse component of radiation. Each peripheral node is
equipped with two radiation sensors, positioned inside the canopy below and just above the permanent
vine cordon. The sensor does not require power supply, and provides an output signal as a continuous
electrical voltage proportional to the amount of diffuse solar radiation. A calibration phase of each
sensor used in the WSN was performed for a period of 10 days in experimental field conditions before
system deployment in the vineyard. The wireless nodes were allocated on a support at 20 m distance
from the master station, and the sensors were placed proximal to the reference sensors installed on a
CR1000 datalogger (Campbell Scientific, Inc.CSI, North Logan, UT, USA). Calibration of the
temperature sensor (thermistor) and temperature and humidity sensor (HTM2500LF) was done with
the HMP45C (Campbell Scientific), a temperature and relative humidity probe containing a platinum
resistance temperature detector (PRTD) and a capacitive relative humidity sensor. The solar radiation
sensor (silicon photocell prototype) was calibrated with a global solar radiation sensor EPPLEY (mod.
psps.n.20298F3, The EPPLEY Laboratory, Inc., Newport, RI, USA). Calibration was performed by
acquiring data every 5 min for the duration of the calibration phase, and transmitting data from each
node to the master station at hourly intervals.
Sensors 2013, 13 7659
2.6. Software Description and Integration
Network management was performed by software based on the TinyOS platform [14]. TinyOS is an
open source operating system based on modules, designed specifically for WSN, developed by the
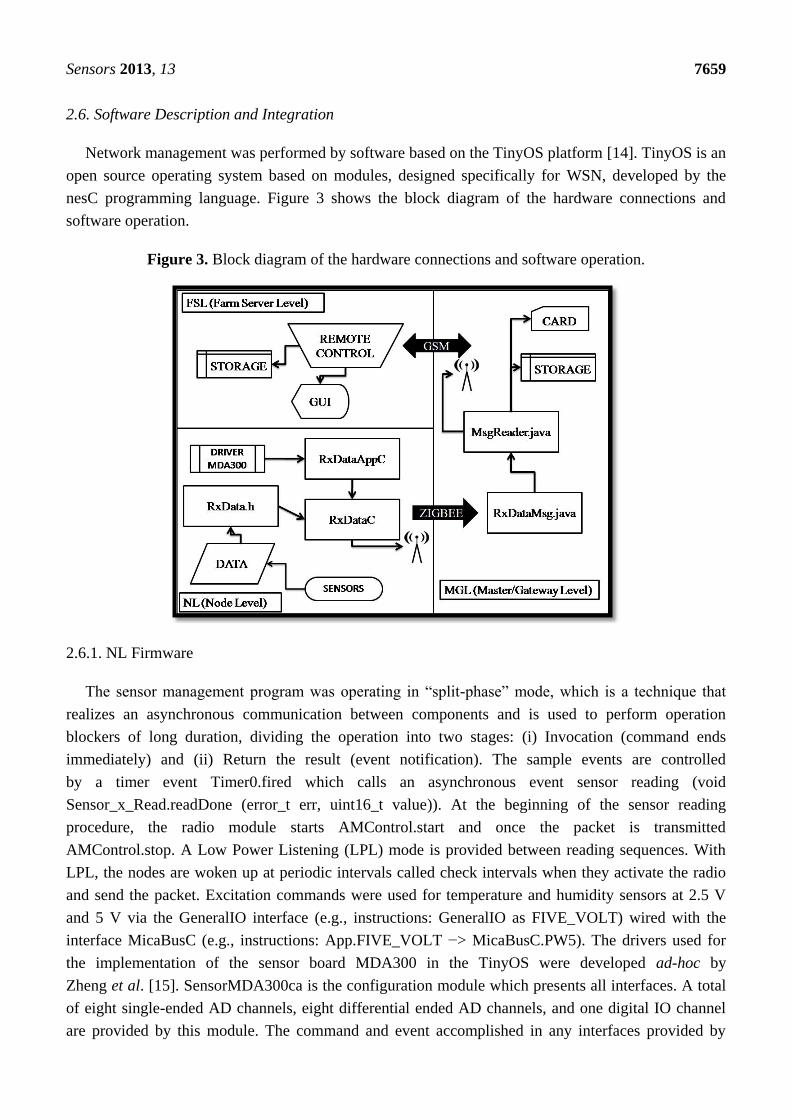
nesC programming language. Figure 3 shows the block diagram of the hardware connections and
software operation.
Figure 3. Block diagram of the hardware connections and software operation.
2.6.1. NL Firmware
The sensor management program was operating in “split-phase” mode, which is a technique that
realizes an asynchronous communication between components and is used to perform operation
blockers of long duration, dividing the operation into two stages: (i) Invocation (command ends
immediately) and (ii) Return the result (event notification). The sample events are controlled
by a timer event Timer0.fired which calls an asynchronous event sensor reading (void
Sensor_x_Read.readDone (error_t err, uint16_t value)). At the beginning of the sensor reading
procedure, the radio module starts AMControl.start and once the packet is transmitted
AMControl.stop. A Low Power Listening (LPL) mode is provided between reading sequences. With
LPL, the nodes are woken up at periodic intervals called check intervals when they activate the radio
and send the packet. Excitation commands were used for temperature and humidity sensors at 2.5 V
and 5 V via the GeneralIO interface (e.g., instructions: GeneralIO as FIVE_VOLT) wired with the
interface MicaBusC (e.g., instructions: App.FIVE_VOLT −> MicaBusC.PW5). The drivers used for
the implementation of the sensor board MDA300 in the TinyOS were developed ad-hoc by
Zheng et al. [15]. SensorMDA300ca is the configuration module which presents all interfaces. A total
of eight single-ended AD channels, eight differential ended AD channels, and one digital IO channel
are provided by this module. The command and event accomplished in any interfaces provided by
Sensors 2013, 13 7660
SensorMDA300ca is the same. The command “read” can be invoked to start the AD converter. A
“readDone” event will be triggered after the conversion is done. An interface from
“sensorMDA300ca” has to be correctly wired in the application according to the hardware connection.
The NL software consists of three integrated codes for the signals acquisition from the sensors and the
transmission in packets form to MGL:
“RxAppAppC” was the component configuration defined by assembling existing components
provided by TinyOS, it is a global configuration that defines the connections between all its
components. “RxDataC” is the module that implements the interfaces exporting controls and event
handlers. The application “RxDataC” needs to use four read interfaces aliased as “sensor_0_read” to
“sensor_3_read”. In the corresponding configuration module, “RxDataAppC”, the four interfaces are
wired to the interfaces provided by “sensorMDA300ca”. The interface number to be chosen from
“sensorMDA300ca” is determined by the physical connection port a sensor is wired in. Each data
packet that comes out of the mote contains several fields of data (uint 16). The data payload of the
message is defined in “RxData.h”. The overall message format for the application is as follows
• Node ID (2 bytes)
• Counter (2 byte)
• Payload (20bytes):
• ADC data readings (8 readings of 2 bytes each)
• Battery voltage (2 bytes)
2.6.2. MGL Firmware
The basic TinyOS utility application BaseStation (BaseStationP.nc, BaseStationC.nc) is used in
order to receive data from the gateway. It acts as a bridge between the serial port and radio network.
When it receives a packet from the serial port, it transmits it on the radio; when it receives a packet
over the radio, it transmits it to the serial port. Because TinyOS has a toolchain for generating and
sending packets to a mote over a serial port using a BaseStation, it allows PC tools to communicate
directly with mote networks. This module was loaded into the Iris wireless module connected to
Mib520. TinyOS also provides a set of APIs and tools to build applications that interact with the
sensor network (API Java, Parser package). The “RxDataMsg.java” application is a class that
implements a Java interface to the “RxDataMsg” and all the message specifications, for example the
size. Finally, the application “Msgreader.java” is a method for the data management and reception of
all messages, sent from the mote connected to the USB port. This method performs a series of
operations when it receives a message of “DataMsg” type, containing the nodes sensor data:
(1) data conversion from count to mv (* 2.5/4096);
(2) data calibration using cross-calibration span and offset;
(3) printing out the packets coming from the mote on the Gateway;
(4) saving each package in an ASCII file.
Sensors 2013, 13 7661
2.6.3. FSL Firmware
To access the MGL, equipped with a Linux Asus eeePc, a direct connection must first be
established from the FSL. This is accomplished with a Point-to-Point Protocol (PPP) connection. On
the Master side Mgetty was used, a versatile program to handle all aspects of a modem under Unix
based systems. The Mgetty program opens a serial device, configures it appropriately, configures the
modem, and waits for a connection to be made. When a connection is detected, Mgetty issues a login
prompt, and then invokes the login program to handle the actual system login. At this point the user
has complete control of the Master PC, can view log files to check for system integrity, access
individual data files from every node, and even retrieve data files.
2.7. Field Experiment
The CrossVit system was tested in Veneto Region (North-East Italy) by the National Council for
Agricultural Research CRA. The trial was conducted on two commercial vineyards (Ponte di Piave and
San Nicolò) owned by Le Rive farm, located in the province of Treviso. In the first vineyard the Vitis
vinifera variety was cv Pinot gris grafted on SO4, and in the second one Cabernet Sauvignon grafted
on 1103 P, both were planted in 2002. Both vineyards, which are located on silty-clay soils, are trellis
trained with free cordon with spur pruning and have an irrigation system. For both varieties two
different methods of winter pruning have been used, which allow the comparison between three
treatments:
a. NP: no pruning;
b. PM: mechanical pruning;
c. PMa: manual pruning
For grape quality and health of bunches it is very important to study the varietal adaptability to
different training systems and pruning methods, the two varieties were chosen for their skin color and
habitus: high vigor and fast growth for Cabernet Sauvignon and low vigor for Pinot gris. The
microclimate inside the canopy is one of the most useful parameters to study given its effect on grape
color, sugar and aroma compounds accumulation. The vines were spaced 0.95 m and 1.3 m apart for
Pinot gris and Cabernet Sauvignon respectively, while row spacing was 2.5 m for both varieties. The
single wire was 1.5 m high and the shoots positioning was free because there were no other wires or
catch wires above the permanent cordon
The trial was conducted over two growing seasons from April to September (2011 and 2012). The
node sensors were positioned inside the vineyards, adopting an experimental layout representing the
six treatments (two varieties and NP, PM and PMa pruning), with two replicates for each sensor and
treatment (in total two main stations and six nodes each). The temperature, humidity and solar
radiation sensors were positioned inside the canopy as follows:
• Temperature sensor just above the permanent cordon;
• Solar radiation sensor placed below (20 cm) the permanent cordon;
• Humidity sensors inside the canopy in the same position as the solar radiation sensor.
Sensors 2013, 13 7662
3. Results and Discussion
3.1. Power Management Performances
The energy consumption test, for both MGL and NL, was done in the laboratory (Table 3). The
node performed the reading of the sensors (75 mA peak) every 15 minutes and sent data to the gateway
(6 mA peak). The increased energy consumption in the reading phase was due to the 5 s. excitation
needed by the HTM2500 sensors. The nodes were equipped with a full capacity 4,500 mA battery,
therefore to estimate the available battery life, 60% of capacity was considered (3,000 mAh), giving an
estimated autonomy of approximately 21 days. This autonomy appears to be optimal in a field
application to ensure, in case of problems with solar charge, enough time to replace the batteries.
Regarding the gateway, the Asus eeePC consumed 900 mA. Fortunately, in the field tests it was not
necessary to replace batteries, thanks to the solar panel charge and the high number of sunny days
during the summer period.
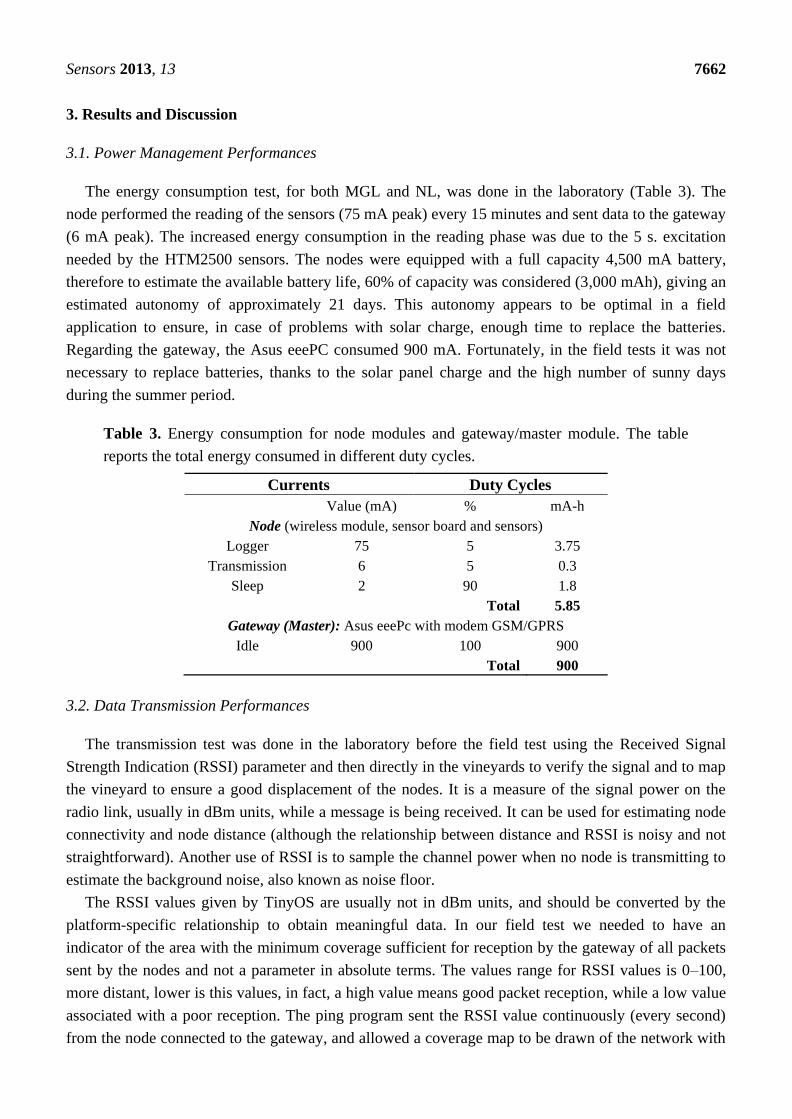
Table 3. Energy consumption for node modules and gateway/master module. The table
reports the total energy consumed in different duty cycles.
Currents Duty Cycles
Value (mA) % mA-h
Node (wireless module, sensor board and sensors)
Logger 75 5 3.75
Transmission 6 5 0.3
Sleep 2 90 1.8
Total 5.85
Gateway (Master): Asus eeePc with modem GSM/GPRS
Idle 900 100 900
Total 900
3.2. Data Transmission Performances
The transmission test was done in the laboratory before the field test using the Received Signal
Strength Indication (RSSI) parameter and then directly in the vineyards to verify the signal and to map
the vineyard to ensure a good displacement of the nodes. It is a measure of the signal power on the
radio link, usually in dBm units, while a message is being received. It can be used for estimating node
connectivity and node distance (although the relationship between distance and RSSI is noisy and not
straightforward). Another use of RSSI is to sample the channel power when no node is transmitting to
estimate the background noise, also known as noise floor.
The RSSI values given by TinyOS are usually not in dBm units, and should be converted by the
platform-specific relationship to obtain meaningful data. In our field test we needed to have an
indicator of the area with the minimum coverage sufficient for reception by the gateway of all packets
sent by the nodes and not a parameter in absolute terms. The values range for RSSI values is 0–100,
more distant, lower is this values, in fact, a high value means good packet reception, while a low value
associated with a poor reception. The ping program sent the RSSI value continuously (every second)
from the node connected to the gateway, and allowed a coverage map to be drawn of the network with
Sensors 2013, 13 7663
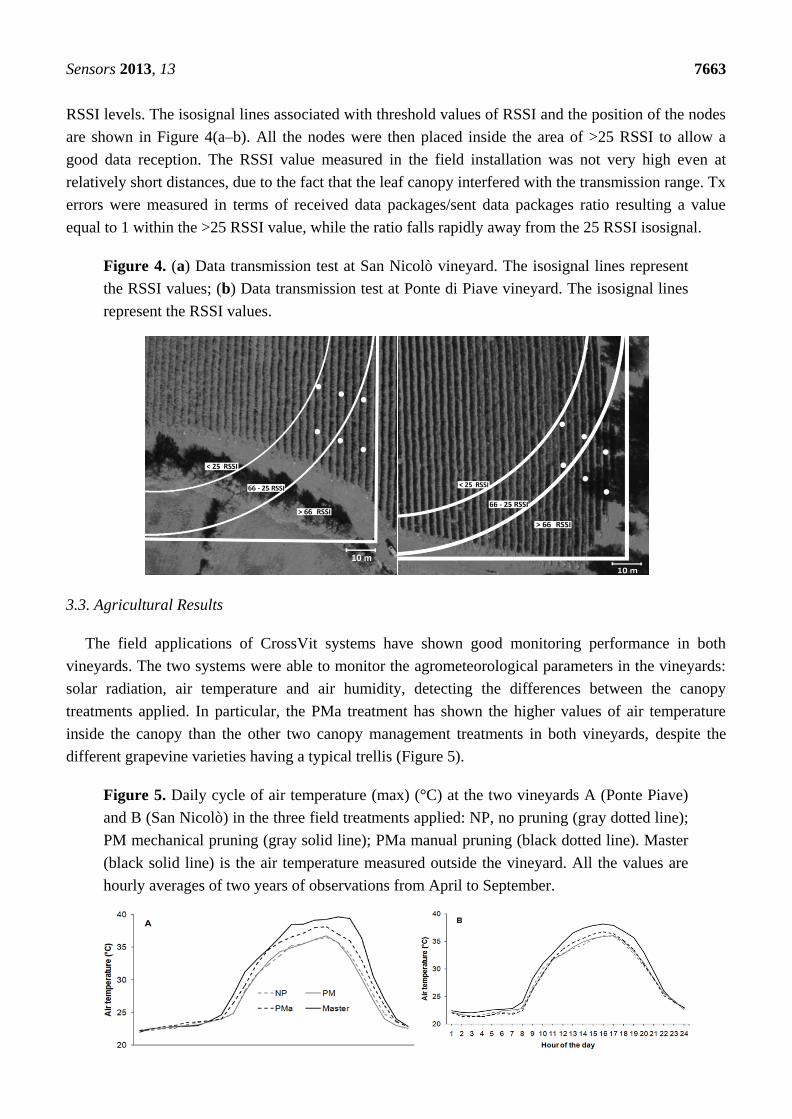
RSSI levels. The isosignal lines associated with threshold values of RSSI and the position of the nodes
are shown in Figure 4(a–b). All the nodes were then placed inside the area of >25 RSSI to allow a
good data reception. The RSSI value measured in the field installation was not very high even at
relatively short distances, due to the fact that the leaf canopy interfered with the transmission range. Tx
errors were measured in terms of received data packages/sent data packages ratio resulting a value
equal to 1 within the >25 RSSI value, while the ratio falls rapidly away from the 25 RSSI isosignal.
Figure 4. (a) Data transmission test at San Nicolò vineyard. The isosignal lines represent
the RSSI values; (b) Data transmission test at Ponte di Piave vineyard. The isosignal lines
represent the RSSI values.
3.3. Agricultural Results
The field applications of CrossVit systems have shown good monitoring performance in both
vineyards. The two systems were able to monitor the agrometeorological parameters in the vineyards:
solar radiation, air temperature and air humidity, detecting the differences between the canopy
treatments applied. In particular, the PMa treatment has shown the higher values of air temperature
inside the canopy than the other two canopy management treatments in both vineyards, despite the
different grapevine varieties having a typical trellis (Figure 5).
Figure 5. Daily cycle of air temperature (max) (°C) at the two vineyards A (Ponte Piave)
and B (San Nicolò) in the three field treatments applied: NP, no pruning (gray dotted line);
PM mechanical pruning (gray solid line); PMa manual pruning (black dotted line). Master
(black solid line) is the air temperature measured outside the vineyard. All the values are
hourly averages of two years of observations from April to September.
Sensors 2013, 13 7664
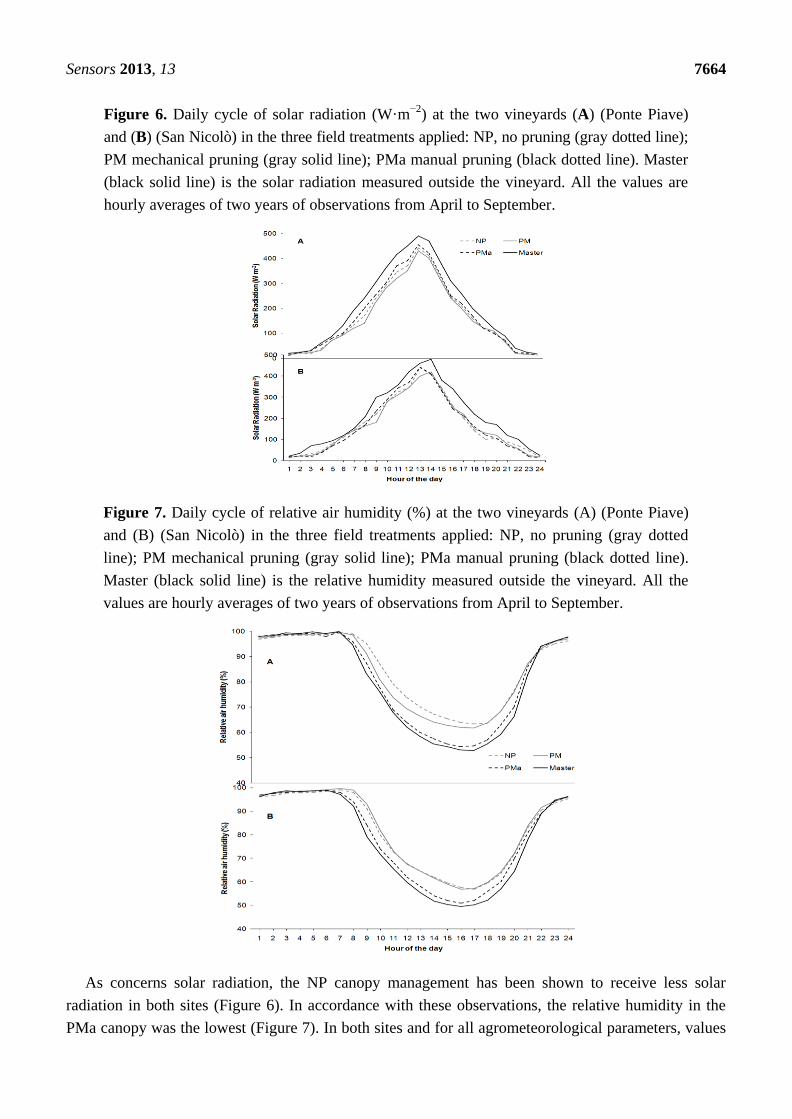
Figure 6. Daily cycle of solar radiation (W·m−2
) at the two vineyards (A) (Ponte Piave)
and (B) (San Nicolò) in the three field treatments applied: NP, no pruning (gray dotted line);
PM mechanical pruning (gray solid line); PMa manual pruning (black dotted line). Master
(black solid line) is the solar radiation measured outside the vineyard. All the values are
hourly averages of two years of observations from April to September.
Figure 7. Daily cycle of relative air humidity (%) at the two vineyards (A) (Ponte Piave)
and (B) (San Nicolò) in the three field treatments applied: NP, no pruning (gray dotted
line); PM mechanical pruning (gray solid line); PMa manual pruning (black dotted line).
Master (black solid line) is the relative humidity measured outside the vineyard. All the
values are hourly averages of two years of observations from April to September.
As concerns solar radiation, the NP canopy management has been shown to receive less solar
radiation in both sites (Figure 6). In accordance with these observations, the relative humidity in the
PMa canopy was the lowest (Figure 7). In both sites and for all agrometeorological parameters, values

Sensors 2013, 13 7665
recorded by the Master station were always higher compared with the Node values, consistently with
the fact that the Master station was installed outside the vineyards without foliage coverage.
These two seasons’ results indicated a satisfactory reliability of CrossVit systems in monitoring
micrometeorological parameters and detecting the different canopy management effects. The CrossVit
performance was evaluated considering the specific aims of this study:
1. Handiness: the solution had to be ready for use and easy to install; the installation was simply
provided with two screws to the cordon pole.
2. Cost-effective: the cost of hardware, software and sensors had to be very low; the cost for a
single complete node was approximately 300 euro.
3. Non-invasive dimensions: the nodes of the WSN had to permit the operations in the vineyard
and not affect the surrounding environment; the case including the node and solar panel
dimensions were 20 × 25 cm and 8 × 12 cm respectively.
4. Versatile and expandable: the system was developed for monitoring in the vineyard, but could
be used for a wide range of applications and with the possibility of adding new types of sensors
with small changes of the firmware (i.e., irrigation schedule);
5. Low power consumption: the system should have low consumption in terms of energy supply
and fully rechargeable with a small solar panel.
6. Firmware and software of the system must be developed in open source environments.
The CrossVit system is still being evaluated in the vineyards, but it has already been shown to have
achieved many of the set goals. The results in terms of power supply and data transmission in the two
seasons confirmed the reliability of the system. The agronomic results have shown the capability of
CrossVit systems in monitoring micrometeorological parameters. However some weak points of the
systems were identified, in particular, the high energy consumption of the receiving station data (Asus
eeePc) and the quite complicated management software (TinyOS).
Regarding the first weak point, future development will be the implementation of the MGL based
on an Arduino platform with the TinyOS operating system that promises a much lower energy
consumption, even if having a PC in the field enabled the control of data supply chain and real time
display, which was very useful. Studies on WSNs for agricultural application used different types of
hardware and were often only aimed at a test run or concerned monitoring for few days in the
field [13–16]. The present CrossVit system was tested in the vineyards for two seasons in analogy with
the work of the Portuguese research team that started in 2008 [11] and then evolved as described in
Peres et al. [12]. Our vineyards monitoring projects began in 2009 with the NAV system, which had
good flexibility characteristics but weaknesses in terms of price and the proprietary software.
4. Conclusions
A new WSN application for real-time monitoring of vineyards is presented. The CrossVit system
allowed two WSN to be implemented in two vineyards with different pruning treatments in order to
understand whether the system could discriminate the effects of the treatments on the microclimate.
This system has allowed us to collect data on the state of the crop with real time microclimate
monitoring, not only for research purposes, but also for controlling events of management interest, such
Sensors 2013, 13 7666
as early disease detection. The system was able to monitor the agrometeorological parameters in the
vineyard: solar radiation, air temperature and air humidity, detecting the differences between the canopy
treatments applied. This research has helped to demonstrate the feasibility of using WSNs for technical
applications in precision viticulture. The methodology focuses on the monitoring of vineyards as a
reference case but, with minor changes, it could be applied directly to other agricultural scenarios.
Acknowledgments
The authors are grateful to Tiziana De Filippis and Leandro Rocchi (IBIMET—CNR) for software
development and assistance, Federica Gaiotti and Patrick Marcuzzo (CRA-VIT) for field assistance.
Thanks to “LE RIVE DI BONATO” Farm who allowed access to their vineyards.
Conflicts of Interest
The author declares no conflict of interest.
References
1. Receuil des methods internationals d’analyse de vins et des moûts; OIV: Paris, France, 2013.
Available online: http://www.oiv.int/oiv/info/enizmiroivreport (accessed on 15 April 2013).
2. Matese, A.; Di Gennaro, S.F.; Zaldei, A.; Genesio, L.; Vaccari, F.P. A wireless sensor network for
precision viticulture: The NAV system. Comput. Electron. Agric. 2009, 69, 51–58.
3. Zucca, G.; Smith, D.E.; Mitry, D.J. Sustainable viticulture and winery practices in California:
What is it, and do customers care? Int. J. Wine Res. 2009, 2, 198–194.
4. Santos, R.A.; onz lez-Potes, A.; Block, A.E.; Virgen-Ortiz, R.A. Developing a new
wireless sensor network platform and its application in precision agriculture. Sensors 2011, 11,
1192–1211.
5. Romer, K.; Mattern, F. The design space of wireless sensor networks. IEEE Wirel. Commun.
2004, 11, 54–61.
6. Ruiz-Garcia, L.; Lunadei, L.; Barreiro, P.; Robla, J.I. A review of wireless sensor technologies
and applications in agriculture and food industry: State of the art and current trends. Sensors 2009,
9, 4728–4750.
7. Burrell, J.; Brooke, T.; Beckwith, R. Vineyard computing: Sensor networks in agricultural
production. IEEE Pervasive Comput. 2004, 3, 38–45.
8. Beckwith, R.; Teibel, D.; Bowen, P. Report from the Field: Results from An Agricultural
Wireless Sensor Network. In Proceedings of the 29th Annual IEEE International Conference on
Local Computer Networks, Tampa, FL, USA, November 2004; pp. 471–478.
9. Levis, P.; Madden, S.; Polastre, J.; Szewczyk, R.; Whitehouse, K.; Woo, A.; Gay, D.; Hill, J.;
Welsh, M.; Brewer, E.; et al. TinyOS: An Operating System for Wireless Sensor Networks. In
Ambient Intelligence; Springer-Verlag: New York, NY, USA, 2005b.
10. Lloret, J.; Garcia, M.; Bri, D.; Sendra, S. A wireless sensor network deployment for rural and
forest fire detection and verification. Sensors 2009, 9, 8722–8747.

Sensors 2013, 13 7667
11. Garcia-Sanchez, A.J.; Garcia-Sanchez, F.; Garcia-Haro, J. Wireless sensor network deployment
for integrating video-surveillance and data-monitoring in precision agriculture over distributed
crops. Comput. Electron. Agric. 2011, 75, 288–303.
12. Morais, R.; Fernandes, M.A.; Matos, S.G.; Serôdio, C.; Ferreira, P.J.S.G.; Reis, M.J.C.S.
A ZigBee multi-powered wireless acquisition device for remote sensing applications in precision
viticulture. Comput. Electron. Agric. 2008, 62, 94–106.
13. Peres, E.; Fernandes, M.A.; Morais, R.; Cunha, C.R.; López, J.A.; Matos, S.R.; Ferreira, P.J.S.G.;
Reis, M.J.C.S. An autonomous intelligent gateway infrastructure for in-field processing in
precision viticulture. Comput. Electron. Agric. 2011, 78, 176–187.
14. Nadimi, E.S.; Jørgensen, R.N.; Blanes-Vidal, V.; Christensen, S. Monitoring and classifying
animal behavior using ZigBee-based mobile ad hoc wireless sensor networks and artificial neural
networks. Comput. Electron. Agric. 2012, 82, 44–54.
15. Zheng, J.; Elliott, C.; Dersingh, A.; Liscano, R.; Eklund, M. Design of a Wireless Sensor Network
from an Energy Management Perspective. In Proceedings of Communication Networks and
Services Research on 8th Annual Communication Networks and Services Research Conference,
Montreal, QC, Canada, 11–14 May 2010.
16. Lopez, J.A.; Soto, F.; Suardiaz, J.; Sánchez, P.; Iborra, A.; Vera, J.A. Wireless sensor networks
for precision horticulture in Southern Spain. Comput. Electron. Agric. 2009, 68, 25–35.
© 2013 by the authors; licensee MDPI, Basel, Switzerland. This article is an open access article
distributed under the terms and conditions of the Creative Commons Attribution license
(http://creativecommons.org/licenses/by/3.0/).