crown point and ticonderoga central school districts castallo & silky-education consultants...
TRANSCRIPT

Castallo & Silky-Education Consultants
1
Prepared by
Castallo & Silky-Education Consultants P.O. Box 15100
Syracuse, New York 13215 August 2013
This report was prepared with funds provided by the New York State Department of State under the Local
Government Efficiency Grant Program
Merger Study Final Report
Crown Point and Ticonderoga Central School
Districts

Castallo & Silky-Education Consultants
2
Table of Contents
Page No.
Acknowledgements …………………………………………………………………….3
I. Background …………………………………………………………………………5
II. Enrollment History and Projections ………….…………………………………….12
III. Instructional/Extracurricular Program ……………..………………………………19
IV. Facilities ………………………………….………………………………………..48
V. Student Transportation ……………….………………………………………..….60
VI. Staffing……………………………………………………………………………..66
VII. Fiscal Condition of the Districts …………………….……………….……….….87
VIII. Key Findings and Recommendations …………………………………………..118
Appendix: Merger Study Advisory Committee Meeting Minutes….……..….………126

Castallo & Silky-Education Consultants
3
Acknowledgements A study with this purpose and magnitude could not have been accomplished
without the support and cooperation of many individuals. We would first like to express
our appreciation to the members of the Crown Point and Ticonderoga boards of
education, as well as superintendents Shari Brannock and John McDonald. Strong district
leadership is not afraid to ask important yet difficult and sometimes controversial
questions—that is what these district leaders have done in commissioning this study.
We also owe a large debt of gratitude to the members of the study Advisory
Committee listed below. These individuals devoted considerable time and effort to assist
us with this important work. They are to be commended for the commitment they have
shown to their respective communities:
Crown Point Committee Members Ticonderoga Committee Members
Seth Celotti Mike Cherubini
Anita Johnson Joyce Cooper
Tom Fish John Donohue
Brian Kiely Dave Iuliano
Agatha Mace James Major
Shana Macey Seanna Porter
Peggy Patnode Lynn Reale
Tara Spaulding Nancy Rich
Tom Wranosky Michelle Young
The New York State Department of State graciously provided the funding for this
study and deserves the gratitude of all involved. We would also like to express our
gratitude to Suzanne Spear at the New York State Education Department. Ms. Spear has
offered us direction and provided critical information that ensures we have complied with
all Department requirements for a study of this nature. As always, she continues to
advocate for quality work that will benefit all school children in New York.

Castallo & Silky-Education Consultants
4
To these and all other individuals who assisted us in bringing this study to a
successful conclusion, we offer our deepest gratitude. If we have overlooked anyone that
was supportive in our work, we apologize; but understand we are grateful nonetheless.
Jessica F. Cohen, Consultant Alan D. Pole, Consultant [email protected] [email protected] 315.445.7909 315.692.4615 6106 Bay Hill Circle 4514 Whistler Circle Jamesville, NY 13078 Manlius, NY 13104
August 2013

Castallo & Silky-Education Consultants
5
Chapter 1 Background
A number of factors are affecting the operation of public school districts in New
York State today. State standards continue to rise requiring students to do more in order
to attain a high school diploma. These standards are driven by a rapidly changing world
where more skills than ever before are required in order for students to be successful in
college, the world of work, or both. Pressures on schools to increase the number of
students who successfully complete high school continue to mount.
At the same time that schools are requiring more of their students, the number of
students attending New York State schools is declining. Other than in a few isolated
sections of the state, most school district enrollments have declined in the past few years
and are projected to continue to decline in the foreseeable future. It is a challenge for
schools to do more with fewer students.
Another challenge facing school districts in New York State is one of resources.
As districts strive to provide more for their students, financial challenges continue to
grow in our nation and in New York State in particular. Our national economy is more
precarious than it has been in decades. Our state budget is in dire straits facing
significant challenges in the future. Radical cuts in state and federal aid to school districts
have been made for the past several school years. A new law creating a local tax cap will
further limit the ability of school districts to raise local revenues to fund their schools. It
is clearly time for courageous school leaders to begin discussions about doing business
differently.
In the fall of 2012, the Crown Point and Ticonderoga boards of education
expressed interest in pursuing a study to examine the merger of their two school districts.
Both districts approached the State Education Department and the New York State
Department of State to secure funding for this study. The districts did receive a state
grant to support this study and Ticonderoga was designated as the Local Education
Agency (LEA) to administer the funding. The districts selected Castallo and Silky,
Education Consultants from Syracuse, to conduct the study. Castallo and Silky has
conducted more than 25 school district merger studies prior to this investigation. Each
Castallo & Silky-Education Consultants
6
board of education identified members of its respective school community to form an
advisory committee. The purpose of the advisory committee was to offer assistance to
the consultants as they went about their work and to serve as key communicators back to
their school district communities.
The study began in earnest in January 2013 with an initial meeting of the advisory
committee. This report represents the culmination of our work and offers an overview of
each district in the essential areas of operation when a merger is being considered:
enrollment and enrollment projections, program (academic, co-curricular, and extra-
curricular), facilities, transportation, staffing, and finances. This report also contains our
recommendations for consideration by a new board of education should residents of both
the Crown Point and Ticonderoga Central School Districts approve a merger.
As a framework for completing this study, the following critical questions were
regularly discussed with the advisory committee:
Program and Enrollment
What are the enrollment historical patterns and projections for each district and how
might these projections affect future program offerings?
What programs does each district offer the other if they were to merge today?
What new academic and extracurricular programs might be offered?
How would merger affect class size?
How would program-offering decisions be made?
What effect would merger have on vocational programs, both on-site and presently
offered at the BOCES?
What effect would merger have on special education programs, both on-site and those
offered through other organizations?
Facilities and Transportation
What should be the configuration of the facilities by grade level?
What is the status of the existing physical facilities?

Castallo & Silky-Education Consultants
7
What immediate and longer term needs will have to be addressed and what are the
cost implications for these needs if existing buildings remain in use?
What other facilities options should be considered and what are the implications
(cost, travel, space, etc.) for each?
If new facilities were built, what general locations would be recommended?
What is the longest bus run (distance/time) for a student in each district today?
If existing facilities were used, how long would it take to reach each one?
Would additional bus runs be feasible to cut down on travel time?
Would one or two bus facilities be recommended?
What would be the advantages/disadvantages of combining the transportation fleet,
staff, inventory, or purchasing?
Staffing
What might happen with disparate pay scales?
What major provisions exist in present contracts and how do they compare? Are there
significant language differences in contracts?
Should provisions be recommended for continuation of present probationary and/or
tenured staff for a period of time?
How should assignments be made in a new district for administrators, teachers,
support staff, coaches, and extracurricular advisors?
What might be the administrative structure in a merged district?
Finance
How have taxes varied in each district over the past five years?
What proportion of additional state aid should be directed to program improvement,
tax reduction, long-term fiscal stability, or facilities?
What are the financial assets of each district?
What are the financial liabilities of each district?
How much incentive operating aid should the new district expect to receive?

Castallo & Silky-Education Consultants
8
What would be the maximum approved building aid the new district would receive?
What considerations should be placed in the financial plan to assure the new district
will see long-term benefits from additional aid?
What would be the impact on property taxes should the districts decide to merge?
In conducting this study, we examined data from the 2012-13 school year. The
study took a “snapshot” of the conditions that existed in Crown Point and Ticonderoga at
this point in time. This report is written with a clear understanding that things will
change. As school leaders look to the future, they can use this study as a starting point
but will have to adjust as a result of economic conditions and increased demands from the
state.
The Crown Point and Ticonderoga Central School Districts are both located in the
southern part of Essex County. The Hague portion of the Ticonderoga district is located
in northern Warren County. Approximately one hour south of Plattsburgh, Crown Point is
on Lake Champlain and Ticonderoga is on both Lake Champlain and Lake George. The
two districts are east of Interstate 87, the Northway. Both school districts are rural in
nature and are communities where the school buildings serve as the hub of school and
community activity. While the school districts are among the largest employers in the
area, there is also a large International Paper Company plant that is located in the
Ticonderoga school district, approximately half way between the villages of Ticonderoga
and Crown Point.
The Ticonderoga Central School District has already gone through a relatively
recent reorganization. Discussions about reorganization between Hague Central School
and Ticonderoga Central School started taking place in the early 1970’s. In 1971, 1974,
and each year from 1976 through 1979, Hague voted six times to centralize with
Ticonderoga. The vote was defeated in each of these six years. In 1978, State Education
Department Deputy Commissioner Robert Spillane wrote to the superintendent in Hague
saying that Hague “may not continue to graduate a senior class after June 1979.” In
addition, he wrote “…it is imperative that the Hague Central School join with the
Ticonderoga Central School before September 1979.” In 1979, the voters in Hague voted
in favor of being annexed by Ticonderoga by a vote of 242 to 190.
Castallo & Silky-Education Consultants
9
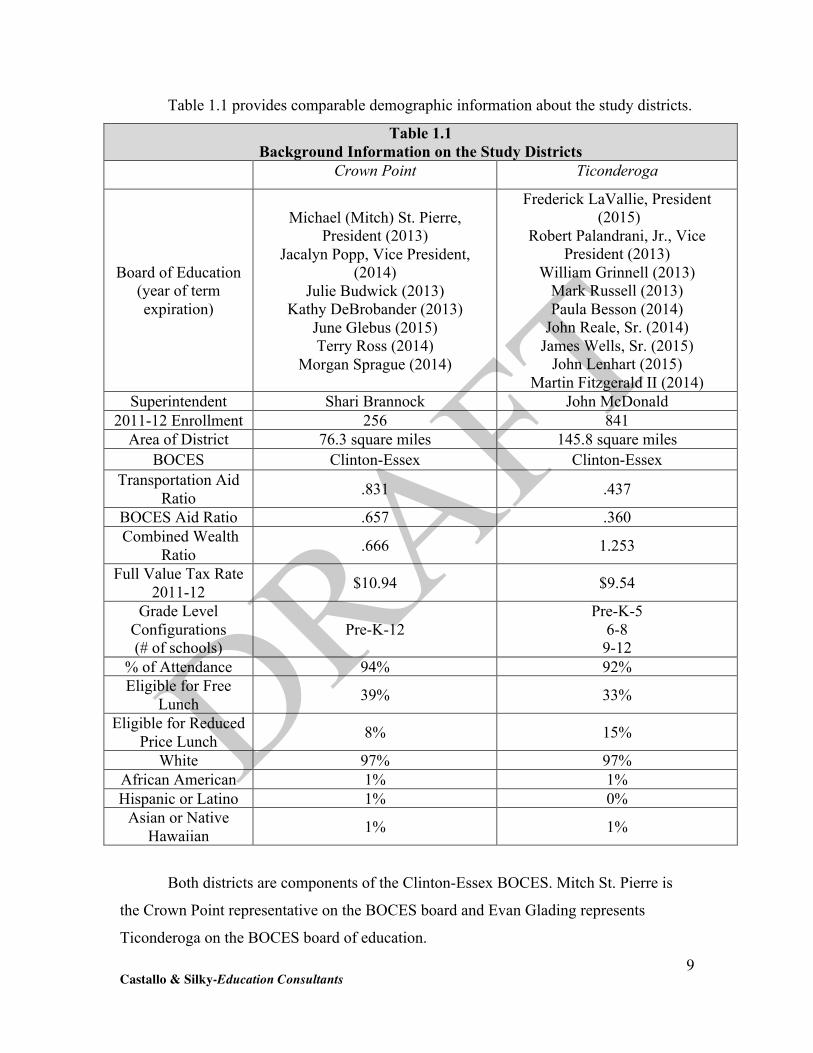
Table 1.1 provides comparable demographic information about the study districts.
Table 1.1 Background Information on the Study Districts
Crown Point Ticonderoga
Board of Education (year of term expiration)
Michael (Mitch) St. Pierre, President (2013)
Jacalyn Popp, Vice President, (2014)
Julie Budwick (2013) Kathy DeBrobander (2013)
June Glebus (2015) Terry Ross (2014)
Morgan Sprague (2014)
Frederick LaVallie, President (2015)
Robert Palandrani, Jr., Vice President (2013)
William Grinnell (2013) Mark Russell (2013) Paula Besson (2014)
John Reale, Sr. (2014) James Wells, Sr. (2015)
John Lenhart (2015) Martin Fitzgerald II (2014)
Superintendent Shari Brannock John McDonald 2011-12 Enrollment 256 841
Area of District 76.3 square miles 145.8 square miles BOCES Clinton-Essex Clinton-Essex
Transportation Aid Ratio .831 .437
BOCES Aid Ratio .657 .360 Combined Wealth
Ratio .666 1.253
Full Value Tax Rate 2011-12 $10.94 $9.54
Grade Level Configurations (# of schools)
Pre-K-12 Pre-K-5
6-8 9-12
% of Attendance 94% 92% Eligible for Free
Lunch 39% 33%
Eligible for Reduced Price Lunch 8% 15%
White 97% 97% African American 1% 1% Hispanic or Latino 1% 0%
Asian or Native Hawaiian 1% 1%
Both districts are components of the Clinton-Essex BOCES. Mitch St. Pierre is
the Crown Point representative on the BOCES board and Evan Glading represents
Ticonderoga on the BOCES board of education.

Castallo & Silky-Education Consultants
10
This merger study has been about the centralization of Crown Point and
Ticonderoga. In a centralization, a new school district is created that encompasses the
entire property of the two school districts being merged. A new board of education is
elected to oversee the operations of the newly created school district.
Upon its completion, the merger study will be reviewed by the State Education
Department. Following SED approval of the report, presentations on the study will be
made to the two boards of education. Ample opportunity for questions and answers will
be provided to the boards and their staff. It is anticipated that the boards of education will
take time to deliberate about this report and then make decisions about how to proceed in
a manner that will best serve their districts.
Should the Crown Point and Ticonderoga boards of education decide to move
forward, an advisory referendum or “straw vote” is taken in both school district
communities. If a majority of the voters in both communities approve the straw vote, the
Commissioner of Education will then formally lay out the merged school district and call
for a formal referendum. At this same public referendum, the public will also vote on
whether there will be 5, 7, or 9 members on the board of education should the merger
vote be successful and whether terms of office will be 3, 4, or 5 years. If the merger vote
is successful in each district, the votes on the two propositions regarding board of
education structure will be combined from both districts with the results of the total tally
prevailing.
Should the voters from both school districts approve the merger in the public
referendum, the merger of the two school districts is approved. Should the merger vote
not receive majority voter approval in each district, the merger vote fails and the two
school districts remain in their current status. Within a year and a day, a second vote on
reorganization may be held. If the first vote failed in only one of the districts, it is only
that district that would hold a second vote with the positive vote from the other district
remaining valid.
Subsequent to a successful merger vote, the Commissioner of Education calls a
special meeting in the merged school district in order to elect a new board of education.
Once this board of education is elected, it is empowered with all of the authority and

Castallo & Silky-Education Consultants
11
responsibility of any other school district board of education to oversee the operations of
the new school district.
A merged school district inherits all of the property of the previous two school
districts as well as some of the contractual obligations that existed in both of the previous
districts. One of the major decisions that the new board of education will make is to hire
the new superintendent for the school district. While existing contractual obligations for
both of the sitting superintendents must be honored by the new board of education,
neither superintendent has a contractual right to the position of superintendent in the
merged district. The District Superintendent can serve as a valuable resource for the
board of education in the process of selecting a superintendent.
Centralized school districts come into formal operation on July 1 of a given year.
This study was conducted with the understanding that the merged district would begin
operation on July 1, 2014. However, recent conversations between the school district
superintendents and representatives from the State Education Department have structured
a time line that would have a merged district begin operation on July 1, 2015.

Castallo & Silky-Education Consultants
12
Chapter 2 Enrollment History and Projections
Accurate student enrollment projections are essential for district long range
planning. Virtually all aspects of a school district’s operation, including program,
staffing, facilities, and finances, are related to the number of students enrolled. For this
reason, updated enrollment projections are critical and serve as the first aspect of analysis
for this study.
The procedure for projecting student enrollments is referred to as the cohort
survival method. This methodology is highly reliable and is the most frequently used
projective technique for making short-term school enrollment projections. To calculate
enrollment projections, the following data and procedures are used:
• Six years of district enrollment by grade level
• Calculation of survival ratios by grade level
• Kindergarten enrollment projections based on resident live births
A survival ratio is obtained by dividing a given grade’s enrollment by the
enrollment of the preceding grade a year earlier. For example, the number of students in
grade three in any year is divided by the number of students in grade two of the previous
year. The ratio indicates the proportion of the cohort “surviving” to the following year.
Cohort refers to the enrollment in a grade for a given year.
Using grade-to-grade survival ratios, an average of these ratios for each cohort
progression is obtained. This average is referred to as an average projective survival
ratio. This ratio is then multiplied by each current grade enrollment to obtain the
projected enrollment for the next successive year. The multiplicative process is
continued for each successive year.
Survival ratios usually have values close to one, but may be less than or greater
than one. Where the survival ratio is less than one, fewer students “survived” to the next
grade. Where the survival ratio is more than one, more students “survived” to the next
grade. Grade-to-grade survival ratios reflect the net effects of deaths, dropouts, the
number of students who are home schooled, promotion policies, transfers to and from
nonpublic schools, and migration patterns in and out of the school district.

Castallo & Silky-Education Consultants
13
Since estimating births introduces a possible source of error into the model,
enrollment projections are most accurate when existing data on live residential births can
be used. Live birth data is currently available from the New York State Department of
Health for both school districts from 2002 through 2010. Enrollment projections are
therefore most accurate for five years into the future for the elementary grades.
The methodology used in this study was an extrapolation of kindergarten
enrollment cohorts from live birth data from the two school districts. Live birth data for
Crown Point and Ticonderoga from 2002-2010 are shown in the following table:
Comparing the number of live births in any year with the number of students
entering kindergarten five years later will produce a ratio. This ratio of live births to
entering kindergarten students is the factor that is used to project kindergarten
enrollments from live births into the future. Combining the kindergarten enrollment
projections with the cohort survival ratios for each grade level, the K-12 enrollments for
Crown Point and Ticonderoga can now be projected through the 2019-20 school year.
Tables 2.2 and 2.3 on the following pages present the projected enrollments for both of
the study districts. NOTE: It is important to point out that column totals of projected K-
12 students may not equal the sum of the column (perhaps off by one or two students)
due to rounding errors created by the survival ratios.
Table 2.1 Number of Live Births, 2002 – 2010
Calendar Year Crown Point Ticonderoga Total 2002 15 57 72 2003 15 49 64 2004 22 58 80 2005 23 55 78 2006 21 47 68 2007 20 59 79 2008 29 71 100 2009 12 56 68 2010 28 63 91

Castallo & Silky-Education Consultants
14
Table 2.2 Crown Point Enrollment History and Projection
Grade 2006-07
2007 -08
2008 -09
2009 -10
2010 -11
2011 -12
2012 -13
2013 -14
2014 -15
2015 -16
2016 -17
2017 -18
2018 -19
2019 -20
Births 5 yrs. earlier
15 15 22 23 21 20 29 12 28 22 22 22 22
K 24 16 14 19 13 19 20 18 26 11 25 20 20 20 1 12 22 19 18 17 14 20 22 20 29 12 28 22 22 2 18 14 23 16 15 16 15 19 21 19 27 11 26 21 3 23 17 13 22 15 16 18 15 19 21 19 28 11 27 4 23 19 15 15 21 15 16 18 15 19 21 19 27 11 5 18 19 21 14 15 21 19 17 19 16 20 22 20 29 6 22 19 18 23 16 15 22 20 18 20 17 21 23 21 7 18 23 23 21 24 19 18 26 23 21 23 19 24 27 8 18 16 20 23 16 21 19 16 23 21 19 21 17 22 9 23 21 20 23 23 20 24 22 19 27 24 22 24 20
10 25 24 19 19 28 21 22 24 22 19 27 25 22 25 11 29 22 21 18 19 25 18 20 22 20 17 25 22 20 12 29 28 19 20 19 19 23 17 19 21 20 17 24 21
Ungraded Elementary
Ungraded Secondary
2
Total K-12
284 260 245 251 241 241 254 255 267 264 272 277 285 286
Total K-5
118 107 105 104 96 101 108 109 120 115 125 128 127 130
Total 6-8
58 58 61 67 56 55 59 62 64 61 58 61 65 70
Total 9-12
108 95 79 80 89 85 87 84 83 88 88 88 92 86
NOTE: Live births to estimate 2017-18 and 2019-20 Kindergarten enrollments were averages of the previous five years of live births.

Castallo & Silky-Education Consultants
15
Table 2.3
Ticonderoga Enrollment History and Projection Grade 2006-
07 2007 -08
2008 -09
2009 -10
2010 -11
2011 -12
2012 -13
2013 -14
2014 -15
2015 -16
2016 -17
2017 -18
2018 -19
2019 -20
Births 5 yrs. earlier
57 49 58 55 47 59 71 56 63 59 59 59 59
K 75 62 66 71 79 65 70 81 77 86 81 81 81 81 1 56 59 49 49 56 56 54 54 62 59 67 62 62 62 2 66 57 62 48 43 55 53 52 52 60 57 64 60 60 3 60 68 59 55 43 37 55 50 49 49 57 54 60 57 4 65 59 64 58 59 41 41 56 50 49 49 57 54 61 5 65 63 61 63 58 54 38 40 54 49 48 48 56 53 6 61 67 61 54 70 54 56 37 39 53 48 47 47 55 7 81 67 82 70 66 82 66 67 45 47 64 58 57 57 8 79 83 68 73 78 64 77 65 66 44 46 63 57 56 9 95 95 87 69 82 82 76 84 71 72 48 50 68 62
10 99 68 92 85 68 77 76 73 80 68 69 46 48 66 11 67 104 65 81 82 55 76 70 67 74 62 63 42 44 12 85 65 104 75 78 80 62 79 73 70 77 65 66 44
Ungraded Elementary
3 3
Ungraded Secondary
8 6
Total K-12
954 917 920 851 862 813 809 808 786 781 773 759 760 757
Total K-5
387 368 361 344 338 311 314 332 345 353 359 367 374 374
Total 6-8
221 217 211 197 214 200 199 170 150 145 158 168 161 168
Total 9-12
346 332 348 310 310 302 296 306 291 283 256 225 225 216
NOTE: Live births to estimate 2017-18 through 2019-20 enrollments were averages of the previous five years of live births.
The K-12 enrollment in Crown Point has been declining since 2006-07 to the
current year (-10.6%) similar to Ticonderoga’s (-15.2%). This pattern is not unusual for
upstate New York school districts. The elementary (K – 5) enrollments in each district
declined during this time period (Crown Point, -8.5%; Ticonderoga, -18.9%) and the
middle school (6-8) and secondary (9-12) enrollments also show reductions (Crown
Point,-1.7% and 19%; Ticonderoga, -10% and -14.5%). Projections for Crown Point
predict that the K-12 student body will increase from 254 students to 286, an increase of
12.6%. Ticonderoga’s enrollment is projected to decline to 757 students, a decline of
6.4%. Projections for the elementary level at Crown Point show an increase of 20.4% and
for Ticonderoga an increase of 19.1%.

Castallo & Silky-Education Consultants
16
Should the districts decide to merge, table 2.4 shows the projected enrollment of
the merged district. The projected enrollment of a merged district will be 1,062 next year
and only slightly decline (2%) by 2019-20.
Table 2.4 Combined Enrollment Projections 2013-14 to 2019-20
Year
Grade 2013-14 2014-15 2015-16 2016-17 2017-18 2018-19 2019-20
K 99 103 97 106 101 101 101 1 76 82 88 79 90 84 84 2 71 73 79 84 75 86 81 3 65 68 70 76 82 71 84 4 74 65 68 70 76 81 72 5 57 73 65 68 70 76 82 6 57 57 73 65 68 70 76 7 93 68 68 87 77 81 84 8 81 89 65 65 84 74 78 9 106 90 99 72 72 92 82 10 97 102 87 96 71 70 91 11 90 89 94 79 88 64 64 12 96 92 91 97 82 90 65
Total 1062 1051 1044 1044 1036 1040 1044
K-5
K-5
442 464 467 483 494 499 504 6-8 231 214 206 217 229 225 238 9-12 389 373 371 344 313 316 302
NOTE: Due to rounding error, these totals will not exactly match the totals in the individual district enrollment projections and some may be off by 1-3 students.
Today, a growing number of parents have chosen to educate their children at
home. Some school districts have a large number of these “home-schooled children”
and, should these families all decide to discontinue this practice, it could possibly place a
strain on the district of residence to welcome them into the public schools. Consequently,
it is important to examine the number of these home-schooled students in each of the
study districts. Table 2.5 provides a summary of the home-schooled students in both the
Crown Point and Ticonderoga Central School Districts.

Castallo & Silky-Education Consultants
17
Table 2.5 Number of Home Schooled Students 2007-08 to 2011-12
Year Crown Point Ticonderoga 2007-08 19 6 2008-09 20 8 2009-10 15 6 2010-11 19 8 2011-12 16 10 Average 17.8 7.6
The number of home-schooled children in Crown Point has declined slightly in
the past five years while those in Ticonderoga have increased slightly from 2007-08
through 2011-12. This number of home-schooled students is relatively low for school
districts in upstate New York. It is interesting to note that there are only 4 families home
schooling the 16 students in Crown Point in the 2011-12 year. In any event, should all of
the home schooled students decide to start attending the public schools, it does not appear
that there would be a significant impact on any area of school operations.
District resident students in non-public schools is sometimes an important
consideration when projecting future enrollments, especially if there is a large number
and there is the possibility of one or more of the non-public schools closing and students
returning to the public school system. Table 2.6 that follows examines the number of
Crown Point and Ticonderoga students who have been enrolled in non-public schools for
the past five years.
Table 2.6 Number of Resident Students in Non-Public Schools 2007-08 to 2011-12
Year Crown Point Ticonderoga 2007-08 30 49 2008-09 25 49 2009-10 24 42 2010-11 25 57 2011-12 18 62 Average 24.4 51.8
The vast majority of the students identified in table 2.6 above attend St. Mary’s
Elementary School, a K-8 Catholic school located in Ticonderoga. At the end of eighth
grade, most of these students return to Crown Point and Ticonderoga. This is the reason
for the increase in enrollment for both districts between eighth and ninth grades. There is

Castallo & Silky-Education Consultants
18
no indication that St. Mary’s is in danger of closing in the near future. However, if St.
Mary’s should close, accommodations would have to be made for the approximately 75
students who would presumably return to the two public schools. However 75 students
spread across grades K-8 would not materially impact the projections in this chapter.
In addition to district students attending non-public schools, there are also non-
resident students who attend Ticonderoga. The Putnam Central School District pays
tuition for 39 7th – 12th graders to attend school in Ticonderoga. There are currently no
non-resident students attending Crown Point.
In conclusion, the projected student enrollments have not required adjustment to
account for any returning students such as home schooled or non-public school students.
Consequently, the projected enrollment numbers in Tables 2.2, 2.3, and 2.4 are best
estimates.
Castallo & Silky-Education Consultants
19
Chapter 3 Instructional/Extra-Curricular Program
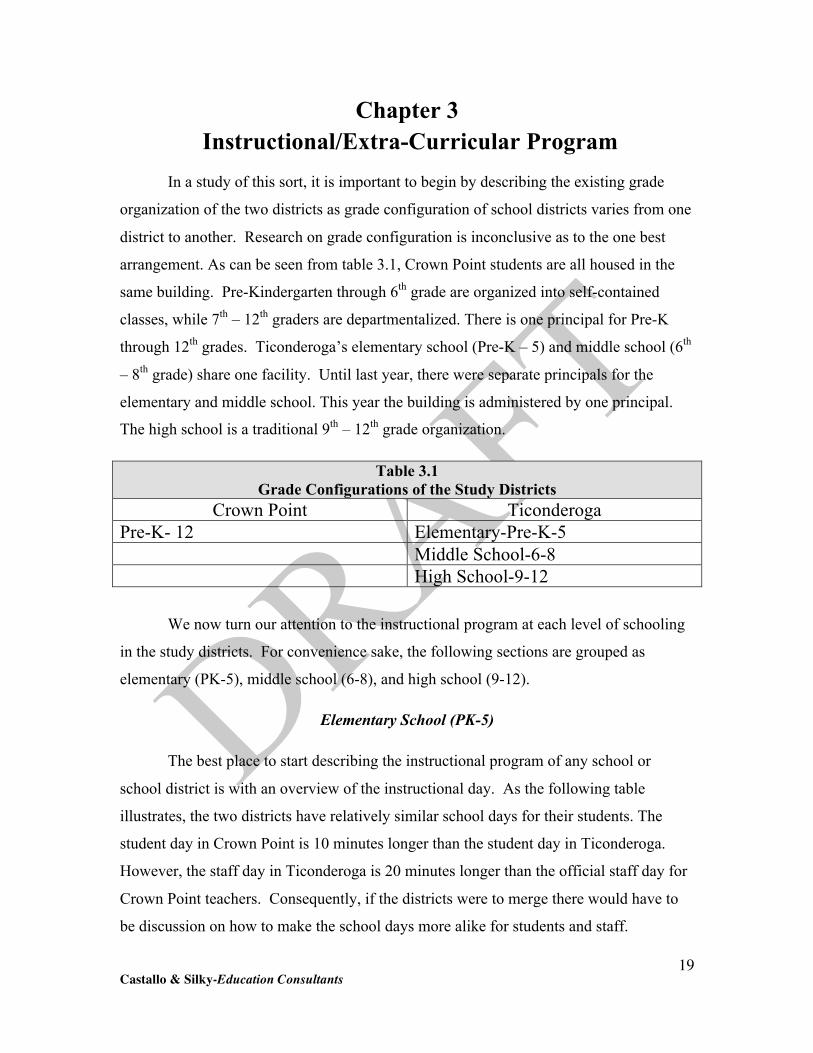
In a study of this sort, it is important to begin by describing the existing grade
organization of the two districts as grade configuration of school districts varies from one
district to another. Research on grade configuration is inconclusive as to the one best
arrangement. As can be seen from table 3.1, Crown Point students are all housed in the
same building. Pre-Kindergarten through 6th grade are organized into self-contained
classes, while 7th – 12th graders are departmentalized. There is one principal for Pre-K
through 12th grades. Ticonderoga’s elementary school (Pre-K – 5) and middle school (6th
– 8th grade) share one facility. Until last year, there were separate principals for the
elementary and middle school. This year the building is administered by one principal.
The high school is a traditional 9th – 12th grade organization.
Table 3.1 Grade Configurations of the Study Districts
Crown Point Ticonderoga Pre-K- 12 Elementary-Pre-K-5 Middle School-6-8 High School-9-12
We now turn our attention to the instructional program at each level of schooling
in the study districts. For convenience sake, the following sections are grouped as
elementary (PK-5), middle school (6-8), and high school (9-12).
Elementary School (PK-5)
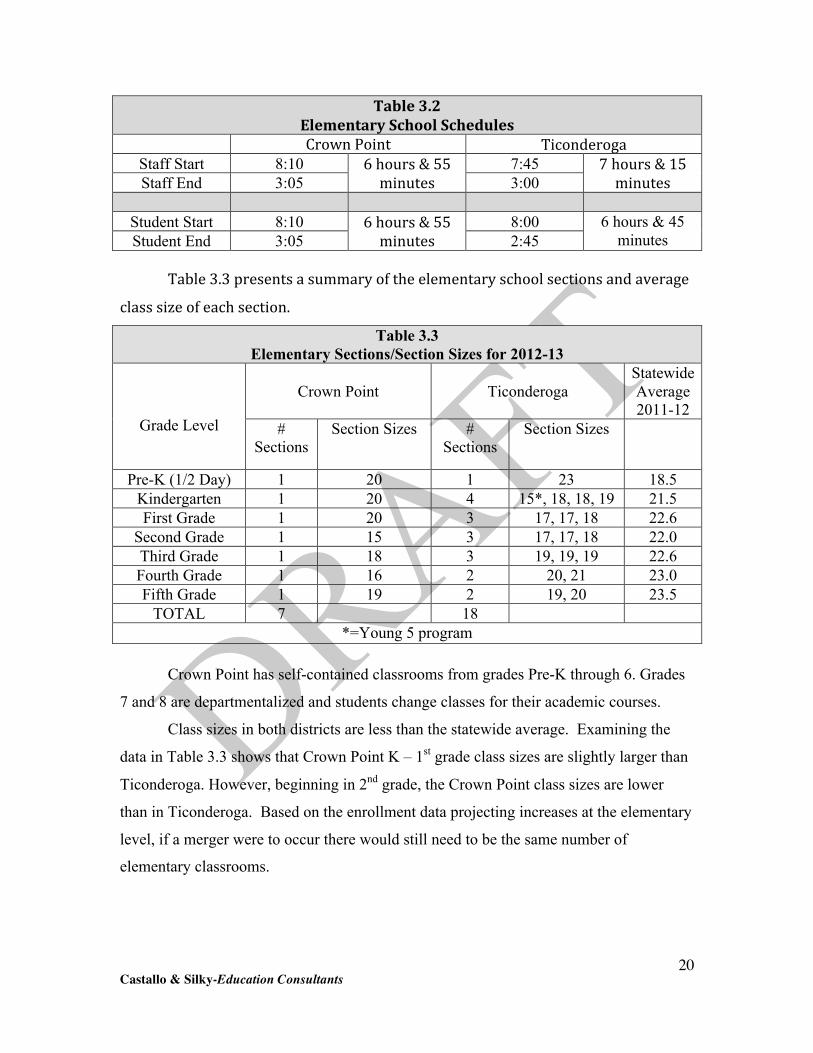
The best place to start describing the instructional program of any school or
school district is with an overview of the instructional day. As the following table
illustrates, the two districts have relatively similar school days for their students. The
student day in Crown Point is 10 minutes longer than the student day in Ticonderoga.
However, the staff day in Ticonderoga is 20 minutes longer than the official staff day for
Crown Point teachers. Consequently, if the districts were to merge there would have to
be discussion on how to make the school days more alike for students and staff.
Castallo & Silky-Education Consultants
20
Table 3.2 Elementary School Schedules
Crown Point Ticonderoga Staff Start 8:10 7:45 Staff End 3:05
6 hours & 55 minutes 3:00
7 hours & 15 minutes
Student Start 8:10 8:00 Student End 3:05
6 hours & 55 minutes 2:45
6 hours & 45 minutes
Table 3.3 presents a summary of the elementary school sections and average
class size of each section.
Table 3.3 Elementary Sections/Section Sizes for 2012-13
Crown Point
Ticonderoga
Statewide Average 2011-12
Grade Level # Sections
Section Sizes # Sections
Section Sizes
Pre-K (1/2 Day) 1 20 1 23 18.5 Kindergarten 1 20 4 15*, 18, 18, 19 21.5 First Grade 1 20 3 17, 17, 18 22.6
Second Grade 1 15 3 17, 17, 18 22.0 Third Grade 1 18 3 19, 19, 19 22.6 Fourth Grade 1 16 2 20, 21 23.0 Fifth Grade 1 19 2 19, 20 23.5
TOTAL 7 18 *=Young 5 program
Crown Point has self-contained classrooms from grades Pre-K through 6. Grades
7 and 8 are departmentalized and students change classes for their academic courses.
Class sizes in both districts are less than the statewide average. Examining the
data in Table 3.3 shows that Crown Point K – 1st grade class sizes are slightly larger than
Ticonderoga. However, beginning in 2nd grade, the Crown Point class sizes are lower
than in Ticonderoga. Based on the enrollment data projecting increases at the elementary
level, if a merger were to occur there would still need to be the same number of
elementary classrooms.
Castallo & Silky-Education Consultants
21
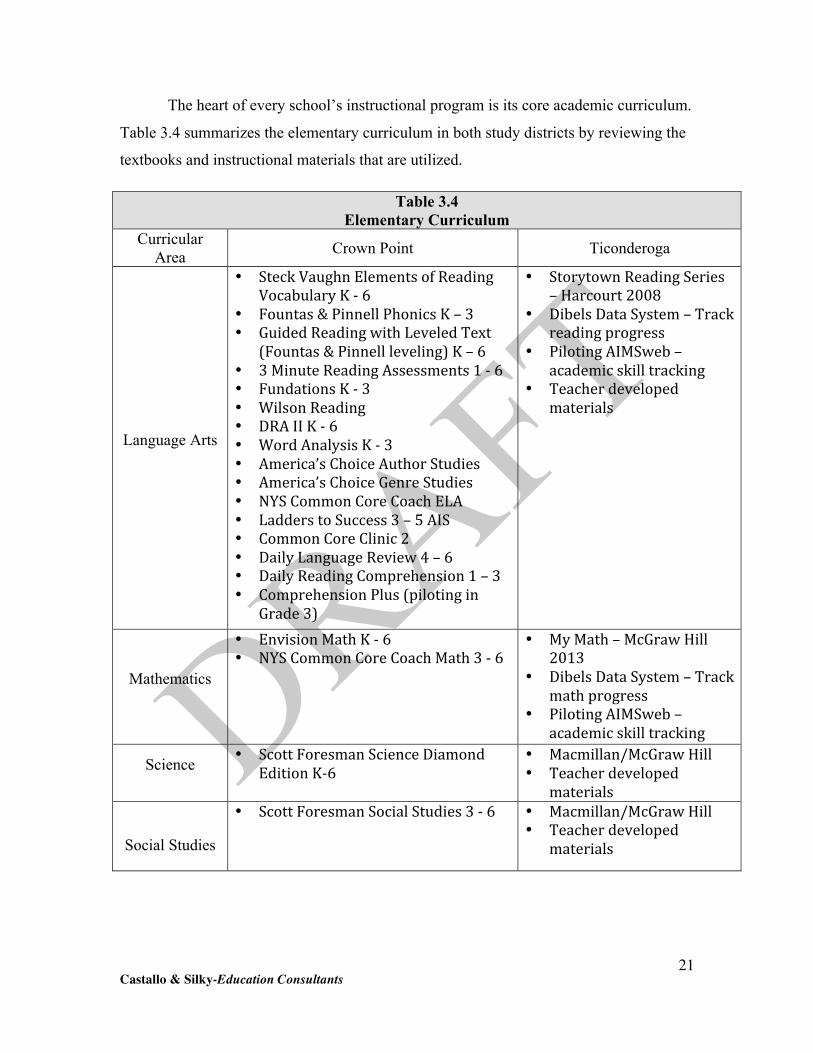
The heart of every school’s instructional program is its core academic curriculum.
Table 3.4 summarizes the elementary curriculum in both study districts by reviewing the
textbooks and instructional materials that are utilized.
Table 3.4 Elementary Curriculum
Curricular Area Crown Point Ticonderoga
Language Arts
• Steck Vaughn Elements of Reading Vocabulary K -‐ 6
• Fountas & Pinnell Phonics K – 3 • Guided Reading with Leveled Text
(Fountas & Pinnell leveling) K – 6 • 3 Minute Reading Assessments 1 -‐ 6 • Fundations K -‐ 3 • Wilson Reading • DRA II K -‐ 6 • Word Analysis K -‐ 3 • America’s Choice Author Studies • America’s Choice Genre Studies • NYS Common Core Coach ELA • Ladders to Success 3 – 5 AIS • Common Core Clinic 2 • Daily Language Review 4 – 6 • Daily Reading Comprehension 1 – 3 • Comprehension Plus (piloting in
Grade 3)
• Storytown Reading Series – Harcourt 2008
• Dibels Data System – Track reading progress
• Piloting AIMSweb – academic skill tracking
• Teacher developed materials
Mathematics
• Envision Math K -‐ 6 • NYS Common Core Coach Math 3 -‐ 6
• My Math – McGraw Hill 2013
• Dibels Data System – Track math progress
• Piloting AIMSweb – academic skill tracking
Science • Scott Foresman Science Diamond Edition K-‐6
• Macmillan/McGraw Hill • Teacher developed
materials
Social Studies
• Scott Foresman Social Studies 3 -‐ 6
• Macmillan/McGraw Hill • Teacher developed
materials

Castallo & Silky-Education Consultants
22
While different series are currently utilized, both districts are moving to the
adoption of the Common Core curriculum that will require new textbook adoptions in the
next few years.
In addition to the core curriculum, each elementary school offers special area
subjects to provide a well-rounded education to students. As Table 3.5 illustrates, the
core elementary special subjects (art, music and physical education) are taught in each
district. However the amount of time students get per week varies considerably between
the two districts.
Table 3.5 Elementary Special Area Subjects
Special Area Subject Crown Point Ticonderoga
Music
• Pre K – Gr. 1: 80 min/ 6 day cycle • Gr 2: 120 min/ 6 day cycle • Gr. 3: 80 min/6 day cycle • Gr 4: 120 min/ 6 day cycle • Gr 5: 40 min/ 6 day cycle • Gr 6: 40 min/ 6 day cycle
• Pre-‐K – Gr 5: 60 min/ 6 day cycle
Art • Pre K – Gr 4: 80 min/6 day cycle • Gr 5: 120 min/ 6 day cycle • Gr 6: 80 min/ 6 day cycle
• Pre-‐K – Gr 5: 60 min/ 6 day cycle
Physical Education
• Pre K – Kg: 200 min/ 6 day cycle • Gr. 1 – 6: 120 min/ 6 day cycle
• Pre K: 30 min/6 day cycle
• Kg – Gr. 3: 180 min/6 day cycle
• Gr 4: 135 min/6 day cycle
• Gr. 5: 180 min/ 6 day cycle
Library or Computer
• Pre K: 80 min/6 day cycle (Library) • Kg: 40 min/per 6 day cycle (Library) • Gr 1: 40 min/ (Library);80 min/
(Computer)/6 day cycle • Gr 2: 40 min/ (Library); 40
min/(Computer)/ 6 day cycle • Gr 3: 40 min/(Library); 40 min/
(Computer)/6 day cycle • Gr 4 – Gr 5: 40 min/ 6 day cycle for
Computer
• Kg: 60 min Computer/6 day cycle
• Gr 1 – Gr 2: 90 minutes Computer/ 6 day cycle
• Gr. 3 – Gr 5: 90 minutes Computer /6 day cycle and 30 min Library Research/6 day cycle
Nutrition/Health • Gr 1 – Gr 5: 40 min/6 day cycle

Castallo & Silky-Education Consultants
23
Spanish • Gr 3 – Gr 5: 40 min/6 day cycle
Technology • Gr 5: 40 min/6 day cycle • Gr. 6: 60 min/6 day cycle
Family & Consumer Science
• Gr. 6: 60 min/6 day cycle
Finally, to ensure a complete picture of the elementary school instructional
program, it is necessary to present a summary of student academic performance. At the
elementary and middle levels in New York State, the best way to accomplish this is by
examining student performance on the English/Language Arts (ELA) and Mathematics
state tests administered in grades 3-8. Before presenting recent results for Crown Point
and Ticonderoga, it is important to understand the rating system currently used in New
York. The following summary describes the four-level system in place.
Performance Level Descriptors (Grades 3-8 Assessment System)
Level 1-Not Meeting Learning Standards
Student performance does not demonstrate an understanding of the content expected in
the subject and grade level.
Level 2-Partially Meeting Learning Standards
Student performance demonstrates a partial understanding of the content expected in the
subject and grade level.
Level 3-Meeting Learning Standards
Student performance demonstrates an understanding of the content expected in the
subject and grade level.
Level 4-Meeting Learning Standards with Distinction
Student performance demonstrates a thorough understanding of the content expected in
the subject and grade level.
The following series of tables (3.6-3.11) present a four-year summary of students
scoring at each achievement level in both of the study districts in grades 3-5.

Castallo & Silky-Education Consultants
24
Table 3.6 Percent of Students Scoring at Each Level
English/Language Arts-Grade 3 2008-09 2009-10 2010-11 2011-12
Level CP (15)
TI (58)
CP (23)
TI (55)
CP (15)
TI (44)
CP (16)
TI (37)
1 0 7 17 5 0 9 0 19 2 7 7 31 22 27 27 38 30 3 93 76 35 62 73 59 63 43 4 0 10 17 11 0 5 0 8
( ) indicates the number tested
Table 3.7 Percent of Students Scoring at Each Level
Math-Grade 3 2008-09 2009-10 2010-11 2011-12
Level CP (15)
TI (57)
CP (23)
TI (55)
CP (15)
TI (44)
CP (16)
TI (37)
1 0 0 0 2 0 5 0 14 2 0 5 26 29 27 29 38 30 3 67 63 65 34 53 57 56 46 4 33 32 9 35 20 9 6 11
( ) indicates the number tested
Table 3.8 Percent of Students Scoring at Each Level
English/Language Arts-Grade 4 2008-09 2009-10 2010-11 2011-12
Level CP (16)
TI (64)
CP (15)
TI (58)
CP (20)
TI (57)
CP (15)
TI (41)
1 6 2 0 12 0 2 0 5 2 13 15 53 28 25 28 20 37 3 81 77 40 57 75 65 80 59 4 0 6 7 3 0 5 0 0
( ) indicates the number tested
Castallo & Silky-Education Consultants
25
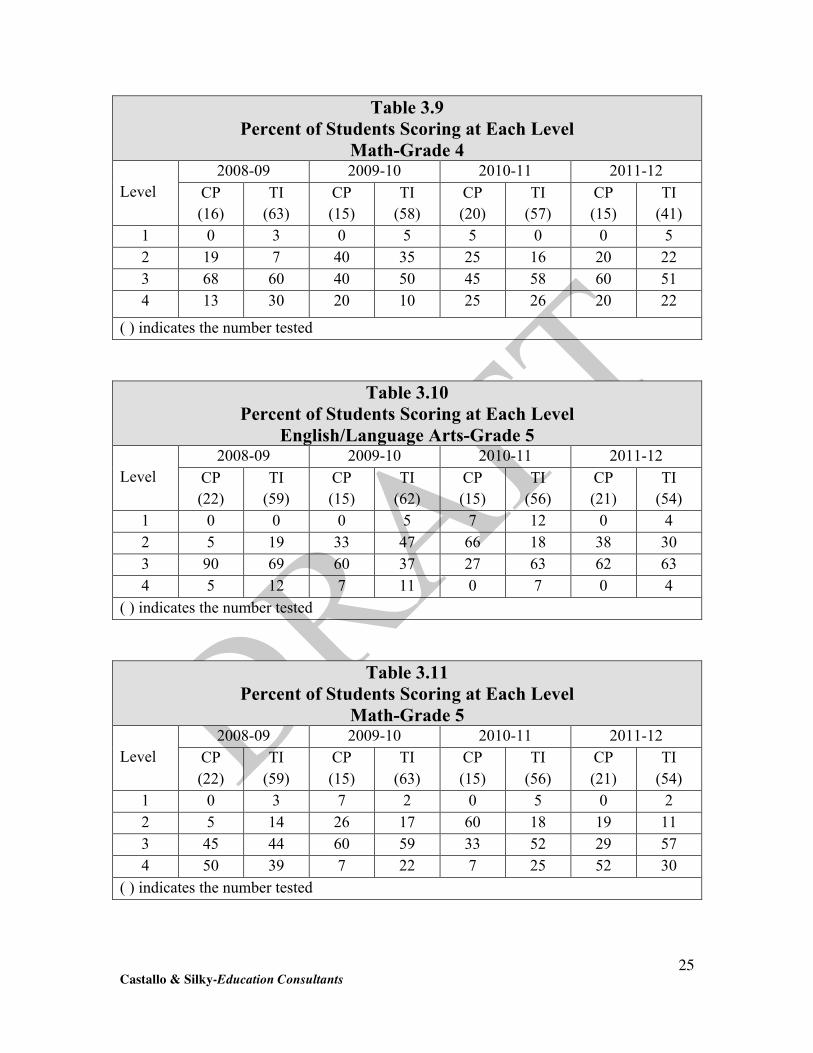
Table 3.9 Percent of Students Scoring at Each Level
Math-Grade 4 2008-09 2009-10 2010-11 2011-12
Level CP (16)
TI (63)
CP (15)
TI (58)
CP (20)
TI (57)
CP (15)
TI (41)
1 0 3 0 5 5 0 0 5 2 19 7 40 35 25 16 20 22 3 68 60 40 50 45 58 60 51 4 13 30 20 10 25 26 20 22
( ) indicates the number tested
Table 3.10 Percent of Students Scoring at Each Level
English/Language Arts-Grade 5 2008-09 2009-10 2010-11 2011-12
Level CP (22)
TI (59)
CP (15)
TI (62)
CP (15)
TI (56)
CP (21)
TI (54)
1 0 0 0 5 7 12 0 4 2 5 19 33 47 66 18 38 30 3 90 69 60 37 27 63 62 63 4 5 12 7 11 0 7 0 4
( ) indicates the number tested
Table 3.11 Percent of Students Scoring at Each Level
Math-Grade 5 2008-09 2009-10 2010-11 2011-12
Level CP (22)
TI (59)
CP (15)
TI (63)
CP (15)
TI (56)
CP (21)
TI (54)
1 0 3 7 2 0 5 0 2 2 5 14 26 17 60 18 19 11 3 45 44 60 59 33 52 29 57 4 50 39 7 22 7 25 52 30
( ) indicates the number tested

Castallo & Silky-Education Consultants
26
Caution should be exercised in drawing conclusions regarding the performance of
the two districts because of the small number of students in each grade level in the
districts. With that in mind, it appears that there is very little difference in performance
between the districts. In some years, Crown Point students do better than Ticonderoga
students and in other years the reverse is true. Overall, both districts have similar
performance.
Middle School (Grades 6-8)
As was done with the elementary schools, the following table shows the daily
schedules for the middle schools.
Table 3.12 Middle School Daily Schedule
Crown Point Ticonderoga MIDDLE SCHOOL
Start/End Times Length of Day Start/End Times Length of Day Staff Start 8:10 7:45 Staff End 3:05
6 hours & 55 minutes 3:00
7 hours and 15 minutes
Student Start 8:10 7:50 Student End 3:05
6 hours & 55 minutes 2:48
6 hours & 58 minutes
At the middle schools, we find that the daily schedules are much more alike than
they are different for students but not for staff. Middle school staff days at Crown Point
begin twenty-five minutes later and end five minutes earlier than at Ticonderoga. The
Ticonderoga middle school staff day is twenty minutes longer than at Crown Point.
Currently, the middle school teachers in Ticonderoga work one hundred minutes more
per week than do the teachers in Crown Point.
The student days in the middle schools are more similar than the staff schedules.
The lengths of the middle school student days are different by only three minutes but the
start times vary by twenty minutes and the end times differ by seventeen minutes. If the
districts were to merge, there will have to be agreement regarding the staff and student
days in the middle school.

Castallo & Silky-Education Consultants
27
As was done with the elementary schools, we now look at the instructional
program. At the middle school level, we do this by reviewing the courses offered and the
section sizes. Table 3.13 that follows provides this data.
Table 3.13 Middle School Sections/Section Sizes-2012-13 (Maximum Class Size of 25; AIS - 15)
Course CP TI No. of Students
No. of Sections Merged
District No. of
Sections
No. of Fewer
Sections
Net Reduction
in Sections
6-Math 19, 18, 17 76 4 19, 19, 19,
19 4 0
6-Science 20,18, 17 77 4 20, 19, 19,
19 4 0
6-Social Studies
19, 18, 18 77 4 20, 19, 19,
19 4 0
6-English
22
19, 18, 18 77 4 20, 19, 19,
19 4 0
6-Reading 20, 16, 18 54 3 18, 18, 18 3 0
6-Spanish 22 (1/2) 22 1 22 1 0 6-Math
Lab 12 12 1 12 1 0
6-Science Lab 13 13 1 13 1 0
6-Soc. Stud. Lab 12 12 1 12 1 0
6-Eng. Lab 13 13 1 13 1 0
7-Math 19, 22, 22 81 4 20, 20, 20,
21 4 0
7-Science 20, 21, 24 83 4 21, 21, 21,
20 4 0
7-Social Studies
19, 21, 26 84 4 21, 21, 21,
21 4 0
7-English
18
20, 23, 22 83 4 21, 21, 21,
20 4 0
7-Math Lab 18 16 34 2 17, 17 2 0
7-Science Lab 14 14 1 14 1 0
7-Soc. Stud. Lab 15 15 1 15 1 0
7-English Lab 18 16 34 2 17, 17 2 0
7-French 9, 23 32 2 16, 16 2 0 7-Spanish 15 (1/2) 9, 20 44 3 22, 22 2 1
8-Math (Algebra)
20, 21, 15, (21)
75 (21)
4 (1) 25, 25, 25,
(21) 3
(1) 1
8-Science (Biology)
19
19, 22, 10, 11 (17)
81 (17)
5 (1)
20, 20, 20, 21
(17)
4 (1) 1
12 fewer
sections of
Middle School

Castallo & Silky-Education Consultants
28
8-Social Studies
21, 23, 11, 23 97 5 24, 24, 24,
25 4 1
8-English
19, 19, 24, 16 97 5 24, 24, 24,
25 4 1
8-Math Lab 19 14 33 2 17, 18 2 0
8-Science Lab 14 14 1 14 1 0
8-Biology Lab (1/2) 17 17 1 17 1 0
8-Eng. Lab 13 13 1 13 1 0
8-French 17, 19 36 2 17, 19 2 0 8-Spanish 17 14,18 49 3 25, 24 2 1
AIS 6,7,7,5,6,6 37 6 12,12,13 3 3
Physical Education
(1/2)
19,18, 22
17,19, 18, 18, 22,21,
8,11,16,16,16,
17
258 15 24 (10) 18 11 4
Study Hall 27, 11, 32, 32,
41 143 5 25, 25, 25,
25, 23, 20 6 (1)
Table 3.13 shows the courses and the section sizes for the middle school academic
programs. In addition, the table also shows what the middle school section sizes might
look like should the districts decide to merge. In looking at the section sizes of a merged
district, the assumption was made that no class section would exceed twenty-five students
with the exception of AIS classes that would not exceed 15 students. Applying this
assumption to the merged student population would have the potential of saving a total of
12 sections of middle school classes.
Each section of an academic course represents a period of an academic teacher’s
time. Additional support staff might also be represented by these blocks of time. By
eliminating twelve sections of classes, at least two opportunities potentially exist for the
merged district. First, it might be possible to replace those sections with additional
courses, thereby increasing the program opportunities for students. Or, on the other hand,
by reducing the number of sections, it might be possible to reduce staff and thereby
reduce budget expenses or free up staff to work in other buildings in the district. Table
3.14 provides some additional information on offerings for special area subjects in the
two districts.

Castallo & Silky-Education Consultants
29
Table 3.14 Middle School Special Area Subjects
Special Area Subject Crown Point Ticonderoga
Music • Gr. 6: 50 min/6 day cycle • Gr. 7: 80 min/6 day cycle • Gr. 8: None
• Gr. 6: 10 weeks • Gr. 7: 10 weeks • Gr. 8: 10 weeks
Art • Gr. 6: 100 min/ 6 day cycle • Gr. 7: 120 min/6 day cycle • Gr. 8: None
• Gr. 6: 10 weeks • Gr. 7: 10 weeks • Gr. 8: 10 weeks
Physical Education • Gr. 6 – 8: 120 min/ 6 day cycle
• Gr. 6 – 8: 3 days of 6 day cycle
Health • Gr. 7: 120 min/ 6 day cycle • Gr. 6: 10 weeks • Gr. 7: 10 weeks
Technology • Gr. 6: 120 min/6 day cycle • Gr. 8: 120 min/6 day cycle
• Gr. 6: 10 weeks • Gr. 7: 10 weeks • Gr. 8: 20 weeks
Family & Consumer Science • Gr. 6: 60 min/6 day cycle • Gr. 8: 120 min/6 day cycle
• Gr. 6: 10 weeks • Gr. 7: 10 weeks • Gr. 8: 20 weeks
While there are some differences in the grade levels that courses are offered, both
districts currently offer approximately the same amount of time in these areas for students
in accordance with state regulations. It should not be difficult to organize these offerings
if a merger were to occur.
The following tables look at the student performance for both districts on the state
assessments for English Language Arts and Math in grades six through eight.
Table 3.15 Percent of Students Scoring at Each Level
English/Language Arts-Grade 6 2008-09 2009-10 2010-11 2011-12
Level CP (19)
TI (59)
CP (24)
TI (56)
CP (16)
TI (68)
CP (16)
TI (54)
1 0 0 8 7 0 3 19 4 2 32 7 25 18 37 37 50 35 3 68 78 63 55 63 57 31 59 4 0 15 4 20 0 3 0 2
( ) indicates the number tested
Castallo & Silky-Education Consultants
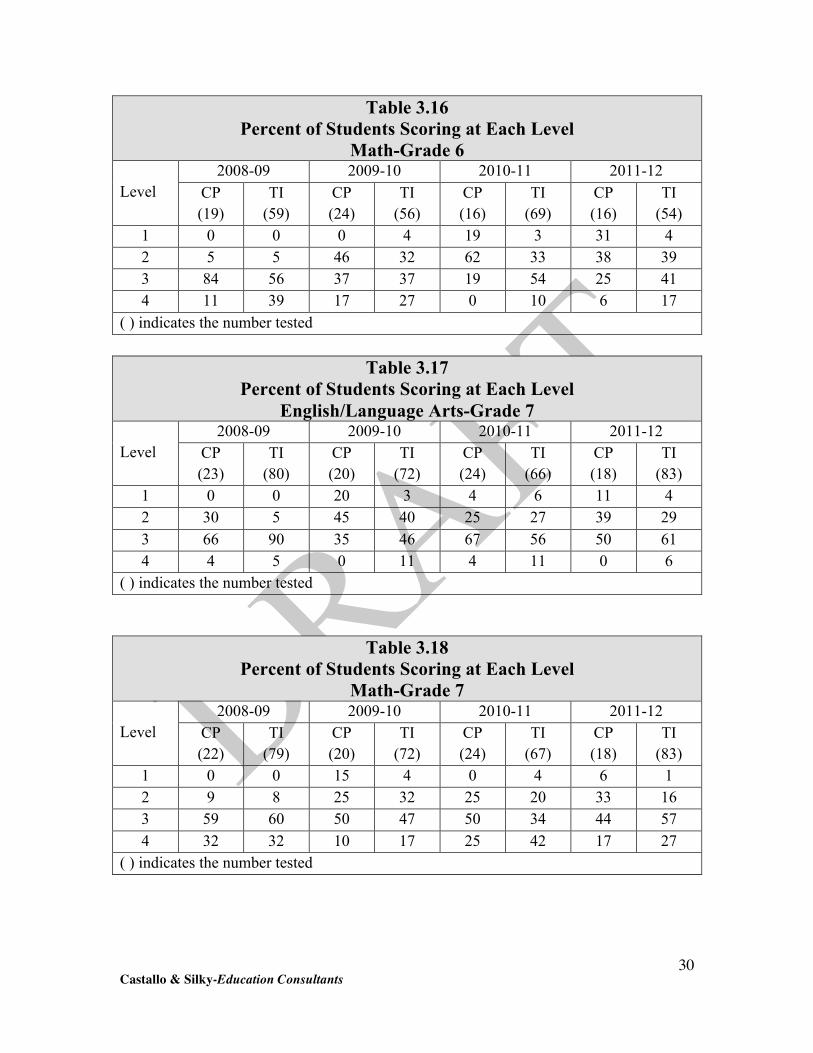
30
Table 3.16 Percent of Students Scoring at Each Level
Math-Grade 6 2008-09 2009-10 2010-11 2011-12
Level CP (19)
TI (59)
CP (24)
TI (56)
CP (16)
TI (69)
CP (16)
TI (54)
1 0 0 0 4 19 3 31 4 2 5 5 46 32 62 33 38 39 3 84 56 37 37 19 54 25 41 4 11 39 17 27 0 10 6 17
( ) indicates the number tested
Table 3.18 Percent of Students Scoring at Each Level
Math-Grade 7 2008-09 2009-10 2010-11 2011-12
Level CP (22)
TI (79)
CP (20)
TI (72)
CP (24)
TI (67)
CP (18)
TI (83)
1 0 0 15 4 0 4 6 1 2 9 8 25 32 25 20 33 16 3 59 60 50 47 50 34 44 57 4 32 32 10 17 25 42 17 27
( ) indicates the number tested
Table 3.17 Percent of Students Scoring at Each Level
English/Language Arts-Grade 7 2008-09 2009-10 2010-11 2011-12
Level CP (23)
TI (80)
CP (20)
TI (72)
CP (24)
TI (66)
CP (18)
TI (83)
1 0 0 20 3 4 6 11 4 2 30 5 45 40 25 27 39 29 3 66 90 35 46 67 56 50 61 4 4 5 0 11 4 11 0 6
( ) indicates the number tested

Castallo & Silky-Education Consultants
31
Table 3.19 Percent of Students Scoring at Each Level
English/Language Arts-Grade 8 2008-09 2009-10 2010-11 2011-12
Level CP (21)
TI (66)
CP (22)
TI (74)
CP (18)
TI (78)
CP (24)
TI (63)
1 0 2 5 4 6 8 4 5 2 19 21 45 35 50 48 25 40 3 81 74 36 52 44 38 71 52 4 0 3 14 9 0 6 0 3
( ) indicates the number tested
Table 3.20 Percent of Students Scoring at Each Level
Math-Grade 8 2008-09 2009-10 2010-11 2011-12
Level CP (22)
TI (65)
CP (22)
TI (72)
CP (18)
TI (75)
CP (24)
TI (62)
1 0 0 5 1 6 0 8 3 2 9 5 27 13 16 24 25 29 3 82 70 45 50 50 64 50 50 4 9 25 23 36 28 12 17 18
( ) indicates the number tested
It is difficult to draw any fair comparisons between the two districts in terms of
how middle school students performed on state test for the four years shown due to the
relatively small number of students and the variance that one or two students may cause
in each district taking the tests. In some years it appears as if Crown Point students
outperformed Ticonderoga students while other years it is just the opposite. In summary,
there does not seem to be significant consistent differences (year-to-year) between the
two districts in terms of how their elementary and middle school students performed on
the state ELA and math assessments.

Castallo & Silky-Education Consultants
32
High School (Grades 9-12)
As illustrated in the section on middle schools, the following table shows the daily
schedule for the high schools in the study districts.
Table 3.21 High School Daily Schedule
Crown Point Ticonderoga Start/End Times Length of Day Start/End Times Length of Day
Staff Start 8:10 7:45 Staff End 3:05
6 hours & 55 minutes 3:00
7 hours and 15 minutes
Student Start 8:10 7:57 Student End 3:05
6 hours & 55 minutes 3:00
7 hours & 3 minutes
At the high school level, we find that the daily schedules are much more alike
than they are different for students but not for staff. High school staff days at Crown
Point begin twenty-five minutes later and end five minutes earlier than at Ticonderoga.
The Ticonderoga High School staff day is twenty minutes longer than at Crown Point.
Currently, the high school teachers in Ticonderoga work one hundred minutes more per
week than do the teachers in Crown Point.
The student days in the high schools differs by eight minutes and the start times
differ by thirteen minutes. If the districts were to merge, there will have to be agreement
made on the staff and student days in the high school.
Table 3.22 that follows presents an overview of the curriculum in each district’s
high school. In addition to identifying the courses taught during 2012-13, the number of
sections of each course and each section size are also shown in this table. For example,
in Crown Point there is one section of English 9 with a section size of 23 (1.5 refers to the
fact that the course is given for 1.5 periods a day); Ticonderoga has four sections of
English 9 with 10, 17, 22, and 18 students in the classes.
In addition to showing the current classes being offered, the number of sections,
and the section sizes, the table also shows what might reasonably be expected to happen
to the section sizes should the two districts decide to merge. This analysis assumes that
all of the courses that are currently being offered will continue to be offered. No new
course offerings have been introduced. The creation of section sizes in the potentially

Castallo & Silky-Education Consultants
33
merged district is guided by the assumption that class size in the core academic areas will
not exceed twenty-five students. AIS class sizes will not exceed fifteen students.
We also believe that the consolidation of classes described in the following table
is very plausible given the size of a new merged high school. Scheduling students in a
smaller high school offers limited flexibility. The limited number of periods, BOCES
classes, limited certification flexibility for staff, and facilities constraints often limit
scheduling options in a small high school. Should the high schools merge, we believe that
much more flexibility would be available for arranging student schedules and therefore
the reductions in section numbers identified could be realized.
Finally, a word of caution is offered. The reduction in the number of sections
shown in the following table should not be assumed to be directly connected to staff
reductions. Following mergers, curriculum opportunities often expand for students. Table
3.22 frees up teacher schedules in order to potentially offer more electives and broaden
the high school curriculum. It is also noted that many merged districts’ boards of
education agree to reduce staff only by attrition. If this is the position taken by the board
of education in this merged district, a combination of more electives and staff reductions
through attrition can be implemented over an extended period of time. This would have
the long-term effect of reducing staff costs without layoffs while increasing program
offerings for the students.
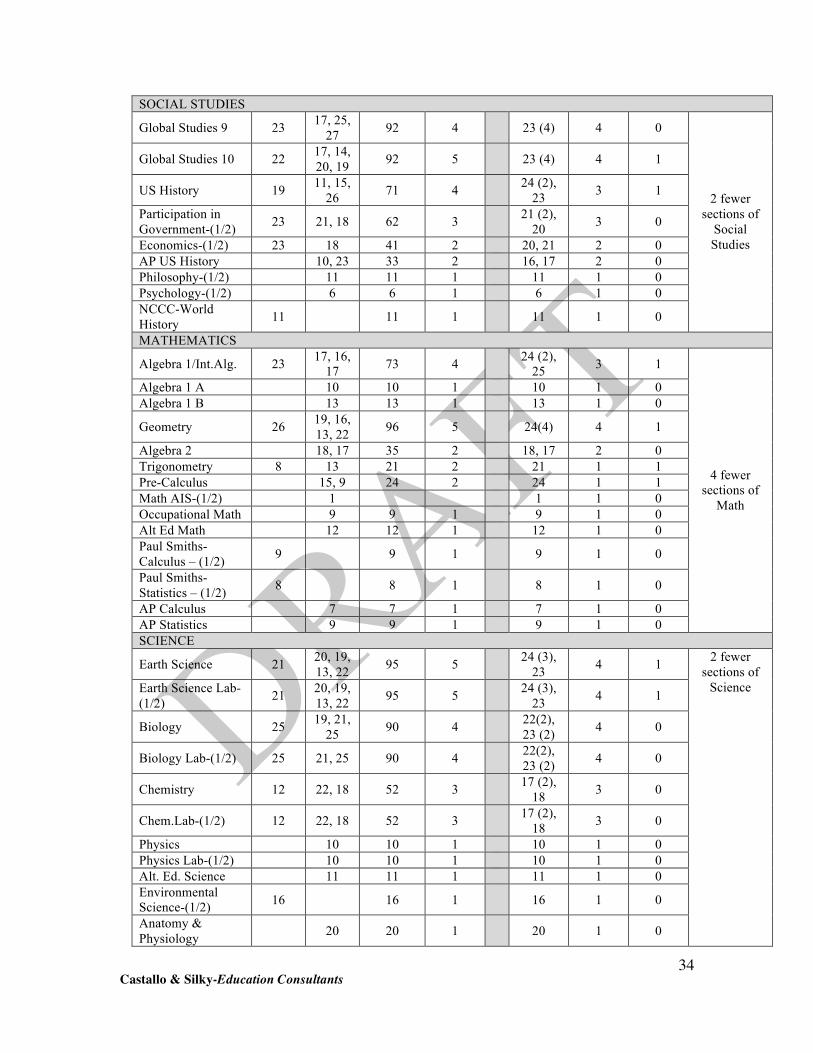
Table 3.22 High School Curriculum Offerings-2012-13 (Maximum Class Size of 25)
Course CP TI No. of Students
No. of Sections Merged
District No. of
Sections
No. of Fewer
Sections
Net Reduction in
Sections ENGLISH
English 9 23 (1.5)
10, 17, 22, 18 90 5.5 22 (2),
23 (2) 4 1.5
English 10 23 20, 17, 18, 18 96 5 24 (4) 4 1
English 11 18 32 50 2 25 (2) 2 0
English 12 22 23, 22 67 3 22 (2), 23 3 0
Alt. Ed. English 11 11 1 11 1 0 AP English Language 19, 19 38 2 19 (2) 2 0
AP English Lit/Comp 11 11 1 11 1 0
NCCC-App. for Literature (1/2) 7 7 1 7 1 0
Comp. Lit – (1/2) 23 23 1 23 1 0
2.5 fewer sections of
English
Castallo & Silky-Education Consultants
34
SOCIAL STUDIES
Global Studies 9 23 17, 25, 27 92 4 23 (4) 4 0
Global Studies 10 22 17, 14, 20, 19 92 5 23 (4) 4 1
US History 19 11, 15, 26 71 4 24 (2),
23 3 1
Participation in Government-(1/2) 23 21, 18 62 3 21 (2),
20 3 0
Economics-(1/2) 23 18 41 2 20, 21 2 0 AP US History 10, 23 33 2 16, 17 2 0 Philosophy-(1/2) 11 11 1 11 1 0 Psychology-(1/2) 6 6 1 6 1 0 NCCC-World History 11 11 1 11 1 0
2 fewer sections of
Social Studies
MATHEMATICS
Algebra 1/Int.Alg. 23 17, 16, 17 73 4 24 (2),
25 3 1
Algebra 1 A 10 10 1 10 1 0 Algebra 1 B 13 13 1 13 1 0
Geometry 26 19, 16, 13, 22 96 5 24(4) 4 1
Algebra 2 18, 17 35 2 18, 17 2 0 Trigonometry 8 13 21 2 21 1 1 Pre-Calculus 15, 9 24 2 24 1 1 Math AIS-(1/2) 1 1 1 0 Occupational Math 9 9 1 9 1 0 Alt Ed Math 12 12 1 12 1 0 Paul Smiths-Calculus – (1/2) 9 9 1 9 1 0
Paul Smiths-Statistics – (1/2) 8 8 1 8 1 0
AP Calculus 7 7 1 7 1 0 AP Statistics 9 9 1 9 1 0
4 fewer sections of
Math
SCIENCE
Earth Science 21 20, 19, 13, 22 95 5 24 (3),
23 4 1
Earth Science Lab-(1/2) 21 20, 19,
13, 22 95 5 24 (3), 23 4 1
Biology 25 19, 21, 25 90 4 22(2),
23 (2) 4 0
Biology Lab-(1/2) 25 21, 25 90 4 22(2), 23 (2) 4 0
Chemistry 12 22, 18 52 3 17 (2), 18 3 0
Chem.Lab-(1/2) 12 22, 18 52 3 17 (2), 18 3 0
Physics 10 10 1 10 1 0 Physics Lab-(1/2) 10 10 1 10 1 0 Alt. Ed. Science 11 11 1 11 1 0 Environmental Science-(1/2) 16 16 1 16 1 0
Anatomy & Physiology 20 20 1 20 1 0
2 fewer sections of
Science

Castallo & Silky-Education Consultants
35
Forensics-(1/2) 22 22 1 22 1 0 AP Biology 6 6 1 6 1 0 AP Biology Lab-(1/2) 6 6 1 6 1 0
NCCC-Concepts of Wellness (1/2) 21 21 1 21 1 0
LANGUAGES OTHER THAN ENGLISH Spanish 1 17 5 22 2 22 1 1 Spanish 2 22 18 40 2 20 (2) 2 0 Spanish 3 16 15 31 2 16, 15 2 0 Spanish 4 6 6 1 6 1 0 SUNY-Spanish 103 10 10 1 10 1 0
SUNY-Spanish 104 9 9 1 9 1 0
French 2 16, 14 30 2 15 (2) 2 0 French 3 12, 10 22 2 22 1 1 NCCC-French 101 8 8 1 8 1 0 NCCC-French 102 2 2 1 2 1 0
1 less section of Spanish; 1 less section of French
BUSINESS Career &Financial Management-(1/2) 23 17 40 2 20 (2) 2 0
Finance 6 6 1 6 1 0 NCCC-Accounting 17 17 1 17 1 0 NCCC-Bus. 101 Acct I 11 11 1 11 1 0
Bus. 102/Acct II 7 7 1 7 1 0 Comp Info Systems-NCC 11 11 1 11 1 0
Same number of Business sections
TECHNOLOGY Intro to Tech 7 7 1 7 1 0 Basic Woodshop 8 8 1 8 1 0 Marine Technology 10, 10 20 2 20 1 1 Woods-(1/2) 11 11 1 11 1 0 Rustic Furniture-(1/2) 6, 2 8 2 8 1 1
Construction-(1/2) 1 1 1 1 1 0 Transportation Systems – (1/2) 8 8 1 8 1 0
Structures-(1/2) 7 7 1 7 1 0
2 fewer sections of
Tech
HOME AND CAREER SKILLS Gourmet Foods-(1/2) 12 12 1 12 1 0
Food & Nutrition-(1/2) 10 10 1 10 1 0
Early Childhood 12 12 1 12 1 0
Same number of
H&C sections
HEALTH Health-(1/2) 22 12, 14 48 3 24 (2) 2 1 Stress Management (1/2) 16 16 1 16 1 0
1 less section of
Health ART Mixed Media-Art 1-(1/2) 30 30 1 15 (2) 2 +1 1 more
section of
Castallo & Silky-Education Consultants
36
Studio Art 18 18 1 18 1 0 Studio Drawing & Painting-(1/2) 20 25 45 2 23, 22 2 0
General Art-(1/2) 20, 11 31 2 15, 16 2 0 Sculpture -(1/2) 12 12 1 12 1 0
Art
MUSIC Band-(1/2) 12 40 52 2 52 1 1 Orchestra-(1/3) 10 10 1 10 1 0 Popular Guitar 3 3 1 3 1 0 Music Technology 9 9 1 9 1 0 Chorus-(1/2) 1 77 78 2 78 1 1
2 fewer sections of
Music
PHYSICAL EDUCATION
Phys Ed-(1/2)
8, 11, 7, 18,
19, 18, 16
16, 18, 14, 31, 27, 17, 23, 23, 19, 25
310 17 24 (12), 22 13 4
Dance-(1/2) 25 25 1 25 1 0
4 fewer sections of Physical
Education
OTHER
Drivers Ed-Car 4, 4, 4, 4 16 4 4 (4) 4 0
Drivers Ed-Class-(1/2) 16 16 1 16 1 0
Ti TV 5, 4 9 2 9 1 1
1 less section of
Ti TV
AIS and Study Halls (Maximum size in AIS classes is 15)
AIS 8
1, 4, 5, 5, 4, 9, 1, 4, 4, 1, 5, 3, 2, 8, 3, 19, 12, 4, 1, 1, 7, 4, 2
117 24 15 (5), 14 (3) 8 16
16 fewer sections of
AIS
Study Halls/Academic Labs
20, 16, 9, 10, 6, 13, 10, 9,
35, 16, 16, 21, 11, 16
16, 22, 16, 18, 19, 16, 5, 20,
25, 17, 23, 22, 18, 12,
19
6 29 24 (19), 20 20 9
9 fewer sections of Study Hall
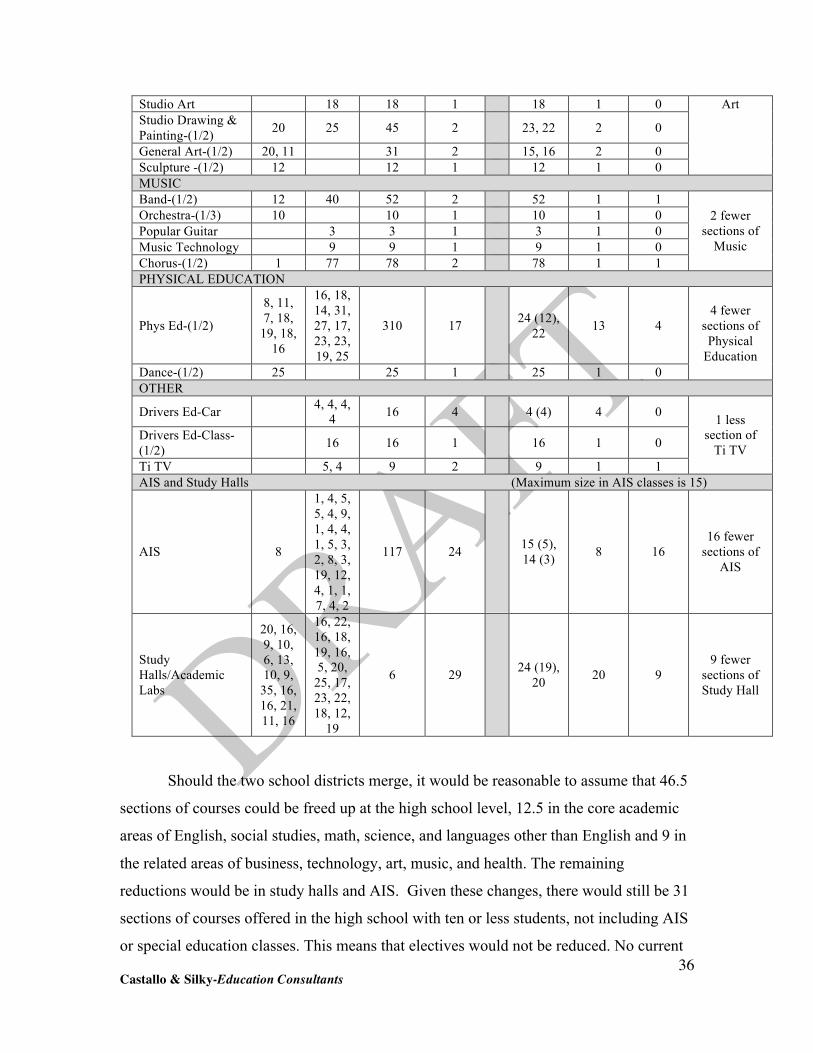
Should the two school districts merge, it would be reasonable to assume that 46.5
sections of courses could be freed up at the high school level, 12.5 in the core academic
areas of English, social studies, math, science, and languages other than English and 9 in
the related areas of business, technology, art, music, and health. The remaining
reductions would be in study halls and AIS. Given these changes, there would still be 31
sections of courses offered in the high school with ten or less students, not including AIS
or special education classes. This means that electives would not be reduced. No current

Castallo & Silky-Education Consultants
37
courses would be eliminated. The number of section reductions is summarized in table
3.23 that follows.
Table 3.23 Number of Middle and High School Section Reductions by Subject Area
(Maximum of 25 Students Per Section) Middle School High School Total
English 1 2.5 3.5 Social Studies 1 2 3
Math 1 4 5 Science 1 2 3
Spanish/French 2 2 4 Business - - 0
Home and Careers - - 0 Technology 0 3 3
Art 0 +1 -1 Music 0 2 2 Health - 1 1
Physical Education 4 4 8 Study Halls +1 9 8
AIS 3 16 19 Total 12 46.5 58.5
Both districts have a solid program in the core areas of English, math, science,
and social studies for districts of their size. A fair number of elective courses are
available in the core areas in both districts although some of them have small
enrollments. Spanish is offered for three years at Crown Point. Both Spanish and French
are offered for five years at Ticonderoga, with the last two years being offered for college
credit. The technology area has a fair number of offerings in both districts. Crown Point
offers a variety of courses including rustic woods, construction, transportation, and
structures while Ticonderoga offers courses in marine technology, woodshop and
introduction to technology. The enrollments in these courses are lower than the
enrollments in the core academic areas and may be impacted as financial constraints
force districts to more closely examine courses with lower enrollments. The observations
that are made about the technology offerings in the two districts could also be made about
the business and art electives that currently exist.
Castallo & Silky-Education Consultants
38
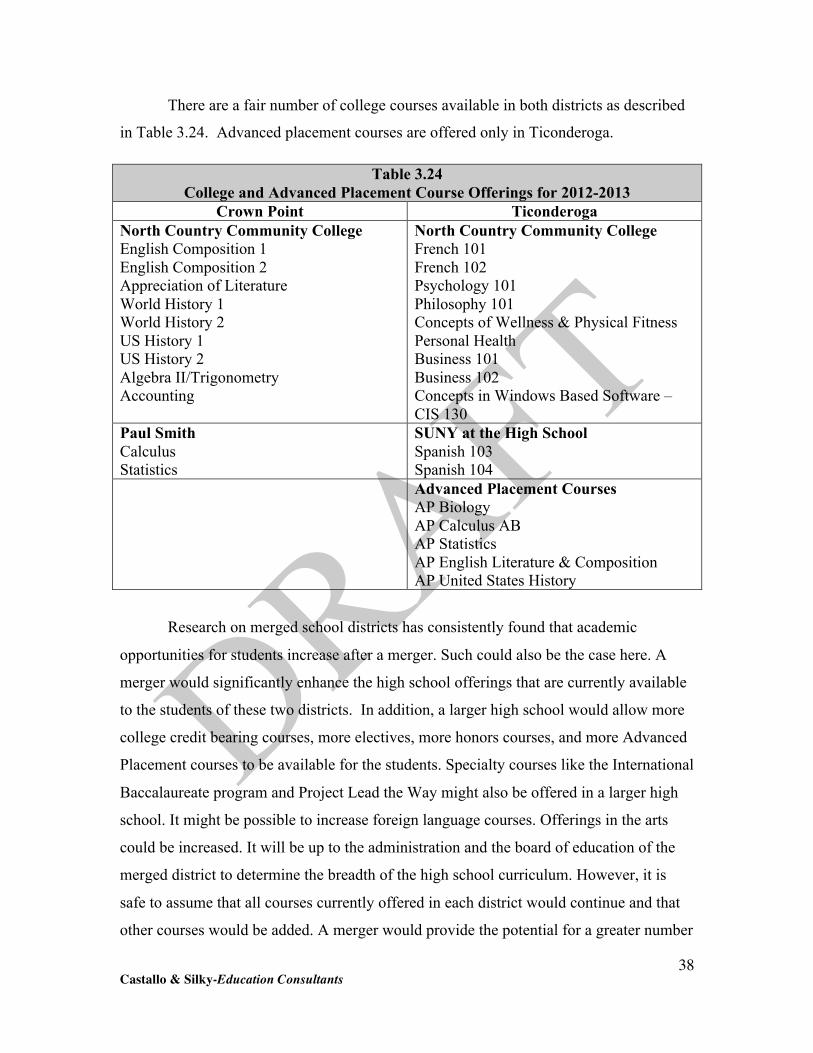
There are a fair number of college courses available in both districts as described
in Table 3.24. Advanced placement courses are offered only in Ticonderoga.
Table 3.24 College and Advanced Placement Course Offerings for 2012-2013
Crown Point Ticonderoga North Country Community College
• English Composition 1 • English Composition 2 • Appreciation of Literature • World History 1 • World History 2 • US History 1 • US History 2 • Algebra II/Trigonometry • Accounting
North Country Community College • French 101 • French 102 • Psychology 101 • Philosophy 101 • Concepts of Wellness & Physical Fitness • Personal Health • Business 101 • Business 102 • Concepts in Windows Based Software –
CIS 130 Paul Smith
• Calculus • Statistics
SUNY at the High School • Spanish 103 • Spanish 104
Advanced Placement Courses • AP Biology • AP Calculus AB • AP Statistics • AP English Literature & Composition • AP United States History
Research on merged school districts has consistently found that academic
opportunities for students increase after a merger. Such could also be the case here. A
merger would significantly enhance the high school offerings that are currently available
to the students of these two districts. In addition, a larger high school would allow more
college credit bearing courses, more electives, more honors courses, and more Advanced
Placement courses to be available for the students. Specialty courses like the International
Baccalaureate program and Project Lead the Way might also be offered in a larger high
school. It might be possible to increase foreign language courses. Offerings in the arts
could be increased. It will be up to the administration and the board of education of the
merged district to determine the breadth of the high school curriculum. However, it is
safe to assume that all courses currently offered in each district would continue and that
other courses would be added. A merger would provide the potential for a greater number

Castallo & Silky-Education Consultants
39
of options than would otherwise exist in either of the two individual high schools in the
future.
In addition to the courses listed in Table 3.22 high school students from both
districts have access to a wide array of Career and Technical Education courses from the
Clinton-Essex BOCES. Table 3.25 which follows shows the number of students from
each of the districts who are currently taking CTE courses at their BOCES.
Table 3.25 Enrollment in BOCES Career & Technical Education Courses-2012-13
Crown Point Ticonderoga
Junior Class No. of Students in Class 18 76
No. of students in BOCES CTE 7 12
Senior Class No. of Students in Class 23 62
No. of Students in BOCES CTE 9 6
Total No. of Juniors and Seniors in BOCES
CTE Courses 16 of 41 18 of 138
% of Juniors & Seniors in BOCES CTE Courses 39.0% 13.0%
The difference in the percentage of juniors and seniors in BOCES may be
reflective of the number of electives offered in each school district or the philosophy of
the administration or guidance staff.
As with the elementary and middle school student performance summaries, we
now turn to examine high school student performance on New York State Regents
examinations. Table 3.26 that follows provides this data for all students.

Castallo & Silky-Education Consultants
40
Table 3.26 High School Regents Exam Performance-All Students
No. Tested % at or above 55%
% at or above 65%
% at or above 85% Regents
Examination Year CP TI CP TI CP TI CP TI
09-10 21 78 90% 97% 76% 96% 10% 38%
10-11 23 82 96% 96% 91% 91% 30% 28% English 11-12 48 74 96% 88% 85% 84% 6% 21%
09-10 26 69 92% 96% 85% 88% 12% 14%
10-11 22 66 82% 94% 73% 86% 18% 9% Integrated
Algebra 11-12 25 73 88% 99% 84% 92% 4% 15%
09-10 10 34 60% 97% 60% 97% 30% 82%
10-11 2 35 0% 100% 0% 97% 0% 71% Algebra 2/
Trigonometry 11-12 13 41 77% 100% 69% 95% 23% 46%
09-10 23 62 96% 94% 87% 81% 17% 24%
10-11 1 51 0% 96% 0% 90% 0% 39% Geometry 11-12 22 39 64% 100% 55% 95% 14% 46%
09-10 24 83 100% 92% 100% 86% 46% 30%
10-11 27 63 93% 87% 85% 78% 33% 24% Global History 11-12 18 78 100% 85% 100% 77% 39% 31%
09-10 21 78 100% 91% 100% 87% 52% 49%
10-11 20 82 100% 91% 100% 83% 65% 34% US History 11-12 24 58 100% 91% 96% 79% 63% 40%
09-10 24 65 92% 94% 83% 85% 25% 32%
10-11 27 40 93% 98% 74% 78% 22% 28% Living
Environment 11-12 24 75 88% 97% 58% 93% 8% 37%
09-11 22 79 100% 89% 95% 78% 18% 27%
10-11 24 62 92% 84% 75% 69% 25% 18% Earth Science 11-12 21 74 67% 88% 48% 73% 19% 38%
09-10 14 48 71% 85% 21% 69% 0% 0%
10-11 6 29 67% 97% 50% 62% 0% 10% Chemistry 11-12 17 28 71% 82% 47% 61% 0% 11%
09-10 6 3 100% 0% 83% 0% 17% 0%
10-11 - 15 - 73% - 60% - 13% Physics 11-12 - 22 - 67% - 59% - 18%
09-10 14 26 93% 96% 50% 92% 7% 15%
10-11 6 16 83% 100% 67% 100% 0% 31% Spanish 11-12
At this point in the report, we have examined student performance on elementary,
middle, and high school assessments. Like in the elementary school and in the middle
school, comparing student performance results across both districts yields very similar

Castallo & Silky-Education Consultants
41
results. Again, there are exams in various years where students in Crown Point outscored
their counterparts in Ticonderoga. However, in other years and with other exams, the
opposite is true. In short, student performance on high school Regents examinations have
been similar and should not be an issue should the high schools decide to merge.
We now examine the types of diplomas that graduates of each high school
receive. Table 3.27 that follows looks at the data for those graduates.
Table 3.27 Diplomas Received By Graduates
Year Diploma Type Crown Point Ticonderoga Total Graduates 75% 82%
Regents Diploma 20% 35% Advanced Regents Diploma 50% 41%
IEP Diploma 0% 2% Dropped Out 13% 8%
Entered GED Program 0 0
20091
Still Enrolled 13% 9%
Total Graduates 72% 82% Regents Diploma 28% 38%
Advanced Regents Diploma 38% 38% IEP Diploma 3% 3% Dropped Out 10% 14%
Entered GED Program 10% 0%
20102
Still Enrolled 3% 7%
Total Graduates 85% 84% Regents Diploma 40% 36%
Advanced Regents Diploma 35% 40% IEP Diploma 0% 1% Dropped Out 5% 13%
Entered GED Program 0% 0%
20113
Still Enrolled 10% 3%
Total Graduates 83% 81% Regents Diploma 39% 36%
Advanced Regents Diploma 35% 38% IEP Diploma 0% 0% Dropped Out 4% 13%
Entered GED Program 0% 0
20124
Still Enrolled 13% 6%

Castallo & Silky-Education Consultants
42
1Based on a 6 year graduation outcome 2Based on a 5 year graduation outcome 3 & 4Based on a 4 year graduation outcome
As can be seen in table 3.27 above, the percentage of students who complete high
school and earn a diploma is very similar in both districts. However, since 2010, the
percentage of students who drop out has been consistently higher in Ticonderoga than it
has been in Crown Point.
Measuring students’ plans after high school also provides insight into the
effectiveness of the high school programs. Table 3.28 provides some data on students’
plans after graduation.
Table 3.28 Post-Graduate Follow Up
2007-2008 2008-2009 2009-2010 2010-2011 2011-2012 CP TI CP TI CP TI CP TI CP TI
4-year College 9 27 9 42 8 21 1 22 8 19 2-year College 8 21 9 31 8 21 11 25 7 28 Technical/Vocational 3 0 0 5 1 6 2 4 2 1 Military 0 7 0 3 0 4 1 6 0 7
Total # of Graduates 29 68 19 92 21 59 21 69 22 68 Percentage Continuing 70% 80% 95% 88% 81% 88% 71% 82% 77% 80%
As can be seen in table 3.28 above, while there is variation from year to year as to
the percentage of students attending college or entering the military, overall there is little
difference between the two districts.
An important aspect of any student’s high school education is the availability of
extra-curricular opportunities to offer a well-rounded education. Consequently, we now
turn to student athletic and extra-curricular opportunities currently available to the high
school students. Table 3.29 that follows shows the athletic opportunities that are currently
available to the students of the two study districts as well as the level of participation in
each of these sports.
Castallo & Silky-Education Consultants
43
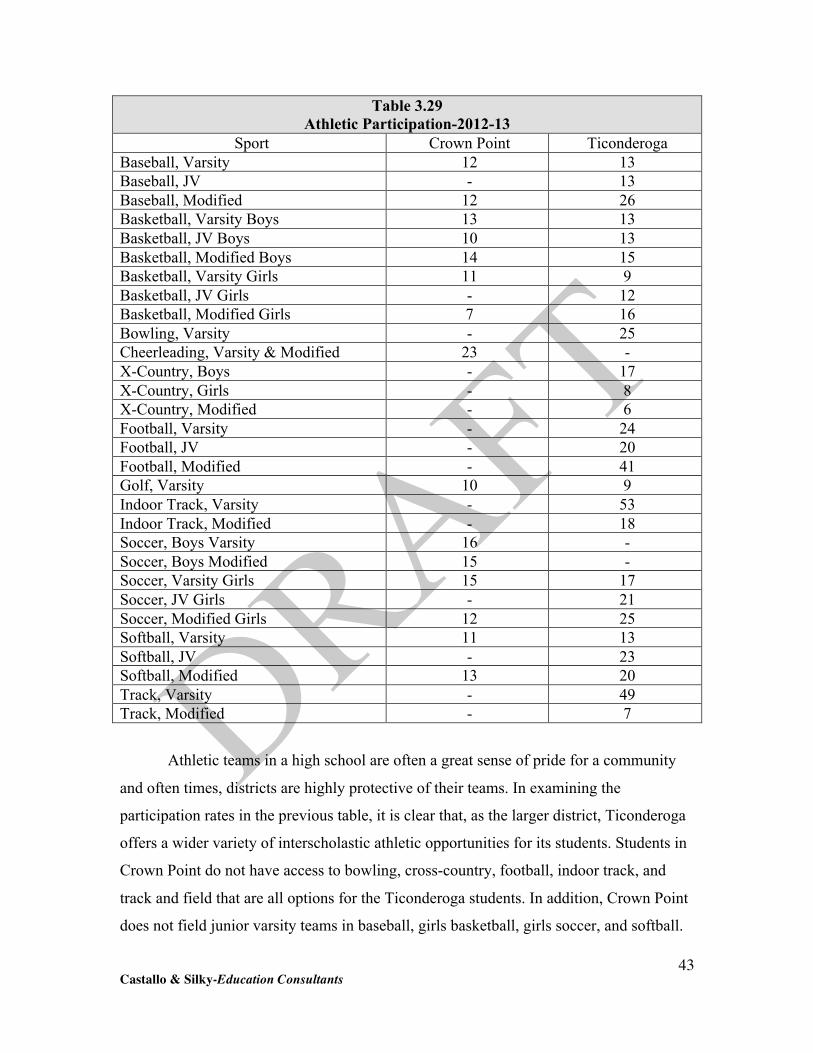
Table 3.29 Athletic Participation-2012-13
Sport Crown Point Ticonderoga Baseball, Varsity 12 13 Baseball, JV - 13 Baseball, Modified 12 26 Basketball, Varsity Boys 13 13 Basketball, JV Boys 10 13 Basketball, Modified Boys 14 15 Basketball, Varsity Girls 11 9 Basketball, JV Girls - 12 Basketball, Modified Girls 7 16 Bowling, Varsity - 25 Cheerleading, Varsity & Modified 23 - X-Country, Boys - 17 X-Country, Girls - 8 X-Country, Modified - 6 Football, Varsity - 24 Football, JV - 20 Football, Modified - 41 Golf, Varsity 10 9 Indoor Track, Varsity - 53 Indoor Track, Modified - 18 Soccer, Boys Varsity 16 - Soccer, Boys Modified 15 - Soccer, Varsity Girls 15 17 Soccer, JV Girls - 21 Soccer, Modified Girls 12 25 Softball, Varsity 11 13 Softball, JV - 23 Softball, Modified 13 20 Track, Varsity - 49 Track, Modified - 7
Athletic teams in a high school are often a great sense of pride for a community
and often times, districts are highly protective of their teams. In examining the
participation rates in the previous table, it is clear that, as the larger district, Ticonderoga
offers a wider variety of interscholastic athletic opportunities for its students. Students in
Crown Point do not have access to bowling, cross-country, football, indoor track, and
track and field that are all options for the Ticonderoga students. In addition, Crown Point
does not field junior varsity teams in baseball, girls basketball, girls soccer, and softball.

Castallo & Silky-Education Consultants
44
Not having a junior varsity program may mean that students are pushed to the varsity
level before they are really ready to compete at that level. On the other hand, the students
in Ticonderoga do not have a boys soccer program that is enjoyed by the Crown Point
students.
A further examination of this table reveals relatively low participation rates in a
number of sports in both districts. Having 12 students on a baseball team, 20 students on
a football team, and 11 students on a softball team should raise concern for the future.
These participation numbers are close to the point of jeopardizing the continuation of
these athletic teams into the future.
There will be changes in the interscholastic athletic program should a merger
occur. First, with a combination of teams, it could reasonably be assumed that current
athletic teams would be stabilized and that these opportunities would continue to exist for
students into the future. Current students in Ticonderoga will have access to their sports
as well as the sports in Crown Point. Current Crown Point students will have access to
their sports as well as the sports in Ticonderoga. Junior varsity opportunities for students
will increase. Second, in a merged high school, there will be fewer students playing some
sports than currently play in Crown Point and Ticonderoga. For example, there are
currently two boys basketball teams and two girls basketball teams; after a merger, it is
reasonable to assume that there would be one of each. This could be viewed as a negative
aspect of a merger. However, students who will no longer be playing on these teams will
be available to play other sports and those opportunities will exist. The increased
enrollment at the high school will also provide the opportunity to start additional athletic
teams. Perhaps there will be enough students to have volleyball, lacrosse, ice hockey
and/or wrestling teams at the merged high school.
Table 3.30 that follows presents a summary of the clubs and extracurricular
activities offered for the high school students in 2011-12.

Castallo & Silky-Education Consultants
45
Table 3.30 Club Participation-2012-13
Club Crown Point Ticonderoga Academic Bowl 11 22 Art Club - 11 Drama Club/School Play 14 27 FBLA - 14 Family Community Career Leaders of America 8 10 Foreign Language Club - 20 Journalism 13 - Key Club - 16 National Honor Society 18 40 Night Shadows Musical Group - 22 Quiz Bowl 18 - S.A.D.D. 23 - Sentinel Big Band - 25 Student Council/Student Voice 14 10 Varsity Club 25 - Yearbook 25 12 Youth & Government - 18
In analyzing table 3.30 above, it is apparent that the students in both high schools
have a reasonable number of opportunities to participate in extra-curricular activities.
Most districts are usually willing to start any club in which there is sufficient student
interest and a faculty advisor can be secured. Districts find clubs much more affordable
than interscholastic athletics and much easier to administer. Should a merger of the
districts occur, students, faculty, and the board will determine which clubs will or will not
continue. It is safe to assume, however, that students in the merged high school would
have access to all of the clubs that currently exist in either high school. It can also be
predicted that having more students in the middle school and in the high school in a
merged district will create more opportunities for students to participate in clubs and
other extra-curricular activities.
Finally, it is important to have an understanding of the special education program
in each school district. Table 3.31 that follows summarizes the number of special needs
students in Crown Point and Ticonderoga, by disability, for the past two academic years.
A considerable amount of information can be gleaned from studying this table. For
example, New York State typically has a goal for school districts to have no more than

Castallo & Silky-Education Consultants
46
12% of their total student population identified as in need of special education services.
However, while this may be a laudable state goal, the identification of students with
special needs is a process that varies greatly from district to district for a variety of
reasons, one of which may be the philosophy of the district’s Committee on Special
Education and/or Committee on Pre-School Special Education. Crown Point’s special
education students represent 18.2% of the total district enrollment in 2010-11 and 14.4%
in 2011-12. In these same two years, Ticonderoga identified special needs students are
13.7% and 15.6% for 2010-01 and 2011-12 respectively. Over time, the percentage of
students with disabilities has varied at numbers slightly higher than the state but not
significantly different from each other. Like all districts, special needs students are
predominantly classified as either learning disabled or other health impaired in Crown
Point and Ticonderoga. Generally speaking, the majority of “other health impaired”
includes students who have been classified because of an attention deficit disorder.
Neither district has an inordinately large percentage of severely disabled students.
Table 3.31 Special Education Students by Disability-2011-12 and 2012-13
Disability Crown Point
2010-11 Crown Point
2011-12 Ticonderoga
2010-11 Ticonderoga
2011-12 Autism 4 4 6 6 Emotional Disturbance 0 0 8 6 Learning Disability 15 8 49 45 Intellectual Disability 0 0 3 3 Deafness 0 0 0 0 Hearing Impairment 0 1 1 1 Speech Impairment 8 9 27 23 Visual Impairment 0 0 2 2 Orthopedic Impairment 0 0 0 0 Other Health Impairment 19 15 32 36 Multiple Disabilities 4 3 6 4 Deaf-Blindness 0 0 0 0 Traumatic Brain Injury 0 0 0 0 Totals 50 40 134 126 % -Total Students 18.2% 14.4% 13.7% 15.6%
In addition to looking at the numbers of students with disabilities, it is often
helpful to review the teaching models and programs that are provided for students with
disabilities. As Table 3.32 below indicates, both districts use resource room and
consultant teacher models for the majority of their students with disabilities.

Castallo & Silky-Education Consultants
47
Ticonderoga has recently established an 8:1:1 class for primary students with
autism, allowing them to serve some students who had previously been in programs
outside of the district. There are 6 students whose needs can not be currently met in
Ticonderoga programs and are served at the BOCES. Crown Point has relied on BOCES
classrooms for students with disabilities whose needs cannot be served within the district.
Table 3.32 Special Education
Crown Point Ticonderoga
Teaching Models Resource Room and Consultant Teacher
Resource Room and Consultant Teacher
8-1-1 Classes 1 Primary Classroom Students educated at other locations
15 students at BOCES 6 students at BOCES
If the districts merge, a new Committee on Special Education and Committee on
Pre-School Special Education will be formed. There may be some philosophical
differences that will have to be addressed to bring consistency in student identification,
interventions, programming, and placement, but we do not see this as a major obstacle.

Castallo & Silky-Education Consultants
48
Chapter 4 Facilities
The construction, maintenance, and enhancement of educational facilities are
extremely important functions for school leaders. Capital costs to construct school
facilities are significant. Housing children in safe and healthy facilities that are
conducive to learning is an ongoing challenge. The physical structures in school districts
have a great deal to do with the way that grades are aligned and programs are delivered.
This section of the report will provide an overview of the current facilities that each
district owns, how they are used, a general analysis of their conditions, and implications
should a merger occur.
Instructional space in Crown Point is provided in one building while Ticonderoga
houses its students in two different buildings on two separate campuses; a Pre-K-8
elementary-middle school and a 9-12 high school. An overview of the Crown Point and
Ticonderoga Central School buildings is provided in the following table. The data for this
table was taken from the building condition survey that is required of all school buildings
every five years and is conducted by each district’s architectural firm.
Table 4.1 Overview of Crown Point and Ticonderoga School Buildings
Schools Crown Point Ticonderoga High School
Ticonderoga Elementary/Middle
School
Address 2758 Main St. Crown Point
5 Calkins Place Ticonderoga
116 Alexandria Ave Ticonderoga
Year of Original Building 1928 1928 1966 Sq. Ft. in Current Building 80,227 85,900 100,000
Number of Floors 3 3 1 Grades Housed Pre-K-12 9-12 Pre-K-8
Students Served this year 254 290 540 Number of Instructional
Classrooms 27 17 35
Rating of Space Adequacy (Good/Fair/Poor) Good (300) Fair (373) Good (619)
Overall Building Rating (E/S/U/F) Excellent Satisfactory Satisfactory
Architect AES Northeast W-P-S Consulting
W-P-S Consulting Engineers

Castallo & Silky-Education Consultants
49
Engineers NOTE: 1-All information was taken from the most recent NYS Building Conditions Survey except the enrollments that were drawn from the 2012-13 academic year database.
In rating the overall condition of the buildings, architects use a continuum of
Excellent – Satisfactory – Unsatisfactory – Failing. As can be seen in Table 4.1 above, all
three school buildings are rated as either Excellent or Satisfactory.
In addition to rating the overall condition of the buildings, architects also rate a
number of systems within the buildings. These systems include site utilities, pavement,
electrical, plumbing, water, air handling, and a number of other systems usually found in
school buildings. The rating for these systems follows a continuum of Excellent –
Satisfactory – Unsatisfactory – Non-Functioning. All of the systems in all three buildings
were rated as Excellent or Satisfactory with the exception of the following items in the
Ticonderoga Elementary/Middle School.
Table 4.2 Systems in Ticonderoga Elementary/Middle School Rated As Unsatisfactory
Item Estimated Cost to Remediate Replace asphalt at main parking lot $270,000
Replacement of lockers $140,000 Plumbing-water booster system $66,000
Plumbing-correct drainage in kitchen and locker rooms $310,000 TOTAL $786,000
After the completion of the building condition survey, a major capital project was
completed at Ticonderoga that dealt with all of the issues listed above in table 4.2.
In addition to the districts’ instructional buildings, each district has its own bus
garage. Table 4.3 that follows provides an overview of these bus garages.
Table 4.3 Overview of Crown Point and Ticonderoga Bus Garages Schools Crown Point Ticonderoga
Address 2758 Main St. Crown Point
104 Alexandria Ave Ticonderoga
Year of Original Building 2001 1969 Sq. Ft. in Current Building 8,334 8,600
Number of Floors 1 1

Castallo & Silky-Education Consultants
50
Recent Capital Improvements None
Added booster pump to domestic hot water
system; added fire alarm system
Rating of Space Adequacy (Good/Fair/Poor) Good Fair
Overall Building Rating (E/S/U/P) Excellent Satisfactory
Architect AES Northeast W-P-S Consulting Engineers
NOTE: All information was taken from the most recent NYS Building Conditions Survey except the enrollments that were drawn from the 2012-13 academic year data base.
In analyzing the systems inside the bus garages, all systems were rated Excellent
or Satisfactory with the exception of the Ticonderoga bus garage where the following
items were cited.
Table 4.4 Systems in Ticonderoga Bus Garage Rated As Unsatisfactory
Item Estimated Cost to Remediate Replace paving and provide additional paving $450,000
Add fire alarm system and connect to elementary school $10,000 TOTAL $460,000
As with the instructional buildings, the capital project that was recently completed
at Ticonderoga dealt with both of the issues listed in table 4.4 above. Both districts have
undertaken significant capital project work fairly recently. Neither district has any current
capital projects in the planning.
The second major consideration with respect to facilities is exploring the available
space and how it might be used should a merger occur. It is recommended that the current
grade configuration currently in place in Ticonderoga be maintained. This would result in
a merged school district with a grade configuration of Pre-K-5, 6-8, and 9-12. Student
enrollment projections performed earlier in this report show the past and future
enrollments for a merged school district to be as shown in the following table 4.5.
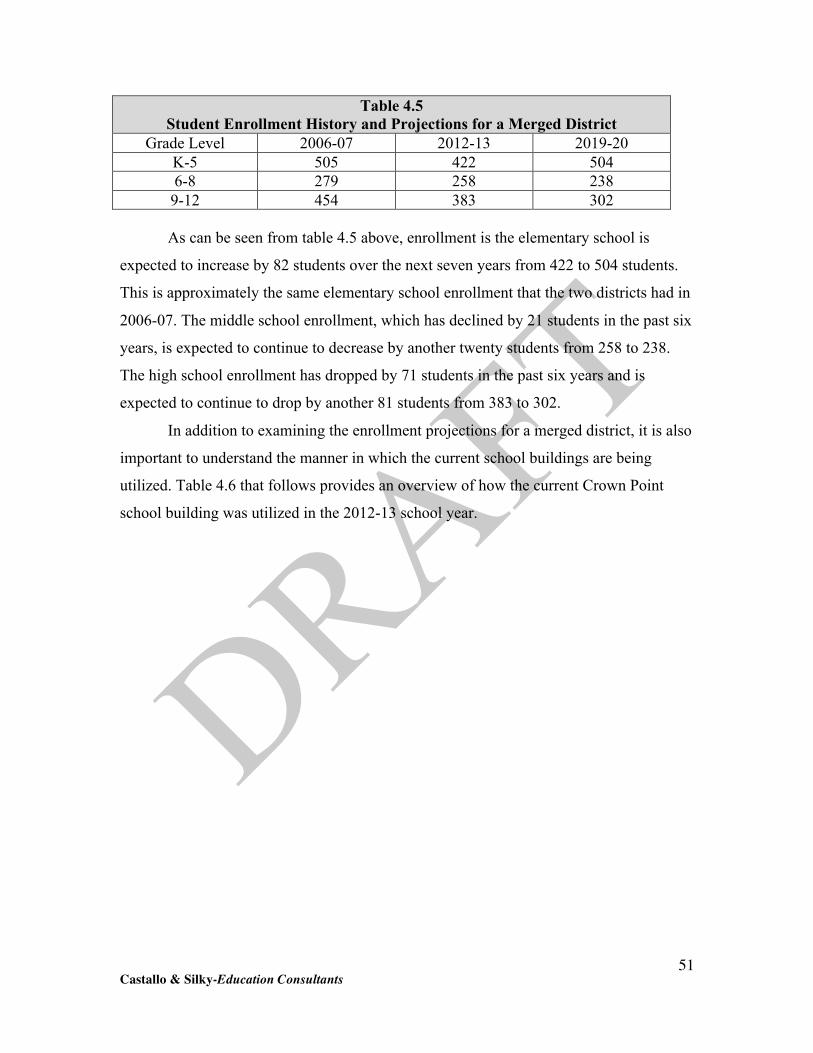
Castallo & Silky-Education Consultants
51
Table 4.5 Student Enrollment History and Projections for a Merged District
Grade Level 2006-07 2012-13 2019-20 K-5 505 422 504 6-8 279 258 238 9-12 454 383 302
As can be seen from table 4.5 above, enrollment is the elementary school is
expected to increase by 82 students over the next seven years from 422 to 504 students.
This is approximately the same elementary school enrollment that the two districts had in
2006-07. The middle school enrollment, which has declined by 21 students in the past six
years, is expected to continue to decrease by another twenty students from 258 to 238.
The high school enrollment has dropped by 71 students in the past six years and is
expected to continue to drop by another 81 students from 383 to 302.
In addition to examining the enrollment projections for a merged district, it is also
important to understand the manner in which the current school buildings are being
utilized. Table 4.6 that follows provides an overview of how the current Crown Point
school building was utilized in the 2012-13 school year.

Castallo & Silky-Education Consultants
52
Table 4.6 Utilization of Crown Point School-2012-13
Building Has a Full-Size Art Room, Music Room, Library,
Auditorium, Offices, Cafeteria, and Gymnasium that are Independent of the Count of Full-Size Classrooms Below
School Building
No. of Full-Size
Rooms
No. of Classes (21)
Other Usage of Full-Size Rooms
Usage of Small Rooms, Not Full-Size, Other Than Administration, Guidance, CSE, Nurse, and Custodian
Crown Point
School
24 Pre-K-1 K-1 1-1 2-1 3-1 4-1 5-1 6-1
English-2 Soc Stud-1
Math-1 Science-1
Business-1 Home Ec.-1
Tech-1 Computer-1
AIS-2 Sp. Ed.-2
Fitness Room-1 Extra-2 (On 2nd floor labeled as
English and Science)
Speech Athletic Director
OT and AIS
Similarly, table 4.7 that follows depicts the utilization of the school buildings in
Ticonderoga for the 2012-13 school year.

Castallo & Silky-Education Consultants
53
Table 4.7 Ticonderoga Classroom Usage-2012-13
Middle School has a Full-Size Art Room, Music Room, Library, and Offices;
Elementary School has a Full Size Art Room, Music Room, Library, and Offices; Gymnasium, Fish Bowl (Multi-Purpose Room) and Cafeteria are Shared. These
Rooms are Independent of the Count of Classrooms Below
School Building
No. of Full-Size
Rooms
No. of Classes
Other Usage of Full-Size Rooms
Usage of Small Rooms, Not Full-Size, Other Than Administration, Guidance, CSE, Nurse, Storage, and
Custodian
Ticonderoga High School 35
English-4 Soc Stud-4
Math-4 Science-4 Spanish-1 French-1 Health-1 Sp. Ed.-3
Study Hall-1 ISS-1
Ti TV-1 Computer Lab-2 Testing Area-1
Teachers Room-1 Weight Room-1 Planetarium-1
Home Ec-1 Tech-3
AIS-1 Server Room-1
Conference Room-1 Records Room-1
Admin. Conference-1
Ticonderoga Middle School
18
English-3 Soc Stud-2
Math-3 Science-3 Spanish-1 French-1
Computer-1 Shop-1
Resource-2 Home Ec-1
Ticonderoga Elementary
School 31
Pre-K-1 Young 5-1
K-3 1-3 2-3 3-3 4-2 5-2
Sp. Ed.-4
AIS-1 Comm. Dev.-1
Computer Lab-1 OT/PT-1
Psychologist-1 Reading-1 Speech-1
Work Room-1 Vacant-1
Teachers Room-1 Fitness Room-1
In addition to identifying the types of classrooms in all of the schools, an analysis
was also made of the extent to which both the middle school and the high school rooms
were being utilized. Table 4.8 that follows is the middle school room utilization for the
current Ticonderoga Middle School.

Castallo & Silky-Education Consultants
54
Table 4.8 Ticonderoga Middle School Classroom Usage-2012-13
Period Room 1 2 3 4 5 6 7 8 9 10 2001 x x x 2002 x x x x x x x 2003 x x x x x x 2004 x x x x x x x 2005 1 1 1 1 1 1 1 1 1 1 2006 x x x x x x x 2007 x x x x x x x 2008 x x x x x x x x 2009 x x x x x x x 2010 x x x x x x x 2011 x x x x x x 2012 x x x x x x x 2013 x x x x x x 2014 x x x x x x x 2015 x x x x x x x 2016 x x x x x x x 2017 x x x x x x x 2018 x x x x x x 2019 x x x x x x x x 2020 x x x x 2021 2 2 2 2 2 2 2 2 2 2
Notes: (1)-assumes computer lab (2005) is occupied every period; (2)-assumes library (2021) is occupied every period;
(3)-Of 210 total periods, 144 are currently occupied, 66 are currently vacant Given the assumptions identified in the table above, there are 210 periods of
available time in the middle school. Currently, 144 of those periods are occupied and 66
are vacant. This means that there is room in the middle school for more students.
In similar fashion, table 4.9 that follows shows the current utilization of
classrooms in the Ticonderoga High School.

Castallo & Silky-Education Consultants
55
Table 4.9 Ticonderoga High School Classroom Usage-2012-13
Period Room 1 2 3 4 5 6 7 8 9 GO
1015 x x x x x x 1116 x x 1 x x x x x 1118 x x x x x x x x 1119 x x x x 1122 1201 x x x x x x x 1202 2 2 2 2 2 2 2 2 2 2 1203 x x x x x x x 1204 x x x x x x 1212 x x x 1 x x 1213 x x x x x 1214 x x x x x x x 1215 x 1216 x x x x x x x x 1217 x x x x x x x 1218 x x x x x x 1301 x x x x x x x 1302 x x x x x 1303 x x x x x x x x x x 1304 x x x 1305 x 1 x x x x x x 1312 3 3 3 3 3 3 3 3 3 3 1314 x x x x x x x 1316 x x x x x x x 1317 x x x x x x x 1318 1 x x x x x 1319 x x x x x x x 1321 x x x x x x 1415 x x x x Gym x x x x x x x x
Notes: (1)-class is taught at alternative school; (2)-assumes computer room (1202) is occupied every period;
(3)-assumes library (1302) is occupied every period; (3)-Of 300 total periods, 187 are currently occupied, 113 are vacant
GO = Guide On

Castallo & Silky-Education Consultants
56
In analyzing the utilization of the high school, we see that of the 300 total periods
that are available, 187 are currently occupied and 113 are vacant. This means that there is
room for additional students in the high school.
In considering the merger of the two existing high schools, more students will be
attending the high school and more periods of instruction will be required to teach this
larger group of high school students. Table 4.10 that follows compares the current
number of class sections being taught at Ticonderoga High School with the number of
anticipated sections that would be needed in a merged high school.
Table 4.10 Room Usage in Ticonderoga High School Compared with Merged High School
Area Number of Sections
Currently in Ticonderoga High School
Number of Sections Needed for Merged
High School English 15 19 Social Studies 17 21 Math 19 20 Science 25 31 LOTE 11 13 Business 4 7 Technology 4 8 Home & Career Skills 3 3 Health 2 3 Art 3 8 Music 4 5 Physical Education 10 14 Other 7 6 AIS 23 8 Study Halls/Academic Labs 15 20 TOTAL 162 186 As table 4.10 indicates, merging the high schools will require 24 more classroom
periods of instruction. However, given the number of available periods shown in table
4.9, fitting the students from both of the current high schools into the current Ticonderoga
High School should be easily accomplished.

Castallo & Silky-Education Consultants
57
As a result of the data presented in this chapter, should the districts decide to
merge, it is recommended that:
a.) Each district will continue to keep its elementary students in their
existing buildings for grades Pre-K-5. This will allow the youngest elementary school
students to attend the school that is closest to their home and not have an extended
amount of time on the bus riding to and from school. This recommendation will also
accommodate the enrollment increase at the elementary level that is anticipated in the
next seven years.
b.) The current middle school in Ticonderoga will serve as the merged
district’s middle school. If the current Crown Point elementary students are going to
remain in Crown Point, the Ticonderoga Middle School is the only building that is large
enough to house the approximately 250 middle school students that are expected in the
merged district. Also, given the analysis of the current building utilization tables, it is
apparent that sufficient room exists to accommodate all of the middle school student sin
the merged district.
c.) Ticonderoga’s secondary school will serve as the merged district’s high
school. The Ticonderoga High School is the only building that is large enough to house
the number of students that will be in high school in a merged school district. In addition,
compared with Crown Point, Ticonderoga has significantly more athletic fields which are
critical to providing a well rounded education to the middle and high school students.
Crown Point has a playground, a softball field, a baseball field, two soccer fields, and a
tennis court. The Ticonderoga High School has a multi-purpose play/practice field, a
softball field, and a tennis/basketball court. The Ticonderoga Elementary/Middle School
has a playground, a 5 lane track, a football stadium, a softball field, two baseball fields,
two soccer fields, two basketball courts, a multi-purpose play/practice field, and an
undeveloped field for potential future expansion.
d.) At least for the short term, the two bus garages in the existing districts
should be maintained. While there may be opportunities for efficiencies should all
transportation functions be carried on in one building, it appears that constantly
transporting buses from one end of the merged district to the other for repairs and storage
would more than mitigate any savings that might be realized. However, we recommend

Castallo & Silky-Education Consultants
58
that, should the districts decide to merge, a full transportation study be conducted to
ensure the most cost effective transportation program possible.
It should also be noted that both districts allow outside groups to use the facilities.
Table 10 that follows summarizes the major organizations that use each district’s schools.
It is recommended that the practice that exists in both districts of allowing access to
school facilities by community groups be continued and that a new policy and procedures
be developed for the use of the buildings should a merger occur.
Wells Central School

Castallo & Silky-Education Consultants
59
Table 4.11 Outside Groups Using Crown Point & Ticonderoga District Buildings
Crown Point
Ticonderoga • Men’s Basketball League • Boy Scouts • Girl Scouts • SUNY Plattsburgh Teach Mentor
Program • Crown Point Youth Commission • Crown Point Fire District • Distinguished Young Woman of the Year • Champlain Valley String Orchestra • Champlain Valley Chorale • Adirondack Mountain Men AAU Program • Crown Point Memorial Day Committee • Town of Crown point • Ragnar Events • Center Stage Dance • EF Tour Group • Ticonderoga Little League • Crown Point Chamber of Commerce • Mountain Lake Services • SADD • On Common Ground Theater Group • Performance Art Connection Wrestling
• 4-‐H • 4th of July Committee • Accelerated Christian Education
Athletics • Adirondack Mountainmen Basketball • Behavioral Health Services North • Boy Scouts/ Girl Scouts/ Cub Scouts • Community Band • Distinguished Young Woman Program • Essex County Board of Elections • Families & Schools Together Program • Fort Ticonderoga Fife & Drum Corp • James Cawley Photo Shoot • Kiwanis • NCCC Nurse Pinning Ceremony • Plymouth Fife & Drum Corp • Ragnar Relay Adirondacks Race • Road Runners • Royal Winter Pageant • St. Mary’s School • Ti Alumni Organization • Ti Booster Club • Ti Federal Credit Union • Ti Fire Department • Ti Little League and Ti T-‐Ball • Ti Titans • Ti Youth Center • Tiny Tim Organization • Town of Ti Basketball • Town of Ti Bass Federation Registration • Town of Ti Little League • Town of Ti Summer program • Town of Ti Youth Football • Town of Ti Youth Commission • Town of Ti Youth Soccer • Zumba Fitness