crs tacloban using uav and gis for planning and project...
TRANSCRIPT

CRS Tacloban using UAV and GIS for
Planning and Project Management
Presentation by:
Holly Fuller, Program Manager
Janeen Cayetano, GIS Specialist

2
Outline of Presentation
• Typhoon Haiyan Recovery Program Overview
• Using Unmanned Aerial Vehicles (UAV) and the considerations prior to
use
• Working with SkyEye
• Process of Developing the Baseline Maps
• Current Uses of Maps
• Next steps in the use of UAV and GIS
• Challenges and Lessons Learned
2
Typhoon Haiyan Recovery Program
Overview
3
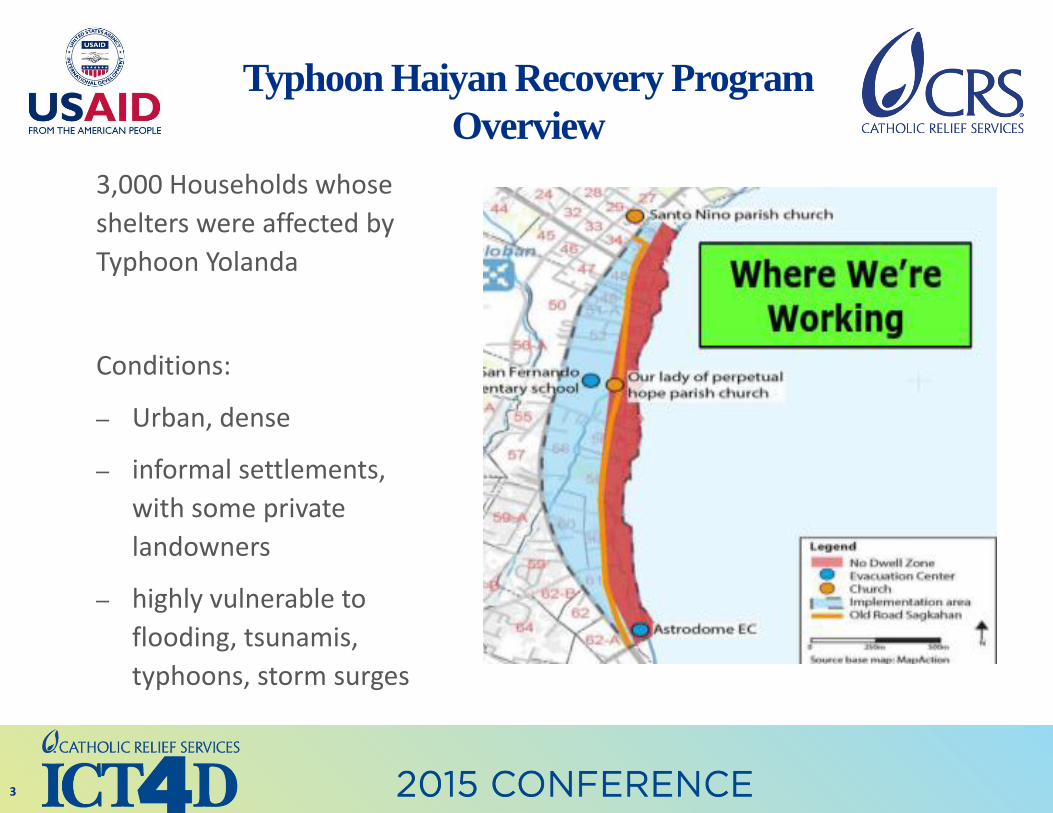
3,000 Households whose
shelters were affected by
Typhoon Yolanda
Conditions:
– Urban, dense
– informal settlements,
with some private
landowners
– highly vulnerable to
flooding, tsunamis,
typhoons, storm surges

Typhoon Haiyan Recovery Program
Overview
4
Goal: Households affected by super typhoon Yolanda live in resilient communities
Damage caused in coastal area by the Typhoon. Nov. 2013. Beneficiary constructed a new house incorporating “Build Back Better” techniques. July 2014.

Typhoon Haiyan Recovery Program
Overview
5
SHELTER SHELTER
WASH
DRR PROTECTION
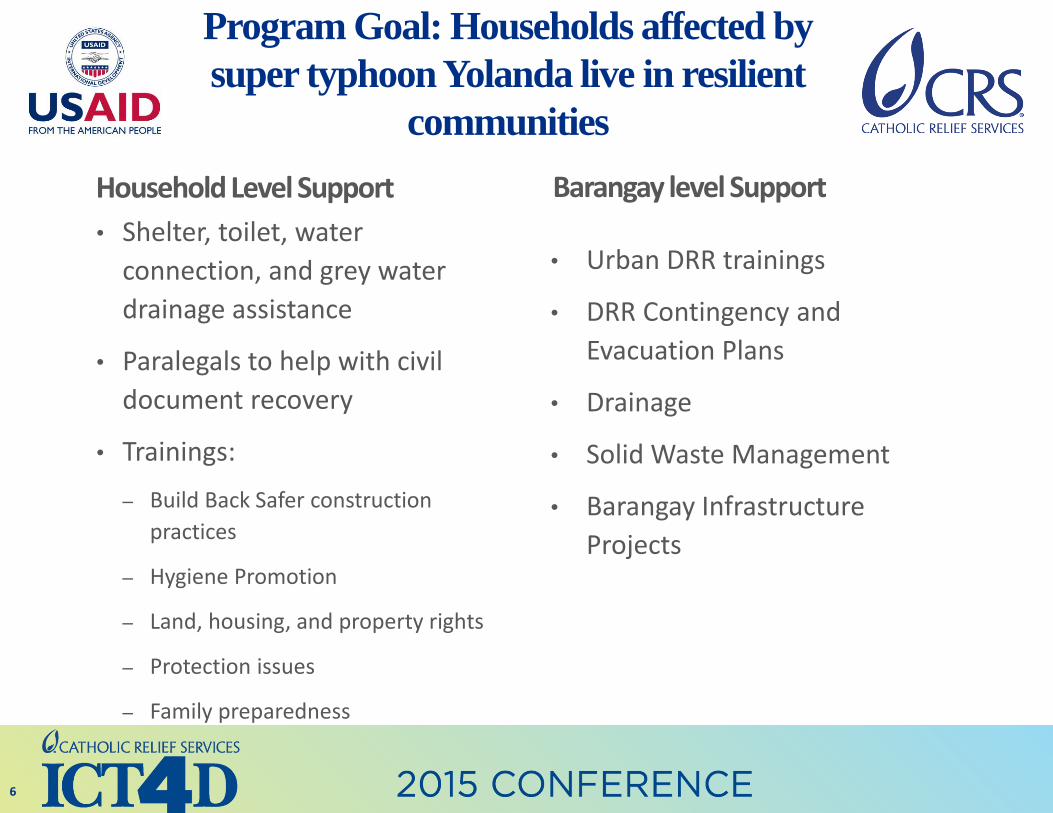
Household Level Support
• Shelter, toilet, water
connection, and grey water
drainage assistance
• Paralegals to help with civil
document recovery
• Trainings:
– Build Back Safer construction
practices
– Hygiene Promotion
– Land, housing, and property rights
– Protection issues
– Family preparedness
• Urban DRR trainings
• DRR Contingency and
Evacuation Plans
• Drainage
• Solid Waste Management
• Barangay Infrastructure
Projects
6
Barangay level Support
Program Goal: Households affected by
super typhoon Yolanda live in resilient
communities

7
Why did CRS decide on using an UAV and
GIS?
• Saves money (vs. land surveys)
• Processing time is much faster
• No map was available
7
– Land Tenure mapping- proving people’s title/ownership
– Project participants’ buy-in thru participatory uses of maps
– Improved settlement design to create healthier, safer communities
– Create contour map which is helpful for infrastructure projects
– Shows how to open a neighborhood for evacuation routes
– Quality, data-linked images improve communication for donors and
for internal decision-making
What were the expected uses?

8
Considerations prior to using UAV
• Project participants’ privacy/ethical concerns
• Proper approval channels for use of UAV thru LGU, barangays, airport..
• Buy vs. hire
– Who operates it?
– Who maintains it?
– What are the rules and regulations?
– Who repairs it?
8
9
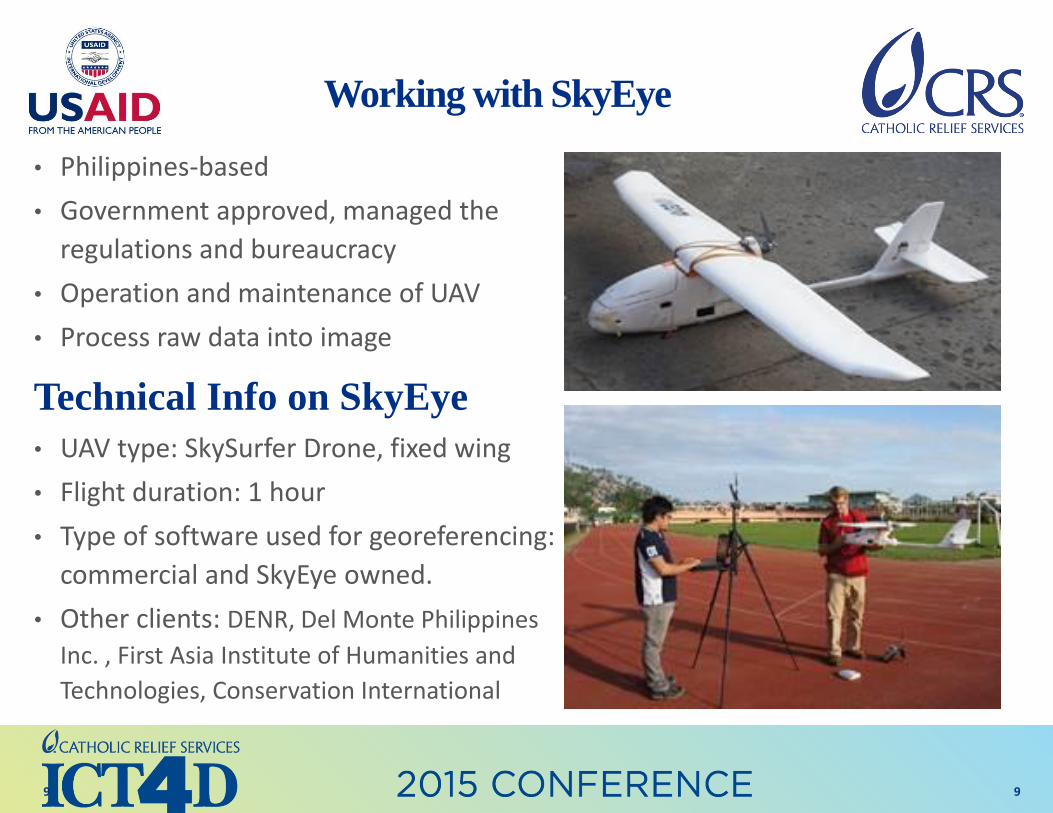
Working with SkyEye
• Philippines-based
• Government approved, managed the
regulations and bureaucracy
• Operation and maintenance of UAV
• Process raw data into image
9
Technical Info on SkyEye
• UAV type: SkySurfer Drone, fixed wing
• Flight duration: 1 hour
• Type of software used for georeferencing:
commercial and SkyEye owned.
• Other clients: DENR, Del Monte Philippines
Inc. , First Asia Institute of Humanities and
Technologies, Conservation International
10
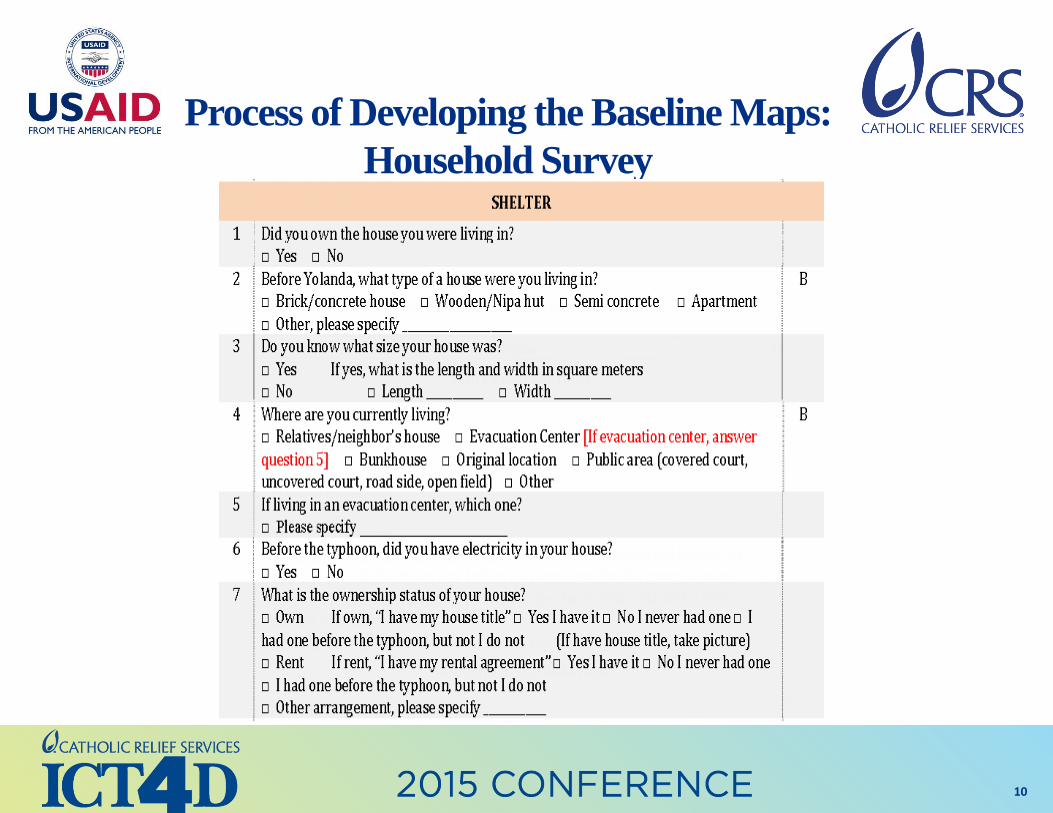
Process of Developing the Baseline Maps:
Household Survey

11
Process of Developing the Baseline Maps:
Use of GPS + Fieldwork

12
Process of Developing the Baseline Maps:
Statistical description and Spatial Analysis
13
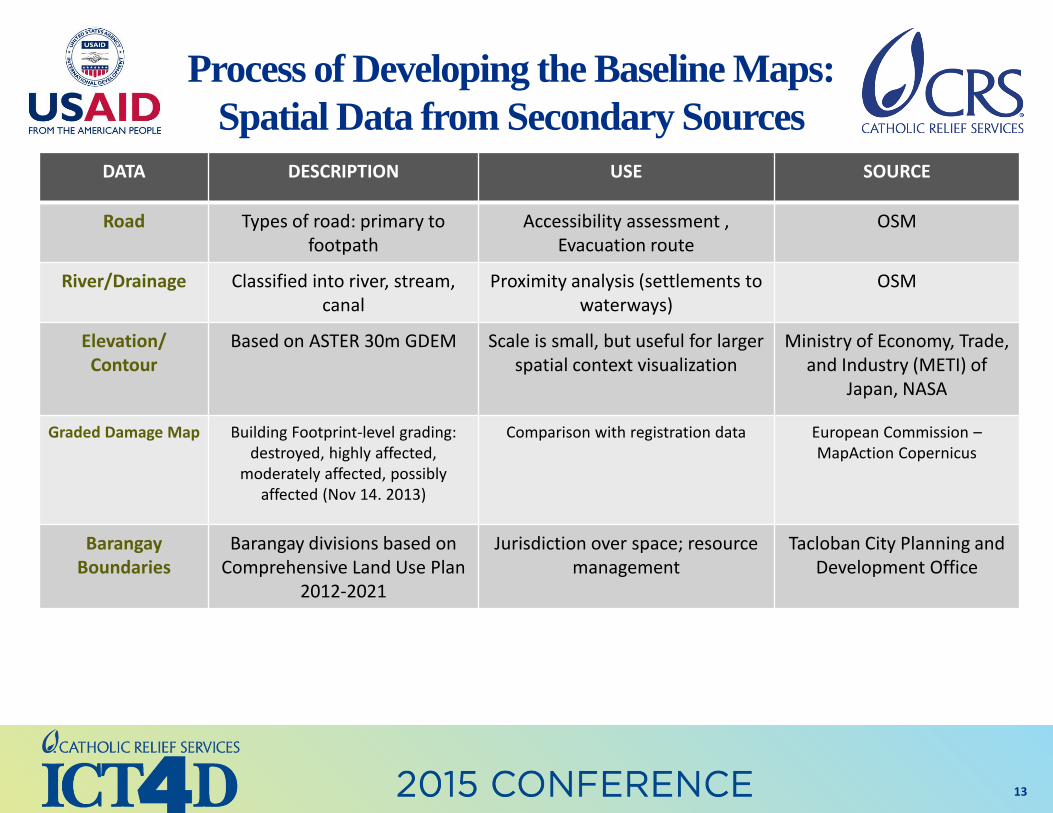
DATA DESCRIPTION USE SOURCE
Road Types of road: primary to footpath
Accessibility assessment , Evacuation route
OSM
River/Drainage Classified into river, stream, canal
Proximity analysis (settlements to waterways)
OSM
Elevation/ Contour
Based on ASTER 30m GDEM Scale is small, but useful for larger spatial context visualization
Ministry of Economy, Trade, and Industry (METI) of
Japan, NASA
Graded Damage Map Building Footprint-level grading: destroyed, highly affected,
moderately affected, possibly affected (Nov 14. 2013)
Comparison with registration data European Commission – MapAction Copernicus
Barangay Boundaries
Barangay divisions based on Comprehensive Land Use Plan
2012-2021
Jurisdiction over space; resource management
Tacloban City Planning and Development Office
Process of Developing the Baseline Maps:
Spatial Data from Secondary Sources
14
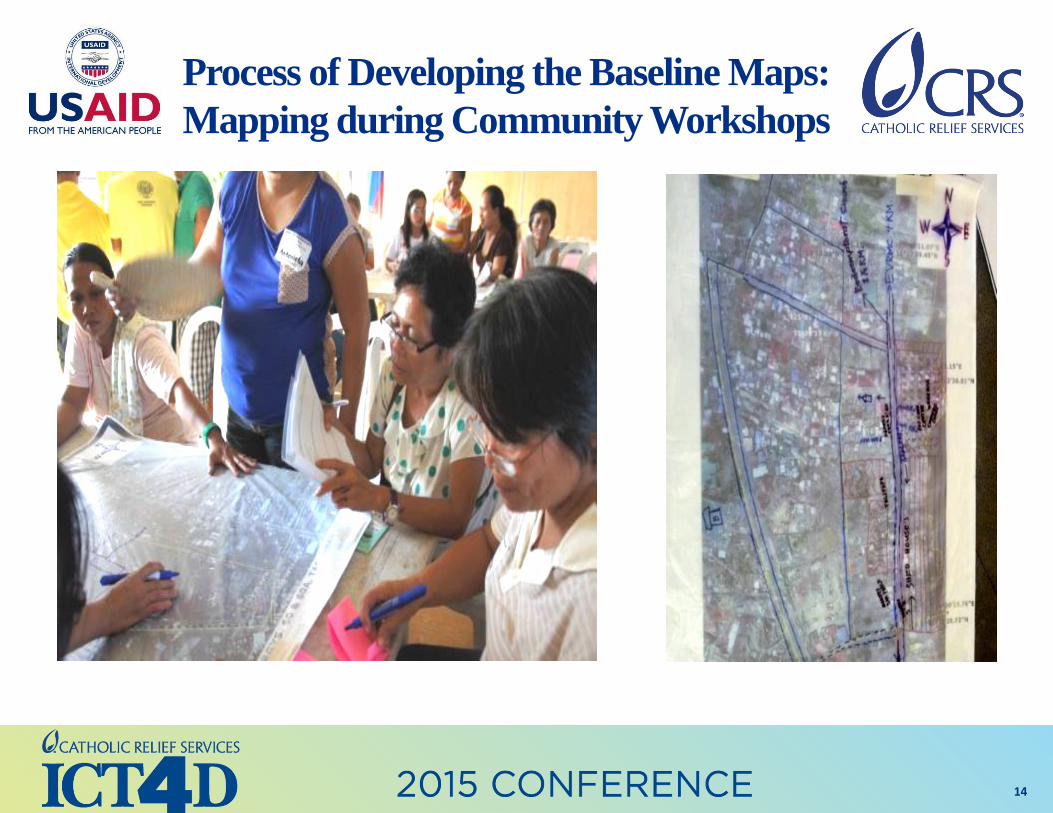
Process of Developing the Baseline Maps:
Mapping during Community Workshops

15
Process of Developing the Baseline Maps:
Verification of barangay boundaries
16
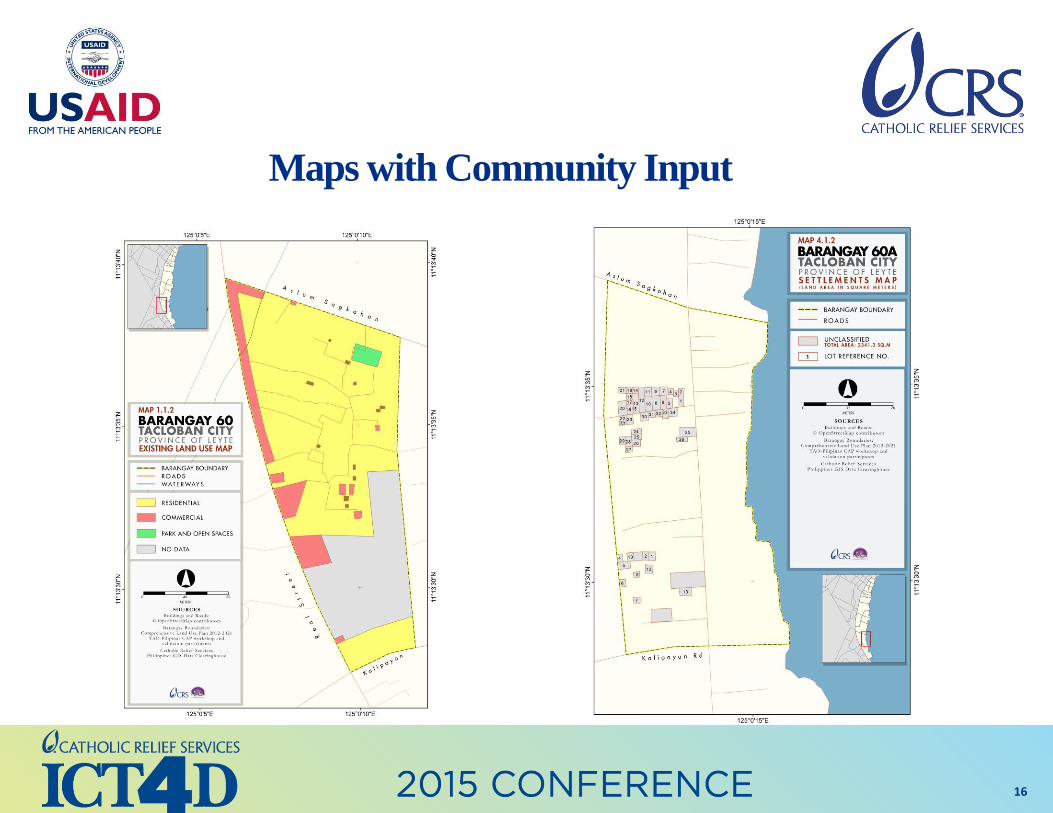
Maps with Community Input
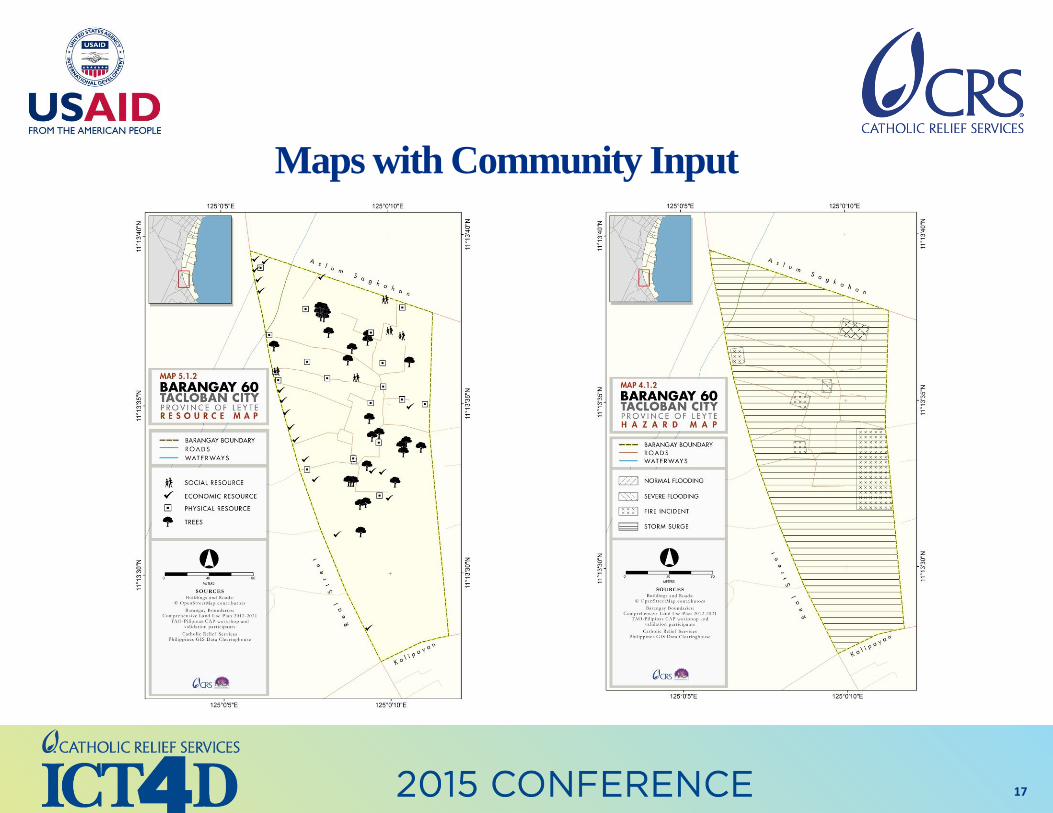
17
Maps with Community Input

18
The red dots represent the
GPS-generated locations of
the surveyed households,
while the squares represent
the buildings or structures.
Each point is associated with a
set of information in tabular
format (right of image), which
comes from the CRS
Database.
Process of Developing the Baseline
Maps: Geo-referencing the Urban
Shelter Database
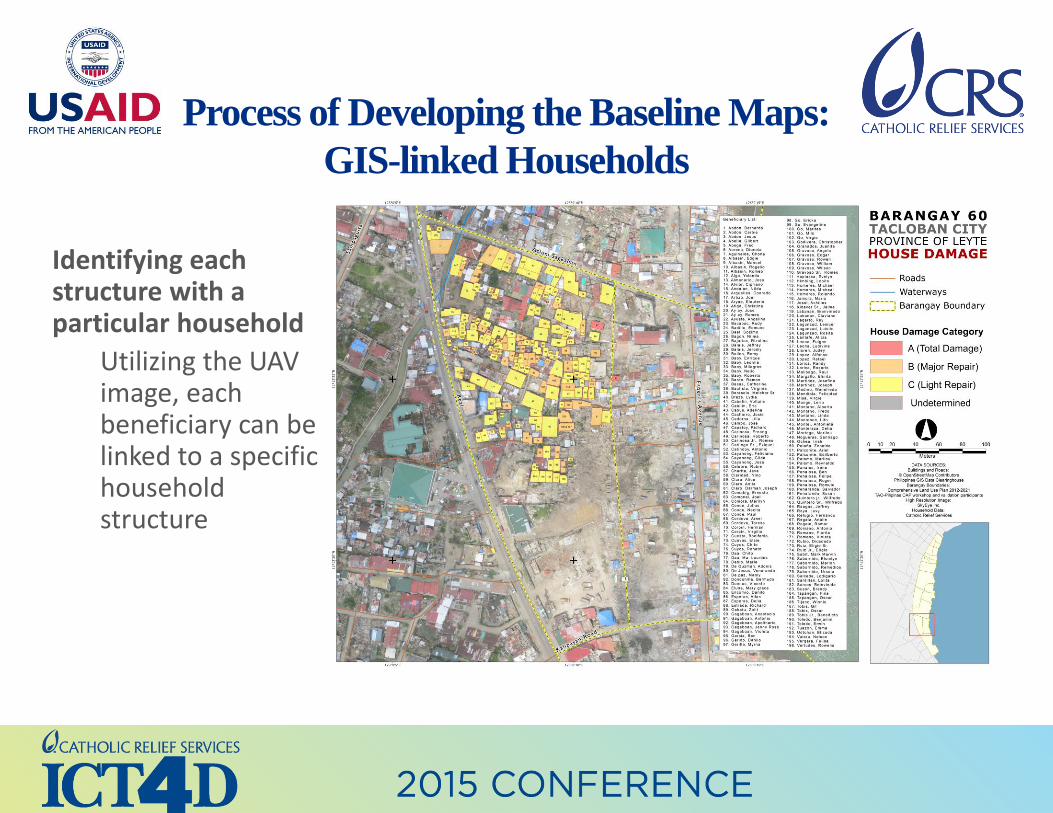
Identifying each structure with a particular household
Utilizing the UAV image, each beneficiary can be linked to a specific household structure
Process of Developing the Baseline Maps:
GIS-linked Households

20
• Disaster Risk Reduction plans and evacuation routes
• Analysis of densification and relocation
• Contour map for infrastructure projects
• Measure progress of project/ household beneficiaries:
• Efficient monitoring of progress of household beneficiaries in the
use of their conditional cash grants
• Donor reporting tool: Progress of the relief and recovery efforts
can be mapped visually and in real-time providing different
donors and stakeholders with concrete evidence of development)
• Internal decision-making tool
– Area that is not progressing quickly-> more support/visits from
Community Organizer, Engineer, foremen
20
Current uses of Maps
21
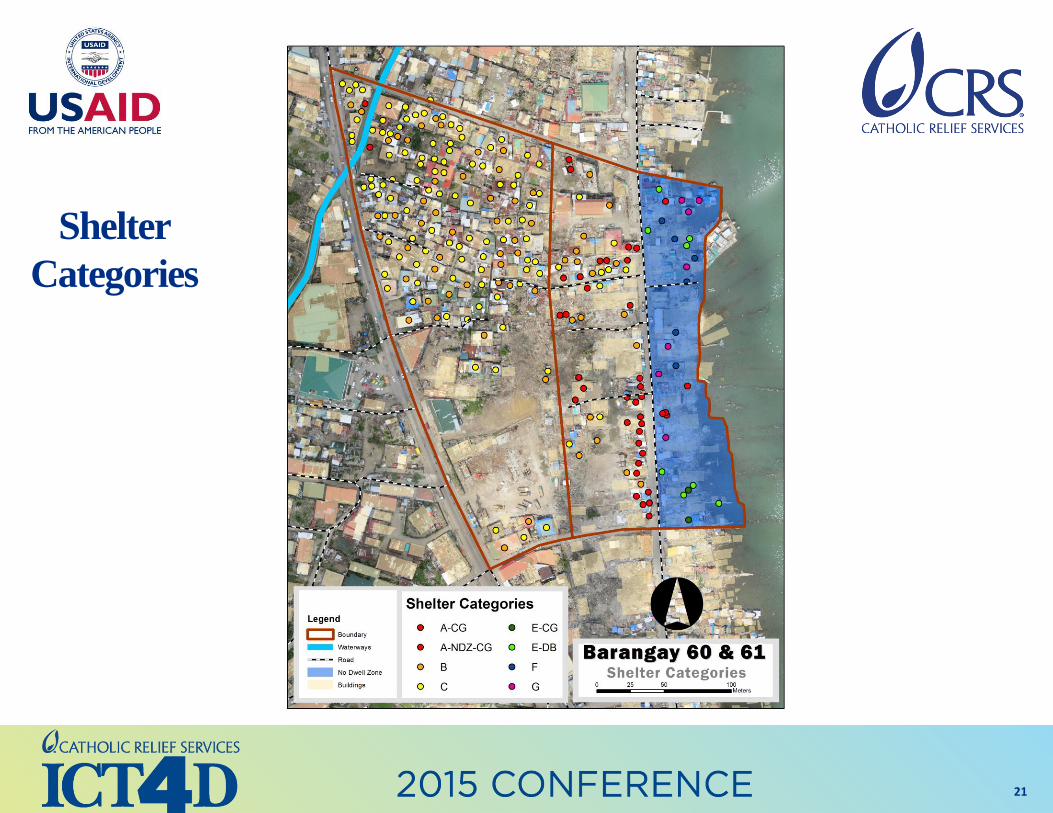
Shelter
Categories

22
Shelter
Progress
June 2014

23
Shelter
Progress
Oct. 2014
24
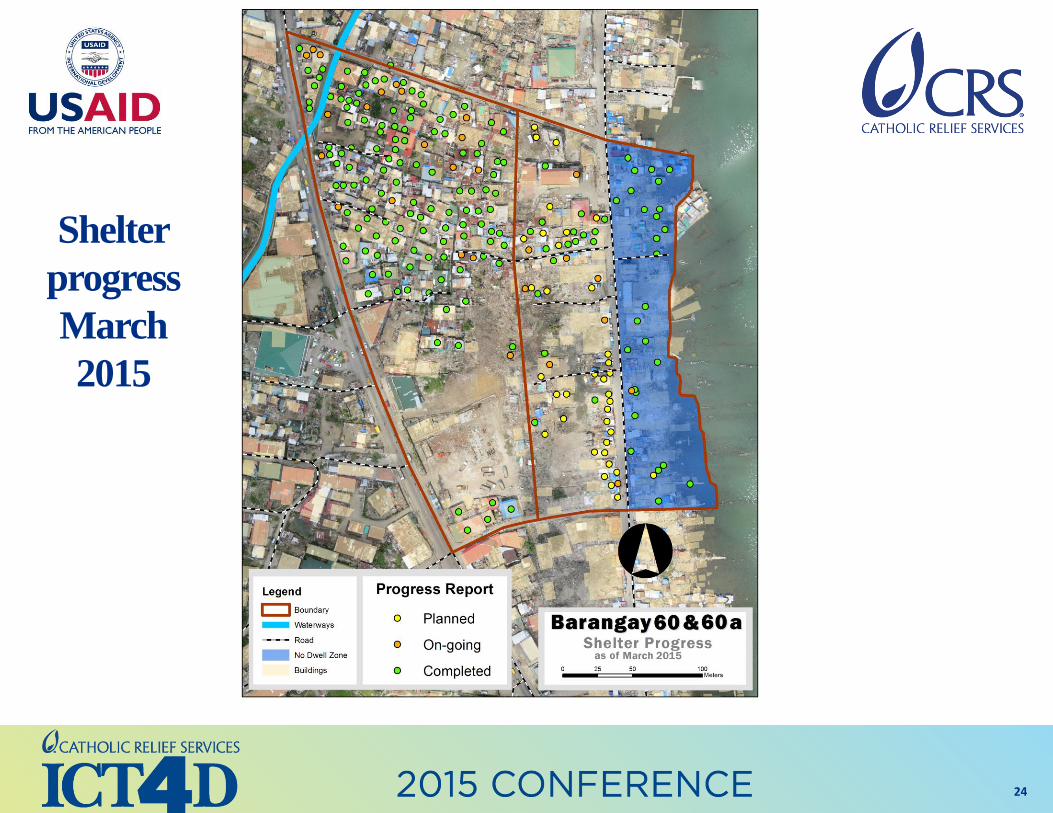
Shelter
progress
March
2015

25
Next steps in the use of UAV and GIS
• Geospatial imagery and analysis in support of DRR activities
– Expansion into a another part of urban Tacloban
• Site planning
– Water and sanitation analysis
• Septic tanks design and infiltration
• Water connections with LMWD
• Lay-out of the houses and infrastructure to maintain proper easements from roads, creeks, high tide mark
• Digitalization in the cloud for media and communications purposes.
– More visual information sharing
• Internal decision-making tool
– Knowledge retention of Build Back Safer or Hygiene Promotion trainings-> improve capacity of staff giving training and re-train with better modules
25

26
Challenges and Lessons Learned
• Technical staff are needed to know how to optimize the use of the
maps
• Outsourced Community Action Planning process and done in a short
time-frame
• Short term technical consultancy led to various opinions on what the
maps should be used for
• Problems with iPad GPS
• One point vs four points digital footprint of shelters
• Community use and buy-in

27
CRS Tacloban using UAV and GIS for Planning and Project Management