cruise fuel reduction potential from altitude and speed ... · cruise fuel reduction potential from...
TRANSCRIPT
MIT International Center for Air Transportation
Cruise Fuel Reduction Potential from Altitude and Speed Optimization in Global Airline Operations
11th ATM Research and Development Seminar Lisbon, Portugal June 23, 2015
This work was funded by the US Federal Aviation Administration (FAA) Office of Environment and Energy as a part of ASCENT Project 15 under Air Force
Contract FA8721-05-C-0002. Any opinions, findings, and conclusions or recommendations expressed in this material are those of the authors and do not necessarily reflect the views of the FAA or other ASCENT Sponsors.
Luke Jensen [email protected]
Henry Tran
R. John Hansman [email protected]

2
Cruise Altitude and Speed Optimization: Overview
• Operational adjustments have the potential to reduce the environmental impacts of aviation − Near/mid-term implementation timeline − Simpler to implement than new aircraft/
engine technology
• Typical airline operations occur away from optimal speed and altitude
• Research objectives: 1. Quantify the benefits of cruise speed
and altitude optimization in different types of airline operations
2. Identify opportunities to apply efficient speeds and altitudes § Domestic United States § Long-Haul and Oceanic
Typical Operating
Regime (fast,
off-optimal alt) Optimal Mach/Alt
Typical Narrow-Body Jet Efficiency Contours

3
CASO Approach
Flight Tracks (Radar / Flight Plan)
Aircraft Fuel Burn Model
Lissys PianoX
Weight Estimation
As-Flown Fuel Burn
Improved Fuel Burn
(from changed speed/alt)
CASO Benefits
Baseline (As-Flown) Trajectory
Weather Correction Wind/Temp
Speed/ Altitude
Optimizer
Modified Trajectory (Speed / Altitude / Both)
4
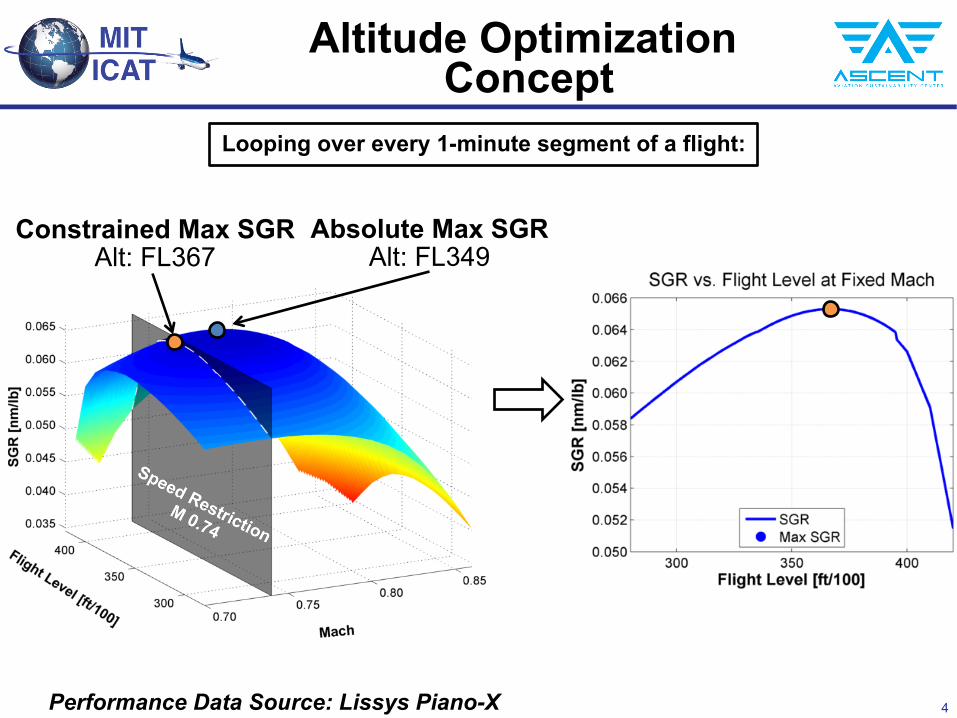
Altitude Optimization Concept
Absolute Max SGR Alt: FL349
Constrained Max SGR Alt: FL367
Looping over every 1-minute segment of a flight:
Performance Data Source: Lissys Piano-X
5
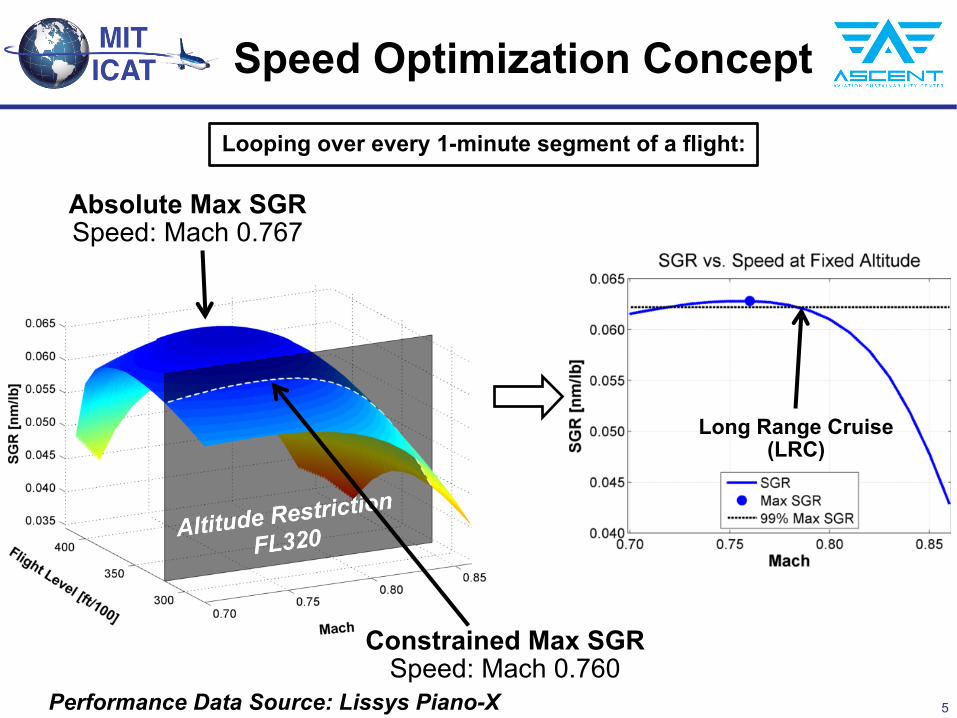
Speed Optimization Concept
Absolute Max SGR Speed: Mach 0.767
Constrained Max SGR Speed: Mach 0.760
Maximum Range Cruise (MRC)
Long Range Cruise (LRC)
Looping over every 1-minute segment of a flight:
Performance Data Source: Lissys Piano-X

6
Estimating Aircraft Weight
• Fuel consumption is dependent on aircraft weight
• Weight is not reported in public data sources
• Estimation method: regression surface using data provided by three major US airlines − Regression variables
1. Total flight time 2. Initial cruise altitude
− 35,131 sample flights including domestic US and long haul flights
9,779 Sample Points
Example: A320 Weight Estimation Surface

7
Single-Flight Altitude Optimization

8
Single-Flight Speed Optimization
Max Range Cruise (MRC), Fuel Optimal 4.58% Fuel Savings, 5.0 Minute Flight Time Increase
Long Range Cruise (LRC), 99% Efficiency 3.59% Fuel Savings, 2.2 Minute Flight Time Increase As-Flown Mach

9
2012 Domestic US Operations: Aggregate Results

10
Domestic US Altitude Results
Year 2012 18 days, 217,000 flights
Average fuel burn reduction across all flights:
• Cruise Climb 102 lbs (1.87%)
• 1000 ft Step Climb 104 lbs (1.90%)
• 2000 ft Step Climb 96 lbs (1.75%)
• Flexible VNAV 107 lbs (1.96%)

11
Domestic US Speed Results
Max Range Cruise (MRC): Fuel-optimal speed − 1.96% mean fuel burn reduction − 2m 32s average flight time
increase Long Range Cruise (LRC): 99% efficiency speed − 0.93% mean fuel burn reduction − 0m 3s average flight time
increase

12
Aircraft Type Differences: Altitude
More Efficient
Less Efficient

13
Airline Differences: Speed
More Efficient
Less Efficient

14
Altitude Sensitivity by Aircraft Type
Metric: 1% Altitude Efficiency Window
• Definition: Given best Mach, the span of all altitudes at which an aircraft remains within 1% of optimal efficiency
• Notes: − Instantaneous metric:
changes with weight and weather conditions
− Does not provide information about absolute fuel burn, only percentage
Question: Do some types have higher impact than others?

15
Aircraft Fuel Sensitivity to Altitude by Percentage
• Weight assumption: 75% useful load used as reference point
• Indicates sensitivity by percentage, not by total fuel consumption - Does not reflect higher
fuel consumption by larger aircraft

16
Aircraft Fuel Sensitivity to Altitude by Total Fuel Burn
• Weight assumption: 75% useful load used as reference point
• Indicates sensitivity by total fuel consumption - Sensitivity Criteria:
Change in Specific Air Range of 0.25 nm/lb
• Service ceiling can impact fuel sensitivity window size (regional jets)
17
• Flights with cruise phases less than 500nm operated significantly farther from optimal altitudes − Large potential benefits from better altitude assignment − Absolute fuel burn impact smaller than long-haul aircraft
due to short cruise duration
• Simultaneous altitude and speed optimization provides nonlinear benefits − Neither altitude nor speed alone dominate the additive
benefits of joint trajectory optimization (varies by airline, aircraft type, weather, etc.)
− Fuel benefits from joint altitude and speed optimization are not equal to the sum of independent altitude and speed results
Domestic Speed and Altitude Results: Other Observations

18
Long-Haul and Oceanic Operations: Aggregate Results

19
• In-service records for A330/A340 aircraft • 10 airframes • Tracking and atmospheric data
• Data from 2010-2013 used for analysis • 3,763 flights • 3 airlines
Data Source: MOZAIC/IAGOS
Imag
e: E
urop
ean
Com
mis
sion
Strengths Limitations • High resolution • Oceanic positions
and altitudes
• Number of flights • Variety of airlines
and types

20
MOZAIC/IAGOS Altitude Results
Average fuel burn reduction across all flights:
• Cruise Climb 810 lbs (0.78%)
• 1000 ft Step Climb 883 lbs (0.85%)
• 2000 ft Step Climb 682 lbs (0.65%)
• Flexible VNAV 905 lbs (0.87%)

21
MOZAIC/IAGOS Speed Results
Max Range Cruise (MRC): Fuel-optimal speed − 1.81% mean fuel burn reduction − 10m 4s average flight time
increase Long Range Cruise (LRC): 99% efficiency speed − 0.89% mean fuel burn reduction − 1m 42s average flight time
decrease

22
Comparison: Domestic US and MOZAIC/IAGOS
Domestic MOZAIC/IAGOS
Alti
tude
Cruise Climb 1.87% (102 lbs) 0.78% (810 lbs)
2000ft Step Climb 1.75% (96 lbs) 0.65% (682 lbs)
Spee
d Maximum Range Cruise 1.93% (105 lbs) 1.81% (1891 lbs)
Long Range Cruise 0.93% (51 lbs) 0.89% (933 lbs)
Initial results for altitude: • Larger percentage benefits for domestic US • Larger per-flight benefits for MOZAIC/IAGOS long haul flights
Initial results for speed: • Similar percentage benefits across all flights • Larger per-flight benefits for MOZAIC/IAGOS long haul flights
23
• Expanded international analysis − Oceanic analysis (e.g. North Atlantic Tracks)
§ Clearance and position reporting data from Nav Canada § ADS-B tracking data where available
• Check 2012 results against 2014 operations for any efficiency changes
• Meet with key stakeholders to discuss operational implications − Air traffic controllers and air traffic managers − Airline operations departments and dispatchers
• Implement analysis framework with alternative aircraft performance models − BADA 3 or BADA 4 (if available)
Next Steps

24
Conclusion
• Altitude and speed trajectory improvements have the potential to save airlines money and reduce environmental impact • Benefits can be realized by different types of operators:
– Short-haul (large percentage gains) – Long-haul (large per-flight gains)
• Detailed analysis of long-haul and intercontinental operations requires more extensive dataset
• Potential applications for: • Airline flight planning and dispatch • Cockpit decision making • Air traffic control procedures • Airspace allocation and management
25
Questions?
Luke Jensen [email protected]
Henry Tran
R. John Hansman [email protected]
Acknowledgements
Federal Aviation Administration: Chris Dorbian, Stephen Merlin, Pat Moran MIT Lincoln Laboratory: Tom Reynolds, Joe Venuti, Alan Midkiff, Lanie Sandberg, Yari Rodriguez

26
Backup Slides

27
Altitude Sensitivity Window Illustration
Unconstrained by Service Ceiling Constrained by Service Ceiling