cruise report origin of lineated midplate volcanism in … · n'est décrit dans le modèle...
TRANSCRIPT

Cruise Report Origin of Lineated MidPlate Volcanism
in the Southern Austral Islands EW9602
R/V Maurice Ewing Marcia McNutt, Massachusetts Institute of Technology
Chief Scientist David Caress, Lamont-Doherty/SeaBeam Instruments
Co-Principal Investigator
March 24, 1996 - May 11, 1996
Lyttelton, New Zealand to Papeete, Tahiti
EW9602 Cruise Report 2
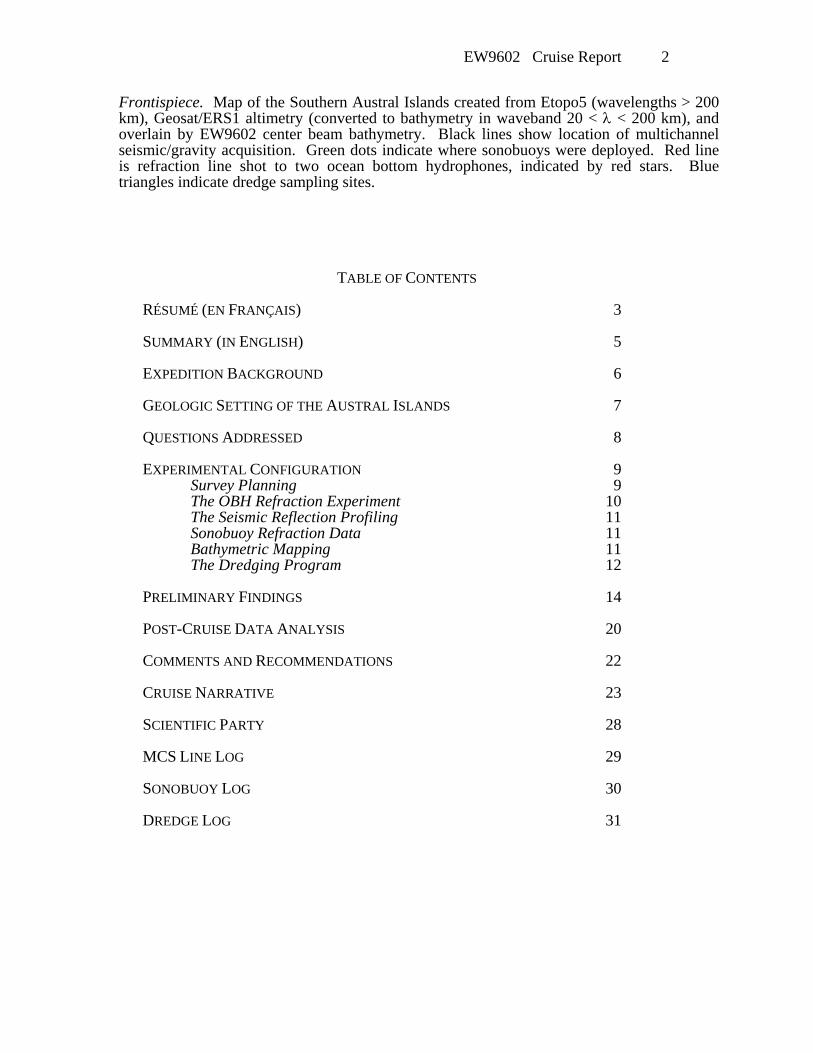
Frontispiece. Map of the Southern Austral Islands created from Etopo5 (wavelengths > 200 km), Geosat/ERS1 altimetry (converted to bathymetry in waveband 20 < λ < 200 km), and overlain by EW9602 center beam bathymetry. Black lines show location of multichannel seismic/gravity acquisition. Green dots indicate where sonobuoys were deployed. Red line is refraction line shot to two ocean bottom hydrophones, indicated by red stars. Blue triangles indicate dredge sampling sites.
TABLE OF CONTENTS
RÉSUMÉ (EN FRANÇAIS) 3 SUMMARY (IN ENGLISH) 5 EXPEDITION BACKGROUND 6 GEOLOGIC SETTING OF THE AUSTRAL ISLANDS 7 QUESTIONS ADDRESSED 8 EXPERIMENTAL CONFIGURATION 9 Survey Planning 9 The OBH Refraction Experiment 10 The Seismic Reflection Profiling 11 Sonobuoy Refraction Data 11 Bathymetric Mapping 11 The Dredging Program 12 PRELIMINARY FINDINGS 14 POST-CRUISE DATA ANALYSIS 20 COMMENTS AND RECOMMENDATIONS 22 CRUISE NARRATIVE 23 SCIENTIFIC PARTY 28 MCS LINE LOG 29 SONOBUOY LOG 30 DREDGE LOG 31

EW9602 Cruise Report 3
RÉSUMÉ L'expédition EW 9602, à bord du N/O Maurice Ewing du Lamont-Doherty Earth Observatory de la Columbia University (New York), a effectué de mars à mai 1996 une étude multidisciplinaire de géologie et géophysique marines dans la partie sud-est des Iles Australes. Cinq profils de sismique réflexion multitrace perpendiculaires à cet alignement et d'environ 450 km de longueur chacun, ont été réalisés en utilisant comme source sonore un dispositif de 20 canons à air et comme récepteur une "flûte" à enregistrement digitalisé de 3,7 km de longueur. Un sixième profil de sismique réflexion de grande longueur a été réalisé le long de la fosse flexurale sur le flanc Sud de cette partie des Iles Australes. Les vitesses de propagation des ondes sismiques ont été estimées à l'aide de 39 bouées sonores lancées le long de ces profils. Les détails tectoniques et volcaniques les plus marquants dans cette région ont été cartographiés grâce au dispositif de mesures bathymétriques Hydrosweep à large bande. De même, des mesures de la gravité ont été effectuées tout au long de la mission et les anomalies magnétiques ont été déterminées le long des profils réalisés perpendiculairement à l'alignement. Finalement, des roches volcaniques ont été draguées sur les pentes de 20 monts sous-marins. Basé sur une analyse très préliminaire des données ainsi obtenues, il apparaît que cette partie des Australes soit composée de deux chaînes volcaniques majeures distinctes et d'un alignement mineur (Figure 1). La chaîne la plus ancienne de ces volcans (Lineation “Ngatemato”) n'est pas encore datée, mais elle pourrait presque être du même âge que la lithosphère sous-jacente (environ 40 millions d'années). Cette chaîne s'étend dans la direction du mouvement absolu des plaques, parallèlement, mais à une distance d'environ 50 km au Nord, d'un autre alignement volcanique plus jeune allant du Macdonald jusqu'à Rapa, en passant par le mont sous-marin Rá et le îlots Morotiri. Cependant, bien que le volume de l'alignement au Nord, plus âgé, soit presque le double de celui de l'alignement du Macdonald au Sud, plus jeune, ce fait n'apparaît pas sur les cartes bathymétriques car la plus grande partie de la masse de ses volcans est enfouie dans sa fosse flexurale profonde. L'épaisseur élastique effective de la lithosphère supportant ces édifices n'est que de 5 km, ce qui tend à confirmer notre supposition qu'ils soient très âgés. Cet alignement de volcans se compose de cônes isolés à sommets arrondis dont les pentes les plus fortes se confondent souvent en formant des rides en échelons. Il s'est révélé difficile d'effectuer des dragages sur ces volcans, à cause de leur couverture de sédiments et de la présence d'encroûtements à manganèse. D'après les cartes gravimétriques obtenues par mesures satellitaires, ces rides se prolongent bien dans le sud-est du Macdonald et formeraient eventuellement une ligne volcanique continue jusqu'à la bordure Sud de la microplaque de Juan Fernandez, sur la ride du Pacifique-Est. Cependant, leur volume atteint en vérité son maximum dans la région du sud-est des Australes, à l'intersection de la fosse de l'Adventure (une ancienne ride de grande extension) et du trend Sud du point triple de Juan Fernandez. L'alignement volcanique plus jeune du Macdonald (Lineation “Macdonald”) est également orienté dans la direction du mouvement absolu des plaques. Les datations radiométriques indiquent que le Macdonald possède un “âge zéro”, ce qui est confirmé par ses éruptions historiques, et par le fait que Rapa est âgé de 5 millions d'années. Cette progression d'âges est globalement compatible avec le déplacement de la plaque du Pacifique au-dessus d'un point chaud fixe. Cependant, ce qui n'est pas conforme avec une origine due à un point chaud est que cet alignement se place exactement le long de la bordure Sud de la fosse flexurale de la chaîne plus ancienne située au Nord. Le volume du volcanisme de l'alignement du Macdonald a d'abord augmenté pour ensuite diminuer, dans le temps; c'est également le cas pour la chaîne plus ancienne, bien que le volume du premier ne soit approximativement que la moitié de la deuxième. Les volcans de l'alignement du Macdonald sont des volcans à rifts, possédant des sommets très pointus, chargeant une plaque élastique plus raide (dont l'épaisseur élastique effective augmente de 10 km à Rapa à 15 km près du Macdonald).

EW9602 Cruise Report 5
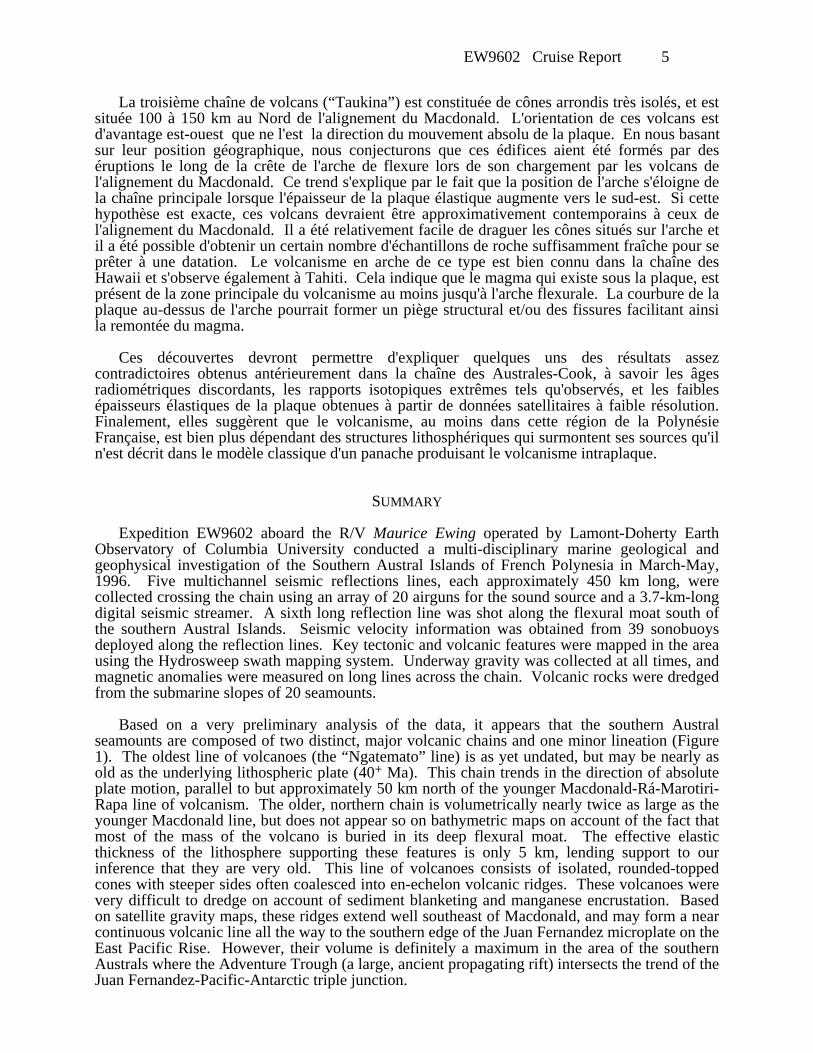
La troisième chaîne de volcans (“Taukina”) est constituée de cônes arrondis très isolés, et est située 100 à 150 km au Nord de l'alignement du Macdonald. L'orientation de ces volcans est d'avantage est-ouest que ne l'est la direction du mouvement absolu de la plaque. En nous basant sur leur position géographique, nous conjecturons que ces édifices aient été formés par des éruptions le long de la crête de l'arche de flexure lors de son chargement par les volcans de l'alignement du Macdonald. Ce trend s'explique par le fait que la position de l'arche s'éloigne de la chaîne principale lorsque l'épaisseur de la plaque élastique augmente vers le sud-est. Si cette hypothèse est exacte, ces volcans devraient être approximativement contemporains à ceux de l'alignement du Macdonald. Il a été relativement facile de draguer les cônes situés sur l'arche et il a été possible d'obtenir un certain nombre d'échantillons de roche suffisamment fraîche pour se prêter à une datation. Le volcanisme en arche de ce type est bien connu dans la chaîne des Hawaii et s'observe également à Tahiti. Cela indique que le magma qui existe sous la plaque, est présent de la zone principale du volcanisme au moins jusqu'à l'arche flexurale. La courbure de la plaque au-dessus de l'arche pourrait former un piège structural et/ou des fissures facilitant ainsi la remontée du magma. Ces découvertes devront permettre d'expliquer quelques uns des résultats assez contradictoires obtenus antérieurement dans la chaîne des Australes-Cook, à savoir les âges radiométriques discordants, les rapports isotopiques extrêmes tels qu'observés, et les faibles épaisseurs élastiques de la plaque obtenues à partir de données satellitaires à faible résolution. Finalement, elles suggèrent que le volcanisme, au moins dans cette région de la Polynésie Française, est bien plus dépendant des structures lithosphériques qui surmontent ses sources qu'il n'est décrit dans le modèle classique d'un panache produisant le volcanisme intraplaque.
SUMMARY Expedition EW9602 aboard the R/V Maurice Ewing operated by Lamont-Doherty Earth Observatory of Columbia University conducted a multi-disciplinary marine geological and geophysical investigation of the Southern Austral Islands of French Polynesia in March-May, 1996. Five multichannel seismic reflections lines, each approximately 450 km long, were collected crossing the chain using an array of 20 airguns for the sound source and a 3.7-km-long digital seismic streamer. A sixth long reflection line was shot along the flexural moat south of the southern Austral Islands. Seismic velocity information was obtained from 39 sonobuoys deployed along the reflection lines. Key tectonic and volcanic features were mapped in the area using the Hydrosweep swath mapping system. Underway gravity was collected at all times, and magnetic anomalies were measured on long lines across the chain. Volcanic rocks were dredged from the submarine slopes of 20 seamounts. Based on a very preliminary analysis of the data, it appears that the southern Austral seamounts are composed of two distinct, major volcanic chains and one minor lineation (Figure 1). The oldest line of volcanoes (the “Ngatemato” line) is as yet undated, but may be nearly as old as the underlying lithospheric plate (40+ Ma). This chain trends in the direction of absolute plate motion, parallel to but approximately 50 km north of the younger Macdonald-Rá-Marotiri-Rapa line of volcanism. The older, northern chain is volumetrically nearly twice as large as the younger Macdonald line, but does not appear so on bathymetric maps on account of the fact that most of the mass of the volcano is buried in its deep flexural moat. The effective elastic thickness of the lithosphere supporting these features is only 5 km, lending support to our inference that they are very old. This line of volcanoes consists of isolated, rounded-topped cones with steeper sides often coalesced into en-echelon volcanic ridges. These volcanoes were very difficult to dredge on account of sediment blanketing and manganese encrustation. Based on satellite gravity maps, these ridges extend well southeast of Macdonald, and may form a near continuous volcanic line all the way to the southern edge of the Juan Fernandez microplate on the East Pacific Rise. However, their volume is definitely a maximum in the area of the southern Australs where the Adventure Trough (a large, ancient propagating rift) intersects the trend of the Juan Fernandez-Pacific-Antarctic triple junction.
EW9602 Cruise Report 6
The younger Macdonald line of volcanism (the “Macdonald” line) is also oriented in the direction of absolute plate motion. Radiometric dates indicate that Macdonald is “zero age”, a fact confirmed by its historic eruptions, and that Rapa Island is 5 Ma. This age progression is roughly consistent with motion of the Pacific plate over a fixed hotspot. However, what is not consistent with a hotspot origin for the Macdonald line is that it lies precisely along the southern edge of the flexural moat of the older chain to the north. As the volume of the old chain waxes and wanes, so does the volume of the Macdonald volcanism, although the latter is approximately half the volume of the former. Macdonald volcanoes are sharp-peaked, rift-zone volcanoes that load a stiffer elastic plate (effective elastic thickness of 10 near Rapa increasing to 15 km near Macdonald). The third, minor chain of volcanoes (the “Taukina” Line) consists of very isolated, rounded cones 100 to 150 km north of the Macdonald line. The volcanoes are oriented more east-west that the direction of absolute plate motion. Based on their position, we speculate that these features represent eruptions on the crest of the flexural arch from loading by the Macdonald chain. The trend is explained by the fact that the position of the arch migrates further away from the main chain as the elastic plate thickness increases to the southeast. If this hypothesis is correct, then these volcanoes should be roughly contemporaneous with the Macdonald line. The arch cones were relatively easy to dredge and yielded an number of rocks fresh enough for dating. Arch volcanism of this sort has been well documented for the Hawaiian chain and is also observed near Tahiti. It indicates that melt is available beneath the plate at least as far away from the main volcanism as the flexural arch. The bending of the plate over the arch may provide a structural trap and/or cracks that facilitate magma ascent. These findings may help to explain some previous, curious results from the Cook-Austral chain, such as the discordant radiometric ages, extremes in radiogenic isotopic compositions, and low elastic plate thicknesses determined from low-resolution satellite data. Furthermore, they suggest that volcanism at least in this area of French Polynesia is far more sensitive to overlying lithospheric structure than the classic plume model for midplate volcanism would predict.
EXPEDITION BACKGROUND
Originally the goals of this expedition were to use marine seismic techniques to study the patterns of and processes leading to volcanic underplating of hotspot chains. Emphasis was to have been placed on obtaining three long refraction lines across the Austral chain, one just in front of Macdonald Seamount, another through a gap in the chain northwest of Rá Seamount, and the third where the chain in broadest neat Marotiri. These three locations would allow us to investigate the timing of formation of underplating (is it contemporaneous with the first eruptive products at Macdonald?) and the relationship of the volume of underplating to volume of the chain (is in directly or inversely proportional to the loads at the small and large load cross-sections?) Multichannel seismic profiling and dredging were to be conducted along the refraction lines to support interpretation of the refraction data by looking for the mechanical and petrological responses to underplating. However, eleven of the thirteen ocean bottom seismometers that were to provide the deep seismic structure of the island chain were not recovered after the first of three deployments on account of insufficient buoyancy and acoustic communication failures. Therefore, the objectives of the expedition were modified to concentrate on understanding processes of midplate volcanism using multichannel seismology, sonobuoy-refraction seismology, Hydrosweep mapping, shipboard gravity and magnetics, and dredging. The traditional view is that midplate volcanism is caused by plumes of hot material ascending from the core-mantle boundary. These plumes produce age-progressive linear chains oriented in the direction of absolute plate motion, with the Hawaiian-Emperor chain being the type example of this phenomenon. Plumes are thought to tap radiogenically enriched source regions of the mantle
EW9602 Cruise Report 7
quite distinct from the depleted upper mantle from which midocean ridge basalts (MORB) are extracted, thus imparting a characteristic non-MORB fingerprint to midplate volcanism. However, on closer inspection, it is clear that the plume model does not provide a good match to observations of midplate volcanism in French Polynesia. Here, hotspot chains show consistent age progressions of only a few (<10) million years (e.g., Marquesas, Society), the azimuths of the chains and the rate of migration of volcanism can be significantly different from what is predicted by absolute plate motion models (e.g., Marquesas), and several sites along the same trend separated by many hundred of kilometers are simultaneously active (e.g., Puka-Puka Ridges, Cook-Austral chain). Furthermore, excess volcanism does not only occur in volcanic chains; at all scales, volcanism is enhanced by a factor of 4 in French Polynesia as compared with that for normal Pacific lithosphere. This type of volcanism appears to be the rule rather than the exception for French Polynesia and its Cretaceous predecessor, the Darwin Rise, which have been termed “superswells” based on their anomalously shallow seafloor with enhanced rates of midplate volcanism. Expedition EW9602 therefore provides us with the opportunity to better understand this type of volcanism which is not produced at plate boundaries or by mantle plumes.
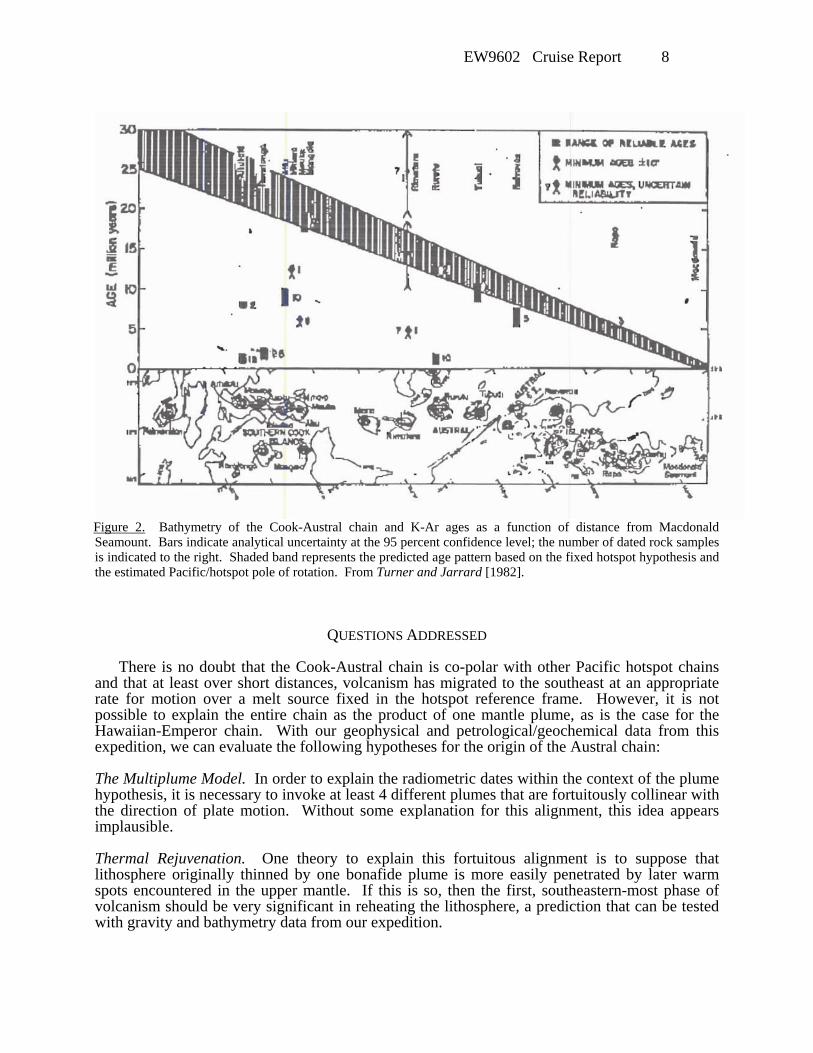
GEOLOGIC SETTING OF THE AUSTRAL ISLANDS Although the Cook-Austral chain is one of the most poorly surveyed in French Polynesia, existing data suggest that it is a type example of this non-plume, superswell-type volcanism. The chain actually consists of two parallel lines of volcanism separated by up to 250 km, both of which lie along the predicted trend for motion of the Pacific plate in the hotspot reference frame (Figure 2). The northern lineation includes the island of Raivavae at the southeast end and extends to Palmerston Atoll on the northeast end. The southern line extends from Macdonald seamount at the southeast, located on 43-Ma lithosphere, to Rarotonga island at the northwest. Active volcanism is presently occurring at Macdonald seamount, but young volcanics with radiometric ages less than 5 Ma have been sampled at Rurutu, Rarotonga, and Aitutaki, at distances as much as 2000 km northwest of Macdonald. While most of the radiometric dating suggests that maximum ages of volcanism do not exceed that predicted for a plume located at Macdonald, the summit depths of flat-topped guyots surveyed on ~60 Ma lithosphere at the northern end of the southern Australs are too deep to have been formed by a plume located at Macdonald. Geosat/ERS1 altimetry also show volcanism along the Austral trend but well southeast of Macdonald extending all the way to the southern edge of the Easter microplate at the East Pacific Rise. Analysis of radiometric isotopes shows a mixture of the HIMU and EMII enriched mantle sources, with the isotopic pattern not clearly associated with the northern versus the southern chain nor with age of volcanism. Finally, flexural models of isostatic compensation of volcanic loads in the Cook-Austral chain predict lithospheric thicknesses too low given the age of the lithosphere determined from magnetic lineations and the age of volcanism. One difficulty with trying to sort out the spatial and temporal pattern of volcanism in the southern Australs is that emergent islands are rare. Few oceanographic research vessels have visited this region (notable exceptions are the expeditions of the N/O Jean Charcot and F/S Sonne in the late 1980’s), and therefore extrapolations of ages and geochemical patterns based on the few sampled volcanoes are likely to be highly aliased in a situation where formation of all volcanoes along the lineation by one mantle plume is already ruled out. Sampling during EW9602 therefore focussed on the submarine portions of the chain for which, with the exception of Macdonald Seamount, virtually nothing is known about volcanic age and isotope geochemisty.
EW9602 Cruise Report 8
Figure 2. Bathymetry of the Cook-Austral chain and K-Ar ages as a function of distance from Macdonald Seamount. Bars indicate analytical uncertainty at the 95 percent confidence level; the number of dated rock samples is indicated to the right. Shaded band represents the predicted age pattern based on the fixed hotspot hypothesis and the estimated Pacific/hotspot pole of rotation. From Turner and Jarrard [1982].
QUESTIONS ADDRESSED
There is no doubt that the Cook-Austral chain is co-polar with other Pacific hotspot chains and that at least over short distances, volcanism has migrated to the southeast at an appropriate rate for motion over a melt source fixed in the hotspot reference frame. However, it is not possible to explain the entire chain as the product of one mantle plume, as is the case for the Hawaiian-Emperor chain. With our geophysical and petrological/geochemical data from this expedition, we can evaluate the following hypotheses for the origin of the Austral chain: The Multiplume Model. In order to explain the radiometric dates within the context of the plume hypothesis, it is necessary to invoke at least 4 different plumes that are fortuitously collinear with the direction of plate motion. Without some explanation for this alignment, this idea appears implausible. Thermal Rejuvenation. One theory to explain this fortuitous alignment is to suppose that lithosphere originally thinned by one bonafide plume is more easily penetrated by later warm spots encountered in the upper mantle. If this is so, then the first, southeastern-most phase of volcanism should be very significant in reheating the lithosphere, a prediction that can be tested with gravity and bathymetry data from our expedition.

EW9602 Cruise Report 9
Small-Scale Convection. Both theoretical and laboratory models predict that at certain Rayleigh numbers, a viscous fluid sheared by plate motion from above will develop small-scale convective rolls aligned in the direction of absolute plate motion. One possibility for this “line source”-type volcanism seen in the Austral Islands is that it develops over the upwelling segment of a convective roll. According to this hypothesis, the Austral chain should be superimposed on a gravity high that persists even at gaps in the volcanic chain. Closer inspection should show a range of ages at all locations limited only at the lower end by the age of the plate and at the upper end by the present. Lithospheric Stretching. Another possible explanation for the pervasive volcanism through French Polynesia is that the lithosphere is being stretched in the direction perpendicular to absolute plate motion. This stretching thins the lithosphere to form the depth anomaly of the Superswell and provide easy ascent for melt in the upper mantle. According to this hypothesis, there should be structural features in the crust that control the locus of volcanism. We plan to test the above hypotheses and any combinations of them with data collected during EW9602. Specific questions we can answer include: • What is the elastic strength of the lithosphere along the chain for volcanoes of different ages
as determined by gravity and MCS data? How does the strength compare with that predicted for normal (unrejuvenated) oceanic lithosphere?
• How do the ages of submarine portions of the volcanic chain compare with those of the few dated islands? Are age progressions real or an oversimplification? What is the range of ages on a single edifice?
• How do different lines of volcanoes of different ages relate to each other in a structural sense, as determined from our Hydrosweep bathymetry in places where sediment is thin and by multichannel seismology in places where sediment cover is thick? Is there any evidence for tensional grabens? Do younger chains form on the flexural arches of older ones?
• How does the volume of volcanism vary as lithospheric fabric changes, such as along fracture zones, the Adventure Trough, etc?
• How does the geochemistry of volcanic rocks vary with age and position?
EXPERIMENTAL CONFIGURATION
The breakdown of time for the experiment was as follows: 9 days transiting from New Zealand at 11 knots to the SE end of the Austral chain. During the
transit we recorded underway Hydrosweep bathymetry, gravity, and magnetic data. 1 day deploying 13 ocean bottom hydrophones (OBHs) 3 days shooting one refraction line across ocean bottom hydrophones 5 days recovering 2 OBHs (failing in the other 11 attempts) and dredging (with little success) 4
dredge sites 16 days shooting MCS data, including streamer deployment, recovery, and repairs. We also
deployed 42 sonobuoys during the reflection profiling. 10 days dredging and associated bathymetric surveying 3 days transit back to Tahiti. During the transit we recorded underway Hydrosweep bathymetry,
gravity, and magnetic data. Survey Planning A significant problem we faced with this experiment was the lack of an adequate bathymetric map on a regional scale for siting MCS lines, deciding where to deploy sonobuoys, selecting dredge targets, and constraining depth near but not along our lines for use in gravity modeling. To a large extent, this problem was solved by making our own bathymetric map with the aid of Geosat/ERS-1 altimetry data. The filter to predict bathymetry given gravity was calculated assuming a flexural rigidity of 1 x 10²¹ Nm and a density of 2650 kg/m3. At wavelengths longer than 200 km, Etopo5 bathymetry was used rather than the predicted bathymetry from gravity.
EW9602 Cruise Report 10
The filter was exponentially tapered to zero starting at 40 km to prevent instabilities. This map is shown on the Frontispiece of this report. In general, it agreed quite well with the bathymetry actually measured along our ship tracks except in the following cases: - flexural arches apparent in gravity did not have a bathymetric expression on account of infilling
by the archipelagic apron; - the depth of sedimentary basins between old volcanoes buried in the flexural moat north of the
main chain was often exaggerated; - small volcanoes were smoothed out so that they looked shorter but wider than they actually are. As we collected our own bathymetric data, we overlaid this on the predicted bathymetry. We also were given access to multibeam data from two expeditions to this area conducted on the Jean Charcot and the Sonne, which greatly aided our surveying, particularly in the area of Macdonald Seamount. Overall, this proved to be a very satisfactory solution to the problem of expedition planning without benefit of a bathymetric map and without enough ship time to survey the area in advance of instrument deployment. As planned, our seismic lines found saddles in the seamount chains, and sonobuoys were launched along what proved to be flat stretches of seafloor. We successfully steered the ship to dredge targets that were completely uncharted. The OBH Refraction Experiment For the first refraction line just east of Macdonald Seamount, we deployed 13 ocean bottom hydrophones (OBHs) from Scripps. The OBHs were deployed from south to north with a spacing of 10 to 20 nm. The recovery of the instruments was as follows: OBH1: Acknowledged release command, but rise rate too slow on account of insufficient
buoyancy to rise through the thermocline. Abandoned adrift at 30°18.424S, 140°34.931W. OBH2: Acknowledged release command, but insufficient buoyancy to even lift off the bottom.
Abandoned without anchor on bottom at 29°56.348S, 140°25.670W. OBH3: Recovered at 29°41.799S, 140°19.715W. Data quality appears to be good. OBH4: Recovered at 29°29.864S, 140°14.438W. Data quality appears to be good. OBH5: Acknowledged release command, but rise rate too slow on account of insufficient
buoyancy to rise through the thermocline. Abandoned adrift at 29°21.173S, 140°10.915W. OBH6: Failed to acknowledge release command from the surface. Abandoned anchored at
29°10.748S, 140°06.449W. OBH7: Failed to acknowledge any acoustical commands from the surface. Abandoned anchored
at 29°02.350S, 140°03.084W. OBH8: Failed to acknowledge any acoustical commands from the surface. Abandoned anchored
at 28°52.469S, 139°59.146W. OBH9: Failed to acknowledge any acoustical commands from the surface. Abandoned anchored
at 28°43.658S, 139°55.418W. OBH10: Failed to acknowledge any acoustical commands from the surface. Abandoned
anchored at 28°31.268S, 139°50.124W. OBH11: Failed to acknowledge any acoustical commands from the surface. Abandoned
anchored at 28°19.481S, 139°45.657W. OBH12: Failed to acknowledge any acoustical commands from the surface. Abandoned
anchored at 28°05.469S, 139°39.698W. OBH13: Failed to acknowledge any acoustical commands from the surface. Abandoned
anchored at 27°49.471S, 139°32.895W. The failure of the refraction program to return any significant amount of useful data can be attributed to two problems. The first was a faulty float test before the deployment of the first OBH. The float test was done quickly before the ship had come to a complete stop, and the calculation for the amount of buoyancy failed to take into account the mechanical advantage of a block and tackle. If the float test had been done properly, we would have realized before deploying any instruments that they each needed three glass spheres for buoyancy rather than two. This would have reduced the number of instruments we could have deployed from 13 to 9, but still would have produced a successful refraction experiment. The other problem, failure to

EW9602 Cruise Report 11
respond to acoustics commands, was finally traced by the Scripps personnel on shore to a incorrect resistor incorporated into the acoustics board of 8 of the 13 instruments. The inappropriate resistor reduced the sensitivity of the instrument to acoustic commands. Therefore, even if the float test had been properly done, no data could have been obtained from 8 of the 13 instruments. And if we had been unlucky in which 9 we originally chose to deploy, we might have lost a significant number of those instruments anyway. The Seismic Reflection Profiling The prime purpose of the reflection data acquisition was to image the sedimentary section filling the flexural moats and the Moho at the base of the crust. We deployed a 20 airgun array with a combined source volume of 8385 cu. in. The guns were fired every 21-23 seconds (depending on ship speed), to yield a 50-m shot spacing. The streamer was configured for 148, 25-m groups giving a total length of 3.7 km. We used a sample rate of 2 millisecs and recorded for 16 secs on 3480 cartridge media on the Digicon DMS 2000. QC display and a simple brute stack were available on the vessel during the experiment. The lines were numbered as follows: A1-3 NS line east of Macdonald Seamount A4 Transit to west along line south of Australs A5 NS line west of Macdonald Seamount A6 Transit to west along line north of Australs A7 NS line just west of Rá Seamount A8 Transit north parallel to but east of A7 A9 Moat line from east to west just south of Austral chain A10 Transit south subparallel to A11 A11 NS line east of Rapa Island A12 Transit to west along line north of Austral chain A13-14 NS line west of Rapa Island The Frontispiece shows the locations of these MCS lines, and the Seismic Line Log table at the end of this report gives dates, times, and tape, file, and shot numbers for the starts and ends of each line. The data are stored on approximately 900 magnetic tapes permanently archived at Lamont-Doherty Earth Observatory. Sonobuoy Refraction Data During the reflection profiling, we deployed several sonobuoys along each line. We deployed a total of 45 sonobuoys (including # and #a buoys for cases in which the first deployment failed), and got usable data from 39 of those buoys. Refracted waves emerging as first arrivals were seen on all of the successful sonobuoys. Analysis of these data should allow velocity determination for sediments and the upper part of the oceanic crust. The locations, times, MSC line numbers, and recording information for each sonobuoy are listed in the Sonobuoy Log at the end of this report. Bathymetric Mapping The R/V Maurice Ewing is equipped with a Hydrosweep DS multibeam sonar manufactured by Krupp Atlas Elektronik of Bremen, Germany. The Hydrosweep is a hull mounted 15.5 kHz multibeam sonar which generates both swath bathymetry and amplitude data. The swath consists of 59 formed beams separated by 1.53° to produce a 90° wide swath covering an area twice the water depth wide. The beam footprints are 2.5° in both the along and across track directions. Each bathymetry value has an amplitude value associated with it, providing a low resolution measure of the acoustic backscatter from the seafloor. The Hydrosweep was operated continuously through the cruise, excepting during OBH station work.

EW9602 Cruise Report 12
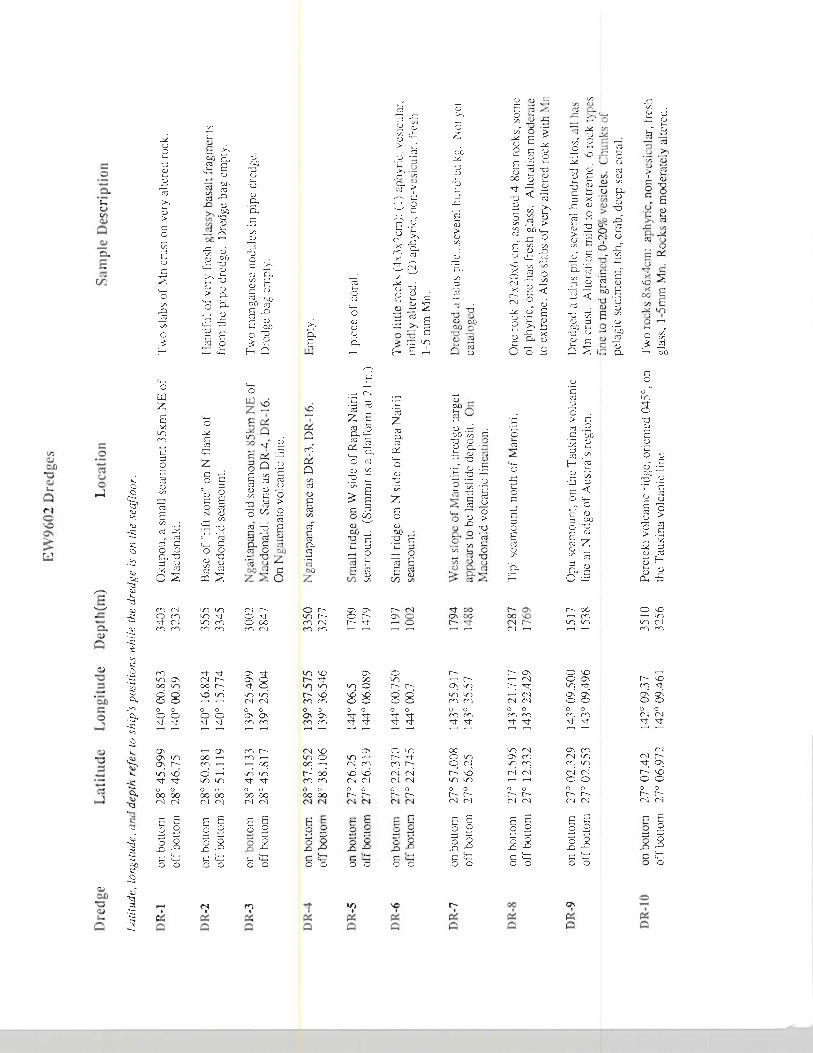
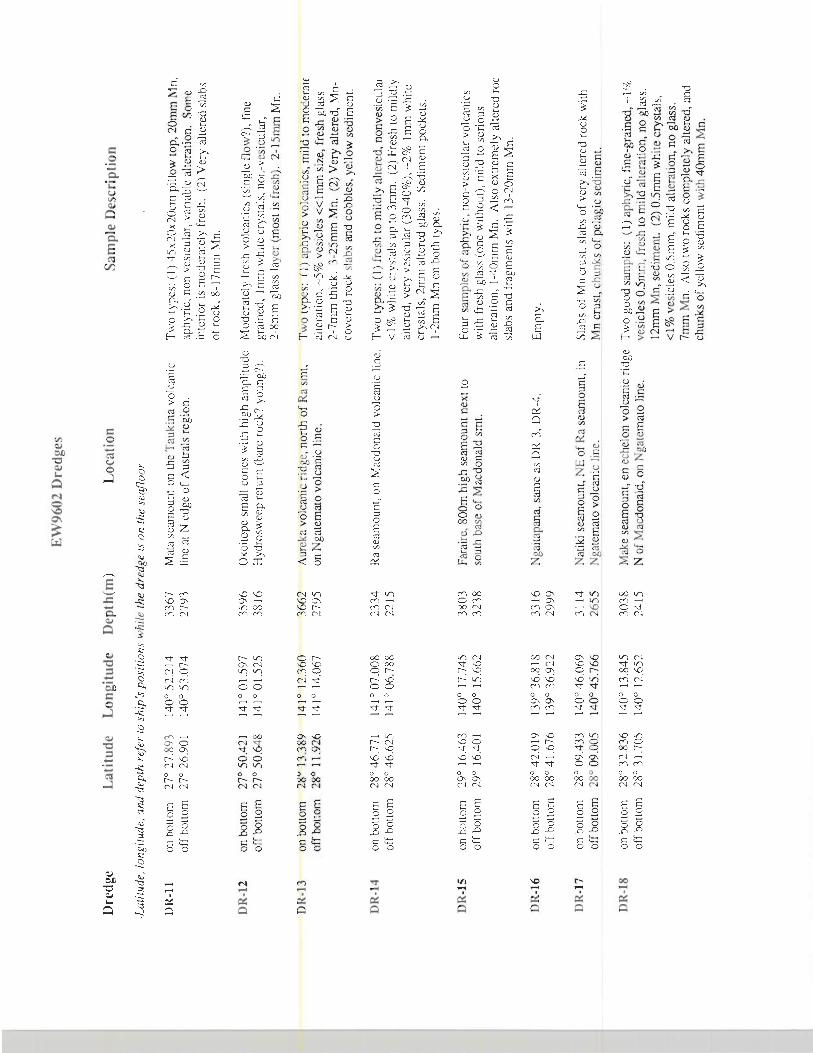
In addition to a 9-track tape archive, the Hydrosweep data is broadcast over the "realtime" segment of the shipboard network and logged in files accessible over the network. During most cruises, the logged data is accessed in near-real-time to generate contour maps on large flatbed pen plotters and for screen displays on a Sun workstation using Bill Ryan's program, MapMaker. During EW9602 we were able to use a Silicon Graphics Indigo 2 Extreme workstation and realtime sonar display software loaned to us by SeaBeam Instruments. The realtime display software, called SeaSurvey, allowed us to view the bathymetry and amplitude data in a variety of 2D and 3D displays during survey operations. SeaSurvey can also be used to interactively determine data values at any point, find the size of structures, determine the distance and heading between points, and to pick waypoints. The realtime map displays were thus useful for both quality control and decision-making during survey operations. The ability to load pre-existing grids into the SeaSurvey display also proved useful. We were able to load grids combining SeaBeam Classic bathymetry (collected by the R/V Sonne in the late 1980's) and bathymetry predicted from satellite-derived free-air-gravity data. We could thus immediately compare the new bathymetry with the old SeaBeam data and the predicted bathymetry and interactively plan our surveys accordingly. We did not fire up the flatbed pen plotters once during EW9602. The Hydrosweep data were initially processed in the usual fashion using the MB-System software package. The processing steps were: 1) Copy raw data (MB format 21) to L-DEO binary format (MB format 24). 2) Recalculate bathymetry by raytracing through a realistic water sound velocity profile. 3) Use a slope filter to flag large artifacts in the bathymetry. 4) Interactively edit the bathymetry, flagging all obvious artifacts. Rob Hagg and Heather Zorn were responsible for all of the Hydrosweep editing. 5) Merge the Hydrosweep data with the final navigation. A single water sound velocity profile was used for the entire survey area (Figure 3). This SVP was obtained by analyzing selected Hydrosweep data using mbvelocitytool and starting with SVP's derived from the Levitus global database and two XBT profiles. Another SeaBeam Instruments software tool, called SeaPatch, was used to look for problems with roll and pitch bias in the Hydrosweep data. We found a roll bias of -0.65° and a pitch bias of 1.0°. There was no bias to the heading values, and also no evidence for problems with the time stamping of the Hydrosweep data relative to the navigation. We did not change the roll bias or pitch bias values in the Hydrosweep until after we left the survey area so that a uniform correction could be made to the data. The final Hydrosweep data were corrected for the roll bias, but not for the pitch bias (Hydrosweep data do not include along-track positions). We did not undertake any significant processing of the Hydrosweep amplitude data. However, we did find it quite useful in characterizing the nature of the seafloor. In particular, pelagic sediments, archipelagic apron, talus piles, old volcanics, and young volcanics all had qualitatively different variations of amplitude vs. grazing angle. It is clear that more use can be made of the amplitude data. The Dredging Program Dredging targets were chosen in order to sample the three line of volcanoes (the Macdonald line, the older line to the north, and the smaller line along the flexural arch) in the Southern Austral Islands over a distance of about 400 km. Dredges were performed off the stern A-frame. For most of the dredges, the pinger was placed at 500 m above the dredge. During several of the first 6 dredges, the dredge became stuck on the bottom. In one case, tension hit the upper limit (10.5 tons) on the tensiometer, but the weak link did not break. Upon inspection of the dredge, we discovered that the “weak link” was a 2-ton shackle, which is supposed to fail at six times its rating. Thus the weak link would not give until tension exceeded at least 12 tons at the winch,

EW9602 Cruise Report 14
and probably more if the weight was being shared by both sides of the dredge. Therefore, after dredge 6, we replaced the weak link by a 1.5-ton shackle. Several dredges later, after more incidences of getting hung up but the weak link not breaking, we installed 1-ton shackles on each side of the dredge basket. The locations of the dredges are shown on the Frontispiece. The Dredge Summary at the end of the report briefly describes each target and the samples recovered. From a visual inspection of the samples, the ages of the rocks appeared to support our theory from analysis of bathymetry and gravity that the northern chain of volcanoes is quite old, whereas the southern and arch chains are less than a few million years old.
PRELIMINARY FINDINGS
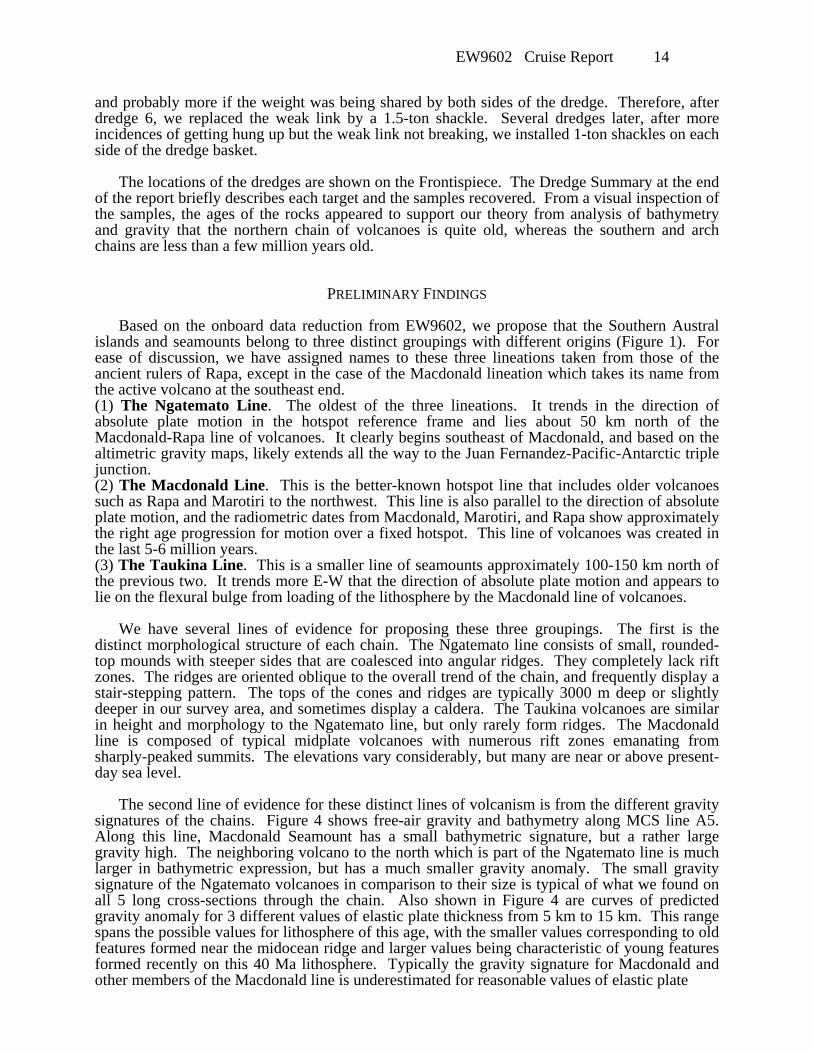
Based on the onboard data reduction from EW9602, we propose that the Southern Austral islands and seamounts belong to three distinct groupings with different origins (Figure 1). For ease of discussion, we have assigned names to these three lineations taken from those of the ancient rulers of Rapa, except in the case of the Macdonald lineation which takes its name from the active volcano at the southeast end. (1) The Ngatemato Line. The oldest of the three lineations. It trends in the direction of absolute plate motion in the hotspot reference frame and lies about 50 km north of the Macdonald-Rapa line of volcanoes. It clearly begins southeast of Macdonald, and based on the altimetric gravity maps, likely extends all the way to the Juan Fernandez-Pacific-Antarctic triple junction. (2) The Macdonald Line. This is the better-known hotspot line that includes older volcanoes such as Rapa and Marotiri to the northwest. This line is also parallel to the direction of absolute plate motion, and the radiometric dates from Macdonald, Marotiri, and Rapa show approximately the right age progression for motion over a fixed hotspot. This line of volcanoes was created in the last 5-6 million years. (3) The Taukina Line. This is a smaller line of seamounts approximately 100-150 km north of the previous two. It trends more E-W that the direction of absolute plate motion and appears to lie on the flexural bulge from loading of the lithosphere by the Macdonald line of volcanoes. We have several lines of evidence for proposing these three groupings. The first is the distinct morphological structure of each chain. The Ngatemato line consists of small, rounded-top mounds with steeper sides that are coalesced into angular ridges. They completely lack rift zones. The ridges are oriented oblique to the overall trend of the chain, and frequently display a stair-stepping pattern. The tops of the cones and ridges are typically 3000 m deep or slightly deeper in our survey area, and sometimes display a caldera. The Taukina volcanoes are similar in height and morphology to the Ngatemato line, but only rarely form ridges. The Macdonald line is composed of typical midplate volcanoes with numerous rift zones emanating from sharply-peaked summits. The elevations vary considerably, but many are near or above present-day sea level. The second line of evidence for these distinct lines of volcanism is from the different gravity signatures of the chains. Figure 4 shows free-air gravity and bathymetry along MCS line A5. Along this line, Macdonald Seamount has a small bathymetric signature, but a rather large gravity high. The neighboring volcano to the north which is part of the Ngatemato line is much larger in bathymetric expression, but has a much smaller gravity anomaly. The small gravity signature of the Ngatemato volcanoes in comparison to their size is typical of what we found on all 5 long cross-sections through the chain. Also shown in Figure 4 are curves of predicted gravity anomaly for 3 different values of elastic plate thickness from 5 km to 15 km. This range spans the possible values for lithosphere of this age, with the smaller values corresponding to old features formed near the midocean ridge and larger values being characteristic of young features formed recently on this 40 Ma lithosphere. Typically the gravity signature for Macdonald and other members of the Macdonald line is underestimated for reasonable values of elastic plate


EW9602 Cruise Report 16
thickness, while that for the Ngatemato line is overestimated. This misfit is not caused by changes in the sizes of the volcanoes perpendicular to the line of the profile in that the theoretical curves were calculated from a fully 3 dimensional model of the bathymetry in this area which is well-constrained by Hydrosweep and SeaBeam data. However, we can obtain a rather good fit to the gravity data (Figure 5d) with a simple two-dimensional model which assumes that Gaussian loads (Figure 5a) are placed on an elastic plate. The first load (the Ngatemato seamount) is formed near-ridge, such that it loads an elastic plate only 5 km thick. The second load (the Macdonald seamount) loads a stiffer, 15-km thick plate more recently. The difference in gravity signature is caused by the greater support by the elastic plate in the later case. Note that the weak plate is flexed to form a much deeper trough (Figure 3b) under the Ngatemato seamount. After the load sinks to fill the trough, it does not appear as prominent in the bathymetry (Figure 5c) even though it is far more voluminous than the younger Macdonald seamount (Figure 5a). Figures 6 and 7 show similar data and modeling for MCS line A11 near Rapa. Again, the Ngatemotu seamount is larger in volume but loads a weaker plate and produces a small gravity signal. Thus the Ngatemato and Macdonald chains can be distinguished by the different magnitude of their gravity signatures and by their different volumes. The Taukina line is predicted to lie on the flexural arch of loading by the Macdonald line in this analysis. The more E-W trend of this chain compared with that of the other two is explained by the fact that the position of the flexural arch migrates away from the Macdonald chain as one moves from NW to SE in this survey area on account of the increasing thickness of the elastic plate between Rapa and Macdonald. The Taukina seamounts are too small to produce discernable plate flexure, but their gravity signature is consistent with the hypothesis that they are also young features loading a stiff plate. The third line of evidence in support of the model proposed comes from the dredging program. In general, rocks from the Macdonald and Taukina seamounts included fresh-looking, angular basalts. These seamounts were relatively easy to dredge. On the other hand, the Ngatemato seamounts were difficult to dredge. Samples were mostly highly altered basalts thickly encrusted with manganese. The final observational support for our model is provided by the Hydrosweep amplitude data. The young seamounts were typically far more acoustic reflectivity than the Ngatemato seamounts. In particular, our first clue that Evelyn seamount, the southeasternmost of the Taukina line of volcanoes, might be young came from its brightly reflective character in the Hydrosweep amplitude data. In terms of the original hypotheses proposed earlier in this report, the results presented above demonstrate that the earliest, Ngatemato phase of volcanism, began as a near-ridge melting that backtracks to the location of a current microplate. However, we have not yet determined whether indeed a microplate existed in this region at 40 Ma, and if it did, whether the trace of its triple junction would have followed the direction of absolute plate motion. (Or perhaps, whether a near-ridge hotspot would have in some way captured the triple junction.) The fact that the first, very voluminous chain existed, however, appears to have strongly controlled the later locus of the Macdonald chain, which in turn determined the location, strike, and age of the Taukina volcanism. The Macdonald chain may not represent a true plume from the core/mantle boundary, but may instead be merely a locally hotter place in the upper mantle that produces more melt that can rise through weak spots in the overlying lithosphere. In addition to the correlation of volcanism with the microplate’s triple junction, it is notable that the volume of the Austral chain, for both the Ngatemato and Macdonald phases, is greatest where the Adventure Trough, a major outer pseudofault that cut through older Pacific crust generated at the Pacific/Farallon Ridge, intersects the microplate’s lineation. Therefore, Heather Zorn analyzed the magnetic anomalies in our survey region to determine the age offset along this lineation and how far north beneath the Australs it might extend.

EW9602 Cruise Report 17
Figure 5. Two-dimensional model of loading of the lithosphere in the Austral Islands for profile A5. The first panel shows the size of the loads assumed. The old, Ngatemato load (dotted line) is approximated as a Gaussian seamount with amplitude 6500 m, Gaussian half-width of 40 km, and located 50 km to the right (northeast) of the center of the profile. The dashed line is the younger Macdonald seamount, with a height of 2600 m, width of 50 km, and located 25 km right of the center of the profile. This seamount appears skewed because it is assumed that its load in the areas where the Ngatemato seamount occurs can only accumulate once it is taller than the Ngatemato seamount. The solid line is the sum of the two loads. The second panel shows the flexure of the lithosphere induced by the two loads. The old seamount loads a 5 km elastic plate (dotted line) while the young seamount loads a 15 km elastic plate (dashed line). The sum of the two deflections is the solid line. The third panel compares the actual bathymetry (thick line) with the predicted bathymetry (thin line) from this model after the loads subside into the flexural moat. The final panel compares observed (thick line) and predicted (thin line) free-air gravity anomalies. The match at the edges of the profile is poor on account of the omission of many seamounts, but the model is successful in predicting that the gravity signatures of the two loads are similar despite the fact that the old Ngatemato load is much larger.
EW9602 Cruise Report 19
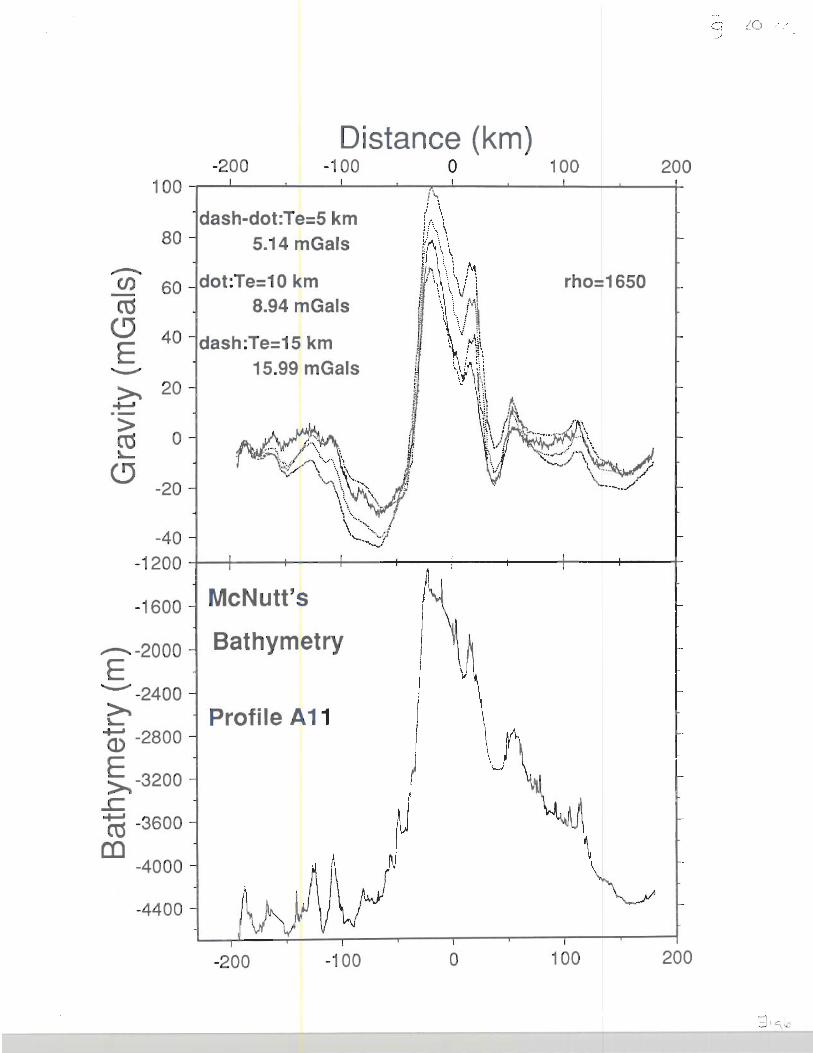
Figure 7. Same as Figure 5 but for profile A5. In the first panel, the old, Ngatemato load (dotted line) is approximated as a Gaussian seamount with amplitude 9500 m, Gaussian half-width of 50 km, and located 35 km to the right (northeast) of the center of the profile. The dashed line is the younger Rapa seamount, with a height of 7500 m, width of 50 km, and located at the center of the profile. In the second panel, the old seamount loads a 5 km elastic plate while the young seamount loads a 10 km elastic plate. The sum of the two deflections is the solid line. The third panel compares the actual bathymetry (thick line) with the predicted bathymetry (thin line) from this model after the loads subside into the flexural moat. The final panel compares observed (thick line) and predicted (thin line) free-air gravity anomalies. The match is better along this profile than for the first because other, smaller volcanoes near the edges of the profiles are buried in the flexural moat so that they do not have a bathymetric or gravity signature.

EW9602 Cruise Report 20
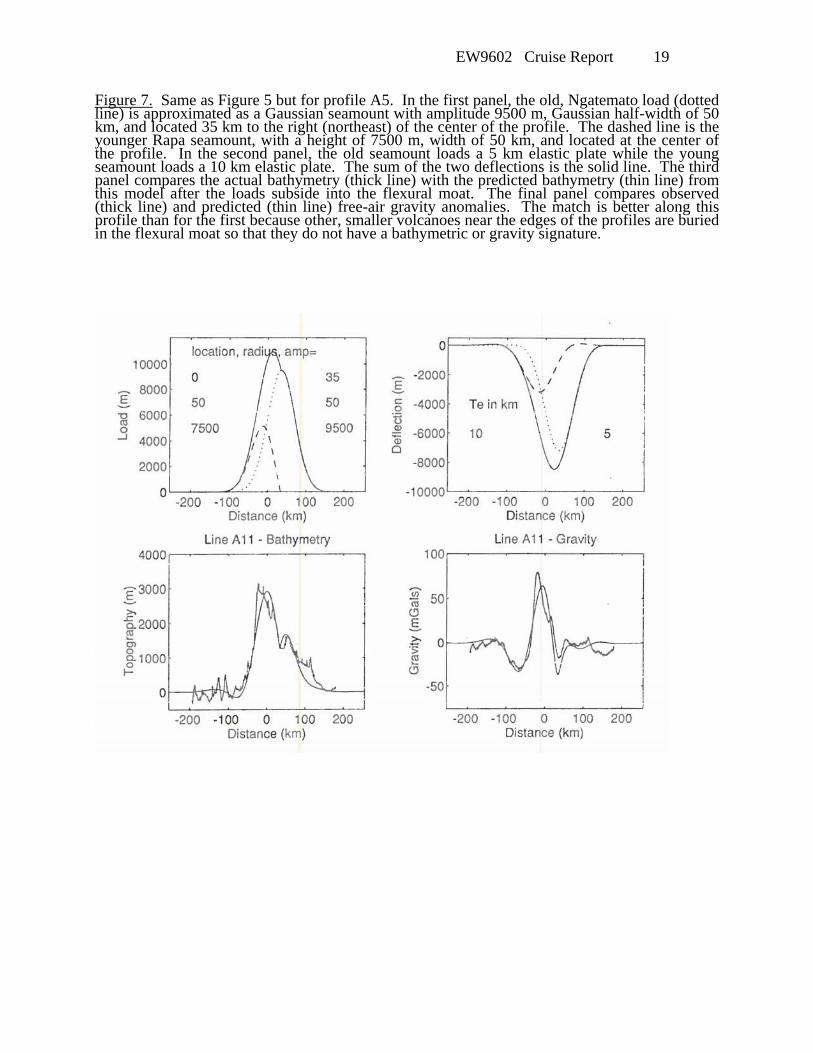
Magnetic data for lines A1, A5, A7, A9, A11, A13 and the incoming transit line B are presented in Figure 8. From these six tracks, anomalies 20-25 were identified. These anomalies approximate the magnetic anomalies synthetically modeled using a spreading center strike of 340˚ at 29˚S. Anomalies 22-24 found on profiles A9 and B yield a half-spreading rate of 36 km/my, although anomaly 22 on profile A9 may be truncated by the Adventure Trough. Using the proposed half-spreading rate of 36 km/my, about 45 km of crust is missing along the Adventure Trough between anomaly 21 and anomaly 22 on profile A7, 60 km between anomaly 20 and anomaly 21 on profile A5, and 70 km between anomaly 20 and anomaly 21 on profile A1. These calculations suggest that the Adventure Trough represents an offset of only 2 my in lithospheric age. However, its gravity signature (Figure 4) suggests that it is a major structural feature within the Pacific plate.
POST-CRUISE DATA ANALYSIS
Our future research activities will focus on testing various aspects of the model proposed above. For example, constraints from the 6 lines of multichannel seismic data have not yet been brought to bear on the models since the shear volume of data makes on-board processing of long seismic lines difficult. Chemical and isotopic analyses of the dredge rocks also requires use of major facilities not available on board the Ewing. Specific questions we can address with the data in hand are: (1) Do radiometric ages support the hypothesis that the Ngatemato line is nearly as old as the lithosphere (~40 Ma), while the Macdonald and Taukina lines formed in the last 5 Ma? (2) Does Hydrosweep reflectivity correlate with the results from radiometric dating, such that younger seamounts appear consistently brighter than old ones? If so, such data could provide an inexpensive proxy for radiometric ages for features not sampled. (3) Does the sedimentary stratigraphy in the flexural moat as imaged by the multichannel seismic data show onlapping of older Ngatemato sediments by younger Macdonald sediments? Is the progressive onlapping to the southeast along the moat on older sediments from the northwest by younger sediments to the southeast? (4) Are age progressions along any of the 3 lines consistent with motion over a fixed hotspot? (5) Do we find evidence in the major element chemistry of the rocks for large volumes of melt production beneath a thin plate to make the Ngatemato line, and smaller volumes of melt beneath a thicker lithosphere to make the Macdonald line? (6) Are there distinct radiogenic isotopic signatures associated with each line? For example, the Ngatemato line might reasonably be of MORB geochemistry if it formed near the midocean ridge. The Macdonald line might be dominated by a hotspot geochemical signature, while the Taukina chain would be an uncontaminated sample of the geochemistry of the Polynesian upper mantle away from the hotspot. (7) Does the depth and width of the flexural moat along and across strike support the interpretation from gravity that the two main chains loaded plates with different flexural rigidities? Is there evidence for magmatic underplating in the form of an anomalously shallow moat given its flexural width? (8) Does the position of the Moho as determined by the MCS and sonobuoy data support the predictions from the flexural modeling of a very asymmetric moat that is deeper and narrower to the north than on the south? (9) Does a fully three-dimensional gravity model of elastic plate loading for two different ages of seamounts and two different effective elastic thicknesses confirm the preliminary results based on 2-D modeling? (10) Are there structural features in the crust as imaged in the reflection data that control the locus and changes in volume of volcanism along the chains of volcanoes? Although there are clearly many tests of the proposed model for volcanism in the Austral Islands yet to be done, it is likely that none of the data in hand will give an unambiguous
EW9602 Cruise Report 21
Figure 8. Magnetic anomalies along lines A1, A5, A7, A9, A11, A13 and the transit line B superimposed on a grey-shade image of the Southern Austral Islands. The positive anomalies are oriented perpendicular to the track line on the northern/western side. The white numbers refer to magnetic anomalies previously identified by Cande and Haxby. Correlated anomalies are connected with black lines. Stars note the locations where the correlations were uncertain.
EW9602 Cruise Report 22
determination of the deflection of the Moho beneath the central and northern part of the chain where our model (Figures 5 and 7) make the most specific predictions concerning crustal structure. The reflection and sonobuoy refraction data simply do not produce arrivals out to 40-60 km where we might expect to see turning rays from the base of the crust. Thus we will need to return to the Austral islands at some future date with ocean bottom seismometers to accomplish the refraction work that was prevented by the loss of the ocean bottom hydrophones during this experiment.
COMMENTS AND RECOMMENDATIONS
All expeditions encounter some problems, but EW9602 seems to have had more than its share (prompting some imaginative T-shirt designs). Most of the difficulties (e.g., OBH failures, bad weather) were beyond the control of the ship operators. However, of Lamont’s scientific equipment, only the gravimeter worked flawlessly. The Hydrosweep system experienced frequent crashes in the middle of the cruise, but a round of board-swapping by Bruce Francis seems to have fixed this problem. The airgun system went down once on account of a hydraulic leak, but otherwise ran smoothly with most guns in the water for the entire two weeks of MCS work. Some other problems that still need to be attended to include: (1) the MCS streamer. All Lamont personnel put forth a heroic effort to get a working cable deployed. It took 3 separate 24-hour-plus attempts at deployment to finally get a cable 3.7 km long. This streamer worked well throughout the deployment, but it was somewhat of a disappointment since we had anticipated having a minimum of 4.5 km of active sections, and had been told that as much as 6 km could be available at the time we submitted the proposal for this expedition to NSF. Given the deep targets we were attempting to image, the extra cable length would have made a substantial difference. Bruce Francis and Chris Liedhold believe that the power adapter section may be the problem with getting more than 3.7 km of working cable. In the short term, Lamont should try to repair or replace this section. In the long term, Lamont and the rest of the MCS community need to work to upgrade the streamer situation on board the Ewing since it is the only MCS capability in the UNOLS fleet. (2) the level wind on the winch. It is not wrapping to the ends of the drum well enough to prevent loose wraps. This problem slowed down the recovery on several dredges and required setting aside 8 hours of ship time to reel out the entire core winch wire and rewrap it without the dredge. The problem was exacerbated by the fact that we ended up doing more dredges than originally anticipated on account of the loss of the OBHs. (3) the magnetometer. The present magnetometer is on its last legs. It experienced electrical problems that were more severe in bad weather. For this reason, we chose not to deploy the instrument in rough seas in an attempt to nurse it along until the end of the leg. We understand that a new magnetometer is on order. It should be installed as soon as possible, and certainly before any expedition for which magnetic anomaly data are a priority. (4) Hydrosweep. During the first two weeks we found that “augers” (large artifacts consisting of many adjacent beams that are far too deep) occurred whenever a "soft" sedimented bottom was encountered. The augers were preferentially located in the inner port side of the swath. Later the sonar performance deteriorated further, with frequent dropping of groups of eight beams at apparently random locations across the swath and with numerous instances of system faults, crashes, and hangs. Bruce Francis and Chris Liedhold cleaned and swapped boards and processors in an attempt to fix the sonar. Following their efforts, the sonar performance was greatly improved. The sonar performed reasonably reliably the last three weeks of the cruise (no further crashes or mass beam drops), albeit still with significant numbers of artifacts that required intensive editing. In the end, we were not sure whether the poor sonar performance we had encountered was caused by bad boards, processors, or the airguns, in that the end of MCS profiling also approximately coincided with the end of Hydrosweep problems. At the very least, the boards that were removed from the system should be checked and repaired so that spares are available on board.

EW9602 Cruise Report 23
(4) the science library. Rumors of the intent to supply some books for a science library have been circulating for 5 years at least, but no books have materialized. Expeditions such as EW9602 are used as educational experiences for the undergraduate and graduate students in the scientific party, as well as for basic research, and it is frustrating not to have some material to give students to read when they ask questions about basic marine geology and geophysics. It would be most helpful if some scientific text and reference books were available on board in support of both the research and educational missions.
CRUISE NARRATIVE
Sunday, March 24, 1996 (JD 84-85) We cast off from Lyttelton, New Zealand on schedule at 9 am and were underway by 10 am. Monday, March 25-Sunday, March 31 (JD 85-92) Underway to Austral Islands. We accomplished the 9-day transit in 8 calendar days because of the date-line crossing. We only had one good weather day on the entire transit. Most of the time we were in the midst of one of two low-pressure areas in the South Pacific that cause uncomfortable amounts of rolling or pitching and large amounts of water over the fantail. Once outside of the New Zealand 200-mile limit, we deployed the magnetometer. On parts of the survey, we had problems with Hydrosweep losing bottom when the water depth was over 5 km and the basement covered by soft pelagic sediments. The magnetometer also had frequent electrical problems, which Bruce Francis attributed to a failing connector. We decided to wait to fix it until we arrived at the site to deploy the streamer. Since we would be traversing the same lines several times during the reflection and refraction portions of the experiment, any magnetic data missed on the first pass could be sampled during a later pass. Monday, April 1 (JD 92-93) Arrived on station for streamer deployment at 0830L. Science Officer deemed that the weather was too rough to deploy the streamer. We waited in the area until 1400L, hoping that the weather would clear. The winds did drop from 30 kts to less than 20 kts, but Bruce Francis still felt that it was unsafe to launch the streamer. Therefore, the decision was made to go forward with the OBH part of the program first, for at least Line A1 and probably Line A3. We performed a float test of an OBH at 1400L, and then began preparing the OBHs for launch. We came onto station for the first OBH deployment, and launched it successfully at 1930L. Tuesday, April 2 (JD 93-94) Continued to deploy OBHs 2, 3, 4, 5, and 6 through the night. We stopped for about 1 hour short of OBH site 7 to move the dredge and dredge weight from A deck down to the stern. Deployed OBH 7 at 0830L. Steamed to seamount just north of Macdonald for a dredge in order to give the OBH techs some rest. We did a survey of the seamount, which turned out to be a sequence of cones elongated in the direction of absolute plate motion. We dredged the lower-relief, frontal lobe of the seamount. The dredge returned only two rocks, both of which had significant manganese encrusting. We propose the name “Burns Seamount” for this feature, after Roger Burns, an MIT mineralogist who was responsible for formulating the chemical reactions for manganese precipitation on the seafloor. Roger died rather suddenly of cancer about 2 years ago. Dredge was secured about 1700L, and we were underway to the site of the next OBH deployment. Deployments continued through the night. Wednesday, April 3 (JD 94-95) Began deploying the airguns at dawn and had them firing around breakfast time. This first refraction line will be shot from NE to SW just east of Macdonald Seamount. Total length of the line is about 200 km. Pop rate is 120 seconds and ship speed 3-4 knots. Airgunning proceeded smoothly through the day and night.
EW9602 Cruise Report 24
Thursday, April 4 (JD 95-96) Continued shooting refraction Line 1. Friday, April 5 (JD 96-97) Continued shooting refraction Line 1. Saturday, April 6 (JD 97-98) Finished shooting refraction Line 1 in the early morning hours. Pulled in the guns and steamed back to the deployment site of OBH-1 for recovery. Sent release code to instrument about 0730L and it was acknowledged, but based on the slope of the return ping on the PDR the rise rate was so slow that it would take 22 hours to rise. Decided to return later. Steamed to OBH-2. Had difficulties with instrument hearing ship’s transducer. Instrument acknowledged release code from portable transducer deployed over side of ship, but several hours later did not appear to have risen any appreciable amount in the water column. Couldn’t gauge exact change in range from outgoing and incoming pings because couldn’t get portable transducer to record on PDR. Moved on to OBH-3. OBH-3 was located and it acknowledged the release command at approximately 1831L. Took nearly 6 hours to surface. When it arrived on the surface, only half of the flag was barely floating out of the water. On recovery, the OBH kept getting sucked under the ship. It was finally snagged and hauled on board manually over the port fantail deck. Instrument was in good shape and the data appeared to be high quality. Sunday, April 7. (JD 98-99) Returned to OBH-1 in the early hours of the morning, near the time that it was predicted to surface. Couldn’t find any trace of the OBH visually, on the sonar, or on the radio. Searched in the area until approximately 0930 for the instrument, then decided to get underway for OBH-4. Crispin Hollinshead determined that he had made an error in calculating the buoyancy from the float test and that the instrument was only half as buoyant as the 25 lbs that had been originally calculated. Sara Bazin remembered that one of the three instruments originally deployed had an extra C cell battery in the beacon as compared with the others. If that was OBH-2, that might explain why OBH-2 never left the bottom of the ocean. Arrived at OBH-4 at about 1400L. After the enable command was acknowledged, couldn’t get any further response from the instrument. Went on to OBH-5. Same story - finally got a release at about 1830, but rise rate was slow. Returned to OBH-4 about 1930L. Got good acoustics, but instrument was still on bottom. Got it to release, and rise rate was calculated at 900 m/hour, the fastest yet. Returned to OBH-5 for recovery, but found it wallowing at 1600 m, without rising any more. Monday, April 8. (JD 99-100) Returned to OBH-4 and recovered it about 0115L. OBH-5 still had risen much further. Went off to dredge N rift of Macdonald. Got a few rock chips in the pipe weight at the end of the dredge bag. Steamed to OBH-7. No response. Tuesday, April 9 (JD 100-101) Tried to contact OBH-8 in the early morning hours. No response. Made an attempt to dredge the farthest SE in a small line of seamounts just north of Macdonald. Got only manganese nodules. Tried to raise OBH-9 and OBH-10. No response. Lowered one of the recovered OBHs on the dredge wire while we were on station at OBH-9. Able to hear it, so problem is not just poor ship acoustics, although reception could have been better. Wednesday, April 10 (JD 101-102) Tried another dredge on presumably old seamount NE of Macdonald. Got a lot of very big tugs, but not rocks. Tried to communicate with OBH-10 again - no luck. During the afternoon and evening, finishing running up the line to OBHs 11-13. No response from any of them.
EW9602 Cruise Report 25
Thursday, April 11 (JD 102-103) Began deploying the streamer in the early morning hours. Tailbuoy was over the side at about 0700 L. Had to swap some bad sections, fill up some empty sections, and add 140 lbs of lead to ballast the streamer for warm water. Finished the initial deployment shortly after midnight. Friday, April 12 (JD 103-104) Could only build 2.8 km of the streamer. Decided to collect data with only this short streamer in order to give Bruce and Chris a chance to rest. Calling this part of the line Australs 1 (A1). Developed a plan for changing sections and cans. Began after dinner pulling in streamer. Saturday, April 13 (JD 104-105) Completed redeployment of streamer in early afternoon. Continued down line east of Macdonald (continuation of line is A2). Deployed the first sonobuoy after dinner. Sunday, April 14 (JD 105-106) Continued along the first MCS line, with a deviation westward just after passing Macdonald seamount in order to pass over OBHs 3 and 4 (since we have that refraction data) and over OBH-2 (to see if we can still hear it with the ship’s acoustics). Experienced frequent crashes of the streamer in the morning hours and early afternoon, such that we needed to change the line number to A3 by the time we finished it. Turning up the voltage to the streamer appeared to fix the problem, at least temporarily. Peter’s program crashed 21 times without recovery. Monday, April 15 (JD 106-107) Completed the first line east of Macdonald (A1-3). Started experiencing frequent streamer crashes again after lunch. Decided to pull streamer. Got in all but 500 m, breaking the streamer at each can and checking for voltage problems. Found a precipitous drop in power at can 5 (voltage drop of nearly 50%. Tuesday, April 16 (JD 107-108) Completed redeployment of the streamer about lunch time, another 24 hour marathon. In the process of redeployment, we opened up every can to check for bad connection. Ended up taking out three sections, so now we have 3.7 km of active streamer. Never did find anything obviously wrong that would have been responsible for the streamer crashes and failure to rebuild. Began shooting the second seismic line just west of Macdonald seamount (called Austral 5). Wednesday, April 17 (JD 108-109) Continued shooting the second long N-S seismic line (A5). System behaving well, but have to keep up a faster speed than we want because of a strong swell from the south that keeps pushing the streamer up. Thursday, April 18 (JD 109-110) Finished up the second long line (A5) and transited over (MCS Line A6) to the third. Streamer behaving much better and slower speeds are possible. Friday, April 19 (JD 110-111) Continued shooting the third long line (A7). Wind up and from the west this time, but otherwise everything going well. Saturday, April 20 (JD 111-112) Finished shooting the third long line (A7). Turned back in early afternoon to parallel it 8 km to east (MCS Line A8) to position the ship at the start of the moat line.
EW9602 Cruise Report 26
Sunday, April 21 (JD 112-113) Turned on to the moat line (A9) at about 5 am. Got great signal from the moat, both in terms of Moho imaging and sonobuoy refractions. Unfortunate that entire line is spent rolling in the trough. Monday, April 22 (JD 113-114) Finished up the moat line (A9). Turned to transit (MCS Line A10) down to beginning of Rapa line. Tuesday, April 23 (JD 114-115) Shooting Rapa line (A11). Wednesday, April 24 (JD 115-116) Launched rescue boat at 6 am while underway with MCS gear to pick up Hans Barsczus at Rapa. Closest approach to island was about 10 nm. Pick up went smoothly. Second mate, chief engineer, and chief scientist returned with Barsczus and his 200 kg of rocks in time for breakfast. Continued running Rapa line (A11) until the early hours of the following morning. Thursday, April 25 (JD 116-117) Turned for small transit (MCS Line A12) westward to last reflection line west of Rapa (Line A12). Began shooting last line (A13) around breakfast time. Friday, April 26 (JD 117-118) Completed final MCS line at about 2230L. Only interruption was caused by a broken air hose at about 10 am that caused the guns to flood and shut down data acquisition for about 2.5 hours. We circled the ship to avoid a data gap. Line number after shooting resumed is A14. Completed shooting this reflection line at 2240L and began pulling in seismic streamer. Saturday, April 27 (JD 118-119) Completed recovery of MCS gear at 0400L. Began steaming to dredge site at Rapa. Spent some time circling the island, but failed to find any deep incisions that looked like good opportunities to sample deep stratigraphic levels of the edifice. Moved on northeastward to another shallow volcanic bank lying somewhere between the northern volcanic trend and the southern line. We informally call this bank “Rapa Narii” because it is close to Rapa. Two dredge attempts on this volcano finally yielded two small pieces of basalt in the early morning hours (Dredges 5 and 6). Sunday, April 28 (JD 119-120) Did small survey of Marotiri and collected a large haul of rocks and basalt on one dredge attempt (Dredge 7). During the dredging, we launched the work boat so that Hans Barsczus could sample the emergent spires of Marotiri. However, the surf proved too rough for the small shore party to safely land on the rocks and sample them. Moved on to a small seamount well north of Marotiri (“unRapa”). Dredged up some old-looking basalt and manganese slabs (Dredge 8). Monday, April 29 (JD 120-121) Performed another dredge (Dredge 9) on a small seamount north of the main Australs line. Got lots of relatively unaltered but old basalt. Did another wireline test of the OBHs, using one of the recovered units and another unit with a newer-style acoustics board identical to the ones that never responded to the enable command. Found that the old unit performed just fine, but the unit with the new board was unable to communicate with the ship at depths below 3000 m. We could hear its pings, but it only intermittently heard our pings. Started working on ways to boost power from the ship to try to communicate with some of the instruments still on the seafloor. Tuesday, April 30 (JD 121-122) Dredged two more old seamounts in the north-central part of the chain (Dredges 10 and 11). Got good samples both times.

EW9602 Cruise Report 27
Wednesday, May 1 (JD 122-123) Completed one more dredge (dredge 12) by noon. Decided to steam to deep water site to lay out all of winch wire because it was becoming too difficult to wrap properly. Experiencing shaft problems for the last few days that don’t allow the ship to maintain low RPMs. Thursday, May 2 (JD 123-124) Completed Dredge 13 in the early morning hours. Pinger died 20 minutes into the dredge, but came on again on the way up. Transited to Rá Seamount for Dredge 14. During the previous evening, the weather got noticeably rougher. We are now back to sustained 25 knot winds and high seas that will make dredging and OBH recovery difficult. After dredging Rá, moved on to a small seamount just south of Macdonald. Friday, May 3 (JD 124-125) Completed dredge of small seamount near Macdonald (Dredge 15). Began final attempt at OBH recovery. Managed to establish acoustic contact with OBH-6 using ship’s Edo (6 times more powerful that OBH box). Enabled the instrument, but decided to return to release it later so that it would surface at night. Bad decision. Went on the OBHs 7 and 8, but never established contact with them, nor did we re-establish contact with OBH-6 upon returning there in the early evening. Also tried using an OBH as a relay transponder on the dredge wire, but that didn’t work either. Steamed off to Dredge 16 Saturday, May 4 (JD 125-126) Failed to recover any rocks from Dredge 16, an “old” volcano just NE of Macdonald. This was the third attempt to dredge this feature, each one of which resulted in an empty dredge basket. Began a Hydrosweep survey of the “old” line of volcanoes beginning at Macdonald and going to the northwest. The survey continued through the night. Sunday, May 5 (JD 126-127) Continued survey of SE end of old seamount chain. Stopped in midafternoon for a dredge (Dredge 17). Recovered some small rocks encrusted with manganese. Monday, May 6 (JD 127-128) Completed survey and conducted final dredge (Dredge 18) on old seamounts in flexural moat. Recovered quite a number of fist-sized rocks. Made final attempt at OBH communication with OBH-10. No answer. Steamed north to Evelyn seamount to sample what we believe might be an arch volcano. Pulled up the dredge before midnight, with many very fresh basalt samples. Tuesday, May 7 (JD 128-129) Surveyed and dredged last arch volcano. Came up with the biggest dredge haul yet. Continued to run a Hydrosweep line along the northern flexural arch until dinner time when we had to break off scientific operations for transit back to Tahiti. Wednesday, May 8 - Friday, May 10 (JD 129-132) Continued transit back to Tahiti. Performed belated dateline crossing ceremony during transit. Stopped about 150 km south of Tahiti for a last dredge of one of the young volcanoes on the Society Island arch. Saturday, May 11 (JD 132-133) Arrived in Papeete in early morning hours.

EW9602 Cruise Report 28
Scientific Party
Marcia McNutt Chief Scientist [email protected] 54-826 MIT, Cambridge, MA 02139 David Caress Co-Principal Investigator [email protected] SeaBeam Instruments, 141 Washington Street, East Walpole, MA 02032 Peter Buhl Seismologist [email protected] Lamont-Doherty Earth Observatory, Palisades, New York 10964 Jennifer Reynolds Petrologist [email protected] USGS, Hawaiian Volcano Observatory, POB 51, Hawaii Volcanoes National Park, HI 96718 Hans Barsczus Petrologist [email protected] Centre ORSTOM, B.P. 5045, F-34032, Montpellier Cedex 2, France Kelsey Jordahl Graduate Student [email protected] 54-810, MIT, Cambridge, MA 02139 Heather Zorn Undergraduate Student [email protected] Worner Box 139, Colorado College, Colorado Springs, Colorado 80946 Scripps Institution of Oceanography participants: Sara Bazin Graduate Student [email protected] Harm Van Avendonk Graduate Student [email protected] David Willoughby OBH Technician Crispin Hollinshead OBH Technician Paul Zimmer OBH Technician All SIO personnel at: Scripps Institution of Oceanography, La Jolla, California 92093 Lamont-Doherty Geological Observatory participants: Bruce Francis Science Officer Christopher Leidhold Electrical Technician Sefano Budhypramono System Manager [email protected] Robert Hagg Technician John DiBernardo Pneumatic Sound Source Officer Paul Olsgaard Gunner Michael Wittreich Gunner Matthew Cheslik Gunner Ropate Maiwiriwiri Core Bosun All Lamont personnel at: Lamont-Doherty Earth Observatory, Palisades, New York 10964

EW9602 Cruise Report 29
EW6902 Seismic Line Log Line JD Time Tape File Shot A1 - start 103 1525 1 100 3000 A1 - end 104 0059 21 1737(?) 4641 A2 - start 104 2305 22 100 5000 A2 - end 105 2110 85 3550(?) 8450 A3 - start 105 2115 85 100 8458 A3 - end 106 2117 149 3511 12214 A4 - start 106 2138 150 100 12234 A4 - end 107 0003 156 >208 >12615 A5 - start 107 2136 6 100 13000 A5 - end 109 1826 293 7761 20668 A6 - start 109 1836 294 103 20714 A6 - end 110 >0142 315 >1318 >3715 A7- start 110 0300 316 100 22016 A7 - end 111 2333 365* >2965 >29657 A8 - start 112 0105 448 103 30003 A8 - end 112 1516 489 2535 32436 A9 - start 112 1556 490 104 33004 A9 - end 114 0329 585 5667 38568 A10 - start 114 0500 586 101 40007 A10 - end 114 1803 621 2139 42049 A11 - start 114 1912 622 100 43018 A11 - end 116 1227 734 6551 49474 A12 - start 116 1249 735 100 50007 A12 - end 116 1619 744 648 50555 A13 - start 116 1644 745 100 51000 A13 - end 117 2005 824 4557 >56415 A14 - start 117 2243 825 113 57014 A14 - end 118 0848 855 1843 58745 * Tape numbers went backwards and file number was reset to 100 on JD 111, 0650Z. Tape number previously reached 397 and reset to 316. File number was 4827 and reset to 100.

EW9602 Cruise Report 30 EW6902 Sonobuoy Log
Buoy #
Line #
Latitude
Longitude
JD Date
Time
Tape
File
Shot
1 A2 -28°18.627’ -139°30.066’ 105 0438 38 969 5864 2 A2 -28°48.96’ -139°42.18’ 105 1155 58 2107 7003 3 A2 -29°16.182’ -139°55.019’ 105 1905 79 8123 4 A3 -29°45.109’ -140°20.871’ 106 0359 104 1119 9507 5* A3 -29°56.348’ -140°25.670’ 106 0845 114 10306 6 A3 -30°11.990’ -140°32.236’ 106 1220 123 2113 10816 7 A5 -30°24.014’ -141°08.165’ 108 0313 173 1044 13947 8 A5 -29°49.601’ -140°53.738’ 108 1109 196 2404 15308 9 A5 -29°19.110’ -140°41.026’ 108 1722 215 3464 16372 10a A5 -28°47.490’ -140°27.920’ 108 2313 232 4471 17375 11 A5 -27°39.747’ -140°00.059’ 109 1208 270 665? 19560+ 12 A7 -27°34.274’ -140°54.270’ 110 1051 339 1444 23362 13 A7 -27°53.27’ -141°02.58’ 110 1453 351 2133 24051 14 A7 -28°16.698’ -141°12.855’ 110 2005 366 3025 24944 15 A7 -28°41.009 -141°23.545’ 111 0138 382 3977 25895 16** A7 -29°11.12’ -141°36.86’ 111 0829 320 332 27069 17 A7 -29°13.582’ -141°37.928’ 111 0901 322 470 27162 18 A7 -29°50.924’ -141°51.546’ 111 1728 347 1919 28610 19 A9 -29°11.524’ -141°37.173’ 112 1624 491 177 33077 20 A9 -29°02.624’ -142°01.440’ 112 2145 505 1014 33914 21 A9 -28°52.600’ -142°28.654’ 113 0311 520 1865 34765 22 A9 -28°43.97’ -142°52.06’ 113 0733 532 2549 35449 23a A9 -28°36.027’ -143°13.474 113 1151 543 3221 36121 24 A9 -28°27.81’ -143°35.78’ 113 1626 556 3939 36839 25 A11 -28°59.182’ -144°30.927’ 114 2320 633 746 43664 26 A11 -28°41.56’ -144°26.30’ 115 0305 643 1331 44250 27 A11 -28°25.471’ -144°22.16’ 115 0639 652 1840 44808 28a A11 -28°02.814’ -144°16.376’ 115 1123 665 2632 45551 29 A11 -27°30.517’ -144°08.076’ 115 1811 683 3695 46615 30 A11 -27°12.141’ -144°03.382 115 2200 694 4291 47211 31 A11 -26°50.529’ -143°57.915’ 116 0223 706 4976 47898 32 A11 -26°27.52’ -143°52.13’ 116 0645 LOST 33 A11 -26°26.8’ -143°51.9’ 116 0657 719 5703 48626 34 A13 -26°00.420’ -144°07.984 116 1707 745 153 51054 35 A13 -26°22.229’ -144°18.506’ 116 2158 759 768 52670 36 A13 -26°42.369’ -144°28.179’ 117 0230 772 1543 53445 37 A13 -26°57.9’ -144°35.6’ 117 0557 782 2132 54035 38 A13 -27°17.567’ -144°45.206’ 117 1000 795 2829 54732 39 A13 -27°42.58’ -144°57.32’ 117 1520 810 3742 55645 40 A13 -28°03’ -145°07’ 117 antenna didn’t deploy 41 A14 -28°02.355’ -145°06.920’ 117 2248 825 129 57029 42 A14 -28°19.358’ -145°15.251’ 118 0238 836 789 57690 *Beginning not recorded because no guns firing. Deployed to listen for OBH2. ** Stopped transmission after only 20 minutes.